Embed Size (px)
Citation preview

2013 Real Estate Forecasts - Retail2013 Real Estate Forecasts - Retail
R1
Retail Market Areas
R2
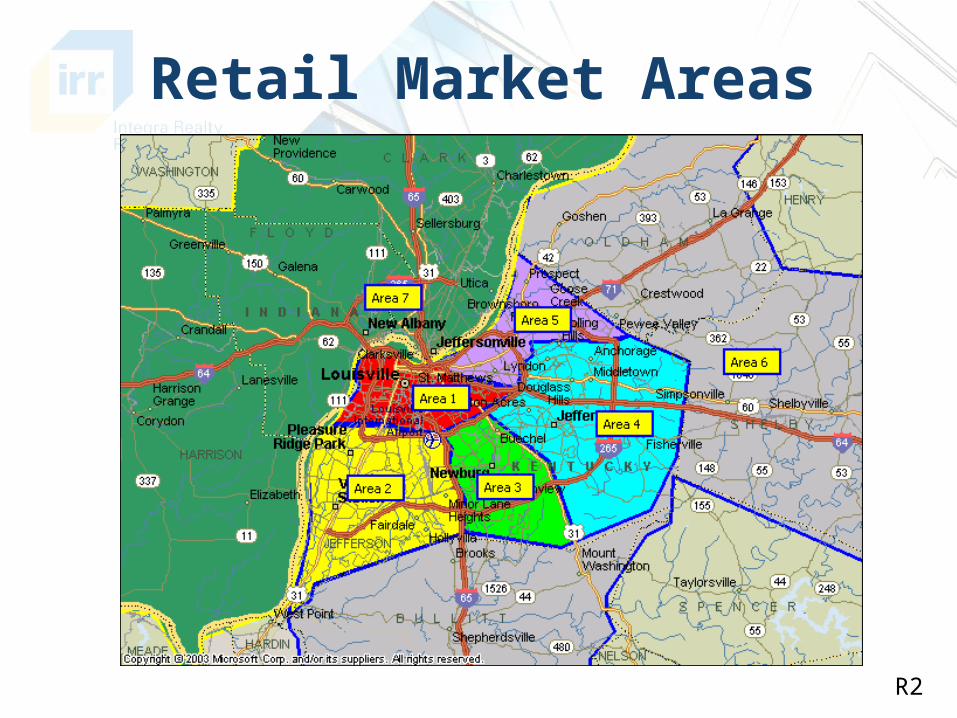
Regional Retail Performance
R3

Louisville MSA Retail Performance – Stabilized and Non-Stabilized Occupancy
R4
0%
5%
10%
15%
20%
25%
30%
35%
0.000
2.000
4.000
6.000
8.000
10.000
12.000
14.000
Vac
ancy
Pe
rcen
t
MS
A S
trip
Ret
ail S
.F. S
pace
X 1
,000
,000
Market Acceptability of Retail Space
NOT STABILIZED SF STABILIZED SF NOT STABLIZED VACANCY Vacancy Rate -STABLE RATE

Louisville MSA Retail Overall Performance
R5
-40%
-30%
-20%
-10%
0%
10%
20%
30%
40%
50%
Market Performance
Total 2012 Poly. (Total 2012)

Market Participants Expectations on Current Inventory
R6
0.00
1.00
2.00
3.00
4.00
5.00
6.00
7.00
8.00
9.00
10.00
Jun-01
Dec-01
Jun-02
Dec-02
Jun-03
Dec-03
Jun-04
Dec-04
Jun-05
Dec-05
Jun-06
Dec-06
Jun-07
Dec-07
Jun-08
Dec-08
Jun-09
Dec-09
Jun-10
Dec-10
Jun-11
Dec-11
Jun-12
Dec-12
Su
m o
f Tr
affi
c &
Lea
sin
g R
atin
g
Future Market Performance
Retail Total

Area Participants Expectations on Current Activity
R7
0.001.002.003.004.005.006.007.008.009.00
10.00
SU
M O
F T
RA
FF
IC A
ND
LE
AS
ING
AC
TIV
ITY
.
Future Market Performance
Area 4 Eastern Jefferson Cty
0.001.002.003.004.005.006.007.008.009.00
10.00S
UM
OF
TR
AF
FIC
AN
D L
EA
SIN
G A
CT
IVIT
Y
.
Future Market Performance
Area 2 Souuth West Jefferson Cty
0.001.002.003.004.005.006.007.008.009.00
10.00
SU
M O
F T
RA
FFIC
AN
D L
EA
SIN
G A
CT
IVIT
Y
.
Future Market Performance
Area 7 Southern Ind
0.001.002.003.004.005.006.007.008.009.00
10.00
SU
M O
F T
RA
FF
IC A
ND
LE
AS
ING
AC
TIV
ITY
.
Future Market Performance
Area 6 Oldhan,Shelby & Bullitt Cty

Louisville MSA Retail Rental Rates Compared to CPI
R8
$10.00
$11.00
$12.00
$13.00
$14.00
$15.00
$16.00
$17.00
$18.00
$19.00
Do
llar
s p
er s
qu
are
foo
t
History of Retail Rental Rates and CPI
Class "A" Rent Class "B" Rent Street Rent

Space Absorption in MSA and Jefferson County
R9
-300
-200
-100
0
100
200
300
400
500
Abs
orpt
ion
SF
X 1
000
LOUISVILLE MSA & JEFFERSON COUNTY RETAIL ABSORPTION
Estimated Absorption-MSA Estimated Absorption Jefferson Cty.
2 per. Mov. Avg. (Estimated Absorption-MSA) 2 per. Mov. Avg. (Estimated Absorption Jefferson Cty.)

Jefferson County Neighborhood Centers Rents, Rent Growth Rates and Vacancy
R10
2012 Neighborhood Strip Centers Vacancy, Rent and Rent Increases

Jefferson County Community Centers Rents, Rent Growth Rates and Vacancy
R11
2012 Community Centers Vacancy,Rent and Rent Increases

Retail Vacancy for Space Above and Below the Market Average
R12
0.0%
5.0%
10.0%
15.0%
20.0%
25.0%
30.0%
35.0%
Jun-10 Dec-10 Jun-11 Dec-11 Jun-12 Dec-12
26.00%
26.86%21.83%
30.00%
25.86%
31.71%
Non Stablized Vacancy Rate 0.0%
0.5%
1.0%
1.5%
2.0%
2.5%
3.0%
3.5%
4.0%
Jun-10 Dec-10 Jun-11 Dec-11 Jun-12 Dec-12
3.83%
3.14%2.86%
3.43%
2.71%
3.43%
Stable Vacancy Rate

Retail Properties
R13

Area Recent Retail Sales
R14
Number of Transactions Date
Average sq ft
Total sq ft
Year Built Total Price in $
Average Price in $
Average of $/sq ft
Cap Rate Qualifier
Land Area in Acres Occupancy
34 2009 36,416 946,818 1995 $91,824,907 $3,992,387 $192.27 8.5% 5.8 91%64 2010 62,259 1,681,002 1998 $145,996,692 $5,839,868 $186.56 8.5% 11.8 97%
Regional Retail Sales GA,TN, NC and SC
Date Property Name Local sq. ft. Price in $ $/sq. ft. Buyer Type OccupancyCap Rate Comment
Jul-09 BB&T Bank Louisville 4,000 2,640,000 660 by Stan Johnson Company Bank 100%Aug-09 Springhurst Towne Center Louisville 422,035 42,400,000 100 The Hocker Group LLC StripFeb-10 Hunters Ridge Louisville 26,565 4,700,000 177 Hunter Ridge LLC Strip 60%Mar-10 CVS Louisville 10,125 1,380,700 136 by Stan Johnson Co PortfolioMar-10 Garden Ridge Louisville 162,000 4,000,000 25 Garden Ridge LP Big BoxSep-10 Tractor Supply Sellersburg 19,097 2,606,061 136 Cole Real Estate Investments Single Tenant 100%Oct-10 Walgreens Louisville 14,820 by Hogan Real Estate Single Tenant 100%Nov-10 Dixie Depot Plaza Louisville 7,964 2,000,000 251 by Cooper Commercial Investment Group Strip 100%Feb-11 CVS Louisville 12,000 999,768 83 by Stan Johnson Co Drug 100%Dec-11 Springhurst Towne Center Louisville 422,035 78,000,000 185 CalSTRS Strip 100% 6.5%Jan-12 CVS Sellersburg 13,325 4,882,893 366 The Landes Group Drug 100% 6.5%Feb-12 Central Station Louisville 146,570 10,850,000 74 Stream Realty Partners Inc. Strip 85%Mar-12 Mount Washington Commons Mount Washington, 14,600 3,037,000 208 TJ Development LLC Strip 93%May-12 Blankenbaker Place Louisville 88,275 12,474,890 141 Strip defaultJun-12 Stonefield Square Louisville 90,887 Viking Partners Strip 90% 8.3% defaultOct-12 Walgreens La Grange 14,455 5,859,375 405 Drug 100% 9.8% defaultDec-12 Hurstbourne Forum Louisville 139,661 7,050,000 50 Altus REA from C-III Asset Management Strip 51%Dec-12 Prospect Village Shopping Center Prospect 153,000 19,500,000 127 Kroger Inc. Strip 88% 6.0%
Significant Local Retail Sales

A Look Into 2013 and Beyond
1. Slightly higher sales transaction volumes2. Stable interest rate environment3. Stable cap rate environment4. Multifamily construction activity increases overbuilding risk5. Continued changing dynamics influenced by E-commerce6. Improved industrial demand along with the economy7. Concern about office absorption
Local expertise nationally
• Slightly higher sales transaction volumes
• Improvement of retail sector fundamentals as American consumer sentiment returns
R15