Embed Size (px)
DESCRIPTION
2013 Farm Bank Performance Report
Citation preview

2013 Farm Bank Performance Report

American Bankers Association 1

American Bankers Association 2
2013 Farm Bank Performance Report
Key Findings
The U.S. banking industry is the nation’s most important supplier of credit to agriculture
providing nearly 50 percent ($149 billion) of all farm loans.
Small loans made up almost half of bank farm and ranch lending with nearly $70 billion
in small and micro-small farm and ranch loans on the books at the end of 2013.
The 2,152 farm banks recorded strong asset quality and capital levels in 2013 through
serving their communities and sticking to traditional banking practices: a focus on the
fundamentals of credit, solid underwriting standards and knowledge of the customer’s
business.
Farm banks’ asset quality continued to improve. Nonperforming loans (loans 90 days or
more past due and in nonaccrual status) declined to 1.22 percent of total loans, close to
pre-recession levels.
As a group, farm banks, remained well-capitalized through 2013. Over ninety-nine
percent, were considered well-capitalized, the highest capital rating given by bank
regulators.
Farm banks increased farm lending by 9.1 percent, or $7.3 billion, in 2013 and held $87.8
billion in farm loans at year-end. Since 2007, employment at farm banks has risen 15.1
percent.
In 2013, farm banks increased employment by 2.1 percent, adding nearly 2,000 jobs, and
employed over 91,900 rural Americans.
Over 96 percent of farm banks were profitable in 2013, with over half reporting an
increase in earnings.
Based on solid 2013 performance, farm banks are well positioned to meet the needs of
their customers in 2014.
The ABA definition of “farm bank” has changed over the production of this report. In 2012, ABA
made the decision to include institutions, previously excluded, with more than $1 billion in assets
as these institution grew in number and importance to our country’s farmers and ranchers. In
addition, due to changing reporting requirements, ABA began to include savings and loan
associations in the production of this report as data became available.

American Bankers Association 3
Table of Contents
Performance Review ...................................................... 4
Regional Summary
Northeast .............................................................. 10
South ..................................................................... 11
Cornbelt ................................................................ 12
Plains .................................................................... 13
West ...................................................................... 14
ABA Agricultural Banking Experts ................................ 15

American Bankers Association 4
2013 Farm Bank Performance Report
The U.S. banking industry is a major provider of credit to agriculture with over $149 billion in
farm loans extended—nearly 50 percent of the total farm credit outstanding in the U.S.—as of
year-end 2013.
Moreover, the U.S. banking industry is a major source of credit to small farmers. The banking
industry reported holding approximately $70 billion in small farm loans with $20.6 billion in
micro-small farm loans at the end of 2013.1 The number of outstanding small farm loans totaled
1.19 million with the vast majority—over 830,000 loans—under $100,000.
In 2013, the agricultural sector continued to outperform the broader national economy and, as a
result, farm banks2 posted solid results. Farm banks reported improved asset quality,
strengthened balance sheets and solid earnings in 2013. In addition, farm banks, as a group,
remained well-capitalized through 2013.
The U.S. Department of Agriculture (USDA) is forecasting net farm cash income to decline to
$101.9 billion in 2014. If the decline is realized, while still above the ten year average, this will
be the lowest level since 2010. Farm banks are well-prepared for turbulence in the agricultural
sector if the forecasts are realized. Farm banks have benefited from several years of strong
agricultural sector performance and have, during these years, increased their quality and quantity
of capital while strengthening their balance sheets.
This paper examines the 2013
performance of the 2,152 banks that
specialize in lending to agriculture. These
farm banks have 7,915 offices and employ
91,924 workers. Employment at farm
banks increased by 2.1 percent in 2013.
Since the end of 2007, employment at
farm banks is up 15.1 percent.
The majority of farm banks are small
institutions. The median sized farm bank
had $102 million in assets. However, there
were thirty-eight farm banks with more
than $1 billion in assets.
1 A small farm loan is defined as a loan with an original value of $500,000 or less. A micro-small farm loan is a loan with an
original value of $100,000 or less. 2 Farm banks are defined by the American Bankers Association as banks whose ratio of domestic farm loans to total domestic
loans greater than or equal to the industry average, in 2013 this was 14.42 percent. Studies before 2012 did not include banks
with more than $1 billion in assets nor savings and loan associations.
Farm Lending Increases Albeit
Declining Number of Farm Banks
$0
$20
$40
$60
$80
0
500
1,000
1,500
2,000
2,500
3,000
1999 2001 2003 2005 2007 2009 2011 2013
Nu
mb
er
of
Farm
Ban
ks
Source: Federal Deposit Insurance Corporation & ABA Analysis
Farm
Len
din
g b
y F
arm
Ban
ks, $
B
American Bankers Association 5
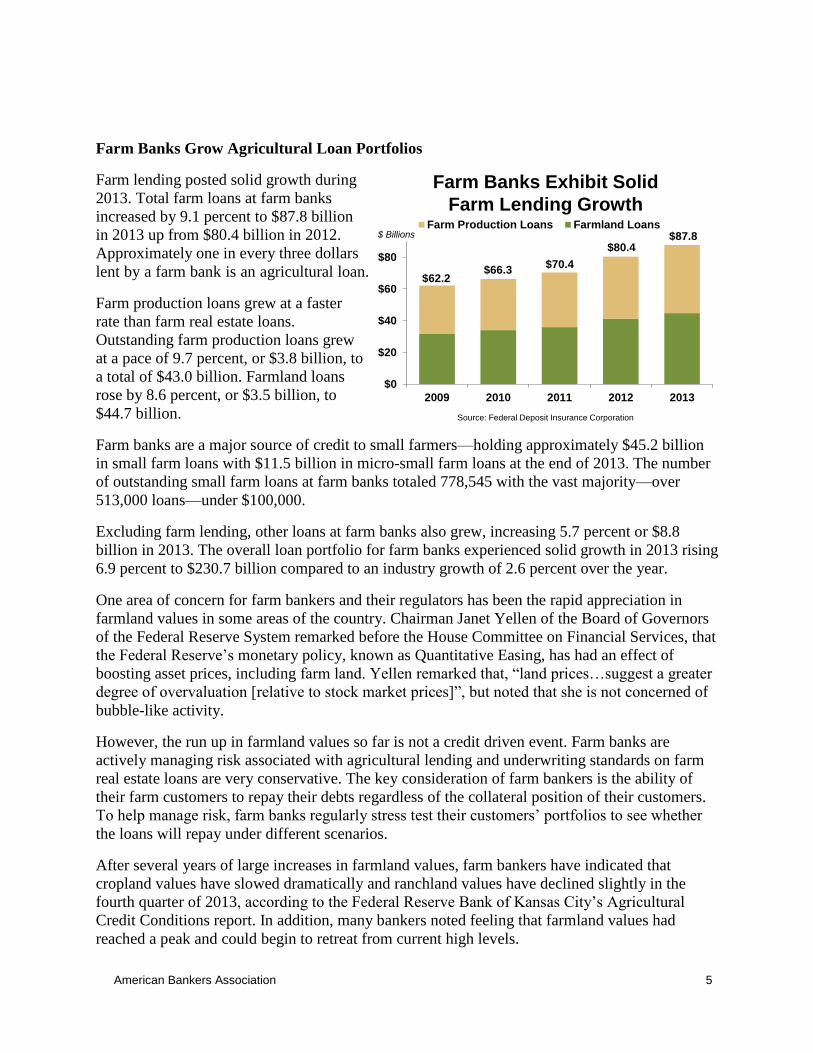
Farm Banks Grow Agricultural Loan Portfolios
Farm lending posted solid growth during
2013. Total farm loans at farm banks
increased by 9.1 percent to $87.8 billion
in 2013 up from $80.4 billion in 2012.
Approximately one in every three dollars
lent by a farm bank is an agricultural loan.
Farm production loans grew at a faster
rate than farm real estate loans.
Outstanding farm production loans grew
at a pace of 9.7 percent, or $3.8 billion, to
a total of $43.0 billion. Farmland loans
rose by 8.6 percent, or $3.5 billion, to
$44.7 billion.
Farm banks are a major source of credit to small farmers—holding approximately $45.2 billion
in small farm loans with $11.5 billion in micro-small farm loans at the end of 2013. The number
of outstanding small farm loans at farm banks totaled 778,545 with the vast majority—over
513,000 loans—under $100,000.
Excluding farm lending, other loans at farm banks also grew, increasing 5.7 percent or $8.8
billion in 2013. The overall loan portfolio for farm banks experienced solid growth in 2013 rising
6.9 percent to $230.7 billion compared to an industry growth of 2.6 percent over the year.
One area of concern for farm bankers and their regulators has been the rapid appreciation in
farmland values in some areas of the country. Chairman Janet Yellen of the Board of Governors
of the Federal Reserve System remarked before the House Committee on Financial Services, that
the Federal Reserve’s monetary policy, known as Quantitative Easing, has had an effect of
boosting asset prices, including farm land. Yellen remarked that, “land prices…suggest a greater
degree of overvaluation [relative to stock market prices]”, but noted that she is not concerned of
bubble-like activity.
However, the run up in farmland values so far is not a credit driven event. Farm banks are
actively managing risk associated with agricultural lending and underwriting standards on farm
real estate loans are very conservative. The key consideration of farm bankers is the ability of
their farm customers to repay their debts regardless of the collateral position of their customers.
To help manage risk, farm banks regularly stress test their customers’ portfolios to see whether
the loans will repay under different scenarios.
After several years of large increases in farmland values, farm bankers have indicated that
cropland values have slowed dramatically and ranchland values have declined slightly in the
fourth quarter of 2013, according to the Federal Reserve Bank of Kansas City’s Agricultural
Credit Conditions report. In addition, many bankers noted feeling that farmland values had
reached a peak and could begin to retreat from current high levels.
Farm Banks Exhibit Solid
Farm Lending Growth
$0
$20
$40
$60
$80
2009 2010 2011 2012 2013
Farm Production Loans Farmland Loans$ Billions
Source: Federal Deposit Insurance Corporation
$62.2$66.3
$70.4
$80.4$87.8

American Bankers Association 6
Over the last several years, farmland loans
at farm banks have risen as a percent of
total farm loans. Despite this increase in
farmland debt as a portion of total farm
loans, at the end of 2013 very few farm
banks were overly concentrated in farm
real estate loans, as a percent of a bank’s
Tier 1 capital. The majority of farm banks
had a farmland concentration ratio of
under 200 percent—a level that has not
raised concerns with regulators.
Deposits Grow at Farm Banks
The loan-to-deposit ratio for farm banks rose from 71.4 percent at the end of 2012 to 73.6
percent at the end of 2013. Farm banks continue to have ample ability to meet the future demand
for credit for qualified farm and ranch customers.
Farm banks have posted solid deposit growth over the last several years. In 2013, deposits at
farm banks increased $11.8 billion or 3.6 percent to $340.6 billion. This deposit growth is
comparable to deposit growth of 3.5 percent for the industry over the same time frame. As a
result of the strong deposit growth, the median deposit per employee at a farm bank in 2013 is
slightly more than $3.6 million—up slightly from 2012.
Farm Banks Continue to Build Capital
Equity capital3 at farm banks increased
0.5 percent to $43.6 billion in 2013 while
core capital4 increased by $2.5 billion to
$40.9 billion. Since the end of 2007, farm
banks have added $14.3 billion in equity
capital and $14.2 billion in core capital.
Farm banks have built strong high-quality
capital reserves and are well-insulated
from risks associated with the agricultural
sector.
The median Tier-1 leverage ratio5 for
farm banks rose by twenty-three basis
points during 2013 to 10.00 percent; and is now eight basis points above the leverage ratio before
the recession began at the end of 2007. Over 99 percent of all farm banks met the regulatory
requirement of being well capitalized at the end of 2013.
3 Equity capital is invested capital; it consists of the funds invested in a bank on a long-term basis. Such capital is obtained by
issuing preferred or common stock, or retaining a portion of earnings. 4 Core capital consists of equity capital plus noncumulative perpetual preferred stock plus minority interest in consolidated
subsidiaries, less goodwill and other ineligible intangible assets. 5 Tier-1 leverage ratio is Tier-1 capital divided by total average assets.
Farm Banks Increase
High Quality Capital
$0
$10
$20
$30
$40
2003 2005 2007 2009 2011 2013
Source: Federal Deposit Insurance Corporation
$ Billions $43.6 B
Few Farm Banks Are Overly
Exposed to Farmland
3%
9%
35%
53%
(As a percent of Tier-1 Capital)
Over 300%200% - 300%100% - 200%Under 100%
Source: Federal Deposit Insurance Corporation

American Bankers Association 7
Asset Quality Improves at Farm Banks
Like most banks, farm banks saw an
increase in nonperforming loans during
the recession. However, farm banks
experienced an improvement in asset
quality in 2013, as farm bank customers
have benefited from the strong farm
economy. According to the various
Federal Reserve District Banks,
repayment rates on farm loans remained
strong, holding steady with the pace of
previous years..
Nonperforming loans (loans 90 days or more past due and in nonaccrual status) fell by $402
million during 2013 to $3.1 billion. The nonperforming loan ratio fell by twenty-six basis points
to 1.22 percent. This compares favorably to an industry nonperforming loan ratio of 2.62 percent.
Early delinquencies also declined in 2013, indicating that farm and ranch customers continue to
repay their farm loans. Farm banks reported holding $1.9 billion in loans 30 to 89 days past due;
down 7.1 percent from 2012. This is relative to a 3.95 percent increase for the industry as a
whole.
Farm banks reported fewer loan losses in 2013, as net charge-offs declined by 38.6 percent to
$457.2 million.
As a result of the improvement in asset quality, loan loss provisions fell by $292.3 million to
$518.4 million in 2013. This was the fourth consecutive annual decline in provisions for loan and
lease losses. A decrease in the provision for loan losses indicates management’s expectation that
future loan losses will decline.
Farm Banks Post Solid Earnings
Farm banks posted solid earnings in 2013, reflecting the overall strength of the agricultural
economy. Income before taxes and extraordinary items totaled $4.5 billion, 1.1 percent higher
than in 2012. Over 96 percent of all farm banks were profitable in 2013 and approximately 51
percent reported an increase in their 2013 pre-tax earnings compared to a year earlier. However,
farm banks reported that on average operating profits per average employee fell $914 or 1.9
percent from an average of $47,400 to $46,500.
Both interest income and interest expense fell during 2013, with interest income at farm banks
falling at a slower pace than interest expenses. Interest income fell during 2013 by $186 million
to $15.2 billion. In comparison, total interest expenses fell by $455 million over the year to $1.9
billion.
On the other hand, both noninterest income and noninterest expenses rose during 2013.
Noninterest income at farm banks rose by 1.5 percent during 2013 to $3.0 billion, while
noninterest expenses increased 4.8 percent to $10.5 billion. Salary and employee benefits at farm
Farm Banks Continue
to Improve Loan Portfolio
0.0%
0.5%
1.0%
1.5%
2.0%
2.5%
2009 2010 2011 2012 2013
Source: Federal Deposit Insurance Corporation
1.96%2.09%
1.91%
1.45%
1.22%
No
np
erf
orm
ing
Lo
an
Ra
tio

American Bankers Association 8
banks grew by 5.2 percent during 2013 to $5.9 billion. Salaries and employee benefits
represented approximately 56 percent of all noninterest expenses in 2013.
As farm banks continue to struggle with the piling on of new regulations and a slowly recovering
economy, the median return on average assets (ROA) for farm banks (adjusted for Subchapter S)
fell to 0.83 percent in 2013 from 0.88 percent in 2012. However, a quarter of all farm banks had
an ROA in 2013 in excess of 1.12 percent—near pre-recession levels.
Outlook for 2014—Headwinds For The Farm Economy
The USDA is projecting net farm cash income in 2014 of $101.9 billion. This is down $28.2
billion, 21.7 percent, from 2013, reaching the lowest level since 2010, but remaining $4.8 billion
above the 10-year average (2004-2014) of $91.7 billion. The expected decline is driven by lower
crop cash receipts, a change in the value of crop inventories and reduced government farm
payments.
The USDA is estimating that crop receipts will fall in 2014 by more than 12 percent. The
average prices for corn, wheat, soybean, cotton, vegetables and melons are expected to decline in
2014. U.S. corn production is expected to increase as farmers continue to recuperate from the
2012 drought, which will cause sales receipts and value of inventory in 2014 to decline
significantly. Furthermore, wheat and cotton producers will see increased competition from
production abroad, thus pushing down expected annual prices in 2014.
The bright sport, livestock and dairy sales are forecasted to increase in 2014 by 0.7 percent as
increasing dairy receipts more than offset declines in hog and egg receipts. Receipts for cattle
and calves are expected to remain stable in 2014.
Reduced government farm payments are also a contributor to the lower projected net farm cash
income in 2014. Government payments paid to producers are expected to decline 45.4 percent
from 2013, totaling $6.12 billion, primarily due to the elimination of direct payments under the
Agricultural Act of 2014 (Farm Bill) and uncertainty regarding enrollment and payments. This
may be offset by higher payments in calendar year 2015.
Farm production expenses are expected to decrease by $3.9 billion, 1.1 percent, in 2014 to
$348.2 billion. This is the first decline since 2009 and interrupting a 12-year upward trend in
expenses. Despite the decrease, farm production expenses remain well above the nominal 2012
level, and are expected to be the second highest on record and the third highest in inflation-
adjusted dollars. Total production expenses are expected to constitute 78 percent of gross farm
income in 2014, up from 73 percent in 2013, indicating a return to tighter margins.
The rate of growth in farm assets, debt and equity is forecast by the USDA to slow in 2014,
primarily due to expected lower income, higher borrowing costs and moderation in the growth of
farmland values. However, farm balance sheets—with historically low levels of debt relative to
assets and equity—reaffirm the sector’s strong financial position.
The farm sector’s debt-to-asset ratio is projected to fall to 10.54 percent in 2014, while the debt-
to-equity ratio is projected to remain steady at 11.78 percent. If realized, these would be the

American Bankers Association 9
lowest values for both measures since 1954, confirming the strength of the farm sector’s
solvency despite an expected slowdown.
The USDA expects farm sector debt to increase to $316.2 billion by the end of 2014, an increase
of 2.3 percent over 2013 farm sector debt levels—well below the 10 year average growth of 4.3
percent. Farm sector real estate debt is expected to increase by 3.2 percent to $186.7 billion,
while non-real estate debt is expected to increase at an even slower rate, 1 percent, to $129.5
billion. Farm banks have ample funds to meet the credit needs for qualified farm borrowers.
We may see a higher than projected increase in farm real estate debt as banks try to help their
customers by restructuring short term debt over longer terms. Real estate is the primary collateral
for long term debt.
The USDA expects non-real estate debt to be impacted by the expected drop in farm income
which will decrease the cash available to cover operating expenses and create upward pressure
on non-real estate debt levels. On the other hand, the expected decline in production expenses—
particularly production inputs—could reduce the need for debt financing.
Despite the outlook for modest farm lending, farm banks will struggle to generate higher future
earnings. Expectations are for net interest margins to remain under pressure and for top line
revenue growth to remain weak. In addition, operating costs will rise as farm banks seek to
comply with a more onerous regulatory environment.

American Bankers Association 10
The ten farm banks in the Northeast region reported a 21.7 percent increase in farm loans from a
year ago, rising to $503 million, largely influenced by one institution. (Excluding this institution,
farm loans in the region increased 11.5 percent.) Agricultural production loans rose 7.3 percent
from a year ago to $165 million, while farmland loans increased 30.3 percent to $337 million.
Farm banks in the Northeast region were able to maintain profitability in 2013. The median
return on equity increased 22 basis points to 15.8 percent, while return on assets rose at a much
slower rate settling at 1.1 percent. The median Tier 1 risk-based capital ratio for farm banks in
the Northeast region increased 59 basis points year-over-year to 15.8 percent.
Median Top 25% Bottom 25%
Number of Full-Time Employees 49 109 25
Total Assets ($ in Mil) $268.0 $416.0 $180.8
Total Deposits ($ in Mil) $213.9 $332.8 $155.9
Total Loans & Leases ($ in Mil) $171.2 $237.8 $123.1
Tier 1 Risk-Based Capital Ratio 15.8% 21.3% 13.8%
Tier 1 Common Capital Ratio 10.6% 13.2% 10.3%
Return on Average Assets* 1.1% 1.3% 1.0%
Return on Average Equity* 10.3% 11.2% 8.9%
Operating Profit per Employee ($ in Thousands) $95.8 $116.9 $58.7
Net Interest Margin (Tax Adjusted) 3.7% 4.0% 3.5%
Total Interest Expense/Average Assets 0.7% 0.5% 0.8%
Total Interest Income/Average Assets 3.8% 4.0% 3.7%
Total Noninterest Income/Average Assets 0.5% 0.6% 0.4%
Total Noninterest Income (YTD $ in Mil) $1.0 $4.1 $0.6
Efficiency Ratio 53.8% 47.7% 61.4%
Non-Performing Loans**/Gross Loans 0.3% 0.2% 0.6%
Net Charge-Offs/Average Loans 0.0% 0.0% 0.1%
Provision for Loan Losses/Average Loans 0.0% 0.0% 0.1%
Loan Loss Reserves/Gross Loans 1.5% 1.6% 1.2%
Agricultural Production Loans/Gross Domestic Loans 6.6% 9.1% 3.4%
Agric Prod & Agric RE Loans/Gross Domestic Loans 19.1% 29.7% 15.7%
* ROA and ROE are adjusted for Sub-S corporations. Applicable incomes of such institutions are multiplied by .66 to reflect
estimated after-tax income.
Northeast
** Non-performing loans are defined as past 90 days due and loans in nonaccrual status.

American Bankers Association 11
The 224 farm banks in the South region increased farm loans by 6.5 percent, $399 million, from
the year ago period rising to $6.6 billion in 2013. Agricultural production loans increased 11.4
percent from a year ago, to $1.7 billion, while farmland loans rose by 4.8 percent to $4.8 billion.
Farm banks in the South struggled to maintain profitability in 2013. The median return on equity
rose by 18 basis points to 7.1 percent, while return on assets decreased three basis points to 0.8
percent. The region’s farm banks’ median Tier 1 risk-based capital ratio of 16.3 percent was a 17
basis point increase from a year ago. Farm banks in the South region employ over 11,600 men
and women, an increase of one percent from the previous year.
Median Top 25% Bottom 25%
Number of Full-Time Employees 34 61 19
Total Assets ($ in Mil) $125.7 $218.4 $74.1
Total Deposits ($ in Mil) $105.9 $183.2 $65.7
Total Loans & Leases ($ in Mil) $73.3 $138.1 $38.1
Tier 1 Risk-Based Capital Ratio 16.3% 21.3% 13.7%
Tier 1 Common Capital Ratio 10.7% 12.5% 9.5%
Return on Average Assets* 0.8% 1.1% 0.5%
Return on Average Equity* 7.1% 9.9% 4.8%
Operating Profit per Employee ($ in Thousands) $39.7 $56.9 $21.4
Net Interest Margin (Tax Adjusted) 4.0% 4.5% 3.7%
Total Interest Expense/Average Assets 0.5% 0.4% 0.7%
Total Interest Income/Average Assets 4.1% 4.6% 3.6%
Total Noninterest Income/Average Assets 0.6% 0.8% 0.4%
Total Noninterest Income (YTD $ in Mil) $0.8 $1.5 $0.3
Efficiency Ratio 67.3% 59.5% 77.3%
Non-Performing Loans**/Gross Loans 1.5% 0.6% 2.9%
Net Charge-Offs/Average Loans 0.2% 0.1% 0.5%
Provision for Loan Losses/Average Loans 0.3% 0.1% 0.4%
Loan Loss Reserves/Gross Loans 1.6% 2.2% 1.2%
Agricultural Production Loans/Gross Domestic Loans 4.6% 11.1% 2.4%
Agric Prod & Agric RE Loans/Gross Domestic Loans 22.7% 29.6% 17.9%
South
* ROA and ROE are adjusted for Sub-S corporations. Applicable incomes of such institutions are multiplied by .66 to reflect
estimated after-tax income.
** Non-performing loans are defined as past 90 days due and loans in nonaccrual status.

American Bankers Association 12
Farm banks in the Cornbelt region increased farm loans by 9.0 percent, $3.2 billion, from a year
ago to $38.4 billion in 2013. Agricultural production loans rose 9.7 percent from a year ago to
$18.2 billion, while farmland loans increased 8.3 percent to $20.2 billion. There are 1,014 farm
banks in the Cornbelt region.
Farm banks in the Cornbelt region were unable to improve profitability in 2013. The median
return on equity fell 39 basis points to 7.84 percent, while return on assets fell eight basis points
to 0.84 percent. The region’s median Tier 1 risk-based capital ratio of 14.9 percent was 22 basis
points higher compared to a year ago. Farm banks in the Cornbelt region employ over 38,000
men and women, a 1.9 percent increase compared to 2012 employment levels.
Median Top 25% Bottom 25%
Number of Full-Time Employees 23 44 12
Total Assets ($ in Mil) $103.4 $191.6 $57.3
Total Deposits ($ in Mil) $88.2 $165.6 $50.4
Total Loans & Leases ($ in Mil) $62.1 $122.1 $30.3
Tier 1 Risk-Based Capital Ratio 14.9% 19.1% 12.5%
Tier 1 Common Capital Ratio 10.0% 11.7% 9.0%
Return on Average Assets* 0.8% 1.1% 0.6%
Return on Average Equity* 7.8% 10.3% 5.4%
Operating Profit per Employee ($ in Thousands) $48.6 $73.0 $27.7
Net Interest Margin (Tax Adjusted) 3.6% 4.0% 3.3%
Total Interest Expense/Average Assets 0.5% 0.4% 0.6%
Total Interest Income/Average Assets 3.7% 4.1% 3.4%
Total Noninterest Income/Average Assets 0.5% 0.7% 0.3%
Total Noninterest Income (YTD $ in Mil) $0.4 $1.1 $0.2
Efficiency Ratio 64.6% 56.4% 74.6%
Non-Performing Loans**/Gross Loans 0.7% 0.2% 1.5%
Net Charge-Offs/Average Loans 0.1% 0.0% 0.2%
Provision for Loan Losses/Average Loans 0.1% 0.0% 0.3%
Loan Loss Reserves/Gross Loans 1.3% 1.7% 1.1%
Agricultural Production Loans/Gross Domestic Loans 15.5% 25.2% 8.6%
Agric Prod & Agric RE Loans/Gross Domestic Loans 35.7% 50.1% 24.1%
* ROA and ROE are adjusted for Sub-S corporations. Applicable incomes of such institutions are multiplied by .66 to reflect
estimated after-tax income.
Cornbelt
** Non-performing loans are defined as past 90 days due and loans in nonaccrual status.

American Bankers Association 13
The 828 farm banks in the Plains region increased their farm loans by 9.3 percent, $2.9 billion,
from a year ago to over $33.9 billion in 2013. Agricultural production loans rose 9.0 percent
from a year ago to $19.1 billion, while farmland loans increased 9.7 percent to $14.9 billion.
Farm banks in the Plains struggled to improve profitability in 2013. The median return on equity
rose a basis point to 7.92 percent, while return on assets fell three basis points to 0.83 percent.
Farm banks in the Plains region had a median Tier 1 risk-based capital ratio of 15.34 percent – a
two basis point increase from the previous year. Farm banks in the Plains region employ over
34,500 men and women, an increase of 3.2 percent compared to 2012.
Median Top 25% Bottom 25%
Number of Full-Time Employees 19 38 11
Total Assets ($ in Mil) $86.7 $171.8 $46.6
Total Deposits ($ in Mil) $73.8 $145.0 $39.7
Total Loans & Leases ($ in Mil) $45.3 $100.8 $22.0
Tier 1 Risk-Based Capital Ratio 15.3% 20.0% 12.6%
Tier 1 Common Capital Ratio 10.0% 11.5% 8.9%
Return on Average Assets* 0.8% 1.1% 0.5%
Return on Average Equity* 7.9% 10.6% 5.1%
Operating Profit per Employee ($ in Thousands) $46.3 $69.8 $26.6
Net Interest Margin (Tax Adjusted) 3.7% 4.2% 3.2%
Total Interest Expense/Average Assets 0.4% 0.3% 0.6%
Total Interest Income/Average Assets 3.7% 4.2% 3.2%
Total Noninterest Income/Average Assets 0.5% 0.7% 0.3%
Total Noninterest Income (YTD $ in Mil) $0.4 $0.9 $0.2
Efficiency Ratio 66.9% 58.2% 76.1%
Non-Performing Loans**/Gross Loans 0.4% 0.1% 1.1%
Net Charge-Offs/Average Loans 0.0% 0.0% 0.2%
Provision for Loan Losses/Average Loans 0.1% 0.0% 0.2%
Loan Loss Reserves/Gross Loans 1.4% 1.8% 1.1%
Agricultural Production Loans/Gross Domestic Loans 23.1% 37.4% 12.7%
Agric Prod & Agric RE Loans/Gross Domestic Loans 41.6% 60.2% 26.6%
* ROA and ROE are adjusted for Sub-S corporations. Applicable incomes of such institutions are multiplied by .66 to reflect
estimated after-tax income.
Plains
** Non-performing loans are defined as past 90 days due and loans in nonaccrual status.

American Bankers Association 14
The 76 farm banks in the West region increased farm loans by 10.3 percent, $774 million, from a
year ago to $8.3 billion in 2013. Agricultural production loans rose 12.3 percent from a year ago
to $3.8 billion, while farmland loans increased 8.6 percent to $4.5 billion.
Farm banks in the West experienced improved profitability in 2013. The median return on equity
increased 44 basis points to 7.95 percent, while return on assets rose by eight basis points to 0.90
percent. The median Tier 1 risk-based capital ratio for farm banks in the West region was 15.37
percent—a two basis point drop from a year ago. Farm banks in the West region employ over
6,900 men and women, up slightly from the previous year.
Median Top 25% Bottom 25%
Number of Full-Time Employees 29 80 16
Total Assets ($ in Mil) $136.9 $315.0 $62.2
Total Deposits ($ in Mil) $120.4 $276.9 $54.6
Total Loans & Leases ($ in Mil) $78.4 $163.9 $37.2
Tier 1 Risk-Based Capital Ratio 15.4% 18.5% 13.2%
Tier 1 Common Capital Ratio 10.2% 11.5% 9.2%
Return on Average Assets* 0.9% 1.1% 0.6%
Return on Average Equity* 7.9% 9.9% 5.5%
Operating Profit per Employee ($ in Thousands) $46.5 $71.3 $25.8
Net Interest Margin (Tax Adjusted) 4.1% 4.4% 3.7%
Total Interest Expense/Average Assets 0.3% 0.2% 0.5%
Total Interest Income/Average Assets 4.0% 4.4% 3.5%
Total Noninterest Income/Average Assets 0.5% 0.7% 0.3%
Total Noninterest Income (YTD $ in Mil) $0.6 $1.8 $0.2
Efficiency Ratio 69.6% 60.1% 79.9%
Non-Performing Loans**/Gross Loans 1.2% 0.5% 2.3%
Net Charge-Offs/Average Loans 0.1% 0.0% 0.2%
Provision for Loan Losses/Average Loans 0.1% 0.0% 0.3%
Loan Loss Reserves/Gross Loans 1.8% 2.2% 1.5%
Agricultural Production Loans/Gross Domestic Loans 17.6% 28.0% 9.8%
Agric Prod & Agric RE Loans/Gross Domestic Loans 33.1% 47.9% 22.0%
* ROA and ROE are adjusted for Sub-S corporations. Applicable incomes of such institutions are multiplied by .66 to reflect
estimated after-tax income.
West
** Non-performing loans are defined as past 90 days due and loans in nonaccrual status.

American Bankers Association 15
ABA Center for Agricultural &
Rural Banking
ABA Agricultural Banking Experts
John Blanchfield, Sr. VP, Center for Agricultural & Rural Banking
Sarah Grano, Director, Public Relations
Ed Elfmann, Vice President, Congressional Relations
Barbara McCoy, Website Administrator, Center for Agricultural & Rural Banking
Cynthia Hall Watkins, Director, Congressional Relations
Keith Leggett, VP & Senior Economist, Economic Policy & Research
Brittany Dengler, Research Manager, Economic Policy & Research
Brian Nixon, Senior Editor, Member Communications
Resources for Agricultural Banks
ABA Ag Banker
Bert Ely's Farm Credit Watch
ABA National Agricultural Bankers Conference: November 9-12, 2014, Omaha, NE
Agricultural Banks Performance Scorecard
Farmer Mac Alliance