Embed Size (px)
Citation preview

7/28/2019 2013 County Health Status Profiles
http://slidepdf.com/reader/full/2013-county-health-status-profiles 1/102
7/28/2019 2013 County Health Status Profiles
http://slidepdf.com/reader/full/2013-county-health-status-profiles 2/102

7/28/2019 2013 County Health Status Profiles
http://slidepdf.com/reader/full/2013-county-health-status-profiles 3/102ii
ACKNOWLEDGMENTS
John Rudzinskas, MBA Research Program Specialist I, with the California Departmentof Public Health (CDPH), Public Health Policy and Research Branch, Assessment andPolicy Section, Data Analysis Reporting Unit prepared this report.
Alicia Van Hoy, MA Research Program Specialist I, with the CDPH, Public HealthPolicy and Research Branch, Assessment and Policy Section, Data Analysis ReportingUnit independently peer reviewed the tables and thematic maps.
Scott Fujimoto, MD, MPH with the CDPH, Public Health Policy and Research Branch,was an advisor and evaluator of the data analysis.
Bill Schooling, with the Department of Finance provided the 2012 race/ethnicpopulation estimates by county with age and sex detail.
Michael Curtis, PhD and Carina Saraiva, MPH with the CDPH, Maternal, Child and Adolescent Health Program for providing direction in accessing the most currentbreastfeeding information.
Denise Gilson with the CDPH, Sexually Transmitted Disease Control Branch providedchlamydia and gonorrhea case incidence data.
Linda Johnson with the CDPH, Tuberculosis Control Branch provided tuberculosiscase incidence data.
Matt Facer, PhD with the CDPH, Office of AIDS provided AIDS case incidence data.
Jan Christensen with the CDPH, Public Health Policy and Research Branch, HealthInformation and Research Section, Data Quality Management Unit matched the birthand infant death records from the Birth and Death Statistical Master Files to create theBirth Cohort-Perinatal Outcome Files of linked births and deaths.
Daniel Cox with the CDPH, Information Technology Services Division, ApplicationDevelopment and Support Branch, Health and Administrative Support Section preparedthe Web page and data links for the Internet version of the report and county summarytables.
Health Information and Strategic Planning staff, who collected, coded, and edited birthand death certificates, the basis of the Birth and the Death Statistical Master Files.
Cover Photography by John Rudzinskas: The Capitol in early spring.

7/28/2019 2013 County Health Status Profiles
http://slidepdf.com/reader/full/2013-county-health-status-profiles 4/102

7/28/2019 2013 County Health Status Profiles
http://slidepdf.com/reader/full/2013-county-health-status-profiles 5/102iv
TABLE OF CONTENTS
INTRODUCTION ..................................................................................................... 1-2
TABLES WITH HIGHLIGHTS ................................................................................. 3-82
TABLES HEALTH STATUS INDICATORS
1 – 19 MORTALITY INDICATORS PER 100,000 POPULATION
1 All Causes of Death ............................................................................................ 3-42 All Cancer Deaths ............................................................................................... 5-63 Colorectal Cancer ............................................................................................... 7-84 Lung Cancer ........................................................................................................ 9-105 Female Breast Cancer ........................................................................................ 11-126 Prostate Cancer .................................................................................................. 13-147 Diabetes .............................................................................................................. 15-168 Alzheimer’s Disease ............................................................................................ 17-189 Coronary Heart Disease ...................................................................................... 19-20
10 Cerebrovascular Disease (Stroke) ...................................................................... 21-2211 Influenza/Pneumonia .......................................................................................... 23-2412 Chronic Lower Respiratory Disease ................................................................... 25-2613 Chronic Liver Disease and Cirrhosis ................................................................... 27-2814 Accidents (Unintentional Injuries) ....................................................................... 29-3015 Motor Vehicle Traffic Crashes ............................................................................. 31-3216 Suicide ................................................................................................................. 33-3417 Homicide………………. ....................................................................................... 35-3618 Firearm-Related Deaths ...................................................................................... 37-3819 Drug-Induced Deaths .......................................................................................... 39-40
20 – 23 MORBIDITY INDICATORS PER 100,000 POPULATION
20 Acquired Immunodeficiency Syndrome (AIDS)................................................... 41-4221 Chlamydia ........................................................................................................... 43-4422F Gonorrhea Females 15 To 44 Years Old ............................................................ 45-4622M Gonorrhea Males 15 To 44 Years Old ................................................................ 47-4823 Tuberculosis ........................................................................................................ 49-50
24A – 24E BIRTH COHORT INFANT MORTALITY UNDER ONE YEAROF AGE PER 1,000 LIVE BIRTHS
24A Infant Mortality, All Race/Ethnic Groups ............................................................. 51-5224B Asian/Pacific Islander Infant Mortality ................................................................. 53-54
24C Black Infant Mortality ........................................................................................... 55-5624D Hispanic Infant Mortality ...................................................................................... 57-5824E White Infant Mortality .......................................................................................... 59-60

7/28/2019 2013 County Health Status Profiles
http://slidepdf.com/reader/full/2013-county-health-status-profiles 6/102v
TABLE OF CONTENTS (continued)
TABLES HEALTH STATUS INDICATORS
25 – 27B NATALITY INDICATORS PER 100 LIVE BIRTHS OR 1,000POPULATION
25 Low Birthweight Infants ....................................................................................... 61-6226 Births to Adolescent Mothers, 15-19 Years Old Per 1,000 Live Births ............... 63-6427A Prenatal Care Begun During the First Trimester ................................................ 65-6627B Adequate/Adequate Plus Prenatal Care ............................................................. 67-68
BREASTFEEDING INITIATION RATES PER 100 LIVE BIRTHS
28 Breastfeeding Initiation During Early Postpartum ................................................ 69-70
2010 CENSUS POPULATION HEALTH INDICATOR
29 Persons Under 18 In Poverty .............................................................................. 71-72
CURRENT AND PRIOR THREE-YEAR AVERAGE RATES ANDPERCENTAGES BY COUNTY
30 A Comparison of Three-Year Average Rates And Percentages AmongSelected Health Status Indicators ....................................................................... 73-82
TECHNICAL NOTES................................................................................................................... 83-93
APPENDIX A
California’s Health Status Profile 2013 ........................................................................................... 94
BIBLIOGRAPHY........................................................................................................................... 95

7/28/2019 2013 County Health Status Profiles
http://slidepdf.com/reader/full/2013-county-health-status-profiles 7/102
7/28/2019 2013 County Health Status Profiles
http://slidepdf.com/reader/full/2013-county-health-status-profiles 8/102
County Health Status Profles 2013California Department of Public Health 1
INTRODUCTION
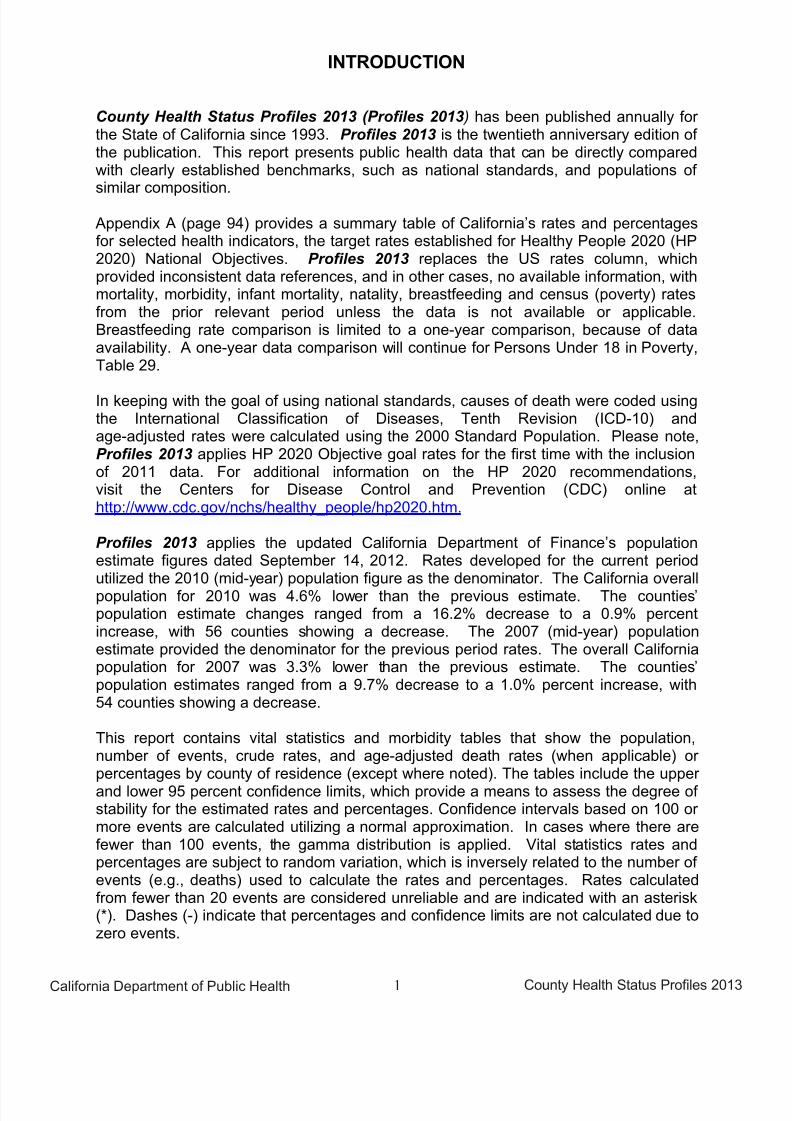
County Health Status Profiles 2013 (Profiles 2013 ) has been published annually for the State of California since 1993. Profiles 2013 is the twentieth anniversary edition of the publication. This report presents public health data that can be directly comparedwith clearly established benchmarks, such as national standards, and populations of similar composition.
Appendix A (page 94) provides a summary table of California’s rates and percentagesfor selected health indicators, the target rates established for Healthy People 2020 (HP2020) National Objectives. Profiles 2013 replaces the US rates column, whichprovided inconsistent data references, and in other cases, no available information, withmortality, morbidity, infant mortality, natality, breastfeeding and census (poverty) ratesfrom the prior relevant period unless the data is not available or applicable.Breastfeeding rate comparison is limited to a one-year comparison, because of dataavailability. A one-year data comparison will continue for Persons Under 18 in Poverty,Table 29.
In keeping with the goal of using national standards, causes of death were coded usingthe International Classification of Diseases, Tenth Revision (ICD-10) andage-adjusted rates were calculated using the 2000 Standard Population. Please note,Profiles 2013 applies HP 2020 Objective goal rates for the first time with the inclusionof 2011 data. For additional information on the HP 2020 recommendations,visit the Centers for Disease Control and Prevention (CDC) online athttp://www.cdc.gov/nchs/healthy_people/hp2020.htm.
Profiles 2013 applies the updated California Department of Finance’s populationestimate figures dated September 14, 2012. Rates developed for the current periodutilized the 2010 (mid-year) population figure as the denominator. The California overallpopulation for 2010 was 4.6% lower than the previous estimate. The counties’population estimate changes ranged from a 16.2% decrease to a 0.9% percentincrease, with 56 counties showing a decrease. The 2007 (mid-year) populationestimate provided the denominator for the previous period rates. The overall Californiapopulation for 2007 was 3.3% lower than the previous estimate. The counties’population estimates ranged from a 9.7% decrease to a 1.0% percent increase, with54 counties showing a decrease.
This report contains vital statistics and morbidity tables that show the population,number of events, crude rates, and age-adjusted death rates (when applicable) or percentages by county of residence (except where noted). The tables include the upper
and lower 95 percent confidence limits, which provide a means to assess the degree of stability for the estimated rates and percentages. Confidence intervals based on 100 or more events are calculated utilizing a normal approximation. In cases where there arefewer than 100 events, the gamma distribution is applied. Vital statistics rates andpercentages are subject to random variation, which is inversely related to the number of events (e.g., deaths) used to calculate the rates and percentages. Rates calculatedfrom fewer than 20 events are considered unreliable and are indicated with an asterisk(*). Dashes (-) indicate that percentages and confidence limits are not calculated due tozero events.

7/28/2019 2013 County Health Status Profiles
http://slidepdf.com/reader/full/2013-county-health-status-profiles 9/102
County Health Status Profles 2013California Department of Public Health 2
Counties are ranked by rates or percentages based on the methodology described inthe Technical Notes section (pages 83 to 93). Data limitations and qualifications areprovided in the Technical Notes to assist the reader with interpretation and comparisonof these data among the counties. For those who want to learn more about thechallenges associated with analysis of vital events involving small numbers, small areaanalysis, and age-adjusted death rates, references to relevant statistical publicationsare located in the bibliography.
Thematic maps of California’s 58 counties provide added visual comparison of rates or percentages from each table (excluding Table 30) along with the customary healthstatus indicator highlights.
The following California Department of Public Health (CDPH) offices provided data for this report: Vital Records, Communicable Disease Control, Genetic Disease ScreeningProgram, Maternal, Child and Adolescent Health Program, and the Office of AIDS. Inaddition, the Demographic Research Unit of the California Department of Financeprovided 2010 race/ethnicity population estimates by county with age and sex detail.Estimates of persons under age 18 in poverty in 2010 are from the U.S. Census Bureau
http://www.census.gov/did/www/saipe/data/statecounty/data/2010.html.
To access electronic copies of this report, visit the CDPH, Health Information andStrategic Planning, Public Health Policy and Research Branch site on the Internet athttp://www.cdph.ca.gov/programs/OHIR/Pages/CHSP.aspx.
If you have questions about this report, or desire additional state or county health statusdata and statistics please write, phone, or e-mail:
California Department of Public HealthHealth Information and Strategic Planning
Public Health Policy and Research BranchMS 5101
P.O. Box 997410Sacramento, CA 95899-7410
Telephone (916) 552-8095Fax (916) 650-6889
Email [email protected]
Profiles for the years 1999 through 2012 are available on the CDPH website at:http://www.cdph.ca.gov/programs/ohir/Pages/CHSPPriorReports.aspx. Paper copies of the1993 through 2006 reports may be purchased for $10 by
contacting the Public Health Policy and Research Branch at the above address or phone number.

7/28/2019 2013 County Health Status Profiles
http://slidepdf.com/reader/full/2013-county-health-status-profiles 10/102
County Health Status Profles 2013California Department of Public Health 3
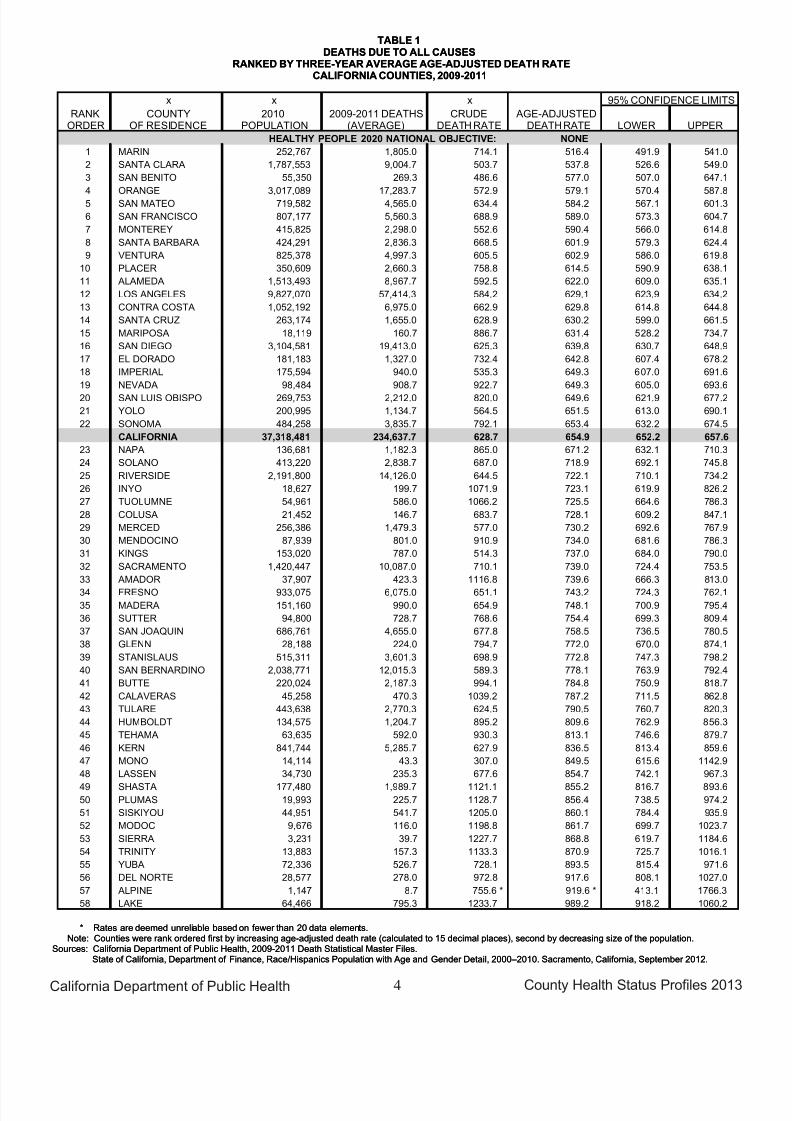
DEATHS DUE TO ALL CAUSES, 2009-2011
he crude death rate from all causes for California was 628.7 deaths per 100,000population, a risk of dying equivalent to approximately one death for every159.0 persons. This rate was based on a 2009 through 2011 three-year average
number of deaths equaling 234,637.7 and population count of 37,318,481 as of July 1, 2010. Among counties with reliable rates, the crude rate ranged from 1,233.7 inLake County to 307.0 in Mono County, a factor of 4.0 to 1.
The age-adjusted death rate from all causes for California during the 2009 through 2011three-year period was 654.9 deaths per 100,000 population. Reliable age-adjusteddeath rates ranged from 989.2 in Lake County to 516.4 in Marin County.
A Healthy People 2020 National Objective for deaths due to all causes has not beenestablished.
The California average age-adjusted death rate for the 2006-2008 period was 696.8.
T
7/28/2019 2013 County Health Status Profiles
http://slidepdf.com/reader/full/2013-county-health-status-profiles 11/102
County Health Status Profles 2013California Department of Public Health 4
State of California, Department of Finance, Race/Hispanics Population with Age and Gender Detail, 2000–2010. Sacramento, California, September 2012.Sources: California Department of Public Health, 2009-2011 Death Statistical Master Files.
Note: Counties were rank ordered first by increasing age-adjusted death rate (calculated to 15 decimal places), second by decreasing size of the population.* Rates are deemed unreliable based on fewer than 20 data elements.
TABLE 1
DEATHS DUE TO ALL CAUSES
RANKED BY THREE-YEAR AVERAGE AGE-ADJUSTED DEATH RATE
CALIFORNIA COUNTIES, 2009-2011
x x x 95% CONFIDENCE LIMITS
RANKORDER
COUNTYOF RESIDENCE
2010POPULATION
2009-2011 DEATHS(AVERAGE)
CRUDEDEATH RATE
AGE-ADJUSTEDDEATHRATE LOWER UPPER
HEALTHY PEOPLE 2020 NATIONAL OBJECTIVE: NONE
1 MARIN 252,767 1,805.0 714.1 516.4 491.9 541.0
2 SANTA CLARA 1,787,553 9,004.7 503.7 537.8 526.6 549.0
3 SAN BENITO 55,350 269.3 486.6 577.0 507.0 647.1
4 ORANGE 3,017,089 17,283.7 572.9 579.1 570.4 587.8
5 SAN MATEO 719,582 4,565.0 634.4 584.2 567.1 601.3
6 SAN FRANCISCO 807,177 5,560.3 688.9 589.0 573.3 604.7
7 MONTEREY 415,825 2,298.0 552.6 590.4 566.0 614.8
8 SANTA BARBARA 424,291 2,836.3 668.5 601.9 579.3 624.4
9 VENTURA 825,378 4,997.3 605.5 602.9 586.0 619.8
10 PLACER 350,609 2,660.3 758.8 614.5 590.9 638.1
11 ALAMEDA 1,513,493 8,967.7 592.5 622.0 609.0 635.1
12 LOS ANGELES 9,827,070 57,414.3 584.2 629.1 623.9 634.2
13 CONTRA COSTA 1,052,192 6,975.0 662.9 629.8 614.8 644.8
14 SANTA CRUZ 263,174 1,655.0 628.9 630.2 599.0 661.5
15 MARIPOSA 18,119 160.7 886.7 631.4 528.2 734.7
16 SAN DIEGO 3,104,581 19,413.0 625.3 639.8 630.7 648.9
17 EL DORADO 181,183 1,327.0 732.4 642.8 607.4 678.2
18 IMPERIAL 175,594 940.0 535.3 649.3 607.0 691.6
19 NEVADA 98,484 908.7 922.7 649.3 605.0 693.6
20 SAN LUIS OBISPO 269,753 2,212.0 820.0 649.6 621.9 677.2
21 YOLO 200,995 1,134.7 564.5 651.5 613.0 690.1
22 SONOMA 484,258 3,835.7 792.1 653.4 632.2 674.5
CALIFORNIA 37,318,481 234,637.7 628.7 654.9 652.2 657.6
23 NAPA 136,681 1,182.3 865.0 671.2 632.1 710.3
24 SOLANO 413,220 2,838.7 687.0 718.9 692.1 745.8
25 RIVERSIDE 2,191,800 14,126.0 644.5 722.1 710.1 734.2
26 INYO 18,627 199.7 1071.9 723.1 619.9 826.2
27 TUOLUMNE 54,961 586.0 1066.2 725.5 664.6 786.3
28 COLUSA 21,452 146.7 683.7 728.1 609.2 847.1
29 MERCED 256,386 1,479.3 577.0 730.2 692.6 767.9
30 MENDOCINO 87,939 801.0 910.9 734.0 681.6 786.3
31 KINGS 153,020 787.0 514.3 737.0 684.0 790.0
32 SACRAMENTO 1,420,447 10,087.0 710.1 739.0 724.4 753.5
33 AMADOR 37,907 423.3 1116.8 739.6 666.3 813.0
34 FRESNO 933,075 6,075.0 651.1 743.2 724.3 762.1
35 MADERA 151,160 990.0 654.9 748.1 700.9 795.4
36 SUTTER 94,800 728.7 768.6 754.4 699.3 809.4
37 SAN JOAQUIN 686,761 4,655.0 677.8 758.5 736.5 780.5
38 GLENN 28,188 224.0 794.7 772.0 670.0 874.1
39 STANISLAUS 515,311 3,601.3 698.9 772.8 747.3 798.2
40 SAN BERNARDINO 2,038,771 12,015.3 589.3 778.1 763.9 792.4
41 BUTTE 220,024 2,187.3 994.1 784.8 750.9 818.7
42 CALAVERAS 45,258 470.3 1039.2 787.2 711.5 862.8
43 TULARE 443,638 2,770.3 624.5 790.5 760.7 820.3
44 HUMBOLDT 134,575 1,204.7 895.2 809.6 762.9 856.3
45 TEHAMA 63,635 592.0 930.3 813.1 746.6 879.7
46 KERN 841,744 5,285.7 627.9 836.5 813.4 859.6
47 MONO 14,114 43.3 307.0 849.5 615.6 1142.9
48 LASSEN 34,730 235.3 677.6 854.7 742.1 967.3
49 SHASTA 177,480 1,989.7 1121.1 855.2 816.7 893.650 PLUMAS 19,993 225.7 1128.7 856.4 738.5 974.2
51 SISKIYOU 44,951 541.7 1205.0 860.1 784.4 935.9
52 MODOC 9,676 116.0 1198.8 861.7 699.7 1023.7
53 SIERRA 3,231 39.7 1227.7 868.8 619.7 1184.6
54 TRINITY 13,883 157.3 1133.3 870.9 725.7 1016.1
55 YUBA 72,336 526.7 728.1 893.5 815.4 971.6
56 DEL NORTE 28,577 278.0 972.8 917.6 808.1 1027.0
57 ALPINE 1,147 8.7 755.6 * 919.6 * 413.1 1766.3
58 LAKE 64,466 795.3 1233.7 989.2 918.2 1060.2

7/28/2019 2013 County Health Status Profiles
http://slidepdf.com/reader/full/2013-county-health-status-profiles 12/102
County Health Status Profles 2013California Department of Public Health 5
DEATHS DUE TO ALL CANCERS, 2009-2011
he crude death rate from all cancers for California was 150.2 deaths per 100,000population, a risk of dying equivalent to approximately one death for every666.0 persons. This rate was based on a 2009 through 2011 three-year average
number of deaths equaling 56,035.3 and population count of 37,318,481 as of July 1, 2010. Among counties with reliable rates, the crude rate ranged from 300.1 inTrinity County to 101.7 in Kings County, a factor of 3.0 to 1.
The age-adjusted death rate from all cancers for California during the 2009 through2011 three-year period was 156.4 deaths per 100,000 population. Reliableage-adjusted death rates ranged from 200.8 in Trinity County to 124.0 in
Inyo County.
Twenty-eight counties with reliable age-adjusted death rates and California as awhole met the Healthy People 2020 National Objective C-1 of no more than
160.6 age-adjusted deaths due to all cancers per 100,000 population. An additional twocounties with unreliable rates met the objective.
The California average age-adjusted death rate for the 2006-2008 period was 162.7.
T

7/28/2019 2013 County Health Status Profiles
http://slidepdf.com/reader/full/2013-county-health-status-profiles 13/102
County Health Status Profles 2013California Department of Public Health 6
State of California, Department of Finance, Race/Hispanics Population with Age and Gender Detail, 2000–2010. Sacramento, California, September 2012.Sources: California Department of Public Health, 2009-2011 Death Statistical Master Files.
Note: Counties were rank ordered first by increasing age-adjusted death rate (calculated to 15 decimal places), second by decreasing size of the population.* Rates are deemed unreliable based on fewer than 20 data elements.
TABLE 2
DEATHS DUE TO ALL CANCERS
RANKED BY THREE-YEAR AVERAGE AGE-ADJUSTED DEATH RATE
CALIFORNIA COUNTIES, 2009-2011
x x x 95% CONFIDENCE LIMITS
RANKORDER
COUNTYOF RESIDENCE
2010POPULATION
2009-2011 DEATHS(AVERAGE)
CRUDEDEATH RATE
AGE-ADJUSTEDDEATHRATE LOWER UPPER
1 SIERRA 3,231 5.0 154.8 * 91.2 * 29.6 212.8
2 INYO 18,627 35.3 189.7 124.0 86.5 172.2
3 IMPERIAL 175,594 207.0 117.9 138.1 119.0 157.3
4 MONO 14,114 8.0 56.7 * 138.8 * 59.9 273.6
5 SANTA CLARA 1,787,553 2,330.3 130.4 139.5 133.8 145.36 SANTA BARBARA 424,291 639.0 150.6 141.1 130.0 152.2
7 MARIN 252,767 487.0 192.7 143.0 130.0 156.0
8 KINGS 153,020 155.7 101.7 143.1 120.0 166.2
9 SANTA CRUZ 263,174 380.7 144.6 145.3 130.2 160.4
10 ORANGE 3,017,089 4,323.0 143.3 145.9 141.5 150.3
11 MONTEREY 415,825 555.0 133.5 146.4 134.1 158.7
12 VENTURA 825,378 1,220.0 147.8 148.6 140.2 157.0
13 MARIPOSA 18,119 41.3 228.1 148.9 107.0 201.8
14 SAN FRANCISCO 807,177 1,393.0 172.6 151.2 143.2 159.2
15 PLACER 350,609 660.3 188.3 152.0 140.3 163.7
16 LASSEN 34,730 43.0 123.8 152.1 110.1 204.9
17 ALAMEDA 1,513,493 2,199.3 145.3 153.0 146.5 159.5
18 LOS ANGELES 9,827,070 13,907.0 141.5 153.1 150.5 155.7
19 SAN BENITO 55,350 72.3 130.7 153.5 120.2 193.2
20 SAN LUIS OBISPO 269,753 521.0 193.1 153.9 140.5 167.3
21 SAN MATEO 719,582 1,193.7 165.9 153.9 145.1 162.7
22 FRESNO 933,075 1,244.7 133.4 154.4 145.7 163.0
23 YOLO 200,995 264.7 131.7 154.5 135.5 173.4
24 NEVADA 98,484 228.3 231.8 154.6 133.8 175.4
25 CONTRA COSTA 1,052,192 1,704.7 162.0 154.9 147.4 162.4
26 MADERA 151,160 215.0 142.2 155.0 134.0 176.0
27 EL DORADO 181,183 340.3 187.8 156.4 139.4 173.5
CALIFORNIA 37,318,481 56,035.3 150.2 156.4 155.1 157.8
28 TUOLUMNE 54,961 134.3 244.4 157.0 129.9 184.1
29 SUTTER 94,800 155.0 163.5 158.6 133.5 183.7
30 SAN DIEGO 3,104,581 4,798.0 154.5 160.6 156.0 165.1
HEALTHY PEOPLE 2020 NATIONAL OBJECTIVE C-1 160.6
31 TULARE 443,638 566.3 127.7 160.7 147.3 174.1
32 KERN 841,744 1,050.0 124.7 161.3 151.3 171.2
33 STANISLAUS 515,311 758.7 147.2 161.7 150.0 173.3
34 MERCED 256,386 330.3 128.8 162.3 144.6 180.0
35 RIVERSIDE 2,191,800 3,319.3 151.4 162.7 157.1 168.3
36 PLUMAS 19,993 48.0 240.1 165.1 121.8 218.9
37 SONOMA 484,258 960.0 198.2 167.4 156.6 178.2
38 SAN JOAQUIN 686,761 1,033.3 150.5 168.3 157.9 178.7
39 GLENN 28,188 51.0 180.9 168.9 125.8 222.1
40 SAN BERNARDINO 2,038,771 2,711.7 133.0 170.0 163.5 176.6
41 CALAVERAS 45,258 116.0 256.3 170.8 138.2 203.4
42 MENDOCINO 87,939 193.0 219.5 170.9 146.1 195.6
43 SACRAMENTO 1,420,447 2,346.3 165.2 172.6 165.5 179.6
44 AMADOR 37,907 103.3 272.6 172.7 138.5 206.9
45 COLUSA 21,452 35.3 164.7 173.8 121.3 241.4
46 SOLANO 413,220 717.0 173.5 177.0 163.8 190.2
47 MODOC 9,676 25.7 265.3 178.0 115.9 261.5
48 BUTTE 220,024 495.3 225.1 179.6 163.5 195.8
49 NAPA 136,681 306.0 223.9 180.3 159.7 200.8
50 HUMBOLDT 134,575 275.0 204.3 182.4 160.3 204.4
51 TEHAMA 63,635 143.0 224.7 185.5 154.7 216.3
52 LAKE 64,466 168.0 260.6 193.3 163.3 223.4
53 SISKIYOU 44,951 129.3 287.7 193.7 159.2 228.2
54 SHASTA 177,480 465.0 262.0 194.8 176.8 212.9
55 YUBA 72,336 119.0 164.5 196.0 160.0 231.9
56 DEL NORTE 28,577 63.3 221.6 197.1 151.5 252.0
57 TRINITY 13,883 41.7 300.1 200.8 144.5 271.7
58 ALPINE 1,147 2.3 203.4 * 298.8 * 45.4 992.4
7/28/2019 2013 County Health Status Profiles
http://slidepdf.com/reader/full/2013-county-health-status-profiles 14/102
County Health Status Profles 2013California Department of Public Health 7
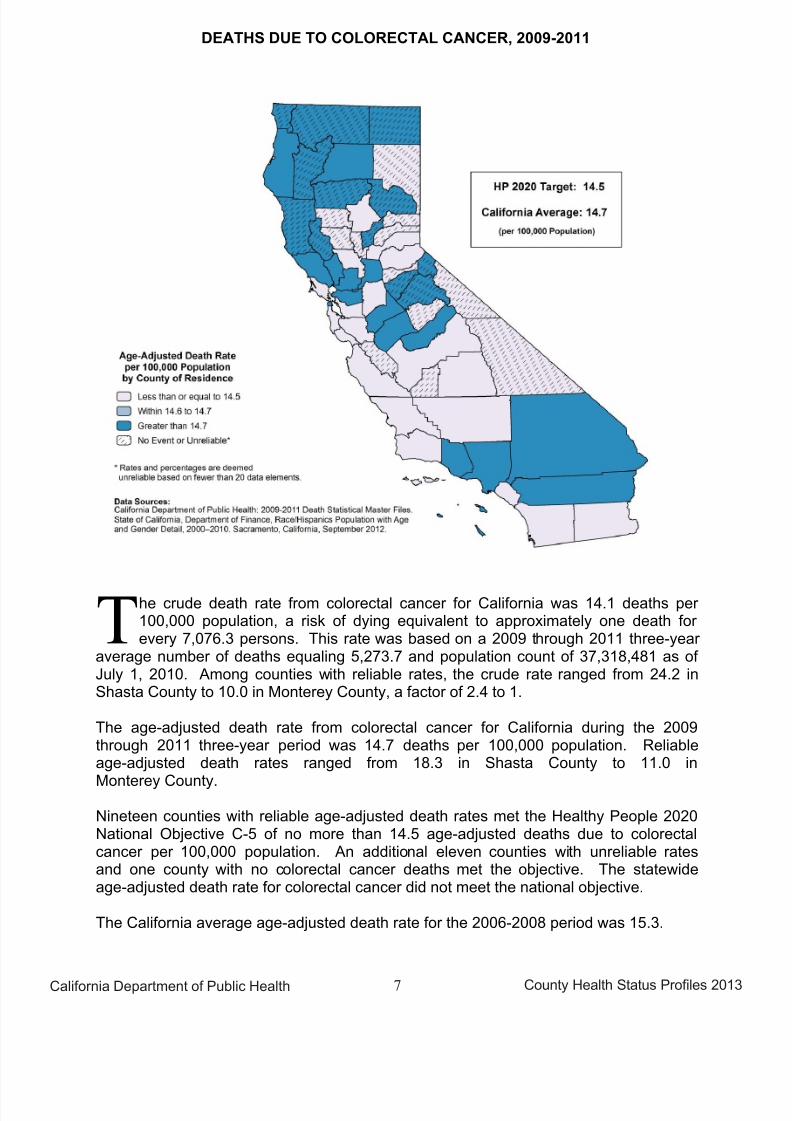
DEATHS DUE TO COLORECTAL CANCER, 2009-2011
he crude death rate from colorectal cancer for California was 14.1 deaths per 100,000 population, a risk of dying equivalent to approximately one death for every 7,076.3 persons. This rate was based on a 2009 through 2011 three-year
average number of deaths equaling 5,273.7 and population count of 37,318,481 as of July 1, 2010. Among counties with reliable rates, the crude rate ranged from 24.2 inShasta County to 10.0 in Monterey County, a factor of 2.4 to 1.
The age-adjusted death rate from colorectal cancer for California during the 2009through 2011 three-year period was 14.7 deaths per 100,000 population. Reliableage-adjusted death rates ranged from 18.3 in Shasta County to 11.0 in
Monterey County.
Nineteen counties with reliable age-adjusted death rates met the Healthy People 2020National Objective C-5 of no more than 14.5 age-adjusted deaths due to colorectalcancer per 100,000 population. An additional eleven counties with unreliable ratesand one county with no colorectal cancer deaths met the objective. The statewideage-adjusted death rate for colorectal cancer did not meet the national objective.
The California average age-adjusted death rate for the 2006-2008 period was 15.3.
T

7/28/2019 2013 County Health Status Profiles
http://slidepdf.com/reader/full/2013-county-health-status-profiles 15/102
County Health Status Profles 2013California Department of Public Health 8
State of California, Department of Finance, Race/Hispanics Population with Age and Gender Detail, 2000–2010. Sacramento, California, September 2012.Sources: California Department of Public Health, 2009-2011 Death Statistical Master Files.
Note: Counties were rank ordered first by increasing age-adjusted death rate (calculated to 15 decimal places), second by decreasing size of the population.- Rates, percentages, and confidence limits are not calculated for zero events.* Rates are deemed unreliable based on fewer than 20 data elements.
TABLE 3
DEATHS DUE TO COLORECTAL CANCER
RANKED BY THREE-YEAR AVERAGE AGE-ADJUSTED DEATH RATE
CALIFORNIA COUNTIES, 2009-2011
x x x 95% CONFIDENCE LIMITS
RANKORDER
COUNTYOF RESIDENCE
2010POPULATION
2009-2011 DEATHS(AVERAGE)
CRUDEDEATHRATE
AGE-ADJUSTEDDEATH RATE LOWER UPPER
1 SIERRA 3,231 0.0 - - - -
2 MARIPOSA 18,119 1.7 9.2 * 5.3 * 0.5 21.1
3 MONO 14,114 0.3 2.4 * 7.2 * 0.0 94.5
4 KINGS 153,020 11.3 7.4 * 11.0 * 5.5 19.5
5 MONTEREY 415,825 41.7 10.0 11.0 7.9 14.9
6 SUTTER 94,800 11.0 11.6 * 11.2 * 5.6 20.1
7 COLUSA 21,452 2.3 10.9 * 11.3 * 1.7 37.5
8 SANTA BARBARA 424,291 52.3 12.3 11.4 8.5 14.9
9 GLENN 28,188 3.3 11.8 * 11.6 * 2.7 32.3
10 AMADOR 37,907 7.0 18.5 * 11.6 * 4.7 24.0
11 PLACER 350,609 53.0 15.1 12.3 9.2 16.1
12 ORANGE 3,017,089 372.3 12.3 12.4 11.1 13.7
13 SAN BENITO 55,350 5.3 9.6 * 12.5 * 4.3 28.5
14 MARIN 252,767 43.7 17.3 12.6 9.1 16.9
15 NEVADA 98,484 18.7 19.0 * 12.8 * 7.7 20.1
16 SANTA CRUZ 263,174 35.3 13.4 13.4 9.4 18.7
17 SANTA CLARA 1,787,553 228.3 12.8 13.5 11.7 15.3
18 KERN 841,744 88.0 10.5 13.6 10.9 16.8
19 INYO 18,627 3.7 19.7 * 13.7 * 3.5 36.5
20 EL DORADO 181,183 29.0 16.0 13.7 9.2 19.7
21 SAN LUIS OBISPO 269,753 46.7 17.3 13.7 10.1 18.322 FRESNO 933,075 111.7 12.0 13.8 11.2 16.4
23 IMPERIAL 175,594 21.0 12.0 14.0 8.7 21.4
24 LASSEN 34,730 3.7 10.6 * 14.0 * 3.5 37.3
25 BUTTE 220,024 40.7 18.5 14.0 10.1 19.1
26 ALAMEDA 1,513,493 204.3 13.5 14.1 12.1 16.1
27 SAN MATEO 719,582 110.7 15.4 14.1 11.5 16.8
28 SAN JOAQUIN 686,761 87.0 12.7 14.2 11.4 17.5
29 YOLO 200,995 24.7 12.3 14.2 9.2 21.1
30 SAN DIEGO 3,104,581 433.7 14.0 14.4 13.0 15.7
31 TULARE 443,638 51.0 11.5 14.5 10.8 19.1
HEALTHY PEOPLE 2020 NATIONAL OBJECTIVE C-5 14.5
CALIFORNIA 37,318,481 5,273.7 14.1 14.7 14.3 15.1
32 LOS ANGELES 9,827,070 1,360.3 13.8 14.9 14.1 15.7
33 VENTURA 825,378 125.0 15.1 14.9 12.3 17.5
34 SAN FRANCISCO 807,177 140.7 17.4 15.1 12.6 17.635 MENDOCINO 87,939 17.0 19.3 * 15.2 * 8.9 24.4
36 LAKE 64,466 12.7 19.6 * 15.3 * 8.1 26.3
37 CALAVERAS 45,258 9.7 21.4 * 15.5 * 7.3 28.7
38 SONOMA 484,258 90.7 18.7 15.5 12.5 19.0
39 SOLANO 413,220 63.3 15.3 15.6 12.0 20.0
40 CONTRA COSTA 1,052,192 174.7 16.6 15.7 13.3 18.0
41 SACRAMENTO 1,420,447 211.3 14.9 15.7 13.5 17.8
42 TUOLUMNE 54,961 13.0 23.7 * 15.8 * 8.4 27.1
43 MADERA 151,160 22.3 14.8 15.9 10.0 24.0
44 TRINITY 13,883 3.0 21.6 * 16.0 * 3.3 46.8
45 TEHAMA 63,635 12.7 19.9 * 16.0 * 8.4 27.6
46 PLUMAS 19,993 5.3 26.7 * 16.3 * 5.5 37.0
47 STANISLAUS 515,311 76.0 14.7 16.3 12.8 20.4
48 DEL NORTE 28,577 5.3 18.7 * 16.6 * 5.6 37.7
49 HUMBOLDT 134,575 25.0 18.6 16.8 10.9 24.950 SISKIYOU 44,951 10.7 23.7 * 16.9 * 8.3 30.5
51 RIVERSIDE 2,191,800 346.3 15.8 17.2 15.4 19.1
52 NAPA 136,681 29.3 21.5 17.5 11.8 25.1
53 MERCED 256,386 35.3 13.8 17.7 12.4 24.6
54 SAN BERNARDINO 2,038,771 282.0 13.8 17.9 15.8 20.1
55 YUBA 72,336 11.0 15.2 * 18.2 * 9.1 32.6
56 SHASTA 177,480 43.0 24.2 18.3 13.2 24.6
57 MODOC 9,676 4.3 44.8 * 28.0 * 8.2 69.4
58 ALPINE 1,147 0.3 29.1 * 29.3 * 0.0 382.8

7/28/2019 2013 County Health Status Profiles
http://slidepdf.com/reader/full/2013-county-health-status-profiles 16/102
County Health Status Profles 2013California Department of Public Health 9
DEATHS DUE TO LUNG CANCER, 2009-2011
he crude death rate from lung cancer for California was 34.5 deaths per 100,000population, a risk of dying equivalent to approximately one death for every2,898.8 persons. This rate was based on the 2009 through 2011 three-year
average number of deaths equaling 12,873.7 and population count of 37,318,481 as of July 1, 2010. Among counties with reliable rates, the crude rate ranged from 84.5 inSiskiyou County to 23.5 in Imperial County, a factor of 3.6 to 1.
The age-adjusted death rate from lung cancer for California during the 2009 through2011 three-year period was 36.5 deaths per 100,000 population. Reliable age-adjusteddeath rates ranged from 61.6 in Yuba County to 27.5 in Imperial County.
Thirty-five counties with reliable age-adjusted death rates and California as a whole metthe Healthy People 2020 National Objective C-2 of no more than 45.5 age-adjusteddeaths due to lung cancer per 100,000 population. An additional eight counties withunreliable rates met the objective.
The California average age-adjusted death rate for the 2006-2008 period was 39.7.
T

7/28/2019 2013 County Health Status Profiles
http://slidepdf.com/reader/full/2013-county-health-status-profiles 17/102
County Health Status Profles 2013California Department of Public Health 10
State of California, Department of Finance, Race/Hispanics Population with Age and Gender Detail, 2000–2010. Sacramento, California, September 2012.Sources: California Department of Public Health, 2009-2011 Death Statistical Master Files.
Note: Counties were rank ordered first by increasing age-adjusted death rate (calculated to 15 decimal places), second by decreasing size of the population.* Rates are deemed unreliable based on fewer than 20 data elements.
TABLE 4
DEATHS DUE TO LUNG CANCER
RANKED BY THREE-YEAR AVERAGE AGE-ADJUSTED DEATH RATE
CALIFORNIA COUNTIES, 2009-2011
x x x 95% CONFIDENCE LIMITS
RANKORDER
COUNTYOF RESIDENCE
2010POPULATION
2009-2011 DEATHS(AVERAGE)
CRUDEDEATHRATE
AGE-ADJUSTEDDEATH RATE LOWER UPPER
1 SIERRA 3,231 1.3 41.3 * 24.2 * 1.3 111.6
2 IMPERIAL 175,594 41.3 23.5 27.5 19.7 37.2
3 SANTA CRUZ 263,174 70.7 26.9 28.1 21.9 35.4
4 SANTA CLARA 1,787,553 473.3 26.5 28.9 26.2 31.5
5 MARIN 252,767 108.3 42.9 32.0 25.9 38.26 VENTURA 825,378 260.0 31.5 32.1 28.2 36.1
7 SANTA BARBARA 424,291 143.3 33.8 32.3 27.0 37.6
8 SAN BENITO 55,350 15.3 27.7 * 32.4 * 18.3 53.2
9 LOS ANGELES 9,827,070 2,938.0 29.9 33.0 31.8 34.2
10 ORANGE 3,017,089 980.3 32.5 33.7 31.6 35.8
11 YOLO 200,995 57.3 28.5 33.7 25.6 43.6
12 SAN MATEO 719,582 267.3 37.2 34.8 30.6 39.0
13 KINGS 153,020 37.0 24.2 34.9 24.6 48.1
14 PLUMAS 19,993 10.7 53.4 * 35.1 * 17.3 63.4
15 EL DORADO 181,183 77.7 42.9 35.1 27.8 43.9
16 PLACER 350,609 154.0 43.9 35.4 29.7 41.0
17 INYO 18,627 10.0 53.7 * 35.4 * 17.0 65.2
18 MONTEREY 415,825 131.0 31.5 35.5 29.3 41.6
19 ALAMEDA 1,513,493 502.3 33.2 35.5 32.3 38.6
20 NEVADA 98,484 53.7 54.5 35.6 26.8 46.5
21 LASSEN 34,730 9.3 26.9 * 35.8 * 16.6 67.2
22 SAN LUIS OBISPO 269,753 121.3 45.0 35.9 29.4 42.3
23 CONTRA COSTA 1,052,192 387.7 36.8 36.2 32.6 39.9
CALIFORNIA 37,318,481 12,873.7 34.5 36.5 35.8 37.1
24 FRESNO 933,075 287.7 30.8 36.7 32.4 40.9
25 SAN FRANCISCO 807,177 334.7 41.5 36.8 32.9 40.8
26 SAN DIEGO 3,104,581 1,091.7 35.2 37.2 35.0 39.4
27 MONO 14,114 2.0 14.2 * 39.4 * 4.8 142.4
28 RIVERSIDE 2,191,800 810.7 37.0 39.5 36.7 42.2
29 SAN BERNARDINO 2,038,771 625.3 30.7 40.3 37.0 43.5
30 SONOMA 484,258 229.0 47.3 40.6 35.2 46.0
31 KERN 841,744 259.7 30.8 40.7 35.6 45.7
32 MODOC 9,676 6.0 62.0 * 41.1 * 15.1 89.4
33 MADERA 151,160 57.0 37.7 41.4 31.4 53.7
34 MERCED 256,386 84.0 32.8 41.6 33.2 51.5
35 TUOLUMNE 54,961 37.0 67.3 41.6 29.3 57.4
36 STANISLAUS 515,311 194.7 37.8 41.8 35.9 47.7
37 GLENN 28,188 13.7 48.5 * 43.4 * 23.5 73.2
38 NAPA 136,681 72.3 52.9 43.4 34.0 54.6
39 SOLANO 413,220 175.7 42.5 43.5 37.0 50.1
40 TULARE 443,638 154.7 34.9 44.4 37.3 51.4
41 BUTTE 220,024 121.0 55.0 44.6 36.5 52.7
42 CALAVERAS 45,258 32.0 70.7 44.7 30.6 63.2
43 SACRAMENTO 1,420,447 601.7 42.4 44.8 41.2 48.4
HEALTHY PEOPLE 2020 NATIONAL OBJECTIVE C-2 45.5
44 MENDOCINO 87,939 52.7 59.9 45.6 34.1 59.7
45 SAN JOAQUIN 686,761 282.3 41.1 47.0 41.4 52.5
46 HUMBOLDT 134,575 69.3 51.5 47.0 36.6 59.5
47 AMADOR 37,907 29.0 76.5 47.5 31.8 68.2
48 MARIPOSA 18,119 14.3 79.1 * 49.2 * 27.1 82.0
49 SHASTA 177,480 120.7 68.0 49.9 40.9 58.950 SUTTER 94,800 51.0 53.8 52.1 38.8 68.5
51 SISKIYOU 44,951 38.0 84.5 53.2 37.7 73.1
52 TEHAMA 63,635 41.3 65.0 53.4 38.4 72.3
53 ALPINE 1,147 1.0 87.2 * 54.7 * 1.4 305.0
54 LAKE 64,466 51.0 79.1 57.6 42.9 75.7
55 COLUSA 21,452 12.7 59.0 * 60.7 * 32.0 104.5
56 DEL NORTE 28,577 19.3 67.7 * 61.3 * 37.1 95.4
57 YUBA 72,336 36.7 50.7 61.6 43.3 85.0
58 TRINITY 13,883 12.7 91.2 * 62.6 * 33.0 107.8
7/28/2019 2013 County Health Status Profiles
http://slidepdf.com/reader/full/2013-county-health-status-profiles 18/102
County Health Status Profles 2013California Department of Public Health 11
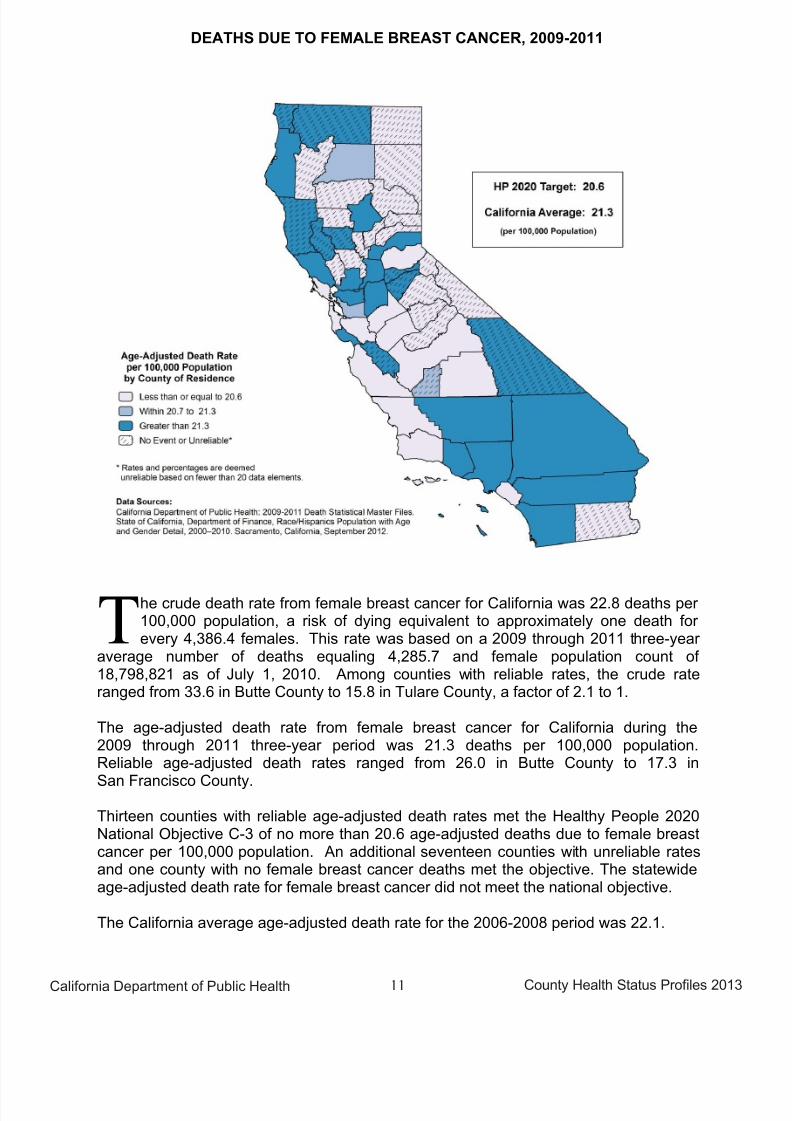
DEATHS DUE TO FEMALE BREAST CANCER, 2009-2011
he crude death rate from female breast cancer for California was 22.8 deaths per 100,000 population, a risk of dying equivalent to approximately one death for every 4,386.4 females. This rate was based on a 2009 through 2011 three-year
average number of deaths equaling 4,285.7 and female population count of 18,798,821 as of July 1, 2010. Among counties with reliable rates, the crude rateranged from 33.6 in Butte County to 15.8 in Tulare County, a factor of 2.1 to 1.
The age-adjusted death rate from female breast cancer for California during the2009 through 2011 three-year period was 21.3 deaths per 100,000 population.Reliable age-adjusted death rates ranged from 26.0 in Butte County to 17.3 in
San Francisco County.
Thirteen counties with reliable age-adjusted death rates met the Healthy People 2020National Objective C-3 of no more than 20.6 age-adjusted deaths due to female breastcancer per 100,000 population. An additional seventeen counties with unreliable ratesand one county with no female breast cancer deaths met the objective. The statewideage-adjusted death rate for female breast cancer did not meet the national objective.
The California average age-adjusted death rate for the 2006-2008 period was 22.1.
T

7/28/2019 2013 County Health Status Profiles
http://slidepdf.com/reader/full/2013-county-health-status-profiles 19/102
County Health Status Profles 2013California Department of Public Health 12
State of California, Department of Finance, Race/Hispanics Population with Age and Gender Detail, 2000–2010. Sacramento, California, September 2012.Sources: California Department of Public Health, 2009-2011 Death Statistical Master Files.
Note: Counties were rank ordered first by increasing age-adjusted death rate (calculated to 15 decimal places), second by decreasing size of the population.- Rates, percentages, and confidence limits are not calculated for zero events.* Rates are deemed unreliable based on fewer than 20 data elements.
TABLE 5
DEATHS DUE TO FEMALE BREAST CANCER
RANKED BY THREE-YEAR AVERAGE AGE-ADJUSTED DEATH RATE
CALIFORNIA COUNTIES, 2009-2011
x x x 95% CONFIDENCE LIMITS
RANKORDER
COUNTYOF RESIDENCE
2010 FEMALEPOPULATION
2009-2011 DEATHS(AVERAGE)
CRUDEDEATHRATE
AGE-ADJUSTEDDEATH RATE LOWER UPPER
1 ALPINE 555 0.0 - - - -
2 MONO 6,695 0.7 10.0 * 7.0 * 0.0 52.7
3 SIERRA 1,589 0.3 21.0 * 8.2 * 0.0 107.8
4 LASSEN 12,264 1.7 13.6 * 8.9 * 0.8 35.8
5 MARIPOSA 8,934 1.7 18.7 * 10.6 * 0.9 42.4
6 MADERA 78,291 9.0 11.5 * 11.5 * 5.3 21.9
7 NEVADA 50,055 12.7 25.3 * 15.2 * 8.0 26.2
8 TEHAMA 31,970 7.0 21.9 * 17.1 * 6.9 35.1
9 PLUMAS 9,975 2.7 26.7 * 17.1 * 3.1 53.0
10 SAN FRANCISCO 398,392 86.7 21.8 17.3 13.8 21.3
11 SUTTER 47,804 9.3 19.5 * 17.7 * 8.2 33.2
12 TULARE 221,509 35.0 15.8 17.7 12.3 24.7
13 SANTA BARBARA 211,386 44.0 20.8 17.8 12.9 23.9
14 YOLO 102,944 17.0 16.5 * 17.9 * 10.4 28.6
15 MARIN 129,029 35.3 27.4 18.1 12.6 25.1
16 IMPERIAL 85,518 14.7 17.2 * 18.2 * 10.1 30.1
17 FRESNO 467,436 82.7 17.7 18.4 14.7 22.8
18 MONTEREY 202,151 38.7 19.1 18.6 13.2 25.4
19 MERCED 127,300 21.0 16.5 18.6 11.5 28.5
20 SANTA CLARA 892,757 177.7 19.9 18.7 16.0 21.5
21 TUOLUMNE 25,985 9.3 35.9 * 19.1 * 8.9 35.922 GLENN 13,954 3.0 21.5 * 19.4 * 4.0 56.6
23 MODOC 4,811 1.0 20.8 * 19.4 * 0.5 108.1
24 ORANGE 1,530,198 329.0 21.5 19.6 17.5 21.7
25 SAN MATEO 368,808 86.3 23.4 19.6 15.7 24.2
26 EL DORADO 90,557 23.0 25.4 19.7 12.5 29.5
27 YUBA 35,885 6.7 18.6 * 19.7 * 7.7 41.3
28 STANISLAUS 260,500 52.3 20.1 19.8 14.8 25.9
29 NAPA 68,647 18.0 26.2 * 19.8 * 11.7 31.3
30 TRINITY 6,718 1.7 24.8 * 20.2 * 1.8 81.0
31 SAN LUIS OBISPO 131,921 36.3 27.5 20.5 14.4 28.4
HEALTHY PEOPLE 2020 NATIONAL OBJECTIVE C-3 20.6
32 KINGS 66,804 12.0 18.0 * 21.1 * 10.9 36.9
33 ALAMEDA 773,407 173.3 22.4 21.1 17.9 24.3
34 SHASTA 90,224 27.7 30.7 21.3 14.1 30.8
CALIFORNIA 18,798,821 4,285.7 22.8 21.3 20.6 21.935 CONTRA COSTA 540,405 133.0 24.6 21.4 17.7 25.1
36 SACRAMENTO 725,770 168.7 23.2 21.7 18.4 25.0
37 VENTURA 416,347 100.7 24.2 21.7 17.4 26.0
38 SAN BENITO 27,732 6.0 21.6 * 21.8 * 8.0 47.4
39 LOS ANGELES 4,990,693 1,140.7 22.9 21.9 20.6 23.2
40 RIVERSIDE 1,100,978 246.7 22.4 22.1 19.3 24.8
41 SAN DIEGO 1,548,552 372.0 24.0 22.4 20.1 24.7
42 KERN 407,231 81.0 19.9 22.5 17.9 27.9
43 SAN JOAQUIN 345,346 78.3 22.7 22.7 18.0 28.3
44 SANTA CRUZ 131,980 34.7 26.3 23.4 16.2 32.5
45 COLUSA 10,410 2.3 22.4 * 23.7 * 3.6 78.6
46 HUMBOLDT 66,810 20.3 30.4 23.9 14.6 36.7
47 SISKIYOU 22,481 9.0 40.0 * 24.1 * 11.0 45.7
48 SOLANO 207,720 55.0 26.5 24.1 18.2 31.4
49 SAN BERNARDINO 1,026,302 224.3 21.9 24.2 21.0 27.450 LAKE 32,055 11.3 35.4 * 25.2 * 12.8 44.8
51 PLACER 179,468 60.3 33.6 25.4 19.4 32.6
52 DEL NORTE 12,700 4.3 34.1 * 25.5 * 7.4 63.1
53 SONOMA 246,827 82.3 33.4 25.6 20.4 31.8
54 BUTTE 111,037 37.3 33.6 26.0 18.3 35.7
55 MENDOCINO 43,896 15.3 34.9 * 26.6 * 15.0 43.7
56 CALAVERAS 22,610 10.0 44.2 * 27.2 * 13.1 50.1
57 INYO 9,191 4.3 47.1 * 27.9 * 8.1 69.0
58 AMADOR 17,305 10.3 59.7 * 37.2 * 18.1 67.8

7/28/2019 2013 County Health Status Profiles
http://slidepdf.com/reader/full/2013-county-health-status-profiles 20/102
County Health Status Profles 2013California Department of Public Health 13
DEATHS DUE TO PROSTATE CANCER, 2009-2011
he crude death rate from male prostate cancer for California was 16.6 deaths per 100,000 population, a risk of dying equivalent to approximately one death for every 6,033.1 males. This rate was based on a 2009 through 2011 three-year
average number of deaths equaling 3,069.7 and male population count of 18,519,660 as of July 1, 2010. Among counties with reliable rates, the crude rateranged from 32.1 in Shasta County to 12.6 in Tulare County, a factor of 2.5 to 1.
The age-adjusted death rate from male prostate cancer for California during the2009 through 2011 three-year period was 21.9 deaths per 100,000 population.Reliable age-adjusted death rates ranged from 27.6 in Shasta County to 17.0 in
San Francisco County.
Eleven counties with reliable age-adjusted death rates met the Healthy People 2020National Objective C-7 of no more than 21.2 age-adjusted deaths due to prostatecancer per 100,000 male population. An additional fourteen counties with unreliablerates met the objective. The statewide age-adjusted death rate for male prostate cancer did not meet the national objective.
The California average age-adjusted death rate for the 2006-2008 period was 22.8.
T

7/28/2019 2013 County Health Status Profiles
http://slidepdf.com/reader/full/2013-county-health-status-profiles 21/102
County Health Status Profles 2013California Department of Public Health 14
State of California, Department of Finance, Race/Hispanics Population with Age and Gender Detail, 2000–2010. Sacramento, California, September 2012.Sources: California Department of Public Health, 2009-2011 Death Statistical Master Files.
Note: Counties were rank ordered first by increasing age-adjusted death rate (calculated to 15 decimal places), second by decreasing size of the population.* Rates are deemed unreliable based on fewer than 20 data elements.
TABLE 6
DEATHS DUE TO PROSTATE CANCER
RANKED BY THREE-YEAR AVERAGE AGE-ADJUSTED DEATH RATE
CALIFORNIA COUNTIES, 2009-2011
x x x 95% CONFIDENCE LIMITS
RANKORDER
COUNTYOF RESIDENCE
2010 MALEPOPULATION
2009-2011 DEATHS(AVERAGE)
CRUDEDEATHRATE
AGE-ADJUSTEDDEATH RATE LOWER UPPER
1 LASSEN 22,466 1.0 4.5 * 8.1 * 0.2 45.0
2 TUOLUMNE 28,976 5.7 19.6 * 15.1 * 5.3 33.5
3 MODOC 4,865 1.0 20.6 * 17.0 * 0.4 94.5
4 SAN FRANCISCO 408,785 64.7 15.8 17.0 13.1 21.7
5 SANTA CLARA 894,796 113.3 12.7 17.1 13.9 20.36 PLACER 171,141 31.3 18.3 17.1 11.7 24.3
7 MENDOCINO 44,043 8.3 18.9 * 17.8 * 7.8 34.6
8 MONO 7,419 1.0 13.5 * 17.9 * 0.5 99.6
9 EL DORADO 90,626 15.7 17.3 * 18.7 * 10.6 30.4
10 FRESNO 465,639 61.0 13.1 19.2 14.7 24.6
11 STANISLAUS 254,811 35.0 13.7 19.3 13.4 26.8
12 KINGS 86,216 7.0 8.1 * 19.5 * 7.8 40.1
13 YUBA 36,451 4.7 12.8 * 19.6 * 6.0 47.0
14 MARIN 123,738 27.3 22.1 19.7 13.0 28.5
15 MADERA 72,869 10.7 14.6 * 20.3 * 10.0 36.6
16 ORANGE 1,486,891 237.0 15.9 20.4 17.8 23.1
17 SAN MATEO 350,774 61.3 17.5 20.5 15.7 26.3
18 SAN LUIS OBISPO 137,832 30.0 21.8 20.7 13.9 29.5
19 SUTTER 46,996 7.7 16.3 * 20.8 * 8.8 41.6
20 CALAVERAS 22,648 6.0 26.5 * 20.8 * 7.6 45.3
21 SONOMA 237,431 48.0 20.2 20.9 15.4 27.7
22 GLENN 14,234 2.7 18.7 * 20.9 * 3.8 64.8
23 TULARE 222,129 28.0 12.6 20.9 13.9 30.2
24 MARIPOSA 9,185 2.3 25.4 * 21.2 * 3.2 70.3
25 MERCED 129,086 16.0 12.4 * 21.2 * 12.1 34.4
HEALTHY PEOPLE 2020 NATIONAL OBJECTIVE C-7 21.2
26 SAN JOAQUIN 341,415 49.7 14.5 21.3 15.8 28.1
27 DEL NORTE 15,877 2.7 16.8 * 21.3 * 3.8 66.1
28 CONTRA COSTA 511,787 93.0 18.2 21.4 17.2 26.2
29 YOLO 98,051 14.7 15.0 * 21.7 * 12.0 35.9
30 MONTEREY 213,674 32.3 15.1 21.7 14.9 30.6
31 LOS ANGELES 4,836,377 761.0 15.7 21.7 20.2 23.3
CALIFORNIA 18,519,660 3,069.7 16.6 21.9 21.1 22.7
32 SACRAMENTO 694,677 117.0 16.8 22.2 18.1 26.3
33 VENTURA 409,031 73.3 17.9 22.4 17.6 28.1
34 SANTA CRUZ 131,194 23.3 17.8 22.5 14.3 33.7
35 AMADOR 20,602 5.7 27.5 * 22.6 * 8.0 50.3
36 SANTA BARBARA 212,905 44.3 20.8 23.1 16.8 31.0
37 HUMBOLDT 67,765 13.7 20.2 * 23.4 * 12.7 39.4
38 ALAMEDA 740,086 129.0 17.4 23.6 19.5 27.7
39 TRINITY 7,165 2.3 32.6 * 23.7 * 3.6 78.6
40 SAN DIEGO 1,556,029 293.0 18.8 24.2 21.4 27.0
41 KERN 434,513 56.7 13.0 24.4 18.5 31.7
42 COLUSA 11,042 2.0 18.1 * 24.4 * 3.0 88.3
43 IMPERIAL 90,076 14.3 15.9 * 24.5 * 13.5 40.8
44 RIVERSIDE 1,090,822 197.7 18.1 24.6 21.1 28.1
45 SOLANO 205,500 37.3 18.2 24.8 17.5 34.2
46 NAPA 68,034 19.0 27.9 * 25.2 * 15.2 39.4
47 BUTTE 108,987 31.0 28.4 25.5 17.4 36.2
48 SAN BERNARDINO 1,012,469 148.7 14.7 26.1 21.8 30.5
49 TEHAMA 31,665 8.3 26.3 * 26.5 * 11.7 51.650 SAN BENITO 27,618 4.3 15.7 * 26.6 * 7.7 65.8
51 SISKIYOU 22,470 7.7 34.1 * 27.0 * 11.4 54.0
52 SHASTA 87,256 28.0 32.1 27.6 18.3 39.9
53 INYO 9,436 3.3 35.3 * 28.0 * 6.4 77.9
54 NEVADA 48,429 16.3 33.7 * 28.5 * 16.4 46.1
55 PLUMAS 10,018 2.7 26.6 * 29.2 * 5.3 90.5
56 LAKE 32,411 9.7 29.8 * 29.3 * 13.9 54.5
57 SIERRA 1,642 0.7 40.6 * 31.9 * 0.2 238.1
58 ALPINE 592 0.3 56.3 * 143.4 * 0.0 1875.3

7/28/2019 2013 County Health Status Profiles
http://slidepdf.com/reader/full/2013-county-health-status-profiles 22/102

7/28/2019 2013 County Health Status Profiles
http://slidepdf.com/reader/full/2013-county-health-status-profiles 23/102
County Health Status Profles 2013California Department of Public Health 16
State of California, Department of Finance, Race/Hispanics Population with Age and Gender Detail, 2000–2010. Sacramento, California, September 2012.Sources: California Department of Public Health, 2009-2011 Death Statistical Master Files.
Note: Counties were rank ordered first by increasing age-adjusted death rate (calculated to 15 decimal places), second by decreasing size of the population.* Rates are deemed unreliable based on fewer than 20 data elements.
TABLE 7
DEATHS DUE TO DIABETES
RANKED BY THREE-YEAR AVERAGE AGE-ADJUSTED DEATH RATE
CALIFORNIA COUNTIES, 2009-2011
x x x 95% CONFIDENCE LIMITS
RANKORDER
COUNTYOF RESIDENCE
2010POPULATION
2009-2011 DEATHS(AVERAGE)
CRUDEDEATHRATE
AGE-ADJUSTEDDEATH RATE LOWER UPPER
HEALTHY PEOPLE 2020 NATIONAL OBJECTIVE: NONE
1 COLUSA 21,452 1.0 4.7 * 4.0 * 0.1 22.5
2 AMADOR 37,907 4.3 11.4 * 6.8 * 2.0 16.9
3 MONO 14,114 0.3 2.4 * 7.2 * 0.0 94.5
4 MODOC 9,676 1.0 10.3 * 7.4 * 0.2 41.15 TRINITY 13,883 1.7 12.0 * 7.4 * 0.7 29.8
6 MARIN 252,767 29.7 11.7 8.4 5.7 12.0
7 MARIPOSA 18,119 2.0 11.0 * 9.9 * 1.2 35.6
8 INYO 18,627 3.0 16.1 * 9.9 * 2.0 29.0
9 NEVADA 98,484 15.3 15.6 * 10.5 * 5.9 17.2
10 SAN FRANCISCO 807,177 101.3 12.6 10.9 8.7 13.0
11 PLACER 350,609 53.0 15.1 12.2 9.1 15.9
12 SAN MATEO 719,582 94.7 13.2 12.2 9.9 15.0
13 TUOLUMNE 54,961 11.0 20.0 * 13.1 * 6.6 23.5
14 SAN LUIS OBISPO 269,753 44.7 16.6 13.5 9.8 18.1
15 SHASTA 177,480 31.3 17.7 13.5 9.2 19.2
16 EL DORADO 181,183 28.3 15.6 13.8 9.2 19.9
17 ORANGE 3,017,089 417.7 13.8 14.0 12.7 15.4
18 SANTA CRUZ 263,174 37.7 14.3 14.7 10.4 20.2
19 MENDOCINO 87,939 15.7 17.8 * 15.1 * 8.6 24.6
20 SIERRA 3,231 0.7 20.6 * 15.2 * 0.1 113.3
21 CALAVERAS 45,258 10.7 23.6 * 15.2 * 7.5 27.5
22 SAN BENITO 55,350 7.0 12.6 * 15.2 * 6.1 31.4
23 MADERA 151,160 20.7 13.7 15.3 9.5 23.5
24 NAPA 136,681 26.3 19.3 15.4 10.1 22.5
25 BUTTE 220,024 42.7 19.4 15.5 11.2 20.9
26 PLUMAS 19,993 4.3 21.7 * 15.5 * 4.5 38.5
27 SONOMA 484,258 90.0 18.6 15.8 12.7 19.4
28 VENTURA 825,378 131.7 16.0 16.1 13.3 18.8
29 MONTEREY 415,825 62.0 14.9 16.2 12.5 20.8
30 SANTA BARBARA 424,291 76.3 18.0 16.5 13.0 20.7
31 SUTTER 94,800 16.3 17.2 * 16.5 * 9.5 26.7
32 CONTRA COSTA 1,052,192 186.3 17.7 16.9 14.5 19.4
33 TEHAMA 63,635 13.7 21.5 * 18.1 * 9.8 30.6
34 LAKE 64,466 15.3 23.8 * 18.4 * 10.4 30.2
35 DEL NORTE 28,577 5.7 19.8 * 19.0 * 6.7 42.3
36 SAN DIEGO 3,104,581 571.7 18.4 19.1 17.5 20.7
37 ALAMEDA 1,513,493 286.7 18.9 20.0 17.7 22.4
38 SACRAMENTO 1,420,447 275.7 19.4 20.2 17.8 22.6
CALIFORNIA 37,318,481 7,213.7 19.3 20.2 19.7 20.7
39 YOLO 200,995 34.3 17.1 20.3 14.1 28.3
40 RIVERSIDE 2,191,800 410.0 18.7 20.5 18.5 22.5
41 ALPINE 1,147 0.3 29.1 * 21.2 * 0.0 276.5
42 LOS ANGELES 9,827,070 2,016.3 20.5 22.3 21.3 23.3
43 STANISLAUS 515,311 103.3 20.1 22.4 18.0 26.7
44 SISKIYOU 44,951 14.7 32.6 * 22.8 * 12.7 37.9
45 SANTA CLARA 1,787,553 378.3 21.2 22.9 20.5 25.2
46 SOLANO 413,220 94.3 22.8 23.4 18.9 28.6
47 LASSEN 34,730 6.7 19.2 * 24.4 * 9.6 51.2
48 TULARE 443,638 87.7 19.8 24.8 19.8 30.5
49 HUMBOLDT 134,575 39.0 29.0 25.9 18.4 35.350 MERCED 256,386 51.3 20.0 26.1 19.4 34.3
51 YUBA 72,336 16.3 22.6 * 27.7 * 15.9 44.8
52 FRESNO 933,075 228.3 24.5 28.5 24.8 32.3
53 SAN JOAQUIN 686,761 177.0 25.8 28.9 24.6 33.2
54 GLENN 28,188 8.7 30.7 * 29.1 * 13.1 55.8
55 KINGS 153,020 32.0 20.9 30.3 20.8 42.8
56 IMPERIAL 175,594 47.0 26.8 32.0 23.5 42.5
57 KERN 841,744 204.0 24.2 32.4 27.8 36.9
58 SAN BERNARDINO 2,038,771 526.7 25.8 33.9 30.9 36.8

7/28/2019 2013 County Health Status Profiles
http://slidepdf.com/reader/full/2013-county-health-status-profiles 24/102
County Health Status Profles 2013California Department of Public Health 17
DEATHS DUE TO ALZHEIMER’S DISEASE, 2009-2011
he crude death rate from Alzheimer’s disease for California was 28.8 deaths per 100,000 population, a risk of dying equivalent to approximately one death for every 3,471.9 persons. This rate was based on a 2009 through 2011 three-year
average number of deaths equaling 10,748.7 and population count of 37,318,481 as of July 1, 2010. Among counties with reliable rates, the crude rate ranged from 58.3 inButte County to 11.8 in Imperial County, a factor of 5.0 to 1.
The age-adjusted death rate from Alzheimer’s disease for California during the 2009 through 2011 three-year period was 30.5 deaths per 100,000 population.Reliable age-adjusted death rates ranged from 49.9 in Solano County to 16.2 in
Imperial County.
A Healthy People National Objective for deaths due to Alzheimer’s disease has notbeen established.
The California average age-adjusted death rate for the 2006-2008 period was 27.0.
T

7/28/2019 2013 County Health Status Profiles
http://slidepdf.com/reader/full/2013-county-health-status-profiles 25/102
County Health Status Profles 2013California Department of Public Health 18
State of California, Department of Finance, Race/Hispanics Population with Age and Gender Detail, 2000–2010. Sacramento, California, September 2012.Sources: California Department of Public Health, 2009-2011 Death Statistical Master Files.
Note: Counties were rank ordered first by increasing age-adjusted death rate (calculated to 15 decimal places), second by decreasing size of the population.- Rates, percentages, and confidence limits are not calculated for zero events.* Rates are deemed unreliable based on fewer than 20 data elements.
TABLE 8
DEATHS DUE TO ALZHEIMER'S DISEASE
RANKED BY THREE-YEAR AVERAGE AGE-ADJUSTED DEATH RATE
CALIFORNIA COUNTIES, 2009-2011
x x x 95% CONFIDENCE LIMITS
RANKORDER
COUNTYOF RESIDENCE
2010POPULATION
2009-2011 DEATHS(AVERAGE)
CRUDEDEATHRATE
AGE-ADJUSTEDDEATH RATE LOWER UPPER
HEALTHY PEOPLE 2020 NATIONAL OBJECTIVE: NONE
1 ALPINE 1,147 0.0 - - - -
2 INYO 18,627 1.0 5.4 * 3.6 * 0.1 20.2
3 LASSEN 34,730 2.3 6.7 * 10.6 * 1.6 35.0
4 SAN BENITO 55,350 5.3 9.6 * 12.4 * 4.2 28.3
5 SIERRA 3,231 0.7 20.6 * 14.7 * 0.1 110.1
6 TUOLUMNE 54,961 12.7 23.0 * 15.2 * 8.0 26.1
7 MENDOCINO 87,939 17.0 19.3 * 15.4 * 9.0 24.7
8 IMPERIAL 175,594 20.7 11.8 16.2 10.0 24.9
9 CALAVERAS 45,258 9.3 20.6 * 16.9 * 7.9 31.7
10 MODOC 9,676 2.3 24.1 * 17.2 * 2.6 57.0
11 MONTEREY 415,825 70.3 16.9 17.9 13.9 22.5
12 GLENN 28,188 5.3 18.9 * 19.2 * 6.5 43.8
13 TULARE 443,638 64.7 14.6 20.3 15.7 25.9
14 PLUMAS 19,993 5.3 26.7 * 22.1 * 7.5 50.2
15 YUBA 72,336 11.0 15.2 * 22.2 * 11.1 39.7
16 SAN FRANCISCO 807,177 232.7 28.8 22.9 19.9 25.8
17 DEL NORTE 28,577 6.3 22.2 * 23.1 * 8.8 49.2
18 SAN LUIS OBISPO 269,753 86.3 32.0 23.7 19.0 29.3
19 MERCED 256,386 44.3 17.3 24.0 17.5 32.2
20 SUTTER 94,800 23.0 24.3 24.2 15.3 36.321 LOS ANGELES 9,827,070 2,238.3 22.8 24.9 23.9 26.0
22 SISKIYOU 44,951 17.0 37.8 * 26.1 * 15.2 41.8
23 ALAMEDA 1,513,493 372.0 24.6 26.3 23.6 29.0
24 MARIPOSA 18,119 6.3 35.0 * 27.4 * 10.4 58.4
25 HUMBOLDT 134,575 42.0 31.2 27.9 20.1 37.7
26 SACRAMENTO 1,420,447 375.3 26.4 27.9 25.1 30.7
27 VENTURA 825,378 231.7 28.1 28.0 24.4 31.6
28 SANTA BARBARA 424,291 147.3 34.7 28.3 23.7 33.0
29 NEVADA 98,484 42.3 43.0 28.7 20.7 38.8
30 TRINITY 13,883 4.3 31.2 * 28.8 * 8.4 71.2
31 LAKE 64,466 21.3 33.1 29.0 18.0 44.1
32 SAN BERNARDINO 2,038,771 394.0 19.3 30.1 27.1 33.1
33 AMADOR 37,907 18.3 48.4 * 30.4 * 18.1 47.9
CALIFORNIA 37,318,481 10,748.7 28.8 30.5 29.9 31.1
34 CONTRA COSTA 1,052,192 353.3 33.6 31.3 28.0 34.635 NAPA 136,681 61.3 44.9 31.6 24.2 40.6
36 TEHAMA 63,635 22.3 35.1 31.8 20.0 48.0
37 SANTA CRUZ 263,174 83.7 31.8 32.5 25.9 40.3
38 MONO 14,114 1.0 7.1 * 32.9 * 0.8 183.2
39 COLUSA 21,452 6.3 29.5 * 32.9 * 12.5 70.2
40 ORANGE 3,017,089 992.7 32.9 33.0 31.0 35.1
41 FRESNO 933,075 266.3 28.5 33.1 29.1 37.1
42 SAN MATEO 719,582 269.3 37.4 33.6 29.6 37.7
43 PLACER 350,609 153.0 43.6 33.9 28.5 39.3
44 EL DORADO 181,183 65.7 36.2 33.9 26.2 43.2
45 KINGS 153,020 30.0 19.6 34.4 23.2 49.1
46 MARIN 252,767 131.0 51.8 34.6 28.5 40.6
47 RIVERSIDE 2,191,800 612.3 27.9 34.7 32.0 37.5
48 KERN 841,744 190.0 22.6 36.0 30.9 41.1
49 SHASTA 177,480 89.7 50.5 36.7 29.5 45.150 SAN JOAQUIN 686,761 219.7 32.0 37.5 32.5 42.4
51 SAN DIEGO 3,104,581 1,177.0 37.9 38.1 35.9 40.3
52 YOLO 200,995 68.0 33.8 38.2 29.7 48.5
53 SONOMA 484,258 247.3 51.1 38.7 33.8 43.6
54 STANISLAUS 515,311 173.3 33.6 38.7 32.9 44.5
55 SANTA CLARA 1,787,553 642.7 36.0 38.8 35.8 41.8
56 BUTTE 220,024 128.3 58.3 40.4 33.3 47.5
57 MADERA 151,160 50.3 33.3 43.2 32.1 56.9
58 SOLANO 413,220 183.0 44.3 49.9 42.7 57.1

7/28/2019 2013 County Health Status Profiles
http://slidepdf.com/reader/full/2013-county-health-status-profiles 26/102
County Health Status Profles 2013California Department of Public Health 19
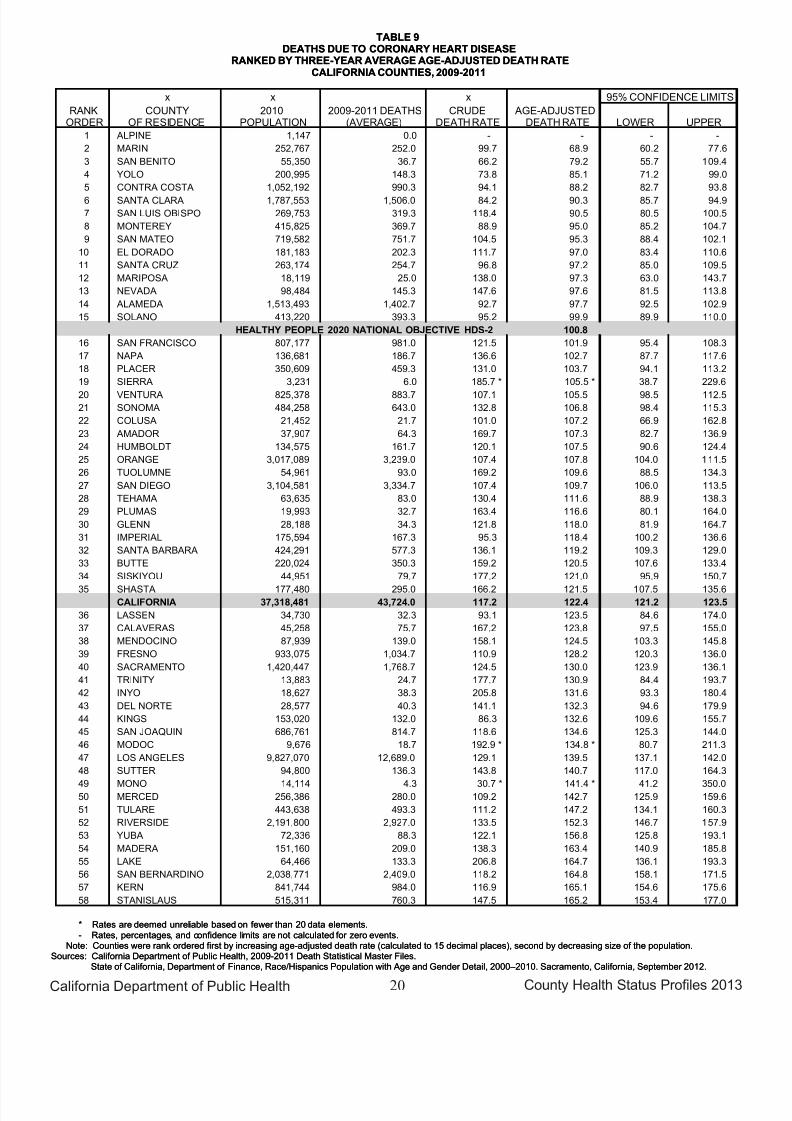
DEATHS DUE TO CORONARY HEART DISEASE, 2009-2011
he crude death rate from coronary heart disease for California was 117.2 deathsper 100,000 population, a risk of dying equivalent to approximately one death for every 853.5 persons. This rate was based on a 2009 through 2011 three-year
average number of deaths equaling 43,724.0 and population count of 37,318,481 as of July 1, 2010. Among counties with reliable rates, the crude rate ranged from 206.8 inLake County to 66.2 in San Benito County, a factor of 3.1 to 1.
The age-adjusted death rate from coronary heart disease for California during the2009 through 2011 three-year period was 122.4 deaths per 100,000 population.Reliable age-adjusted death rates ranged from 165.2 in Stanislaus County to 68.9 in
Marin County.
Fourteen counties with reliable age-adjusted death rates met the Healthy People 2020National Objective HDS-2 of no more than 100.8 age-adjusted deaths due to coronaryheart disease per 100,000 population. The statewide age-adjusted death rate for coronary heart disease did not meet the national objective.
The California average age-adjusted death rate for the 2006-2008 period was 143.7.
T
7/28/2019 2013 County Health Status Profiles
http://slidepdf.com/reader/full/2013-county-health-status-profiles 27/102
County Health Status Profles 2013California Department of Public Health 20
State of California, Department of Finance, Race/Hispanics Population with Age and Gender Detail, 2000–2010. Sacramento, California, September 2012.Sources: California Department of Public Health, 2009-2011 Death Statistical Master Files.
Note: Counties were rank ordered first by increasing age-adjusted death rate (calculated to 15 decimal places), second by decreasing size of the population.- Rates, percentages, and confidence limits are not calculated for zero events.* Rates are deemed unreliable based on fewer than 20 data elements.
TABLE 9
DEATHS DUE TO CORONARY HEART DISEASE
RANKED BY THREE-YEAR AVERAGE AGE-ADJUSTED DEATH RATE
CALIFORNIA COUNTIES, 2009-2011
x x x 95% CONFIDENCE LIMITS
RANKORDER
COUNTYOF RESIDENCE
2010POPULATION
2009-2011 DEATHS(AVERAGE)
CRUDEDEATHRATE
AGE-ADJUSTEDDEATH RATE LOWER UPPER
1 ALPINE 1,147 0.0 - - - -
2 MARIN 252,767 252.0 99.7 68.9 60.2 77.6
3 SAN BENITO 55,350 36.7 66.2 79.2 55.7 109.4
4 YOLO 200,995 148.3 73.8 85.1 71.2 99.0
5 CONTRA COSTA 1,052,192 990.3 94.1 88.2 82.7 93.8
6 SANTA CLARA 1,787,553 1,506.0 84.2 90.3 85.7 94.9
7 SAN LUIS OBISPO 269,753 319.3 118.4 90.5 80.5 100.5
8 MONTEREY 415,825 369.7 88.9 95.0 85.2 104.7
9 SAN MATEO 719,582 751.7 104.5 95.3 88.4 102.1
10 EL DORADO 181,183 202.3 111.7 97.0 83.4 110.6
11 SANTA CRUZ 263,174 254.7 96.8 97.2 85.0 109.5
12 MARIPOSA 18,119 25.0 138.0 97.3 63.0 143.7
13 NEVADA 98,484 145.3 147.6 97.6 81.5 113.8
14 ALAMEDA 1,513,493 1,402.7 92.7 97.7 92.5 102.9
15 SOLANO 413,220 393.3 95.2 99.9 89.9 110.0
HEALTHY PEOPLE 2020 NATIONAL OBJECTIVE HDS-2 100.8
16 SAN FRANCISCO 807,177 981.0 121.5 101.9 95.4 108.3
17 NAPA 136,681 186.7 136.6 102.7 87.7 117.6
18 PLACER 350,609 459.3 131.0 103.7 94.1 113.2
19 SIERRA 3,231 6.0 185.7 * 105.5 * 38.7 229.6
20 VENTURA 825,378 883.7 107.1 105.5 98.5 112.521 SONOMA 484,258 643.0 132.8 106.8 98.4 115.3
22 COLUSA 21,452 21.7 101.0 107.2 66.9 162.8
23 AMADOR 37,907 64.3 169.7 107.3 82.7 136.9
24 HUMBOLDT 134,575 161.7 120.1 107.5 90.6 124.4
25 ORANGE 3,017,089 3,239.0 107.4 107.8 104.0 111.5
26 TUOLUMNE 54,961 93.0 169.2 109.6 88.5 134.3
27 SAN DIEGO 3,104,581 3,334.7 107.4 109.7 106.0 113.5
28 TEHAMA 63,635 83.0 130.4 111.6 88.9 138.3
29 PLUMAS 19,993 32.7 163.4 116.6 80.1 164.0
30 GLENN 28,188 34.3 121.8 118.0 81.9 164.7
31 IMPERIAL 175,594 167.3 95.3 118.4 100.2 136.6
32 SANTA BARBARA 424,291 577.3 136.1 119.2 109.3 129.0
33 BUTTE 220,024 350.3 159.2 120.5 107.6 133.4
34 SISKIYOU 44,951 79.7 177.2 121.0 95.9 150.7
35 SHASTA 177,480 295.0 166.2 121.5 107.5 135.6CALIFORNIA 37,318,481 43,724.0 117.2 122.4 121.2 123.5
36 LASSEN 34,730 32.3 93.1 123.5 84.6 174.0
37 CALAVERAS 45,258 75.7 167.2 123.8 97.5 155.0
38 MENDOCINO 87,939 139.0 158.1 124.5 103.3 145.8
39 FRESNO 933,075 1,034.7 110.9 128.2 120.3 136.0
40 SACRAMENTO 1,420,447 1,768.7 124.5 130.0 123.9 136.1
41 TRINITY 13,883 24.7 177.7 130.9 84.4 193.7
42 INYO 18,627 38.3 205.8 131.6 93.3 180.4
43 DEL NORTE 28,577 40.3 141.1 132.3 94.6 179.9
44 KINGS 153,020 132.0 86.3 132.6 109.6 155.7
45 SAN JOAQUIN 686,761 814.7 118.6 134.6 125.3 144.0
46 MODOC 9,676 18.7 192.9 * 134.8 * 80.7 211.3
47 LOS ANGELES 9,827,070 12,689.0 129.1 139.5 137.1 142.0
48 SUTTER 94,800 136.3 143.8 140.7 117.0 164.3
49 MONO 14,114 4.3 30.7 * 141.4 * 41.2 350.050 MERCED 256,386 280.0 109.2 142.7 125.9 159.6
51 TULARE 443,638 493.3 111.2 147.2 134.1 160.3
52 RIVERSIDE 2,191,800 2,927.0 133.5 152.3 146.7 157.9
53 YUBA 72,336 88.3 122.1 156.8 125.8 193.1
54 MADERA 151,160 209.0 138.3 163.4 140.9 185.8
55 LAKE 64,466 133.3 206.8 164.7 136.1 193.3
56 SAN BERNARDINO 2,038,771 2,409.0 118.2 164.8 158.1 171.5
57 KERN 841,744 984.0 116.9 165.1 154.6 175.6
58 STANISLAUS 515,311 760.3 147.5 165.2 153.4 177.0

7/28/2019 2013 County Health Status Profiles
http://slidepdf.com/reader/full/2013-county-health-status-profiles 28/102
County Health Status Profles 2013California Department of Public Health 21
DEATHS DUE TO CEREBROVASCULAR DISEASE (STROKE), 2009-2011
he crude death rate from cerebrovascular disease (stroke) for California was 36.1
deaths per 100,000 population, a risk of dying equivalent to approximately onedeath for every 2,771.5 persons. This rate was based on a 2009 through 2011three-year average number of deaths equaling 13,465.3 and population count of 37,318,481 as of July 1, 2010. Among counties with reliable rates, the crude rateranged from 76.2 in San Luis Obispo County to 26.1 in Santa Clara County, a factor of 2.9 to 1.
The age-adjusted death rate from cerebrovascular disease for California during the2009 through 2011 three-year period was 38.1 deaths per 100,000 population.Reliable age-adjusted death rates ranged from 56.6 in San Luis Obispo Countyto 26.0 in El Dorado County.
Four counties with reliable age-adjusted death rates met the Healthy People 2020National Objective HDS-3 of no more than 33.8 age-adjusted deaths due tocerebrovascular disease per 100,000 population. An additional five counties withunreliable rates and one county with no cerebrovascular disease deaths met theobjective. The statewide age-adjusted death rate for cerebrovascular disease did notmeet the national objective.
The California average age-adjusted death rate for the 2006-2008 period was 42.8.
T

7/28/2019 2013 County Health Status Profiles
http://slidepdf.com/reader/full/2013-county-health-status-profiles 29/102
County Health Status Profles 2013California Department of Public Health 22
State of California, Department of Finance, Race/Hispanics Population with Age and Gender Detail, 2000–2010. Sacramento, California, September 2012.Sources: California Department of Public Health, 2009-2011 Death Statistical Master Files.
Note: Counties were rank ordered first by increasing age-adjusted death rate (calculated to 15 decimal places), second by decreasing size of the population.- Rates, percentages, and confidence limits are not calculated for zero events.* Rates are deemed unreliable based on fewer than 20 data elements.
TABLE 10DEATHS DUE TO CEREBROVASCULAR DISEASE (STROKE)
RANKED BY THREE-YEAR AVERAGE AGE-ADJUSTED DEATH RATECALIFORNIA COUNTIES, 2009-2011
x x x 95% CONFIDENCE LIMITS
RANKORDER
COUNTYOF RESIDENCE
2010POPULATION
2009-2011 DEATHS(AVERAGE)
CRUDEDEATHRATE
AGE-ADJUSTEDDEATH RATE LOWER UPPER
1 ALPINE 1,147 0.0 - - - -
2 TRINITY 13,883 3.3 24.0 * 17.9 * 4.1 49.7
3 EL DORADO 181,183 51.7 28.5 26.0 19.4 34.1
4 SANTA CLARA 1,787,553 467.3 26.1 28.3 25.7 30.9
5 MONO 14,114 1.0 7.1 * 28.6 * 0.7 159.5
6 MARIN 252,767 109.0 43.1 29.8 24.1 35.5
7 LASSEN 34,730 7.7 22.1 * 31.0 * 13.1 62.0
8 GLENN 28,188 9.3 33.1 * 31.7 * 14.8 59.6
9 MENDOCINO 87,939 35.7 40.6 32.2 22.5 44.7
10 PLUMAS 19,993 8.0 40.0 * 33.6 * 14.5 66.2
HEALTHY PEOPLE 2020 NATIONAL OBJECTIVE HDS-3 33.8
11 SAN MATEO 719,582 270.7 37.6 34.7 30.5 38.9
12 SANTA CRUZ 263,174 88.7 33.7 34.8 27.9 42.8
13 SAN DIEGO 3,104,581 1,049.3 33.8 34.8 32.7 36.9
14 SAN FRANCISCO 807,177 334.7 41.5 34.8 31.0 38.6
15 AMADOR 37,907 21.0 55.4 34.9 21.6 53.4
16 ORANGE 3,017,089 1,047.7 34.7 35.2 33.0 37.3
17 SANTA BARBARA 424,291 174.3 41.1 35.3 30.0 40.6
18 PLACER 350,609 157.3 44.9 35.3 29.8 40.9
19 VENTURA 825,378 302.0 36.6 36.4 32.3 40.6
20 LOS ANGELES 9,827,070 3,279.7 33.4 36.5 35.2 37.821 CALAVERAS 45,258 21.3 47.1 36.5 22.7 55.6
22 TUOLUMNE 54,961 31.0 56.4 37.0 25.1 52.4
23 MONTEREY 415,825 145.0 34.9 37.3 31.2 43.4
24 SOLANO 413,220 145.3 35.2 37.8 31.6 44.0
CALIFORNIA 37,318,481 13,465.3 36.1 38.1 37.5 38.7
25 SUTTER 94,800 38.3 40.4 39.2 27.8 53.7
26 SONOMA 484,258 239.3 49.4 39.2 34.1 44.3
27 ALAMEDA 1,513,493 555.0 36.7 39.2 35.9 42.5
28 NEVADA 98,484 56.7 57.5 39.4 29.8 51.0
29 YOLO 200,995 68.7 34.2 39.4 30.7 50.0
30 CONTRA COSTA 1,052,192 440.3 41.8 39.7 36.0 43.5
31 NAPA 136,681 75.0 54.9 39.8 31.3 49.8
32 KINGS 153,020 41.0 26.8 40.0 28.7 54.2
33 SACRAMENTO 1,420,447 547.7 38.6 40.6 37.2 44.1
34 INYO 18,627 11.7 62.6 * 40.7 * 20.8 71.635 SAN BENITO 55,350 19.0 34.3 * 40.9 * 24.6 63.8
36 MADERA 151,160 51.7 34.2 40.9 30.5 53.7
37 KERN 841,744 250.7 29.8 42.4 37.0 47.7
38 DEL NORTE 28,577 12.3 43.2 * 42.6 * 22.3 73.9
39 RIVERSIDE 2,191,800 805.0 36.7 42.8 39.8 45.8
40 SAN BERNARDINO 2,038,771 633.7 31.1 43.7 40.3 47.2
41 SHASTA 177,480 106.0 59.7 44.4 35.8 52.9
42 STANISLAUS 515,311 201.3 39.1 44.5 38.3 50.7
43 MARIPOSA 18,119 10.3 57.0 * 44.7 * 21.7 81.4
44 IMPERIAL 175,594 61.0 34.7 45.3 34.7 58.2
45 SAN JOAQUIN 686,761 272.7 39.7 45.7 40.2 51.2
46 BUTTE 220,024 137.0 62.3 46.0 38.1 53.8
47 MERCED 256,386 89.3 34.8 46.0 37.0 56.6
48 FRESNO 933,075 368.3 39.5 46.2 41.5 51.0
49 SISKIYOU 44,951 31.0 69.0 47.5 32.3 67.450 YUBA 72,336 26.0 35.9 48.1 31.4 70.4
51 MODOC 9,676 6.7 68.9 * 48.6 * 19.0 101.8
52 COLUSA 21,452 9.3 43.5 * 49.7 * 23.1 93.2
53 TULARE 443,638 170.3 38.4 50.6 42.9 58.2
54 HUMBOLDT 134,575 79.3 59.0 52.4 41.5 65.3
55 SIERRA 3,231 2.3 72.2 * 53.3 * 8.1 176.9
56 TEHAMA 63,635 38.3 60.2 53.7 38.1 73.7
57 LAKE 64,466 43.3 67.2 55.3 40.1 74.4
58 SAN LUIS OBISPO 269,753 205.7 76.2 56.6 48.8 64.4

7/28/2019 2013 County Health Status Profiles
http://slidepdf.com/reader/full/2013-county-health-status-profiles 30/102
County Health Status Profles 2013California Department of Public Health 23
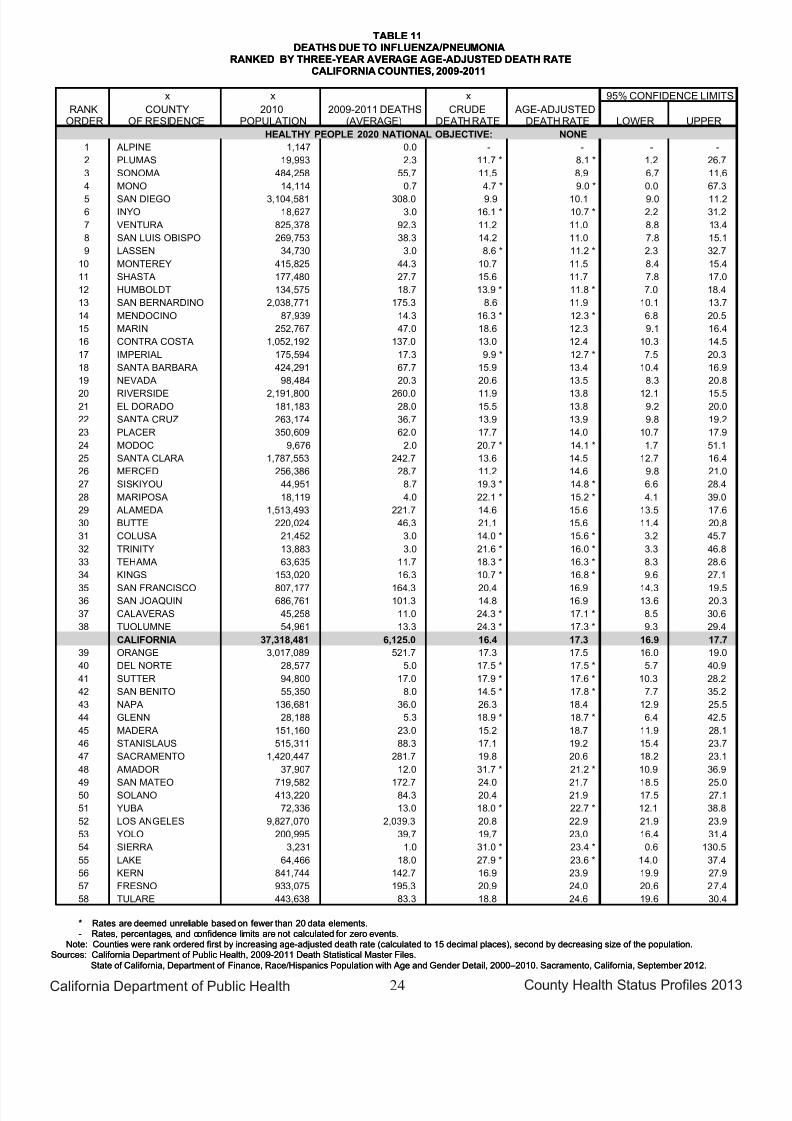
DEATHS DUE TO INFLUENZA/PNEUMONIA, 2009-2011
he crude death rate from influenza/pneumonia for California was 16.4 deaths per 100,000 population, a risk of dying equivalent to approximately one death for every 6,092.8 persons. This rate was based on a 2009 through 2011 three-year
average number of deaths equaling 6,125.0 and population count of 37,318,481 as of July 1, 2010. Among counties with reliable rates, the crude rate ranged from 26.3 inNapa County to 8.6 in San Bernardino County, a factor of 3.1 to 1.
The age-adjusted death rate from influenza/pneumonia for California during the 2009through 2011 three-year period was 17.3 deaths per 100,000 population. Reliableage-adjusted death rates ranged from 24.6 in Tulare County to 8.9 in Sonoma County.
A Healthy People 2020 National Objective for deaths due to influenza/pneumonia hasnot been established.
The California average age-adjusted death rate for the 2006-2008 period was 20.6.
T
7/28/2019 2013 County Health Status Profiles
http://slidepdf.com/reader/full/2013-county-health-status-profiles 31/102
County Health Status Profles 2013California Department of Public Health 24
State of California, Department of Finance, Race/Hispanics Population with Age and Gender Detail, 2000–2010. Sacramento, California, September 2012.Sources: California Department of Public Health, 2009-2011 Death Statistical Master Files.
Note: Counties were rank ordered first by increasing age-adjusted death rate (calculated to 15 decimal places), second by decreasing size of the population.- Rates, percentages, and confidence limits are not calculated for zero events.* Rates are deemed unreliable based on fewer than 20 data elements.
TABLE 11
DEATHS DUE TO INFLUENZA/PNEUMONIA
RANKED BY THREE-YEAR AVERAGE AGE-ADJUSTED DEATH RATE
CALIFORNIA COUNTIES, 2009-2011
x x x 95% CONFIDENCE LIMITS
RANKORDER
COUNTYOF RESIDENCE
2010POPULATION
2009-2011 DEATHS(AVERAGE)
CRUDEDEATHRATE
AGE-ADJUSTEDDEATH RATE LOWER UPPER
HEALTHY PEOPLE 2020 NATIONAL OBJECTIVE: NONE
1 ALPINE 1,147 0.0 - - - -
2 PLUMAS 19,993 2.3 11.7 * 8.1 * 1.2 26.7
3 SONOMA 484,258 55.7 11.5 8.9 6.7 11.6
4 MONO 14,114 0.7 4.7 * 9.0 * 0.0 67.3
5 SAN DIEGO 3,104,581 308.0 9.9 10.1 9.0 11.2
6 INYO 18,627 3.0 16.1 * 10.7 * 2.2 31.2
7 VENTURA 825,378 92.3 11.2 11.0 8.8 13.4
8 SAN LUIS OBISPO 269,753 38.3 14.2 11.0 7.8 15.1
9 LASSEN 34,730 3.0 8.6 * 11.2 * 2.3 32.7
10 MONTEREY 415,825 44.3 10.7 11.5 8.4 15.4
11 SHASTA 177,480 27.7 15.6 11.7 7.8 17.0
12 HUMBOLDT 134,575 18.7 13.9 * 11.8 * 7.0 18.4
13 SAN BERNARDINO 2,038,771 175.3 8.6 11.9 10.1 13.7
14 MENDOCINO 87,939 14.3 16.3 * 12.3 * 6.8 20.5
15 MARIN 252,767 47.0 18.6 12.3 9.1 16.4
16 CONTRA COSTA 1,052,192 137.0 13.0 12.4 10.3 14.5
17 IMPERIAL 175,594 17.3 9.9 * 12.7 * 7.5 20.3
18 SANTA BARBARA 424,291 67.7 15.9 13.4 10.4 16.9
19 NEVADA 98,484 20.3 20.6 13.5 8.3 20.8
20 RIVERSIDE 2,191,800 260.0 11.9 13.8 12.1 15.521 EL DORADO 181,183 28.0 15.5 13.8 9.2 20.0
22 SANTA CRUZ 263,174 36.7 13.9 13.9 9.8 19.2
23 PLACER 350,609 62.0 17.7 14.0 10.7 17.9
24 MODOC 9,676 2.0 20.7 * 14.1 * 1.7 51.1
25 SANTA CLARA 1,787,553 242.7 13.6 14.5 12.7 16.4
26 MERCED 256,386 28.7 11.2 14.6 9.8 21.0
27 SISKIYOU 44,951 8.7 19.3 * 14.8 * 6.6 28.4
28 MARIPOSA 18,119 4.0 22.1 * 15.2 * 4.1 39.0
29 ALAMEDA 1,513,493 221.7 14.6 15.6 13.5 17.6
30 BUTTE 220,024 46.3 21.1 15.6 11.4 20.8
31 COLUSA 21,452 3.0 14.0 * 15.6 * 3.2 45.7
32 TRINITY 13,883 3.0 21.6 * 16.0 * 3.3 46.8
33 TEHAMA 63,635 11.7 18.3 * 16.3 * 8.3 28.6
34 KINGS 153,020 16.3 10.7 * 16.8 * 9.6 27.1
35 SAN FRANCISCO 807,177 164.3 20.4 16.9 14.3 19.536 SAN JOAQUIN 686,761 101.3 14.8 16.9 13.6 20.3
37 CALAVERAS 45,258 11.0 24.3 * 17.1 * 8.5 30.6
38 TUOLUMNE 54,961 13.3 24.3 * 17.3 * 9.3 29.4
CALIFORNIA 37,318,481 6,125.0 16.4 17.3 16.9 17.7
39 ORANGE 3,017,089 521.7 17.3 17.5 16.0 19.0
40 DEL NORTE 28,577 5.0 17.5 * 17.5 * 5.7 40.9
41 SUTTER 94,800 17.0 17.9 * 17.6 * 10.3 28.2
42 SAN BENITO 55,350 8.0 14.5 * 17.8 * 7.7 35.2
43 NAPA 136,681 36.0 26.3 18.4 12.9 25.5
44 GLENN 28,188 5.3 18.9 * 18.7 * 6.4 42.5
45 MADERA 151,160 23.0 15.2 18.7 11.9 28.1
46 STANISLAUS 515,311 88.3 17.1 19.2 15.4 23.7
47 SACRAMENTO 1,420,447 281.7 19.8 20.6 18.2 23.1
48 AMADOR 37,907 12.0 31.7 * 21.2 * 10.9 36.9
49 SAN MATEO 719,582 172.7 24.0 21.7 18.5 25.050 SOLANO 413,220 84.3 20.4 21.9 17.5 27.1
51 YUBA 72,336 13.0 18.0 * 22.7 * 12.1 38.8
52 LOS ANGELES 9,827,070 2,039.3 20.8 22.9 21.9 23.9
53 YOLO 200,995 39.7 19.7 23.0 16.4 31.4
54 SIERRA 3,231 1.0 31.0 * 23.4 * 0.6 130.5
55 LAKE 64,466 18.0 27.9 * 23.6 * 14.0 37.4
56 KERN 841,744 142.7 16.9 23.9 19.9 27.9
57 FRESNO 933,075 195.3 20.9 24.0 20.6 27.4
58 TULARE 443,638 83.3 18.8 24.6 19.6 30.4

7/28/2019 2013 County Health Status Profiles
http://slidepdf.com/reader/full/2013-county-health-status-profiles 32/102
County Health Status Profles 2013California Department of Public Health 25
DEATHS DUE TO CHRONIC LOWER RESPIRATORY DISEASE, 2009-2011
he crude death rate from chronic lower respiratory disease deaths for Californiawas 35.0 deaths per 100,000 population, a risk of dying equivalent toapproximately one death for every 2,860.8 persons. This rate was based on a
2009 through 2011 three-year average number of deaths equaling 13,044.7 andpopulation count of 37,318,481 as of July 1, 2010. Among counties with reliable rates,the crude rate ranged from 97.7 in Shasta County to 17.8 in Imperial County, a factor of 5.5 to 1.
The age-adjusted death rate from chronic lower respiratory disease deaths for Californiaduring the 2009 through 2011 three-year period was 37.5 deaths per 100,000
population. Reliable age-adjusted death rates ranged from 71.5 in Shasta County to21.2 in Marin County.
A Healthy People 2020 National Objective for deaths due to chronic lower respiratorydisease has not been established.
The California average age-adjusted death rate for the 2006-2008 period was 39.4.
T

7/28/2019 2013 County Health Status Profiles
http://slidepdf.com/reader/full/2013-county-health-status-profiles 33/102
County Health Status Profles 2013California Department of Public Health 26
State of California, Department of Finance, Race/Hispanics Population with Age and Gender Detail, 2000–2010. Sacramento, California, September 2012.Sources: California Department of Public Health, 2009-2011 Death Statistical Master Files.
Note: Counties were rank ordered first by increasing age-adjusted death rate (calculated to 15 decimal places), second by decreasing size of the population.- Rates, percentages, and confidence limits are not calculated for zero events.* Rates are deemed unreliable based on fewer than 20 data elements.
TABLE 12
DEATHS DUE TO CHRONIC LOWER RESPIRATORY DISEASE
RANKED BY THREE-YEAR AVERAGE AGE-ADJUSTED DEATH RATE
CALIFORNIA COUNTIES, 2009-2011
x x x 95% CONFIDENCE LIMITS
RANKORDER
COUNTYOF RESIDENCE
2010POPULATION
2009-2011 DEATHS(AVERAGE)
CRUDEDEATHRATE
AGE-ADJUSTEDDEATH RATE LOWER UPPER
HEALTHY PEOPLE 2020 NATIONAL OBJECTIVE: NONE
1 ALPINE 1,147 0.0 - - - -
2 MONO 14,114 0.3 2.4 * 18.4 * 0.0 241.0
3 MARIN 252,767 74.3 29.4 21.2 16.6 26.6
4 SAN FRANCISCO 807,177 206.7 25.6 22.0 18.9 25.0
5 IMPERIAL 175,594 31.3 17.8 22.6 15.4 32.0
6 SANTA CLARA 1,787,553 407.0 22.8 25.1 22.7 27.6
7 SANTA BARBARA 424,291 135.0 31.8 28.2 23.4 33.0
8 SAN MATEO 719,582 224.0 31.1 29.3 25.5 33.2
9 ALAMEDA 1,513,493 418.3 27.6 30.2 27.3 33.2
10 MONTEREY 415,825 114.7 27.6 30.4 24.8 36.0
11 MARIPOSA 18,119 9.3 51.5 * 30.7 * 14.3 57.6
12 ORANGE 3,017,089 918.0 30.4 31.6 29.6 33.7
13 SANTA CRUZ 263,174 84.0 31.9 33.0 26.3 40.9
14 LOS ANGELES 9,827,070 2,948.7 30.0 33.4 32.2 34.6
15 SAN BENITO 55,350 15.0 27.1 * 34.0 * 19.0 56.0
16 VENTURA 825,378 277.7 33.6 34.4 30.3 38.5
17 SAN DIEGO 3,104,581 1,020.0 32.9 34.6 32.4 36.7
18 CONTRA COSTA 1,052,192 382.0 36.3 35.4 31.8 39.0
19 NAPA 136,681 62.3 45.6 35.9 27.6 46.0
20 FRESNO 933,075 284.0 30.4 36.3 32.0 40.621 PLACER 350,609 160.3 45.7 36.7 31.0 42.4
22 TRINITY 13,883 7.7 55.2 * 37.1 * 15.7 74.2
CALIFORNIA 37,318,481 13,044.7 35.0 37.5 36.9 38.2
23 SAN LUIS OBISPO 269,753 128.3 47.6 37.8 31.2 44.4
24 SONOMA 484,258 232.0 47.9 40.4 35.1 45.7
25 EL DORADO 181,183 83.3 46.0 40.5 32.2 50.1
26 LASSEN 34,730 10.0 28.8 * 41.2 * 19.8 75.8
27 TUOLUMNE 54,961 35.7 64.9 42.0 29.4 58.3
28 SACRAMENTO 1,420,447 566.7 39.9 42.8 39.3 46.4
29 SOLANO 413,220 168.0 40.7 43.8 37.1 50.5
30 MADERA 151,160 57.3 37.9 44.0 33.4 57.0
31 SAN JOAQUIN 686,761 263.7 38.4 44.4 39.0 49.9
32 CALAVERAS 45,258 28.7 63.3 45.7 30.5 65.7
33 NEVADA 98,484 66.3 67.4 45.8 35.4 58.2
34 INYO 18,627 13.3 71.6 * 46.8 * 25.2 79.635 MENDOCINO 87,939 51.7 58.8 47.2 35.2 62.0
36 MERCED 256,386 91.7 35.8 47.3 38.1 58.0
37 COLUSA 21,452 9.3 43.5 * 48.1 * 22.4 90.4
38 STANISLAUS 515,311 217.0 42.1 48.4 41.9 54.9
39 AMADOR 37,907 29.7 78.3 48.4 32.6 69.2
40 KINGS 153,020 48.0 31.4 48.4 35.7 64.2
41 RIVERSIDE 2,191,800 941.0 42.9 49.0 45.8 52.1
42 TULARE 443,638 171.7 38.7 51.1 43.4 58.8
43 YOLO 200,995 91.0 45.3 53.5 43.0 65.6
44 SUTTER 94,800 52.7 55.6 55.0 41.1 72.0
45 GLENN 28,188 16.3 57.9 * 55.2 * 31.8 89.2
46 HUMBOLDT 134,575 82.7 61.4 56.2 44.8 69.7
47 DEL NORTE 28,577 17.0 59.5 * 56.7 * 33.1 90.8
48 SAN BERNARDINO 2,038,771 820.3 40.2 57.0 53.0 61.0
49 SISKIYOU 44,951 39.3 87.5 59.2 42.1 80.850 BUTTE 220,024 167.0 75.9 59.4 50.2 68.5
51 YUBA 72,336 36.3 50.2 61.8 43.3 85.4
52 SIERRA 3,231 3.0 92.9 * 64.2 * 13.2 187.8
53 PLUMAS 19,993 18.0 90.0 * 66.1 * 39.2 104.4
54 KERN 841,744 411.3 48.9 68.4 61.7 75.2
55 TEHAMA 63,635 53.7 84.3 70.4 52.9 92.0
56 LAKE 64,466 59.0 91.5 71.1 54.1 91.7
57 SHASTA 177,480 173.3 97.7 71.5 60.7 82.2
58 MODOC 9,676 9.7 99.9 * 71.6 * 33.8 133.1

7/28/2019 2013 County Health Status Profiles
http://slidepdf.com/reader/full/2013-county-health-status-profiles 34/102
County Health Status Profles 2013California Department of Public Health 27
DEATHS DUE TO CHRONIC LIVER DISEASE AND CIRRHOSIS, 2009-2011
he crude death rate from chronic liver disease and cirrhosis for California was11.7 deaths per 100,000 population, a risk of dying equivalent to approximatelyone death for every 8,582.9 persons. This rate was based on a 2009 through
2011 three-year average number of deaths equaling 4,348.0 and population count of 37,318,481 as of July 1, 2010. Among counties with reliable rates, the crude rateranged from 19.5 in Shasta County to 9.1 in Marin County, a factor of 2.1 to 1.
The age-adjusted death rate from chronic liver disease and cirrhosis for Californiaduring the 2009 through 2011 three-year period was 11.4 deaths per 100,000population. Reliable age-adjusted death rates ranged from 16.0 in San Joaquin Countyto 6.5 in Marin County.
One county with a reliable age-adjusted death rate met the Healthy People 2020National Objective SA-11 of no more than 8.2 age-adjusted deaths due to chronic liver disease and cirrhosis per 100,000 population. An additional four counties withunreliable rates and one county with no deaths due to chronic liver disease andcirrhosis met the objective. The statewide age-adjusted death rate for chronic liver disease and cirrhosis did not meet the national objective.
The California average age-adjusted death rate for the 2006-2008 period was 11.2.
T

7/28/2019 2013 County Health Status Profiles
http://slidepdf.com/reader/full/2013-county-health-status-profiles 35/102
County Health Status Profles 2013California Department of Public Health 28
State of California, Department of Finance, Race/Hispanics Population with Age and Gender Detail, 2000–2010. Sacramento, California, September 2012.Sources: California Department of Public Health, 2009-2011 Death Statistical Master Files.
Note: Counties were rank ordered first by increasing age-adjusted death rate (calculated to 15 decimal places), second by decreasing size of the population.- Rates, percentages, and confidence limits are not calculated for zero events.* Rates are deemed unreliable based on fewer than 20 data elements.
TABLE 13
DEATHS DUE TO CHRONIC LIVER DISEASE AND CIRRHOSIS
RANKED BY THREE-YEAR AVERAGE AGE-ADJUSTED DEATH RATE
CALIFORNIA COUNTIES, 2009-2011
x x x 95% CONFIDENCE LIMITS
RANKORDER
COUNTYOF RESIDENCE
2010POPULATION
2009-2011 DEATHS(AVERAGE)
CRUDEDEATHRATE
AGE-ADJUSTEDDEATH RATE LOWER UPPER
1 ALPINE 1,147 0.0 - - - -
2 MONO 14,114 0.7 4.7 * 3.2 * 0.0 24.2
3 PLUMAS 19,993 1.7 8.3 * 5.0 * 0.4 20.2
4 GLENN 28,188 2.0 7.1 * 5.9 * 0.7 21.3
5 LASSEN 34,730 2.0 5.8 * 5.9 * 0.7 21.4
6 MARIN 252,767 23.0 9.1 6.5 4.1 9.8
HEALTHY PEOPLE 2020 NATIONAL OBJECTIVE SA-11 8.2
7 EL DORADO 181,183 20.3 11.2 8.4 5.2 12.9
8 NEVADA 98,484 12.0 12.2 * 8.4 * 4.4 14.7
9 COLUSA 21,452 2.0 9.3 * 8.5 * 1.0 30.5
10 PLACER 350,609 36.7 10.5 8.8 6.2 12.1
11 SAN FRANCISCO 807,177 80.7 10.0 8.8 7.0 10.9
12 ALAMEDA 1,513,493 142.0 9.4 8.9 7.4 10.4
13 SANTA CLARA 1,787,553 168.3 9.4 9.3 7.9 10.7
14 CONTRA COSTA 1,052,192 109.0 10.4 9.4 7.6 11.1
15 ORANGE 3,017,089 300.0 9.9 9.6 8.5 10.7
16 SAN MATEO 719,582 80.0 11.1 10.0 7.9 12.4
17 SAN DIEGO 3,104,581 316.7 10.2 10.1 8.9 11.2
18 VENTURA 825,378 88.7 10.7 10.1 8.1 12.4
19 CALAVERAS 45,258 7.7 16.9 * 10.6 * 4.5 21.2
20 SACRAMENTO 1,420,447 156.7 11.0 10.8 9.1 12.521 MARIPOSA 18,119 3.0 16.6 * 10.8 * 2.2 31.6
22 SAN LUIS OBISPO 269,753 37.0 13.7 11.0 7.8 15.2
23 MONTEREY 415,825 45.0 10.8 11.1 8.1 14.9
24 SANTA BARBARA 424,291 47.7 11.2 11.2 8.3 14.9
25 SONOMA 484,258 66.0 13.6 11.3 8.8 14.4
26 NAPA 136,681 16.7 12.2 * 11.4 * 6.6 18.3
CALIFORNIA 37,318,481 4,348.0 11.7 11.4 11.0 11.7
27 RIVERSIDE 2,191,800 252.7 11.5 11.5 10.1 13.0
28 SOLANO 413,220 51.7 12.5 11.6 8.6 15.2
29 MENDOCINO 87,939 13.0 14.8 * 11.9 * 6.3 20.3
30 YOLO 200,995 23.0 11.4 12.2 7.7 18.3
31 DEL NORTE 28,577 4.3 15.2 * 12.2 * 3.5 30.1
32 SUTTER 94,800 11.7 12.3 * 12.2 * 6.2 21.5
33 LOS ANGELES 9,827,070 1,221.7 12.4 12.6 11.9 13.3
34 SAN BERNARDINO 2,038,771 229.7 11.3 12.6 10.9 14.335 KERN 841,744 98.0 11.6 13.1 10.6 15.9
36 SANTA CRUZ 263,174 39.0 14.8 13.1 9.3 17.9
37 STANISLAUS 515,311 65.3 12.7 13.2 10.2 16.8
38 SAN BENITO 55,350 7.7 13.9 * 13.6 * 5.7 27.1
39 MERCED 256,386 31.3 12.2 14.3 9.7 20.2
40 KINGS 153,020 18.3 12.0 * 14.3 * 8.5 22.5
41 MADERA 151,160 20.7 13.7 14.3 8.8 22.0
42 BUTTE 220,024 34.3 15.6 14.4 10.0 20.1
43 TULARE 443,638 56.0 12.6 14.6 11.0 18.9
44 AMADOR 37,907 8.7 22.9 * 14.8 * 6.7 28.4
45 FRESNO 933,075 126.7 13.6 14.9 12.3 17.5
46 SHASTA 177,480 34.7 19.5 14.9 10.4 20.8
47 TUOLUMNE 54,961 12.0 21.8 * 15.0 * 7.7 26.2
48 HUMBOLDT 134,575 22.3 16.6 15.1 9.5 22.9
49 IMPERIAL 175,594 25.3 14.4 15.9 10.3 23.550 SAN JOAQUIN 686,761 106.3 15.5 16.0 12.9 19.1
51 TEHAMA 63,635 13.0 20.4 * 16.8 * 8.9 28.7
52 SISKIYOU 44,951 12.0 26.7 * 17.1 * 8.8 29.8
53 MODOC 9,676 2.3 24.1 * 17.4 * 2.6 57.7
54 INYO 18,627 4.7 25.1 * 17.5 * 5.4 41.9
55 YUBA 72,336 12.7 17.5 * 18.1 * 9.5 31.1
56 TRINITY 13,883 3.7 26.4 * 19.7 * 5.0 52.3
57 LAKE 64,466 19.0 29.5 * 21.7 * 13.0 33.8
58 SIERRA 3,231 1.0 31.0 * 27.7 * 0.7 154.5

7/28/2019 2013 County Health Status Profiles
http://slidepdf.com/reader/full/2013-county-health-status-profiles 36/102
County Health Status Profles 2013California Department of Public Health 29
DEATHS DUE TO ACCIDENTS (UNINTENTIONAL INJURIES), 2009-2011
he crude death rate from accidents (unintentional injuries) for California was27.7 deaths per 100,000 population, a risk of dying equivalent to approximatelyone death for every 3,605.7 persons. This rate was based on a 2009 through
2011 three-year average number of deaths equaling 10,350.0 and population count of 37,318,481 as of July 1, 2010. Among counties with reliable rates, the crude rateranged from 97.2 in Lake County to 19.9 in Los Angeles County, a factor of 4.9 to 1.
The age-adjusted death rate from accidents for California during the 2009 through 2011three-year period was 27.6 deaths per 100,000 population. Reliable age-adjusted deathrates ranged from 85.7 in Lake County to 20.0 in Los Angeles County.
Twenty-four counties with reliable age-adjusted death rates and California as awhole met the Healthy People 2020 National Objective IVP-11 of no more than 36.0
age-adjusted deaths due to accidents per 100,000 population. An additional threecounties with unreliable rates met the objective.
The California average age-adjusted death rate for the 2006-2008 period was 30.8.
T

7/28/2019 2013 County Health Status Profiles
http://slidepdf.com/reader/full/2013-county-health-status-profiles 37/102

7/28/2019 2013 County Health Status Profiles
http://slidepdf.com/reader/full/2013-county-health-status-profiles 38/102
County Health Status Profles 2013California Department of Public Health 31
DEATHS DUE TO MOTOR VEHICLE TRAFFIC CRASHES, 2009-2011
he crude death rate from motor vehicle traffic crashes for California was7.6 deaths per 100,000 population, a risk of dying equivalent to approximatelyone death for every 13,200.7 persons. This rate was based on a 2009 through
2011 three-year average number of deaths equaling 2,827.0 and population count of 37,318,481 as of July 1, 2010. Among counties with reliable rates, the crude rateranged from 18.5 in Madera County to 3.1 in San Francisco County, a factor of 5.9 to 1.
The age-adjusted death rate from motor vehicle traffic crashes for California duringthe 2009 through 2011 three-year period was 7.5 deaths per 100,000 population.Reliable age-adjusted death rates ranged from 18.9 in Madera County to 2.9 in
San Francisco County.
Twenty counties with reliable age-adjusted death rates and California as a whole metthe Healthy People 2020 National Objective IVP-13.1 of no more than12.4 age-adjusted deaths due to motor vehicle traffic crashes per 100,000 population.
An additional thirteen counties with unreliable rates and one county with no deaths dueto motor vehicle traffic crashes met the objective.
The California average age-adjusted death rate for the 2006-2008 period was 10.6.
T

7/28/2019 2013 County Health Status Profiles
http://slidepdf.com/reader/full/2013-county-health-status-profiles 39/102
County Health Status Profles 2013California Department of Public Health 32
State of California, Department of Finance, Race/Hispanics Population with Age and Gender Detail, 2000–2010. Sacramento, California, September 2012.Sources: California Department of Public Health, 2009-2011 Death Statistical Master Files.
Note: Counties were rank ordered first by increasing age-adjusted death rate (calculated to 15 decimal places), second by decreasing size of the population.- Rates, percentages, and confidence limits are not calculated for zero events.* Rates are deemed unreliable based on fewer than 20 data elements.
TABLE 15
DEATHS DUE TO MOTOR VEHICLE TRAFFIC CRASHES
RANKED BY THREE-YEAR AVERAGE AGE-ADJUSTED DEATH RATE
CALIFORNIA COUNTIES, 2009-2011
x x x 95% CONFIDENCE LIMITS
RANKORDER
COUNTYOF RESIDENCE
2010POPULATION
2009-2011 DEATHS(AVERAGE)
CRUDEDEATH RATE
AGE-ADJUSTEDDEATHRATE LOWER UPPER
1 SIERRA 3,231 0.0 - - - -
2 SAN FRANCISCO 807,177 25.3 3.1 2.9 1.9 4.3
3 MARIN 252,767 7.3 2.9 * 3.1 * 1.3 6.4
4 INYO 18,627 1.0 5.4 * 3.6 * 0.1 20.3
5 ALAMEDA 1,513,493 66.7 4.4 4.3 3.4 5.5
6 SAN MATEO 719,582 32.3 4.5 4.4 3.0 6.2
7 ORANGE 3,017,089 145.0 4.8 4.7 3.9 5.4
8 SANTA CLARA 1,787,553 90.7 5.1 5.2 4.1 6.3
9 SANTA CRUZ 263,174 13.7 5.2 * 5.2 * 2.8 8.7
10 CONTRA COSTA 1,052,192 64.3 6.1 6.1 4.7 7.8
11 LOS ANGELES 9,827,070 616.0 6.3 6.2 5.7 6.7
12 SONOMA 484,258 32.0 6.6 6.6 4.5 9.3
13 SAN DIEGO 3,104,581 211.0 6.8 6.6 5.7 7.5
14 SANTA BARBARA 424,291 32.0 7.5 7.1 4.9 10.1
15 PLACER 350,609 24.0 6.8 7.2 4.6 10.7
16 VENTURA 825,378 62.0 7.5 7.4 5.7 9.5
17 SOLANO 413,220 32.3 7.8 7.5 5.2 10.6
CALIFORNIA 37,318,481 2,827.0 7.6 7.5 7.2 7.7
18 YOLO 200,995 15.3 7.6 * 7.6 * 4.3 12.5
19 SAN LUIS OBISPO 269,753 23.0 8.5 7.8 4.9 11.7
20 NAPA 136,681 11.3 8.3 * 8.0 * 4.1 14.321 MONTEREY 415,825 33.7 8.1 8.3 5.7 11.6
22 SACRAMENTO 1,420,447 120.7 8.5 8.5 7.0 10.0
23 EL DORADO 181,183 15.0 8.3 * 8.9 * 5.0 14.7
24 MONO 14,114 0.7 4.7 * 9.2 * 0.0 68.6
25 IMPERIAL 175,594 15.7 8.9 * 9.2 * 5.2 15.1
26 RIVERSIDE 2,191,800 204.7 9.3 9.4 8.1 10.7
27 LASSEN 34,730 3.3 9.6 * 9.7 * 2.2 26.8
28 SAN BERNARDINO 2,038,771 197.7 9.7 9.9 8.5 11.4
29 PLUMAS 19,993 2.7 13.3 * 10.8 * 1.9 33.5
30 SAN BENITO 55,350 6.0 10.8 * 11.3 * 4.1 24.6
31 SAN JOAQUIN 686,761 77.0 11.2 11.4 9.0 14.3
32 STANISLAUS 515,311 58.7 11.4 11.5 8.7 14.8
33 NEVADA 98,484 12.7 12.9 * 12.2 * 6.4 20.9
34 YUBA 72,336 9.0 12.4 * 12.3 * 5.6 23.3
HEALTHY PEOPLE 2020 NATIONAL OBJECTIVE IVP-13.1 12.435 BUTTE 220,024 30.7 13.9 13.2 9.0 18.8
36 FRESNO 933,075 120.0 12.9 13.2 10.8 15.6
37 MERCED 256,386 33.0 12.9 13.3 9.2 18.7
38 KERN 841,744 109.7 13.0 13.4 10.8 15.9
39 SUTTER 94,800 13.0 13.7 * 13.4 * 7.2 23.0
40 SHASTA 177,480 25.7 14.5 13.8 9.0 20.3
41 TULARE 443,638 60.7 13.7 14.0 10.7 18.0
42 KINGS 153,020 21.7 14.2 14.6 9.1 22.2
43 HUMBOLDT 134,575 21.7 16.1 15.7 9.8 23.8
44 MENDOCINO 87,939 13.7 15.5 * 16.0 * 8.7 27.0
45 MODOC 9,676 2.3 24.1 * 17.2 * 2.6 57.1
46 AMADOR 37,907 6.7 17.6 * 17.4 * 6.8 36.5
47 SISKIYOU 44,951 8.7 19.3 * 17.5 * 7.9 33.6
48 COLUSA 21,452 3.7 17.1 * 17.9 * 4.5 47.6
49 MARIPOSA 18,119 3.7 20.2 * 18.0 * 4.5 47.950 TUOLUMNE 54,961 11.0 20.0 * 18.0 * 9.0 32.2
51 GLENN 28,188 5.0 17.7 * 18.8 * 6.1 43.9
52 MADERA 151,160 28.0 18.5 18.9 12.6 27.3
53 TRINITY 13,883 2.3 16.8 * 19.7 * 3.0 65.3
54 TEHAMA 63,635 12.3 19.4 * 20.0 * 10.4 34.7
55 DEL NORTE 28,577 6.3 22.2 * 20.1 * 7.6 43.0
56 LAKE 64,466 14.3 22.2 * 21.9 * 12.1 36.5
57 CALAVERAS 45,258 10.0 22.1 * 24.5 * 11.7 45.0
58 ALPINE 1,147 0.3 29.1 * 40.9 * 0.0 535.1

7/28/2019 2013 County Health Status Profiles
http://slidepdf.com/reader/full/2013-county-health-status-profiles 40/102
County Health Status Profles 2013California Department of Public Health 33
DEATHS DUE TO SUICIDE, 2009-2011
he crude death rate from suicide for California was 10.3 deaths per 100,000population, a risk of dying equivalent to approximately one death for every9,684.8 persons. This rate was based on a 2009 through 2011 three-year
average number of deaths equaling 3,853.3 and population count of 37,318,481 as of July 1, 2010. Among counties with reliable rates, the crude rate ranged from 24.3 inHumboldt County to 7.8 in Fresno County, a factor of 3.1 to 1.
The age-adjusted death rate from suicide for California during the 2009 through 2011three-year period was 10.2 deaths per 100,000 population. Reliable age-adjusted deathrates ranged from 22.7 in Humboldt County to 7.8 in Los Angeles County.
Nine counties with reliable age-adjusted rates and California as a whole met the HealthyPeople 2020 National Objective MHMD-1 of no more than 10.2 age-adjusted deathsdue to suicide per 100,000 population. An additional four counties with unreliable ratesand one county with no deaths due to suicide met the objective.
The California average age-adjusted death rate for the 2006-2008 period was 9.7.
T

7/28/2019 2013 County Health Status Profiles
http://slidepdf.com/reader/full/2013-county-health-status-profiles 41/102
County Health Status Profles 2013California Department of Public Health 34
State of California, Department of Finance, Race/Hispanics Population with Age and Gender Detail, 2000–2010. Sacramento, California, September 2012.Sources: California Department of Public Health, 2009-2011 Death Statistical Master Files.
Note: Counties were rank ordered first by increasing age-adjusted death rate (calculated to 15 decimal places), second by decreasing size of the population.- Rates, percentages, and confidence limits are not calculated for zero events.* Rates are deemed unreliable based on fewer than 20 data elements.
TABLE 16
DEATHS DUE TO SUICIDE
RANKED BY THREE-YEAR AVERAGE AGE-ADJUSTED DEATH RATE
CALIFORNIA COUNTIES, 2009-2011
x x x 95% CONFIDENCE LIMITS
RANKORDER
COUNTYOF RESIDENCE
2010POPULATION
2009-2011 DEATHS(AVERAGE)
CRUDEDEATHRATE
AGE-ADJUSTEDDEATH RATE LOWER UPPER
1 ALPINE 1,147 0.0 - - - -
2 IMPERIAL 175,594 12.0 6.8 * 7.3 * 3.8 12.7
3 KINGS 153,020 11.0 7.2 * 7.3 * 3.7 13.1
4 LOS ANGELES 9,827,070 779.0 7.9 7.8 7.3 8.4
5 FRESNO 933,075 72.3 7.8 8.1 6.4 10.2
6 YOLO 200,995 16.3 8.1 * 8.3 * 4.8 13.4
7 SANTA CLARA 1,787,553 151.0 8.4 8.3 6.9 9.6
8 MONTEREY 415,825 36.3 8.7 8.8 6.2 12.2
9 SAN MATEO 719,582 69.0 9.6 8.9 6.9 11.3
10 ALAMEDA 1,513,493 140.0 9.3 9.0 7.5 10.5
11 ORANGE 3,017,089 278.3 9.2 9.0 7.9 10.1
12 GLENN 28,188 2.7 9.5 * 9.6 * 1.7 29.6
13 RIVERSIDE 2,191,800 211.7 9.7 9.8 8.5 11.1
14 SAN JOAQUIN 686,761 66.7 9.7 10.2 7.9 13.0
CALIFORNIA 37,318,481 3,853.3 10.3 10.2 9.8 10.5
HEALTHY PEOPLE 2020 NATIONAL OBJECTIVE MHMD-1 10.2
15 TULARE 443,638 41.3 9.3 10.3 7.4 14.0
16 SAN BENITO 55,350 5.0 9.0 * 10.4 * 3.4 24.2
17 NAPA 136,681 15.7 11.5 * 10.5 * 5.9 17.1
18 SAN FRANCISCO 807,177 94.7 11.7 10.5 8.5 12.9
19 MONO 14,114 1.3 9.4 * 10.6 * 0.6 48.820 CONTRA COSTA 1,052,192 118.7 11.3 10.8 8.8 12.8
21 SANTA BARBARA 424,291 45.7 10.8 10.9 8.0 14.6
22 SAN BERNARDINO 2,038,771 215.0 10.5 11.0 9.5 12.5
23 VENTURA 825,378 95.7 11.6 11.3 9.1 13.8
24 STANISLAUS 515,311 56.7 11.0 11.4 8.6 14.8
25 KERN 841,744 89.7 10.7 11.5 9.2 14.1
26 SAN DIEGO 3,104,581 366.7 11.8 11.5 10.3 12.7
27 LASSEN 34,730 4.3 12.5 * 11.5 * 3.1 29.5
28 SUTTER 94,800 11.3 12.0 * 11.9 * 6.0 21.1
29 SACRAMENTO 1,420,447 175.0 12.3 12.1 10.3 13.9
30 MERCED 256,386 29.0 11.3 12.6 8.4 18.1
31 SOLANO 413,220 53.0 12.8 12.7 9.5 16.6
32 SONOMA 484,258 69.7 14.4 13.1 10.2 16.5
33 MADERA 151,160 19.0 12.6 * 13.1 * 7.9 20.5
34 SANTA CRUZ 263,174 36.3 13.8 13.6 9.6 18.935 MARIN 252,767 40.0 15.8 13.8 9.8 18.8
36 YUBA 72,336 9.7 13.4 * 13.9 * 6.5 25.7
37 PLACER 350,609 53.0 15.1 14.4 10.8 18.9
38 SAN LUIS OBISPO 269,753 49.7 18.4 16.3 12.1 21.5
39 COLUSA 21,452 3.3 15.5 * 16.8 * 3.9 46.7
40 SIERRA 3,231 0.3 10.3 * 17.0 * 0.0 222.5
41 TEHAMA 63,635 12.0 18.9 * 17.8 * 9.2 31.2
42 MODOC 9,676 2.3 24.1 * 17.9 * 2.7 59.3
43 EL DORADO 181,183 38.0 21.0 18.7 13.2 25.7
44 BUTTE 220,024 45.0 20.5 19.5 14.2 26.1
45 PLUMAS 19,993 4.3 21.7 * 19.8 * 5.8 49.1
46 INYO 18,627 4.3 23.3 * 20.4 * 6.0 50.6
47 NEVADA 98,484 20.7 21.0 21.4 13.2 32.8
48 MENDOCINO 87,939 21.3 24.3 22.2 13.8 33.8
49 SHASTA 177,480 42.3 23.9 22.2 16.0 30.050 DEL NORTE 28,577 6.7 23.3 * 22.5 * 8.8 47.2
51 HUMBOLDT 134,575 32.7 24.3 22.7 15.6 31.9
52 TUOLUMNE 54,961 13.7 24.9 * 23.4 * 12.7 39.5
53 AMADOR 37,907 11.3 29.9 * 25.0 * 12.6 44.4
54 CALAVERAS 45,258 13.0 28.7 * 25.2 * 13.4 43.1
55 TRINITY 13,883 3.3 24.0 * 25.4 * 5.8 70.5
56 MARIPOSA 18,119 5.3 29.4 * 26.7 * 9.1 60.8
57 LAKE 64,466 19.7 30.5 * 26.7 * 16.3 41.4
58 SISKIYOU 44,951 11.3 25.2 * 27.1 * 13.7 48.0

7/28/2019 2013 County Health Status Profiles
http://slidepdf.com/reader/full/2013-county-health-status-profiles 42/102
County Health Status Profles 2013California Department of Public Health 35
DEATHS DUE TO HOMICIDE, 2009-2011
he crude death rate from homicide for California was 5.3 deaths per 100,000population, a risk of dying equivalent to approximately one death for every18,734.2 persons. This rate was based on a 2009 through 2011 three-year
average number of deaths equaling 1,992.0 and population count of 37,318,481 as of July 1, 2010. Among counties with reliable rates, the crude rate ranged from 10.9 inMonterey County to 2.5 in Orange County and Ventura County, a factor of 4.3 to 1.
The age-adjusted death rate from homicide for California during the 2009 through 2011three-year period was 5.2 deaths per 100,000 population. Reliable age-adjusted deathrates ranged from 10.4 in San Joaquin County to 2.5 in Orange County.
Six counties with reliable age-adjusted death rates and California as a whole met theHealthy People 2020 National Objective IVP-29 of no more than 5.5 age-adjusteddeaths due to homicide per 100,000 population. An additional twenty-three countieswith unreliable rates and five counties with no homicide deaths met the objective.
The California average age-adjusted death rate for the 2006-2008 period was 6.4.
T
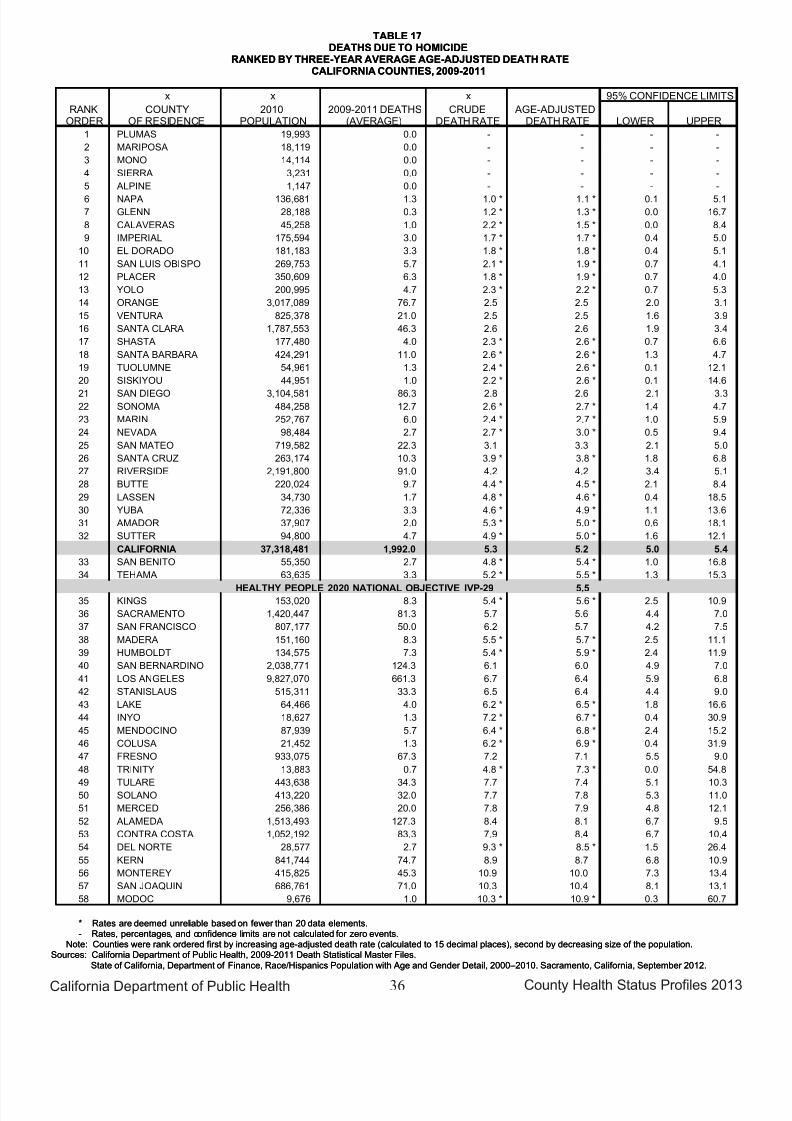
7/28/2019 2013 County Health Status Profiles
http://slidepdf.com/reader/full/2013-county-health-status-profiles 43/102
County Health Status Profles 2013California Department of Public Health 36
State of California, Department of Finance, Race/Hispanics Population with Age and Gender Detail, 2000–2010. Sacramento, California, September 2012.Sources: California Department of Public Health, 2009-2011 Death Statistical Master Files.
Note: Counties were rank ordered first by increasing age-adjusted death rate (calculated to 15 decimal places), second by decreasing size of the population.- Rates, percentages, and confidence limits are not calculated for zero events.* Rates are deemed unreliable based on fewer than 20 data elements.
TABLE 17
DEATHS DUE TO HOMICIDE
RANKED BY THREE-YEAR AVERAGE AGE-ADJUSTED DEATH RATE
CALIFORNIA COUNTIES, 2009-2011
x x x 95% CONFIDENCE LIMITS
RANKORDER
COUNTYOF RESIDENCE
2010POPULATION
2009-2011 DEATHS(AVERAGE)
CRUDEDEATHRATE
AGE-ADJUSTEDDEATH RATE LOWER UPPER
1 PLUMAS 19,993 0.0 - - - -
2 MARIPOSA 18,119 0.0 - - - -
3 MONO 14,114 0.0 - - - -
4 SIERRA 3,231 0.0 - - - -
5 ALPINE 1,147 0.0 - - - -
6 NAPA 136,681 1.3 1.0 * 1.1 * 0.1 5.1
7 GLENN 28,188 0.3 1.2 * 1.3 * 0.0 16.7
8 CALAVERAS 45,258 1.0 2.2 * 1.5 * 0.0 8.4
9 IMPERIAL 175,594 3.0 1.7 * 1.7 * 0.4 5.0
10 EL DORADO 181,183 3.3 1.8 * 1.8 * 0.4 5.1
11 SAN LUIS OBISPO 269,753 5.7 2.1 * 1.9 * 0.7 4.1
12 PLACER 350,609 6.3 1.8 * 1.9 * 0.7 4.0
13 YOLO 200,995 4.7 2.3 * 2.2 * 0.7 5.3
14 ORANGE 3,017,089 76.7 2.5 2.5 2.0 3.1
15 VENTURA 825,378 21.0 2.5 2.5 1.6 3.9
16 SANTA CLARA 1,787,553 46.3 2.6 2.6 1.9 3.4
17 SHASTA 177,480 4.0 2.3 * 2.6 * 0.7 6.6
18 SANTA BARBARA 424,291 11.0 2.6 * 2.6 * 1.3 4.7
19 TUOLUMNE 54,961 1.3 2.4 * 2.6 * 0.1 12.1
20 SISKIYOU 44,951 1.0 2.2 * 2.6 * 0.1 14.6
21 SAN DIEGO 3,104,581 86.3 2.8 2.6 2.1 3.322 SONOMA 484,258 12.7 2.6 * 2.7 * 1.4 4.7
23 MARIN 252,767 6.0 2.4 * 2.7 * 1.0 5.9
24 NEVADA 98,484 2.7 2.7 * 3.0 * 0.5 9.4
25 SAN MATEO 719,582 22.3 3.1 3.3 2.1 5.0
26 SANTA CRUZ 263,174 10.3 3.9 * 3.8 * 1.8 6.8
27 RIVERSIDE 2,191,800 91.0 4.2 4.2 3.4 5.1
28 BUTTE 220,024 9.7 4.4 * 4.5 * 2.1 8.4
29 LASSEN 34,730 1.7 4.8 * 4.6 * 0.4 18.5
30 YUBA 72,336 3.3 4.6 * 4.9 * 1.1 13.6
31 AMADOR 37,907 2.0 5.3 * 5.0 * 0.6 18.1
32 SUTTER 94,800 4.7 4.9 * 5.0 * 1.6 12.1
CALIFORNIA 37,318,481 1,992.0 5.3 5.2 5.0 5.4
33 SAN BENITO 55,350 2.7 4.8 * 5.4 * 1.0 16.8
34 TEHAMA 63,635 3.3 5.2 * 5.5 * 1.3 15.3
HEALTHY PEOPLE 2020 NATIONAL OBJECTIVE IVP-29 5.535 KINGS 153,020 8.3 5.4 * 5.6 * 2.5 10.9
36 SACRAMENTO 1,420,447 81.3 5.7 5.6 4.4 7.0
37 SAN FRANCISCO 807,177 50.0 6.2 5.7 4.2 7.5
38 MADERA 151,160 8.3 5.5 * 5.7 * 2.5 11.1
39 HUMBOLDT 134,575 7.3 5.4 * 5.9 * 2.4 11.9
40 SAN BERNARDINO 2,038,771 124.3 6.1 6.0 4.9 7.0
41 LOS ANGELES 9,827,070 661.3 6.7 6.4 5.9 6.8
42 STANISLAUS 515,311 33.3 6.5 6.4 4.4 9.0
43 LAKE 64,466 4.0 6.2 * 6.5 * 1.8 16.6
44 INYO 18,627 1.3 7.2 * 6.7 * 0.4 30.9
45 MENDOCINO 87,939 5.7 6.4 * 6.8 * 2.4 15.2
46 COLUSA 21,452 1.3 6.2 * 6.9 * 0.4 31.9
47 FRESNO 933,075 67.3 7.2 7.1 5.5 9.0
48 TRINITY 13,883 0.7 4.8 * 7.3 * 0.0 54.8
49 TULARE 443,638 34.3 7.7 7.4 5.1 10.350 SOLANO 413,220 32.0 7.7 7.8 5.3 11.0
51 MERCED 256,386 20.0 7.8 7.9 4.8 12.1
52 ALAMEDA 1,513,493 127.3 8.4 8.1 6.7 9.5
53 CONTRA COSTA 1,052,192 83.3 7.9 8.4 6.7 10.4
54 DEL NORTE 28,577 2.7 9.3 * 8.5 * 1.5 26.4
55 KERN 841,744 74.7 8.9 8.7 6.8 10.9
56 MONTEREY 415,825 45.3 10.9 10.0 7.3 13.4
57 SAN JOAQUIN 686,761 71.0 10.3 10.4 8.1 13.1
58 MODOC 9,676 1.0 10.3 * 10.9 * 0.3 60.7

7/28/2019 2013 County Health Status Profiles
http://slidepdf.com/reader/full/2013-county-health-status-profiles 44/102
County Health Status Profles 2013California Department of Public Health 37
FIREARM-RELATED DEATHS, 2009-2011
he crude death rate from firearm-related injuries for California was 8.0 deaths per 100,000 population, a risk of dying equivalent to approximately one death for every 12,566.4 persons. This rate was based on the 2009 through 2011
three-year average number of deaths equaling 2,969.7 and population count of 37,318,481 as of July 1, 2010. Among counties with reliable rates, the crude rateranged from 15.4 in Shasta County to 4.3 in Santa Clara County, a factor of 3.6 to 1.
The age-adjusted death rate from firearm-related injuries for California during the2009 through 2011 three-year period was 7.8 deaths per 100,000 population.Reliable age-adjusted death rates ranged from 13.8 in Shasta County to 4.2 inSanta Clara County.
Fifteen counties with reliable age-adjusted death rates and California as a whole metthe Healthy People 2020 National Objective IVP-30 of no more than 9.2 age-adjusteddeaths due to firearm-related injuries per 100,000 population. An additional ten countieswith unreliable age-adjusted death rates and one county with no deaths due tofirearm-related injuries met the objective.
The California average age-adjusted death rate for the 2006-2008 period was 8.8.
T

7/28/2019 2013 County Health Status Profiles
http://slidepdf.com/reader/full/2013-county-health-status-profiles 45/102
County Health Status Profles 2013California Department of Public Health 38
State of California, Department of Finance, Race/Hispanics Population with Age and Gender Detail, 2000–2010. Sacramento, California, September 2012.Sources: California Department of Public Health, 2009-2011 Death Statistical Master Files.
Note: Counties were rank ordered first by increasing age-adjusted death rate (calculated to 15 decimal places), second by decreasing size of the population.- Rates, percentages, and confidence limits are not calculated for zero events.* Rates are deemed unreliable based on fewer than 20 data elements.
TABLE 18
FIREARM-RELATED DEATHS
RANKED BY THREE-YEAR AVERAGE AGE-ADJUSTED DEATH RATE
CALIFORNIA COUNTIES, 2009-2011
x x x 95% CONFIDENCE LIMITS
RANKORDER
COUNTYOF RESIDENCE
2010POPULATION
2009-2011 DEATHS(AVERAGE)
CRUDEDEATHRATE
AGE-ADJUSTEDDEATH RATE LOWER UPPER
1 ALPINE 1,147 0.0 - - - -
2 SANTA CLARA 1,787,553 76.3 4.3 4.2 3.3 5.2
3 YOLO 200,995 9.0 4.5 * 4.4 * 2.0 8.3
4 ORANGE 3,017,089 146.0 4.8 4.7 3.9 5.5
5 NAPA 136,681 7.0 5.1 * 4.9 * 2.0 10.1
6 SANTA BARBARA 424,291 22.3 5.3 5.3 3.3 8.0
7 SAN MATEO 719,582 38.0 5.3 5.4 3.8 7.4
8 SIERRA 3,231 0.3 10.3 * 5.5 * 0.0 71.7
9 SAN FRANCISCO 807,177 50.0 6.2 5.6 4.2 7.4
10 KINGS 153,020 8.3 5.4 * 5.6 * 2.5 11.0
11 VENTURA 825,378 47.3 5.7 5.6 4.2 7.5
12 IMPERIAL 175,594 9.0 5.1 * 5.7 * 2.6 10.7
13 MARIN 252,767 16.7 6.6 * 5.9 * 3.4 9.5
14 SAN DIEGO 3,104,581 191.3 6.2 6.0 5.1 6.8
15 SONOMA 484,258 34.7 7.2 6.8 4.7 9.4
16 RIVERSIDE 2,191,800 149.0 6.8 6.9 5.8 8.0
17 SANTA CRUZ 263,174 19.7 7.5 * 7.2 * 4.4 11.2
18 LOS ANGELES 9,827,070 797.0 8.1 7.8 7.2 8.3
CALIFORNIA 37,318,481 2,969.7 8.0 7.8 7.5 8.1
19 SUTTER 94,800 7.7 8.1 * 8.0 * 3.4 15.9
20 SAN LUIS OBISPO 269,753 26.0 9.6 8.0 5.2 11.821 PLACER 350,609 30.7 8.7 8.2 5.6 11.7
22 FRESNO 933,075 77.7 8.3 8.3 6.5 10.3
23 SACRAMENTO 1,420,447 124.7 8.8 8.5 7.0 10.0
24 MONO 14,114 1.0 7.1 * 8.6 * 0.2 48.1
25 SAN BERNARDINO 2,038,771 177.7 8.7 8.9 7.6 10.2
26 YUBA 72,336 6.3 8.8 * 9.1 * 3.5 19.5
HEALTHY PEOPLE 2020 NATIONAL OBJECTIVE IVP-30 9.2
27 STANISLAUS 515,311 48.7 9.4 9.5 7.0 12.6
28 MADERA 151,160 14.0 9.3 * 9.6 * 5.3 16.2
29 MERCED 256,386 25.0 9.8 9.8 6.3 14.4
30 SAN BENITO 55,350 4.7 8.4 * 9.9 * 3.1 23.8
31 PLUMAS 19,993 2.3 11.7 * 10.0 * 1.5 33.3
32 ALAMEDA 1,513,493 159.7 10.5 10.2 8.6 11.8
33 LASSEN 34,730 3.7 10.6 * 10.3 * 2.6 27.4
34 GLENN 28,188 3.0 10.6 * 10.3 * 2.1 30.235 SOLANO 413,220 44.3 10.7 10.9 7.9 14.6
36 TULARE 443,638 47.3 10.7 10.9 8.0 14.5
37 MONTEREY 415,825 48.3 11.6 11.0 8.1 14.6
38 HUMBOLDT 134,575 17.0 12.6 * 11.2 * 6.5 18.0
39 CONTRA COSTA 1,052,192 116.0 11.0 11.4 9.3 13.5
40 BUTTE 220,024 28.0 12.7 11.6 7.7 16.7
41 TEHAMA 63,635 8.3 13.1 * 11.8 * 5.2 23.0
42 KERN 841,744 97.0 11.5 11.9 9.6 14.5
43 EL DORADO 181,183 24.0 13.2 12.1 7.8 18.1
44 SAN JOAQUIN 686,761 84.3 12.3 12.4 9.9 15.3
45 NEVADA 98,484 12.3 12.5 * 12.4 * 6.5 21.6
46 TUOLUMNE 54,961 7.7 13.9 * 12.7 * 5.4 25.4
47 SHASTA 177,480 27.3 15.4 13.8 9.1 20.0
48 CALAVERAS 45,258 8.3 18.4 * 13.8 * 6.1 26.9
49 COLUSA 21,452 3.0 14.0 * 15.0 * 3.1 43.950 AMADOR 37,907 8.0 21.1 * 15.6 * 6.8 30.8
51 MARIPOSA 18,119 3.0 16.6 * 15.7 * 3.2 46.0
52 SISKIYOU 44,951 7.3 16.3 * 16.0 * 6.6 32.4
53 DEL NORTE 28,577 5.0 17.5 * 16.2 * 5.3 37.8
54 LAKE 64,466 13.0 20.2 * 16.7 * 8.9 28.6
55 MENDOCINO 87,939 15.0 17.1 * 17.1 * 9.6 28.2
56 TRINITY 13,883 2.7 19.2 * 18.5 * 3.3 57.3
57 INYO 18,627 4.3 23.3 * 19.9 * 5.8 49.3
58 MODOC 9,676 3.3 34.4 * 28.8 * 6.6 79.9

7/28/2019 2013 County Health Status Profiles
http://slidepdf.com/reader/full/2013-county-health-status-profiles 46/102
County Health Status Profles 2013California Department of Public Health 39
DRUG-INDUCED DEATHS, 2009-2011
he crude death rate from drug-induced deaths for California was 11.3 deaths per 100,000 population, a risk of dying equivalent to approximately one death for every 8,869.9 persons. This rate was based on a 2009 through 2011 three-year
average number of deaths equaling 4,207.3 and population count of 37,318,481 as of July 1, 2010. Among counties with reliable rates, the crude rate ranged from 51.2 inLake County to 7.2 in Los Angeles County, a factor of 7.1 to 1.
The age-adjusted death rate from drug-induced deaths for California during the2009 through 2011 three-year period was 10.9 deaths per 100,000 population.Reliable age-adjusted death rates ranged from 45.3 in Lake County to 6.9 in
Santa Clara County.
Eleven counties with reliable age-adjusted death rates and California as a whole metthe Healthy People 2020 National Objective SA-12 of no more than 11.3 age-adjusteddrug-induced deaths per 100,000 population. An additional ten counties with unreliableage-adjusted death rates and one county with no drug-induced deaths met theobjective.
The California average age-adjusted death rate for the 2006-2008 period was 11.1.
T

7/28/2019 2013 County Health Status Profiles
http://slidepdf.com/reader/full/2013-county-health-status-profiles 47/102
County Health Status Profles 2013California Department of Public Health 40
State of California, Department of Finance, Race/Hispanics Population with Age and Gender Detail, 2000–2010. Sacramento, California, September 2012.Sources: California Department of Public Health, 2009-2011 Death Statistical Master Files.
Note: Counties were rank ordered first by increasing age-adjusted death rate (calculated to 15 decimal places), second by decreasing size of the population.- Rates, percentages, and confidence limits are not calculated for zero events.* Rates are deemed unreliable based on fewer than 20 data elements.
TABLE 19
DRUG-INDUCED DEATHS
RANKED BY THREE-YEAR AVERAGE AGE-ADJUSTED DEATH RATE
CALIFORNIA COUNTIES, 2009-2011
x x x 95% CONFIDENCE LIMITS
RANKORDER
COUNTYOF RESIDENCE
2010POPULATION
2009-2011 DEATHS(AVERAGE)
CRUDEDEATHRATE
AGE-ADJUSTEDDEATH RATE LOWER UPPER
1 ALPINE 1,147 0.0 - - - -
2 COLUSA 21,452 1.0 4.7 * 3.6 * 0.1 19.8
3 YUBA 72,336 4.3 6.0 * 6.2 * 1.8 15.3
4 SANTA CLARA 1,787,553 129.7 7.3 6.9 5.7 8.1
5 LOS ANGELES 9,827,070 709.7 7.2 7.0 6.5 7.5
6 SAN MATEO 719,582 56.7 7.9 7.3 5.5 9.5
7 INYO 18,627 1.3 7.2 * 8.0 * 0.4 36.8
8 PLACER 350,609 31.0 8.8 8.3 5.6 11.7
9 KINGS 153,020 13.0 8.5 * 8.7 * 4.6 14.8
10 TULARE 443,638 35.0 7.9 9.1 6.3 12.6
11 ALAMEDA 1,513,493 151.7 10.0 9.3 7.8 10.8
12 YOLO 200,995 18.0 9.0 * 9.6 * 5.7 15.2
13 MONO 14,114 1.3 9.4 * 9.8 * 0.5 44.9
14 SAN BERNARDINO 2,038,771 198.7 9.7 9.8 8.4 11.2
15 CONTRA COSTA 1,052,192 112.7 10.7 9.9 8.0 11.7
16 MONTEREY 415,825 41.7 10.0 10.2 7.3 13.8
17 ORANGE 3,017,089 322.3 10.7 10.3 9.2 11.4
18 NAPA 136,681 17.0 12.4 * 10.5 * 6.1 16.8
19 IMPERIAL 175,594 17.3 9.9 * 10.5 * 6.1 16.7
CALIFORNIA 37,318,481 4,207.3 11.3 10.9 10.6 11.3
20 MARIN 252,767 31.0 12.3 11.2 7.6 15.921 SAN BENITO 55,350 6.3 11.4 * 11.2 * 4.2 23.8
22 TRINITY 13,883 1.7 12.0 * 11.3 * 1.0 45.2
HEALTHY PEOPLE 2020 NATIONAL OBJECTIVE SA-12 11.3
23 RIVERSIDE 2,191,800 253.3 11.6 11.7 10.2 13.1
24 VENTURA 825,378 97.7 11.8 11.7 9.5 14.3
25 FRESNO 933,075 103.0 11.0 11.7 9.5 14.0
26 MADERA 151,160 17.7 11.7 * 12.1 * 7.1 19.2
27 MERCED 256,386 28.0 10.9 12.1 8.0 17.5
28 SAN DIEGO 3,104,581 391.3 12.6 12.2 11.0 13.4
29 SONOMA 484,258 65.0 13.4 12.2 9.4 15.6
30 DEL NORTE 28,577 3.7 12.8 * 12.8 * 3.2 34.1
31 SOLANO 413,220 54.7 13.2 13.0 9.8 16.9
32 TEHAMA 63,635 8.0 12.6 * 13.4 * 5.8 26.4
33 SANTA BARBARA 424,291 55.0 13.0 13.4 10.1 17.5
34 NEVADA 98,484 13.7 13.9 * 14.0 * 7.6 23.635 MARIPOSA 18,119 4.3 23.9 * 14.3 * 4.2 35.3
36 SAN LUIS OBISPO 269,753 39.7 14.7 14.5 10.4 19.8
37 SACRAMENTO 1,420,447 219.0 15.4 15.1 13.1 17.2
38 SANTA CRUZ 263,174 43.0 16.3 15.9 11.5 21.4
39 SUTTER 94,800 14.3 15.1 * 16.2 * 8.9 27.0
40 STANISLAUS 515,311 86.3 16.8 16.9 13.6 20.9
41 MENDOCINO 87,939 18.0 20.5 * 17.4 * 10.3 27.6
42 KERN 841,744 147.0 17.5 18.3 15.3 21.2
43 SAN JOAQUIN 686,761 131.0 19.1 19.4 16.1 22.7
44 MODOC 9,676 1.7 17.2 * 19.5 * 1.7 78.2
45 EL DORADO 181,183 38.7 21.3 19.8 14.1 27.1
46 SAN FRANCISCO 807,177 182.3 22.6 20.0 17.0 22.9
47 LASSEN 34,730 8.3 24.0 * 22.1 * 9.7 43.0
48 SISKIYOU 44,951 10.3 23.0 * 24.2 * 11.8 44.0
49 GLENN 28,188 6.7 23.7 * 26.2 * 10.3 55.050 AMADOR 37,907 12.0 31.7 * 27.2 * 14.0 47.5
51 SHASTA 177,480 53.7 30.2 29.1 21.8 38.0
52 TUOLUMNE 54,961 16.0 29.1 * 31.0 * 17.7 50.3
53 PLUMAS 19,993 5.3 26.7 * 32.3 * 11.0 73.4
54 CALAVERAS 45,258 15.0 33.1 * 34.8 * 19.5 57.5
55 BUTTE 220,024 78.0 35.5 36.0 28.4 44.9
56 HUMBOLDT 134,575 50.3 37.4 36.7 27.3 48.4
57 SIERRA 3,231 1.0 31.0 * 39.4 * 1.0 219.6
58 LAKE 64,466 33.0 51.2 45.3 31.2 63.6

7/28/2019 2013 County Health Status Profiles
http://slidepdf.com/reader/full/2013-county-health-status-profiles 48/102
County Health Status Profles 2013California Department of Public Health 41
REPORTED INCIDENCE OF AIDS AMONG POPULATIONAGES 13 YEARS AND OLDER, 2009-2011
he crude case rate of reported AIDS cases for Californians aged 13 years andolder was 9.7 cases per 100,000 population or approximately one reported AIDScase for every 10,290.7 persons. This rate was based on a 2009 through 2011
three-year average reported number of cases equaling 2,995.0 and a population countof 30,820,500, for ages 13 years and older, as of July 1, 2010.
Among counties with reliable rates, the crude case rate ranged from 38.9 inSan Francisco County to 3.1 in Ventura County, a factor of 12.6 to 1.
Fifteen counties with a reliable crude case rate met the Healthy People 2020 NationalObjective HIV-4 of no more than 13.0 AIDS case per 100,000 population aged 13 yearsand older. Thirty-six counties with unreliable rates and five counties with no new AIDScases met the objective. The statewide AIDS crude case met the national objective.
The California crude case rate for the 2006-2008 period was 12.4.
T

7/28/2019 2013 County Health Status Profiles
http://slidepdf.com/reader/full/2013-county-health-status-profiles 49/102
County Health Status Profles 2013California Department of Public Health 42
State of California, Department of Finance, Race/Hispanics Population with Age and Gender Detail, 2000–2010. Sacramento, California, September 201Sources: California Department of Public Health, Office of AIDS, HIV/AIDS Surveillance Section, data as of 12/31/2012.
Note: Counties were rank ordered first by increasing case rate (calculated to 15 decimal places), second by decreasing size of the population.- Rates, percentages, and confidence limits are not calculated for zero events.* Rates are deemed unreliable based on fewer than 20 data elements.
TABLE 20
REPORTED INCIDENCE OF AIDS AMONG POPULATION AGES 13 YEARS AND OVER
RANKED BY THREE-YEAR AVERAGE CRUDE CASE RATE
CALIFORNIA COUNTIES, 2009-2011
x x x 95% CONFIDENCE LIMITS
RANKORDER
COUNTYOF RESIDENCE
2010 POPULATION AGED 13 AND OVER
2009-2011CASES (AVERAGE)
CRUDECASE RATE LOWER UPPER
1 PLUMAS 17,494 0.0 - - -
2 COLUSA 16,837 0.0 - - -
3 MODOC 8,199 0.0 - - -
4 SIERRA 2,862 0.0 - - -
5 ALPINE 955 0.0 - - -
6 CALAVERAS 39,382 0.3 0.8 * 0.0 11.1
7 SHASTA 150,168 1.3 0.9 * 0.0 4.1
8 AMADOR 33,756 0.3 1.0 * 0.0 12.9
9 LASSEN 30,262 0.3 1.1 * 0.0 14.4
10 YUBA 56,989 0.7 1.2 * 0.0 8.7
11 NEVADA 85,345 1.0 1.2 * 0.0 6.5
12 SUTTER 76,251 1.0 1.3 * 0.0 7.3
13 GLENN 22,445 0.3 1.5 * 0.0 19.4
14 PLACER 291,584 4.3 1.5 * 0.4 3.7
15 BUTTE 187,740 3.0 1.6 * 0.3 4.7
16 HUMBOLDT 115,458 2.0 1.7 * 0.2 6.3
17 TEHAMA 52,203 1.0 1.9 * 0.0 10.7
18 MARIPOSA 15,951 0.3 2.1 * 0.0 27.3
19 INYO 15,908 0.3 2.1 * 0.0 27.4
20 EL DORADO 152,913 3.3 2.2 * 0.5 6.1
21 YOLO 168,849 4.3 2.6 * 0.7 6.322 SISKIYOU 38,429 1.0 2.6 * 0.1 14.5
23 MENDOCINO 74,047 2.0 2.7 * 0.3 9.8
24 KINGS 121,948 3.3 2.7 * 0.6 7.6
25 TRINITY 12,174 0.3 2.7 * 0.0 35.8
26 DEL NORTE 24,245 0.7 2.7 * 0.0 20.5
27 MONO 11,879 0.3 2.8 * 0.0 36.7
28 SAN LUIS OBISPO 234,255 6.7 2.8 * 1.1 6.0
29 SANTA BARBARA 355,303 10.7 3.0 * 1.5 5.4
30 SAN BENITO 44,130 1.3 3.0 * 0.2 13.9
31 VENTURA 678,157 21.0 3.1 1.9 4.7
32 SANTA CRUZ 224,160 7.7 3.4 * 1.4 6.8
33 TULARE 339,385 11.7 3.4 * 1.8 6.1
34 LAKE 55,077 2.0 3.6 * 0.4 13.1
35 MERCED 198,996 7.3 3.7 * 1.5 7.5
36 SAN MATEO 605,078 23.7 3.9 2.5 5.837 MONTEREY 335,776 13.7 4.1 * 2.2 6.9
38 TUOLUMNE 48,439 2.0 4.1 * 0.5 14.9
39 MADERA 120,463 5.0 4.2 * 1.3 9.7
40 STANISLAUS 411,961 19.0 4.6 * 2.8 7.2
41 NAPA 114,587 6.3 5.5 * 2.1 11.8
42 SOLANO 342,502 20.0 5.8 3.6 9.0
43 SONOMA 409,021 24.3 5.9 3.8 8.8
44 ORANGE 2,509,472 169.3 6.7 5.7 7.8
45 MARIN 214,225 14.7 6.8 * 3.8 11.4
46 SAN BERNARDINO 1,626,793 113.0 6.9 5.7 8.2
47 RIVERSIDE 1,765,887 125.0 7.1 5.8 8.3
48 SACRAMENTO 1,166,702 84.0 7.2 5.7 8.9
49 SAN JOAQUIN 545,528 39.3 7.2 5.1 9.8
50 CONTRA COSTA 867,346 69.7 8.0 6.3 10.2
51 KERN 660,456 55.0 8.3 6.3 10.852 IMPERIAL 140,108 12.0 8.6 * 4.4 15.0
53 SANTA CLARA 1,473,073 132.3 9.0 7.5 10.5
CALIFORNIA 30,820,500 2,995.0 9.7 9.4 10.1
54 FRESNO 735,427 74.0 10.1 7.9 12.6
55 SAN DIEGO 2,601,339 301.0 11.6 10.3 12.9
56 ALAMEDA 1,269,605 159.7 12.6 10.6 14.5
HEALTHY PEOPLE 2020 NATIONAL OBJECTIVE HIV-4 13.0
57 LOS ANGELES 8,173,205 1,148.3 14.0 13.2 14.9
58 SAN FRANCISCO 729,773 283.7 38.9 34.3 43.4

7/28/2019 2013 County Health Status Profiles
http://slidepdf.com/reader/full/2013-county-health-status-profiles 50/102
County Health Status Profles 2013California Department of Public Health 43
REPORTED INCIDENCE OF CHLAMYDIA, 2009-2011
he crude case rate of reported chlamydia cases for California was 417.6 casesper 100,000 population or approximately one reported chlamydia case for every239.5 persons. This rate was based on a 2009 through 2011 three-year average
reported number of cases equaling 155,844.7 and population count of 37,318,481 asof July 1, 2010.
Among counties with reliable rates, the crude case rate ranged from 637.1 inKern County to 117.1 in Calaveras County, a factor of 5.4 to 1.
Prevalence data are not available in all California counties to evaluate the Healthy
People 2020 National Objective STD-1, as the Health People objective is restricted tofemales who are 15-24 years old and identified at a family planning clinic, and malesand females under 24 years old who participate in a national job-training program.
The California crude case rate for the 2006-2008 period was 391.0
T
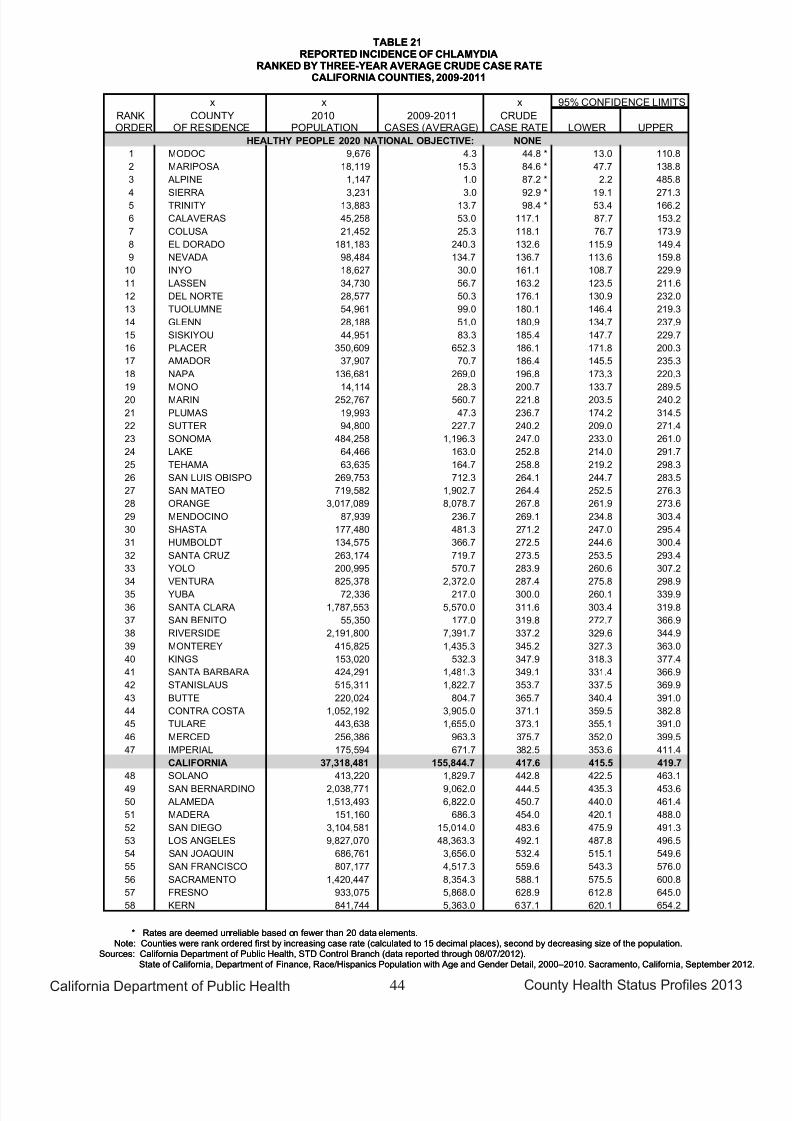
7/28/2019 2013 County Health Status Profiles
http://slidepdf.com/reader/full/2013-county-health-status-profiles 51/102
County Health Status Profles 2013California Department of Public Health 44
State of California, Department of Finance, Race/Hispanics Population with Age and Gender Detail, 2000–2010. Sacramento, California, September 20Sources: California Department of Public Health, STD Control Branch (data reported through 08/07/2012).
Note: Counties were rank ordered first by increasing case rate (calculated to 15 decimal places), second by decreasing size of the population.* Rates are deemed unreliable based on fewer than 20 data elements.
TABLE 21
REPORTED INCIDENCE OF CHLAMYDIA
RANKED BY THREE-YEAR AVERAGE CRUDE CASE RATE
CALIFORNIA COUNTIES, 2009-2011
x x x 95% CONFIDENCE LIMITS
RANKORDER
COUNTYOF RESIDENCE
2010POPULATION
2009-2011CASES (AVERAGE)
CRUDECASE RATE LOWER UPPER
HEALTHY PEOPLE 2020 NATIONAL OBJECTIVE: NONE
1 MODOC 9,676 4.3 44.8 * 13.0 110.8
2 MARIPOSA 18,119 15.3 84.6 * 47.7 138.8
3 ALPINE 1,147 1.0 87.2 * 2.2 485.8
4 SIERRA 3,231 3.0 92.9 * 19.1 271.35 TRINITY 13,883 13.7 98.4 * 53.4 166.2
6 CALAVERAS 45,258 53.0 117.1 87.7 153.2
7 COLUSA 21,452 25.3 118.1 76.7 173.9
8 EL DORADO 181,183 240.3 132.6 115.9 149.4
9 NEVADA 98,484 134.7 136.7 113.6 159.8
10 INYO 18,627 30.0 161.1 108.7 229.9
11 LASSEN 34,730 56.7 163.2 123.5 211.6
12 DEL NORTE 28,577 50.3 176.1 130.9 232.0
13 TUOLUMNE 54,961 99.0 180.1 146.4 219.3
14 GLENN 28,188 51.0 180.9 134.7 237.9
15 SISKIYOU 44,951 83.3 185.4 147.7 229.7
16 PLACER 350,609 652.3 186.1 171.8 200.3
17 AMADOR 37,907 70.7 186.4 145.5 235.3
18 NAPA 136,681 269.0 196.8 173.3 220.3
19 MONO 14,114 28.3 200.7 133.7 289.5
20 MARIN 252,767 560.7 221.8 203.5 240.2
21 PLUMAS 19,993 47.3 236.7 174.2 314.5
22 SUTTER 94,800 227.7 240.2 209.0 271.4
23 SONOMA 484,258 1,196.3 247.0 233.0 261.0
24 LAKE 64,466 163.0 252.8 214.0 291.7
25 TEHAMA 63,635 164.7 258.8 219.2 298.3
26 SAN LUIS OBISPO 269,753 712.3 264.1 244.7 283.5
27 SAN MATEO 719,582 1,902.7 264.4 252.5 276.3
28 ORANGE 3,017,089 8,078.7 267.8 261.9 273.6
29 MENDOCINO 87,939 236.7 269.1 234.8 303.4
30 SHASTA 177,480 481.3 271.2 247.0 295.4
31 HUMBOLDT 134,575 366.7 272.5 244.6 300.4
32 SANTA CRUZ 263,174 719.7 273.5 253.5 293.4
33 YOLO 200,995 570.7 283.9 260.6 307.2
34 VENTURA 825,378 2,372.0 287.4 275.8 298.9
35 YUBA 72,336 217.0 300.0 260.1 339.9
36 SANTA CLARA 1,787,553 5,570.0 311.6 303.4 319.8
37 SAN BENITO 55,350 177.0 319.8 272.7 366.9
38 RIVERSIDE 2,191,800 7,391.7 337.2 329.6 344.9
39 MONTEREY 415,825 1,435.3 345.2 327.3 363.0
40 KINGS 153,020 532.3 347.9 318.3 377.4
41 SANTA BARBARA 424,291 1,481.3 349.1 331.4 366.9
42 STANISLAUS 515,311 1,822.7 353.7 337.5 369.9
43 BUTTE 220,024 804.7 365.7 340.4 391.0
44 CONTRA COSTA 1,052,192 3,905.0 371.1 359.5 382.8
45 TULARE 443,638 1,655.0 373.1 355.1 391.0
46 MERCED 256,386 963.3 375.7 352.0 399.5
47 IMPERIAL 175,594 671.7 382.5 353.6 411.4
CALIFORNIA 37,318,481 155,844.7 417.6 415.5 419.7
48 SOLANO 413,220 1,829.7 442.8 422.5 463.1
49 SAN BERNARDINO 2,038,771 9,062.0 444.5 435.3 453.6
50 ALAMEDA 1,513,493 6,822.0 450.7 440.0 461.4
51 MADERA 151,160 686.3 454.0 420.1 488.0
52 SAN DIEGO 3,104,581 15,014.0 483.6 475.9 491.3
53 LOS ANGELES 9,827,070 48,363.3 492.1 487.8 496.5
54 SAN JOAQUIN 686,761 3,656.0 532.4 515.1 549.6
55 SAN FRANCISCO 807,177 4,517.3 559.6 543.3 576.0
56 SACRAMENTO 1,420,447 8,354.3 588.1 575.5 600.8
57 FRESNO 933,075 5,868.0 628.9 612.8 645.0
58 KERN 841,744 5,363.0 637.1 620.1 654.2

7/28/2019 2013 County Health Status Profiles
http://slidepdf.com/reader/full/2013-county-health-status-profiles 52/102
County Health Status Profles 2013California Department of Public Health 45
REPORTED INCIDENCE OF GONORRHEAAMONG FEMALES 15 TO 44 YEARS OLD, 2009-2011
he crude case rate of reported gonorrhea cases among females aged 15 to 44 for California was 125.9 cases per 100,000 population or approximately one reportedgonorrhea case for every 794.4 persons. This rate was based on a 2009 through
2011 three-year average reported number of cases equaling 10,014.7 and populationcount of 7,955,836 females aged 15 to 44 as of July 1, 2010.
Among counties with reliable rates, the crude case rate ranged from 309.0 inSacramento County to 34.0 in Santa Barbara County, a factor of 9.1 to 1.
Twenty-seven counties with reliable crude case rates met the Healthy People 2020
National Objective STD-6.1 of no more than 257.0 new gonorrhea cases per 100,000population for females, aged 15 to 44. An additional twenty-six counties with unreliablerates and three counties with no new gonorrhea cases met the objective. The statewidegonorrhea crude case rate met the national objective.
The California crude case rate for the 2006-2008 period was 168.8.
T

7/28/2019 2013 County Health Status Profiles
http://slidepdf.com/reader/full/2013-county-health-status-profiles 53/102
County Health Status Profles 2013California Department of Public Health 46
State of California, Department of Finance, Race/Hispanics Population with Age and Gender Detail, 2000–2010. Sacramento, California, September 201Sources: California Department of Public Health, STD Control Branch, Data Request, August, 2012.
Note: Counties were rank ordered first by increasing case rate (calculated to 15 decimal places), second by decreasing size of the population.- Rates, percentages, and confidence limits are not calculated for zero events.* Rates are deemed unreliable based on fewer than 20 data elements.
TABLE 22F
REPORTED INCIDENCE OF GONORRHEA AMONG FEMALES 15 TO 44 YEARS OLD
RANKED BY THREE-YEAR AVERAGE CRUDE CASE RATE
CALIFORNIA COUNTIES, 2009-2011
x x x 95% CONFIDENCE LIMITS
RANKORDER
COUNTYOF RESIDENCE
2010 FEMALEPOPULATION
15TO44 YRS OLD2009-2011
CASES (AVERAGE)CRUDE
CASE RATE LOWER UPPER
1 PLUMAS 2,742 0.0 - - -
2 MODOC 1,411 0.0 - - -
3 ALPINE 155 0.0 - - -
4 COLUSA 4,056 0.3 8.2 * 0.0 107.5
5 MONO 3,003 0.3 11.1 * 0.0 145.2
6 MARIPOSA 2,475 0.3 13.5 * 0.0 176.17 LASSEN 4,197 0.7 15.9 * 0.1 118.7
8 TRINITY 1,817 0.3 18.3 * 0.0 239.9
9 EL DORADO 28,533 8.0 28.0 * 12.1 55.2
10 SAN LUIS OBISPO 50,389 16.3 32.4 * 18.6 52.4
11 CALAVERAS 5,997 2.0 33.4 * 4.0 120.5
12 SANTA BARBARA 91,164 31.0 34.0 23.1 48.3
13 TEHAMA 10,922 4.0 36.6 * 10.0 93.8
14 NEVADA 13,636 5.0 36.7 * 11.9 85.6
15 SONOMA 91,374 35.3 38.7 27.0 53.7
16 SAN MATEO 149,589 59.0 39.4 30.0 50.9
17 NAPA 25,296 10.0 39.5 * 19.0 72.7
18 DEL NORTE 4,193 1.7 39.7 * 3.5 159.5
19 YOLO 49,759 20.7 41.5 25.6 63.7
20 SANTA CRUZ 55,892 23.7 42.3 27.0 63.2
21 IMPERIAL 35,001 15.0 42.9 * 24.0 70.722 ORANGE 647,871 292.0 45.1 39.9 50.2
23 MONTEREY 85,396 38.7 45.3 32.1 62.0
24 INYO 2,856 1.3 46.7 * 2.6 214.9
25 VENTURA 166,306 78.3 47.1 37.3 58.8
26 MARIN 41,421 20.0 48.3 29.5 74.6
27 SAN BENITO 11,262 5.7 50.3 * 17.8 111.9
28 PLACER 63,786 33.0 51.7 35.6 72.7
29 TULARE 92,123 47.7 51.7 38.1 68.7
30 HUMBOLDT 26,796 14.0 52.2 * 28.6 87.7
31 AMADOR 4,590 2.7 58.1 * 10.5 180.0
32 SANTA CLARA 381,031 228.0 59.8 52.1 67.6
33 KINGS 28,851 17.3 60.1 * 35.2 95.8
34 TUOLUMNE 7,325 4.7 63.7 * 19.7 152.9
35 MERCED 54,426 35.3 64.9 45.3 90.1
36 GLENN 5,113 3.3 65.2 * 15.0 181.2
37 STANISLAUS 107,534 70.7 65.7 51.3 82.9
38 SUTTER 18,755 12.3 65.8 * 34.3 114.0
39 BUTTE 43,326 28.7 66.2 44.2 95.2
40 MENDOCINO 14,772 10.0 67.7 * 32.5 124.5
41 SISKIYOU 6,378 4.7 73.2 * 22.6 175.6
42 RIVERSIDE 454,653 366.7 80.6 72.4 88.9
43 YUBA 14,865 12.0 80.7 * 41.7 141.0
44 SAN DIEGO 677,783 564.0 83.2 76.3 90.1
45 SHASTA 30,632 26.3 86.0 56.3 125.7
46 SAN FRANCISCO 195,228 221.7 113.5 98.6 128.5
CALIFORNIA 7,955,836 10,014.7 125.9 123.4 128.3
47 SAN BERNARDINO 445,396 636.3 142.9 131.8 154.0
48 MADERA 33,112 49.0 148.0 109.5 195.6
49 LOS ANGELES 2,205,646 3,372.0 152.9 147.7 158.0
50 SIERRA 411 0.7 162.1 * 0.8 1211.1
51 LAKE 10,083 19.3 191.7 * 116.0 298.3
52 CONTRA COSTA 209,065 438.0 209.5 189.9 229.1
53 SOLANO 82,335 177.3 215.4 183.7 247.1
54 ALAMEDA 339,081 736.0 217.1 201.4 232.7
55 SAN JOAQUIN 142,148 325.0 228.6 203.8 253.5
56 FRESNO 198,633 485.3 244.3 222.6 266.1
HEALTHY PEOPLE 2020 NATIONAL OBJECTIVE STD-6.1 257.0
57 KERN 170,838 462.3 270.6 246.0 295.3
58 SACRAMENTO 304,409 940.7 309.0 289.3 328.8

7/28/2019 2013 County Health Status Profiles
http://slidepdf.com/reader/full/2013-county-health-status-profiles 54/102
County Health Status Profles 2013California Department of Public Health 47
REPORTED INCIDENCE OF GONORRHEAAMONG MALES AGES 15 TO 44 YEARS OLD, 2009-2011
he crude case rate of reported gonorrhea cases among males aged 15 to 44 for California was 164.9 cases per 100,000 population or approximately one reportedgonorrhea case for every 606.4 persons. This rate was based on a 2009 through
2011 three-year average reported number of cases equaling 13,629.3 and a populationcount of 8,264,462 males aged 15 to 44 as of July 1, 2010.
Among counties with reliable rates, the crude case rate ranged from 690.1 inSan Francisco County to 34.9 in San Luis Obispo County, a factor of 19.8 to 1.
Twenty-five counties with reliable crude case rates met the Healthy People 2020
National Objective STD-6.2 of no more than 198.0 new gonorrhea cases per 100,000population for males, aged 15-44. An additional twenty-four counties with unreliablerates and five counties with no new gonorrhea cases met the objective. The statewidegonorrhea crude case rate met the national objective.
The California average crude case rate for the 2006-2008 period was 174.9.
T

7/28/2019 2013 County Health Status Profiles
http://slidepdf.com/reader/full/2013-county-health-status-profiles 55/102
County Health Status Profles 2013California Department of Public Health 48
State of California, Department of Finance, Race/Hispanics Population with Age and Gender Detail, 2000–2010. Sacramento, California, September 201Sources: California Department of Public Health, STD Control Branch, Data Request, August, 2012.
Note: Counties were rank ordered first by increasing case rate (calculated to 15 decimal places), second by decreasing size of the population.- Rates, percentages, and confidence limits are not calculated for zero events.* Rates are deemed unreliable based on fewer than 20 data elements.
TABLE 22M
REPORTED INCIDENCE OF GONORRHEA AMONG MALES 15 TO 44 YEARS OLD
RANKED BY THREE-YEAR AVERAGE CRUDE CASE RATE
CALIFORNIA COUNTIES, 2009-2011
x x x 95% CONFIDENCE LIMITS
RANKORDER
COUNTYOF RESIDENCE
2010 MALEPOPULATION
15 TO44 YRS OLD2009-2011
CASES (AVERAGE)CRUDE
CASE RATE LOWER UPPER
1 DEL NORTE 7,328 0.0 - - -
2 MARIPOSA 2,568 0.0 - - -
3 MODOC 1,533 0.0 - - -
4 SIERRA 431 0.0 - - -
5 ALPINE 168 0.0 - - -
6 MONO 3,452 0.3 9.7 * 0.0 126.3
7 LASSEN 13,445 1.3 9.9 * 0.6 45.7
8 NEVADA 14,632 2.0 13.7 * 1.7 49.4
9 EL DORADO 30,177 6.0 19.9 * 7.3 43.3
10 TUOLUMNE 10,539 2.3 22.1 * 3.4 73.5
11 COLUSA 4,394 1.0 22.8 * 0.6 126.8
12 GLENN 5,344 1.3 25.0 * 1.4 114.9
13 NAPA 26,549 8.3 31.4 * 13.8 61.0
14 AMADOR 7,265 2.3 32.1 * 4.9 106.7
15 IMPERIAL 41,253 13.3 32.3 * 17.4 54.9
16 SAN BENITO 11,328 3.7 32.4 * 8.2 86.1
17 TRINITY 2,058 0.7 32.4 * 0.2 242.0
18 YUBA 15,347 5.0 32.6 * 10.6 76.0
19 INYO 3,032 1.0 33.0 * 0.8 183.8
20 KINGS 43,326 15.0 34.6 * 19.4 57.1
21 SAN LUIS OBISPO 60,143 21.0 34.9 21.6 53.422 TEHAMA 11,432 4.0 35.0 * 9.5 89.6
23 CALAVERAS 6,389 2.3 36.5 * 5.5 121.3
24 MENDOCINO 16,390 6.0 36.6 * 13.4 79.7
25 TULARE 96,105 39.3 40.9 29.1 55.9
26 SANTA BARBARA 99,522 41.0 41.2 29.6 55.9
27 MONTEREY 98,681 45.7 46.3 33.8 61.8
28 PLACER 63,890 30.7 48.0 32.5 68.3
29 VENTURA 173,544 83.3 48.0 38.3 59.5
30 HUMBOLDT 29,616 14.3 48.4 * 26.7 80.7
31 BUTTE 46,567 22.7 48.7 30.7 73.3
32 SANTA CRUZ 58,472 29.0 49.6 33.2 71.2
33 MERCED 57,471 31.0 53.9 36.6 76.6
34 SONOMA 96,170 53.0 55.1 41.3 72.1
35 YOLO 48,355 26.7 55.1 36.2 80.4
36 PLUMAS 2,902 1.7 57.4 * 5.1 230.537 MADERA 30,000 17.3 57.8 * 33.9 92.1
38 SUTTER 19,379 11.7 60.2 * 30.8 106.0
39 STANISLAUS 109,205 68.3 62.6 48.6 79.3
40 SHASTA 31,185 21.3 68.4 42.5 104.2
41 SISKIYOU 6,943 5.0 72.0 * 23.4 168.1
42 RIVERSIDE 464,379 344.7 74.2 66.4 82.1
43 SANTA CLARA 401,630 298.7 74.4 65.9 82.8
44 SAN MATEO 151,360 127.7 84.3 69.7 99.0
45 ORANGE 659,562 567.7 86.1 79.0 93.1
46 MARIN 43,994 40.3 91.7 65.6 124.7
47 SAN BERNARDINO 451,848 520.3 115.2 105.3 125.1
48 CONTRA COSTA 205,870 270.3 131.3 115.7 147.0
49 LAKE 10,751 15.3 142.6 * 80.4 234.0
50 SOLANO 86,163 136.3 158.2 131.7 184.8
CALIFORNIA 8,264,462 13,629.3 164.9 162.1 167.7
51 SAN DIEGO 733,343 1,210.3 165.0 155.7 174.3
52 FRESNO 206,595 369.0 178.6 160.4 196.8
53 SAN JOAQUIN 146,295 270.3 184.8 162.8 206.8
54 KERN 198,657 372.7 187.6 168.5 206.6
HEALTHY PEOPLE 2020 NATIONAL OBJECTIVE STD-6.2 198.0
55 LOS ANGELES 2,248,341 5,436.0 241.8 235.4 248.2
56 ALAMEDA 336,029 817.0 243.1 226.5 259.8
57 SACRAMENTO 305,842 763.3 249.6 231.9 267.3
58 SAN FRANCISCO 207,273 1,430.3 690.1 654.3 725.8

7/28/2019 2013 County Health Status Profiles
http://slidepdf.com/reader/full/2013-county-health-status-profiles 56/102

7/28/2019 2013 County Health Status Profiles
http://slidepdf.com/reader/full/2013-county-health-status-profiles 57/102
County Health Status Profles 2013California Department of Public Health 50
State of California, Department of Finance, Race/Hispanics Population with Age and Gender Detail, 2000–2010. Sacramento, California, September 201Sources: California Department of Public Health, Tuberculosis Control Branch, Data Request, September, 2012.
Note: Counties were rank ordered first by increasing case rate (calculated to 15 decimal places), second by decreasing size of the population.- Rates, percentages, and confidence limits are not calculated for zero events.* Rates are deemed unreliable based on fewer than 20 data elements.
TABLE 23REPORTED INCIDENCE OF TUBERCULOSIS
RANKED BY THREE-YEAR AVERAGE CRUDE CASE RATE
CALIFORNIA COUNTIES, 2009-2011
x x x 95% CONFIDENCE LIMITS
RANKORDER
COUNTYOF RESIDENCE
2010POPULATION
2009-2011CASES (AVERAGE)
CRUDECASE RATE LOWER UPPER
1 SISKIYOU 44,951 0.0 - - -
2 LASSEN 34,730 0.0 - - -
3 DEL NORTE 28,577 0.0 - - -
4 PLUMAS 19,993 0.0 - - -
5 MARIPOSA 18,119 0.0 - - -
6 MONO 14,114 0.0 - - -7 TRINITY 13,883 0.0 - - -
8 MODOC 9,676 0.0 - - -
9 SIERRA 3,231 0.0 - - -
10 ALPINE 1,147 0.0 - - -
11 NEVADA 98,484 0.3 0.3 * 0.0 4.4
12 SHASTA 177,480 1.0 0.6 * 0.0 3.1
13 BUTTE 220,024 1.3 0.6 * 0.0 2.8
14 TUOLUMNE 54,961 0.3 0.6 * 0.0 7.9
15 AMADOR 37,907 0.3 0.9 * 0.0 11.5
16 EL DORADO 181,183 1.7 0.9 * 0.1 3.7
17 YUBA 72,336 0.7 0.9 * 0.0 6.9
18 HUMBOLDT 134,575 1.3 1.0 * 0.1 4.6
HEALTHY PEOPLE 2020 NATIONAL OBJECTIVE IID-29 1.0
19 GLENN 28,188 0.3 1.2 * 0.0 15.5
20 LAKE 64,466 1.0 1.6 * 0.0 8.621 TEHAMA 63,635 1.0 1.6 * 0.0 8.8
22 SAN LUIS OBISPO 269,753 4.3 1.6 * 0.5 4.0
23 PLACER 350,609 5.7 1.6 * 0.6 3.6
24 INYO 18,627 0.3 1.8 * 0.0 23.4
25 MENDOCINO 87,939 1.7 1.9 * 0.2 7.6
26 SONOMA 484,258 10.3 2.1 * 1.0 3.9
27 CALAVERAS 45,258 1.0 2.2 * 0.1 12.3
28 SAN BENITO 55,350 1.3 2.4 * 0.1 11.1
29 STANISLAUS 515,311 15.0 2.9 * 1.6 4.8
30 MERCED 256,386 7.7 3.0 * 1.3 6.0
31 KINGS 153,020 4.7 3.0 * 0.9 7.3
32 SANTA CRUZ 263,174 8.3 3.2 * 1.4 6.2
33 SAN BERNARDINO 2,038,771 64.7 3.2 2.4 4.0
34 RIVERSIDE 2,191,800 70.3 3.2 2.5 4.1
35 SUTTER 94,800 3.3 3.5 * 0.8 9.836 YOLO 200,995 7.3 3.6 * 1.5 7.4
37 CONTRA COSTA 1,052,192 46.7 4.4 3.3 5.9
38 KERN 841,744 38.7 4.6 3.3 6.3
39 COLUSA 21,452 1.0 4.7 * 0.1 26.0
40 VENTURA 825,378 38.7 4.7 3.3 6.4
41 NAPA 136,681 6.7 4.9 * 1.9 10.2
42 MARIN 252,767 12.3 4.9 * 2.5 8.5
43 MONTEREY 415,825 20.7 5.0 3.1 7.6
44 MADERA 151,160 7.7 5.1 * 2.1 10.1
45 TULARE 443,638 23.0 5.2 3.3 7.8
46 SACRAMENTO 1,420,447 79.3 5.6 4.4 7.0
47 SANTA BARBARA 424,291 24.7 5.8 3.8 8.6
48 FRESNO 933,075 55.7 6.0 4.5 7.8
49 SOLANO 413,220 25.7 6.2 4.0 9.1
CALIFORNIA 37,318,481 2,375.3 6.4 6.1 6.6
50 ORANGE 3,017,089 210.0 7.0 6.0 7.9
51 LOS ANGELES 9,827,070 729.3 7.4 6.9 8.0
52 SAN DIEGO 3,104,581 236.0 7.6 6.6 8.6
53 SAN JOAQUIN 686,761 55.3 8.1 6.1 10.5
54 SAN MATEO 719,582 61.3 8.5 6.5 10.9
55 ALAMEDA 1,513,493 159.7 10.5 8.9 12.2
56 SANTA CLARA 1,787,553 191.3 10.7 9.2 12.2
57 SAN FRANCISCO 807,177 107.0 13.3 10.7 15.8
58 IMPERIAL 175,594 29.3 16.7 11.2 23.9

7/28/2019 2013 County Health Status Profiles
http://slidepdf.com/reader/full/2013-county-health-status-profiles 58/102
County Health Status Profles 2013California Department of Public Health 51
INFANT MORTALITY, ALL RACE/ETHNIC GROUPS, 2008-2010
he birth cohort infant death rate for California was 5.0 deaths per 1,000 live births,a risk of dying equivalent to approximately one infant death for every 198.7 births.This rate was based on a 2008 through 2010 three-year average number of infant
deaths equaling 2,666.0 and 529,617.7 live births.
Among counties with reliable rates, the birth cohort infant death rate ranged from6.7 in San Bernardino County and Fresno County to 3.1 in San Mateo County, afactor of 2.2 to 1.
Seventeen counties with reliable infant death rates and California as a whole met the
Healthy People 2020 National Objective MICH-1.3 of no more than 6.0 infant deaths per 1,000 birth cohort live births. An additional twenty-five counties with unreliable ratesand two counties with no infant deaths met the objective.
The California birth cohort infant death rate for the 2005-2007 period was 5.3.
T

7/28/2019 2013 County Health Status Profiles
http://slidepdf.com/reader/full/2013-county-health-status-profiles 59/102
County Health Status Profles 2013California Department of Public Health 52
Source: California Department of Public Health: 2008-2010 Birth Cohort-Perinatal Outcome Files.Note: Counties were rank ordered first by increasing birth cohort death rate (calculated to 15 decimal places), second by decreasing total number of live births.
- Rates, percentages, and confidence limits are not calculated for zero events.* Rates are deemed unreliable based on fewer than 20 data elements.
TABLE 24A
INFANT MORTALITY, ALL RACE/ETHNIC GROUPS
RANKED BY THREE-YEAR AVERAGE BIRTH COHORT INFANT DEATH RATE
CALIFORNIA COUNTIES, 2008-2010
x THREE-YEAR AVERAGE 95% CONFIDENCE LIMITS
RANKORDER
COUNTYOF RESIDENCE
LIVEBIRTHS
INFANTDEATHS
BIRTH COHORTINFANT
DEATHRATE LOWER UPPER
1 SIERRA 22.0 0.0 - - -
2 ALPINE 7.0 0.0 - - -
3 PLUMAS 166.3 0.3 2.0 * 0.0 26.2
4 AMADOR 285.0 0.7 2.3 * 0.0 17.5
5 SANTA CRUZ 3,344.7 9.3 2.8 * 1.3 5.2
6 TRINITY 116.7 0.3 2.9 * 0.0 37.4
7 TUOLUMNE 466.3 1.3 2.9 * 0.2 13.2
8 GLENN 443.7 1.3 3.0 * 0.2 13.8
9 SAN MATEO 9,471.7 29.0 3.1 2.1 4.4
10 YOLO 2,526.3 8.0 3.2 * 1.4 6.2
11 MARIN 2,528.0 8.3 3.3 * 1.5 6.4
12 NEVADA 808.7 2.7 3.3 * 0.6 10.2
13 SANTA CLARA 25,291.0 85.7 3.4 2.7 4.2
14 PLACER 3,888.0 15.0 3.9 * 2.2 6.4
15 SAN FRANCISCO 8,905.0 35.7 4.0 2.8 5.6
16 ORANGE 40,381.3 162.7 4.0 3.4 4.6
17 IMPERIAL 3,146.7 13.7 4.3 * 2.4 7.3
18 CONTRA COSTA 12,724.7 55.3 4.3 3.3 5.7
19 ALAMEDA 20,203.3 88.0 4.4 3.5 5.4
20 SONOMA 5,613.3 25.0 4.5 2.9 6.6
21 INYO 219.0 1.0 4.6 * 0.1 25.4
22 SAN DIEGO 45,531.7 208.0 4.6 3.9 5.2
23 CALAVERAS 352.3 1.7 4.7 * 0.4 19.0
24 SAN BENITO 767.7 3.7 4.8 * 1.2 12.7
25 SAN LUIS OBISPO 2,696.3 13.0 4.8 * 2.6 8.2
26 MONTEREY 7,089.7 34.3 4.8 3.4 6.8
27 EL DORADO 1,718.3 8.3 4.8 * 2.1 9.4
28 HUMBOLDT 1,569.0 7.7 4.9 * 2.1 9.8
29 VENTURA 11,528.3 56.7 4.9 3.7 6.4
30 BUTTE 2,471.7 12.3 5.0 * 2.6 8.7
31 SHASTA 2,130.7 10.7 5.0 * 2.5 9.0
CALIFORNIA 529,617.7 2,666.0 5.0 4.8 5.2
32 SANTA BARBARA 6,060.0 30.7 5.1 3.4 7.2
33 LOS ANGELES 140,259.7 719.7 5.1 4.8 5.5
34 TULARE 8,351.7 44.3 5.3 3.9 7.1
35 MADERA 2,453.3 13.3 5.4 * 2.9 9.236 KINGS 2,620.7 14.3 5.5 * 3.0 9.1
37 STANISLAUS 8,099.0 44.3 5.5 4.0 7.3
38 RIVERSIDE 31,718.3 174.3 5.5 4.7 6.3
39 YUBA 1,244.3 7.0 5.6 * 2.3 11.6
40 COLUSA 355.3 2.0 5.6 * 0.7 20.3
41 SACRAMENTO 20,630.0 118.3 5.7 4.7 6.8
42 SUTTER 1,420.3 8.3 5.9 * 2.6 11.4
43 MERCED 4,359.7 25.7 5.9 3.8 8.6
44 NAPA 1,616.3 9.7 6.0 * 2.8 11.1
HEALTHY PEOPLE 2020 NATIONAL OBJECTIVE MICH-1.3 6.0
45 LASSEN 323.3 2.0 6.2 * 0.7 22.3
46 SOLANO 5,349.3 33.3 6.2 4.3 8.7
47 SAN JOAQUIN 10,832.3 69.0 6.4 5.0 8.1
48 KERN 14,853.0 94.7 6.4 5.2 7.8
49 FRESNO 16,440.3 109.3 6.7 5.4 7.950 SAN BERNARDINO 32,384.3 216.7 6.7 5.8 7.6
51 MARIPOSA 149.3 1.0 6.7 * 0.2 37.3
52 MODOC 98.7 0.7 6.8 * 0.0 50.5
53 DEL NORTE 339.3 2.3 6.9 * 1.0 22.8
54 LAKE 718.0 5.0 7.0 * 2.3 16.3
55 MENDOCINO 1,111.0 8.3 7.5 * 3.3 14.6
56 TEHAMA 790.7 6.7 8.4 * 3.3 17.7
57 SISKIYOU 470.0 4.0 8.5 * 2.3 21.8
58 MONO 155.0 1.3 8.6 * 0.5 39.6

7/28/2019 2013 County Health Status Profiles
http://slidepdf.com/reader/full/2013-county-health-status-profiles 60/102
County Health Status Profles 2013California Department of Public Health 53
ASIAN/PACIFIC ISLANDER INFANT MORTALITY, 2008-2010
he Asian/Pacific Islander birth cohort infant death rate for California was4.0 deaths per 1,000 live births, a risk of dying equivalent to approximately oneinfant death for every 250.0 births. This rate was based on a 2008 through 2010
three-year average number of infant deaths equaling 260.7 infant deaths and65,164.3 live births.
Among counties with reliable rates, the birth cohort infant death rate for Asian/Pacific Islanders ranged from 4.0 in Los Angeles County to 3.0 inOrange County, a factor of 1.3 to 1.
Three counties with reliable infant death rates and California as a whole met the HealthyPeople 2020 National Objective MICH-1.3 of no more than 6.0 infant deaths per 1,000 birth cohort live births. An additional twenty-three counties with unreliable ratesand twenty-four counties with no infant deaths met the objective.
The California Asian/Pacific Islander birth cohort infant death rate for the 2005-2007period was 4.5.
T

7/28/2019 2013 County Health Status Profiles
http://slidepdf.com/reader/full/2013-county-health-status-profiles 61/102
County Health Status Profles 2013California Department of Public Health 54
Source: California Department of Public Health: 2008-2010 Birth Cohort-Perinatal Outcome Files.Note: Counties were rank ordered first by increasing birth cohort death rate (calculated to 15 decimal places), second by decreasing total number of live births.
- Rates, percentages, and confidence limits are not calculated for zero events.* Rates are deemed unreliable based on fewer than 20 data elements.
TABLE 24B
ASIAN/PACIFIC ISLANDER INFANT MORTALITY
RANKED BY THREE-YEAR AVERAGE BIRTH COHORT INFANT DEATH RATE
CALIFORNIA COUNTIES, 2008-2010
x THREE-YEAR AVERAGE 95% CONFIDENCE LIMITS
RANKORDER
COUNTYOF RESIDENCE
LIVEBIRTHS
INFANTDEATHS
BIRTH COHORTINFANT
DEATHRATE LOWER UPPER
1 KINGS 90.7 0.0 - - -
2 SANTA CRUZ 90.0 0.0 - - -
3 SAN LUIS OBISPO 78.7 0.0 - - -
4 HUMBOLDT 48.3 0.0 - - -
5 DEL NORTE 19.7 0.0 - - -
6 MENDOCINO 17.3 0.0 - - -
7 NEVADA 15.0 0.0 - - -
8 SAN BENITO 13.7 0.0 - - -
9 GLENN 13.0 0.0 - - -
10 LASSEN 8.7 0.0 - - -
11 SISKIYOU 8.7 0.0 - - -
12 TUOLUMNE 8.0 0.0 - - -
13 TEHAMA 7.7 0.0 - - -
14 INYO 4.3 0.0 - - -
15 AMADOR 4.0 0.0 - - -
16 COLUSA 4.0 0.0 - - -
17 MONO 3.3 0.0 - - -
18 CALAVERAS 2.0 0.0 - - -
19 TRINITY 1.3 0.0 - - -
20 PLUMAS 1.0 0.0 - - -
21 MODOC 0.7 0.0 - - -
22 SIERRA 0.7 0.0 - - -
23 MARIPOSA 0.3 0.0 - - -
24 ALPINE 0.0 0.0 - - -
25 YOLO 291.0 0.3 1.1 * 0.0 15.0
26 CONTRA COSTA 1,935.7 5.0 2.6 * 0.8 6.0
27 SAN FRANCISCO 2,682.0 7.0 2.6 * 1.0 5.4
28 ORANGE 6,838.0 20.7 3.0 1.9 4.6
29 YUBA 110.0 0.3 3.0 * 0.0 39.6
30 SANTA CLARA 8,624.3 27.0 3.1 2.1 4.6
31 ALAMEDA 5,578.7 18.7 3.3 * 2.0 5.2
32 SAN MATEO 2,635.0 9.3 3.5 * 1.6 6.6
33 SAN DIEGO 4,597.3 17.7 3.8 * 2.3 6.1
34 LOS ANGELES 16,141.0 65.3 4.0 3.1 5.2
CALIFORNIA 65,164.3 260.7 4.0 3.5 4.5
35 SANTA BARBARA 225.7 1.0 4.4 * 0.1 24.736 EL DORADO 75.0 0.3 4.4 * 0.0 58.1
37 SHASTA 75.0 0.3 4.4 * 0.0 58.1
38 PLACER 291.3 1.3 4.6 * 0.3 21.1
39 KERN 506.7 2.3 4.6 * 0.7 15.3
40 SUTTER 205.0 1.0 4.9 * 0.1 27.2
41 MARIN 198.3 1.0 5.0 * 0.1 28.1
42 SAN BERNARDINO 1,783.7 9.0 5.0 * 2.3 9.6
43 TULARE 261.3 1.3 5.1 * 0.3 23.5
44 SONOMA 259.7 1.3 5.1 * 0.3 23.6
45 STANISLAUS 447.7 2.3 5.2 * 0.8 17.3
46 VENTURA 762.3 4.0 5.2 * 1.4 13.4
47 NAPA 118.7 0.7 5.6 * 0.0 42.0
48 SACRAMENTO 3,486.0 19.7 5.6 * 3.4 8.7
49 BUTTE 172.7 1.0 5.8 * 0.1 32.3
50 RIVERSIDE 1,687.0 10.0 5.9 * 2.8 10.9HEALTHY PEOPLE 2020 NATIONAL OBJECTIVE MICH-1.3 6.0
51 SOLANO 764.3 4.7 6.1 * 1.9 14.6
52 SAN JOAQUIN 1,584.7 10.7 6.7 * 3.3 12.1
53 MERCED 339.0 2.3 6.9 * 1.0 22.9
54 FRESNO 1,689.7 11.7 6.9 * 3.5 12.2
55 MONTEREY 292.7 2.3 8.0 * 1.2 26.5
56 MADERA 32.3 0.3 10.3 * 0.0 134.8
57 IMPERIAL 22.3 0.3 14.9 * 0.0 195.1
58 LAKE 9.3 0.3 35.7 * 0.0 467.0

7/28/2019 2013 County Health Status Profiles
http://slidepdf.com/reader/full/2013-county-health-status-profiles 62/102
County Health Status Profles 2013California Department of Public Health 55
BLACK INFANT MORTALITY, 2008-2010
he Black birth cohort infant death rate for California was 11.0 deaths per 1,000 live births, a risk of dying equivalent to approximately one infant death for every 90.5 births. This rate was based on a 2008 through 2010 three-year
average number of infant deaths equaling 316.0 and 28,610.7 live births.
Among counties with reliable rates, the birth cohort infant death rate for Blacks rangedfrom 12.8 in San Bernardino County to 8.4 in Alameda County, a factor of 1.5 to 1.
No county with a reliable infant death rate met the Healthy People 2020 NationalObjective MICH-1.3 of no more than 6.0 infant deaths per 1,000 birth cohort live births.
Three counties with unreliable infant death rates and twenty-seven counties with noinfant deaths met the objective. The statewide Black infant death rate did not meet thenational objective.
The California Black birth cohort infant death rate for the 2005-2007 period was 12.4.
T

7/28/2019 2013 County Health Status Profiles
http://slidepdf.com/reader/full/2013-county-health-status-profiles 63/102
County Health Status Profles 2013California Department of Public Health 56
Source: California Department of Public Health: 2008-2010 Birth Cohort-Perinatal Outcome Files.Note: Counties were rank ordered first by increasing birth cohort death rate (calculated to 15 decimal places), second by decreasing total number of live births.
- Rates, percentages, and confidence limits are not calculated for zero events.* Rates are deemed unreliable based on fewer than 20 data elements.
TABLE 24C
BLACK INFANT MORTALITY
RANKED BY THREE-YEAR AVERAGE BIRTH COHORT INFANT DEATH RATE
CALIFORNIA COUNTIES, 2008-2010
x THREE-YEAR AVERAGE 95% CONFIDENCE LIMITS
RANKORDER
COUNTYOF RESIDENCE
LIVEBIRTHS
INFANTDEATHS
BIRTH COHORTINFANT
DEATHRATE LOWER UPPER
1 MADERA 32.0 0.0 - - -
2 IMPERIAL 22.7 0.0 - - -
3 SANTA CRUZ 18.7 0.0 - - -
4 NAPA 15.3 0.0 - - -
5 HUMBOLDT 12.0 0.0 - - -
6 EL DORADO 9.3 0.0 - - -
7 LAKE 8.7 0.0 - - -
8 MENDOCINO 5.3 0.0 - - -
9 SISKIYOU 4.0 0.0 - - -
10 TEHAMA 3.7 0.0 - - -
11 PLUMAS 2.0 0.0 - - -
12 COLUSA 1.7 0.0 - - -
13 NEVADA 1.7 0.0 - - -
14 SAN BENITO 1.7 0.0 - - -
15 CALAVERAS 1.3 0.0 - - -
16 GLENN 1.3 0.0 - - -
17 INYO 1.0 0.0 - - -
18 LASSEN 1.0 0.0 - - -
19 TUOLUMNE 1.0 0.0 - - -
20 MARIPOSA 0.7 0.0 - - -
21 MONO 0.7 0.0 - - -
22 AMADOR 0.3 0.0 - - -
23 DEL NORTE 0.3 0.0 - - -
24 MODOC 0.3 0.0 - - -
25 ALPINE 0.0 0.0 - - -
26 SIERRA 0.0 0.0 - - -
27 TRINITY 0.0 0.0 - - -
28 VENTURA 115.0 0.3 2.9 * 0.0 37.9
29 MONTEREY 88.7 0.3 3.8 * 0.0 49.2
30 SANTA BARBARA 59.7 0.3 5.6 * 0.0 73.0
HEALTHY PEOPLE 2020 NATIONAL OBJECTIVE MICH-1.3 6.0
31 YOLO 49.7 0.3 6.7 * 0.0 87.8
32 CONTRA COSTA 1,166.3 8.0 6.9 * 3.0 13.5
33 SANTA CLARA 496.3 3.7 7.4 * 1.9 19.7
34 ORANGE 439.7 3.3 7.6 * 1.7 21.1
35 ALAMEDA 2,395.0 20.0 8.4 5.1 12.936 SAN MATEO 157.0 1.3 8.5 * 0.5 39.1
37 SOLANO 713.0 6.3 8.9 * 3.4 19.0
38 SONOMA 69.3 0.7 9.6 * 0.0 71.8
39 SAN DIEGO 1,973.3 19.0 9.6 * 5.8 15.0
40 PLACER 34.3 0.3 9.7 * 0.0 126.9
41 LOS ANGELES 10,628.7 117.3 11.0 9.0 13.0
CALIFORNIA 28,610.7 316.0 11.0 9.8 12.3
42 RIVERSIDE 1,632.7 18.7 11.4 * 6.8 17.9
43 SACRAMENTO 2,162.3 25.0 11.6 7.5 17.1
44 SAN BERNARDINO 2,718.0 34.7 12.8 8.9 17.8
45 KERN 808.7 10.3 12.8 * 6.2 23.3
46 FRESNO 835.7 11.0 13.2 * 6.6 23.6
47 SUTTER 25.0 0.3 13.3 * 0.0 174.3
48 KINGS 99.7 1.3 13.4 * 0.7 61.6
49 STANISLAUS 161.0 2.3 14.5 * 2.2 48.150 TULARE 89.0 1.3 15.0 * 0.8 69.0
51 MARIN 44.3 0.7 15.0 * 0.1 112.3
52 SHASTA 21.0 0.3 15.9 * 0.0 207.5
53 SAN FRANCISCO 503.3 8.7 17.2 * 7.7 33.1
54 SAN JOAQUIN 786.3 14.0 17.8 * 9.7 29.9
55 MERCED 115.7 2.7 23.1 * 4.2 71.4
56 BUTTE 32.0 1.3 41.7 * 2.3 191.9
57 SAN LUIS OBISPO 15.0 0.7 44.4 * 0.2 332.1
58 YUBA 28.3 1.3 47.1 * 2.6 216.7

7/28/2019 2013 County Health Status Profiles
http://slidepdf.com/reader/full/2013-county-health-status-profiles 64/102
County Health Status Profles 2013California Department of Public Health 57
HISPANIC INFANT MORTALITY, 2008-2010
he Hispanic birth cohort infant death rate for California was 4.9 deaths per 1,000 live births, a risk of dying equivalent to approximately one infant death for every 202.5 births. This rate was based on a 2008 through 2010 three-year
average number of infant deaths equaling 1,341.0 and 271,583.0 live births.
Among counties with reliable rates, the birth cohort infant death rate for Hispanicsranged from 6.5 in Stanislaus County to 3.5 in Santa Clara County, a factor of 1.8 to 1.
Twelve counties with reliable infant death rates and California as a whole met theHealthy People 2020 National Objective MICH-1.3 of no more than 6.0 infant deaths per
1,000 birth cohort live births. An additional twenty-two counties with unreliable ratesand eight counties with no infant deaths met the objective.
The California Hispanic birth cohort infant death rate for the 2005-2007 period was 5.2.
T

7/28/2019 2013 County Health Status Profiles
http://slidepdf.com/reader/full/2013-county-health-status-profiles 65/102
County Health Status Profles 2013California Department of Public Health 58
Source: California Department of Public Health: 2008-2010 Birth Cohort-Perinatal Outcome Files.Note: Counties were rank ordered first by increasing birth cohort death rate (calculated to 15 decimal places), second by decreasing total number of live births.
- Rates, percentages, and confidence limits are not calculated for zero events.* Rates are deemed unreliable based on fewer than 20 data elements.
TABLE 24D
HISPANIC INFANT MORTALITY
RANKED BY THREE-YEAR AVERAGE BIRTH COHORT INFANT DEATH RATE
CALIFORNIA COUNTIES, 2008-2010
x THREE-YEAR AVERAGE 95% CONFIDENCE LIMITS
RANKORDER
COUNTYOF RESIDENCE
LIVEBIRTHS
INFANTDEATHS
BIRTH COHORTINFANT
DEATHRATE LOWER UPPER
1 AMADOR 48.3 0.0 - - -
2 CALAVERAS 47.7 0.0 - - -
3 LASSEN 44.7 0.0 - - -
4 MARIPOSA 18.7 0.0 - - -
5 MODOC 12.0 0.0 - - -
6 TRINITY 9.3 0.0 - - -
7 SIERRA 3.0 0.0 - - -
8 ALPINE 1.7 0.0 - - -
9 GLENN 235.7 0.3 1.4 * 0.0 18.5
10 SAN MATEO 2,837.7 8.0 2.8 * 1.2 5.6
11 SANTA CLARA 9,306.0 33.0 3.5 2.4 5.0
12 SANTA CRUZ 1,939.3 7.0 3.6 * 1.5 7.4
13 PLACER 737.0 2.7 3.6 * 0.7 11.2
14 YOLO 1,052.0 4.0 3.8 * 1.0 9.7
15 IMPERIAL 2,838.7 11.0 3.9 * 1.9 6.9
16 COLUSA 256.3 1.0 3.9 * 0.1 21.7
17 SAN LUIS OBISPO 975.3 4.0 4.1 * 1.1 10.5
18 SONOMA 2,426.0 10.0 4.1 * 2.0 7.6
19 ALAMEDA 6,229.3 26.3 4.2 2.8 6.2
20 SANTA BARBARA 4,056.3 17.3 4.3 * 2.5 6.8
21 SAN DIEGO 19,954.0 85.7 4.3 3.4 5.3
22 MONTEREY 5,343.0 24.3 4.6 2.9 6.8
23 SHASTA 219.0 1.0 4.6 * 0.1 25.4
24 MERCED 2,819.0 13.0 4.6 * 2.5 7.9
25 CONTRA COSTA 4,578.0 21.3 4.7 2.9 7.1
26 MADERA 1,788.0 8.3 4.7 * 2.1 9.1
27 ORANGE 20,420.0 96.0 4.7 3.8 5.7
28 RIVERSIDE 18,962.0 90.0 4.7 3.8 5.8
29 LOS ANGELES 86,928.0 422.3 4.9 4.4 5.3
30 SAN JOAQUIN 5,396.3 26.7 4.9 3.2 7.2
CALIFORNIA 271,583.0 1,341.0 4.9 4.7 5.2
31 MENDOCINO 402.7 2.0 5.0 * 0.6 17.9
32 INYO 66.0 0.3 5.1 * 0.0 66.0
33 TULARE 6,054.7 30.7 5.1 3.4 7.2
34 NEVADA 130.7 0.7 5.1 * 0.0 38.1
35 SACRAMENTO 5,940.3 30.7 5.2 3.5 7.336 MARIN 745.0 4.0 5.4 * 1.5 13.7
37 DEL NORTE 61.7 0.3 5.4 * 0.0 70.7
38 SAN FRANCISCO 1,838.3 10.0 5.4 * 2.6 10.0
39 KINGS 1,570.0 8.7 5.5 * 2.5 10.6
40 HUMBOLDT 237.3 1.3 5.6 * 0.3 25.9
41 VENTURA 6,996.0 39.3 5.6 4.0 7.7
42 SAN BENITO 568.3 3.3 5.9 * 1.3 16.3
HEALTHY PEOPLE 2020 NATIONAL OBJECTIVE MICH-1.3 6.0
43 SAN BERNARDINO 19,072.7 115.7 6.1 5.0 7.2
44 KERN 8,942.7 55.0 6.2 4.6 8.0
45 SOLANO 1,781.0 11.0 6.2 * 3.1 11.1
46 NAPA 857.7 5.3 6.2 * 2.1 14.1
47 BUTTE 482.0 3.0 6.2 * 1.3 18.2
48 FRESNO 9,924.3 62.0 6.2 4.8 8.0
49 EL DORADO 370.3 2.3 6.3 * 1.0 20.950 STANISLAUS 4,398.0 28.7 6.5 4.4 9.4
51 SUTTER 558.3 3.7 6.6 * 1.7 17.5
52 YUBA 384.7 2.7 6.9 * 1.2 21.5
53 MONO 78.3 0.7 8.5 * 0.0 63.6
54 TEHAMA 269.3 2.3 8.7 * 1.3 28.8
55 TUOLUMNE 68.7 0.7 9.7 * 0.0 72.5
56 LAKE 198.7 2.0 10.1 * 1.2 36.4
57 SISKIYOU 81.0 1.0 12.3 * 0.3 68.8
58 PLUMAS 22.0 0.3 15.2 * 0.0 198.1

7/28/2019 2013 County Health Status Profiles
http://slidepdf.com/reader/full/2013-county-health-status-profiles 66/102
County Health Status Profles 2013California Department of Public Health 59
WHITE INFANT MORTALITY, 2008-2010
he White birth cohort infant death rate for California was 4.2 deaths per 1,000 livebirths, a risk of dying equivalent to approximately one infant death for every236.2 births. This rate was based on a 2008 through 2010 three-year average
number of infant deaths equaling 606.0 and 143,140.3 live births.
Among counties with reliable rates, the birth cohort infant death rate for Whites rangedfrom 6.1 in Kern County and San Bernardino County to 2.9 in Orange County, a factor of 2.1 to 1.
Five counties with reliable infant death rates and California as a whole met the Healthy
People 2020 National Objective MICH-1.3 of no more than 6.0 infant deaths per 1,000birth cohort live births. An additional thirty-seven counties with unreliable rates and threecounties with no infant deaths met the objective.
The California White birth cohort infant death rate for the 2005-2007 period was 4.8.
T

7/28/2019 2013 County Health Status Profiles
http://slidepdf.com/reader/full/2013-county-health-status-profiles 67/102
County Health Status Profles 2013California Department of Public Health 60
Source: California Department of Public Health: 2008-2010 Birth Cohort-Perinatal Outcome Files.Note: Counties were rank ordered first by increasing birth cohort death rate (calculated to 15 decimal places), second by decreasing total number of live births.
- Rates, percentages, and confidence limits are not calculated for zero events.* Rates are deemed unreliable based on fewer than 20 data elements.
TABLE 24E
WHITE INFANT MORTALITY
RANKED BY THREE-YEAR AVERAGE BIRTH COHORT INFANT DEATH RATE
CALIFORNIA COUNTIES, 2008-2010
x THREE-YEAR AVERAGE 95% CONFIDENCE LIMITS
RANKORDER
COUNTYOF RESIDENCE
LIVEBIRTHS
INFANTDEATHS
BIRTH COHORTINFANT
DEATH RATE LOWER UPPER
1 PLUMAS 130.3 0.0 - - -
2 SIERRA 17.3 0.0 - - -
3 ALPINE 2.7 0.0 - - -
4 SANTA CRUZ 1,197.0 1.0 0.8 * 0.0 4.7
5 AMADOR 211.7 0.3 1.6 * 0.0 20.6
6 MARIN 1,476.7 2.7 1.8 * 0.3 5.6
7 TUOLUMNE 361.7 0.7 1.8 * 0.0 13.8
8 SAN BENITO 169.0 0.3 2.0 * 0.0 25.8
9 SAN FRANCISCO 3,558.3 7.3 2.1 * 0.9 4.2
10 YOLO 1,029.7 2.7 2.6 * 0.5 8.0
11 SAN MATEO 2,806.7 7.7 2.7 * 1.2 5.5
12 SANTA CLARA 5,488.3 16.0 2.9 * 1.7 4.7
13 ORANGE 11,606.7 34.0 2.9 2.0 4.1
14 INYO 110.7 0.3 3.0 * 0.0 39.4
15 IMPERIAL 217.3 0.7 3.1 * 0.0 22.9
16 NEVADA 630.0 2.0 3.2 * 0.4 11.5
17 VENTURA 3,456.7 11.0 3.2 * 1.6 5.7
18 TRINITY 96.0 0.3 3.5 * 0.0 45.4
19 YUBA 667.3 2.3 3.5 * 0.5 11.6
20 HUMBOLDT 1,047.0 3.7 3.5 * 0.9 9.3
21 STANISLAUS 2,759.0 9.7 3.5 * 1.7 6.5
22 ALAMEDA 4,917.3 18.0 3.7 * 2.2 5.8
23 GLENN 182.0 0.7 3.7 * 0.0 27.4
24 CONTRA COSTA 4,276.7 16.0 3.7 * 2.1 6.1
25 PLACER 2,658.7 10.0 3.8 * 1.8 6.9
26 SAN DIEGO 14,645.3 58.7 4.0 3.0 5.2
27 MONTEREY 1,229.3 5.0 4.1 * 1.3 9.5
28 LOS ANGELES 23,608.0 96.3 4.1 3.3 5.0
29 EL DORADO 1,195.0 5.0 4.2 * 1.4 9.8
CALIFORNIA 143,140.3 606.0 4.2 3.9 4.6
30 BUTTE 1,621.3 7.0 4.3 * 1.7 8.9
31 SONOMA 2,603.3 11.3 4.4 * 2.2 7.7
32 SACRAMENTO 7,958.3 34.7 4.4 3.0 6.1
33 SHASTA 1,683.3 7.3 4.4 * 1.8 8.8
34 SUTTER 590.0 2.7 4.5 * 0.8 14.0
35 LAKE 439.3 2.0 4.6 * 0.6 16.436 TULARE 1,789.7 8.3 4.7 * 2.1 9.1
37 DEL NORTE 202.7 1.0 4.9 * 0.1 27.5
38 SAN LUIS OBISPO 1,527.7 7.7 5.0 * 2.1 10.0
39 KINGS 754.3 4.0 5.3 * 1.4 13.6
40 SOLANO 1,704.0 9.3 5.5 * 2.5 10.3
41 LASSEN 243.3 1.3 5.5 * 0.3 25.2
42 RIVERSIDE 8,339.7 46.0 5.5 4.0 7.4
43 SAN JOAQUIN 2,653.3 15.3 5.8 * 3.3 9.5
44 FRESNO 3,380.7 19.7 5.8 * 3.5 9.0
45 CALAVERAS 282.3 1.7 5.9 * 0.5 23.7
HEALTHY PEOPLE 2020 NATIONAL OBJECTIVE MICH-1.3 6.0
46 KERN 4,211.3 25.7 6.1 4.0 9.0
47 SAN BERNARDINO 8,006.0 49.0 6.1 4.5 8.1
48 MERCED 1,014.0 6.3 6.2 * 2.4 13.3
49 NAPA 575.7 3.7 6.4 * 1.6 16.950 MADERA 522.3 3.7 7.0 * 1.8 18.7
51 SANTA BARBARA 1,565.7 11.0 7.0 * 3.5 12.6
52 TEHAMA 475.0 3.7 7.7 * 1.9 20.5
53 SISKIYOU 325.0 2.7 8.2 * 1.5 25.4
54 MARIPOSA 120.3 1.0 8.3 * 0.2 46.3
55 MODOC 78.0 0.7 8.5 * 0.0 63.9
56 MENDOCINO 569.7 5.3 9.4 * 3.2 21.3
57 MONO 68.7 0.7 9.7 * 0.0 72.5
58 COLUSA 83.0 1.0 12.0 * 0.3 67.1

7/28/2019 2013 County Health Status Profiles
http://slidepdf.com/reader/full/2013-county-health-status-profiles 68/102
County Health Status Profles 2013California Department of Public Health 61
LOW BIRTHWEIGHT INFANTS, 2009-2011
he ratio of low birthweight infants for California was 6.8 per 100 live births, or about one for every 14.7 live births. The 6.8 percentage was based on a 2009through 2011 three-year average number of low birthweight infants equaling
34,848.0 and live births of 512,902.7.
Among counties with reliable percentages, the percent of low birthweight infants rangedfrom 7.5 in Fresno County to 5.1 in Humboldt County, a factor of 1.5 to 1.
Forty-five counties with a reliable percentage met the Healthy People 2020 NationalObjective MICH-8.1 of reducing the incidence of low birthweight infants to no more than
7.8 percent of total births. An additional ten counties with unreliable percentages andone county with no low birthweight infants met the objective. The statewide percentageof low birthweight infants met the national objective.
The California ratio of low birthweight infants for the 2006-2008 period was 6.9.
T

7/28/2019 2013 County Health Status Profiles
http://slidepdf.com/reader/full/2013-county-health-status-profiles 69/102
County Health Status Profles 2013California Department of Public Health 62
Source: California Department of Public Health: 2009-2011 Birth Statistical Master Files.of the total number of live births.
Note: Counties were rank ordered first by increasing low birthweight percentage (calculated to 15 decimal places), second by decreasing size- Rates, percentages, and confidence limits are not calculated for zero events.* Rates are deemed unreliable based on fewer than 20 data elements.
TABLE 25
LOW BIRTHWEIGHT INFANTS
RANKED BY THREE-YEAR AVERAGE LOW BIRTHWEIGHT PERCENTAGE
CALIFORNIA COUNTIES, 2009-2011
x 2009-2011 LIVE BIRTHS (AVERAGE)
x x LOW BIRTHWEIGHT 95% CONFIDENCE LIMITS
RANKORDER
COUNTYOF RESIDENCE
LIVEBIRTHS NUMBER PERCENT LOWER UPPER
1 ALPINE 4.7 0.0 - - -
2 TUOLUMNE 447.3 17.3 3.9 * 2.3 6.2
3 TRINITY 115.3 5.0 4.3 * 1.4 10.1
4 CALAVERAS 336.7 15.3 4.6 * 2.6 7.5
5 DEL NORTE 347.3 17.3 5.0 * 2.9 8.0
6 MARIPOSA 144.0 7.3 5.1 * 2.1 10.3
7 HUMBOLDT 1,513.3 77.3 5.1 4.0 6.4
8 NEVADA 770.7 40.3 5.2 3.7 7.1
9 YOLO 2,416.0 131.3 5.4 4.5 6.4
10 SAN LUIS OBISPO 2,660.7 147.7 5.5 4.7 6.4
11 PLACER 3,820.0 215.3 5.6 4.9 6.4
12 IMPERIAL 3,097.3 174.7 5.6 4.8 6.5
13 BUTTE 2,427.3 137.7 5.7 4.7 6.6
14 SONOMA 5,408.0 308.3 5.7 5.1 6.3
15 YUBA 1,250.0 71.3 5.7 4.5 7.2
16 TEHAMA 769.0 44.0 5.7 4.2 7.7
17 SANTA CRUZ 3,240.7 186.0 5.7 4.9 6.6
18 MONTEREY 6,881.3 396.3 5.8 5.2 6.3
19 GLENN 416.3 24.0 5.8 3.7 8.6
20 MENDOCINO 1,073.3 62.0 5.8 4.4 7.4
21 COLUSA 333.7 19.3 5.8 * 3.5 9.0
22 SUTTER 1,373.0 79.7 5.8 4.6 7.2
23 MONO 148.7 8.7 5.8 * 2.6 11.2
24 SAN BENITO 752.7 44.3 5.9 4.3 7.9
25 SHASTA 2,075.3 124.0 6.0 4.9 7.0
26 SANTA BARBARA 5,887.0 354.0 6.0 5.4 6.6
27 NAPA 1,583.0 95.3 6.0 4.9 7.4
28 MARIN 2,415.7 146.0 6.0 5.1 7.0
29 STANISLAUS 7,825.0 481.3 6.2 5.6 6.7
30 VENTURA 11,052.0 687.3 6.2 5.8 6.7
31 TULARE 8,161.0 515.0 6.3 5.8 6.9
32 LAKE 720.3 45.7 6.3 4.6 8.5
33 AMADOR 278.7 17.7 6.3 * 3.7 10.1
34 EL DORADO 1,655.0 105.3 6.4 5.1 7.6
35 RIVERSIDE 30,956.0 1,988.7 6.4 6.1 6.7
36 SISKIYOU 461.0 29.7 6.4 4.3 9.237 SAN DIEGO 44,472.0 2,915.3 6.6 6.3 6.8
38 KINGS 2,572.0 169.0 6.6 5.6 7.6
39 ORANGE 38,922.7 2,560.7 6.6 6.3 6.8
40 MADERA 2,408.0 159.0 6.6 5.6 7.6
41 SOLANO 5,199.0 345.7 6.6 5.9 7.3
42 PLUMAS 162.7 11.0 6.8 * 3.4 12.1
43 MERCED 4,312.0 295.0 6.8 6.1 7.6
CALIFORNIA 512,902.7 34,848.0 6.8 6.7 6.9
44 CONTRA COSTA 12,362.7 848.3 6.9 6.4 7.3
45 SAN MATEO 9,229.7 634.7 6.9 6.3 7.4
46 SACRAMENTO 20,156.7 1,388.7 6.9 6.5 7.3
47 MODOC 96.7 6.7 6.9 * 2.7 14.5
48 SAN FRANCISCO 8,806.3 609.7 6.9 6.4 7.5
49 SANTA CLARA 24,261.0 1,692.7 7.0 6.6 7.3
50 SAN JOAQUIN 10,595.0 740.3 7.0 6.5 7.551 LASSEN 315.7 22.3 7.1 4.5 10.7
52 SAN BERNARDINO 31,307.3 2,232.0 7.1 6.8 7.4
53 KERN 14,508.0 1,044.0 7.2 6.8 7.6
54 ALAMEDA 19,540.7 1,409.7 7.2 6.8 7.6
55 LOS ANGELES 134,383.3 9,705.7 7.2 7.1 7.4
56 FRESNO 16,237.0 1,217.7 7.5 7.1 7.9
HEALTHY PEOPLE 2020 NATIONAL OBJECTIVE MICH-8.1 7.8
57 INYO 214.7 17.0 7.9 * 4.6 12.7
58 SIERRA 22.3 2.3 10.4 * 1.6 34.7

7/28/2019 2013 County Health Status Profiles
http://slidepdf.com/reader/full/2013-county-health-status-profiles 70/102
County Health Status Profles 2013California Department of Public Health 63
BIRTHS TO ADOLESCENT MOTHERS, 15 TO 19 YEARS OLD, 2009-2011
he age-specific birth rate to adolescents aged 15 to 19 in California was31.5 per 1,000 female population, or approximately one birth for every31.7 adolescent females. This rate was based on a 2009 through 2011
three-year average number of births of 43,088.7 and female population count of 1,367,804.
Among counties with reliable rates, the age-specific rate ranged from 59.8 inTulare County to 12.6 in Marin County, a factor of 4.8 to 1.
A Healthy People 2020 National Objective for births to adolescents aged 15 to 19 has
not been established.
The California age-specific birth rate to adolescents aged 15 to 19 for the 2006-2008period was 39.5.
T

7/28/2019 2013 County Health Status Profiles
http://slidepdf.com/reader/full/2013-county-health-status-profiles 71/102
County Health Status Profles 2013California Department of Public Health 64
State of California, Department of Finance, Race/Hispanics Population with Age and Gender Detail, 2000–2010. Sacramento, California, September 20Sources: California Department of Public Health: 2009-2011 Birth Statistical Master Files.
Note: Counties were rank ordered first by increasing age-specific birth rate (calculated to 15 decimal places), second by decreasing size of the population.* Rates are deemed unreliable based on fewer than 20 data elements.
TABLE 26
BIRTHS TO ADOLESCENT MOTHERS, 15 TO 19 YEARS OLD
RANKED BY THREE-YEAR AVERAGE AGE-SPECIFIC BIRTH RATE
CALIFORNIA COUNTIES, 2009-2011
x x 95% CONFIDENCE LIMITS
RANKORDER
COUNTYOF RESIDENCE
2010 FEMALEPOPULATION
15-19 YRSOLD
2009-2011LIVE BIRTHS(AVERAGE)
AGE-SPECIFICBIRTHRATE LOWER UPPER
HEALTHY PEOPLE 2020 NATIONAL OBJECTIVE: NONE
1 SIERRA 80 1.0 12.5 * 0.3 69.9
2 MARIN 6,081 76.3 12.6 9.9 15.7
3 PLACER 12,005 152.3 12.7 10.7 14.7
4 SAN FRANCISCO 17,508 237.3 13.6 11.8 15.35 NEVADA 2,964 42.3 14.3 10.3 19.3
6 EL DORADO 6,025 93.7 15.5 12.6 19.0
7 SAN LUIS OBISPO 10,076 170.3 16.9 14.4 19.4
8 YOLO 9,727 172.3 17.7 15.1 20.4
9 TUOLUMNE 1,497 28.3 18.9 12.6 27.3
10 SAN MATEO 19,318 367.0 19.0 17.1 20.9
11 AMADOR 957 18.7 19.5 * 11.7 30.6
12 CONTRA COSTA 35,761 708.3 19.8 18.3 21.3
13 SONOMA 16,135 336.7 20.9 18.6 23.1
14 MONO 366 7.7 20.9 * 8.8 41.8
15 SANTA CLARA 55,043 1,184.7 21.5 20.3 22.7
16 ALAMEDA 48,667 1,062.3 21.8 20.5 23.1
17 NAPA 4,690 104.7 22.3 18.0 26.6
18 ORANGE 110,684 2,474.7 22.4 21.5 23.2
19 CALAVERAS 1,307 29.7 22.7 15.3 32.5
20 HUMBOLDT 4,697 112.7 24.0 19.6 28.4
21 ALPINE 28 0.7 24.2 * 0.1 180.6
22 BUTTE 8,563 213.3 24.9 21.6 28.3
23 SANTA CRUZ 10,760 274.0 25.5 22.5 28.5
24 MARIPOSA 510 13.3 26.1 * 14.0 44.4
25 SOLANO 14,742 392.0 26.6 24.0 29.2
26 SAN BENITO 2,227 62.0 27.8 21.3 35.7
27 PLUMAS 620 17.7 28.5 * 16.8 45.2
28 SAN DIEGO 107,026 3,147.7 29.4 28.4 30.4
29 VENTURA 31,286 961.7 30.7 28.8 32.7
30 SACRAMENTO 51,359 1,596.7 31.1 29.6 32.6
CALIFORNIA 1,367,804 43,088.7 31.5 31.2 31.8
31 LOS ANGELES 365,989 11,727.3 32.0 31.5 32.6
32 RIVERSIDE 91,837 2,952.0 32.1 31.0 33.3
33 SHASTA 6,043 194.3 32.2 27.6 36.7
34 SUTTER 3,467 114.7 33.1 27.0 39.1
35 SANTA BARBARA 18,530 620.7 33.5 30.9 36.1
36 INYO 538 20.0 37.2 22.7 57.4
37 MODOC 295 11.0 37.3 * 18.6 66.7
38 SAN JOAQUIN 28,193 1,071.7 38.0 35.7 40.3
39 MENDOCINO 2,588 99.0 38.3 31.1 46.6
40 STANISLAUS 20,606 792.7 38.5 35.8 41.1
41 LASSEN 866 33.3 38.5 26.5 53.9
42 SISKIYOU 1,257 48.7 38.7 28.6 51.2
43 SAN BERNARDINO 87,548 3,467.3 39.6 38.3 40.9
44 TRINITY 391 15.7 40.1 * 22.8 65.4
45 COLUSA 807 32.7 40.5 27.8 56.9
46 TEHAMA 2,252 93.0 41.3 33.3 50.6
47 LAKE 1,991 84.0 42.2 33.7 52.2
48 GLENN 1,024 45.3 44.3 32.3 59.2
49 MERCED 11,741 530.0 45.1 41.3 49.050 YUBA 2,667 124.7 46.7 38.5 55.0
51 MONTEREY 15,641 767.3 49.1 45.6 52.5
52 FRESNO 39,605 1,963.0 49.6 47.4 51.8
53 MADERA 5,762 312.0 54.2 48.1 60.2
54 IMPERIAL 7,477 422.7 56.5 51.1 61.9
55 KERN 34,733 1,987.3 57.2 54.7 59.7
56 KINGS 5,424 313.3 57.8 51.4 64.2
57 DEL NORTE 875 51.3 58.7 43.7 77.1
58 TULARE 18,951 1,133.7 59.8 56.3 63.3

7/28/2019 2013 County Health Status Profiles
http://slidepdf.com/reader/full/2013-county-health-status-profiles 72/102
County Health Status Profles 2013California Department of Public Health 65
PRENATAL CARE BEGUNDURING THE FIRST TRIMESTER OF PREGNANCY, 2009-2011
he ratio of births to mothers with prenatal care begun during the first trimester of pregnancy for California was 83.3 per 100 live births. The 83.3 percentage wasbased on a 2009 through 2011 three-year average number of births to
mothers with prenatal care begun during the first trimester of pregnancy equaling418,473.7 and live births totaling 502,377.0.
Among counties with reliable percentages, the percent of births to mothers withprenatal care begun during the first trimester of pregnancy ranged from 94.3 inMarin County to 55.8 in Imperial County, a factor of 1.7 to 1.
Thirty counties with a reliable percentage met the Healthy People 2020 NationalObjective MICH-10.1 of achieving the percentage of mothers with prenatal care begunduring the first trimester of pregnancy to at least 77.9 percent of total births. Thestatewide percentage of mothers with prenatal care begun during the first trimester of pregnancy met the national objective.
The California percentage of births to mothers with prenatal care begun during the firsttrimester of pregnancy for the 2006-2008 period was 83.7.
T

7/28/2019 2013 County Health Status Profiles
http://slidepdf.com/reader/full/2013-county-health-status-profiles 73/102
County Health Status Profles 2013California Department of Public Health 66
Source: California Department of Public Health: 2009-2011 Birth Statistical Master Files.second by decreasing size of the total number of live births.
Note: Counties were rank ordered first by decreasing percentage of births to mothers with first trimester care (calculated to 15 decimal places),* Rates are deemed unreliable based on fewer than 20 data elements.
TABLE 27A
PRENATAL CARE BEGUN DURING THE FIRST TRIMESTER OF PREGNANCY
RANKED BY PERCENTAGE OF THREE-YEAR AVERAGE FIRST TRIMESTER CARE
CALIFORNIA COUNTIES, 2009-2011
x x 2009-2011 LIVE BIRTHS (AVERAGE)
x x x FIRST TRIMESTER CARE 95% CONFIDENCE LIMITS
RANKORDER
COUNTYOF RESIDENCE
TOTALNUMBER NUMBER PERCENT LOWER UPPER
1 MARIN 2,402.0 2,264.0 94.3 90.4 98.1
2 SAN MATEO 9,198.3 8,232.3 89.5 87.6 91.4
3 ORANGE 38,615.3 34,482.7 89.3 88.4 90.2
4 FRESNO 15,206.3 13,455.7 88.5 87.0 90.0
5 SAN FRANCISCO 8,748.7 7,707.7 88.1 86.1 90.1
6 AMADOR 276.3 241.7 87.5 76.4 98.5
7 ALAMEDA 19,388.7 16,929.3 87.3 86.0 88.6
8 SAN BENITO 747.7 646.7 86.5 79.8 93.2
9 LOS ANGELES 129,479.7 111,179.7 85.9 85.4 86.4
10 PLACER 3,805.7 3,262.3 85.7 82.8 88.7
11 SANTA CLARA 24,099.0 20,404.3 84.7 83.5 85.8
12 RIVERSIDE 30,434.0 25,676.0 84.4 83.3 85.4
13 NAPA 1,567.3 1,318.3 84.1 79.6 88.7
14 CONTRA COSTA 12,263.3 10,231.0 83.4 81.8 85.0
CALIFORNIA 502,377.0 418,473.7 83.3 83.0 83.6
15 SAN DIEGO 44,445.0 36,768.7 82.7 81.9 83.6
16 SAN BERNARDINO 30,887.7 25,528.3 82.6 81.6 83.7
17 TUOLUMNE 443.7 366.0 82.5 74.0 90.9
18 SONOMA 5,378.3 4,428.7 82.3 79.9 84.8
19 SANTA CRUZ 3,192.3 2,617.0 82.0 78.8 85.120 VENTURA 11,036.7 8,975.3 81.3 79.6 83.0
21 SACRAMENTO 19,509.7 15,832.7 81.2 79.9 82.4
22 YOLO 2,383.7 1,932.0 81.1 77.4 84.7
23 HUMBOLDT 1,486.0 1,201.0 80.8 76.3 85.4
24 SAN LUIS OBISPO 2,634.7 2,093.0 79.4 76.0 82.8
25 CALAVERAS 335.3 266.0 79.3 69.8 88.9
26 TULARE 8,054.3 6,388.3 79.3 77.4 81.3
27 INYO 211.7 167.3 79.1 67.1 91.0
28 EL DORADO 1,646.7 1,295.3 78.7 74.4 82.9
29 SISKIYOU 455.0 355.7 78.2 70.0 86.3
30 NEVADA 764.7 597.7 78.2 71.9 84.4
HEALTHY PEOPLE 2020 NATIONAL OBJECTIVE MICH-10.1 77.9
31 STANISLAUS 7,726.3 6,000.0 77.7 75.7 79.6
32 SOLANO 5,131.0 3,945.7 76.9 74.5 79.3
33 SAN JOAQUIN 10,426.7 7,948.7 76.2 74.6 77.934 SIERRA 21.0 16.0 76.2 * 43.5 100.0
35 KERN 13,794.7 10,467.3 75.9 74.4 77.3
36 PLUMAS 154.3 117.0 75.8 62.1 89.5
37 MADERA 2,318.3 1,748.0 75.4 71.9 78.9
38 KINGS 2,526.7 1,896.0 75.0 71.7 78.4
39 MONO 145.7 108.7 74.6 60.6 88.6
40 LASSEN 289.7 215.0 74.2 64.3 84.1
41 DEL NORTE 344.3 253.7 73.7 64.6 82.7
42 MARIPOSA 134.7 99.0 73.5 59.7 89.5
43 MONTEREY 6,749.0 4,952.3 73.4 71.3 75.4
44 SANTA BARBARA 5,823.3 4,256.7 73.1 70.9 75.3
45 BUTTE 2,390.0 1,738.3 72.7 69.3 76.2
46 COLUSA 332.0 237.3 71.5 62.4 80.6
47 ALPINE 4.7 3.3 71.4 * 16.4 100.0
48 MODOC 94.0 66.3 70.6 54.6 89.749 SHASTA 2,019.0 1,412.3 70.0 66.3 73.6
50 GLENN 410.7 282.0 68.7 60.7 76.7
51 TEHAMA 759.7 515.7 67.9 62.0 73.7
52 MENDOCINO 1,060.7 719.7 67.9 62.9 72.8
53 YUBA 1,243.7 827.7 66.6 62.0 71.1
54 LAKE 711.3 473.0 66.5 60.5 72.5
55 SUTTER 1,364.7 896.0 65.7 61.4 70.0
56 MERCED 4,182.7 2,689.7 64.3 61.9 66.7
57 TRINITY 112.3 65.0 57.9 44.7 73.8
58 IMPERIAL 3,008.3 1,678.7 55.8 53.1 58.5

7/28/2019 2013 County Health Status Profiles
http://slidepdf.com/reader/full/2013-county-health-status-profiles 74/102

7/28/2019 2013 County Health Status Profiles
http://slidepdf.com/reader/full/2013-county-health-status-profiles 75/102
County Health Status Profles 2013California Department of Public Health 68
Source: California Department of Public Health: 2009-2011 Birth Statistical Master Files.second by decreasing size of the total number of live births.
Note: Counties were rank ordered first by decreasing percentage of births to mothers with adequate/adequate plus prenatal care (calculated to 15 decimal pla* Rates are deemed unreliable based on fewer than 20 data elements.
TABLE 27B'ADEQUATE/ADEQUATE PLUS' PRENATAL CARE (ADEQUACY OF PRENATAL CARE UTILIZATION INDEX)
RANKED BY PERCENTAGE OF THREE-YEAR 'ADEQUATE/ADEQUATE PLUS' PRENATAL CARECALIFORNIA COUNTIES, 2009-2011
x x 2009-2011 LIVE BIRTHS (AVERAGE)
x x x ADEQUATE / ADEQUATE PLUS CARE 95% CONFIDENCE LIMITS
RANKORDER
COUNTYOF RESIDENCE
TOTALNUMBER NUMBER PERCENT LOWER UPPER
1 FRESNO 14,553.0 12,995.0 89.3 87.8 90.8
2 ORANGE 38,154.7 33,678.3 88.3 87.3 89.2
3 AMADOR 275.7 242.3 87.9 76.8 99.0
4 SAN LUIS OBISPO 2,612.3 2,243.7 85.9 82.3 89.4
5 MARIN 2,397.7 2,019.7 84.2 80.6 87.96 SANTA CRUZ 3,128.3 2,632.0 84.1 80.9 87.3
7 SAN MATEO 9,191.7 7,707.7 83.9 82.0 85.7
8 LOS ANGELES 127,533.0 106,380.7 83.4 82.9 83.9
9 PLACER 3,804.0 3,161.7 83.1 80.2 86.0
10 MONO 145.0 119.7 82.5 67.7 97.3
11 CALAVERAS 333.7 273.7 82.0 72.3 91.7
12 VENTURA 11,028.3 9,022.0 81.8 80.1 83.5
13 TUOLUMNE 442.7 362.0 81.8 73.4 90.2
14 RIVERSIDE 29,176.3 23,655.3 81.1 80.0 82.1
15 DEL NORTE 343.3 277.7 80.9 71.4 90.4
16 SAN FRANCISCO 8,737.7 7,020.7 80.3 78.5 82.2
17 SANTA BARBARA 5,801.3 4,634.3 79.9 77.6 82.2
CALIFORNIA 495,904.0 395,199.0 79.7 79.4 79.9
18 COLUSA 330.7 263.0 79.5 69.9 89.1
19 SAN BENITO 746.0 592.3 79.4 73.0 85.820 YOLO 2,380.0 1,879.7 79.0 75.4 82.5
21 TULARE 7,999.0 6,298.7 78.7 76.8 80.7
22 ALAMEDA 19,333.0 15,221.3 78.7 77.5 80.0
23 SACRAMENTO 19,435.0 15,273.7 78.6 77.3 79.8
24 ALPINE 4.7 3.7 78.6 * 19.8 100.0
25 HUMBOLDT 1,461.0 1,143.3 78.3 73.7 82.8
26 EL DORADO 1,644.0 1,285.0 78.2 73.9 82.4
27 GLENN 402.7 314.7 78.1 69.5 86.8
28 SANTA CLARA 24,076.7 18,791.7 78.0 76.9 79.2
29 SUTTER 1,363.0 1,061.0 77.8 73.2 82.5
30 NEVADA 762.0 592.0 77.7 71.4 83.9
HEALTHY PEOPLE 2020 NATIONAL OBJECTIVE MICH-10.2 77.6
31 SAN BERNARDINO 30,760.3 23,573.3 76.6 75.7 77.6
32 YUBA 1,240.3 949.3 76.5 71.7 81.4
33 SISKIYOU 453.7 345.7 76.2 68.2 84.2
34 BUTTE 2,359.0 1,794.7 76.1 72.6 79.6
35 CONTRA COSTA 12,244.3 9,298.7 75.9 74.4 77.5
36 NAPA 1,558.3 1,177.0 75.5 71.2 79.8
37 MENDOCINO 1,051.3 794.0 75.5 70.3 80.8
38 INYO 211.3 158.7 75.1 63.4 86.8
39 SHASTA 1,971.3 1,469.3 74.5 70.7 78.3
40 SONOMA 5,363.0 3,993.3 74.5 72.2 76.8
41 SAN DIEGO 44,430.3 32,888.0 74.0 73.2 74.8
42 TEHAMA 755.3 556.7 73.7 67.6 79.8
43 MONTEREY 6,714.3 4,890.3 72.8 70.8 74.9
44 KINGS 2,495.3 1,811.3 72.6 69.2 75.9
45 MARIPOSA 133.0 96.3 72.4 58.7 88.4
46 KERN 13,189.3 9,532.0 72.3 70.8 73.7
47 SAN JOAQUIN 9,959.0 7,158.7 71.9 70.2 73.5
48 MADERA 2,287.3 1,632.3 71.4 67.9 74.8
49 STANISLAUS 7,559.0 5,367.7 71.0 69.1 72.9
50 PLUMAS 151.7 107.7 71.0 57.6 84.4
51 LAKE 704.0 481.0 68.3 62.2 74.4
52 SIERRA 21.0 14.3 68.3 * 37.6 100.0
53 SOLANO 5,121.3 3,397.3 66.3 64.1 68.6
54 LASSEN 282.7 184.0 65.1 55.7 74.5
55 MODOC 93.0 59.7 64.2 48.9 82.6
56 MERCED 4,099.3 2,591.7 63.2 60.8 65.7
57 TRINITY 109.7 69.0 62.9 49.0 79.6
58 IMPERIAL 2,989.0 1,660.7 55.6 52.9 58.2
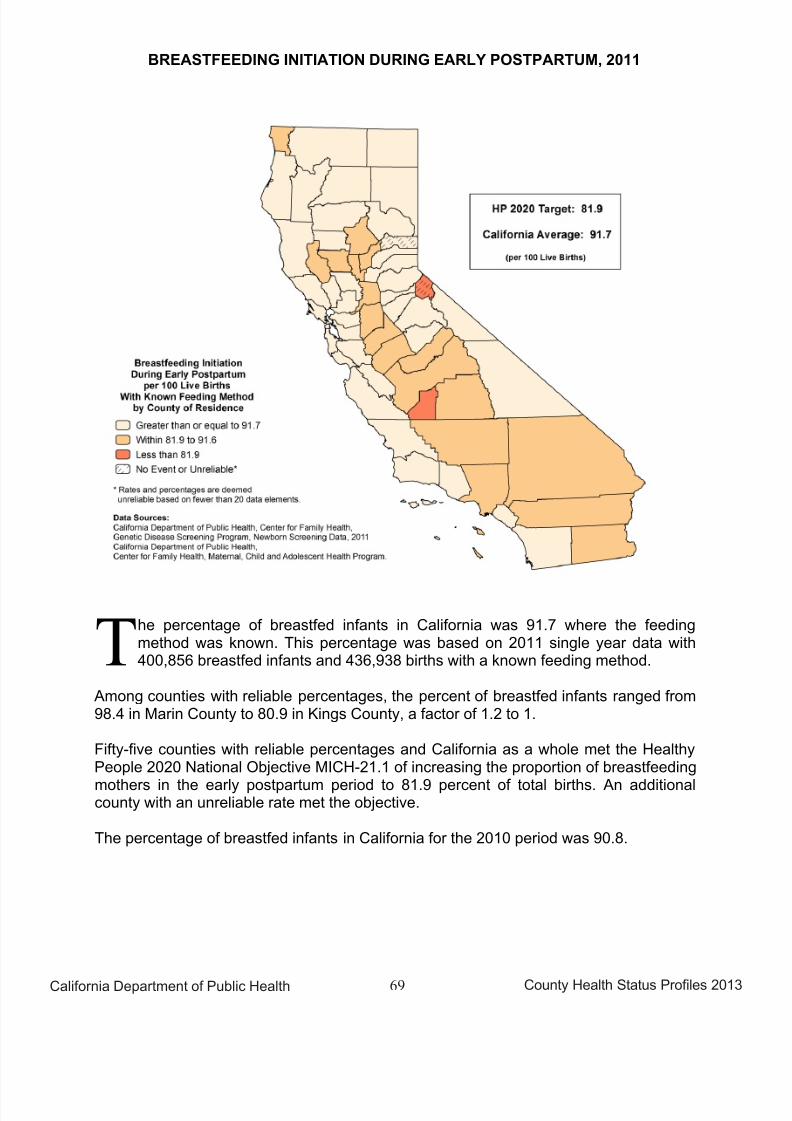
7/28/2019 2013 County Health Status Profiles
http://slidepdf.com/reader/full/2013-county-health-status-profiles 76/102
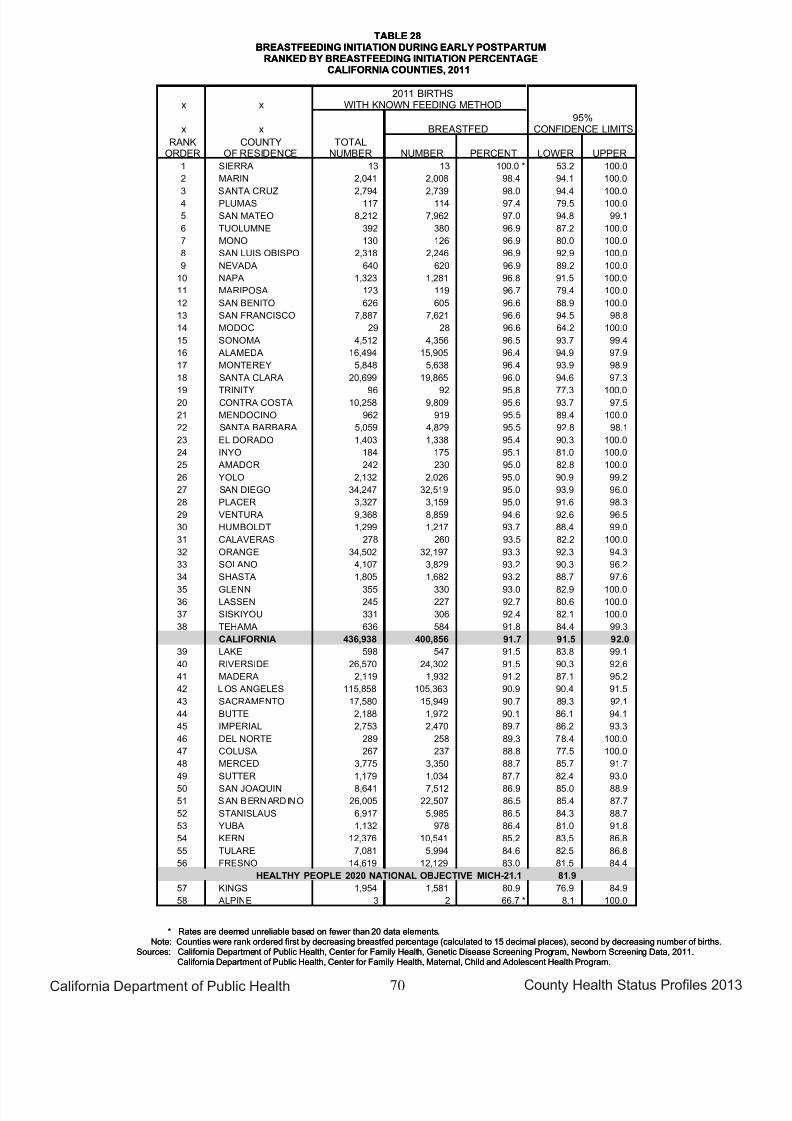
7/28/2019 2013 County Health Status Profiles
http://slidepdf.com/reader/full/2013-county-health-status-profiles 77/102
County Health Status Profles 2013California Department of Public Health 70
California Department of Public Health, Center for Family Health, Maternal, Child and Adolescent Health Program.
Sources: California Department of Public Health, Center for Family Health, Genetic Disease Screening Program, Newborn Screening Data, 2011.Note: Counties were rank ordered first by decreasing breastfed percentage (calculated to 15 decimal places), second by decreasing number of births.
* Rates are deemed unreliable based on fewer than 20 data elements.
TABLE 28
BREASTFEEDING INITIATION DURING EARLY POSTPARTUM
RANKED BY BREASTFEEDING INITIATION PERCENTAGE
CALIFORNIA COUNTIES, 2011
x x2011 BIRTHS
WITH KNOWN FEEDING METHOD
x x BREASTFED95%
CONFIDENCE LIMITS
RANKORDER
COUNTYOF RESIDENCE
TOTALNUMBER NUMBER PERCENT LOWER UPPER
1 SIERRA 13 13 100.0 * 53.2 100.0
2 MARIN 2,041 2,008 98.4 94.1 100.0
3 SANTA CRUZ 2,794 2,739 98.0 94.4 100.0
4 PLUMAS 117 114 97.4 79.5 100.0
5 SAN MATEO 8,212 7,962 97.0 94.8 99.1
6 TUOLUMNE 392 380 96.9 87.2 100.0
7 MONO 130 126 96.9 80.0 100.0
8 SAN LUIS OBISPO 2,318 2,246 96.9 92.9 100.0
9 NEVADA 640 620 96.9 89.2 100.0
10 NAPA 1,323 1,281 96.8 91.5 100.0
11 MARIPOSA 123 119 96.7 79.4 100.0
12 SAN BENITO 626 605 96.6 88.9 100.0
13 SAN FRANCISCO 7,887 7,621 96.6 94.5 98.8
14 MODOC 29 28 96.6 64.2 100.0
15 SONOMA 4,512 4,356 96.5 93.7 99.4
16 ALAMEDA 16,494 15,905 96.4 94.9 97.9
17 MONTEREY 5,848 5,638 96.4 93.9 98.9
18 SANTA CLARA 20,699 19,865 96.0 94.6 97.3
19 TRINITY 96 92 95.8 77.3 100.020 CONTRA COSTA 10,258 9,809 95.6 93.7 97.5
21 MENDOCINO 962 919 95.5 89.4 100.0
22 SANTA BARBARA 5,059 4,829 95.5 92.8 98.1
23 EL DORADO 1,403 1,338 95.4 90.3 100.0
24 INYO 184 175 95.1 81.0 100.0
25 AMADOR 242 230 95.0 82.8 100.0
26 YOLO 2,132 2,026 95.0 90.9 99.2
27 SAN DIEGO 34,247 32,519 95.0 93.9 96.0
28 PLACER 3,327 3,159 95.0 91.6 98.3
29 VENTURA 9,368 8,859 94.6 92.6 96.5
30 HUMBOLDT 1,299 1,217 93.7 88.4 99.0
31 CALAVERAS 278 260 93.5 82.2 100.0
32 ORANGE 34,502 32,197 93.3 92.3 94.3
33 SOLANO 4,107 3,829 93.2 90.3 96.2
34 SHASTA 1,805 1,682 93.2 88.7 97.6
35 GLENN 355 330 93.0 82.9 100.036 LASSEN 245 227 92.7 80.6 100.0
37 SISKIYOU 331 306 92.4 82.1 100.0
38 TEHAMA 636 584 91.8 84.4 99.3
CALIFORNIA 436,938 400,856 91.7 91.5 92.0
39 LAKE 598 547 91.5 83.8 99.1
40 RIVERSIDE 26,570 24,302 91.5 90.3 92.6
41 MADERA 2,119 1,932 91.2 87.1 95.2
42 L OS ANGELES 115,858 105,363 90.9 90.4 91.5
43 SACRAMENTO 17,580 15,949 90.7 89.3 92.1
44 BUTTE 2,188 1,972 90.1 86.1 94.1
45 IMPERIAL 2,753 2,470 89.7 86.2 93.3
46 DEL NORTE 289 258 89.3 78.4 100.0
47 COLUSA 267 237 88.8 77.5 100.0
48 MERCED 3,775 3,350 88.7 85.7 91.7
49 SUTTER 1,179 1,034 87.7 82.4 93.0
50 SAN JOAQUIN 8,641 7,512 86.9 85.0 88.9
51 SAN BERNARDINO 26,005 22,507 86.5 85.4 87.7
52 STANISLAUS 6,917 5,985 86.5 84.3 88.7
53 YUBA 1,132 978 86.4 81.0 91.8
54 KERN 12,376 10,541 85.2 83.5 86.8
55 TULARE 7,081 5,994 84.6 82.5 86.8
56 FRESNO 14,619 12,129 83.0 81.5 84.4
HEALTHY PEOPLE 2020 NATIONAL OBJECTIVE MICH-21.1 81.9
57 KINGS 1,954 1,581 80.9 76.9 84.9
58 ALPINE 3 2 66.7 * 8.1 100.0

7/28/2019 2013 County Health Status Profiles
http://slidepdf.com/reader/full/2013-county-health-status-profiles 78/102
County Health Status Profles 2013California Department of Public Health 71
PERSONS UNDER 18 IN POVERTY, 2010
alifornians under age 18 living in poverty represents 21.8 percent. Thispercentage was based on the U.S. Census Bureau, American CommunitySurvey 2010 estimate and California Department of Finance under 18 population
counts.
All counties demonstrated reliable percentages for persons less than 18 years of age inpoverty. The percentages ranged from 37.9 in Fresno County to 8.5 in San MateoCounty, a factor of 4.5 to 1.
A Healthy People 2020 National Objective for persons under age 18 in poverty has notbeen established.
Californians under age 18 in poverty was 19.8 percent for 2009.
C

7/28/2019 2013 County Health Status Profiles
http://slidepdf.com/reader/full/2013-county-health-status-profiles 79/102
County Health Status Profles 2013California Department of Public Health 72
State of California, Department of Finance, Race/Hispanics Population with Age and Gender Detail, 2000–2010. Sacramento, California, September 20http://www.census.gov/did/www/saipe/data/statecounty/data/2010.html Accessed November, 2012.
Sources: U.S. Census Bureau, Small Area Income and Poverty Estimates.Percentage based on the population under 18 years of age for which the poverty status was determined and excludes persons of unknown poverty statsecond by decreasing size of the same age group population.
Note: Counties were rank ordered first by increasing percentage of persons under 18 in poverty (calculated to 15 decimal places),
TABLE 29
PERSONS UNDER 18 IN POVERTY
RANKED BY PERCENTAGE OF CENSUS POPULATION UNDER 18 BELOW POVERTY
CALIFORNIA COUNTIES, 2010
x UNDER 18
x x IN POVERTY 95% CONFIDENCE LIMITS
RANKORDER
COUNTYOF RESIDENCE
2010POPULATION NUMBER PERCENT LOWER UPPER
HEALTHY PEOPLE 2020 NATIONAL OBJECTIVE: NONE
1 SAN MATEO 157,167 13,301 8.5 8.3 8.6
2 MARIN 52,901 5,609 10.6 10.3 10.9
3 PLACER 85,086 9,054 10.6 10.4 10.9
4 EL DORADO 41,820 4,717 11.3 11.0 11.6
5 CONTRA COSTA 262,817 32,851 12.5 12.4 12.6
6 SANTA CLARA 429,152 56,661 13.2 13.1 13.3
7 NAPA 31,904 4,563 14.3 13.9 14.7
8 SONOMA 106,863 15,489 14.5 14.3 14.7
9 MONO 3,083 448 14.5 13.2 15.9
10 SAN FRANCISCO 105,491 15,392 14.6 14.4 14.8
11 SAN LUIS OBISPO 50,963 7,527 14.8 14.4 15.1
12 VENTURA 211,864 31,691 15.0 14.8 15.1
13 NEVADA 19,860 3,235 16.3 15.7 16.9
14 ORANGE 729,272 118,904 16.3 16.2 16.4
15 AMADOR 6,337 1,039 16.4 15.4 17.4
16 ALAMEDA 337,199 57,722 17.1 17.0 17.3
17 SAN BENITO 16,094 2,777 17.3 16.6 17.9
18 CALAVERAS 9,047 1,573 17.4 16.5 18.2
19 LASSEN 6,502 1,144 17.6 16.6 18.6
20 SOLANO 101,151 17,893 17.7 17.4 17.921 SIERRA 554 103 18.6 15.0 22.2
22 SANTA CRUZ 55,243 10,308 18.7 18.3 19.0
23 YOLO 45,658 8,530 18.7 18.3 19.1
24 SAN DIEGO 712,672 136,770 19.2 19.1 19.3
25 INYO 3,955 793 20.1 18.7 21.4
26 TUOLUMNE 9,709 2,011 20.7 19.8 21.6
27 SANTA BARBARA 97,637 20,762 21.3 21.0 21.6
28 PLUMAS 3,681 783 21.3 19.8 22.8
29 HUMBOLDT 26,761 5,820 21.7 21.2 22.3
CALIFORNIA 9,225,094 2,012,721 21.8 21.8 21.8
30 MARIPOSA 3,262 718 22.0 20.4 23.6
31 COLUSA 6,444 1,453 22.5 21.4 23.7
32 SUTTER 26,006 6,056 23.3 22.7 23.9
33 RIVERSIDE 614,222 143,511 23.4 23.2 23.5
34 SACRAMENTO 358,564 84,466 23.6 23.4 23.7
35 LOS ANGELES 2,370,827 578,160 24.4 24.3 24.436 SAN BERNARDINO 592,264 144,956 24.5 24.3 24.6
37 BUTTE 46,140 11,339 24.6 24.1 25.0
38 GLENN 8,081 1,992 24.7 23.6 25.7
39 SHASTA 39,576 9,769 24.7 24.2 25.2
40 MONTEREY 110,387 28,298 25.6 25.3 25.9
41 SAN JOAQUIN 200,111 51,509 25.7 25.5 26.0
42 MENDOCINO 19,527 5,402 27.7 26.9 28.4
43 STANISLAUS 146,733 40,861 27.8 27.6 28.1
44 YUBA 20,920 5,847 27.9 27.2 28.7
45 LAKE 13,631 3,969 29.1 28.2 30.0
46 DEL NORTE 6,218 1,830 29.4 28.1 30.8
47 KINGS 42,397 12,484 29.4 28.9 30.0
48 TRINITY 2,585 766 29.6 27.5 31.7
49 SISKIYOU 9,399 2,795 29.7 28.6 30.8
50 KERN 253,173 76,107 30.1 29.8 30.3
51 TEHAMA 16,311 4,916 30.1 29.3 31.0
52 ALPINE 255 77 30.2 23.8 37.7
53 MODOC 2,154 664 30.8 28.5 33.2
54 MERCED 80,660 25,055 31.1 30.7 31.4
55 MADERA 42,995 13,394 31.2 30.6 31.7
56 IMPERIAL 50,918 16,157 31.7 31.2 32.2
57 TULARE 144,460 47,902 33.2 32.9 33.5
58 FRESNO 276,432 104,798 37.9 37.7 38.1

7/28/2019 2013 County Health Status Profiles
http://slidepdf.com/reader/full/2013-county-health-status-profiles 80/102
County Health Status Profles 2013California Department of Public Health 73
Note: Age-adjusted death rates are per 100,000 population and exclude multiple causes of death.- Rates are not calculated for zero events.* Rates are deemed unreliable based on fewer than 20 data elements.
TABLE 30
A COMPARISON OF THREE-YEAR AVERAGE RATES AND PERCENTAGES
AMONG SELECTED HEALTH STATUS INDICATORS
CALIFORNIA COUNTIES, 2006-2011
AGE-ADJUSTED DEATH RATES AGE-ADJUSTED DEATH RATES AGE-ADJUSTED DEATH RATES
ALL CANCERS COLORECTAL CANCER LUNG CANCER
(THREE-YEAR AVERAGES) (THREE-YEAR AVERAGES) (THREE-YEAR AVERAGES)
COUNTYOF RESIDENCE 2006-2008 2009-2011 2006-2008 2009-2011 2006-2008 2009-2011
CALIFORNIA 162.7 156.4 15.3 14.7 39.7 36.5
ALAMEDA 160.1 153.0 16.8 14.1 37.9 35.5
ALPINE 14.3 * 298.8 * - 29.3 * - 54.7 *
AMADOR 162.3 172.7 14.1 * 11.6 * 48.1 47.5BUTTE 196.4 179.6 14.6 14.0 56.0 44.6
CALAVERAS 166.5 170.8 15.0 * 15.5 * 45.7 44.7
COLUSA 141.2 173.8 10.1 * 11.3 * 40.3 * 60.7 *
CONTRA COSTA 168.3 154.9 17.3 15.7 39.3 36.2
DEL NORTE 210.2 197.1 19.0 * 16.6 * 64.9 * 61.3 *
EL DORADO 162.8 156.4 13.1 13.7 43.1 35.1
FRESNO 159.0 154.4 13.7 13.8 39.9 36.7
GLENN 175.2 168.9 17.0 * 11.6 * 56.2 * 43.4 *
HUMBOLDT 192.8 182.4 18.5 16.8 50.7 47.0
IMPERIAL 153.3 138.1 11.6 * 14.0 34.6 27.5
INYO 159.5 124.0 11.9 * 13.7 * 52.7 * 35.4 *
KERN 175.7 161.3 15.2 13.6 49.1 40.7
KINGS 171.3 143.1 17.5 * 11.0 * 44.9 34.9
LAKE 204.5 193.3 17.9 * 15.3 * 64.1 57.6
LASSEN 117.3 152.1 6.4 * 14.0 * 35.4 * 35.8 *LOS ANGELES 157.6 153.1 15.8 14.9 35.1 33.0
MADERA 152.7 155.0 17.5 15.9 33.0 41.4
MARIN 146.1 143.0 12.1 12.6 30.5 32.0
MARIPOSA 176.9 148.9 10.0 * 5.3 * 56.8 * 49.2 *
MENDOCINO 164.3 170.9 16.6 * 15.2 * 40.6 45.6
MERCED 161.2 162.3 13.7 17.7 46.6 41.6
MODOC 146.3 178.0 16.9 * 28.0 * 45.6 * 41.1 *
MONO 85.6 * 138.8 * 17.9 * 7.2 * 16.2 * 39.4 *
MONTEREY 141.4 146.4 12.4 11.0 34.3 35.5
NAPA 175.2 180.3 13.0 17.5 46.4 43.4
NEVADA 155.0 154.6 14.1 12.8 * 37.2 35.6
ORANGE 154.1 145.9 14.3 12.4 37.3 33.7
PLACER 171.4 152.0 14.6 12.3 42.5 35.4
PLUMAS 157.4 165.1 11.7 * 16.3 * 48.5 * 35.1 *
RIVERSIDE 166.1 162.7 15.9 17.2 42.2 39.5SACRAMENTO 174.0 172.6 15.9 15.7 48.1 44.8
SAN BENITO 155.5 153.5 11.6 * 12.5 * 33.2 * 32.4 *
SAN BERNARDINO 174.5 170.0 16.5 17.9 43.1 40.3
SAN DIEGO 168.4 160.6 15.1 14.4 40.2 37.2
SAN FRANCISCO 159.6 151.2 16.1 15.1 38.4 36.8
SAN JOAQUIN 175.3 168.3 15.2 14.2 47.9 47.0
SAN LUIS OBISPO 160.0 153.9 11.2 13.7 42.9 35.9
SAN MATEO 155.0 153.9 16.3 14.1 36.6 34.8
SANTA BARBARA 155.7 141.1 13.4 11.4 36.1 32.3
SANTA CLARA 148.1 139.5 13.6 13.5 34.0 28.9
SANTA CRUZ 157.9 145.3 13.6 13.4 34.0 28.1
SHASTA 197.9 194.8 15.3 18.3 62.5 49.9
SIERRA 122.1 * 91.2 * 20.0 * - 17.1 * 24.2 *
SISKIYOU 179.5 193.7 17.7 * 16.9 * 52.4 53.2
SOLANO 181.6 177.0 17.3 15.6 48.9 43.5SONOMA 174.0 167.4 16.0 15.5 44.1 40.6
STANISLAUS 176.2 161.7 19.6 16.3 48.3 41.8
SUTTER 154.4 158.6 13.6 * 11.2 * 45.3 52.1
TEHAMA 201.5 185.5 13.8 * 16.0 * 60.6 53.4
TRINITY 196.1 200.8 10.5 * 16.0 * 70.3 * 62.6 *
TULARE 162.0 160.7 13.5 14.5 42.6 44.4
TUOLUMNE 173.6 157.0 13.3 * 15.8 * 45.0 41.6
VENTURA 151.7 148.6 14.6 14.9 36.5 32.1
YOLO 167.6 154.5 16.8 14.2 46.3 33.7
YUBA 204.1 196.0 15.3 * 18.2 * 80.8 61.6

7/28/2019 2013 County Health Status Profiles
http://slidepdf.com/reader/full/2013-county-health-status-profiles 81/102
County Health Status Profles 2013California Department of Public Health 74
Note: Age-adjusted death rates are per 100,000 population and exclude multiple causes of death.- Rates are not calculated for zero events.* Rates are deemed unreliable based on fewer than 20 data elements.
TABLE 30 (continued)A COMPARISON OF THREE-YEAR AVERAGE RATES AND PERCENTAGES
AMONG SELECTED HEALTH STATUS INDICATORSCALIFORNIA COUNTIES, 2006-2011
AGE-ADJUSTED DEATH RATES AGE-ADJUSTED DEATH RATES AGE-ADJUSTED DEATH RATES
FEMALE BREAST CANCER PROSTATE CANCER DIABETES
(THREE-YEAR AVERAGES) (THREE-YEAR AVERAGES) (THREE-YEAR AVERAGES)
COUNTYOF RESIDENCE 2006-2008 2009-2011 2006-2008 2009-2011 2006-2008 2009-2011
CALIFORNIA 22.1 21.3 22.8 21.9 22.1 20.2
ALAMEDA 22.3 21.1 23.2 23.6 22.8 20.0
ALPINE - - - 143.4 * 23.1 * 21.2 *
AMADOR 15.9 * 37.2 * 17.5 * 22.6 * 12.3 * 6.8 *BUTTE 24.0 26.0 29.1 25.5 18.1 15.5
CALAVERAS 19.7 * 27.2 * 26.2 * 20.8 * 12.7 * 15.2 *
COLUSA 9.9 * 23.7 * 17.0 * 24.4 * 13.5 * 4.0 *
CONTRA COSTA 24.4 21.4 23.5 21.4 19.0 16.9
DEL NORTE 22.4 * 25.5 * 22.3 * 21.3 * 15.2 * 19.0 *
EL DORADO 19.8 19.7 21.9 * 18.7 * 12.7 13.8
FRESNO 21.1 18.4 21.9 19.2 31.7 28.5
GLENN 16.3 * 19.4 * 18.8 * 20.9 * 28.6 * 29.1 *
HUMBOLDT 28.6 23.9 22.9 * 23.4 * 20.9 25.9
IMPERIAL 18.2 * 18.2 * 21.2 * 24.5 * 35.0 32.0
INYO 16.7 * 27.9 * 14.2 * 28.0 * 17.0 * 9.9 *
KERN 21.7 22.5 26.9 24.4 33.4 32.4
KINGS 20.5 * 21.1 * 27.4 * 19.5 * 31.2 30.3
LAKE 13.4 * 25.2 * 21.4 * 29.3 * 17.5 * 18.4 *
LASSEN 19.2 * 8.9 * 13.5 * 8.1 * 25.2 * 24.4 *LOS ANGELES 22.1 21.9 22.8 21.7 25.4 22.3
MADERA 22.6 * 11.5 * 28.4 * 20.3 * 26.1 15.3
MARIN 22.0 18.1 19.9 19.7 9.9 8.4
MARIPOSA 30.0 * 10.6 * 38.6 * 21.2 * 23.4 * 9.9 *
MENDOCINO 24.0 * 26.6 * 21.8 * 17.8 * 18.5 * 15.1 *
MERCED 24.1 18.6 20.5 * 21.2 * 26.0 26.1
MODOC 27.9 * 19.4 * 15.0 * 17.0 * 23.5 * 7.4 *
MONO 29.6 * 7.0 * 7.9 * 17.9 * 6.3 * 7.2 *
MONTEREY 19.2 18.6 21.7 21.7 20.6 16.2
NAPA 23.0 19.8 * 23.9 * 25.2 * 19.5 15.4
NEVADA 24.9 * 15.2 * 24.0 * 28.5 * 13.7 * 10.5 *
ORANGE 20.5 19.6 20.9 20.4 16.1 14.0
PLACER 23.7 25.4 23.2 17.1 15.0 12.2
PLUMAS 17.8 * 17.1 * 19.2 * 29.2 * 19.6 * 15.5 *
RIVERSIDE 23.7 22.1 24.0 24.6 20.7 20.5SACRAMENTO 22.0 21.7 22.5 22.2 20.4 20.2
SAN BENITO 22.1 * 21.8 * 3.9 * 26.6 * 19.5 * 15.2 *
SAN BERNARDINO 24.5 24.2 29.4 26.1 31.6 33.9
SAN DIEGO 22.6 22.4 24.1 24.2 20.3 19.1
SAN FRANCISCO 20.1 17.3 15.3 17.0 12.5 10.9
SAN JOAQUIN 22.5 22.7 23.1 21.3 35.3 28.9
SAN LUIS OBISPO 21.9 20.5 22.8 20.7 10.7 13.5
SAN MATEO 21.9 19.6 21.8 20.5 12.6 12.2
SANTA BARBARA 21.9 17.8 23.1 23.1 14.2 16.5
SANTA CLARA 20.0 18.7 17.7 17.1 23.0 22.9
SANTA CRUZ 27.9 23.4 18.4 * 22.5 16.5 14.7
SHASTA 21.3 21.3 24.8 27.6 13.9 13.5
SIERRA 9.5 * 8.2 * - 31.9 * 16.5 * 15.2 *
SISKIYOU 21.3 * 24.1 * 30.9 * 27.0 * 20.7 * 22.8 *
SOLANO 23.3 24.1 23.2 24.8 31.6 23.4SONOMA 23.3 25.6 26.1 20.9 17.1 15.8
STANISLAUS 22.8 19.8 26.5 19.3 24.5 22.4
SUTTER 19.6 * 17.7 * 24.6 * 20.8 * 17.6 * 16.5 *
TEHAMA 25.9 * 17.1 * 31.2 * 26.5 * 15.5 * 18.1 *
TRINITY 8.8 * 20.2 * 32.9 * 23.7 * 9.8 * 7.4 *
TULARE 21.6 17.7 21.5 20.9 29.5 24.8
TUOLUMNE 21.8 * 19.1 * 25.6 * 15.1 * 16.4 * 13.1 *
VENTURA 19.1 21.7 22.8 22.4 19.4 16.1
YOLO 23.0 17.9 * 24.1 * 21.7 * 20.2 20.3
YUBA 25.5 * 19.7 * 25.0 * 19.6 * 14.5 * 27.7 *

7/28/2019 2013 County Health Status Profiles
http://slidepdf.com/reader/full/2013-county-health-status-profiles 82/102
County Health Status Profles 2013California Department of Public Health 75
Note: Age-adjusted death rates are per 100,000 population and exclude multiple causes of death.- Rates are not calculated for zero events.* Rates are deemed unreliable based on fewer than 20 data elements.
TABLE 30 (continued)A COMPARISON OF THREE-YEAR AVERAGE RATES AND PERCENTAGES
AMONG SELECTED HEALTH STATUS INDICATORSCALIFORNIA COUNTIES, 2006-2011
AGE-ADJUSTED DEATH RATES AGE-ADJUSTED DEATH RATES AGE-ADJUSTED DEATH RATES
ALZHEIMER'S CORONARY CEREBROVASCULAR
DISEASE HEART DISEASE DISEASE (STROKE)
(THREE-YEAR AVERAGES) (THREE-YEAR AVERAGES) (THREE-YEAR AVERAGES)
COUNTYOF RESIDENCE 2006-2008 2009-2011 2006-2008 2009-2011 2006-2008 2009-2011
CALIFORNIA 27.0 30.5 143.7 122.4 42.8 38.1
ALAMEDA 20.4 26.3 125.9 97.7 44.7 39.2
ALPINE - - 54.2 * - - - AMADOR 21.6 * 30.4 * 135.1 107.3 38.0 34.9
BUTTE 30.4 40.4 142.4 120.5 47.9 46.0
CALAVERAS 11.2 * 16.9 * 130.2 123.8 30.5 36.5
COLUSA 29.2 * 32.9 * 146.0 107.2 22.4 * 49.7 *
CONTRA COSTA 31.6 31.3 105.0 88.2 46.4 39.7
DEL NORTE 15.8 * 23.1 * 136.0 132.3 59.8 * 42.6 *
EL DORADO 26.4 33.9 115.8 97.0 30.2 26.0
FRESNO 27.9 33.1 147.9 128.2 52.7 46.2
GLENN 27.6 * 19.2 * 131.0 118.0 37.3 * 31.7 *
HUMBOLDT 38.1 27.9 141.5 107.5 61.0 52.4
IMPERIAL 11.1 * 16.2 123.9 118.4 43.1 45.3
INYO 2.3 * 3.6 * 156.1 131.6 25.1 * 40.7 *
KERN 38.1 36.0 203.9 165.1 48.4 42.4
KINGS 15.4 * 34.4 137.8 132.6 47.7 40.0
LAKE 19.8 * 29.0 164.7 164.7 50.3 55.3
LASSEN 16.5 * 10.6 * 98.8 123.5 28.8 * 31.0 *
LOS ANGELES 21.8 24.9 165.7 139.5 40.3 36.5
MADERA 31.3 43.2 167.4 163.4 44.5 40.9
MARIN 29.8 34.6 84.7 68.9 38.5 29.8
MARIPOSA 13.7 * 27.4 * 130.0 97.3 46.7 * 44.7 *
MENDOCINO 17.5 * 15.4 * 130.7 124.5 43.4 32.2
MERCED 19.2 24.0 169.2 142.7 49.2 46.0
MODOC 13.0 * 17.2 * 94.9 * 134.8 * 32.1 * 48.6 *
MONO - 32.9 * 60.5 * 141.4 * 15.5 * 28.6 *
MONTEREY 17.1 17.9 116.9 95.0 39.8 37.3
NAPA 36.1 31.6 101.6 102.7 44.3 39.8
NEVADA 16.1 28.7 114.6 97.6 45.6 39.4
ORANGE 30.4 33.0 132.7 107.8 41.4 35.2
PLACER 35.0 33.9 124.4 103.7 50.8 35.3
PLUMAS 13.2 * 22.1 * 82.8 116.6 30.6 * 33.6 *
RIVERSIDE 31.3 34.7 164.2 152.3 43.9 42.8
SACRAMENTO 25.4 27.9 148.6 130.0 48.9 40.6
SAN BENITO 15.6 * 12.4 * 89.1 79.2 41.3 * 40.9 *
SAN BERNARDINO 29.6 30.1 189.7 164.8 46.1 43.7
SAN DIEGO 36.8 38.1 123.1 109.7 39.7 34.8
SAN FRANCISCO 19.7 22.9 121.7 101.9 40.7 34.8
SAN JOAQUIN 26.8 37.5 178.0 134.6 47.3 45.7
SAN LUIS OBISPO 16.0 23.7 109.9 90.5 48.9 56.6
SAN MATEO 25.9 33.6 103.5 95.3 38.4 34.7
SANTA BARBARA 22.2 28.3 122.2 119.2 43.7 35.3
SANTA CLARA 36.0 38.8 115.0 90.3 34.3 28.3
SANTA CRUZ 22.9 32.5 108.7 97.2 34.4 34.8
SHASTA 24.6 36.7 157.4 121.5 49.4 44.4
SIERRA 10.7 * 14.7 * 123.9 * 105.5 * 27.7 * 53.3 *
SISKIYOU 20.4 * 26.1 * 116.4 121.0 45.5 47.5
SOLANO 41.8 49.9 114.8 99.9 46.7 37.8SONOMA 34.2 38.7 114.8 106.8 51.2 39.2
STANISLAUS 30.0 38.7 189.6 165.2 47.9 44.5
SUTTER 27.5 24.2 154.0 140.7 37.9 39.2
TEHAMA 31.1 31.8 124.8 111.6 55.6 53.7
TRINITY 12.1 * 28.8 * 88.3 * 130.9 46.7 * 17.9 *
TULARE 12.3 20.3 154.9 147.2 50.8 50.6
TUOLUMNE 15.5 * 15.2 * 112.5 109.6 37.8 37.0
VENTURA 25.6 28.0 136.5 105.5 38.8 36.4
YOLO 33.4 38.2 107.5 85.1 46.3 39.4
YUBA 22.0 * 22.2 * 175.3 156.8 41.7 48.1

7/28/2019 2013 County Health Status Profiles
http://slidepdf.com/reader/full/2013-county-health-status-profiles 83/102
County Health Status Profles 2013California Department of Public Health 76
Note: Age-adjusted death rates are per 100,000 population and exclude multiple causes of death.- Rates are not calculated for zero events.* Rates are deemed unreliable based on fewer than 20 data elements.
TABLE 30 (continued)A COMPARISON OF THREE-YEAR AVERAGE RATES AND PERCENTAGES
AMONG SELECTED HEALTH STATUS INDICATORSCALIFORNIA COUNTIES, 2006-2011
AGE-ADJUSTED DEATH RATES AGE-ADJUSTED DEATH RATES AGE-ADJUSTED DEATH RATES
x CHRONIC LOWER CHRONIC LIVER DISEASE
INFLUENZA/PNEUMONIA RESPIRATORY DISEASE AND CIRRHOSIS
(THREE-YEAR AVERAGES) (THREE-YEAR AVERAGES) (THREE-YEAR AVERAGES)
COUNTYOF RESIDENCE 2006-2008 2009-2011 2006-2008 2009-2011 2006-2008 2009-2011
CALIFORNIA 20.6 17.3 39.4 37.5 11.2 11.4
ALAMEDA 17.7 15.6 32.7 30.2 9.4 8.9
ALPINE - - - - - -
AMADOR 27.6 * 21.2 * 47.4 48.4 11.5 * 14.8 *
BUTTE 17.2 15.6 58.1 59.4 12.0 14.4
CALAVERAS 21.8 * 17.1 * 45.8 45.7 9.9 * 10.6 *
COLUSA 6.5 * 15.6 * 52.0 * 48.1 * 8.2 * 8.5 *
CONTRA COSTA 16.5 12.4 39.1 35.4 9.0 9.4
DEL NORTE 12.3 * 17.5 * 63.8 * 56.7 * 9.6 * 12.2 *
EL DORADO 14.1 13.8 40.1 40.5 9.2 8.4
FRESNO 23.3 24.0 41.9 36.3 13.8 14.9
GLENN 21.1 * 18.7 * 55.2 * 55.2 * 15.6 * 5.9 *
HUMBOLDT 15.8 11.8 * 59.8 56.2 15.7 15.1
IMPERIAL 13.6 * 12.7 * 33.6 22.6 14.5 15.9
INYO 12.6 * 10.7 * 46.3 * 46.8 * 27.3 * 17.5 *
KERN 23.8 23.9 69.8 68.4 14.8 13.1
KINGS 17.1 * 16.8 * 47.9 48.4 11.5 * 14.3 *
LAKE 19.4 * 23.6 * 68.1 71.1 22.9 21.7 *
LASSEN 6.3 * 11.2 * 44.3 * 41.2 * 7.7 * 5.9 *
LOS ANGELES 26.5 22.9 34.7 33.4 12.1 12.6
MADERA 20.2 18.7 46.9 44.0 14.7 14.3
MARIN 15.3 12.3 30.1 21.2 7.8 6.5
MARIPOSA 13.4 * 15.2 * 52.1 * 30.7 * 7.8 * 10.8 *
MENDOCINO 14.3 * 12.3 * 44.2 47.2 17.4 * 11.9 *
MERCED 15.9 14.6 46.8 47.3 10.0 14.3
MODOC 31.6 * 14.1 * 59.6 * 71.6 * 13.5 * 17.4 *
MONO - 9.0 * - 18.4 * 11.1 * 3.2 *
MONTEREY 13.7 11.5 33.6 30.4 10.5 11.1
NAPA 20.4 18.4 42.6 35.9 11.2 * 11.4 *
NEVADA 15.9 13.5 42.0 45.8 8.0 * 8.4 *
ORANGE 21.1 17.5 34.1 31.6 9.8 9.6
PLACER 16.1 14.0 43.8 36.7 6.7 8.8
PLUMAS 13.6 * 8.1 * 44.7 * 66.1 * 7.8 * 5.0 *
RIVERSIDE 15.1 13.8 50.4 49.0 10.0 11.5
SACRAMENTO 23.5 20.6 43.7 42.8 11.1 10.8
SAN BENITO 23.0 * 17.8 * 32.6 * 34.0 * 12.6 * 13.6 *
SAN BERNARDINO 20.1 11.9 59.2 57.0 13.2 12.6
SAN DIEGO 11.8 10.1 37.2 34.6 10.3 10.1
SAN FRANCISCO 24.1 16.9 25.8 22.0 8.1 8.8
SAN JOAQUIN 18.0 16.9 48.1 44.4 15.2 16.0
SAN LUIS OBISPO 12.5 11.0 36.8 37.8 10.0 11.0
SAN MATEO 25.4 21.7 29.4 29.3 9.6 10.0
SANTA BARBARA 13.7 13.4 31.7 28.2 12.6 11.2
SANTA CLARA 20.2 14.5 28.1 25.1 9.0 9.3
SANTA CRUZ 13.2 13.9 36.2 33.0 13.2 13.1
SHASTA 18.9 11.7 71.1 71.5 17.5 14.9
SIERRA 8.2 * 23.4 * 26.5 * 64.2 * 4.6 * 27.7 *
SISKIYOU 17.5 * 14.8 * 55.7 59.2 24.9 * 17.1 *
SOLANO 26.3 21.9 42.0 43.8 8.0 11.6SONOMA 18.0 8.9 37.9 40.4 11.5 11.3
STANISLAUS 23.9 19.2 51.2 48.4 11.8 13.2
SUTTER 21.3 * 17.6 * 51.5 55.0 12.4 * 12.2 *
TEHAMA 24.8 * 16.3 * 74.9 70.4 17.8 * 16.8 *
TRINITY 18.6 * 16.0 * 48.4 * 37.1 * 20.7 * 19.7 *
TULARE 23.1 24.6 46.6 51.1 17.0 14.6
TUOLUMNE 19.2 * 17.3 * 36.5 42.0 14.4 * 15.0 *
VENTURA 14.2 11.0 37.1 34.4 9.7 10.1
YOLO 32.8 23.0 48.0 53.5 13.6 12.2
YUBA 23.5 * 22.7 * 73.1 61.8 16.7 * 18.1 *

7/28/2019 2013 County Health Status Profiles
http://slidepdf.com/reader/full/2013-county-health-status-profiles 84/102
County Health Status Profles 2013California Department of Public Health 77
Note: Age-adjusted death rates are per 100,000 population and exclude multiple causes of death.- Rates are not calculated for zero events.* Rates are deemed unreliable based on fewer than 20 data elements.
TABLE 30 (continued)A COMPARISON OF THREE-YEAR AVERAGE RATES AND PERCENTAGES
AMONG SELECTED HEALTH STATUS INDICATORSCALIFORNIA COUNTIES, 2006-2011
AGE-ADJUSTED DEATH RATES AGE-ADJUSTED DEATH RATES AGE-ADJUSTED DEATH RATES
ACCIDENTS MOTOR VEHICLE
(UNINTENTIONAL INJURIES) TRAFFIC CRASHES SUICIDE
(THREE-YEAR AVERAGES) (THREE-YEAR AVERAGES) (THREE-YEAR AVERAGES)
COUNTYOF RESIDENCE 2006-2008 2009-2011 2006-2008 2009-2011 2006-2008 2009-2011
CALIFORNIA 30.8 27.6 10.6 7.5 9.7 10.2
ALAMEDA 28.6 21.3 7.0 4.3 8.0 9.0
ALPINE - 86.0 * - 40.9 * 45.9 * -
AMADOR 51.4 58.7 22.4 * 17.4 * 18.3 * 25.0 *
BUTTE 61.9 61.7 19.3 13.2 18.4 19.5
CALAVERAS 51.2 52.6 26.6 * 24.5 * 16.8 * 25.2 *
COLUSA 37.3 * 36.1 * 21.5 * 17.9 * 13.9 * 16.8 *
CONTRA COSTA 26.2 25.8 8.2 6.1 9.5 10.8
DEL NORTE 64.4 * 61.7 * 29.6 * 20.1 * 9.8 * 22.5 *
EL DORADO 46.4 38.9 12.4 8.9 * 12.6 18.7
FRESNO 42.3 37.1 17.9 13.2 9.8 8.1
GLENN 64.1 * 65.9 * 22.6 * 18.8 * 12.4 * 9.6 *
HUMBOLDT 74.2 65.2 18.3 15.7 21.0 22.7
IMPERIAL 39.8 28.6 16.7 9.2 * 6.9 * 7.3 *
INYO 41.6 * 29.0 * 13.9 * 3.6 * 8.5 * 20.4 *
KERN 48.7 42.3 19.1 13.4 10.6 11.5
KINGS 40.3 39.7 19.8 14.6 8.8 * 7.3 *
LAKE 70.2 85.7 23.1 * 21.9 * 27.9 * 26.7 *
LASSEN 46.9 * 44.9 * 9.8 * 9.7 * 18.0 * 11.5 *
LOS ANGELES 23.6 20.0 9.0 6.2 7.4 7.8
MADERA 46.4 41.8 23.6 18.9 11.9 * 13.1 *
MARIN 20.7 22.1 4.6 * 3.1 * 13.9 13.8
MARIPOSA 52.8 * 42.0 * 24.9 * 18.0 * 22.7 * 26.7 *
MENDOCINO 52.9 55.7 15.9 * 16.0 * 24.0 22.2
MERCED 43.3 40.9 19.0 13.3 7.0 * 12.6
MODOC 65.6 * 59.9 * 17.3 * 17.2 * 12.6 * 17.9 *
MONO 18.0 * 22.8 * 3.8 * 9.2 * 2.1 * 10.6 *
MONTEREY 30.4 30.0 12.1 8.3 10.0 8.8
NAPA 29.6 25.7 10.0 * 8.0 * 12.2 * 10.5 *
NEVADA 42.0 34.0 14.3 * 12.2 * 16.9 * 21.4
ORANGE 23.5 21.8 7.4 4.7 9.3 9.0
PLACER 32.1 26.9 8.8 7.2 11.2 14.4
PLUMAS 41.1 * 51.1 * 8.8 * 10.8 * 8.8 * 19.8 *
RIVERSIDE 35.5 31.8 14.6 9.4 10.3 9.8
SACRAMENTO 37.3 32.8 10.0 8.5 12.8 12.1
SAN BENITO 22.8 * 28.1 * 11.5 * 11.3 * 7.3 * 10.4 *
SAN BERNARDINO 29.8 25.6 14.8 9.9 10.0 11.0
SAN DIEGO 31.4 30.6 9.6 6.6 11.1 11.5
SAN FRANCISCO 35.9 33.0 5.3 2.9 11.0 10.5
SAN JOAQUIN 44.8 43.1 15.9 11.4 10.0 10.2
SAN LUIS OBISPO 38.0 33.0 12.1 7.8 12.4 16.3
SAN MATEO 22.6 21.4 5.8 4.4 8.5 8.9
SANTA BARBARA 32.3 29.2 9.3 7.1 8.9 10.9
SANTA CLARA 23.8 22.9 6.7 5.2 7.9 8.3
SANTA CRUZ 34.3 32.7 10.2 5.2 * 11.2 13.6
SHASTA 57.7 62.6 12.4 13.8 22.1 22.2
SIERRA 19.7 * 44.9 * 19.7 * - 14.1 * 17.0 *
SISKIYOU 67.7 71.4 28.2 * 17.5 * 25.1 * 27.1 *
SOLANO 32.0 28.7 12.0 7.5 9.6 12.7SONOMA 30.8 27.2 10.1 6.6 12.0 13.1
STANISLAUS 48.0 38.1 14.8 11.5 10.3 11.4
SUTTER 40.1 40.0 18.0 * 13.4 * 10.6 * 11.9 *
TEHAMA 51.5 60.2 19.4 * 20.0 * 20.5 * 17.8 *
TRINITY 74.6 * 64.6 * 28.3 * 19.7 * 36.7 * 25.4 *
TULARE 44.0 36.7 21.7 14.0 10.1 10.3
TUOLUMNE 54.3 61.2 13.0 * 18.0 * 20.0 * 23.4 *
VENTURA 32.1 27.2 10.3 7.4 10.8 11.3
YOLO 33.1 27.9 10.8 7.6 * 11.2 8.3 *
YUBA 68.5 55.7 21.0 * 12.3 * 18.7 * 13.9 *
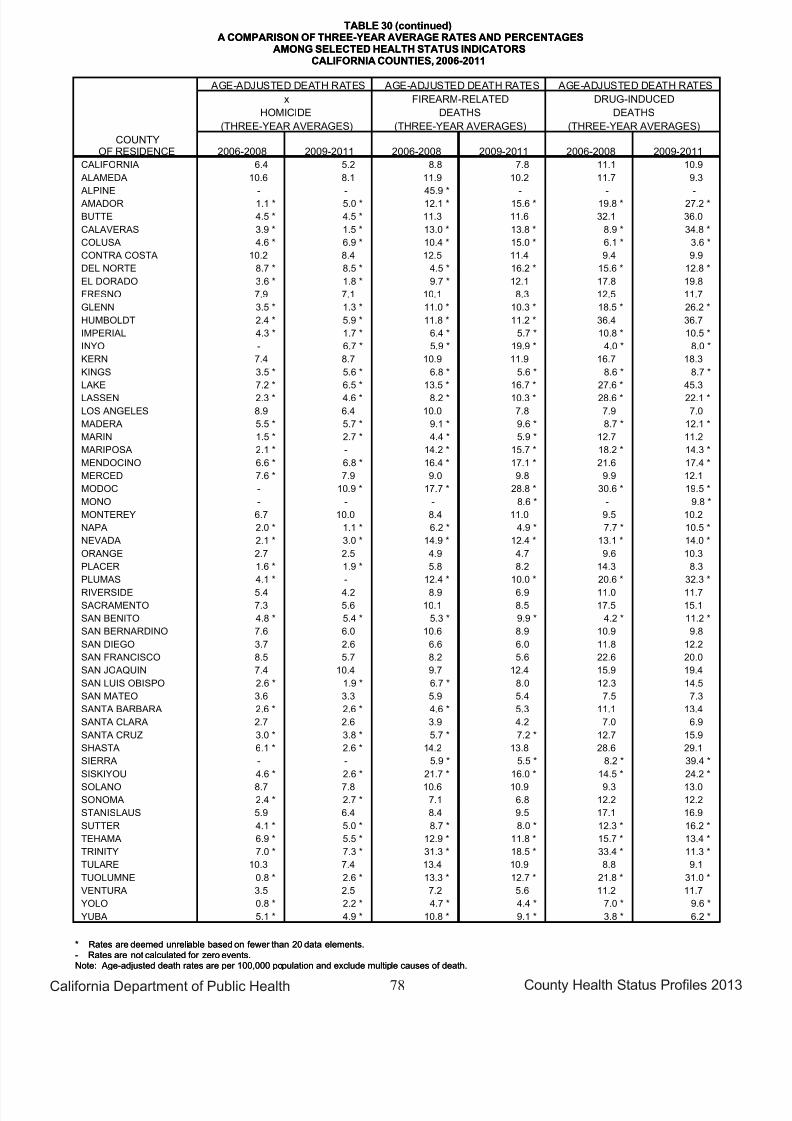
7/28/2019 2013 County Health Status Profiles
http://slidepdf.com/reader/full/2013-county-health-status-profiles 85/102

7/28/2019 2013 County Health Status Profiles
http://slidepdf.com/reader/full/2013-county-health-status-profiles 86/102
County Health Status Profles 2013California Department of Public Health 79
Note: The morbidity rates are crude case rates per 100,000 population.xxxxx- Rates are not calculated for zero events.xxxxx * Rates are deemed unreliable based on fewer than 20 data elements.
TABLE 30 (continued)A COMPARISON OF THREE-YEAR AVERAGE RATES AND PERCENTAGES
AMONG SELECTED HEALTH STATUS INDICATORSCALIFORNIA COUNTIES, 2006-2011
MORBIDITY RATE MORBIDITY RATE MORBIDITY RATE
REPORTED INCIDENCE REPORTED INCIDENCE REPORTED INCIDENCE OF
OF AIDS (AGED 13 AND OVER) OF CHLAMYDIA FEMALE GONORRHEA AGES 15-44
(THREE-YEAR AVERAGES) (THREE-YEAR AVERAGES) (THREE-YEAR AVERAGES)
COUNTYOF RESIDENCE 2006-2008 2009-2011 2006-2008 2009-2011 2006-2008 2009-2011
CALIFORNIA 12.4 9.7 391.0 417.6 168.8 125.9
ALAMEDA 18.6 12.6 453.6 450.7 317.7 217.1
ALPINE - - 53.4 * 87.2 * - -
AMADOR 2.0 * 1.0 * 181.2 186.4 27.9 * 58.1 *
BUTTE 3.0 * 1.6 * 325.2 365.7 131.1 66.2
CALAVERAS 0.8 * 0.8 * 73.0 117.1 41.2 * 33.4 *
COLUSA 2.0 * - 148.4 118.1 49.4 * 8.2 *
CONTRA COSTA 8.5 8.0 337.7 371.1 228.0 209.5
DEL NORTE 5.5 * 2.7 * 107.7 176.1 7.5 * 39.7 *
EL DORADO 2.9 * 2.2 * 135.8 132.6 29.8 * 28.0 *
FRESNO 10.5 10.1 600.9 628.9 295.6 244.3
GLENN - 1.5 * 222.5 180.9 63.5 * 65.2 *
HUMBOLDT 3.8 * 1.7 * 288.0 272.5 76.0 52.2 *
IMPERIAL 11.2 * 8.6 * 387.5 382.5 78.4 42.9 *
INYO 2.1 * 2.1 * 189.7 161.1 34.3 * 46.7 *
KERN 12.1 8.3 592.6 637.1 350.4 270.6
KINGS 5.0 * 2.7 * 353.1 347.9 189.0 60.1 *
LAKE 3.1 * 3.6 * 166.2 252.8 44.9 * 191.7 *
LASSEN 5.4 * 1.1 * 112.8 163.2 21.2 * 15.9 *
LOS ANGELES 16.6 14.0 455.4 492.1 198.6 152.9
MADERA 7.2 * 4.2 * 492.5 454.0 255.3 148.0
MARIN 11.4 6.8 * 218.8 221.8 63.1 48.3
MARIPOSA 2.1 * 2.1 * 74.4 * 84.6 * 61.4 * 13.5 *
MENDOCINO 5.0 * 2.7 * 238.8 269.1 65.7 * 67.7 *
MERCED 3.7 * 3.7 * 378.8 375.7 167.0 64.9
MODOC - - 135.6 * 44.8 * 134.1 * -
MONO - 2.8 * 124.3 * 200.7 24.1 * 11.1 *
MONTEREY 7.3 4.1 * 327.8 345.2 86.2 45.3
NAPA 6.6 * 5.5 * 186.0 196.8 45.0 * 39.5 *
NEVADA 1.2 * 1.2 * 131.3 136.7 29.3 * 36.7 *
ORANGE 8.2 6.7 276.7 267.8 57.3 45.1
PLACER 1.7 * 1.5 * 195.7 186.1 45.6 51.7
PLUMAS 1.9 * - 202.3 236.7 88.3 * -
RIVERSIDE 9.8 7.1 282.4 337.2 110.8 80.6SACRAMENTO 7.9 7.2 540.3 588.1 327.2 309.0
SAN BENITO 2.3 * 3.0 * 260.6 319.8 84.7 * 50.3 *
SAN BERNARDINO 7.7 6.9 418.7 444.5 221.4 142.9
SAN DIEGO 14.8 11.6 427.6 483.6 138.6 83.2
SAN FRANCISCO 62.1 38.9 511.1 559.6 141.8 113.5
SAN JOAQUIN 9.3 7.2 509.6 532.4 301.1 228.6
SAN LUIS OBISPO 5.7 * 2.8 * 232.9 264.1 37.6 * 32.4 *
SAN MATEO 5.0 3.9 259.1 264.4 62.5 39.4
SANTA BARBARA 5.3 * 3.0 * 278.3 349.1 40.0 34.0
SANTA CLARA 8.8 9.0 329.1 311.6 96.2 59.8
SANTA CRUZ 5.5 * 3.4 * 252.7 273.5 50.1 42.3
SHASTA 2.9 * 0.9 * 240.4 271.2 47.0 * 86.0
SIERRA - - 69.8 * 92.9 * - 162.1 *
SISKIYOU 1.7 * 2.6 * 214.0 185.4 29.2 * 73.2 *
SOLANO 13.2 5.8 463.2 442.8 229.8 215.4SONOMA 10.7 5.9 176.7 247.0 43.0 38.7
STANISLAUS 6.6 4.6 * 375.6 353.7 171.6 65.7
SUTTER 5.9 * 1.3 * 239.3 240.2 67.9 * 65.8 *
TEHAMA 0.7 * 1.9 * 217.2 258.8 78.0 * 36.6 *
TRINITY - 2.7 * 104.0 * 98.4 * 51.5 * 18.3 *
TULARE 2.5 * 3.4 * 413.3 373.1 194.9 51.7
TUOLUMNE 3.4 * 4.1 * 109.9 180.1 60.0 * 63.7 *
VENTURA 3.7 3.1 221.8 287.4 44.8 47.1
YOLO 2.2 * 2.6 * 264.1 283.9 62.5 41.5
YUBA 1.2 * 1.2 * 294.8 300.0 85.0 * 80.7 *

7/28/2019 2013 County Health Status Profiles
http://slidepdf.com/reader/full/2013-county-health-status-profiles 87/102
County Health Status Profles 2013California Department of Public Health 80
xxxxxxxxThe infant mortality rates are per 1,000 live births.Note: The morbidity rates are crude case rates per 100,000 population.
xxxxx - Rates and percentages are not calculated for zero events.xxxxx * Rates and percentages are deemed unreliable based on fewer than 20 data elements.
TABLE 30 (continued)A COMPARISON OF THREE-YEAR AVERAGE RATESAMONG SELECTED HEALTH STATUS INDICATORS
CALIFORNIA COUNTIES, 2005-2011
MORBIDITY RATE MORBIDITY RATE MORTALITY RATE
REPORTED INCIDENCE OF REPORTED INCIDENCE INFANT MORTALITY
MALE GONORRHEA AGES 15-44 OF TUBERCULOSIS ALL RACE/ETHNIC GROUPS
(THREE-YEAR AVERAGES) (THREE-YEAR AVERAGES) (THREE-YEAR AVERAGES)
COUNTYOF RESIDENCE 2006-2008 2009-2011 2006-2008 2009-2011 2005-2007 2008-2010
CALIFORNIA 174.9 164.9 7.5 6.4 5.3 5.0
ALAMEDA 291.6 243.1 9.9 10.5 4.7 4.4
ALPINE - - - - - -
AMADOR 21.0 * 32.1 * - 0.9 * 5.8 * 2.3 *
BUTTE 104.6 48.7 1.4 * 0.6 * 7.8 * 5.0 *
CALAVERAS 29.7 * 36.5 * 0.7 * 2.2 * 4.3 * 4.7 *
COLUSA 7.6 * 22.8 * 4.7 * 4.7 * 0.9 * 5.6 *
CONTRA COSTA 148.9 131.3 5.9 4.4 4.3 4.3
DEL NORTE 13.4 * - - - 11.5 * 6.9 *
EL DORADO 26.6 * 19.9 * 2.1 * 0.9 * 3.2 * 4.8 *
FRESNO 221.0 178.6 6.6 6.0 6.4 6.7
GLENN 29.9 * 25.0 * 4.8 * 1.2 * 5.3 * 3.0 *
HUMBOLDT 39.6 * 48.4 * 0.3 * 1.0 * 6.4 * 4.9 *
IMPERIAL 58.4 32.3 * 16.2 16.7 4.9 * 4.3 *
INYO - 33.0 * - 1.8 * 13.5 * 4.6 *
KERN 242.7 187.6 5.4 4.6 6.5 6.4
KINGS 84.2 34.6 * 2.9 * 3.0 * 5.7 * 5.5 *
LAKE 34.2 * 142.6 * 2.1 * 1.6 * 2.3 * 7.0 *
LASSEN 10.0 * 9.9 * - - 11.1 * 6.2 *LOS ANGELES 217.2 241.8 9.0 7.4 5.3 5.1
MADERA 52.8 * 57.8 * 5.4 * 5.1 * 5.1 * 5.4 *
MARIN 91.8 91.7 3.8 * 4.9 * 3.6 * 3.3 *
MARIPOSA 22.2 * - - - 2.4 * 6.7 *
MENDOCINO 48.2 * 36.6 * 4.2 * 1.9 * 8.0 * 7.5 *
MERCED 98.0 53.9 2.5 * 3.0 * 6.1 5.9
MODOC 106.3 * - - - 12.4 * 6.8 *
MONO 28.3 * 9.7 * - - 11.8 * 8.6 *
MONTEREY 78.5 46.3 6.1 5.0 4.6 4.8
NAPA 42.9 * 31.4 * 4.3 * 4.9 * 5.9 * 6.0 *
NEVADA 29.6 * 13.7 * 1.7 * 0.3 * 4.5 * 3.3 *
ORANGE 78.1 86.1 7.3 7.0 4.9 4.0
PLACER 37.1 48.0 2.1 * 1.6 * 5.2 3.9 *
PLUMAS 53.4 * 57.4 * - - 1.9 * 2.0 *
RIVERSIDE 98.0 74.2 3.7 3.2 5.6 5.5SACRAMENTO 281.7 249.6 7.6 5.6 5.8 5.7
SAN BENITO 51.2 * 32.4 * 1.2 * 2.4 * 4.5 * 4.8 *
SAN BERNARDINO 156.6 115.2 3.2 3.2 6.6 6.7
SAN DIEGO 167.5 165.0 9.5 7.6 5.0 4.6
SAN FRANCISCO 735.7 690.1 16.0 13.3 3.5 4.0
SAN JOAQUIN 252.3 184.8 9.7 8.1 5.9 6.4
SAN LUIS OBISPO 31.4 * 34.9 0.8 * 1.6 * 4.3 * 4.8 *
SAN MATEO 96.4 84.3 10.8 8.5 4.9 3.1
SANTA BARBARA 42.9 41.2 5.0 5.8 5.0 5.1
SANTA CLARA 104.0 74.4 12.8 10.7 4.1 3.4
SANTA CRUZ 55.7 49.6 3.2 * 3.2 * 4.6 * 2.8 *
SHASTA 32.4 * 68.4 2.1 * 0.6 * 6.7 * 5.0 *
SIERRA - - - - 13.7 * -
SISKIYOU 14.0 * 72.0 * - - 4.7 * 8.5 *
SOLANO 135.7 158.2 7.7 6.2 6.2 6.2
SONOMA 43.3 55.1 2.5 * 2.1 * 4.1 4.5
STANISLAUS 166.7 62.6 3.4 * 2.9 * 6.9 5.5
SUTTER 52.0 * 60.2 * 3.6 * 3.5 * 3.9 * 5.9 *
TEHAMA 43.3 * 35.0 * 3.8 * 1.6 * 4.9 * 8.4 *
TRINITY 15.5 * 32.4 * 2.4 * - 13.7 * 2.9 *
TULARE 146.7 40.9 6.2 5.2 6.4 5.3
TUOLUMNE 26.8 * 22.1 * - 0.6 * 7.1 * 2.9 *
VENTURA 47.5 48.0 7.1 4.7 5.9 4.9
YOLO 66.0 55.1 3.4 * 3.6 * 4.1 * 3.2 *
YUBA 80.5 * 32.6 * 5.2 * 0.9 * 4.3 * 5.6 *

7/28/2019 2013 County Health Status Profiles
http://slidepdf.com/reader/full/2013-county-health-status-profiles 88/102
County Health Status Profles 2013California Department of Public Health 81
Note: Age-specific birth rates are per 1,000 female population in the 15 to 19 year old age group.xxxx - Rates are not calculated for zero events.xxxx * Rates and percentages are deemed unreliable based on fewer than 20 data elements.
TABLE 30 (continued)A COMPARISON OF THREE-YEAR AVERAGE RATES AND PERCENTAGES
AMONG SELECTED HEALTH STATUS INDICATORSCALIFORNIA COUNTIES, 2006-2011
PERCENT AGE-SPECIFIC BIRTH RATE PERCENT
LOW BIRTHWEIGHT BIRTHS TO ADOLESCENT FIRST TRIMESTER
INFANTS MOTHERS, 15 TO 19 YEARS OLD PRENATAL CARE
(THREE-YEAR AVERAGES) (THREE-YEAR AVERAGES) (THREE-YEAR AVERAGES)
COUNTYOF RESIDENCE 2006-2008 2009-2011 2006-2008 2009-2011 2006-2008 2009-2011
CALIFORNIA 6.9 6.8 39.5 31.5 83.7 83.3
ALAMEDA 7.2 7.2 26.3 21.8 87.6 87.3
ALPINE 2.6 * - 62.3 * 24.2 * 65.8 * 71.4 *
AMADOR 4.9 * 6.3 * 25.0 19.5 * 88.1 87.5
BUTTE 5.9 5.7 24.1 24.9 72.2 72.7
CALAVERAS 5.7 4.6 * 30.1 22.7 83.8 79.3
COLUSA 5.9 5.8 * 58.1 40.5 69.0 71.5
CONTRA COSTA 6.7 6.9 27.9 19.8 85.3 83.4
DEL NORTE 5.7 * 5.0 * 53.8 58.7 56.8 73.7
EL DORADO 6.4 6.4 22.3 15.5 81.9 78.7
FRESNO 7.5 7.5 59.3 49.6 86.9 88.5
GLENN 4.5 5.8 55.1 44.3 69.2 68.7
HUMBOLDT 6.0 5.1 27.4 24.0 79.0 80.8
IMPERIAL 6.5 5.6 70.6 56.5 66.9 55.8
INYO 9.4 7.9 * 55.3 37.2 70.7 79.1
KERN 7.1 7.2 69.7 57.2 76.5 75.9
KINGS 6.4 6.6 69.3 57.8 73.6 75.0
LAKE 5.9 6.3 53.3 42.2 72.1 66.5
LASSEN 5.3 * 7.1 34.4 38.5 76.7 74.2
LOS ANGELES 7.4 7.2 40.1 32.0 87.9 85.9
MADERA 6.2 6.6 67.5 54.2 76.7 75.4
MARIN 6.4 6.0 17.6 12.6 93.4 94.3
MARIPOSA 5.8 * 5.1 * 24.5 * 26.1 * 72.9 73.5
MENDOCINO 6.5 5.8 44.7 38.3 68.5 67.9
MERCED 6.2 6.8 57.0 45.1 62.6 64.3
MODOC 5.6 * 6.9 * 38.6 * 37.3 * 77.5 70.6
MONO 9.9 * 5.8 * 36.7 * 20.9 * 78.4 74.6
MONTEREY 5.7 5.8 58.1 49.1 76.9 73.4
NAPA 6.2 6.0 31.0 22.3 83.2 84.1
NEVADA 6.2 5.2 24.2 14.3 77.4 78.2
ORANGE 6.4 6.6 29.6 22.4 89.3 89.3
PLACER 5.9 5.6 21.0 12.7 84.8 85.7
PLUMAS 5.1 * 6.8 * 23.4 * 28.5 * 74.5 75.8
RIVERSIDE 6.6 6.4 46.3 32.1 84.1 84.4
SACRAMENTO 6.8 6.9 39.9 31.1 79.6 81.2
SAN BENITO 6.5 5.9 46.3 27.8 85.0 86.5
SAN BERNARDINO 7.1 7.1 51.3 39.6 82.5 82.6
SAN DIEGO 6.7 6.6 35.1 29.4 83.3 82.7
SAN FRANCISCO 7.3 6.9 15.7 13.6 85.8 88.1
SAN JOAQUIN 7.0 7.0 53.1 38.0 70.9 76.2
SAN LUIS OBISPO 6.1 5.5 17.8 16.9 80.5 79.4
SAN MATEO 6.6 6.9 25.3 19.0 87.9 89.5
SANTA BARBARA 6.2 6.0 33.7 33.5 77.5 73.1
SANTA CLARA 6.6 7.0 27.5 21.5 83.8 84.7
SANTA CRUZ 5.8 5.7 25.5 25.5 83.0 82.0
SHASTA 6.0 6.0 40.2 32.2 74.9 70.0
SIERRA 5.0 * 10.4 * 10.7 * 12.5 * 73.3 * 76.2 *
SISKIYOU 7.9 6.4 51.3 38.7 81.6 78.2
SOLANO 7.2 6.6 34.9 26.6 74.6 76.9SONOMA 5.6 5.7 27.0 20.9 82.4 82.3
STANISLAUS 6.5 6.2 50.3 38.5 80.6 77.7
SUTTER 5.6 5.8 46.1 33.1 55.6 65.7
TEHAMA 5.2 5.7 54.0 41.3 71.8 67.9
TRINITY 4.9 * 4.3 * 35.4 * 40.1 * 69.2 57.9
TULARE 6.2 6.3 71.2 59.8 77.2 79.3
TUOLUMNE 5.3 3.9 * 34.1 18.9 83.1 82.5
VENTURA 6.7 6.2 40.1 30.7 80.1 81.3
YOLO 5.3 5.4 17.4 17.7 76.1 81.1
YUBA 6.2 5.7 57.7 46.7 58.1 66.6

7/28/2019 2013 County Health Status Profiles
http://slidepdf.com/reader/full/2013-county-health-status-profiles 89/102
County Health Status Profles 2013California Department of Public Health 82
xxxx * Rates and percentages are deemed unreliable based on fewer than 20 data elements.
TABLE 30 (continued)A COMPARISON OF THREE-YEAR AVERAGE RATES AND ONE YEAR PERCENTAGES
AMONG SELECTED HEALTH STATUS INDICATORSCALIFORNIA COUNTIES, 2006-2011
xxxx * Rates and percentages are deemed unreliable based on fewer than 20 data elements.
TABLE 30 (continued)A COMPARISON OF THREE-YEAR AVERAGE RATES AND ONE YEAR PERCENTAGES
AMONG SELECTED HEALTH STATUS INDICATORSCALIFORNIA COUNTIES, 2006-2011
PERCENT PERCENT BREASTFED
ADEQUATE/ADEQUATE PLUS BIRTHS WITH
PRENATAL CARE KNOWN FEEDING METHOD
(THREE-YEAR AVERAGES) (ONE-YEAR)
COUNTYOF RESIDENCE 2006-2008 2009-2011 2010 2011
CALIFORNIA 78.7 79.7 90.8 91.7
ALAMEDA 79.9 78.7 95.9 96.4 ALPINE 48.6 * 78.6 * 66.7 * 66.7 *
AMADOR 86.2 87.9 91.6 95.0
BUTTE 72.1 76.1 91.1 90.1
CALAVERAS 75.8 82.0 93.6 93.5
COLUSA 76.9 79.5 85.7 88.8
CONTRA COSTA 76.4 75.9 95.0 95.6
DEL NORTE 72.1 80.9 87.5 89.3
EL DORADO 70.6 78.2 95.0 95.4
FRESNO 83.4 89.3 82.3 83.0
GLENN 77.3 78.1 93.6 93.0
HUMBOLDT 72.8 78.3 94.7 93.7
IMPERIAL 61.7 55.6 91.1 89.7
INYO 65.6 75.1 95.2 95.1
KERN 70.3 72.3 84.2 85.2
KINGS 72.9 72.6 78.7 80.9LAKE 67.5 68.3 90.7 91.5
LASSEN 75.9 65.1 93.2 92.7
LOS ANGELES 83.4 83.4 89.2 90.9
MADERA 69.2 71.4 89.6 91.2
MARIN 90.4 84.2 98.5 98.4
MARIPOSA 66.3 72.4 89.9 96.7
MENDOCINO 72.6 75.5 94.8 95.5
MERCED 55.4 63.2 87.5 88.7
MODOC 49.6 64.2 91.1 96.6
MONO 78.1 82.5 97.6 96.9
MONTEREY 73.4 72.8 96.0 96.4
NAPA 78.1 75.5 96.1 96.8
NEVADA 73.9 77.7 95.5 96.9
ORANGE 85.4 88.3 92.8 93.3
PLACER 78.5 83.1 94.5 95.0
PLUMAS 58.9 71.0 95.0 97.4
RIVERSIDE 76.8 81.1 91.0 91.5
SACRAMENTO 74.6 78.6 89.0 90.7
SAN BENITO 73.5 79.4 95.3 96.6
SAN BERNARDINO 76.0 76.6 85.4 86.5
SAN DIEGO 73.9 74.0 94.5 95.0
SAN FRANCISCO 81.9 80.3 96.1 96.6
SAN JOAQUIN 68.6 71.9 86.4 86.9
SAN LUIS OBISPO 83.0 85.9 96.2 96.9
SAN MATEO 84.7 83.9 96.8 97.0
SANTA BARBARA 78.2 79.9 95.2 95.5
SANTA CLARA 79.5 78.0 96.4 96.0
SANTA CRUZ 82.6 84.1 98.2 98.0
SHASTA 69.7 74.5 93.6 93.2
SIERRA 68.3 * 68.3 * 100.0 * 100.0 *
SISKIYOU 70.6 76.2 91.1 92.4
SOLANO 72.6 66.3 92.8 93.2
SONOMA 73.2 74.5 96.9 96.5
STANISLAUS 72.2 71.0 85.6 86.5
SUTTER 70.0 77.8 87.6 87.7
TEHAMA 72.7 73.7 91.4 91.8
TRINITY 56.1 62.9 98.8 95.8
TULARE 76.1 78.7 81.4 84.6
TUOLUMNE 76.3 81.8 93.7 96.9
VENTURA 79.6 81.8 94.6 94.6
YOLO 75.3 79.0 94.5 95.0
YUBA 67.1 76.5 85.2 86.4

7/28/2019 2013 County Health Status Profiles
http://slidepdf.com/reader/full/2013-county-health-status-profiles 90/102

7/28/2019 2013 County Health Status Profiles
http://slidepdf.com/reader/full/2013-county-health-status-profiles 91/102
County Health Status Profles 2013California Department of Public Health 84
The CDPH, Division of Communicable Disease Control, Sexually Transmitted DiseasesBranch and the Tuberculosis Control Branch, were the sources for the reported caseincidence of chlamydia, gonorrhea, and tuberculosis. The CDPH, Office of AIDSSurveillance Section, provided incidence data of diagnosed AIDS cases. The CDPH,Center for Family Health, Maternal, Child and Adolescent Health Program, prepared thebreastfeeding initiation data, utilizing information collected by the Genetic DiseaseScreening Program.
The population data are provided on the Internet by the California Department of Finance, Demographic Research Unit. Estimates of persons under age 18 in poverty arefrom the U.S. Census Bureau at http://www.census.gov//did/www/saipe/. These datahave been updated with the most current estimates available. Population series arereferenced in the table footnotes.
Tables in this report may reflect small undercounts where case data were received lateor vital event data were registered after the cutoff date for creation of the data files.
DATA DEFINITIONS
Mortality (Tables 1-19): Use of the consensus set of health status indicators has beenfacilitated by reference to the causes of mortality coded according to the ICD-10.Beginning with 1999 mortality data, the change to ICD-10 follows a worldwide standardcreated by the World Health Organization. Standards for ICD-10 implementation wereset by the National Center for Health Statistics (NCHS).
A small number of non-traffic deaths have previously been reported along with trafficdeaths in prior publication tables titled “Deaths Due to Motor Vehicle Crashes.” Anon-traffic accident is any vehicle accident that occurs entirely in some place other thana public highway. An average of 132 non-traffic deaths during 2009 through 2011 wasnot included in Table 15, which was re-titled “Deaths Due to Motor Vehicle Traffic
Crashes.” This change, effective with Profiles 2009, aligns the data for directcomparison with HP 2020 objectives.

7/28/2019 2013 County Health Status Profiles
http://slidepdf.com/reader/full/2013-county-health-status-profiles 92/102
County Health Status Profles 2013California Department of Public Health 85
Following is a list of the mortality tables in this report and the ICD-10 codes used tocreate these tables.
Table 1: All Causes of Death ........................................... A00-Y89Table 2: All Cancers ........................................................ C00-C97Table 3: Colorectal Cancer .............................................. C18-C21, C26.0Table 4: Lung Cancer ...................................................... C34Table 5: Female Breast Cancer ....................................... C50
Table 6: Prostate Cancer................................................. C61Table 7: Diabetes ............................................................ E10-E14Table 8: Alzheimer’s Disease .......................................... G30Table 9: Coronary Heart Disease .................................... I11, I20-I25Table 10: Cerebrovascular Disease (Stroke) ..................... I60-I69Table 11: Influenza/Pneumonia ......................................... J09-J18Table 12: Chronic Lower Respiratory Disease .................. J40-J47Table 13: Chronic Liver Disease and Cirrhosis ................. K70, K73-K74Table 14: Accidents (Unintentional Injuries) ...................... V01-X59, Y85-Y86Table 15: Motor Vehicle Traffic Crashes…………………... V02-V04 (.1, .9), V09.2,
V12-V14 (.3-.9), V19 (.4-.6),
V20-V28 (.3-.9), V29-V79(.4-.9), V80 (.3-.5), V81.1,V82.1, V83-V86 (.0-.3),V87 (.0-.8), V89.2
Table 16: Suicide ............................................................... U03, X60-X84, Y87.0Table 17: Homicide ........................................................... U01-U02, X85-Y09, Y87.1Table 18: Firearm-Related Deaths .................................... U01.4, W32-W34, X72-X74,
X93-X95, Y22-Y24, Y35.0Table 19: Drug-Induced Deaths ........................................ D52.1, D59.0, D59.2, D61.1,
D64.2, E06.4, E16.0, E23.1,E24.2, E27.3, E66.1,
F11.0-F11.5, F11.7-F11.9,F12.0-F12.5, F12.7-F12.9,F13.0-F13.5, F13.7-F13.9,F14.0-F14.5, F14.7-F14.9,F15.0-F15.5, F15.7-F15.9,F16.0-F16.5, F16.7-F16.9,F17.0, F17.3-F17.5,F17.7-F17.9, F18.0-F18.5,F18.7-F18.9, F19.0-F19.5,F19.7-F19.9, G21.1, G24.0,G25.1,G25.4, G25.6, G44.4,
G62.0, G72.0, I95.2,J70.2-J70.4, K85.3, L10.5,L27.0, L27.1, M10.2, M32.0,M80.4, M81.4, M83.5,M87.1, R50.2, R78.1-R78.5,X40-X44, X60-X64,X85, Y10-Y14

7/28/2019 2013 County Health Status Profiles
http://slidepdf.com/reader/full/2013-county-health-status-profiles 93/102
County Health Status Profles 2013California Department of Public Health 86
Morbidity (Tables 20-23): In general, the case definition of a disease means laboratorytest results, or in their absence, a constellation of clearly specified signs andsymptoms that meet a series of clinical criteria. Centers for Disease Control andPrevention (CDC) online case definitions may be found athttp://www.cdc.gov//DiseasesConditions/.
Due to incomplete reporting of infectious and communicable diseases by many healthcare providers, caution is advised in interpreting morbidity tables. Many factors
contribute to the underreporting of these diseases. These factors include lack of awareness regarding disease surveillance; lack of follow-up by support staff assigned toreport; failure to perform diagnostic lab tests to confirm or rule out infectious etiology;concern for anonymity of the client; and expedited treatment in lieu of waiting for laboratory results because of time or cost constraints. County designation depictscounty of residence. Although table headings indicate the data shown are reportedcases, please contact the Division of Communicable Disease Control and the Office of
AIDS for complete morbidity reporting technical definitions and procedures.
Birth Cohort Infant Mortality (Tables 24A-24E): The infant mortality rate is the number of deaths among infants under one year of age per 1,000 live births. It is a universally
accepted and easily understood indicator, which represents the overall health statusof a community.
Studies of infant mortality that are based on information from death certificates alonehave been found to underestimate infant death rates for infants of all race/ethnic groupsand especially for certain race/ethnic groups, due to problems such as confusion aboutevent registration requirements, incomplete data, and transfers of newborns from onefacility to another for medical care. Infant mortality rates in this report are based onlinked birth and infant death records in the Birth Cohort-Perinatal Outcome Files, whichgenerate more accurate estimates of the total number of infant deaths as well as moreaccurate race-specific infant mortality rates. The race used on the race-specific infant
mortality tables reflected the race of the mother, thus the rate calculation’s numerator and denominator reflect only the mother’s race.
As late registration birth and death certificate data are included in the Birth Cohort-Perinatal Outcome Files after the Birth and Death Statistical Master Files have beenclosed to further processing and since hospital follow-back is conducted to resolvequestionable cases, cohort files cannot be as timely as the Statistical Master Files.However, the Birth Cohort-Perinatal Outcome Files are more complete and accurate.
Race/Ethnicity: Tables 24A-24E align with the 1997 Office of Management and Budget(OMB) revised minimum standards for collecting, maintaining, and presenting data on
race and ethnicity as described in the 1997 OMB Directive 15, which may be reviewed atURL: http://www.whitehouse.gov/omb/fedreg_1997standards. The mother's Hispanicorigin was determined first, irrespective of race, and then the race categories for theremaining non-Hispanics were determined. The Hispanic ethnic group includes anyrace, but is made up primarily of the White race. The remaining mother’s race data weresorted as follows: two or more race groups (includes any combination of OMB racecategories); American Indian/Alaska Native (includes Aleut, American Indian, andEskimo); Asian/Pacific Islander (includes Asian Indian, Asian specified/unspecified,Cambodian, Chinese, Filipino, Guamanian, Hawaiian, Hmong, Japanese, Korean,Laotian, Samoan, Thai, Vietnamese, and Other Pacific Islander); Black (includes Blacks

7/28/2019 2013 County Health Status Profiles
http://slidepdf.com/reader/full/2013-county-health-status-profiles 94/102
County Health Status Profles 2013California Department of Public Health 87
or African Americans); White (includes White and Other-specified); and Not Stated andUnknown (includes data for mothers who declined to state their race or for whom thedata were not obtainable for other reasons).
Table 24B Asian/Pacific Islander Infant Mortality rates should not be compared with the Asian/Other Infant Mortality rates in Profiles reports issued prior to 2005 because thesedata now exclude the Aleut, American Indian, and Eskimo statistics previously reportedin this table that could impact rates for these small numbers. In contrast, while Table
24E White Infant Mortality now excludes data for the Not Stated and Unknown racegroups included in previous reports, the relatively small number of these events in thislarge group may not substantially impact a county’s rate . American Indian/Alaska Nativeand Not Stated/Unknown race groups are not shown independently due to unreliablerates, but are included in Table 24A Infant Mortality, All Race/Ethnic Groups.
Effective with the 2000 data year, California began collecting up to three races on birthand death certificates. To permit comparison with race data found in the Birth Cohort-Perinatal Outcome Files for the 1999 data year and before, which include a single raceonly for the mother, first listed race was used in Profiles issued 2003 through 2006.Race/ethnic groups in Profiles issued since 2007 are compiled using the multi-race (two
or more races) indicator as stated above, thus slight reductions may occur in totalnumbers previously reported for single races. Since the two or more races group iscurrently very small, the impact of this change should be negligible.
Natality (Tables 25-27B): The natality data were obtained from Birth Statistical Master Files for 2009 through 2011. Records with specific unknown attributes were excludedfrom the total number of live births in developing the following tables: Table 25 excludesunknown birthweights; Table 27A excludes unknown prenatal care; and Table 27Bexcludes unknown adequacy of prenatal care.
Low birthweight has been associated with negative birth outcomes, and may be an
indicator of access problems and/or the need for prenatal care services. Prevalence of low birthweight is defined as the percentage of live births weighing less than 2,500grams (approximately 5.5 pounds). Birth rates to adolescents are an indicator for other high-risk pregnancy factors. Adolescent birth rate is defined as the number of births tomothers 15 to 19 years of age per 1,000 female population 15 to 19 years of age.
The prenatal care indicator, Month Prenatal Care Began, has been associated withaccess to care. Late prenatal care is defined as the percentage of mothers who did notbegin prenatal care in the first trimester. However, the percentage of births in which themother's prenatal care began in the first trimester, as a health indicator, does not readilypermit an unambiguous interpretation. According to some researchers, it fails to
document whether or not prenatal care actually continues throughout the pregnancy.Therefore, in addition to Prenatal Care Not Begun First Trimester of Pregnancy, thisProfiles report includes adequacy of prenatal care based on the Adequacy of PrenatalCare Utilization Index.
In Profiles reports published in 1995 through 1998, the Kessner Index was usedto measure the adequacy of prenatal care. The Kessner Index was replaced in the1999 report by the Adequacy of Prenatal Care Utilization Index, which is themethodology specified in HP 2020 Objectives.

7/28/2019 2013 County Health Status Profiles
http://slidepdf.com/reader/full/2013-county-health-status-profiles 95/102
County Health Status Profles 2013California Department of Public Health 88
The Adequacy of Prenatal Care Utilization Index developed by Milton Kotelchuckattempts to characterize prenatal care utilization in two independent and distinctivedimensions: adequacy of prenatal care initiation and services received (once prenatalcare has begun). The initial dimension, adequacy of prenatal care initiation,characterizes the month prenatal care began and its timeliness. The second dimension,adequacy of received services, characterizes the number of prenatal care visits receivedfrom the time the mother began prenatal care until delivery. The adequacy of prenatalvisits is based on the recommendations established by the American College of
Obstetricians and Gynecologists. These two dimensions are then combined into a singlesummary prenatal care utilization index, which contains the following five categories for adequacy of prenatal care:
(1) Adequate Plus: Prenatal care begun by the fourth month and 110 percent or more of the recommended visits received.
(2) Adequate: Prenatal care begun by the fourth month and 80 to 109 percent of therecommended visits received.
(3) Intermediate: Prenatal care begun by the fourth month and 50 to 79 percent of the recommended visits received.
(4) Inadequate: Prenatal care begun after the fourth month, or less than 50 percent
of the recommended visits received.(5) Missing Information: Unknown adequacy of prenatal care.
Only adequate and adequate plus prenatal care is used in Table 27B to measure theadequacy of prenatal care utilization. Also, please note the two-factor index does notassess the quality of the prenatal care that was delivered, but simply its utilization. For further information on the Adequacy of Prenatal Care Utilization Index, see the" American Journal of Public Health" article by Kotelchuck listed in the bibliography.
Breastfeeding Initiation During Early Postpartum (Table 28): The 2010 data serve
as the new baseline for future comparisons and trending of in-hospital breastfeedingpractices in California. The 2010 data should not be compared to data published in prior years (2004-2009) due to revisions to the Newborn Screening Program (NBS) datacollection tool (NBS Form), as well as changes in the data analysis methodology duringthis time period.
The primary change, the exclusion of data for infants that were in a Neonatal IntensiveCare Unit (NICU) nursery at the time of specimen collection, was done in order to better align with the new perinatal quality measure on exclusive breast milk feeding endorsedby the National Quality Forum, the Joint Commission and the Leapfrog Group.
Extensive research demonstrates the diverse and compelling advantages to infants,mothers, families, and society from breastfeeding and the use of human milk for infantfeeding. Breastfeeding provides advantages with regard to the general health, growth,and development of infants, while significantly decreasing their risk for a large number of acute and chronic diseases. There are also a number of studies that indicate possiblehealth benefits for mothers, such as less postpartum bleeding, rapid uterine involution,and reduced risk of ovarian cancer and post-menopausal breast cancer. In addition toindividual health benefits, breastfeeding provides significant social and economicbenefits to the nation, including reduced health care costs and reduced employeeabsenteeism for care attributable to child illness.

7/28/2019 2013 County Health Status Profiles
http://slidepdf.com/reader/full/2013-county-health-status-profiles 96/102
County Health Status Profles 2013California Department of Public Health 89
Breastfeeding initiation data are obtained from the Center for Family Health, GeneticDisease Screening Program, Newborn Screening Data with analyses by the Maternal,Child and Adolescent Health Program. All nonmilitary hospitals providing maternityservices are required to complete the Newborn Screening Test Form prior to an infant’sdischarge. Analysis is limited to cases reported on the Newborn Screening Test Form[Version NBS-I(D) (12/08)], representing approximately 99 percent of all cases.
Infant feeding data presented in this report include all feedings from birth to time of
specimen collection, usually 24 to 48 hours. To complete the form, staff must select fromthe following three categories to describe all feeding since birth: (1) Only Human Milk;(2) Only Formula; and (3) Human Milk & Formula. In Table 28, the number for "BREASTFED" includes records marked 'Only Human Milk' or 'Human Milk & Formula'.The “TOTAL NUMBER” excludes data for infants who were in a Neonatal Intensive CareUnit (NICU) nursery or received Total Parenteral Nutrition (TPN) at the time of specimencollection. Also, excluded are cases with an unknown method of feeding. Statewide,approximately 2.5 percent of cases have missing feeding information and/or receive TPNat the time of specimen collection.
Caution should be taken when analyzing breastfeeding initiation data alone because
breastfeeding duration is not taken into consideration. Examination of breastfeedinginitiation data along with duration data is recommended to thoroughly measure theeffects of breastfeeding. Breastfeeding duration data are not presented in this reportbecause county level duration data are not available.
Childhood Poverty (Table 29): Children under the age of 18 living in families withincome at or below the poverty level define the category of population under 18 inpoverty. The percent of children under 18 in this category is an indicator of global riskfactors that have implications for accessibility to health services.
CRUDE RATES AND AGE-ADJUSTED RATES
The numerator data used to compute mortality rates and percentages were three-year averages compiled by county of residence of the decedent; mother ’s county of residencefor birth data (including linked birth-death data for infant mortality); and county of residence for morbidity data. Three-year averages tend to reduce the year-to-year fluctuations and increase the stability of estimates.
A non-standardized rate (or "crude rate") is calculated by dividing the total number of events (e.g., deaths) by the total population at risk, then multiplying by a base(e.g., 100,000). Sub-populations such as counties with varying age compositions canhave highly disparate crude death rates, since the risk of dying is primarily a function of
age. Therefore, counties with a large component of elderly experience a higher deathrate. The effect of different age compositions among counties or other demographicgroups can be removed from the death rates by the “age -adjustment” process. Thisproduces age-adjusted rates that permit comparisons among geographic anddemographic groups and that are directly comparable with those HP 2020 NationalObjectives that are expressed as age-adjusted rates.
Age-adjusted death rates are hypothetical rates obtained by calculating age-specificrates for each county and multiplying these rates by proportions of the same age
7/28/2019 2013 County Health Status Profiles
http://slidepdf.com/reader/full/2013-county-health-status-profiles 97/102
County Health Status Profles 2013California Department of Public Health 90
categories in a "standard population," then summing the apportioned specific rates to acounty total. The "standard population" used in the age-adjusted rates in this report isthe 2000 U.S. Standard Population. The age-adjusted rates put all counties on thesame footing with respect to the effect of age and permit direct comparisons amongcounties. It is important to understand that age-adjusted death rates should be viewedas constructs or index numbers rather than as actual measures of the risk of mortality.Crude death rates, which include the effect of age, are the rates that should be applied
when measuring the actual risk of dying in a specific population. For further informationon age-adjusted rates, see the National Center for Health Statistics (NCHS) report byCurtin and Klein on "Direct Standardization," listed in the bibliography.
Data for the morbidity tables were not age-adjusted due to the unavailability of themorbidity data by age. Hence, only crude case rates were calculated. Although ageand aging do affect morbidity, the effect is not as prominent as their impact on mortality.Birth cohort infant death rates are not age-adjusted. Since the deaths are linked to thebirths on a record-by-record basis, these rates are based on a numerator (deaths) anda denominator (births) from the same record. Birth cohort comparisons amongcounties reflect the actual risk of dying within one year of birth, and concurrently, areunaffected by confounding age compositions because the cohorts represent the sameage group (under one year).
RELIABILITY OF RATES
All vital statistics rates and morbidity rates are subject to random variation. Thisvariation is inversely related to the number of events (e.g., deaths) used in calculatingthe rate. Small frequencies in the occurrence of events produce a greater likelihoodthat random fluctuations will be found within a specified time period. Rare events arerelatively less stable in their occurrence from observation to observation. As aconsequence, counties with only a few deaths, or a few cases of morbidity, can havehighly unstable rates from year to year. The observation of zero events is especiallyhazardous, regardless of the population size. This report reduces some year-to-year fluctuation in the occurrence of rare events by basing rates on three-year average numbers of events (e.g., 2009-2011), divided by the population in the middleyear (e.g., 2010).
The “standard error of a rate” and “coefficient of variation” or relative standard error (RSE) provided the rational basis for determining which rates may be considered“unreliable.” Conforming to NCHS standards, rates that are calculated from fewer than20 data elements, the equivalent of an RSE of 23 percent or more, are consideredunreliable. When rates, percentages, and confidence limits are not calculated due tozero events, they are shown as dashes (-).
The 95 percent confidence limits depict the region within which the rate would probablyoccur in 95 of 100 sets of data (if data similar to the present set were independentlyacquired on 100 separate occasions). In five of those 100 data sets, the rate or percentwould fall outside the limits. Confidence intervals based on 100 or more data elementsare calculated utilizing a normal distribution. In cases where there are fewer than 100data elements, the gamma distribution is used. For appropriate statisticalmethodologies in comparing independent rates or percentages, please see the NCHSreports listed in the bibliography by Curtin and Klein on “Direct Standardization” and byKleinman on “Infant Mortality.”

7/28/2019 2013 County Health Status Profiles
http://slidepdf.com/reader/full/2013-county-health-status-profiles 98/102
County Health Status Profles 2013California Department of Public Health 91
RANKING OF COUNTIES
Data for each health indicator are displayed with the counties in rank order byincreasing rates or percentages (calculated to 15 decimal places) with the exception of prenatal care begun during the first trimester of pregnancy (Table 27A), prenatal careadequacy (Table 27B) and breastfeeding initiation (Table 28). The county with the
lowest rate or percentage is in the first rank while the county owning the highest rate or percentage is in the 58th rank. Data for prenatal care begun during the first trimester of pregnancy, data for adequacy of prenatal care and data for breastfeeding initiation aredisplayed with the counties in rank order by decreasing percentages (calculated to 15decimal places). The county possessing the highest percentage is in the first rank andthe county with the lowest percentage is in the 58th rank. For all health indicators,counties with identical rates or percentages are ranked first by largest population or number of births.
COMPARISON OF RATES AND PERCENTAGES (TABLE 30)
Rates and percentages have been calculated for one prior period, which facilitatescomparison between the earlier period, and the current reported statistics for selectedhealth indicators. Readers are cautioned that measuring progress toward targetattainment for a HP 2020 objective using only one data point is not recommended. Inmonitoring progress toward achieving the objective target rate, HP 2020 guidelinesrecommend using absolute differences between the target rate, the most recent datapoint, and a progress quotient. HP 2020 guidelines for measuring objectives are onlineat http://www.healthypeople.gov/2020/topicsobjectives2020/default.aspx.
THEMATIC MAPS
ArcGIS, version 10.1, ArcMap software was used to create the thematic maps. Mappeddata were derived from the rates/percentages displayed in the column to the immediateleft of the 95 percent confidence intervals in the adjacent table. Counties with no eventsor with rates or percentages based on fewer than 20 data elements are shown with anoverlay of diagonal dashes.
The mapping methodology strives to illustrate rates/percentages for each indicator in away that highlights a county’s status in meeting the HP 2020 Objective target, if oneexists, and in comparison with the California rate. For example, a typical map for anindicator with an HP 2020 Objective, displays counties that achieved the target in the
lightest shade, counties with a rate between the California rate and the target in themedium shade, and counties with a rate above the California rate in the darkest shade(see the Colorectal Cancer map and table on pages 7 and 8).
Rates or percentages for health indicators without established HP 2020 Objectives, or with HP 2020 data collection criteria that California was unable to meet, are mappedaccording to counties with rates/percentages at or below the California rate/percentagewith the remaining counties above California’s rate/percentage divided into two groupsbased on a calculated 50th percentile of the rates/percentages among those counties.

7/28/2019 2013 County Health Status Profiles
http://slidepdf.com/reader/full/2013-county-health-status-profiles 99/102
County Health Status Profles 2013California Department of Public Health 92
FORMULAS USED IN THIS REPORT
BNpop
DCDR
n
BNpopDW ADR
a
ana
BNpop
D ASDR
a
an
D
CDRSE
nx
SE
W ASDR
Dy
a
n a
2
RSESE
CDR100x
x
RSE
SE
ADR100y
y
Lower 95% CL = ADR – (1.96 x SEy) Upper 95% CL = ADR + (1.96 x SEy)
Where: CDR = Crude Death Rate ADR = Age-Adjusted Death Rate ASDR = Age-Specific Death Rate
nD = Number of DeathsNpop = Population Size
nDa = Number of Deaths in an Age Group
Npopa = Population Size in Same Age GroupB = Base (100,000)
Wa = Age-Specific Weight (Standard PopulationProportion)
SEx = Standard Error of a Crude Death Rate
RSEx = Relative Standard Error of a Crude Death Rate
SEy = Standard Error of an Age-Adjusted Death Rate
RSEy = Relative Standard Error of an Age-Adjusted Death RateCL = Confidence Limit
Gamma Distribution Confidence Intervals
Lower 95% CL= Rate x GamInv (.025, Numerator of Rate, 1)/ Numerator of Rate Upper 95% CL= Rate x GamInv (.975, Numerator of Rate+1, 1)/ Numerator of Rate
Where: Rate is CDR or ADR depending on which table is being calculated.
GamInv is the gamma inverse function.

7/28/2019 2013 County Health Status Profiles
http://slidepdf.com/reader/full/2013-county-health-status-profiles 100/102
County Health Status Profles 2013California Department of Public Health 93
PROCEDURE FOR CALCULATING AGE-ADJUSTED RATESBY THE DIRECT METHOD
Age-adjusted rates calculated in this report follow the procedure that was used to setthe HP 2020 National Objectives. The standard population used the year 2000 U.S.population. The data in the following example were extracted from Table 1: Deaths Due
to All Causes, 2009 through 2011 for Alameda County.
STEP 1: Arrange the data of three-year average number of deaths and population for 11 age groups incolumns A and B.
STEP 2: Calculate age-specific rates by dividing the number of deaths in column A (numerator) by thepopulation in column B (denominator). Multiply the result (quotient) by the base of 100,000 toobtain the rates in column C.
STEP 3: Multiply each age-specific rate in column C by the corresponding 2000 U.S. StandardPopulation proportion in column D and enter the result in column E.
STEP 4: The values for each age group in column E are summed to obtain the Age-Adjusted Death
Rate for Alameda County of 622.0 per 100,000 population.
STEP 5: Repeat Steps 1 through 4 for each county and the statewide total. Note that the2000 U.S. Standard Population proportions remain the same for each county and the State.
STEP 6: Direct comparisons can now be made among the counties, with the removal of the effect thatvarying county age compositions may have on death rates.
AGE
GROUPS
G
2009-2011
DEATHS
(AVERAGE)
(A)
2010
POPULATION)
(B)
AGE-SPECIFIC
RATE/100,000
(C)
2000 U.S.
STANDARD
POPULATION
PROPORTIONS
(D)
.
WEIGHTED
RATE
FACTORS
(E)
TOTAL 8,967.7 1,513,493.0 592.5
Unknown 2.3
<1 84.0 18,965.2 442.9 0.013818 6.11-4 14.0 77,809.6 18.0 0.055317 1.0
5-14 19.3 183,552.8 10.5 0.145565 1.5
15-24 116.0 210,328.8 55.2 0.138646 7.6
25-34 149.3 236,767.5 63.1 0.135573 8.6
35-44 266.0 228,014.0 116.7 0.162613 19.0
45-54 668.0 220,376.8 303.1 0.134834 40.9
55-64 1,202.3 172,226.1 698.1 0.087247 60.9
65-74 1,339.7 89,564.0 1,495.8 0.066037 98.8
75-84 2,104.3 52,267.5 4,026.1 0.044842 180.5
>84 3,002.3 23,620.8 12,710.5 0.015508 197.1
622.0
ALAMEDA COUNTY
AGE-ADJUSTED RATE………………………………………………………

7/28/2019 2013 County Health Status Profiles
http://slidepdf.com/reader/full/2013-county-health-status-profiles 101/102
County Health Status Profles 2013California Department of Public Health 94
HP 2020
OBJECTIVE HEALTH STATUS INDICATOR
ALL CAUSES 234,637.7 628.7 654.9 652.2 657.6 a 696.8
C-1 ALL CANCERS 56,035.3 150.2 156.4 155.1 157.8 160.6 162.7C-5 COLORECTAL CANCER 5,273.7 14.1 14.7 14.3 15.1 14.5 15.3
C-2 LUNG CANCER 12,873.7 34.5 36.5 35.8 37.1 45.5 39.7
C-3 FEMALE BREAST CANCER 4,285.7 22.8 21.3 20.6 21.9 20.6 22.1
C-7 PROSTATE CANCER 3,069.7 16.6 21.9 21.1 22.7 21.2 22.8
DIABETES 7,213.7 19.3 20.2 19.7 20.7 b 22.1
ALZHEIMER'S DISEASE 10,748.7 28.8 30.5 29.9 31.1 a 27.0
HDS-2 CORONARY HEART DISEASE 43,724.0 117.2 122.4 121.2 123.5 100.8 143.7
HDS-3 CEREBROVASCULAR DISEASE (STROKE) 13,465.3 36.1 38.1 37.5 38.7 33.8 42.8INFLUENZA/PNEUMONIA 6,125.0 16.4 17.3 16.9 17.7 a 20.6
CHRONIC LOWER RESPIRATORY DISEASE 13,044.7 35.0 37.5 36.9 38.2 a 39.4
SA-11 CHRONIC LIVER DISEASE AND CIRRHOSIS 4,348.0 11.7 11.4 11.0 11.7 8.2 11.2
IVP-11 ACCIDENTS (UNINTENTIONAL INJURIES) 10,350.0 27.7 27.6 27.1 28.2 36.0 30.8IVP-13.1 MOTOR VEHICLE TRAFFIC CRASHES 2,827.0 7.6 7.5 7.2 7.7 12.4 10.6
MHMD-1 SUICIDE 3,853.3 10.3 10.2 9.8 10.5 10.2 9.7
IVP-29 HOMICIDE 1,992.0 5.3 5.2 5.0 5.4 5.5 6.4
IVP-30 FIREARM-RELATED DEATHS 2,969.7 8.0 7.8 7.5 8.1 9.2 8.8
SA-12 DRUG-INDUCED DEATHS 4,207.3 11.3 10.9 10.6 11.3 11.3 11.1
HP 2020
OBJECTIVE HEALTH STATUS INDICATOR
HIV-4 AIDS INCIDENCE (AGE 13 AND OVER) 2,995.0 9.7 9.4 10.1 13.0 12.4
CHLAMYDIA INCIDENCE 155,844.7 417.6 415.5 419.7 c 391.0STD-6.1 GONORRHEA INCIDENCE FEMALE AGE 15-44 10,014.7 125.9 123.4 128.3 257.0 168.8
STD-6.2 GONORRHEA INCIDENCE MALE AGE 15-44 13,629.3 164.9 162.1 167.7 198.0 174.9
IID-29 TUBERCULOSIS INCIDENCE 2,375.3 6.4 6.1 6.6 1.0 7.5
HP 2020
OBJECTIVE HEALTH STATUS INDICATOR
MICH-1.3 INFANT MORTALITY: ALL RACES 2666.0 5.0 4.8 5.2 6.0 5.3
MICH-1.3 INFANT MORTALITY: ASIAN/PI 260.7 4.0 3.5 4.5 6.0 4.5
MICH-1.3 INFANT MORTALITY: BLACK 316.0 11.0 9.8 12.3 6.0 12.4MICH-1.3 INFANT MORTALITY: HISPANIC 1341.0 4.9 4.7 5.2 6.0 5.2
MICH-1.3 INFANT MORTALITY: WHITE 606.0 4.2 3.9 4.6 6.0 4.8
HP 2020
OBJECTIVE HEALTH STATUS INDICATOR
MICH-8.1 LOW BIRTHWEIGHT INFANTS 34,848.0 6.8 6.7 6.9 7.8 6.9
MICH-10.1 FIRST TRIMESTER PRENATAL CARE 418,473.7 83.3 83.0 83.6 77.9 83.7
MICH-10.2 ADEQUATE/ADEQUATE PLUS CARE 395,199.0 79.7 79.4 79.9 77.6 78.7
HP 2020
OBJECTIVE HEALTH STATUS INDICATOR
BIRTHS TO MOTHERS AGED 15-19 43,088.7 31.5 31.2 31.8 a 39.5
HP 2020
OBJECTIVE HEALTH STATUS INDICATOR
MICH-21.1 BREASTFEEDING INITIATION 400,856 91.7 91.5 92.0 81.9 90.8
HP 2020
OBJECTIVE HEALTH STATUS INDICATOR
PERSONS UNDER 18 IN POVERTY 2,012,721 21.8 21.8 21.8 a 19.8
a Healthy People 2020 (HP 2020) National Objective has not been established.
b National Objective is based on both underlying and contributing cause of death which requires use of multiple cause of death files.
California's data exclude multiple/contributing causes of death.
c Prevalence data are not available in all California counties to evaluate the Healthy People 2020 National Objective STD-1, as the Health People objective is restricted to females
who are 15-24 years old and identified at a family planning cli nic, and males and females under 24 years old who participate in a national job-training program.
Note Crude death rates, crude case rates, and age-adjusted death rates are per 100,000 population. Birth cohort infant death rates are per 1,000 live births.
Age-specific birth rates are per 1,000 population.
Previous refers to previous period rates. These periods vary by type of rate: Mortality 2006-2008, Morbidity 2006-2008, Infant Mortality 2005-2007,
Natality 2006-2008, Breastfeeding 2010, Census 2009.
Sources State of California, Department of Fi nance, Race/Hispanics Population with Age and Gender Detail, 2000–2010. Sacramento, California, September 2012.
California Department of Public Health, 2009-2011 Death Statistical Master Files.
California Department of Public Health, Office of AIDS, HIV/AIDS Case Registry Section, Data Request, January, 2013.
California Department of Public Health, STD Control Branch (data reported through 08/07/2012). Chlamydia data.
California Department of Public Health, STD Control Branch, Data Request, August, 2012. Gonorrhea data.
California Department of Public Health, Tuberculosis Control Branch, Data Request, September, 2012.California Department of Public Health, 2008-2010 Birth Cohort-Perinatal Outcome Files.
California Department of Public Health, 2009-2011 Birth Statistical Master Files.
California Department of Public Health, Center for Family Health, Genetic Disease Screening Program, Newborn Screening Data, 2011.
California Department of Public Health, Center for Family Health, Maternal, Chil d and Adolescent Health Program.
U.S. Census Bureau, Small Area Income and Poverty Estimates. http://www.census.gov/did/www/saipe/data/statecounty/data/2010.html Accessed November, 2012.
PREVIOUSNUMBER PERCENT LOWER UPPER OBJECTIVE
CENSUS2010 95% CONFIDENCE LIMITS NATIONAL PERCENT
BIRTHS PERCENT LOWER UPPER OBJECTIVE PREVIOUS
BREASTFEEDING2011 95% CONFIDENCE LIMITS NATIONAL PERCENT
(AVERAGE) BIRTH RATE LOWER UPPER OBJECTIVE PREVIOUS
PREVIOUS
2009-2011 AGE-SPECIFIC
BIRTHS AGE-SPECIFIC 95% CONFIDENCE LIMITS NATIONAL BIRTH RATE
(AVERAGE) PERCENT LOWER UPPER OBJECTIVE
BIRTHS 95% CONFIDENCE LIMITS NATIONAL PERCENT
PREVIOUS
NATALITY
2009-2011
(AVERAGE) DEATH RATE LOWER UPPER OBJECTIVE
DEATHS INFANT 95% CONFIDENCE LIMITS NATIONAL DEATH RATE
PREVIOUS
INFANT MORTALITY
2008-2010 BIRTH COHORT (BC) BC INFANT
(AVERAGE) CASE RATE LOWER UPPER OBJECTIVE
MORBIDITY2009-2011 CRUDE
CASES CRUDE 95% CONFIDENCE LIMITS NATIONAL CASE RATE
DEATH RATE
(AVERAGE) DEATH RATE DEATH RATE LOWER UPPER OBJECTIVE PREVIOUS
APPENDIX ACALIFORNIA'S HEALTH STATUS PROFILE FOR 2013
MORTALITY2009-2011 AGE-ADJUSTED
DEATHS CRUDE AGE-ADJUSTED 95% CONFIDENCE LIMITS NATIONAL
7/28/2019 2013 County Health Status Profiles
http://slidepdf.com/reader/full/2013-county-health-status-profiles 102/102
BIBLIOGRAPHY
American Academy of Pediatrics. Breastfeeding and the Use of Human Milk.Pediatrics, Vol. 115, No. 2, February 2005: pp. 496-506 (doi:10.1542/peds.2004-2491).
Armitage P, Berry G, Matthews JNS. Statistical Methods in Medical Research(4th edition). Oxford: Blackwell Science 2002. Curtin LR, Klein RJ. Direct Standardization (Age-Adjusted Death Rates), Healthy People 2000 Statistical Notes. National Center for Health Statistics, DHHS Pub. No.(PHS) 95-1237, March 1995; No. 6-Revised.
Fleiss JL. Statistical Methods for Rates and Proportions, second edition. New York:John Wiley and Sons, 1981.
Foster JE. Using Natality Data in Health Planning. Statistical Notes for HealthPlanners, No. 12. National Center for Health Statistics. November 1980.
Institute for Medicine. The Future of Public Health. Washington, D.C.: National
Academy of Science Press, 1988; pp. 13-15.Klein RJ, Schoenborn, CA. Age Adjustment Using the 2000 Projected U.S.Population. Healthy People 2010 Statistical Notes. National Center for Health Statistics,DHHS Publication, Number 20, January 2001.
Kleinman JC. Mortality. Statistical Notes for Health Planners, No. 3. National Center for Health Statistics. February 1977.
Kotelchuck M. An Evaluation of the Kessner Adequacy of Prenatal Care Index and aProposed Adequacy of Prenatal Care Utilization Index. American Journal of Public Health, Vol. 84, No. 9, pp. 1414-1420. September 1994.
Lilienfeld AM, Lilienfeld DE. Foundations of Epidemiology , second edition. New York:Oxford University Press, 1980.
Tashiro M. A Description of the California Birth Cohort-Perinatal File. Data Matters #83-11078. Center for Health Statistics, California Department of Health Services(now California Department of Public Health). February 1984.