Embed Size (px)
Citation preview

2013 2014

Tennessee Higher Education
Fact Book
Tennessee Higher Education Commission Parkway Towers, Suite 1900
404 James Robertson Parkway Nashville, TN 37243-0830
Phone: (615) 741-3605 Fax: (615) 741-6230
www.tn.gov/thec
ACKNOWLEDGMENTS
The Tennessee Higher Education Commission gratefully acknowledges the institutions and agencies that provided the data necessary for compiling the Higher Education Fact Book. This and other THEC publications would be impossible without the timely submission of quality information by the following data providers:
• the Tennessee Board of Regents and its institutions; • the University of Tennessee and its institutions; • the Tennessee Independent Colleges and Universities Association; • the THEC Division of Postsecondary School Authorization; and • the Tennessee Student Assistance Corporation.
PRIVACY NOTICE
Throughout this report, THEC seeks to comply with Family Educational Rights and Privacy Act (FERPA) requirements to protect students’ personally identifiable information. Therefore, when tables are presented, individual cells containing five observations or fewer are suppressed. The suppressed information, however, is included in table totals.
Tennessee Higher Education Commission Fact Book 2013-2014 i Introduction
Table of Contents
History viiCurrent Context vii2013-2014 Commission Members viiiGovernance and Coordination Structure ixDirectory of Public Institutions xDirectory of Tennessee Colleges of Applied Technology xiTennessee Independent Colleges and Universities Association Member Institutions xii
Headcount by Sector Figure 1.1 2FTE by Sector Figure 1.2 3Public Higher Education Enrollment Trends Figure 1.3 4Percent Changes in Public Higher Education Enrollment Figure 1.4 4Fall Enrollment 2003 and 2008-2013 by Institution Table 1.1 514th Day and End of Term Enrollment Table 1.2 6Public Enrollment Term Withdrawals Table 1.3 7FTE Enrollment 2003 and 2008-2013 by Institution Table 1.4 8FTE as a Percent of Headcount Enrollment Table 1.5 9Tennessee Colleges of Applied Technology Enrollment and FTE Table 1.6 10Full-Time and Part-Time Enrollment at Community Colleges Figure 1.5 11Full-Time and Part-Time Enrollment at Public Universities Figure 1.6 11Headcount by Student Level Table 1.7 12Headcount by Gender Table 1.8 13Headcount by Race Table 1.9 14Headcount by Age and Pell Grant Eligibility Table 1.10 15Headcount by Residency and Citizenship Status Table 1.11 16Headcount by Major Field Table 1.12 17Community College and Public University Off-Campus Enrollment Table 1.13 18TCAT Off-Campus Enrollment Table 1.14 19Average ACT Scores of Freshmen Table 1.15 20Undergraduate Transfer Student Activity into Public Universities Table 1.16 21Undergraduate Transfer Student Activity into Community College Table 1.17 22Remedial and Developmental Enrollment Fall 2013 Table 1.18 23
Introduction Figure/Table Page
Student Participation
Tennessee Higher Education Commission Fact Book 2013-2014 ii Introduction

Table of Contents continued
Student Success Figure/Table PageRetention Rates by Institution Table 2.1 26Retention Rates by Race Table 2.2 27Remedial and Developmental Student Success Table 2.3 28Awards by Institution Table 2.4 29Awards by Major Field Table 2.5 30Awards by Major Field and Public University Table 2.6 31Percent of Public University Awards by Major Field Table 2.7 32Awards by Major Field and Community College Table 2.8 33Percent of Awards by Major Field and Community College Table 2.9 34Awards by Gender Table 2.10 35Awards by Gender and Award Type Table 2.11 35Awards by Race and Award Type Table 2.12 36Awards by Race and Institution Table 2.13 38Adult Award Recipients by Institution Table 2.14 39Pell Eligible Award Recipients by Institution Table 2.15 40Six Year Graduation Rates by Institution Table 2.16 41Six Year Graduation Rates by Institution and Race Table 2.17 42Six Year Graduation Rates by Institution 1998-2007 Table 2.18 43Community College Graduate Job Placement Rates 2003-2013 Table 2.19 43Community College Graduate Job Placement Rates by Institution Table 2.20 44TCAT Awards by Institution Table 2.21 45TCAT Awards by Program Table 2.22 46TCAT Program Completion and Placement Rates by Institution Table 2.23 48TCAT Completion and Placement Rates by Institution and Program Table 2.24 49Public University Licensure Exam Scores Table 2.25 59Community College Licensure Exam Scores Table 2.26 60TCAT Licensure Exam Scores by Institution Table 2.27 61Student Satisfaction Survey Results Table 2.28 64
Academic and Fiscal TrendsAcademic Program Inventory Table 3.1 66Program Accreditation Status Table 3.2 67Admissions Data for Public Universities Table 3.3 68Lower Division Instructional Courses Table 3.4 69Percent of Undergraduate Instruction through e-Learning Table 3.5 70Peer Faculty Salary Comparison Table 3.6 71TCAT Average Salary Comparison Table 3.7 71
Tennessee Higher Education Commission Fact Book 2013-2014 iii Introduction

Table of Contents continued
Academic and Fiscal Trends Continued Figure/Table PageAverage Full-Time Public University Faculty Salary Figure 3.1 72Average Full-Time Community College Faculty Salary Figure 3.2 72Annual Tuition and Mandatory Fees Table 3.8 73Annual Tuition and Mandatory Fees Resident Undergraduate Table 3.9 74Average Undergraduate Resident Tuition and Fees by Institution Type Figure 3.3 75Median Full-Time Tuition & Fees Public University Resident Table 3.10 76Median Full-Time Tuition & Fees Community College Resident Table 3.11 76Family Income Needed to Pay for College 2010-2011 Figure 3.4 77Family Income Needed to Pay for College 2011-2012 Figure 3.5 77Tuition & Fees Revenue per FTE Student Table 3.12 78Appropriations & Tuition/Fees Revenue per FTE Student Table 3.13 79Appropriations per FTE Student Table 3.14 80State & Local Appropriations as Percentage of Taxes Table 3.15 81State Appropriations for TN Public Higher Education Formula Units Table 3.16 82State Appropriations for TN Public Higher Education Non-Formula Units Table 3.17 83Revenue per FTE Historical Analysis Table 3.18 84Revenue per Student Award Historical Analysis Table 3.19 85Public University Total Revenue per FTE Figure 3.6 86Community College Total Revenue per FTE Figure 3.7 86Student Share of Revenue per FTE Figure 3.8 87Aid Awards per Enrollment Table 3.20 88State Undergraduate Grant Dollars per Undergraduate Enrollment Table 3.21 89Average Debt for a Tennessee Public University Student Table 3.22 90Cohort Default Rates for TN Public Institutions Table 3.23 91TN Education Lottery Schoarship (TELS) Program Summary Report Table 3.24 92TELS Traditional HOPE Awards by Institution Table 3.25 94TN Student Assistance Corporation Non-Lottery Awards by Program Table 3.26 96TN Student Assistance Corporation Non-Lottery Awards by Sector Table 3.27 96
Outcomes Funding FormulaOutcomes Funding Formula Definitions 98Outcomes Formula Weights for Public Universities 2014-2015 Table 4.1 99Outcomes Formula Weights for Community Colleges 2014-2015 Table 4.2 99Outcomes Funding Formula Data for Public Universities FY 2014-2015 Table 4.3 100Outcomes Funding Formula Data for Community Colleges FY 2014-2015 Table 4.4 101
Tennessee Higher Education Commission Fact Book 2013-2014 iv Introduction

Table of Contents continued
Glossary PageDefinitions 104Institutional and System Abbreviations 105
Tennessee Higher Education Commission Fact Book 2013-2014 v Introduction

Page Intentionally Left Blank
Tennessee Higher Education Commission Fact Book 2013-2014 vi Introduction

History
The Tennessee Higher Education Commission was created in 1967 by the Tennessee General Assembly to achieve coordination and foster unity with regard to higher education. The Commission coordinates two systems of public higher education: the University of Tennessee institutions governed by the University of Tennessee Board of Trustees, and the state universities, community colleges, and colleges of applied technology governed by the Tennessee Board of Regents. There are currently nine public universities, 13 community colleges, and 27 colleges of applied technology in Tennessee that serve over 220,000 students collectively. Tennessee’s independent institutions (non-profit and for-profit) bring statewide enrollment for Fall 2013 to more than 390,000 students. The Commission is composed of nine lay members appointed by the Governor for six year terms representing congressional districts of the State, three Constitutional Officers who are ex-officio voting members (Comptroller of the Treasury, State Treasurer, and Secretary of State), two ex-officio student members who serve two year terms, and the Executive Director of the State Board of Education as an ex-officio non-voting member.
Current Context
In January 2010, the General Assembly passed the Complete College Tennessee Act (CCTA), a comprehensive reform agenda that seeks to transform public higher education through changes in academic, fiscal and administrative policies at the state and institutional level. At the center of these reforms is the need for more Tennesseans to be better educated and trained, while also acknowledging the state's diminished fiscal capacity to support higher education.
The overarching goal of the 2010-15 Public Agenda for Tennessee Higher Education is to have Tennessee meet the projected national average in educational attainment by 2025. The primary state policy levers for addressing the state’s educational needs include promoting: (1) productivity and efficiency through an outcomes-based funding formula; (2) quality assurance through revised performance funding standards; (3) economic and workforce development through responses to a study of labor market supply and demand; (4) efficiency and effectiveness through purposeful reporting; (5) efficiencies through mission and sector differentiation; (6) efficiencies through inter-institutional collaboration and reduced duplication; and (7) efficiencies through incentives for extramural support.
Tennessee Higher Education Commission Fact Book 2013-2014 vii Introduction

Tennessee Higher Education Commission
2013-2014 Commission Members
Mr. Charles W. Bone, Hendersonville, 6th Congressional District
Mr. Randy Boyd, Knoxville, 2nd Congressional District
Mr. Evan Cope, Vice Chair, Murfreesboro, 4th Congressional District
Mr. Robert Fisher, University of Tennessee at Chattanooga
Mr. Tre Hargett, Secretary of State
Ms. Sharon Hayes, Brownsville, 8th Congressional District
Mr. Adam Jarvis, East Tennessee State University
Mr. Cato Johnson, Vice Chair, Bartlett, 7th Congressional District
Mr. Jon Kinsey, Chattanooga, 3rd Congressional District
Ms. Pam Koban, 5th Congressional District
Mr. David Lillard, Jr., State Treasurer
Dr. Gary Nixon, Executive Director, State Board of Education
Mayor A C Wharton, Jr., Secretary, Memphis, 9th Congressional District
Mr. Justin Wilson, State Comptroller
Mr. Keith Wilson, 1st Congressional District
Tennessee Higher Education Commission Fact Book 2013-2014 viii Introduction

Universities Austin Peay State University
East Tennessee State University Middle Tennessee State University
Tennessee State University Tennessee Technological University
University of Memphis
Community Colleges Chattanooga State Community College Cleveland State Community College Columbia State Community College Dyersburg State Community College
Jackson State Community College Motlow State Community College
Nashville State Community College Northeast State Community College Pellissippi State Community College
Roane State Community College Southwest State Community College Volunteer State Community College Walters State Community College
Colleges of Applied Technology
Athens McKenzie Chattanooga McMinnville Covington Memphis Crossville Morristown Crump Murfreesboro Dickson Nashville Elizabethton Newbern Harriman Oneida/Huntsville Hartsville Paris Hohenwald Pulaski Jacksboro Ripley Jackson Shelbyville Knoxville Whiteville Livingston
Tennessee Public Higher Education Governance/Coordination Structure
The Citizens of Tennessee
Governor
Tennessee Higher Education Commission
Tennessee Board of Regents
University of Tennessee at Chattanooga University of Tennessee at Knoxville
University of Tennessee at Martin University of Tennessee Health Science Center
University of Tennessee Space Institute Institute for Agriculture
Institute for Public Service
General Assembly
University of Tennessee System
Tennessee Higher Education Commission Fact Book 2013-2014 ix Introduction
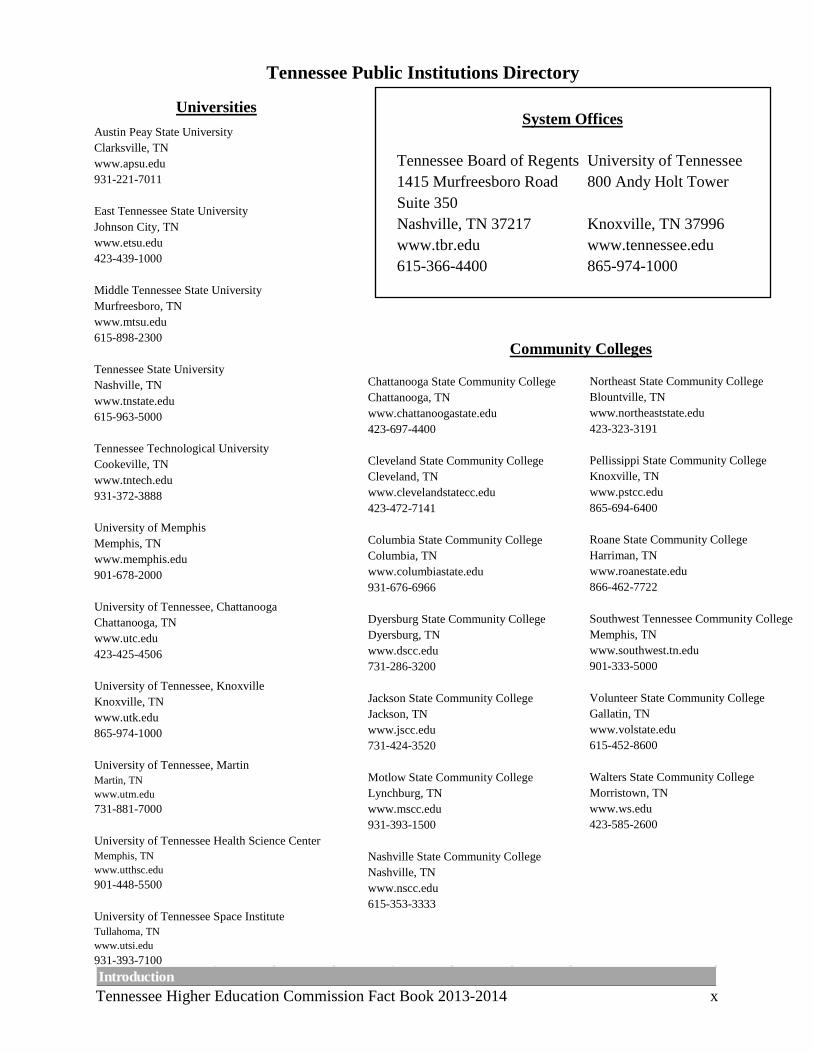
Tennessee Public Institutions Directory
Austin Peay State University Clarksville, TN www.apsu.edu 931-221-7011 East Tennessee State University Johnson City, TN www.etsu.edu 423-439-1000 Middle Tennessee State University Murfreesboro, TN www.mtsu.edu 615-898-2300 Tennessee State University Nashville, TN www.tnstate.edu 615-963-5000 Tennessee Technological University Cookeville, TN www.tntech.edu 931-372-3888 University of Memphis Memphis, TN www.memphis.edu 901-678-2000 University of Tennessee, Chattanooga Chattanooga, TN www.utc.edu 423-425-4506 University of Tennessee, Knoxville Knoxville, TN www.utk.edu 865-974-1000 University of Tennessee, Martin Martin, TN www.utm.edu 731-881-7000 University of Tennessee Health Science Center Memphis, TN www.utthsc.edu 901-448-5500 University of Tennessee Space Institute Tullahoma, TN www.utsi.edu 931-393-7100
Tennessee Board of Regents 1415 Murfreesboro Road Suite 350 Nashville, TN 37217 www.tbr.edu 615-366-4400
System Offices
Community Colleges
Chattanooga State Community College Chattanooga, TN www.chattanoogastate.edu 423-697-4400 Cleveland State Community College Cleveland, TN www.clevelandstatecc.edu 423-472-7141 Columbia State Community College Columbia, TN www.columbiastate.edu 931-676-6966 Dyersburg State Community College Dyersburg, TN www.dscc.edu 731-286-3200 Jackson State Community College Jackson, TN www.jscc.edu 731-424-3520 Motlow State Community College Lynchburg, TN www.mscc.edu 931-393-1500 Nashville State Community College Nashville, TN www.nscc.edu 615-353-3333
Universities
University of Tennessee 800 Andy Holt Tower Knoxville, TN 37996 www.tennessee.edu 865-974-1000
Northeast State Community College Blountville, TN www.northeaststate.edu 423-323-3191 Pellissippi State Community College Knoxville, TN www.pstcc.edu 865-694-6400 Roane State Community College Harriman, TN www.roanestate.edu 866-462-7722 Southwest Tennessee Community College Memphis, TN www.southwest.tn.edu 901-333-5000 Volunteer State Community College Gallatin, TN www.volstate.edu 615-452-8600 Walters State Community College Morristown, TN www.ws.edu 423-585-2600
Tennessee Higher Education Commission Fact Book 2013-2014 x Introduction

Athens www.tcatathens.edu 423-744-2814 Chattanooga www.chattanoogastate.edu/tcat 423-697-4433 Covington www.tcatcovington.edu 901-475-2526 Crossville www.tcatcrossville.edu 931-484-7502 Crump www.tcatcrump.edu 731-632-3393 Dickson www.tcatdickson.edu 615-441-6220 Elizabethton www.tcatelizabethton.edu 423-543-0070 Harriman www.tcatharriman.edu 865-882-6703 Hartsville www.tcathartsville.edu 615-374-2147 Hohenwald www.tcathohenwald.edu 931-796-5351
Tennessee Colleges of Applied Technology Tennessee Public Institutions Directory
Jacksboro www.tcatjacksboro.edu 423-566-9629 Jackson www.tcatjackson.edu 731-424-0691 Knoxville www.tcatknoxville.edu 865-546-5567 Livingston www.tcatlivingston.edu 931-823-5525 McKenzie www.tcatmckenzie.edu 731-352-5364 McMinnville www.tcatmcminnville.edu 931-473-5587 Memphis www.tcatmemphis.edu 901-543-6100 Morristown www.tcatmorristown.edu 423-586-5771 Murfreesboro www.tcatmurfreesboro.edu 615-898-8010 Nashville www.tcatnashville.edu 615-425-5500
Newbern www.tcatnewbern.edu 731-627-2511 Oneida/Huntsville www.tcatoneida.edu 423-663-4900 Paris www.tcatparis.edu 731-644-7365 Pulaski www.tcatpulaski.edu 931-424-4014 Ripley www.tcatripley.edu 731-635-3368 Shelbyville www.tcatshelbyville.edu 931-685-5013 Whiteville www.tcatwhiteville.edu 731-254-8521
Tennessee Higher Education Commission Fact Book 2013-2014 xi Introduction

Tennessee Independent Colleges and Universities Association Member Institutions
TICUA Office www.ticua.org 615-242-6400 Nashville Aquinas College www.aquinascollege.edu Nashville Baptist College of Health Sciences www.bchs.edu Memphis Belmont University www.belmont.edu Nashville Bethel College www.bethelu.edu McKenzie Bryan College www.bryan.edu Dayton Carson-Newman College www.cn.edu Jefferson City Christian Brothers University www.cbu.edu Memphis Cumberland University www.cumberland.edu Lebanon Fisk University www.fisk.edu Nashville Free Will Baptist Bible College www.fwbbc.edu Nashville Freed-Hardeman University www.fhu.edu Henderson
Freed-Hardeman University www.fhu.edu Henderson Johnson Bible College www.johnsonu.edu Jackson King College www.king.edu Bristol Lane College www.lanecollege.edu Jackson Lee University www.leeuniversity.edu Cleveland LeMoyne-Owen College www.loc.edu Memphis Lincoln Memorial University www.lmunet.edu Harrogate Lipscomb University www.lipscomb.edu Nashville Martin Methodist College www.martinmethodist.edu Pulaski Maryville College www.maryvillecollege.edu Maryville Meharry Medical College www.mmc.edu Nashville Memphis College of Art www.mca.edu Memphis
Middle Tennessee School of Anesthesia www.mtsa.edu Madison Milligan College www.milligan.edu Milligan College Rhodes College www.rhodes.edu Memphis Sewanee: The University of the South www.sewanee.edu Sewanee Southern Adventist University www.southern.edu Collegedale Southern College of Optometry www.sco.edu Memphis Tennessee Wesleyan College www.twcnet.edu Athens Trevecca Nazarene University www.trevecca.edu Nashville Tusculum College www.tusculum.edu Greeneville Union University www.uu.edu Jackson Vanderbilt University www.vanderbilt.edu Nashville Watkins College of Art, Design, and Film www.watkins.edu Nashville
Tennessee Higher Education Commission Fact Book 2013-2014 xii Introduction

Tennessee Higher Education Commission Fact Book 2013-2014 1 Student Participation
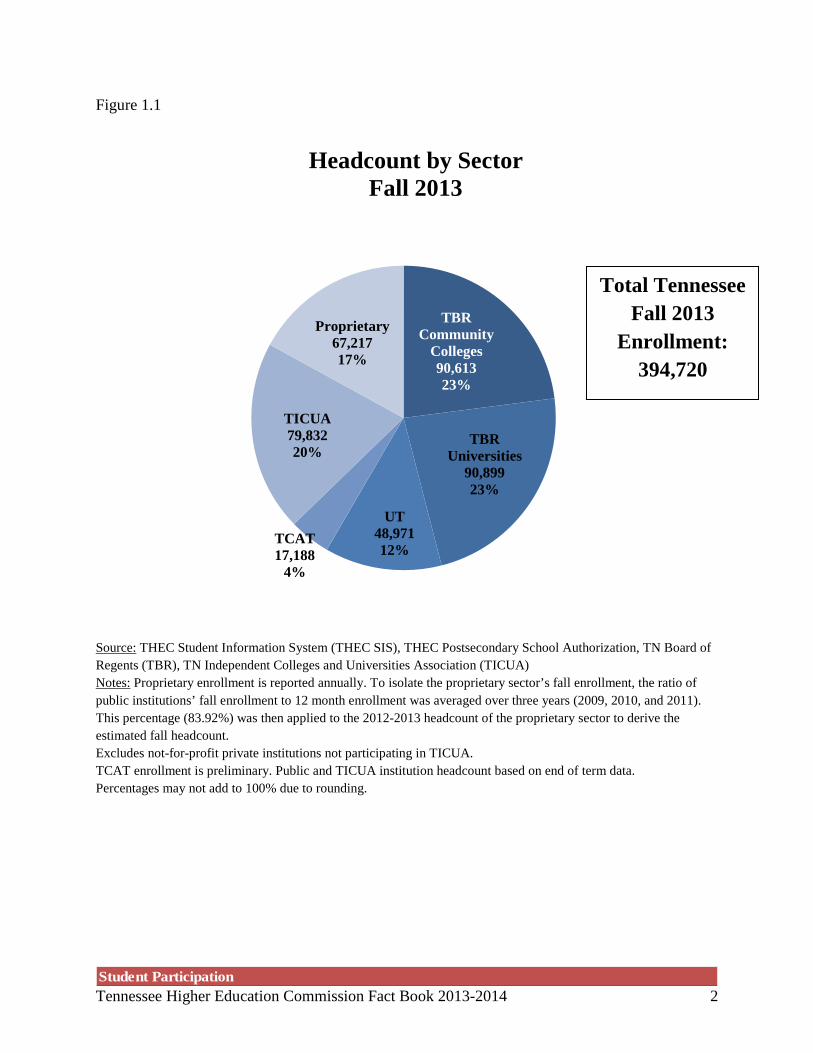
Figure 1.1
Source: THEC Student Information System (THEC SIS), THEC Postsecondary School Authorization, TN Board of Regents (TBR), TN Independent Colleges and Universities Association (TICUA) Notes: Proprietary enrollment is reported annually. To isolate the proprietary sector’s fall enrollment, the ratio of public institutions’ fall enrollment to 12 month enrollment was averaged over three years (2009, 2010, and 2011). This percentage (83.92%) was then applied to the 2012-2013 headcount of the proprietary sector to derive the estimated fall headcount. Excludes not-for-profit private institutions not participating in TICUA. TCAT enrollment is preliminary. Public and TICUA institution headcount based on end of term data. Percentages may not add to 100% due to rounding.
TBR Community
Colleges 90,613 23%
TBR Universities
90,899 23%
UT 48,971 12%
TCAT 17,188
4%
TICUA 79,832 20%
Proprietary 67,217 17%
Headcount by Sector Fall 2013
Total Tennessee Fall 2013
Enrollment: 394,720
Tennessee Higher Education Commission Fact Book 2013-2014 2 Student Participation

Figure 1.2
Source: THEC SIS, THEC Postsecondary School Authorization, TBR, TICUA Notes: Due to limitations in the data, this table does not report FTE for the proprietary sector. Full-Time Equivalent (FTE) enrollment is calculated in a manner consistent with the Outcomes Funding Formula definition found in Section 4. UT Health Science Center, UT Veterinary School, ETSU College of Medicine and College of Pharmacy FTE are equivalent to headcount. TCAT FTE is preliminary. Public and TICUA institution FTE based on end of term data. Percentages may not add to 100% due to rounding.
TBR Community
Colleges 56,392 22%
TBR Universities
74,007 28% UT
43,481 17%
TCAT 12,102
5%
TICUA 74,891 29%
FTE by Sector Fall 2013
Tennessee Higher Education Commission Fact Book 2013-2014 3 Student Participation

Public Higher Education Enrollment Total Trends Fall 2003-Fall 2013
Figure 1.3
Public Higher Education Enrollment Percent Changes Fall 2003-Fall 2013
Figure 1.4
Source: THEC SIS Note: Public higher education enrollment excludes TN Colleges of Applied Technology. Based on end of term data. UT Health Science Center, UT Veterinary School, ETSU College of Medicine and College of Pharmacy FTE are equivalent to headcount.
195,881 214,262
230,483
152,048 164,135
173,880
120,000
140,000
160,000
180,000
200,000
220,000
240,000
260,000
2003 2004 2005 2006 2007 2008 2009 2010 2011 2012 2013
Total Headcount Total FTE
-2.3% -2.3%
7.6% 5.9%
17.7%
14.4%
Headcount FTE
1 Year5 Years10 Years
Tennessee Higher Education Commission Fact Book 2013-2014 4 Student Participation

Table 1.1
Source: THEC SIS Notes: East Tennessee State University includes the Medical and Pharmacy schools. The University of Tennessee, Knoxville includes the Veterinary school and the UT Space Institute. Enrollments are for credit-bearing courses only. Based on end of term data.
Institution 2003 2008 2009 2010 2011 2012 2013
Chattanooga State Community College 8,120 8,485 9,431 10,436 10,498 10,160 10,123 Cleveland State Community College 3,161 3,335 3,615 3,754 3,832 3,640 3,812 Columbia State Community College 4,613 4,767 5,581 5,648 5,514 5,379 5,287 Dyersburg State Community College 2,515 2,749 3,395 3,759 3,777 3,595 3,271 Jackson State Community College 3,993 4,381 5,109 5,375 4,935 4,497 4,593 Motlow State Community College 3,478 4,394 5,079 5,256 5,004 4,782 4,925 Nashville State Community College 6,766 7,716 8,869 9,906 9,883 9,887 10,163 Northeast State Community College 4,836 5,470 6,270 6,780 6,478 6,446 5,895 Pellissippi State Community College 7,563 8,742 10,297 11,169 11,464 10,681 10,836 Roane State Community College 5,385 5,531 6,281 6,881 6,906 6,659 6,361 Southwest Tennessee Community College 11,629 11,427 13,016 13,505 13,038 12,235 10,876 Volunteer State Community College 6,991 7,241 8,430 9,029 8,694 8,210 8,190 Walters State Community College 6,214 5,918 6,853 6,960 6,754 6,571 6,281 TBR Community College Total 75,264 80,156 92,226 98,458 96,777 92,742 90,613
Austin Peay State University 7,623 9,401 10,188 10,744 10,888 10,616 10,449 East Tennessee State University 11,624 13,646 14,421 14,999 15,286 15,202 14,751 Middle Tennessee State University 21,744 23,866 25,188 26,654 26,664 25,578 24,079 Tennessee State University 9,024 8,253 8,824 8,961 9,214 8,881 8,833 Tennessee Technological University 9,107 10,793 10,847 11,528 11,748 11,583 11,200 University of Memphis 19,911 20,214 21,420 22,586 22,869 22,312 21,587 TBR University Total 79,033 86,173 90,888 95,472 96,669 94,172 90,899
University of Tennessee, Chattanooga 8,528 9,807 10,526 10,726 11,394 11,614 11,655 University of Tennessee, Knoxville 25,219 27,881 27,221 27,306 27,296 26,877 27,028 University of Tennessee, Martin 5,770 7,574 8,096 8,479 7,921 7,766 7,429 University of Tennessee, Medical Health Sci Center 2,067 2,671 2,837 2,692 2,789 2,799 2,859 UT University Total 41,584 47,933 48,680 49,203 49,400 49,056 48,971 University Total 120,617 134,106 139,568 144,675 146,069 143,228 139,870Grand Total 195,881 214,262 231,794 243,133 242,846 235,970 230,483
TBR Universities
TBR Community Colleges
Public Headcount Fall Terms 2003 and 2008 - 2013
UT Universities
Tennessee Higher Education Commission Fact Book 2013-2014 5 Student Participation

Table 1.2
Source: THEC SIS Notes: East Tennessee State University includes the Medical and Pharmacy schools. The University of Tennessee, Knoxville includes the Veterinary school and the UT Space Institute. End of term reflects student departures and students who enrolled after the 14th day.
Institution 14th Day End of Term
Chattanooga State Community College 9,910 10,123 + 2.1%Cleveland State Community College 3,790 3,812 + 0.6%Columbia State Community College 5,225 5,287 + 1.2%Dyersburg State Community College 3,258 3,271 + 0.4%Jackson State Community College 4,587 4,593 + 0.1%Motlow State Community College 4,900 4,925 + 0.5%Nashville State Community College 10,006 10,163 + 1.6%Northeast State Community College 5,893 5,895 + 0.0%Pellissippi State Community College 10,703 10,836 + 1.2%Roane State Community College 6,214 6,361 + 2.4%Southwest Tennessee Community College 10,817 10,876 + 0.5%Volunteer State Community College 8,153 8,190 + 0.5%Walters State Community College 6,265 6,281 + 0.3%TBR Community College Total 89,721 90,613 + 1.0%
Austin Peay State University 10,399 10,449 + 0.5%East Tennessee State University 14,691 14,751 + 0.4%Middle Tennessee State University 23,881 24,079 + 0.8%Tennessee State University 8,816 8,833 + 0.2%Tennessee Technological University 11,115 11,200 + 0.8%University of Memphis 21,480 21,587 + 0.5%TBR University Total 90,382 90,899 + 0.6%
University of Tennessee, Chattanooga 11,644 11,655 + 0.1%University of Tennessee, Knoxville 26,836 27,028 + 0.7%University of Tennessee, Martin 7,412 7,429 + 0.2%University of Tennessee, Medical Health Sci Center 2,859 2,859 + 0.0%UT University Total 48,751 48,971 + 0.5%University Total 139,133 139,870 + 0.5%Grand Total 228,854 230,483 + 0.7%
14th Day Enrollment and End of Term Enrollment Fall 2013
TBR Community Colleges
TBR Universities
UT Universities
Percent Change
Tennessee Higher Education Commission Fact Book 2013-2014 6 Student Participation

Table 1.3
Source: THEC SIS & TBR Notes: East Tennessee State University includes the Medical and Pharmacy schools. The University of Tennessee, Knoxville includes the Veterinary school and the UT Space Institute. Withdrawals reflect students who enrolled by the 14th day and then departed by the end of term.
Institution 14th Day Withdrawals Percent Change
Chattanooga State Community College 9,910 335 -3.4%Cleveland State Community College 3,790 218 -5.8%Columbia State Community College 5,225 250 -4.8%Dyersburg State Community College 3,258 179 -5.5%Jackson State Community College 4,587 174 -3.8%Motlow State Community College 4,900 171 -3.5%Nashville State Community College 10,006 574 -5.7%Northeast State Community College 5,893 233 -4.0%Pellissippi State Community College 10,703 422 -3.9%Roane State Community College 6,214 212 -3.4%Southwest Tennessee Community College 10,817 561 -5.2%Volunteer State Community College 8,153 347 -4.3%Walters State Community College 6,265 223 -3.6%TBR Community College Total 89,721 3,899 -4.3%
Austin Peay State University 10,399 187 -1.8%East Tennessee State University 14,691 390 -2.7%Middle Tennessee State University 23,881 543 -2.3%Tennessee State University 8,816 412 -4.7%Tennessee Technological University 11,115 221 -2.0%University of Memphis 21,480 785 -3.7%TBR University Total 90,382 2,538 -2.8%
University of Tennessee, Chattanooga 11,644 127 -1.1%University of Tennessee, Knoxville 26,836 333 -1.2%University of Tennessee, Martin 7,412 213 -2.9%University of Tennessee, Medical Health Sci Center 2,859 7 -0.2%UT University Total 48,751 680 -1.4%University Total 139,133 3,218 -3.3%Grand Total 228,854 7,117 -3.7%
Student Withdrawals After 14th Day Enrollment Fall 2013
TBR Universities
TBR Community Colleges
UT Universities
Tennessee Higher Education Commission Fact Book 2013-2014 7 Student Participation

Table 1.4
Source: THEC SIS Notes: East Tennessee State University includes the Medical and Pharmacy schools. The University of Tennessee, Knoxville includes the Veterinary School and the UT Space Institute. UT Health Science Center, UT Veterinary School, ETSU College of Medicine and College of Pharmacy FTE are equivalent to headcount. Enrollments are for credit-bearing courses only. Based on end of term data.
Institution 2003 2008 2009 2010 2011 2012 2013
Chattanooga State Community College 5,186 5,334 5,987 6,712 6,671 6,585 6,388 Cleveland State Community College 2,224 2,195 2,504 2,592 2,617 2,482 2,487 Columbia State Community College 3,082 3,081 3,569 3,579 3,417 3,348 3,352 Dyersburg State Community College 1,819 1,741 2,213 2,419 2,334 2,217 1,918 Jackson State Community College 2,743 2,803 3,313 3,410 3,260 2,847 2,722 Motlow State Community College 2,436 2,892 3,353 3,337 3,069 2,925 2,984 Nashville State Community College 3,769 4,315 5,154 5,619 5,686 5,681 5,796 Northeast State Community College 3,112 3,606 4,231 4,624 4,423 4,289 3,912 Pellissippi State Community College 5,013 5,686 6,695 7,274 7,402 7,057 6,978 Roane State Community College 3,775 3,766 4,227 4,389 4,205 4,153 3,964 Southwest Tennessee Community College 7,361 7,219 8,465 8,431 8,216 7,555 6,801 Volunteer State Community College 4,426 4,582 5,501 5,777 5,449 5,091 4,985 Walters State Community College 4,067 4,082 4,780 4,808 4,595 4,425 4,103 TBR Community College Total 49,013 51,302 59,993 62,973 61,343 58,656 56,392
Austin Peay State University 6,278 7,499 7,566 8,493 8,513 8,508 8,416 East Tennessee State University 9,936 11,448 12,116 12,794 13,030 12,784 12,374 Middle Tennessee State University 18,735 20,062 21,049 22,010 21,807 20,824 19,637 Tennessee State University 7,716 6,694 7,025 7,142 7,159 6,901 7,080 Tennessee Technological University 7,509 8,568 9,057 9,361 9,525 9,636 9,797 University of Memphis 15,720 15,910 16,792 17,536 17,725 17,462 16,704 TBR University Total 65,894 70,181 73,605 77,336 77,759 76,114 74,007
University of Tennessee, Chattanooga 7,138 8,446 9,116 9,788 9,845 9,951 10,208 University of Tennessee, Knoxville 22,730 25,097 24,624 24,219 23,519 23,610 23,860 University of Tennessee, Martin 5,265 6,305 6,714 6,959 6,852 6,770 6,555 University of Tennessee, Medical Health Sci Center 2,008 2,671 2,837 2,623 2,789 2,799 2,859 University of Tennessee Total 37,141 42,519 43,291 43,589 43,005 43,129 43,481 University Total 103,035 112,700 116,896 120,926 120,764 119,243 117,489Grand Total 152,048 164,002 176,889 183,898 182,107 177,899 173,880
Public FTE Enrollment Fall Terms 2003 and 2008 - 2013
TBR Universities
TBR Community Colleges
UT Universities
Tennessee Higher Education Commission Fact Book 2013-2014 8 Student Participation

Table 1.5
Source: THEC SIS Notes: East Tennessee State University includes the Medical and Pharmacy schools. The University of Tennessee, Knoxville includes the Veterinary school and the UT Space Institute. UT Health Science Center, UT Veterinary School, ETSU College of Medicine and College of Pharmacy FTE are equivalent to headcount. Enrollments are for credit-bearing courses only. Based on end of term data.
Institution 2003 2008 2009 2010 2011 2012 2013
Chattanooga State Community College 63.9% 62.9% 63.5% 64.3% 63.5% 64.8% 63.1%Cleveland State Community College 70.4% 65.8% 69.3% 69.0% 68.3% 68.2% 65.2%Columbia State Community College 66.8% 64.6% 63.9% 63.4% 62.0% 62.2% 63.4%Dyersburg State Community College 72.3% 63.3% 65.2% 64.4% 61.8% 61.7% 58.6%Jackson State Community College 68.7% 64.0% 64.8% 63.4% 66.0% 63.3% 59.3%Motlow State Community College 70.0% 65.8% 66.0% 63.5% 61.3% 61.2% 60.6%Nashville State Community College 55.7% 55.9% 58.1% 56.7% 57.5% 57.5% 57.0%Northeast State Community College 64.4% 65.9% 67.5% 68.2% 68.3% 66.5% 66.4%Pellissippi State Community College 66.3% 65.0% 65.0% 65.1% 64.6% 66.1% 64.4%Roane State Community College 70.1% 68.1% 67.3% 63.8% 60.9% 62.4% 62.3%Southwest Tennessee Community College 63.3% 63.2% 65.0% 62.4% 63.0% 61.8% 62.5%Volunteer State Community College 63.3% 63.3% 65.3% 64.0% 62.7% 62.0% 60.9%Walters State Community College 65.4% 69.0% 69.7% 69.1% 68.0% 67.3% 65.3%TBR Community College Total 65.1% 64.0% 65.0% 64.0% 63.4% 63.2% 62.2%
Austin Peay State University 82.4% 79.8% 74.3% 79.0% 78.2% 80.1% 80.5%East Tennessee State University 85.5% 83.9% 84.0% 85.3% 85.2% 84.1% 83.9%Middle Tennessee State University 86.2% 84.1% 83.6% 82.6% 81.8% 81.4% 81.6%Tennessee State University 85.5% 81.1% 79.6% 79.7% 77.7% 77.7% 80.2%Tennessee Technological University 82.5% 79.4% 83.5% 81.2% 81.1% 83.2% 87.5%University of Memphis 79.0% 78.7% 78.4% 77.6% 77.5% 78.3% 77.4%TBR University Total 83.4% 81.4% 81.0% 81.0% 80.4% 80.8% 81.4%
University of Tennessee, Chattanooga 83.7% 86.1% 86.6% 91.3% 86.4% 85.7% 87.6%University of Tennessee, Knoxville 90.1% 90.0% 90.5% 88.7% 86.2% 87.8% 88.3%University of Tennessee, Martin 91.2% 83.2% 82.9% 82.1% 86.5% 87.2% 88.2%University of Tennessee, Medical Health Sci Center 97.1% 100.0% 100.0% 97.0% 100.0% 100.0% 100.0%University of Tennessee Total 89.3% 88.7% 88.9% 88.6% 87.1% 87.9% 88.8%University Total 85.4% 84.0% 83.8% 83.6% 82.7% 83.3% 84.0%Grand Total 77.6% 76.5% 76.3% 75.6% 75.0% 75.4% 75.4%
TBR Universities
UT Universities
TBR Community Colleges
FTE as a Percent of Headcount Enrollment Fall Terms 2003 and 2008 - 2013
Tennessee Higher Education Commission Fact Book 2013-2014 9 Student Participation

Table 1.6
Source: TBR Note: FTE is calculated as the total number of contact hours divided by 900. TCAT calculations are based on enrollment data from the summer, fall, and spring academic terms.
Institution Headcount FTEFTE as
Percent of Headcount
Contact Hours
Athens 493 233 47.3% 209,830Chattanooga 2,076 1,046 50.4% 940,456Covington 375 182 48.5% 163,894Crossville 729 317 43.5% 284,908Crump 384 240 62.5% 216,418Dickson 915 532 58.1% 479,294Elizabethton 1,025 567 55.3% 509,686Harriman 523 270 51.6% 243,178Hartsville 913 401 43.9% 360,595Hohenwald 681 385 56.5% 346,423Jacksboro 344 205 59.6% 184,097Jackson 1,386 523 37.7% 470,930Knoxville 1,458 641 44.0% 576,834Livingston 1,695 407 24.0% 366,460McKenzie 341 263 77.1% 236,756McMinnville 591 231 39.1% 208,137Memphis 1,538 867 56.4% 780,422Morristown 1,102 548 49.7% 493,142Murfreesboro 5,900 507 8.6% 456,503Nashville 1,568 794 50.6% 714,757Newbern 489 357 73.0% 321,328Oneida/Huntsville 503 219 43.5% 196,963Paris 590 352 59.7% 317,213Pulaski 1,277 337 26.4% 303,772Ripley 540 166 30.7% 149,219Shelbyville 983 509 51.8% 457,952Whiteville 532 158 29.7% 143,176Grand Total 28,951 11,257 38.9% 10,132,343
Tennessee Colleges of Applied Technology Enrollment Academic Year 2012-2013
Tennessee Higher Education Commission Fact Book 2013-2014 10 Student Participation

Full-Time and Part-Time Enrollment Fall 2013 Community Colleges
Figure 1.5
Public Universities Figure 1.6
Source: THEC SIS Note: Based on end of term data.
Tennessee Higher Education Commission Fact Book 2013-2014 11 Student Participation

Table 1.7
Source: THEC SIS Notes: East Tennessee State University includes the Medical and Pharmacy schools. Based on end of term data. The University of Tennessee, Knoxville includes the Veterinary school and the UT Space Institute.
Headcount Percent of Total
Headcount Percent of Total
Headcount Percent of Total
Chattanooga State Community College 1,715 16.9% 10,123 100.0%Cleveland State Community College 744 19.5% 3,812 100.0%Columbia State Community College 986 18.6% 5,287 100.0%Dyersburg State Community College 629 19.2% 3,271 100.0%Jackson State Community College 874 19.0% 4,593 100.0%Motlow State Community College 1,145 23.2% 4,925 100.0%Nashville State Community College 1,599 15.7% 10,163 100.0%Northeast State Community College 1,019 17.3% 5,895 100.0%Pellissippi State Community College 2,153 19.9% 10,836 100.0%Roane State Community College 1,199 18.8% 6,361 100.0%Southwest Tennessee Community College 2,217 20.4% 10,876 100.0%Volunteer State Community College 1,478 18.0% 8,190 100.0%Walters State Community College 1,366 21.7% 6,281 100.0%TBR Community College Total 17,124 18.9% 90,613 100.0%
Austin Peay State University 1,541 14.7% 9,589 91.8% 860 8.2%East Tennessee State University 1,842 12.5% 11,868 80.5% 2,883 19.5%Middle Tennessee State University 3,182 13.2% 21,342 88.6% 2,737 11.4%Tennessee State University 1,326 15.0% 6,760 76.5% 2,073 23.5%Tennessee Technological University 2,152 19.2% 10,128 90.4% 1,072 9.6%University of Memphis 2,082 9.6% 17,285 80.1% 4,302 19.9%TBR University Total 12,125 13.3% 76,972 84.7% 13,927 15.3%
University of Tennessee, Chattanooga 2,342 20.1% 10,275 88.2% 1,380 11.8%University of Tennessee, Knoxville 4,253 15.7% 20,901 77.3% 6,127 22.7%University of Tennessee, Martin 1,313 17.7% 7,031 94.6% 398 5.4%University of Tennessee, Medical Health Sci Center 0 0.0% 149 5.2% 2,710 94.8%UT University Total 7,908 16.1% 38,356 78.3% 10,615 21.7%University Total 20,033 14.3% 115,328 82.5% 24,542 17.5%Grand Total 37,157 16.1% 205,941 89.4% 24,542 10.6%
UT Universities
Fall 2013Public Headcount by Student Level
Institution
TBR Community Colleges
TBR Universities
First-Time Freshman Total Undergraduate Graduate & Professional
Tennessee Higher Education Commission Fact Book 2013-2014 12 Student Participation

Table 1.8
Source: THEC SIS Notes: East Tennessee State University includes the Medical and Pharmacy schools. Based on end of term data. The University of Tennessee, Knoxville includes the Veterinary school and the UT Space Institute. Headcount by gender does not sum to the total headcount for 2012-13 due to an “unknown” gender classification.
Headcount Percent Headcount Percent
Chattanooga State Community College 4,049 40.0% 6,074 60.0%Cleveland State Community College 1,524 40.0% 2,288 60.0%Columbia State Community College 1,882 35.6% 3,405 64.4%Dyersburg State Community College 1,099 33.6% 2,172 66.4%Jackson State Community College 1,561 34.0% 3,032 66.0%Motlow State Community College 1,937 39.3% 2,988 60.7%Nashville State Community College 4,060 40.0% 6,101 60.0%Northeast State Community College 2,776 47.1% 3,119 52.9%Pellissippi State Community College 5,080 46.9% 5,756 53.1%Roane State Community College 2,190 34.4% 4,171 65.6%Southwest Tennessee Community College 4,123 37.9% 6,753 62.1%Volunteer State Community College 3,157 38.5% 5,033 61.5%Walters State Community College 2,436 38.8% 3,845 61.2%TBR Community College Total 35,874 39.6% 54,737 60.4%
Austin Peay State University 4,108 39.3% 6,341 60.7%East Tennessee State University 6,159 41.8% 8,592 58.2%Middle Tennessee State University 11,017 45.8% 13,062 54.2%Tennessee State University 3,235 36.6% 5,598 63.4%Tennessee Technological University 6,082 54.3% 5,118 45.7%University of Memphis 8,618 39.9% 12,969 60.1%TBR University Total 39,219 43.1% 51,680 56.9%
University of Tennessee, Chattanooga 5,245 45.0% 6,410 55.0%University of Tennessee, Knoxville 13,613 50.4% 13,415 49.6%University of Tennessee, Martin 3,109 41.8% 4,320 58.2%University of Tennessee, Medical Health Sci Center 1,211 42.4% 1,648 57.6%UT University Total 23,178 47.3% 25,793 52.7%University Total 62,397 44.6% 77,473 55.4%Grand Total 98,271 42.6% 132,210 57.4%
Public Headcount by Gender
Institution
TBR Community Colleges
TBR Universities
UT Universities
Male FemaleFall 2013
Tennessee Higher Education Commission Fact Book 2013-2014 13 Student Participation

Table 1.9
Source: THEC SIS Notes: “Other” consists of Alaskan Native, American Indian, and Asian or Pacific Islander. “Multiracial” consists of any students that selected more than one race. If a student identified their ethnicity as Hispanic, they appear in the “Hispanic” column as well as the column for their race designation, pursuant to Department of Education reporting guidelines. Based on end of term data.
# % # % # % # % # % # % # %
Chattanooga State Community College 7,551 75% 1,617 16% 294 2.9% 140 1.4% 205 2.0% 316 3.1% 10,123 100%Cleveland State Community College 3,127 82% 248 7% 119 3.1% 37 1.0% 75 2.0% 206 5.4% 3,812 100%Columbia State Community College 4,411 83% 367 7% 181 3.4% 101 1.9% 69 1.3% 158 3.0% 5,287 100%Dyersburg State Community College 2,493 76% 599 18% 68 2.1% 35 1.1% 36 1.1% 40 1.2% 3,271 100%Jackson State Community College 3,450 75% 822 18% 74 1.6% 44 1.0% 41 0.9% 162 3.5% 4,593 100%Motlow State Community College 3,947 80% 425 9% 187 3.8% 65 1.3% 112 2.3% 189 3.8% 4,925 100%Nashville State Community College 5,805 57% 3,012 30% 468 4.6% 129 1.3% 465 4.6% 284 2.8% 10,163 100%Northeast State Community College 5,195 88% 162 3% 101 1.7% 55 0.9% 40 0.7% 342 5.8% 5,895 100%Pellissippi State Community College 8,951 83% 842 8% 366 3.4% 258 2.4% 301 2.8% 118 1.1% 10,836 100%Roane State Community College 5,682 89% 180 3% 159 2.5% 105 1.7% 84 1.3% 151 2.4% 6,361 100%Southwest Tennessee Community College 3,209 30% 6,568 60% 424 3.9% 185 1.7% 356 3.3% 134 1.2% 10,876 100%Volunteer State Community College 6,575 80% 703 9% 285 3.5% 104 1.3% 137 1.7% 386 4.7% 8,190 100%Walters State Community College 5,839 93% 131 2% 150 2.4% 68 1.1% 64 1.0% 29 0.5% 6,281 100%TBR Community College Total 66,235 73.1% 15,676 17.3% 2,876 3.2% 1,326 1.5% 1,985 2.2% 2,515 2.8% 90,613 100%
Austin Peay State University 6,936 66% 1,923 18% 528 5.1% 313 3.0% 248 2.4% 501 4.8% 10,449 100%East Tennessee State University 12,477 85% 876 6% 277 1.9% 209 1.4% 489 3.3% 423 2.9% 14,751 100%Middle Tennessee State University 16,123 67% 4,727 20% 923 3.8% 468 1.9% 1,092 4.5% 746 3.1% 24,079 100%Tennessee State University 2,160 24% 5,838 66% 136 1.5% 124 1.4% 239 2.7% 336 3.8% 8,833 100%Tennessee Technological University 9,580 86% 470 4% 273 2.4% 151 1.3% 432 3.9% 294 2.6% 11,200 100%University of Memphis 11,520 53% 7,627 35% 655 3.0% 378 1.8% 1,073 5.0% 334 1.5% 21,587 100%TBR University Total 58,796 64.7% 21,461 23.6% 2,792 3.1% 1,643 1.8% 3,573 3.9% 2,634 2.9% 90,899 100%
University of Tennessee, Chattanooga 8,644 74% 1,358 12% 328 2.8% 437 3.7% 357 3.1% 531 4.6% 11,655 100%University of Tennessee, Knoxville 21,089 78% 1,872 7% 752 2.8% 472 1.7% 1,478 5.5% 1,365 5.1% 27,028 100%University of Tennessee, Martin 5,823 78% 1,176 16% 140 1.9% 88 1.2% 91 1.2% 111 1.5% 7,429 100%University of Tennessee, Medical Health Sci Ce 2,001 70% 359 13% 43 1.5% 19 0.7% 311 10.9% 126 4.4% 2,859 100%UT University Total 37,557 77% 4,765 10% 1,263 2.6% 1,016 2.1% 2,237 4.6% 2,133 4.4% 48,971 100%University Total 96,353 68.9% 26,226 18.8% 4,055 2.9% 2,659 1.9% 5,810 4.2% 4,767 3.4% 139,870 100%Grand Total 162,588 71% 41,902 18% 6,931 3.0% 3,985 1.7% 7,795 3.4% 7,282 3.2% 230,483 100%
UT Universities
Caucasian African American Hispanic Multiracial Other Unknown Total
Public Headcount by RaceFall 2013
TBR Community Colleges
TBR Universities
Tennessee Higher Education Commission Fact Book 2013-2014 14 Student Participation
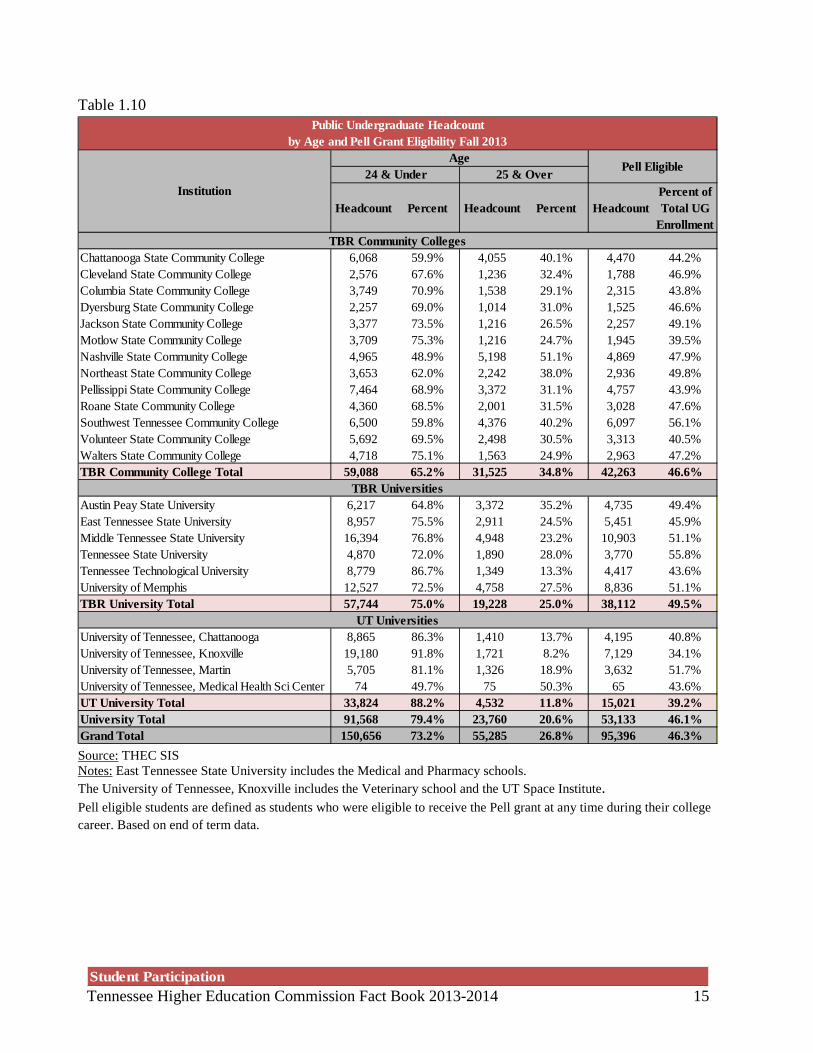
Table 1.10
Source: THEC SIS Notes: East Tennessee State University includes the Medical and Pharmacy schools. The University of Tennessee, Knoxville includes the Veterinary school and the UT Space Institute. Pell eligible students are defined as students who were eligible to receive the Pell grant at any time during their college career. Based on end of term data.
Headcount Percent Headcount Percent HeadcountPercent of Total UG
Enrollment
Chattanooga State Community College 6,068 59.9% 4,055 40.1% 4,470 44.2%Cleveland State Community College 2,576 67.6% 1,236 32.4% 1,788 46.9%Columbia State Community College 3,749 70.9% 1,538 29.1% 2,315 43.8%Dyersburg State Community College 2,257 69.0% 1,014 31.0% 1,525 46.6%Jackson State Community College 3,377 73.5% 1,216 26.5% 2,257 49.1%Motlow State Community College 3,709 75.3% 1,216 24.7% 1,945 39.5%Nashville State Community College 4,965 48.9% 5,198 51.1% 4,869 47.9%Northeast State Community College 3,653 62.0% 2,242 38.0% 2,936 49.8%Pellissippi State Community College 7,464 68.9% 3,372 31.1% 4,757 43.9%Roane State Community College 4,360 68.5% 2,001 31.5% 3,028 47.6%Southwest Tennessee Community College 6,500 59.8% 4,376 40.2% 6,097 56.1%Volunteer State Community College 5,692 69.5% 2,498 30.5% 3,313 40.5%Walters State Community College 4,718 75.1% 1,563 24.9% 2,963 47.2%TBR Community College Total 59,088 65.2% 31,525 34.8% 42,263 46.6%
Austin Peay State University 6,217 64.8% 3,372 35.2% 4,735 49.4%East Tennessee State University 8,957 75.5% 2,911 24.5% 5,451 45.9%Middle Tennessee State University 16,394 76.8% 4,948 23.2% 10,903 51.1%Tennessee State University 4,870 72.0% 1,890 28.0% 3,770 55.8%Tennessee Technological University 8,779 86.7% 1,349 13.3% 4,417 43.6%University of Memphis 12,527 72.5% 4,758 27.5% 8,836 51.1%TBR University Total 57,744 75.0% 19,228 25.0% 38,112 49.5%
University of Tennessee, Chattanooga 8,865 86.3% 1,410 13.7% 4,195 40.8%University of Tennessee, Knoxville 19,180 91.8% 1,721 8.2% 7,129 34.1%University of Tennessee, Martin 5,705 81.1% 1,326 18.9% 3,632 51.7%University of Tennessee, Medical Health Sci Center 74 49.7% 75 50.3% 65 43.6%UT University Total 33,824 88.2% 4,532 11.8% 15,021 39.2%University Total 91,568 79.4% 23,760 20.6% 53,133 46.1%Grand Total 150,656 73.2% 55,285 26.8% 95,396 46.3%
Public Undergraduate Headcount
TBR Community Colleges
TBR Universities
UT Universities
AgePell Eligible24 & Under 25 & Over
Institution
by Age and Pell Grant Eligibility Fall 2013
Tennessee Higher Education Commission Fact Book 2013-2014 15 Student Participation

Table 1.11
Source: THEC SIS Notes: East Tennessee State University includes the Medical and Pharmacy schools. Based on end of term data. The University of Tennessee, Knoxville includes the Veterinary school and the UT Space Institute.
# % # % # % # %
Chattanooga State Community College 8,961 88.5% 1,135 11.2% 27 0.3% 10,123 100%Cleveland State Community College 3,719 97.6% 81 2.1% 12 0.3% 3,812 100%Columbia State Community College 5,201 98.4% 67 1.3% 19 0.4% 5,287 100%Dyersburg State Community College 3,241 99.1% * 0.8% * 0.2% 3,271 100%Jackson State Community College 4,566 99.4% * 0.4% * 0.2% 4,593 100%Motlow State Community College 4,851 98.5% 55 1.1% 19 0.4% 4,925 100%Nashville State Community College 9,474 93.2% 574 5.6% 115 1.1% 10,163 100%Northeast State Community College 5,740 97.4% 147 2.5% 8 0.1% 5,895 100%Pellissippi State Community College 10,512 97.0% 200 1.8% 124 1.1% 10,836 100%Roane State Community College 6,274 98.6% 65 1.0% 22 0.3% 6,361 100%Southwest Tennessee Community College 10,458 96.2% 234 2.2% 184 1.7% 10,876 100%Volunteer State Community College 8,029 98.0% 107 1.3% 54 0.7% 8,190 100%Walters State Community College 6,208 98.8% 48 0.8% 25 0.4% 6,281 100%TBR Community College Total 87,234 96.3% 2,758 3.0% 621 0.7% 90,613 100%
Austin Peay State University 8,620 82.5% 1,772 17.0% 57 0.5% 10,449 100%East Tennessee State University 11,927 80.9% 2,317 15.7% 507 3.4% 14,751 100%Middle Tennessee State University 21,617 89.8% 1,563 6.5% 899 3.7% 24,079 100%Tennessee State University 6,568 74.4% 1,972 22.3% 293 3.3% 8,833 100%Tennessee Technological University 9,903 88.4% 306 2.7% 991 8.8% 11,200 100%University of Memphis 18,195 84.3% 2,713 12.6% 679 3.1% 21,587 100%TBR University Total 76,830 84.5% 10,643 11.7% 3,426 3.8% 90,899 100%
University of Tennessee, Chattanooga 10,618 91.1% 889 7.6% 148 1.3% 11,655 100%University of Tennessee, Knoxville 21,993 81.4% 3,830 14.2% 1,205 4.5% 27,028 100%University of Tennessee, Martin 6,891 92.8% 350 4.7% 188 2.5% 7,429 100%University of Tennessee, Medical Health Sci Center 2,063 72.2% 687 24.0% 109 3.8% 2,859 100%University of Tennessee Total 41,565 84.9% 5,756 11.8% 1,650 3.4% 48,971 100%University Total 118,395 84.6% 16,399 11.7% 5,076 3.6% 139,870 100%Grand Total 205,629 89.2% 19,157 8.3% 5,697 2.5% 230,483 100%
Public Headcount by Residency and Citizenship Status Fall 2013
Total
TBR Community Colleges
TBR Universities
UT Universities
Institution In-State Out-of-State Foreign
Tennessee Higher Education Commission Fact Book 2013-2014 16 Student Participation

Table 1.12
Source: THEC SIS Note: Major Fields are defined by their two digit THEC CIP code. Based on end of term data.
Major Field Undergraduate Graduate & Professional
TotalPercent of
TotalAgriculture 3,526 413 3,939 1.7%Architecture & Related Programs 342 100 442 0.2%Area, Ethnic & Cultural Studies 241 13 254 0.1%Biological Sciences/Life Sciences 4,643 814 5,457 2.4%Business Management & Administrative Services 19,923 2,496 22,419 9.7%Communications 5,094 344 5,438 2.4%Computer & Information Sciences 4,248 345 4,593 2.0%Education 8,750 4,390 13,140 5.7%Engineering 11,727 1,538 13,265 5.8%English Language & Literature/Letters 2,019 449 2,468 1.1%Foreign Languages & Literatures 708 78 786 0.3%Health Professions & Related Services 27,187 6,476 33,663 14.6%Home Economics 3,074 105 3,179 1.4%Law & Legal Studies 580 794 1,374 0.6%Liberal Arts & Sciences 38,049 412 38,461 16.7%Library Science 0 205 205 0.1%Mathematics 887 289 1,176 0.5%Multi/Interdisciplinary Studies 3,408 13 3,421 1.5%Other 19,631 939 20,570 8.9%Parks, Recreation, Leisure & Fitness Studies 5,682 642 6,324 2.7%Personal & Miscellaneous Services 216 0 216 0.1%Personal Improvement & Leisure Programs 596 0 596 0.3%Philosophy, Religion, & Theology 254 56 310 0.1%Physical Sciences 2,513 543 3,056 1.3%Protective Services & Public Affairs 6,801 1,179 7,980 3.5%Psychology 4,714 786 5,500 2.4%Social Sciences 5,141 691 5,832 2.5%Trades and Industrial 1,024 34 1,058 0.5%Undeclared 18,568 0 18,568 8.1%Visual & Performing Arts 6,395 398 6,793 2.9%Grand Total 205,941 24,542 230,483 100%
Public Headcount by Major FieldFall 2013
Tennessee Higher Education Commission Fact Book 2013-2014 17 Student Participation

Table 1.13
Source: THEC SIS Note: Total headcount is duplicated because students are counted at every location in which they enrolled in a course. UT Health Science Center, UT Veterinary School, ETSU College of Medicine and College of Pharmacy FTE are equivalent to headcount. Based on end of term data. More detailed breakouts of off-campus data are available in THEC’s Off-Campus Locations Report, www.tn.gov/thec/Legislative/Reports.html.
Institution Total Headcount
Off-Campus Headcount
Percent of Total
Total FTE Off-Campus FTE
Percent of Total
Chattanooga State Community College 11,024 1,995 18.1% 10,646 1,287 12.1%Cleveland State Community College 4,265 1,260 29.5% 4,145 704 17.0%Columbia State Community College 6,194 2,929 47.3% 5,587 2,350 42.1%Dyersburg State Community College 3,620 1,893 52.3% 3,197 1,395 43.6%Jackson State Community College 5,154 1,722 33.4% 4,537 1,010 22.3%Motlow State Community College 5,716 3,728 65.2% 4,973 3,101 62.4%Nashville State Community College 11,489 3,980 34.6% 9,660 3,066 31.7%Northeast State Community College 7,010 2,865 40.9% 6,520 2,153 33.0%Pellissippi State Community College 12,210 4,488 36.8% 11,631 3,777 32.5%Roane State Community College 8,066 5,278 65.4% 6,607 4,248 64.3%Southwest Tennessee Community College 14,321 2,765 19.3% 11,335 1,810 16.0%Volunteer State Community College 9,088 2,808 30.9% 8,308 1,831 22.0%Walters State Community College 7,372 3,727 50.6% 6,839 2,999 43.9%TBR Community College Total 105,529 39,438 37.4% 93,985 29,731 31.6%
Austin Peay State University 10,892 1,868 17.2% 13,850 1,644 11.9%East Tennessee State University 15,798 1,515 9.6% 20,884 947 4.5%Middle Tennessee State University 24,201 300 1.2% 32,212 194 0.6%Tennessee State University 10,896 3,110 28.5% 11,375 1,949 17.1%Tennessee Technological University 11,370 505 4.4% 16,126 617 3.8%University of Memphis 23,024 2,743 11.9% 26,899 1,536 5.7%TBR University Total 96,181 10,041 10.4% 121,346 6,887 5.7%
University of Tennessee, Chattanooga 11,740 162 1.4% 16,715 229 1.4%University of Tennessee, Knoxville 26,912 156 0.6% 38,420 166 0.4%University of Tennessee, Martin 7,624 1,117 14.7% 10,859 980 9.0%University of Tennessee, Medical Health Sci Center 2,857 0 0.0% 5,496 0 0.0%University of Tennessee Total 49,133 1,435 2.9% 71,490 1,375 1.9%University Total 145,314 11,476 7.9% 192,836 8,262 4.3%Grand Total 250,843 50,914 20.3% 286,821 37,993 13.2%
Off-Campus EnrollmentFall 2013
TBR Universities
TBR Community Colleges
UT Universities
Tennessee Higher Education Commission Fact Book 2013-2014 18 Student Participation
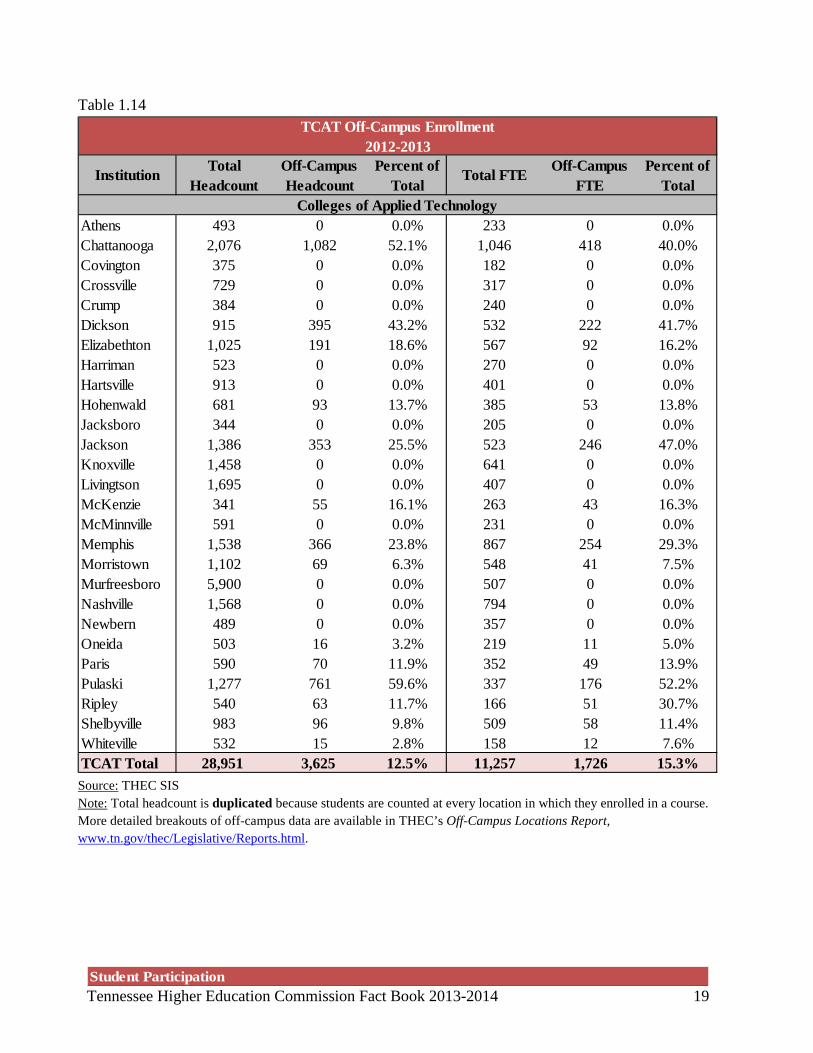
Table 1.14
Source: THEC SIS Note: Total headcount is duplicated because students are counted at every location in which they enrolled in a course. More detailed breakouts of off-campus data are available in THEC’s Off-Campus Locations Report, www.tn.gov/thec/Legislative/Reports.html.
Institution Total Headcount
Off-Campus Headcount
Percent of Total
Total FTE Off-Campus FTE
Percent of Total
Athens 493 0 0.0% 233 0 0.0%Chattanooga 2,076 1,082 52.1% 1,046 418 40.0%Covington 375 0 0.0% 182 0 0.0%Crossville 729 0 0.0% 317 0 0.0%Crump 384 0 0.0% 240 0 0.0%Dickson 915 395 43.2% 532 222 41.7%Elizabethton 1,025 191 18.6% 567 92 16.2%Harriman 523 0 0.0% 270 0 0.0%Hartsville 913 0 0.0% 401 0 0.0%Hohenwald 681 93 13.7% 385 53 13.8%Jacksboro 344 0 0.0% 205 0 0.0%Jackson 1,386 353 25.5% 523 246 47.0%Knoxville 1,458 0 0.0% 641 0 0.0%Livingtson 1,695 0 0.0% 407 0 0.0%McKenzie 341 55 16.1% 263 43 16.3%McMinnville 591 0 0.0% 231 0 0.0%Memphis 1,538 366 23.8% 867 254 29.3%Morristown 1,102 69 6.3% 548 41 7.5%Murfreesboro 5,900 0 0.0% 507 0 0.0%Nashville 1,568 0 0.0% 794 0 0.0%Newbern 489 0 0.0% 357 0 0.0%Oneida 503 16 3.2% 219 11 5.0%Paris 590 70 11.9% 352 49 13.9%Pulaski 1,277 761 59.6% 337 176 52.2%Ripley 540 63 11.7% 166 51 30.7%Shelbyville 983 96 9.8% 509 58 11.4%Whiteville 532 15 2.8% 158 12 7.6%TCAT Total 28,951 3,625 12.5% 11,257 1,726 15.3%
TCAT Off-Campus Enrollment2012-2013
Colleges of Applied Technology
Tennessee Higher Education Commission Fact Book 2013-2014 19 Student Participation

Table 1.15
Source: THEC SIS
InstitutionTotal First Time
FreshmenACT Score Reported
Percent with ACT Score
Average ACT Score
Chattanooga State Community College 1,715 1,120 65.3% 18.5Cleveland State Community College 744 596 80.1% 18.9Columbia State Community College 986 814 82.6% 19.5Dyersburg State Community College 629 449 71.4% 18.5Jackson State Community College 874 733 83.9% 18.1Motlow State Community College 1,145 980 85.6% 19.0Nashville State Community College 1,599 759 47.5% 17.7Northeast State Community College 1,019 707 69.4% 19.2Pellissippi State Community College 2,153 1,674 77.8% 19.8Roane State Community College 1,199 991 82.7% 19.2Southwest Tennessee Community College 2,217 1,677 75.6% 16.6Volunteer State Community College 1,478 1,102 74.6% 19.3Walters State Community College 1,366 1,141 83.5% 19.4TBR Community College Total 17,124 12,743 74.4% 18.7
Austin Peay State University 1,541 1,354 87.9% 21.5East Tennessee State University 1,842 1,578 85.7% 21.8Middle Tennessee State University 3,182 2,954 92.8% 21.8Tennessee State University 1,326 1,150 86.7% 18.0Tennessee Technological University 2,152 1,964 91.3% 22.9University of Memphis 2,082 1,959 94.1% 22.5TBR University Total 12,125 10,959 90.4% 21.4
University of Tennessee, Chattanooga 2,342 2,329 99.4% 22.9University of Tennessee, Knoxville 4,253 4,020 94.5% 26.2University of Tennessee, Martin 1,313 1,252 95.4% 22.0UT University Total 7,908 7,601 96.1% 23.7University Total 20,033 18,560 92.6% 22.2Grand Total 37,157 31,303 84.2% 20.2
Average ACT Scores of Incoming Freshmen Fall 2013
TBR Universities
TBR Community Colleges
UT Universities
Tennessee Higher Education Commission Fact Book 2013-2014 20 Student Participation

Table 1.16
Source: THEC SIS
Sending Institution Total Sent
APSU ETSU MTSU TSU TTU UoM UTC UTK UTM UTHSC
Austin Peay State University 96 * 26 18 8 8 * 12 15East Tennessee State University 124 8 31 * 11 10 9 48 *Middle Tennessee State University 229 21 * 36 29 49 26 35 22 *Tennessee State University 86 * * 45 * 14 * * 7Tennessee Technological University 121 * 8 48 7 7 20 19 * *University of Memphis 103 6 37 6 * * 13 22 12University of Tennessee, Chattanooga 221 21 9 67 9 10 23 67 15University of Tennessee, Knoxville 247 12 42 70 * 15 36 39 22 *University of Tennessee, Martin 102 8 * 20 * * 47 7 * *University Total 1,329 87 73 344 88 81 194 117 207 111 27Chattanooga State Community College 369 6 38 38 6 29 * 239 11 *Cleveland State Community College 110 16 15 * 15 * 44 18Columbia State Community College 306 19 6 169 16 15 * 27 23 27 *Dyersburg State Community College 154 6 * 8 * * 51 * * 78 *Jackson State Community College 261 8 * 39 * * 95 6 * 94 *Motlow State Community College 353 * * 218 20 81 14 15 *Nashville State Community College 450 65 * 148 152 45 * 12 13 8 *Northeast State Community College 303 * 268 9 7 * 16Pellissippi State Community College 633 19 50 32 * 63 * 36 425 *Roane State Community College 299 * 45 13 143 * 12 83Southwest Tennessee Community College 605 6 6 31 26 * 457 * 11 13 49Volunteer State Community College 413 61 11 133 82 66 * 17 35 *Walters State Community College 322 * 186 20 8 * 8 94TBR Community College Total 4,578 201 633 873 313 479 622 421 753 229 54
Undergraduate Transfer Student Activityby Sending Institution into Receiving Public University Fall 2013
Tennessee Higher Education Commission Fact Book 2013-2014 21 Student Participation
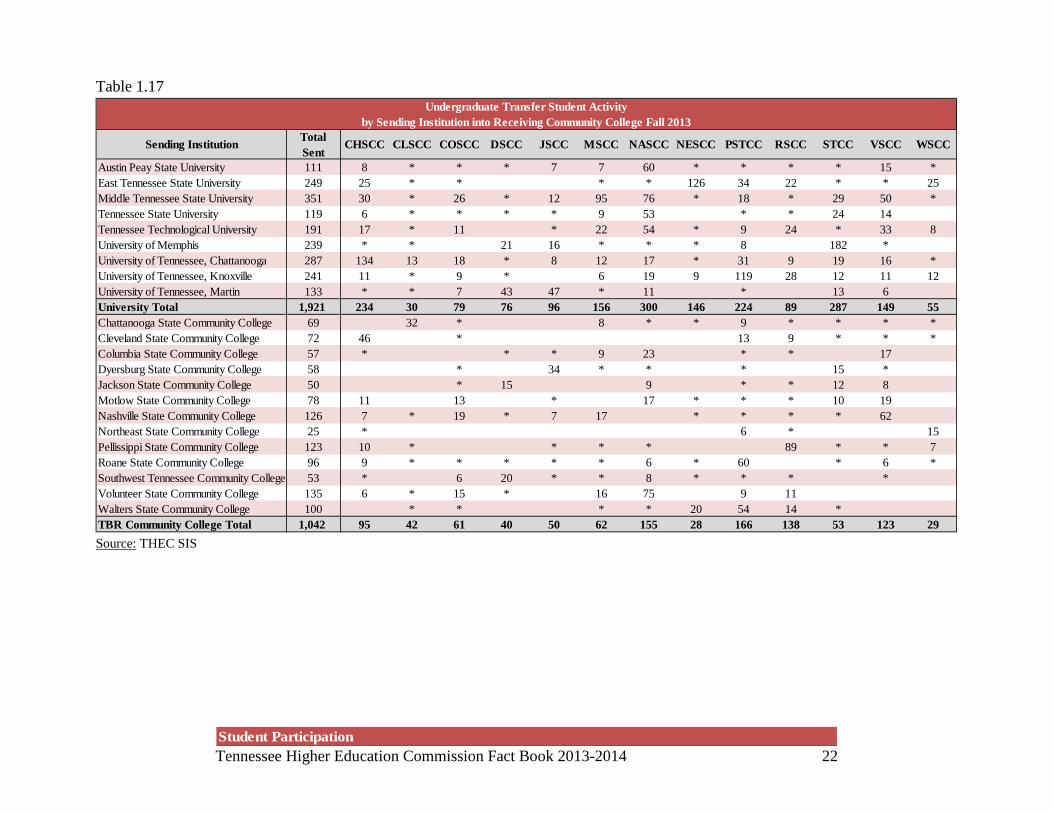
Table 1.17
Source: THEC SIS
Sending Institution Total Sent
CHSCC CLSCC COSCC DSCC JSCC MSCC NASCC NESCC PSTCC RSCC STCC VSCC WSCC
Austin Peay State University 111 8 * * * 7 7 60 * * * * 15 *East Tennessee State University 249 25 * * * * 126 34 22 * * 25Middle Tennessee State University 351 30 * 26 * 12 95 76 * 18 * 29 50 *Tennessee State University 119 6 * * * * 9 53 * * 24 14Tennessee Technological University 191 17 * 11 * 22 54 * 9 24 * 33 8University of Memphis 239 * * 21 16 * * * 8 182 *University of Tennessee, Chattanooga 287 134 13 18 * 8 12 17 * 31 9 19 16 *University of Tennessee, Knoxville 241 11 * 9 * 6 19 9 119 28 12 11 12University of Tennessee, Martin 133 * * 7 43 47 * 11 * 13 6University Total 1,921 234 30 79 76 96 156 300 146 224 89 287 149 55Chattanooga State Community College 69 32 * 8 * * 9 * * * *Cleveland State Community College 72 46 * 13 9 * * *Columbia State Community College 57 * * * 9 23 * * 17Dyersburg State Community College 58 * 34 * * * 15 *Jackson State Community College 50 * 15 9 * * 12 8Motlow State Community College 78 11 13 * 17 * * * 10 19Nashville State Community College 126 7 * 19 * 7 17 * * * * 62Northeast State Community College 25 * 6 * 15Pellissippi State Community College 123 10 * * * * 89 * * 7Roane State Community College 96 9 * * * * * 6 * 60 * 6 *Southwest Tennessee Community College 53 * 6 20 * * 8 * * * *Volunteer State Community College 135 6 * 15 * 16 75 9 11Walters State Community College 100 * * * * 20 54 14 *TBR Community College Total 1,042 95 42 61 40 50 62 155 28 166 138 53 123 29
Undergraduate Transfer Student Activityby Sending Institution into Receiving Community College Fall 2013
Tennessee Higher Education Commission Fact Book 2013-2014 22 Student Participation

Table 1.18
Source: THEC SIS Note: Based on end of term data.
TotalEnrolled in Any R&D
Course
Percent Enrolled in
R&DTotal
Enrolled in Any R&D
Course
Percent Enrolled in
R&D
Chattanooga State Community College 1,715 1,104 64.4% 10,123 2,168 21.4%Cleveland State Community College 744 479 64.4% 3,812 771 20.2%Columbia State Community College 986 555 56.3% 5,287 859 16.2%Dyersburg State Community College 629 422 67.1% 3,271 639 19.5%Jackson State Community College 874 637 72.9% 4,593 954 20.8%Motlow State Community College 1,145 692 60.4% 4,925 921 18.7%Nashville State Community College 1,599 1,025 64.1% 10,163 2,023 19.9%Northeast State Community College 1,019 639 62.7% 5,895 1,257 21.3%Pellissippi State Community College 2,153 1,318 61.2% 10,836 1,901 17.5%Roane State Community College 1,199 741 61.8% 6,361 1,206 19.0%Southwest Tennessee Community College 2,217 1,662 75.0% 10,876 3,077 28.3%Volunteer State Community College 1,478 793 53.7% 8,190 1,311 16.0%Walters State Community College 1,366 850 62.2% 6,281 1,094 17.4%Grand Total 17,124 10,917 63.8% 90,613 18,181 20.1%
All Enrolled StudentsFall 2013
Remedial and Developmental Enrollment
TBR Community Colleges
Institution
First-Time Full-Time Freshmen
Tennessee Higher Education Commission Fact Book 2013-2014 23 Student Participation

Page Intentionally Left Blank
Tennessee Higher Education Commission Fact Book 2013-2014 24 Student Participation

Tennessee Higher Education Commission Fact Book 2013-2014 25 Student Success
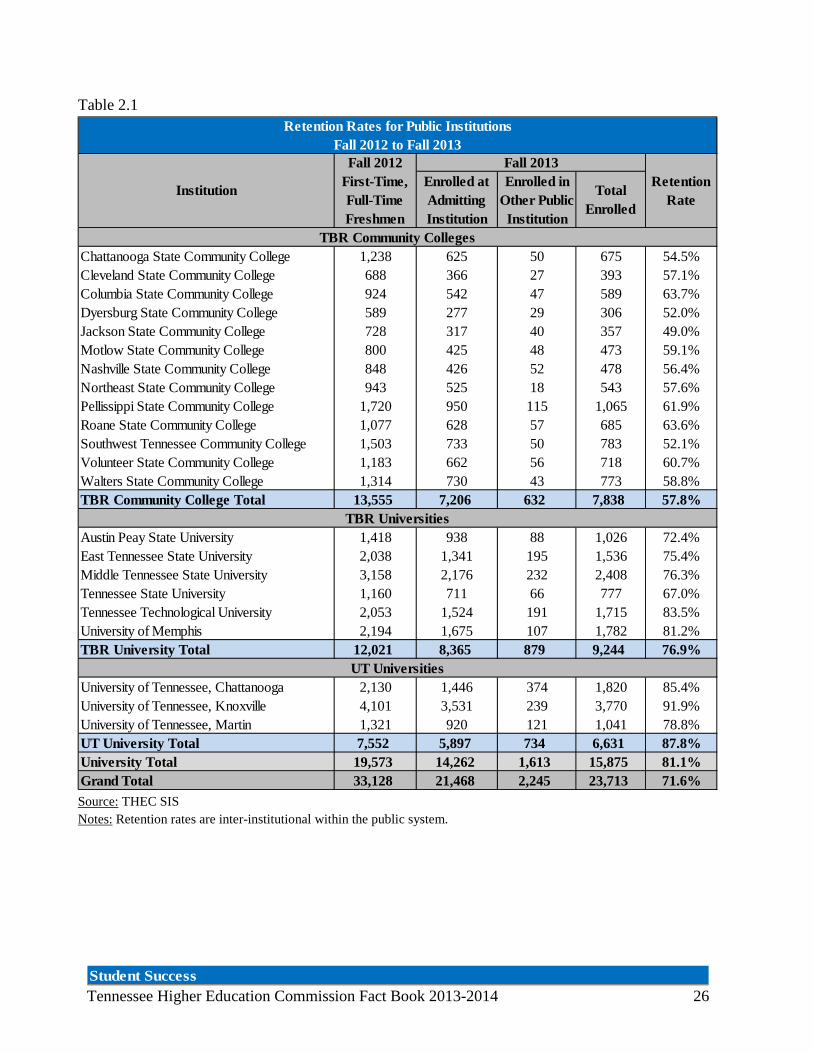
Table 2.1
Source: THEC SIS Notes: Retention rates are inter-institutional within the public system.
Enrolled at Admitting Institution
Enrolled in Other Public Institution
Total Enrolled
Chattanooga State Community College 1,238 625 50 675 54.5%Cleveland State Community College 688 366 27 393 57.1%Columbia State Community College 924 542 47 589 63.7%Dyersburg State Community College 589 277 29 306 52.0%Jackson State Community College 728 317 40 357 49.0%Motlow State Community College 800 425 48 473 59.1%Nashville State Community College 848 426 52 478 56.4%Northeast State Community College 943 525 18 543 57.6%Pellissippi State Community College 1,720 950 115 1,065 61.9%Roane State Community College 1,077 628 57 685 63.6%Southwest Tennessee Community College 1,503 733 50 783 52.1%Volunteer State Community College 1,183 662 56 718 60.7%Walters State Community College 1,314 730 43 773 58.8%TBR Community College Total 13,555 7,206 632 7,838 57.8%
Austin Peay State University 1,418 938 88 1,026 72.4%East Tennessee State University 2,038 1,341 195 1,536 75.4%Middle Tennessee State University 3,158 2,176 232 2,408 76.3%Tennessee State University 1,160 711 66 777 67.0%Tennessee Technological University 2,053 1,524 191 1,715 83.5%University of Memphis 2,194 1,675 107 1,782 81.2%TBR University Total 12,021 8,365 879 9,244 76.9%
University of Tennessee, Chattanooga 2,130 1,446 374 1,820 85.4%University of Tennessee, Knoxville 4,101 3,531 239 3,770 91.9%University of Tennessee, Martin 1,321 920 121 1,041 78.8%UT University Total 7,552 5,897 734 6,631 87.8%University Total 19,573 14,262 1,613 15,875 81.1%Grand Total 33,128 21,468 2,245 23,713 71.6%
UT Universities
Retention Rates for Public InstitutionsFall 2012 to Fall 2013
Institution
Fall 2012 First-Time, Full-Time Freshmen
Fall 2013Retention
Rate
TBR Community Colleges
TBR Universities
Tennessee Higher Education Commission Fact Book 2013-2014 26 Student Success

Table 2.2
Source: THEC SIS Notes: “Other” consists of Alaskan Native, American Indian, and Asian or Pacific Islander. “Multiracial” consists of any students that selected more than one race. If a student identified their ethnicity as Hispanic, they appear in the “Hispanic” column as well as the column for their race designation, pursuant to Department of Education reporting guidelines. Retention rates are inter-institutional within the public system.
TOTAL 2012 FTF
Fall 2012 First Time Freshmen
% Returned Fall 2013
Fall 2012 First Time Freshmen
% Returned Fall 2013
Fall 2012 First Time Freshmen
% Returned Fall 2013
Fall 2012 First Time Freshmen
% Returned Fall 2013
Fall 2012 First Time Freshmen
% Returned Fall 2013
Fall 2012 First Time Freshmen
% Returned Fall 2013
Chattanooga State Community College 1,238 902 55.7% 238 46.6% 43 62.8% 24 66.7% 16 50.0% 15 73.3%Cleveland State Community College 688 572 58.4% 47 36.2% 26 61.5% 13 53.8% 19 57.9% 11 72.7%Columbia State Community College 924 776 65.5% 75 50.7% 38 57.9% 10 60.0% 13 53.8% 12 66.7%Dyersburg State Community College 589 413 57.6% 139 33.1% 14 64.3% 7 42.9% 10 80.0% 6 33.3%Jackson State Community College 728 503 52.9% 177 35.6% 15 66.7% * 66.7% 20 50.0% * 0.0%Motlow State Community College 800 634 60.7% 78 47.4% 29 62.1% 18 61.1% 19 52.6% 22 54.5%Nashville State Community College 848 469 61.6% 270 46.3% 39 56.4% 13 61.5% 27 37.0% 30 80.0%Northeast State Community College 943 658 57.8% 20 50.0% 21 61.9% * 50.0% 233 57.9% * 33.3%Pellissippi State Community College 1,720 1,389 64.1% 163 40.5% 62 67.7% 61 60.7% * 75.0% * 65.9%Roane State Community College 1,077 968 64.5% 34 41.2% 26 65.4% 31 67.7% 7 42.9% 11 54.5%Southwest Tennessee Community College 1,503 420 61.0% 899 46.7% 76 61.8% * 57.1% * 25.0% 55 56.4%Volunteer State Community College 1,183 962 62.7% 98 50.0% 34 47.1% 11 36.4% 54 61.1% 24 54.2%Walters State Community College 1,314 1,179 59.6% 49 42.9% 41 68.3% 35 48.6% * 75.0% * 16.7%TBR Community College Total 13,555 9,845 60.7% 2,287 44.5% 464 61.9% 292 58.2% 430 56.3% 237 60.8%
Austin Peay State University 1,418 964 72.6% 290 72.8% 46 76.1% 65 67.7% 26 69.2% 27 66.7%East Tennessee State University 2,038 1,682 77.0% 166 63.3% 47 83.0% 72 63.9% 39 66.7% 32 78.1%Middle Tennessee State University 3,158 1,918 75.4% 824 79.1% 140 70.7% 113 69.0% 44 68.2% 119 86.6%Tennessee State University 1,160 75 72.0% 1,013 66.2% 15 66.7% 28 71.4% 17 82.4% 12 66.7%Tennessee Technological University 2,053 1,785 84.6% 91 74.7% 54 74.1% 49 71.4% 20 70.0% 54 87.0%University of Memphis 2,194 1,170 81.4% 780 80.4% 89 82.0% 74 79.7% 16 87.5% 65 87.7%TBR University Total 12,021 7,594 78.5% 3,164 73.8% 391 75.7% 401 70.3% 162 71.6% 309 83.5%
University of Tennessee, Chattanooga 2,130 1,627 86.0% 281 86.8% 64 84.4% 88 72.7% 27 77.8% 43 88.4%University of Tennessee, Knoxville 4,101 3,312 92.8% 331 88.5% 125 87.2% 102 85.3% 99 86.9% 132 90.9%University of Tennessee, Martin 1,321 1,039 80.5% 196 75.5% 22 72.7% 27 51.9% 25 76.0% 12 66.7%UT University Total 7,552 5,978 88.8% 808 84.8% 211 84.8% 217 76.0% 151 83.4% 187 88.8%University Total 19,573 13,572 83.0% 3,972 76.0% 602 78.9% 618 72.3% 313 77.3% 496 85.5%Grand Total 33,128 23,417 73.6% 6,259 64.5% 1,066 71.5% 910 67.8% 743 65.1% 733 77.5%
UT Universities
TBR Universities
TBR Community College
Retention Rates for Public Institutions Fall 2012 to Fall 2013 by Race
Institution
Caucasian African American Hispanic Multiracial Unknown Other
Tennessee Higher Education Commission Fact Book 2013-2014 27 Student Success

Table 2.3
Source: THEC SIS Notes: “Remedial and Developmental Success” uses the definition set forth in the funding formula, and refers to the number of full-time and part-time students who were enrolled in any remedial or developmental course who then successfully completed college-level courses in a subsequent semester within three years of their initial enrollment. Census date is used instead of end-of-term date because THEC's inability to collect course level data makes it impossible to know if a student completed the R&D courses they were enrolled in at the census date. For example, if a student is enrolled for 15 credit hours at the census date and finishes the semester with 12 credit hours, THEC is unable to determine which class the student did not complete. The Complete College Tennessee Act enacted in January 2010 requires that Tennessee public universities stop delivering below college level courses by July 1, 2012.
Institution R&D Students 2010-11
Successful Completers
2012-13
Percent Successful
Chattanooga State Community College 4,220 2,875 68.1%Cleveland State Community College 1,389 1,023 73.7%Columbia State Community College 2,190 1,553 70.9%Dyersburg State Community College 1,832 1,199 65.4%Jackson State Community College 2,327 1,435 61.7%Motlow State Community College 2,273 1,620 71.3%Nashville State Community College 4,238 3,152 74.4%Northeast State Community College 3,063 2,129 69.5%Pellissippi State Community College 4,479 3,140 70.1%Roane State Community College 2,350 1,767 75.2%Southwest Tennessee Community College 7,933 4,756 60.0%Volunteer State Community College 3,625 2,426 66.9%Walters State Community College 2,601 1,846 71.0%Grand Total 42,520 28,921 68.0%
Remedial & Developmental Student Success
Tennessee Higher Education Commission Fact Book 2013-2014 28 Student Success
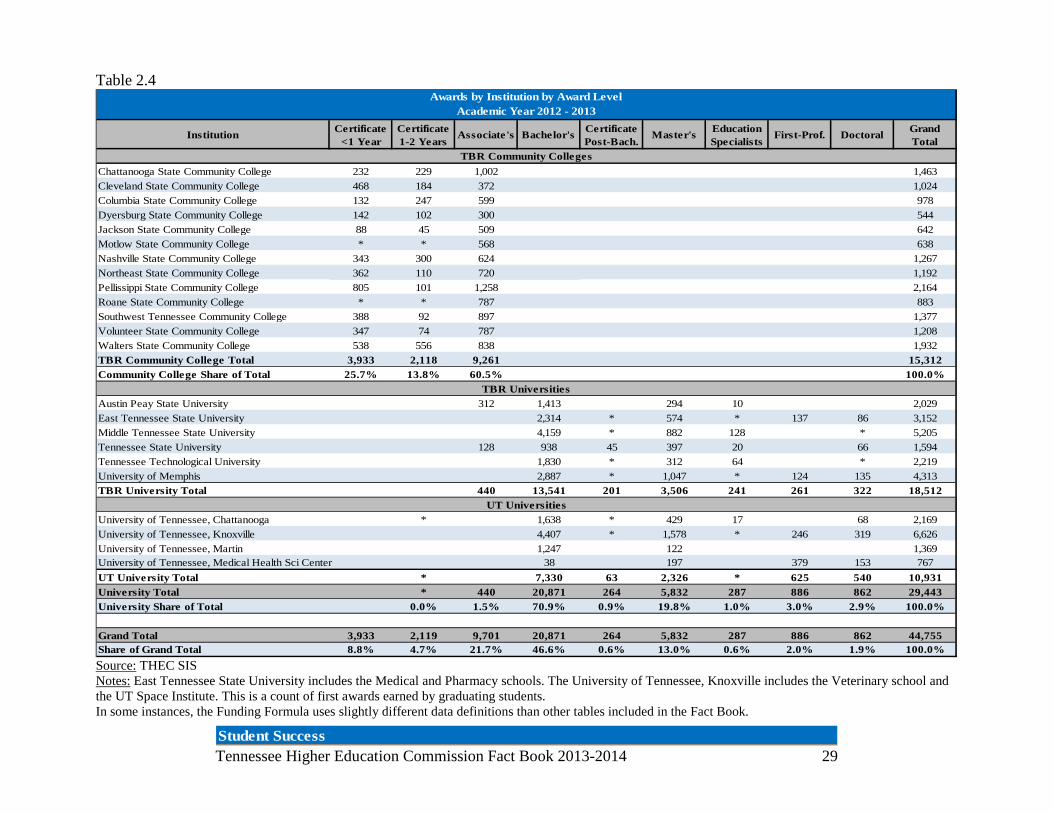
Table 2.4
Source: THEC SIS Notes: East Tennessee State University includes the Medical and Pharmacy schools. The University of Tennessee, Knoxville includes the Veterinary school and the UT Space Institute. This is a count of first awards earned by graduating students. In some instances, the Funding Formula uses slightly different data definitions than other tables included in the Fact Book.
Institution Certificate <1 Year
Certificate 1-2 Years
Associate's Bachelor's Certificate Post-Bach.
Master's Education Specialists
First-Prof. Doctoral Grand Total
Chattanooga State Community College 232 229 1,002 1,463Cleveland State Community College 468 184 372 1,024Columbia State Community College 132 247 599 978Dyersburg State Community College 142 102 300 544Jackson State Community College 88 45 509 642Motlow State Community College * * 568 638Nashville State Community College 343 300 624 1,267Northeast State Community College 362 110 720 1,192Pellissippi State Community College 805 101 1,258 2,164Roane State Community College * * 787 883Southwest Tennessee Community College 388 92 897 1,377Volunteer State Community College 347 74 787 1,208Walters State Community College 538 556 838 1,932TBR Community College Total 3,933 2,118 9,261 15,312Community College Share of Total 25.7% 13.8% 60.5% 100.0%
Austin Peay State University 312 1,413 294 10 2,029East Tennessee State University 2,314 * 574 * 137 86 3,152Middle Tennessee State University 4,159 * 882 128 * 5,205Tennessee State University 128 938 45 397 20 66 1,594Tennessee Technological University 1,830 * 312 64 * 2,219University of Memphis 2,887 * 1,047 * 124 135 4,313TBR University Total 440 13,541 201 3,506 241 261 322 18,512
University of Tennessee, Chattanooga * 1,638 * 429 17 68 2,169University of Tennessee, Knoxville 4,407 * 1,578 * 246 319 6,626University of Tennessee, Martin 1,247 122 1,369University of Tennessee, Medical Health Sci Center 38 197 379 153 767UT University Total * 7,330 63 2,326 * 625 540 10,931University Total * 440 20,871 264 5,832 287 886 862 29,443University Share of Total 0.0% 1.5% 70.9% 0.9% 19.8% 1.0% 3.0% 2.9% 100.0%
Grand Total 3,933 2,119 9,701 20,871 264 5,832 287 886 862 44,755Share of Grand Total 8.8% 4.7% 21.7% 46.6% 0.6% 13.0% 0.6% 2.0% 1.9% 100.0%
Awards by Institution by Award Level Academic Year 2012 - 2013
TBR Community Colleges
TBR Universities
UT Universities
Tennessee Higher Education Commission Fact Book 2013-2014 29 Student Success

Table 2.5
Source: THEC SIS Note: Major fields defined by 2 digit THEC CIP code. This is a count of first awards earned by graduating students. In some instances, the Funding Formula uses slightly different data definitions than other tables included in the Fact Book.
Major Field Certificate <1 Year
Certificate 1-2 Years
Associate's Bachelor's Certificate Post-Bach.
Master's Education Specialists
First-Prof. Doctoral Grand Total
Agriculture * * * 621 88 20 736Architecture & Related Programs 62 40 102Area, Ethnic, & Cultural Studies 103 9 112Biological & Life Sciences * 829 * 97 48 987Business Management 314 128 798 3,379 59 1,171 32 5,881Communications 64 7 93 1,212 73 12 1,461Computer & Information Sciences 229 * 229 293 * 99 10 869Education 303 1,763 37 1,424 * 125 3,938Engineering 263 17 514 1,192 24 360 81 2,451English Language & Literature 551 104 18 673Foreign Languages & Literature 291 * 15 * 317Health Professions 1,039 427 1,954 1,782 49 818 595 305 6,969Home Economics 195 13 155 419 53 6 841Law & Legal Studies 11 130 16 291 448Liberal Arts & Sciences 889 1,317 5,032 1,011 108 8,357Library Science 78 78Mathematics 177 * 60 * 244Multi/Interdisciplinary Studies 666 32 11 709Parks, Recreation, Leisure & Fitness 1,076 269 15 1,360Personal & Misc Services 50 17 67Personal Improvement & Leisure 348 * * 536Philosophy, Religion, & Theology 78 8 8 94Physical Sciences 102 117 427 78 52 776Protective Services & Public Affairs 314 161 1,012 * 402 * 1,901Psychology 1,273 * 178 * 67 1,531Social Sciences & History * * 1,515 13 156 41 1,733Trades & Industrial 18 54 25 124 10 231Visual & Performing Arts 90 29 87 999 9 132 7 1,353Grand Total 3,933 2,119 9,701 20,871 264 5,832 287 886 862 44,755Share of Total 8.8% 4.7% 21.7% 46.6% 0.6% 13.0% 0.6% 2.0% 1.9% 100%
Awards by Major Field by Award LevelAcademic Year 2012 - 2013
Tennessee Higher Education Commission Fact Book 2013-2014 30 Student Success

Table 2.6
Source: THEC SIS Notes: East Tennessee State University includes the Medical and Pharmacy schools. The University of Tennessee, Knoxville includes the Veterinary school and the UT Space Institute. Major fields defined by 2 digit THEC CIP code. This is a count of first awards earned by graduating students.
Major Field APSU ETSU MTSU TSU TTU UoM UTC UTK UTM UTHSC Grand Total Percent of Total
Agriculture 17 120 27 106 24 308 127 729 2.5%Architecture * 81 * 0.3%Area, Ethnic, and Cultural Studies * * 23 83 112 0.4%Biological & Life Sciences 67 87 197 * 67 111 85 244 52 * 975 3.3%Business Management 268 367 723 177 352 823 445 1,237 262 4,654 15.8%Communications 98 127 324 55 28 164 64 397 40 1,297 4.4%Computer & Information Sciences 60 92 72 14 41 41 21 54 12 407 1.4%Education 228 281 826 275 566 567 327 356 209 3,635 12.3%Engineering 44 72 98 74 316 174 206 675 * * 1,682 5.7%English Language & Literature 49 64 101 22 20 144 68 190 15 673 2.3%Foreign Languages & Literature 19 33 74 * * 53 19 91 14 317 1.1%Health Professions 181 863 249 491 114 419 234 300 73 753 3,677 12.5%Home Economics 50 130 32 60 * * 151 49 478 1.6%Law & Legal Studies 124 16 167 307 1.0%Liberal Arts & Sciences 372 171 435 25 140 232 12 1,387 4.7%Library Science 78 78 0.3%Mathematics 20 35 49 * 17 43 17 53 * 244 0.8%Multi/Interdisciplinary Studies 180 * 329 * 35 156 709 2.4%Parks, Recreation, Leisure & Fitness 116 169 191 40 116 164 130 325 109 1,360 4.6%Personal Improvement & Fitness * * 0.0%Philosophy, Religion, & Theology * * 14 29 7 33 94 0.3%Physical Sciences 48 67 55 23 56 79 49 151 29 557 1.9%Protective Services & Public Affairs 156 287 266 111 179 107 257 63 1,426 4.8%Psychology 89 112 259 88 39 200 155 551 38 1,531 5.2%Social Sciences & History 121 175 299 43 122 214 130 566 55 1,725 5.9%Trades & Industrial 134 134 0.5%Visual & Performing Arts 66 92 409 30 39 179 47 243 42 1,147 3.9%Grand Total 2,029 3,152 5,205 1,594 2,219 4,313 2,169 6,626 1,369 767 29,443 100%
Awards by Major Field by Public UniversityAcademic Year 2012 - 2013
Tennessee Higher Education Commission Fact Book 2013-2014 31 Student Success

Table 2.7
Source: THEC SIS Notes: East Tennessee State University includes the Medical and Pharmacy schools. The University of Tennessee, Knoxville includes the Veterinary school and the UT Space Institute. Major fields defined by 2 digit THEC CIP code. This is a count of first awards earned by graduating students.
Major Field APSU ETSU MTSU TSU TTU UoM UTC UTK UTM UTHSC
Agriculture 0.8% 2.3% 1.7% 4.8% 1.1% 4.6% 9.3% Architecture 0.5% 1.2% Area, Ethnic, and Cultural Studies 0.0% 0.3% 0.5% 1.3% Biological & Life Sciences 3.3% 2.8% 3.8% 3.3% 3.0% 2.6% 3.9% 3.7% 3.8% 1.6%Business Management 13.2% 11.6% 13.9% 11.1% 15.9% 19.1% 20.5% 18.7% 19.1% Communications 4.8% 4.0% 6.2% 3.5% 1.3% 3.8% 3.0% 6.0% 2.9% Computer & Information Sciences 3.0% 2.9% 1.4% 0.9% 1.8% 1.0% 1.0% 0.8% 0.9% Education 11.2% 8.9% 15.9% 17.3% 25.5% 13.1% 15.1% 5.4% 15.3% Engineering 2.2% 2.3% 1.9% 4.6% 14.2% 4.0% 9.5% 10.2% 1.5% 0.3%English Language & Literature 2.4% 2.0% 1.9% 1.4% 0.9% 3.3% 3.1% 2.9% 1.1% Foreign Languages & Literature 0.9% 1.0% 1.4% 0.1% 0.5% 1.2% 0.9% 1.4% 1.0% Health Professions 8.9% 27.4% 4.8% 30.8% 5.1% 9.7% 10.8% 4.5% 5.3% 98.2%Home Economics 1.6% 2.5% 2.0% 2.7% 0.0% 0.2% 2.3% 3.6% Law & Legal Studies 2.9% 0.7% 2.5% Liberal Arts & Sciences 18.3% 5.4% 8.4% 1.6% 6.3% 5.4% 0.6% Library Science 1.2% Mathematics 1.0% 1.1% 0.9% 0.4% 0.8% 1.0% 0.8% 0.8% 0.2% Multi/Interdisciplinary Studies 3.5% 0.4% 7.6% 0.0% 0.5% 11.4% Parks, Recreation, Leisure & Fitness 5.7% 5.4% 3.7% 2.5% 5.2% 3.8% 6.0% 4.9% 8.0% Personal Improvement & Fitness 0.3% Philosophy, Religion, & Theology 0.2% 0.2% 0.3% 0.7% 0.3% 0.5% Physical Sciences 2.4% 2.1% 1.1% 1.4% 2.5% 1.8% 2.3% 2.3% 2.1% Protective Services & Public Affairs 7.7% 9.1% 5.1% 7.0% 4.2% 4.9% 3.9% 4.6% Psychology 4.4% 3.6% 5.0% 5.5% 1.8% 4.6% 7.1% 8.3% 2.8% Social Sciences 6.0% 5.6% 5.7% 2.7% 5.5% 5.0% 6.0% 8.5% 4.0% Trades & Industrial 2.6% Visual & Performing Arts 3.3% 2.9% 7.9% 1.9% 1.8% 4.2% 2.2% 3.7% 3.1% TOTAL 100% 100% 100% 100% 100% 100% 100% 100% 100% 100%
Percent of Public University Awards by Major FieldAcademic Year 2012 - 2013
Tennessee Higher Education Commission Fact Book 2013-2014 32 Student Success

Table 2.8
Source: THEC SIS Note: Major fields defined by 2 digit THEC CIP code. This is a count of first awards earned by graduating students.
CHSCC CLSCC COSCC DSCC JSCC MSCC NASCC NESCC PSCC RSCC STCC VSCC WSCC Grand TotalPercent of
TotalAgriculture * * 7 0.0%Biological & Life Sciences 12 12 0.1%Business Management 93 113 28 15 13 16 81 92 342 59 205 95 75 1,227 8.0%Communications 7 157 164 1.1%Computer & Information Sciences 26 * 17 20 * * 50 18 173 * 85 * 19 462 3.0%Education * * 42 19 12 46 * 10 45 47 * 28 27 303 2.0%Engineering 200 52 10 50 69 78 170 111 29 769 5.0%Health Professions 435 133 297 122 290 62 118 129 72 311 341 426 556 3,292 21.5%Home Economics 18 49 * 29 * 22 54 24 24 22 52 43 20 363 2.4%Law & Legal Studies 30 * 36 * 25 32 141 0.9%Liberal Arts & Sciences 351 587 559 330 254 430 757 403 1,016 349 464 445 1,025 6,970 45.5%Personal & Misc. Services 28 31 8 67 0.4%Personal Improvement & Fitness 11 * 7 * 38 * 14 369 12 52 * * * 530 3.5%Physical Sciences * * 219 1.4%Protective Services & Public Affairs 29 77 * * 24 * 27 14 117 168 475 3.1%Social Sciences & History 8 8 0.1%Trades & Industrial * * 60 29 97 0.6%Visual & Performing Arts 39 9 45 86 27 206 1.3%Grand Total 1,463 1024 978 544 642 638 1,267 1,192 2,164 883 1,377 1,208 1,932 15,312 100%
Academic Year 2012 - 2013Awards by Major Field by Community College
Tennessee Higher Education Commission Fact Book 2013-2014 33 Student Success

Table 2.9
Source: THEC SIS Note: Major fields defined by 2 digit THEC CIP code. This is a count of first awards earned by graduating students.
CHSCC CLSCC COSCC DSCC JSCC MSCC NASCC NESCC PSCC RSCC STCC VSCC WSCCAgriculture 0.2% 0.2%Biological / Life Sciences 0.9% Business Management 6.4% 11.0% 2.9% 2.8% 2.0% 2.5% 6.4% 7.7% 15.8% 6.7% 14.9% 7.9% 3.9%Communications 0.7% 7.3% Computer & Information Sciences 1.8% 0.5% 1.7% 3.7% 3.6% 0.3% 3.9% 1.5% 8.0% 0.3% 6.2% 1.7% 1.0%Education 1.1% 0.1% 4.3% 3.5% 1.9% 7.2% 0.4% 0.8% 2.1% 5.3% 0.4% 2.3% 1.4%Engineering 13.7% 5.1% 1.6% 7.8% 5.4% 6.5% 7.9% 8.1% 1.5%Health Professions 29.7% 13.0% 30.4% 22.4% 45.2% 9.7% 9.3% 10.8% 3.3% 35.2% 24.8% 35.3% 28.8%Home Economics 1.2% 4.8% 0.4% 5.3% 0.3% 3.4% 4.3% 2.0% 1.1% 2.5% 3.8% 3.6% 1.0%Law & Legal Studies 2.1% 1.0% 1.7% 0.6% 1.8% 2.6% Liberal Arts & Sciences 24.0% 57.3% 57.2% 60.7% 39.6% 67.4% 59.7% 33.8% 47.0% 39.5% 33.7% 36.8% 53.1%Personal & Misc. Services 2.2% 1.4% 0.4%Personal Improvement & Fitness 0.8% 0.5% 0.7% 0.6% 5.9% 1.6% 1.1% 31.0% 0.6% 5.9% 0.5% 0.1% 0.1%Physical Sciences 14.7% 0.3% Protective Services & Public Affairs 2.0% 7.5% 0.8% 1.1% 1.9% 0.4% 3.1% 1.0% 9.7% 8.7%Social Sciences & History 0.9% Trades & Industrial 0.2% 0.5% 5.0% 2.1% Visual & Performing Arts 2.7% 0.9% 3.6% 4.0% 2.0% TOTAL 100% 100% 100% 100% 100% 100% 100% 100% 100% 100% 100% 100% 100%
Percent of Community College Awards by Major FieldAcademic Year 2012 - 2013
Tennessee Higher Education Commission Fact Book 2013-2014 34 Student Success

Table 2.10
Source: THEC SIS Notes: East Tennessee State University includes the Medical and Pharmacy schools. The University of Tennessee, Knoxville includes the Veterinary school and the UT Space Institute. This is a count of first awards earned by graduating students.
Female Male Unknown Total Female Male Unknown Total
Chattanooga State Community College 773 688 * 1,463Cleveland State Community College 628 394 * 1,024Columbia State Community College 670 308 978Dyersburg State Community College 390 154 544Jackson State Community College 435 206 * 642Motlow State Community College 388 250 638Nashville State Community College 783 484 1,267Northeast State Community College 538 654 1,192Pellissippi State Community College 1,083 1,080 * 2,164Roane State Community College 601 282 883Southwest Tennessee Community College 830 544 * 1,377Volunteer State Community College 723 484 * 1,208Walters State Community College 1,170 762 1,932TBR Community College Total 9,012 6,290 * 15,312Community College Share of Total 58.9% 41.1% 0.1% 100.0%
Austin Peay State University 1,067 656 * 1,725 230 74 304East Tennessee State University 1,379 935 2,314 556 282 838Middle Tennessee State University 2,263 1,893 * 4,159 671 374 * 1,046Tennessee State University 711 354 * 1,066 390 138 528Tennessee Technological University 946 883 * 1,830 217 172 389University of Memphis 1,782 1,104 * 2,887 857 569 1,426TBR University Total 8,148 5,825 * 13,981 2,921 1,609 * 4,531
University of Tennessee, Chattanooga 932 707 1,639 309 221 530University of Tennessee, Knoxville 2,197 2,210 4,407 1,243 976 2,219University of Tennessee, Martin 751 496 1,247 77 45 122University of Tennessee, Medical Health Sci Center * * 38 454 275 729UT University Total 3,917 3,414 * 7,331 2,083 1,517 * 3,600University Total 12,065 9,239 * 21,312 5,004 3,126 * 8,131University Share of Total 56.6% 43.4% 0.0% 100.0% 61.5% 38.4% 0.0% 100.0%Grand Total 21,077 15,529 * 36,624 5,004 3,126 * 8,131Share of Grand Total 57.5% 42.4% 0.0% 100.0% 61.5% 38.4% 0.0% 100.0%
UT Universities
Awards by Gender Academic Year 2012 - 2013
InstitutionUndergraduate Graduate
TBR Community Colleges
TBR Universities
Tennessee Higher Education Commission Fact Book 2013-2014 35 Student Success

Table 2.11
Table 2.12
Source: THEC SIS Notes: If a student identified their ethnicity as Hispanic, they appear in the “Hispanic” column as well as the column for their race designation, pursuant to Department of Education reporting guidelines. This is a count of first awards earned by graduating students. In some instances, the Funding Formula uses slightly different data definitions than THEC’s Fact Book.
Institution Certificate <1 Year
Certificate 1-2 Years
Associate's Bachelor's Certificate Post-Bach.
Master's Education Specialists
First-Prof. Doctoral Grand Total
Female 1,942 1,213 6,151 11,771 185 3,644 232 437 506 26,081Male 1,988 904 3,545 9,092 79 2,187 55 449 356 18,655Unknown * * * * * 19Grand Total 3,933 2,119 9,701 20,871 264 5,832 287 886 862 44,755
Awards by Gender by Award Level Academic Year 2012 - 2013
Institution Certificate <1 Year
Certificate 1-2 Years
Associate's Bachelor's Certificate Post-Bach.
Master's Education Specialists
First-Prof. Doctoral Grand Total
African American 458 219 1,152 3,154 61 782 44 67 83 6,020Asian/ Pacific Islander 65 33 155 581 34 423 * * 107 1,467Caucasian 3,173 1,747 7,750 15,872 150 4,270 229 705 606 34,502Hispanic 80 42 219 458 9 114 * 23 * 962Multiracial 22 * 53 97 * 29 * 216Native Alaskan/American 15 * 29 75 * 19 * * 148Unknown 120 63 343 634 8 195 7 21 49 1,440Grand Total 3,933 2,119 9,701 20,871 264 5,832 287 886 862 44,755
Awards by Race by Award Level Academic Year 2012 - 2013
Tennessee Higher Education Commission Fact Book 2013-2014 36 Student Success

Table 2.13
African American
Asian/ Pacific
IslanderCaucasian Hispanic Multiracial
Native Alaskan/ American
Unknown Total
Chattanooga State Community College 154 23 1,179 25 11 7 64 1,463Cleveland State Community College 47 * 905 24 * 41 1,024Columbia State Community College 50 8 798 38 6 8 70 978Dyersburg State Community College 83 * 445 * * 6 544Jackson State Community College 67 * 539 9 * * 22 642Motlow State Community College 42 9 556 14 * * 10 638Nashville State Community College 282 47 838 43 * * 41 1,267Northeast State Community College 19 6 1,085 * * * 71 1,192Pellissippi State Community College 141 57 1,857 52 11 8 38 2,164Roane State Community College 19 10 778 11 * * 59 883Southwest Tennessee Community College 716 42 545 35 * * 28 1,377Volunteer State Community College 71 19 1,033 30 * * 40 1,208Walters State Community College 45 8 1,834 29 10 6 1,932TBR Community College Total 1,736 239 12,392 321 80 48 496 15,312Community College Share of Total 11.3% 1.6% 80.9% 2.1% 0.5% 0.3% 3.2% 100.0%
Austin Peay State University 261 55 1,128 105 19 14 143 1,725East Tennessee State University 87 61 2,028 44 * * 79 2,314Middle Tennessee State University 565 140 3,239 89 16 18 92 4,159Tennessee State University 713 24 273 12 * * 39 1,066Tennessee Technological University 51 34 1,623 30 11 6 75 1,830University of Memphis 947 89 1,704 59 14 7 67 2,887TBR University Total 2,624 403 9,995 339 72 53 495 13,981
University of Tennessee, Chattanooga * 43 1,310 36 * * 60 1,639University of Tennessee, Knoxville 250 127 3,795 91 27 16 101 4,407University of Tennessee, Martin 185 * 1,019 12 * * * 1,247University of Tennessee, Health Sci Center * * 31 * * 38UT University Total 623 192 6,155 139 30 23 169 7,331University Total 3,247 595 16,150 478 102 76 664 21,312University Share of Total 15.2% 2.8% 75.8% 2.2% 0.5% 0.4% 3.1% 100.0%
Grand Total 4,983 834 28,542 799 182 124 1,160 36,624Share of Grand Total 13.6% 2.3% 77.9% 2.2% 0.5% 0.3% 3.2% 100.0%
UT Universities
Undergraduate Awards by Race and InstitutionAcademic Year 2012-2013
TBR Universities
Institution
TBR Community Colleges
Tennessee Higher Education Commission Fact Book 2013-2014 37 Student Success

Table 2.13 continued
Source: THEC SIS Notes: East Tennessee State University includes the Medical and Pharmacy schools. The University of Tennessee, Knoxville includes the Veterinary school and the UT Space Institute. If a student identified their ethnicity as Hispanic, they appear in the “Hispanic” column as well as the column for their race designation, pursuant to Department of Education reporting guidelines. This is a count of first awards earned by graduating students. Undergraduate awards include less than 1 year certificates, 1-2 year certificates, associate’s, and bachelor’s degrees. Graduate awards include post-baccalaureate certificates, master’s, education specialist, first professional, and doctoral degrees.
African American
Asian/ Pacific
IslanderCaucasian Hispanic Multiracial
Native Alaskan/ American
Unknown Total
Austin Peay State University 33 6 228 12 * * 19 304East Tennessee State University 39 40 730 12 * * 14 838Middle Tennessee State University 130 73 795 21 * * 16 1,046Tennessee State University 246 25 240 * * 7 528Tennessee Technological University 13 20 343 * * 8 389University of Memphis 286 174 909 27 * 6 22 1,426TBR University Total 747 338 3,245 84 18 13 86 4,531TBR Share of Total 16.5% 7.5% 71.6% 1.9% 0.4% 0.3% 1.9% 100%
University of Tennessee, Chattanooga 43 24 380 * * 68 530University of Tennessee, Knoxville 139 195 1,713 60 * * 89 2,219University of Tennessee, Martin 9 11 102 122University of Tennessee, Health Sci Center 99 65 520 * * * 37 729UT University Total 290 295 2,715 79 16 11 194 3,600UT Share of Total 8.1% 8.2% 75.4% 2.2% 0.4% 0.3% 5.4% 100%University Total 1,037 633 5,960 163 34 24 280 8,131University Share of Total 12.8% 7.8% 73.3% 2.0% 0.4% 0.3% 3.4% 100%
UT Universities
TBR Universities
Institution
Graduate Awards by Race and InstitutionAcademic Year 2012-2013
Tennessee Higher Education Commission Fact Book 2013-2014 38 Student Success

Table 2.14
Source: THEC SIS Notes: East Tennessee State University includes the Medical and Pharmacy schools. The University of Tennessee, Knoxville includes the Veterinary school and the UT Space Institute. Adult students are defined as 25 years or older at time credential was earned. This is a count of first awards earned by graduating students. Due to differences in definitions used in the Funding Formula, the numbers in some tables may not match the numbers used in the Funding Formula.
Institution Certificate <1 Year
Certificate 1-2 Years
Associate's Bachelor's Certificate Post-Bach.
Master's Education Specialists
First-Prof. Doctoral TotalSector
Percent of Total
Chattanooga State Community College 154 148 652 954Cleveland State Community College 277 88 210 575Columbia State Community College 82 107 288 477Dyersburg State Community College 97 49 176 322Jackson State Community College 27 * 282 329Motlow State Community College 49 * 275 325Nashville State Community College 224 198 456 878Northeast State Community College 353 67 417 837Pellissippi State Community College 418 44 620 1,082Roane State Community College 14 56 422 492Southwest Tennessee Community College 271 56 630 957Volunteer State Community College 185 55 455 695Walters State Community College 342 180 384 906TBR Community College Total 2,493 1,069 5,267 8,829Community College Share of Total 28.2% 12.1% 59.7% 100.0% 37.4%
Austin Peay State University 226 765 268 10 1,269East Tennessee State University 886 * 474 * 133 84 1,613Middle Tennessee State University 1,616 12 783 128 23 2,562Tennessee State University 111 472 44 373 20 66 1,086Tennessee Technological University 550 * 249 * 12 876University of Memphis 1,375 83 903 17 123 135 2,636TBR University Total 337 5,664 174 3,050 241 256 320 10,042 42.6%
University of Tennessee, Chattanooga 486 16 375 17 68 962University of Tennessee, Knoxville 733 43 1,175 29 242 318 2,540University of Tennessee, Martin 407 105 512University of Tennessee, Medical Health Sci Center 16 164 377 151 708UT University Total 1,642 59 1,819 46 619 537 4,722 20.0%University Total 337 7,306 233 4,869 287 875 857 14,764University Share of Total 2.3% 49.5% 1.6% 33.0% 1.9% 5.9% 5.8% 100.0%Grand Total 2,493 1,069 5,604 7,306 233 4,869 287 875 857 23,593Share of Total 10.6% 4.5% 23.8% 31.0% 1.0% 20.6% 1.2% 3.7% 3.6% 100% 100%
UT Universities
Academic Year 2012 - 2013Adult Award Recipients by Institution
TBR Community Colleges
TBR Universities
Tennessee Higher Education Commission Fact Book 2013-2014 39 Student Success

Table 2.15
Source: THEC SIS Notes: East Tennessee State University includes the Medical and Pharmacy schools. The University of Tennessee, Knoxville includes the Veterinary school and the UT Space Institute. Pell eligible undergraduate students are defined as students who were eligible to receive the Pell grant at any time during their college career. This is a count of first awards earned by graduating students. Due to differences in definitions used in the Funding Formula, the numbers in some tables may not match the numbers used in the Funding Formula.
InstitutionCertificate
<1 YearCertificate 1-2 Years Associate's Bachelor's
Certificate Post-Bach. Master's
Education Specialists First-Prof. Doctoral Total
Sector Percent of Total
Chattanooga State Community College 118 110 601 829Cleveland State Community College 294 132 266 692Columbia State Community College 83 139 352 574Dyersburg State Community College 112 76 217 405Jackson State Community College 63 29 356 448Motlow State Community College 20 0 332 352Nashville State Community College 214 187 425 826Northeast State Community College 50 64 499 613Pellissippi State Community College 459 66 762 1,287Roane State Community College 13 50 544 607Southwest Tennessee Community College 213 57 607 877Volunteer State Community College 163 36 496 695Walters State Community College 338 366 569 1,273TBR Community College Total 2,140 1,312 6,026 9,478Community College Share of Total 22.6% 13.8% 63.6% 100% 43.5%
Austin Peay State University 162 792 * * 1,035East Tennessee State University 1,187 6 133 13 8 1,347Middle Tennessee State University 2,266 * 186 15 * 2,471Tennessee State University 89 627 * * * * 828Tennessee Technological University 952 101 9 1,062University of Memphis 1,591 23 225 * 24 * 1,868TBR University Total 251 7,415 43 815 34 37 16 8,611 39.5%
University of Tennessee, Chattanooga * 785 * 95 * * 885University of Tennessee, Knoxville 1,642 * 279 * 23 * 1,968University of Tennessee, Martin 734 25 759University of Tennessee, Medical Health Sci Center 15 21 56 9 101UT University Total * 3,176 8 420 * 79 23 3,713 17.0%University Total * 251 10,591 51 1,235 40 116 39 12,324University Share of Total 0.0% 2.0% 85.9% 0.4% 10.0% 0.3% 0.9% 0.3% 100%Grand Total 2,140 1,313 6,277 10,591 51 1,235 40 116 39 21,802Share of Total 9.8% 6.0% 28.8% 48.6% 0.2% 5.7% 0.2% 0.5% 0.2% 100% 100%
UT Universities
Academic Year 2012 - 2013Pell Eligible Award Recipients by Institution
TBR Community Colleges
TBR Universities
Tennessee Higher Education Commission Fact Book 2013-2014 40 Student Success

Tables 2.16
Source: THEC SIS Notes: Total Grads were first-time, full-time freshmen (FTFTF) who enrolled fall or summer of 2007, returned for fall 2008, and graduated from either their admitting institution or another institution by spring or summer of 2013. Graduates from the summer of 2013 were included along with traditionally reported spring graduates to align with IPEDS reporting. The grad rate for the Total Grads category is a distinct count of students and includes all in-and out-of-state graduates. The grad rate for the Grads from Admitting Institution category consists of students who began at their admitting institution and graduated from that same institution within six years. Graduates in the TN Public or TN Private Institutions columns may be duplicated; students graduated from either their admitting institution or another institution, or both their admitting institution and another institution.
Institution FTFTF HeadcountOverall
Grad Rate
Headcount Grad RatePercent of Total Grads
HeadcountPercent of Total Grads
HeadcountPercent of Total Grads
HeadcountPercent of Total Grads
HeadcountPercent of Total Grads
HeadcountPercent of Total Grads
Chattanooga State Community College 1,012 249 24.6% 186 18.4% 74.7% 194 77.9% 70 28.1% * 2.0% 0 0.0% 26 10.4%Cleveland State Community College 495 165 33.3% 110 22.2% 66.7% 117 70.9% 48 29.1% 19 11.5% 0 0.0% 6 3.6%Columbia State Community College 805 281 34.9% 186 23.1% 66.2% 193 68.7% 113 40.2% 17 6.0% 0 0.0% 21 7.5%Dyersburg State Community College 523 120 22.9% 77 14.7% 64.2% 84 70.0% 51 42.5% * 3.3% 0 0.0% 6 5.0%Jackson State Community College 887 236 26.6% 168 18.9% 71.2% 168 71.2% 75 31.8% 15 6.4% 0 0.0% 16 6.8%Motlow State Community College 912 298 32.7% 217 23.8% 72.8% 229 76.8% 140 47.0% * 1.7% 0 0.0% 14 4.7%Nashville State Community College 611 149 24.4% 96 15.7% 64.4% 98 65.8% 58 38.9% * 1.3% * 1.3% 6 4.0%Northeast State Community College 786 245 31.2% 220 28.0% 89.8% 222 90.6% 71 29.0% * 1.6% 0 0.0% 7 2.9%Pellissippi State Community College 1,228 416 33.9% 252 20.5% 60.6% 264 63.5% 182 43.8% 36 8.7% 0 0.0% 24 5.8%Roane State Community College 1,018 361 35.5% 258 25.3% 71.5% 272 75.3% 148 41.0% 16 4.4% 0 0.0% 9 2.5%Southwest Tennessee Community College 1,422 216 15.2% 139 9.8% 64.4% 140 64.8% 71 32.9% 11 5.1% * 1.4% 12 5.6%Volunteer State Community College 1,095 286 26.1% 178 16.3% 62.2% 184 64.3% 115 40.2% 13 4.5% * 0.7% 24 8.4%Walters State Community College 1,058 368 34.8% 269 25.4% 73.1% 283 76.9% 119 32.3% 25 6.8% 0 0.0% 20 5.4%TBR Community College Total 11,852 3,390 28.6% 2,356 19.9% 69.5% 2,448 72.2% 1,261 37.2% 172 5.1% 7 0.2% 191 5.6%
Austin Peay State University 1,188 522 43.9% 435 36.6% 83.3% 15 2.9% 484 92.7% 9 1.7% 0 0.0% 17 3.3%East Tennessee State University 1,921 995 51.8% 789 41.1% 79.3% 61 6.1% 872 87.6% 10 1.0% 0 0.0% 64 6.4%Middle Tennessee State University 3,592 1,986 55.3% 1,681 46.8% 84.6% 92 4.6% 1,828 92.0% 30 1.5% * 0.1% 63 3.2%Tennessee State University 1,220 480 39.3% 373 30.6% 77.7% 16 3.3% 400 83.3% 6 1.3% * 0.2% 59 12.3%Tennessee Technological University 1,610 961 59.7% 803 49.9% 83.6% 57 5.9% 882 91.8% 14 1.5% 0 0.0% 23 2.4%University of Memphis 2,025 1,019 50.3% 892 44.0% 87.5% 24 2.4% 937 92.0% 17 1.7% 0 0.0% 44 4.3%TBR University Total 11,556 5,963 51.6% 4,973 43.0% 83.4% 265 4.4% 5,403 90.6% 86 1.4% * 0.0% 270 4.5%
University of Tennessee, Chattanooga 1,929 1,021 52.9% 706 36.6% 69.1% 91 8.9% 881 86.3% 25 2.4% * 0.1% 38 3.7%University of Tennessee, Knoxville 4,331 3,327 76.8% 2,878 66.5% 86.5% 73 2.2% 3,096 93.1% 79 2.4% 0 0.0% 110 3.3%University of Tennessee, Martin 1,283 723 56.4% 589 45.9% 81.5% 40 5.5% 661 91.4% 10 1.4% * 0.1% 21 2.9%UT University Total 7,543 5,071 67.2% 4,173 55.3% 82.3% 204 4.0% 4,638 91.5% 114 2.2% * 0.0% 169 3.3%University Total 19,099 11,034 57.8% 9,146 47.9% 82.9% 469 4.3% 10,041 91.0% 200 1.8% * 0.0% 439 4.0%Grand Total 30,951 14,424 46.6% 11,502 37.2% 79.7% 2,917 20.2% 11,302 78.4% 372 2.6% 11 0.1% 630 4.4%
UT Universities
Six Year Graduation RatesFall 2007 Cohort
Total GradsGrads from Admitting
InsitutionTN Public Institutions
TBR Community Colleges
TBR Universities
TN Private InstitutionsOut-Of-State2 Year 4 Year TICUA Non TICUA
Tennessee Higher Education Commission Fact Book 2013-2014 41 Student Success

Table 2.17
Source: THEC SIS Notes: “Other” race/ethnicity consists of Alaskan Native, American Indian, Asian or Pacific Islander, and multiracial. If a student identified their ethnicity as Hispanic, they appear in the “Hispanic” column as well as the column for their race designation, pursuant to Department of Education reporting guidelines.
CaucasianAfrican
American Hispanic Other Unknown
Chattanooga State Community College 1,012 27.6% 5.1% 20.0% 22.2% 25.0%Cleveland State Community College 495 31.9% 26.8% 30.0% 11.1% 16.7%Columbia State Community College 805 33.6% 14.9% 33.3% 22.2% 35.7%Dyersburg State Community College 523 24.1% 12.1% 20.0% 16.7% 0.0%Jackson State Community College 887 28.2% 10.3% 22.2% 33.3% 10.0%Motlow State Community College 912 33.3% 16.7% 16.0% 28.6% 34.8%Nashville State Community College 611 25.9% 11.7% 28.6% 33.3% 30.6%Northeast State Community College 786 30.2% 11.1% 18.2% 28.6% 35.3%Pellissippi State Community College 1,228 31.8% 19.3% 36.7% 29.7% 50.0%Roane State Community College 1,018 34.7% 21.9% 41.7% 25.0% 42.9%Southwest Tennessee Community College 1,422 18.3% 9.5% 27.3% 18.5% 20.2%Volunteer State Community College 1,095 25.4% 9.5% 27.8% 22.7% 30.0%Walters State Community College 1,058 33.1% 25.5% 40.0% 42.9% 100.0%TBR Community College Total 11,852 29.9% 11.3% 28.7% 26.2% 30.4%
Austin Peay State University 1,188 45.0% 35.2% 42.4% 34.0% 37.9%East Tennessee State University 1,921 49.4% 25.6% 42.9% 53.1% 43.2%Middle Tennessee State University 3,592 53.5% 48.0% 46.8% 52.1% 49.2%Tennessee State University 1,220 39.5% 32.6% 30.0% 42.9% 100.0%Tennessee Technological University 1,610 58.1% 44.2% 52.0% 58.3% 53.1%University of Memphis 2,025 53.3% 37.1% 46.3% 51.9% 38.9%TBR University Total 11,556 52.5% 37.0% 45.4% 50.1% 42.6%
University of Tennessee, Chattanooga 1,929 53.2% 37.7% 44.7% 54.5% 75.0%University of Tennessee, Knoxville 4,331 75.1% 59.2% 54.9% 71.1% 74.4%University of Tennessee, Martin 1,283 55.5% 42.3% 52.9% 38.9% 100.0%UT University Total 7,543 66.7% 46.7% 51.6% 64.7% 74.7%University Total 19,099 58.7% 39.7% 47.7% 55.6% 48.8%Grand Total 30,951 47.4% 29.6% 40.5% 47.8% 40.4%
Six Year Graduation Ratesby Institution and Race
TBR Community Colleges
TBR Universities
UT Universities
Institution 2007 FTFTF
Graduation Rates
Tennessee Higher Education Commission Fact Book 2013-2014 42 Student Success

Table 2.18
Source: THEC SIS Note: Graduation rates for the 2007 cohort were derived from a new calculation procedure which is outlined in Table 2.16. Grad rates in this table can be found in the Overall Grad Rate column of the Total Grads section in Table 2.16.
Institution 1998 1999 2000 2001 2002 2003 2004 2005 2006 2007
Chattanooga State Community College 22.3% 21.7% 21.4% 24.5% 20.4% 22.7% 20.8% 21.4% 21.4% 24.6%Cleveland State Community College 30.1% 25.7% 27.5% 25.5% 29.1% 28.3% 28.9% 27.6% 31.8% 33.3%Columbia State Community College 31.1% 32.1% 33.8% 33.7% 30.8% 35.3% 32.3% 32.2% 34.2% 34.9%Dyersburg State Community College 26.9% 28.2% 25.7% 25.9% 23.8% 22.2% 19.8% 23.9% 20.7% 22.9%Jackson State Community College 29.3% 27.5% 29.8% 27.2% 28.9% 24.7% 24.3% 23.9% 23.1% 26.6%Motlow State Community College 29.0% 36.3% 31.5% 32.2% 29.8% 31.1% 29.4% 29.7% 30.5% 32.7%Nashville State Community College 17.8% 19.8% 19.8% 22.1% 22.6% 23.2% 23.6% 21.1% 20.1% 24.4%Northeast State Community College 28.4% 29.5% 28.5% 29.3% 28.8% 28.4% 29.1% 30.4% 31.8% 31.2%Pellissippi State Community College 24.9% 25.4% 26.7% 28.5% 27.8% 30.8% 26.5% 32.0% 35.1% 33.9%Roane State Community College 29.7% 31.0% 31.8% 31.3% 33.6% 33.7% 31.6% 32.2% 32.4% 35.5%Southwest Tennessee Community College - - 14.5% 14.6% 17.1% 13.9% 12.6% 14.8% 12.6% 15.2%Volunteer State Community College 21.9% 28.9% 25.7% 24.1% 24.6% 28.2% 26.7% 25.4% 28.0% 26.1%Walters State Community College 27.4% 28.9% 30.4% 32.8% 30.2% 31.7% 31.0% 31.0% 32.2% 34.8%TBR Community College Total 25.0% 26.2% 26.3% 26.6% 26.3% 26.7% 25.2% 26.0% 26.7% 28.6%
Austin Peay State University 35.0% 35.5% 37.2% 32.5% 36.8% 36.3% 37.6% 41.1% 42.7% 43.9%East Tennessee State University 42.6% 42.9% 46.0% 42.1% 46.6% 47.2% 45.1% 49.2% 48.5% 51.8%Middle Tennessee State University 43.6% 44.9% 46.4% 47.9% 49.9% 51.8% 52.1% 50.6% 51.6% 55.3%Tennessee State University 46.5% 45.3% 42.0% 41.7% 38.4% 42.0% 36.8% 36.6% 38.4% 39.3%Tennessee Technological University 50.1% 49.3% 50.0% 47.3% 48.9% 56.5% 54.2% 54.5% 55.6% 59.7%University of Memphis 38.6% 37.0% 36.9% 38.9% 41.6% 40.5% 40.3% 43.0% 44.1% 50.3%TBR University Total 42.8% 42.9% 43.5% 42.8% 44.9% 46.7% 45.6% 46.6% 47.7% 51.6%
University of Tennessee, Chattanooga 53.8% 51.3% 52.2% 49.1% 46.5% 51.7% 48.6% 50.5% 51.5% 52.9%University of Tennessee, Knoxville 63.2% 63.2% 66.2% 63.2% 63.5% 65.1% 65.8% 68.8% 71.6% 76.8%University of Tennessee, Martin 47.7% 46.4% 47.3% 47.5% 51.7% 54.1% 53.2% 57.3% 56.7% 56.4%UT University Total 58.4% 58.5% 60.2% 57.9% 57.9% 60.2% 60.1% 62.9% 64.2% 67.2%University Total 49.2% 49.2% 50.0% 48.7% 49.8% 51.7% 51.5% 53.1% 54.3% 57.8%Grand Total 40.3% 40.7% 41.2% 39.8% 40.5% 41.3% 40.9% 42.3% 43.2% 46.6%
Six Year Graduation RatesFall Cohorts 1998-2007
TBR Community Colleges
TBR Universities
UT Universities
Tennessee Higher Education Commission Fact Book 2013-2014 43 Student Success

Table 2.19
Source: 2012-13 Performance Funding Reports Note: Total Placeable is defined as the number of graduates (associate’s degrees and certificates) eligible for placement in a job related to the field in which they received their award as reported by the student. Table 2.20
Source: 2012-13 Performance Funding Reports Note: Total Placeable is defined as the number of graduates eligible for placement in a job related to the field in which they received their degree as reported by the student.
Academic Year Total Placeable Total Placed Percent Placed2002-2003 3,759 3,396 90%2003-2004 4,003 3,643 91%2004-2005 4,081 3,746 92%2005-2006 4,163 3,849 92%2006-2007 3,996 3,726 93%2007-2008 4,092 3,784 92%2008-2009 3,702 3,415 92%2009-2010 3,784 3,385 89%2010-2011 3,916 3,645 93%2011-2012 4,697 4,298 92%2012-2013 4,597 4,200 91%
Job Placement RatesCommunity College Graduates
Academic Years 2002 - 2003 to 2012 - 2013
Institution Total Placeable Total Placed Percent PlacedChattanooga State Community College 588 558 95%Cleveland State Community College 249 190 76%Columbia State Community College 275 212 77%Dyersburg State Community College 130 121 93%Jackson State Community College 381 357 94%Motlow State Community College 83 73 88%Nashville State Community College 393 363 92%Northeast State Community College 298 275 92%Pellissippi State Community College 323 310 96%Roane State Community College 395 386 98%Southwest Tennessee Community College 484 434 90%Volunteer State Community College 482 448 93%Walters State Community College 516 473 92%Grand Total 4,597 4,200 91%
Job Placement RatesCommunity College Graduates
by Institution 2012 - 2013
Tennessee Higher Education Commission Fact Book 2013-2014 44 Student Success

Table 2.21
Source: TBR Diplomas are awarded to students who have demonstrated the competencies required for a program and have been awarded the appropriate diploma upon completion, usually in programs of at least 900 clock hours. Certificates are awarded to students who have demonstrated the competencies required for a program and have been awarded the appropriate certificate upon completion, usually in programs of less than 900 clock hours. Supplemental Certificates are non-preparatory awards, usually related to a special industry or special interest. Sufficient Credential is for students who leave a program without a credential before graduation, but have acquired sufficient competencies for employment in the field of instruction or related field.
Institution Certificates DiplomasSupplemental Certificates
Sufficient Credential
Grand Total
Athens 38 99 141 28 306Chattanooga * 479 * 0 661Covington 34 81 30 0 145Crossville 39 146 131 21 337Crump 35 96 * * 153Dickson 50 200 283 0 533Elizabethton 202 272 11 17 502Harriman 41 112 82 0 235Hartsville 121 158 20 271 570Hohenwald * 156 104 * 314Jacksboro 39 115 35 0 189Jackson 148 242 12 0 402Knoxville 51 374 568 0 993Livingston 21 211 1,163 282 1,677McKenzie 43 131 * * 189McMinnville 35 129 95 28 287Memphis 163 425 216 0 804Morristown 55 241 132 0 428Murfreesboro * 185 374 * 651Nashville 220 322 88 0 630Newbern 36 175 36 0 247Oneida 42 88 147 0 277Paris 76 207 * * 340Pulaski 153 99 805 20 1,077Ripley 22 88 44 0 154Shelbyville 87 221 265 0 573Whiteville 38 68 50 0 156Grand Total 2,112 5,120 4,902 696 12,830Share of Total 16.5% 39.9% 38.2% 5.4% 100.0%
Tennessee Colleges of Applied Technology Awards for Fall 2012 through Summer 2013
Tennessee Higher Education Commission Fact Book 2013-2014 45 Student Success

Table 2.22
Major Name Certificates Diplomas Other TotalAdult Basic Education 238 238ADV Manufacturing Education * * 74 83Aesthetician * * 41Aesthetics 22 22Aircraft Mechanics * 115 * 124Assistant Animal Lab Technology * * 9Automotive Mechanics * 41 * 56Automotive Technology 116 175 51 342Avionics 12 12Barbering * * 37Building Construction Technology 15 31 217 263Business Systems Technology 278 448 228 954Central Services Technician 507 507Collision Repair Technology 45 106 15 166Commercial Truck Driving 232 96 10 338Computer Information Technology 137 244 131 512Computer Numeric Control * 6 * 15Computerized Graphics Design * * 21Cosmetology 43 209 49 301Cosmetology Instructor Training * *Culinary Arts 8 18 26Dental Assistant (Supplemental Program) 32 32Dental Assisting 70 64 134Dental Laboratory Technician 9 17 26Diesel Powered Equipment Technology 11 57 68Dietary Management * * 46Drafting and CAD Technology 48 64 62 174Early Childhood Education 11 30 30 71Electrical & Electronics Equipment Repair * 47 * 72Electrical & Power Transmission Installation 25 25Electro Mechanical Technology * * * 7Electronics Technology 28 82 14 124Graphic & Printing Communications 4 18 22Hazardous Materials (Supplemental Program) 18 18Health Information Technology * 35 * 42Heating, Ventilation, Air Cond & Refrig Technology 78 252 68 398Heavy Equipment Maintenance & Repair * 10 * 14Industrial Electricity 24 91 9 124Industrial Electronics 16 19 13 48Industrial Maintenance 118 330 337 785Industrial Training Technology 1,148 1,148
Tennessee Colleges of Applied TechnologyAwards by Program for Academic Year 2012-2013
Tennessee Higher Education Commission Fact Book 2013-2014 46 Student Success

Table 2.22 continued
Source: TBR
Major Name Certificates Diplomas Other TotalInformation Technology * * 13IV Therapy 49 49IV Therapy (Supplemental Program) 124 124Landscape and Turf Management 8 8Machine Tool Technology 94 229 125 448Manicurist 6 6Masonry 6 10 16Massage Therapy 11 11Mechatronics Technology 22 22Medical Assisting 22 185 207Medical Office Information Technology * * 70Medical Office Management 29 29Motorcycle ATV Technology * 55 * 65Nursing Assistant 182 11 379 572Nursing Assisting (Supplemental Program) 118 118Occupational Safety & Health Technician 6 6Patient Care Technician * 46 * 51Pharmacy Technology 7 51 58Phlebotomy 66 66Phlebotomy (Supplemental Program) * 72 *Pipefitting * * 13Practical Nursing 72 1,380 414 1,866Precision Metals * 14 * 29PT Dietary Management (Supplemental Program) * *RN Refresher (Supplemental Program) 140 140Residential Building Maintenance * * 20Residential Construction Technology 19 * * 25Residential/Commercial Wiring & Plumbing * * 76 130Solar Photovoltaic Technology * 22 * 31Surgical Technology 86 86Technology Foundations 251 251Tool & Die Making * * 14Trade & Ind Supervision Mgmt (Supplemental Program) 9 9Tree Management (Supplemental Program) 12 12Welding, Brazing, Soldering 169 312 192 673Worker Ethics (Supplemental Program) 49 49Workforce Preparedness (Supplemental Program) 21 21Grand Total 2,112 5,120 5,598 12,830
Awards by Program continued
Tennessee Higher Education Commission Fact Book 2013-2014 47 Student Success

Table 2.23
Source: TBR Notes: Calculated Enrollment is the difference between total enrolled during the period less students still enrolled. This is the definition developed by the Council for Occupational Education, the TCAT accreditation body. Completers Available for Placement are those that are not enlisted in the military or seeking additional education, as well as any that are not documented to be unavailable for employment because of situations such as pregnancy, other serious health-related issues (physical/mental/behavioral), caring for ill family members, incarceration, death, etc.
InstitutionCalculated Enrollment Completed
Percent Completed
Completers Available for
Placement
Placed in Field of Training
Percent Placed
Athens 135 113 83.7% 106 93 87.7%Chattanooga 936 705 75.3% 662 625 94.4%Covington 179 151 84.4% 140 109 77.9%Crossville 247 203 82.2% 194 167 86.1%Crump 216 187 86.6% 181 158 87.3%Dickson 394 326 82.7% 293 241 82.3%Elizabethton 455 381 83.7% 353 312 88.4%Harriman 169 153 90.5% 133 114 85.7%Hartsville 281 223 79.4% 216 181 83.8%Hohenwald 300 250 83.3% 230 203 88.3%Jacksboro 172 146 84.9% 132 117 88.6%Jackson 501 396 79.0% 367 298 81.2%Knoxville 583 446 76.5% 367 317 86.4%Livingston 304 238 78.3% 220 190 86.4%McKenzie 198 177 89.4% 153 122 79.7%McMinnville 198 163 82.3% 161 130 80.7%Memphis 797 607 76.2% 469 370 78.9%Morristown 390 306 78.5% 286 243 85.0%Murfreesboro 345 292 84.6% 275 226 82.2%Nashville 671 535 79.7% 464 400 86.2%Newbern 206 161 78.2% 152 115 75.7%Oneida/Huntsville 146 120 82.2% 99 74 74.7%Paris 346 306 88.4% 255 222 87.1%Pulaski 187 160 85.6% 144 118 81.9%Ripley 131 106 80.9% 100 83 83.0%Shelbyville 488 394 80.7% 374 322 86.1%Whiteville 160 126 78.8% 114 108 94.7%Grand Total 9,135 7,371 80.7% 6,640 5,658 85.2%
Tennessee Colleges of Applied Technology2012 - 2013 Program Completion and Placement Rates
Tennessee Higher Education Commission Fact Book 2013-2014 48 Student Success
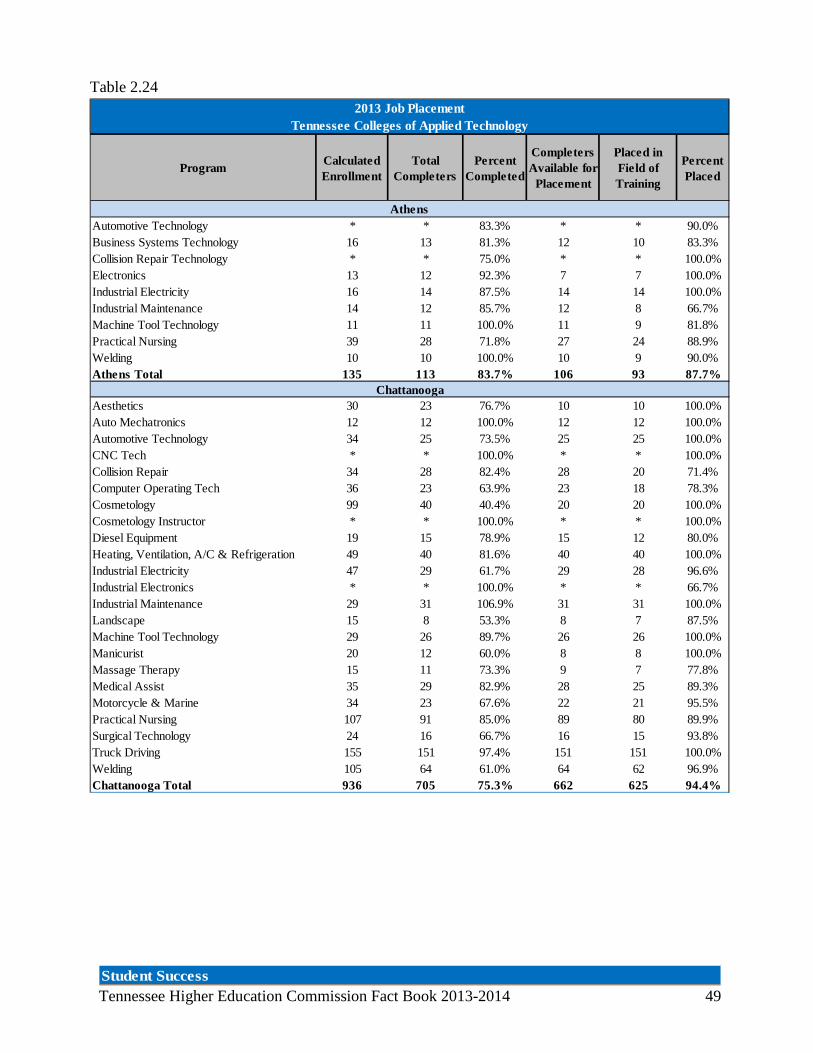
Table 2.24
Program Calculated Enrollment
Total Completers
Percent Completed
Completers Available for
Placement
Placed in Field of Training
Percent Placed
Automotive Technology * * 83.3% * * 90.0%Business Systems Technology 16 13 81.3% 12 10 83.3%Collision Repair Technology * * 75.0% * * 100.0%Electronics 13 12 92.3% 7 7 100.0%Industrial Electricity 16 14 87.5% 14 14 100.0%Industrial Maintenance 14 12 85.7% 12 8 66.7%Machine Tool Technology 11 11 100.0% 11 9 81.8%Practical Nursing 39 28 71.8% 27 24 88.9%Welding 10 10 100.0% 10 9 90.0%Athens Total 135 113 83.7% 106 93 87.7%
Aesthetics 30 23 76.7% 10 10 100.0%Auto Mechatronics 12 12 100.0% 12 12 100.0%Automotive Technology 34 25 73.5% 25 25 100.0%CNC Tech * * 100.0% * * 100.0%Collision Repair 34 28 82.4% 28 20 71.4%Computer Operating Tech 36 23 63.9% 23 18 78.3%Cosmetology 99 40 40.4% 20 20 100.0%Cosmetology Instructor * * 100.0% * * 100.0%Diesel Equipment 19 15 78.9% 15 12 80.0%Heating, Ventilation, A/C & Refrigeration 49 40 81.6% 40 40 100.0%Industrial Electricity 47 29 61.7% 29 28 96.6%Industrial Electronics * * 100.0% * * 66.7%Industrial Maintenance 29 31 106.9% 31 31 100.0%Landscape 15 8 53.3% 8 7 87.5%Machine Tool Technology 29 26 89.7% 26 26 100.0%Manicurist 20 12 60.0% 8 8 100.0%Massage Therapy 15 11 73.3% 9 7 77.8%Medical Assist 35 29 82.9% 28 25 89.3%Motorcycle & Marine 34 23 67.6% 22 21 95.5%Practical Nursing 107 91 85.0% 89 80 89.9%Surgical Technology 24 16 66.7% 16 15 93.8%Truck Driving 155 151 97.4% 151 151 100.0%Welding 105 64 61.0% 64 62 96.9%Chattanooga Total 936 705 75.3% 662 625 94.4%
2013 Job PlacementTennessee Colleges of Applied Technology
Athens
Chattanooga
Tennessee Higher Education Commission Fact Book 2013-2014 49 Student Success

Table 2.24 continued
Program Calculated Enrollment
Total Completers
Percent Completed
Completers Available for
Placement
Placed in Field of Training
Percent Placed
Automotive Technology 10 10 100.0% * * 50.0%Business Systems Technology 25 18 72.0% 16 15 93.8%Computer Information Technology 22 17 77.3% 14 8 57.1%Heating, Ventilation, A/C & Refrigeration 24 15 62.5% * * 92.3%Industrial Maintenance 17 16 94.1% 15 14 93.3%Machine Tool Technology 18 17 94.4% 17 16 94.1%Practical Nursing 32 30 93.8% 30 28 93.3%Welding 31 28 90.3% 27 12 44.4%Covington Total 179 151 84.4% 140 109 77.9%
Automotive Technology 16 14 87.5% 13 13 100.0%Building Construction Technology * * 57.1% * * 100.0%Business Systems Technology 33 25 75.8% 24 20 83.3%Collision Repair Technology 11 11 100.0% 11 10 90.9%Computer Information Technology 20 16 80.0% 16 12 75.0%Drafting and CAD Technology 12 9 75.0% * * 87.5%Electronics Technology 11 9 81.8% 9 8 88.9%Heating, Ventilation, A/C & Refrigeration 10 10 100.0% 9 9 100.0%Industrial Maintenance/Electricity Technology 28 25 89.3% 22 17 77.3%Machine Tool Technology * * 100.0% 9 9 100.0%Practical Nursing 58 44 75.9% 44 36 81.8%Surgical Technology 19 15 78.9% 15 13 86.7%Welding Technology 13 12 92.3% 11 10 90.9%Crossville Total 247 203 82.2% 194 167 86.1%
Business Systems Technology 38 29 76.3% 28 25 89.3%Collision Repair Technology 20 20 100.0% 17 17 100.0%Computer Graphics Design * * 100.0% * * 75.0%Computer Information Technology 23 21 91.3% 21 19 90.5%Drafting and CAD Technology 16 14 87.5% 14 11 78.6%Electronics Technology * * 100.0% * * 80.0%Health and Information Technology 16 14 87.5% 14 10 71.4%Heating, Ventilation, A/C & Refrigeration 10 8 80.0% 8 7 87.5%Industrial Electronics 14 11 78.6% 11 10 90.9%Industrial Maintenance 12 12 100.0% 12 10 83.3%Machine Tool Technology 16 14 87.5% 14 13 92.9%Practical Nursing 23 16 69.6% 16 13 81.3%Welding Technology 14 14 100.0% 13 13 100.0%Crump Total 216 187 86.6% 181 158 87.3%
Covington
Job Placement by Program and College continued
Crossville
Crump
Tennessee Higher Education Commission Fact Book 2013-2014 50 Student Success

Table 2.24 continued
Program Calculated Enrollment
Total Completers
Percent Completed
Completers Available for
Placement
Placed in Field of Training
Percent Placed
Automotive Technology 31 25 80.6% 20 18 90.0%Business Systems Technology 54 39 72.2% 34 21 61.8%Computer Information Technology 28 20 71.4% 16 10 62.5%Cosmetology 37 29 78.4% 25 18 72.0%Dental Assistant 18 16 88.9% 15 14 93.3%Diesel Powered Equipment 14 12 85.7% 10 8 80.0%Drafting and CAD Technology * * 100.0% * * 100.0%Heating, Ventilation, AC & Refrigeration 28 24 85.7% 22 16 72.7%Industrial Maintenance/Electronics 17 16 94.1% 15 12 80.0%Machine Tool Technology 18 17 94.4% 16 15 93.8%Mechatronics Apprenticeship Program 11 10 90.9% 10 10 100.0%Practical Nursing 128 108 84.4% 104 93 89.4%Solar Photovoltaics Technician * * 100.0% * * 100.0%Dickson Total 394 326 82.7% 293 241 82.3%
Automotive Technology 13 12 92.3% 12 12 100.0%Business Systems Technology 61 54 88.5% 48 41 85.4%Computer Information Technology 16 16 100.0% 13 12 92.3%Diesel Powered Equipment Technology 16 16 100.0% 15 14 93.3%Dietary Management 55 44 80.0% 41 35 85.4%Electricity/Electronics 35 30 85.7% 28 22 78.6%Heating, Ventilation, AC & Refrigeration 11 8 72.7% * * 71.4%Millwright Skills 15 15 100.0% 11 11 100.0%Pipefitting 16 16 100.0% 16 14 87.5%Practical Nursing 188 141 75.0% 137 122 89.1%Welding 29 29 100.0% 25 24 96.0%Elizabethton Total 455 381 83.7% 353 312 88.4%
Automotive Technology 18 17 94.4% 15 14 93.3%Business Systems Technology 32 31 96.9% 30 26 86.7%Computer Information Technology 13 11 84.6% 11 8 72.7%Cosmetology 14 12 85.7% * * 100.0%Diesel Mechanics 15 14 93.3% 13 11 84.6%Industrial Maintenance Technology 12 10 83.3% 10 8 80.0%Machine Tool Technology 8 7 87.5% * * 80.0%Practical Nursing 38 32 84.2% 28 24 85.7%Welding Technology 19 19 100.0% 16 14 87.5%Harriman Total 169 153 90.5% 133 114 85.7%
Dickson
Elizabethton
Harriman
Job Placement by Program and College continued
Tennessee Higher Education Commission Fact Book 2013-2014 51 Student Success

Table 2.24 continued
Program Calculated Enrollment
Total Completers
Percent Completed
Completers Available for
Placement
Placed in Field of Training
Percent Placed
Automotive Technology 19 14 73.7% 14 10 71.4%Business Systems Technology 33 27 81.8% 25 20 80.0%Computer Information Technology 26 18 69.2% 17 14 82.4%Cosmetology 17 12 70.6% * * 25.0%Drafting & CAD Technology * * 100.0% 10 8 80.0%Heating, Ventilation, AC & Refrigeration * * 100.0% * * 75.0%Industrial Maintenance 17 13 76.5% 13 12 92.3%Machine Tool Technology 18 15 83.3% 15 14 93.3%Patient Care Technician 21 18 85.7% 18 17 94.4%Practical Nursing 94 78 83.0% 76 71 93.4%Welding Technology 21 13 61.9% 12 9 75.0%Hartsville Total 281 223 79.4% 216 181 83.8%
Automotive Technology 27 23 85.2% 21 18 85.7%Business Systems Technology 21 19 90.5% 19 17 89.5%Computer Information Technology 23 19 82.6% 17 13 76.5%Cosmetology 21 16 76.2% 8 8 100.0%Cosmetology (Diploma) 16 15 93.8% 11 9 81.8%Drafting & CAD Technology 10 9 90.0% 8 6 75.0%Early Childhood Education 14 13 92.9% 13 10 76.9%Electro-Mechanical Technology 13 12 92.3% 12 11 91.7%Electronics Technology 11 10 90.9% 10 10 100.0%Industrial Maintenance 42 39 92.9% 39 31 79.5%Machine Tool Technology 11 9 81.8% 9 9 100.0%Practical Nursing 75 55 73.3% 52 51 98.1%Surgical Technology 16 11 68.8% 11 10 90.9%Hohenwald Total 300 250 83.3% 230 203 88.3%
Automotive Technician 17 17 100.0% 16 16 100.0%Business Systems Technology 24 20 83.3% 18 16 88.9%Computer Information Technology 15 13 86.7% 13 12 92.3%Industrial Electricity - Electrician 12 11 91.7% 11 9 81.8%Machine Tool Technology 11 10 90.9% 10 9 90.0%Motorcycle & Marine 21 21 100.0% 18 15 83.3%Practical Nursing 50 32 64.0% 25 21 84.0%Welding Technology-Combination Welder 22 22 100.0% 21 19 90.5%Jacksboro Total 172 146 84.9% 132 117 88.6%
Job Placement by Program and College continued
Jacksboro
Hohenwald
Hartsville
Tennessee Higher Education Commission Fact Book 2013-2014 52 Student Success

Table 2.24 continued
Program Calculated Enrollment
Total Completers
Percent Completed
Completers Available for
Placement
Placed in Field of Training
Percent Placed
Automotive Technology 23 19 82.6% 19 18 94.7%Business Systems Technology 76 59 77.6% 55 33 60.0%Collision Repair Technology 24 13 54.2% 12 10 83.3%Computer Information Technology 51 29 56.9% 28 18 64.3%Drafting & CAD Technology * * 30.0% * * 100.0%Electronics Technology * * 80.0% * * 75.0%General Building Trades * * 100.0% * * 25.0%Heating, Ventilation, AC & Refrigeration 19 16 84.2% 15 11 73.3%Industrial Electricity 23 20 87.0% 20 14 70.0%Industrial Maintenance Technology 21 21 100.0% 20 15 75.0%Machine Tool Technology 40 29 72.5% 26 22 84.6%Practical Nursing 101 83 82.2% 72 70 97.2%Surgical Technology 14 9 64.3% 8 7 87.5%Tool and Die Technology 13 13 100.0% 13 13 100.0%Truck Driving 35 32 91.4% 32 32 100.0%Welding 42 42 100.0% 38 30 78.9%Jackson Total 501 396 79.0% 367 298 81.2%
Automotive Technology 21 15 71.4% 13 11 84.6%Business Systems Technology 39 26 66.7% 23 16 69.6%Collision Repair Technology 16 13 81.3% 13 12 92.3%Computer and Network Systems Technologies * * 57.1% * * 62.5%Computer Information Systems * * 100.0% * * 25.0%Cosmetology 42 22 52.4% 9 8 88.9%Dental Assisting 18 15 83.3% 15 13 86.7%Diesel Powered Equipment Technology 15 11 73.3% 11 11 100.0%Heating, Ventilation, AC & Refrigeration 16 16 100.0% 14 14 100.0%Industrial Electricity 20 15 75.0% 14 10 71.4%Industrial Maintenance 20 18 90.0% 17 13 76.5%Machine Tool Technology 10 9 90.0% 9 8 88.9%Medical Assistant 16 10 62.5% 9 9 100.0%Medical Office Information Technology 86 77 89.5% 66 60 90.9%Practical Nursing 150 106 70.7% 64 54 84.4%Surgical Technology 37 24 64.9% 24 21 87.5%Truck Driving 43 42 97.7% 40 37 92.5%Welding 16 15 93.8% 14 14 100.0%Knoxville Total 583 446 76.5% 367 317 86.4%
Job Placement by Program and College continued
Jackson
Knoxville
Tennessee Higher Education Commission Fact Book 2013-2014 53 Student Success

Table 2.24 continued
Program Calculated Enrollment
Total Completers
Percent Completed
Completers Available for
Placement
Placed in Field of Training
Percent Placed
Automotive Technology 22 14 63.6% 12 11 91.7%Building Construction Technology * * 80.0% * * 100.0%Business Systems Technology 22 19 86.4% 17 15 88.2%Collision Repair Technology 17 14 82.4% 14 11 78.6%Computer Information Technology 15 12 80.0% 9 8 88.9%Cosmetology 23 16 69.6% 10 9 90.0%Electronics Technology * * 66.7% * * 50.0%Industrial Maintenance 36 29 80.6% 29 26 89.7%Information Technology 15 12 80.0% 11 8 72.7%Machine Tool Technology 12 10 83.3% 10 10 100.0%Pharmacy Technology 21 17 81.0% 15 12 80.0%Practical Nursing 108 85 78.7% 83 71 85.5%Livingston Total 304 238 78.3% 220 190 86.4%
Automotive Technology 15 14 93.3% 11 10 90.9%Business Systems Technology 49 38 77.6% 34 25 73.5%Computer Information Technology (online) 11 10 90.9% * * 100.0%Electronics Technology 41 40 97.6% 33 23 69.7%Heating, Ventilation, AC & Refrigeration 13 11 84.6% 11 9 81.8%Industrial Maintenance 36 33 91.7% 29 24 82.8%Machine Tool Technology 9 8 88.9% * * 71.4%Welding Technology 24 23 95.8% 22 20 90.9%McKenzie Total 198 177 89.4% 153 122 79.7%
Automotive Technology 19 16 84.2% 15 13 86.7%Business Systems Technology 25 25 100.0% 25 18 72.0%Computer Information Technology 24 20 83.3% 20 14 70.0%Culinary Arts * * 0.0% 0 0 --Electronics Technology * * 100.0% * * 75.0%Industrial Electricity * * 100.0% * * 100.0%Industrial Maintenance 32 24 75.0% 24 20 83.3%Machine Tool Technology 13 11 84.6% 11 8 72.7%Medical Assistant 17 15 88.2% 15 12 80.0%Practical Nursing 47 34 72.3% 34 32 94.1%Tool and Die * * 100.0% * * 100.0%Welding 10 10 100.0% 10 7 70.0%McMinnville Total 198 163 82.3% 161 130 80.7%
Job Placement by Program and College continued
Livingston
McKenzie
McMinnville
Tennessee Higher Education Commission Fact Book 2013-2014 54 Student Success
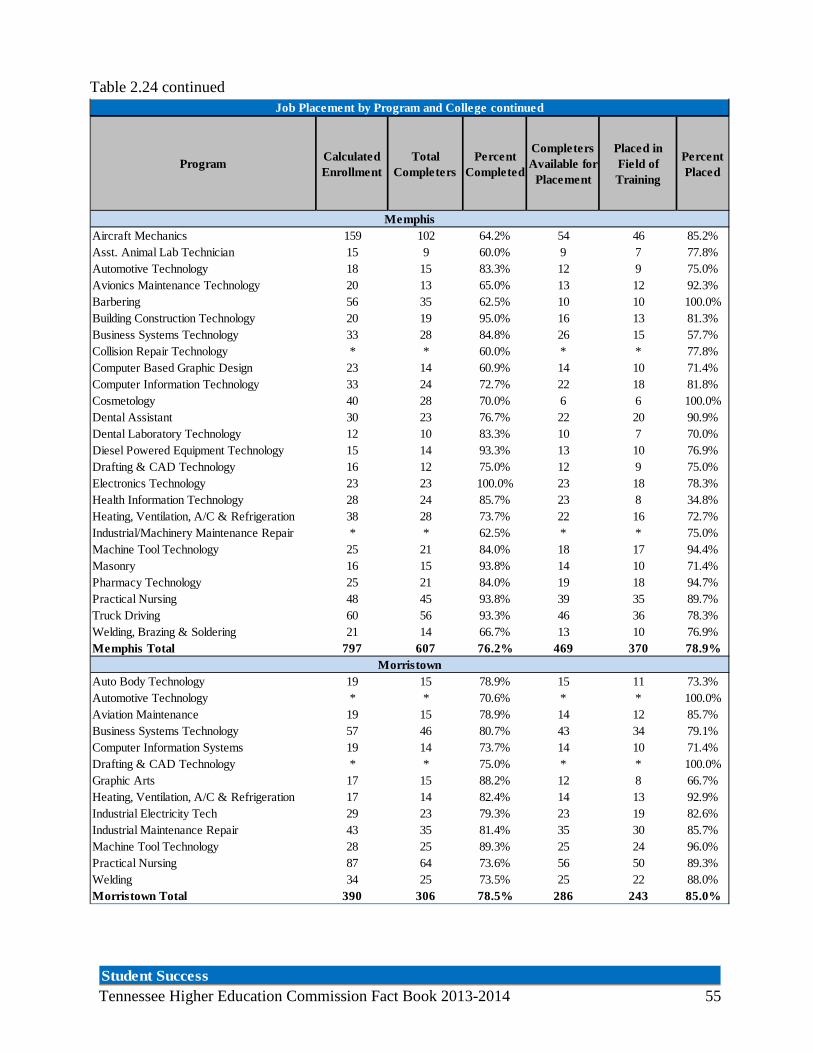
Table 2.24 continued
Program Calculated Enrollment
Total Completers
Percent Completed
Completers Available for
Placement
Placed in Field of Training
Percent Placed
Aircraft Mechanics 159 102 64.2% 54 46 85.2%Asst. Animal Lab Technician 15 9 60.0% 9 7 77.8%Automotive Technology 18 15 83.3% 12 9 75.0%Avionics Maintenance Technology 20 13 65.0% 13 12 92.3%Barbering 56 35 62.5% 10 10 100.0%Building Construction Technology 20 19 95.0% 16 13 81.3%Business Systems Technology 33 28 84.8% 26 15 57.7%Collision Repair Technology * * 60.0% * * 77.8%Computer Based Graphic Design 23 14 60.9% 14 10 71.4%Computer Information Technology 33 24 72.7% 22 18 81.8%Cosmetology 40 28 70.0% 6 6 100.0%Dental Assistant 30 23 76.7% 22 20 90.9%Dental Laboratory Technology 12 10 83.3% 10 7 70.0%Diesel Powered Equipment Technology 15 14 93.3% 13 10 76.9%Drafting & CAD Technology 16 12 75.0% 12 9 75.0%Electronics Technology 23 23 100.0% 23 18 78.3%Health Information Technology 28 24 85.7% 23 8 34.8%Heating, Ventilation, A/C & Refrigeration 38 28 73.7% 22 16 72.7%Industrial/Machinery Maintenance Repair * * 62.5% * * 75.0%Machine Tool Technology 25 21 84.0% 18 17 94.4%Masonry 16 15 93.8% 14 10 71.4%Pharmacy Technology 25 21 84.0% 19 18 94.7%Practical Nursing 48 45 93.8% 39 35 89.7%Truck Driving 60 56 93.3% 46 36 78.3%Welding, Brazing & Soldering 21 14 66.7% 13 10 76.9%Memphis Total 797 607 76.2% 469 370 78.9%
Auto Body Technology 19 15 78.9% 15 11 73.3%Automotive Technology * * 70.6% * * 100.0%Aviation Maintenance 19 15 78.9% 14 12 85.7%Business Systems Technology 57 46 80.7% 43 34 79.1%Computer Information Systems 19 14 73.7% 14 10 71.4%Drafting & CAD Technology * * 75.0% * * 100.0%Graphic Arts 17 15 88.2% 12 8 66.7%Heating, Ventilation, A/C & Refrigeration 17 14 82.4% 14 13 92.9%Industrial Electricity Tech 29 23 79.3% 23 19 82.6%Industrial Maintenance Repair 43 35 81.4% 35 30 85.7%Machine Tool Technology 28 25 89.3% 25 24 96.0%Practical Nursing 87 64 73.6% 56 50 89.3%Welding 34 25 73.5% 25 22 88.0%Morristown Total 390 306 78.5% 286 243 85.0%
Job Placement by Program and College continued
Memphis
Morristown
Tennessee Higher Education Commission Fact Book 2013-2014 55 Student Success

Table 2.24 continued
Program Calculated Enrollment
Total Completers
Percent Completed
Completers Available for
Placement
Placed in Field of Training
Percent Placed
Automotive Technology 24 17 70.8% 16 15 93.8%Business Systems Technology 36 32 88.9% 32 22 68.8%Computer Information Technology 25 22 88.0% 18 13 72.2%Concrete Technology 12 10 83.3% * * 90.0%Cosmetology 10 7 70.0% * * 100.0%Dental Assisting 17 11 64.7% 11 11 100.0%Drafting and CAD Technology 23 21 91.3% 21 15 71.4%Heating, Ventilation, A/C & Refrigeration 21 16 76.2% 14 11 78.6%Industrial Electrical Maintenance 30 25 83.3% 24 22 91.7%Machine Tool Technology 12 10 83.3% 10 9 90.0%Pharmacy Technician 20 18 90.0% 17 14 82.4%Phlebotomy 37 33 89.2% 30 27 90.0%Practical Nursing 60 54 90.0% 52 42 80.8%Surgical Technology 18 16 88.9% 14 10 71.4%Murfreesboro Total 345 292 84.6% 275 226 82.2%
Aesthetics Technology 44 38 86.4% 33 28 84.8%Aircraft Mechanics (Aviation Maintenance Te 20 18 90.0% 16 16 100.0%Automotive Technology 38 35 92.1% 35 28 80.0%Building Construction Technology 17 11 64.7% 11 9 81.8%Business Systems Technology 29 25 86.2% 21 16 76.2%Collision Repair Technology 18 14 77.8% 14 11 78.6%Computer Information Technology 18 15 83.3% 15 13 86.7%Cosmetology 62 37 59.7% 28 20 71.4%Dental Assisting * * 62.5% * * 80.0%Dental Lab Technology 26 17 65.4% 11 8 72.7%Drafting & CAD Technology 14 9 64.3% * * 77.8%Early Childhood Education 21 13 61.9% 13 13 100.0%Heating, Ventilation, A/C & Refrigeration 84 82 97.6% 78 73 93.6%Industrial Electricity/Mechatronics * * 83.3% 10 9 90.0%Machine Tool Technology 21 19 90.5% 19 16 84.2%Phlebotomy 35 34 97.1% 29 21 72.4%Practical Nursing 133 90 67.7% 55 51 92.7%Truck Driving 31 27 87.1% 27 27 100.0%Welding Technology 40 36 90.0% 35 30 85.7%Nashville Total 671 535 79.7% 464 400 86.2%
Job Placement by Program and College continued
Murfreesboro
Nashville
Tennessee Higher Education Commission Fact Book 2013-2014 56 Student Success

Table 2.24 continued
Program Calculated Enrollment
Total Completers
Percent Completed
Completers Available for
Placement
Placed in Field of Training
Percent Placed
Automotive Technology 29 25 86.2% 24 15 62.5%Business Systems Technology 43 30 69.8% 28 10 35.7%Computer Info Technology * * 100.0% * * 33.3%Drafting & CAD Technology 21 19 90.5% 16 12 75.0%Electronics Technology * * 88.9% * * 100.0%Heating, Ventilation, A/C & Refrigeration 12 11 91.7% 11 11 100.0%Industrial Maintenance 25 20 80.0% 20 19 95.0%Machine Tool Technology 15 11 73.3% 10 8 80.0%Practical Nursing 49 34 69.4% 34 33 97.1%Newbern Total 206 161 78.2% 152 115 75.7%
Automotive Technology 9 6 66.7% * * 75.0%Business Systems Technology 29 23 79.3% 23 13 56.5%Collision Repair Technology * * 100.0% 8 6 75.0%Computer Information Technology 10 10 100.0% 10 9 90.0%Cosmetology 20 17 85.0% * * 100.0%Electronics Technology 10 10 100.0% 10 7 70.0%Machine Tool Technology * * 75.0% * * 50.0%Practical Nursing 42 31 73.8% 30 27 90.0%Welding 14 12 85.7% 11 7 63.6%Oneida Total 146 120 82.2% 99 74 74.7%
Business Systems Technology 56 50 89.3% 43 35 81.4%Collision Repair Technology 15 12 80.0% 12 11 91.7%Computer Information Technology 18 16 88.9% 14 12 85.7%Cosmetology 16 12 75.0% * * 71.4%Early Childhood Education 17 14 82.4% * * 87.5%General Metals (Precision Metals) 15 14 93.3% 11 9 81.8%Industrial Maintenance Technology 20 18 90.0% 18 17 94.4%Machine Tool Technology 13 13 100.0% 11 9 81.8%Motorcycle & All Terrain Vehicle Repair 25 22 88.0% 19 18 94.7%Patient Care Technician 22 16 72.7% 15 14 93.3%Practical Nursing 108 99 91.7% 77 68 88.3%Residential Building Maintenance 21 20 95.2% 20 17 85.0%Paris Total 346 306 88.4% 255 222 87.1%
Advanced Manufacturing Education 11 9 81.8% 9 7 77.8%Business Systems Technology 45 34 75.6% 29 24 82.8%Computer Information Systems 11 11 100.0% 11 11 100.0%Heating, Ventilation, A/C & Refrigeration 13 10 76.9% * * 62.5%Industrial Electricity 17 15 88.2% 13 9 69.2%Industrial Maintenance Technology 13 12 92.3% 11 6 54.5%Practical Nursing 24 23 95.8% 23 22 95.7%Residential Construction Technology * * 100.0% * * 100.0%Residential/Commercial Wiring and Plumbing * * 100.0% 8 7 87.5%Solar Photovoltaics Technician 22 15 68.2% 10 8 80.0%Welding Technology 21 21 100.0% 21 18 85.7%Pulaski Total 187 160 85.6% 144 118 81.9%
Job Placement by Program and College continued
Newbern
Oneida
Paris
Pulaski
Tennessee Higher Education Commission Fact Book 2013-2014 57 Student Success
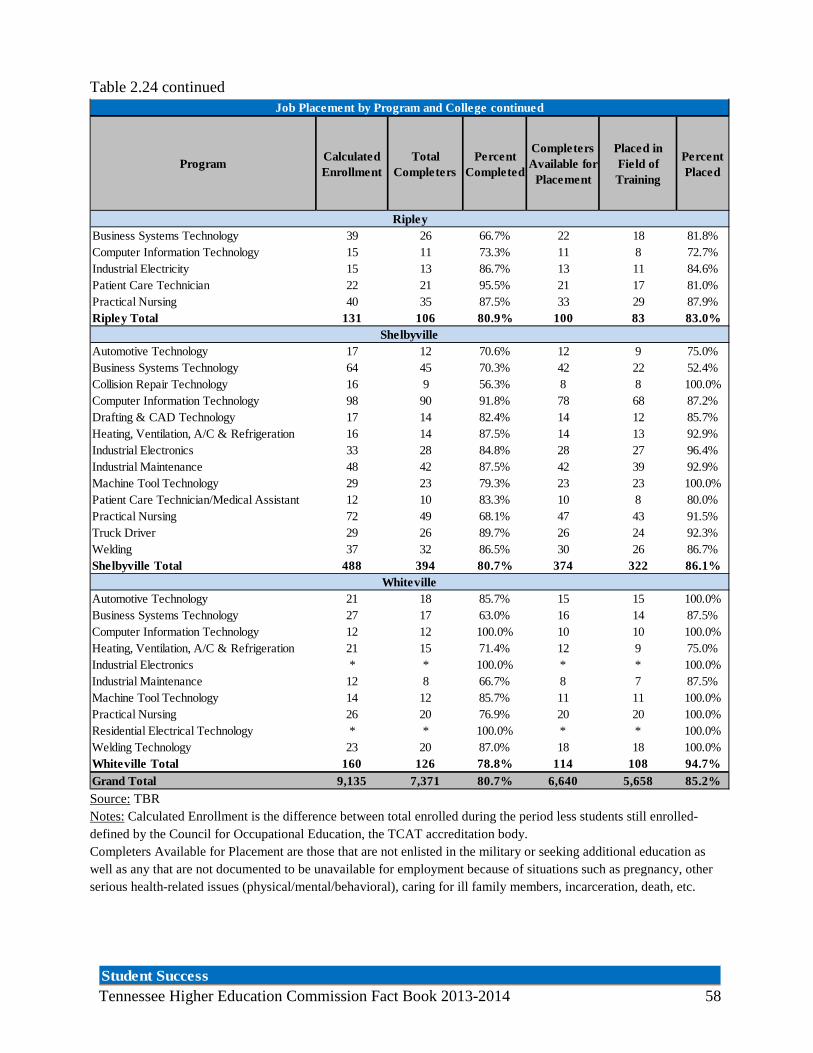
Table 2.24 continued
Source: TBR Notes: Calculated Enrollment is the difference between total enrolled during the period less students still enrolled- defined by the Council for Occupational Education, the TCAT accreditation body. Completers Available for Placement are those that are not enlisted in the military or seeking additional education as well as any that are not documented to be unavailable for employment because of situations such as pregnancy, other serious health-related issues (physical/mental/behavioral), caring for ill family members, incarceration, death, etc.
Program Calculated Enrollment
Total Completers
Percent Completed
Completers Available for
Placement
Placed in Field of Training
Percent Placed
Business Systems Technology 39 26 66.7% 22 18 81.8%Computer Information Technology 15 11 73.3% 11 8 72.7%Industrial Electricity 15 13 86.7% 13 11 84.6%Patient Care Technician 22 21 95.5% 21 17 81.0%Practical Nursing 40 35 87.5% 33 29 87.9%Ripley Total 131 106 80.9% 100 83 83.0%
Automotive Technology 17 12 70.6% 12 9 75.0%Business Systems Technology 64 45 70.3% 42 22 52.4%Collision Repair Technology 16 9 56.3% 8 8 100.0%Computer Information Technology 98 90 91.8% 78 68 87.2%Drafting & CAD Technology 17 14 82.4% 14 12 85.7%Heating, Ventilation, A/C & Refrigeration 16 14 87.5% 14 13 92.9%Industrial Electronics 33 28 84.8% 28 27 96.4%Industrial Maintenance 48 42 87.5% 42 39 92.9%Machine Tool Technology 29 23 79.3% 23 23 100.0%Patient Care Technician/Medical Assistant 12 10 83.3% 10 8 80.0%Practical Nursing 72 49 68.1% 47 43 91.5%Truck Driver 29 26 89.7% 26 24 92.3%Welding 37 32 86.5% 30 26 86.7%Shelbyville Total 488 394 80.7% 374 322 86.1%
Automotive Technology 21 18 85.7% 15 15 100.0%Business Systems Technology 27 17 63.0% 16 14 87.5%Computer Information Technology 12 12 100.0% 10 10 100.0%Heating, Ventilation, A/C & Refrigeration 21 15 71.4% 12 9 75.0%Industrial Electronics * * 100.0% * * 100.0%Industrial Maintenance 12 8 66.7% 8 7 87.5%Machine Tool Technology 14 12 85.7% 11 11 100.0%Practical Nursing 26 20 76.9% 20 20 100.0%Residential Electrical Technology * * 100.0% * * 100.0%Welding Technology 23 20 87.0% 18 18 100.0%Whiteville Total 160 126 78.8% 114 108 94.7%Grand Total 9,135 7,371 80.7% 6,640 5,658 85.2%
Ripley
Shelbyville
Whiteville
Job Placement by Program and College continued
Tennessee Higher Education Commission Fact Book 2013-2014 58 Student Success

Table 2.25
Source: THEC Performance Funding Reports, TBR, UT Note: The written portion of the Dental Hygiene Exam was discontinued in 2012. *Exam passage rates for UT Health Science Center are not available until after the THEC Fact Book publishing date.
Number Taken
Number Passed
Percent Passed
Number Taken
Number Passed
Percent Passed
Austin Peay Nursing (BSN) 92 91 98.9% 96 94 97.9%East Tennessee Dental Hygiene 24 24 100.0% 21 21 100.0%
Nursing (BSN) 169 149 88.2% 192 179 93.2%Medical (Step I) 71 68 95.8% 70 66 94.3%Medical (II Clinical) 61 60 98.4% 66 58 87.9%Medical (II Skills) 61 60 98.4% 65 64 98.5%
Middle Tennessee Nursing (BSN) 91 86 94.5% 105 101 96.2%Tennessee State Engineering 18 8 44.4% * * 44.4%
Nursing (AAS) 80 56 70.0% 93 80 86.0%Nursing (BSN) 24 21 87.5% 44 28 63.6%Dental Hygiene 22 20 90.9% 11 10 90.9%
Tennessee Tech Engineering 149 117 78.5% 121 96 79.3%Nursing (BSN) 88 84 95.5% 73 73 100.0%
University of Memphis Nursing (BSN) 155 149 96.1% 229 220 96.1%Engineering 51 30 58.8% 47 33 70.2%Law 119 106 89.1% 129 114 88.4%
UT Chattanooga Nursing (BSN) 38 37 97.4% 54 53 98.1%Engineering 86 55 64.0% 84 52 61.9%
UT Knoxville Engineering 308 284 92.2% 273 240 87.9%Nursing (BSN) 88 85 96.6% 114 110 96.5%Law 114 97 85.1% 116 104 89.7%Veterinary Medicine 95 95 100.0% 77 77 100.0%
UT Martin Engineering 29 23 79.3% 29 21 72.4%Nursing (BSN) 30 27 90.0% 43 41 95.3%
UT Health Science Center Medical (Step I) 160 147 91.9% 160* 147* --Medical (Step II-CK) 173 171 98.8% 173* 171* --Medical (Step II-CS) 141 137 97.2% 141* 137* --Dentistry (NBDE I) 73 70 95.9% 73* 70* --Dentistry (NBDE II) 69 69 100.0% 69* 69* --Dental Hygiene (clinical) 30 25 83.3% 30* 25* --Pharmacy 174 171 98.3% 174* 171* --Medical Technology 14 12 85.7% 14* 12* --DPT 57 52 91% 57* 52* --
Licensure Exam Pass Rates for Public UniversitiesFirst-time Test Takers 2012 and 2013
Institution Test 2012 2013
Tennessee Higher Education Commission Fact Book 2013-2014 59 Student Success
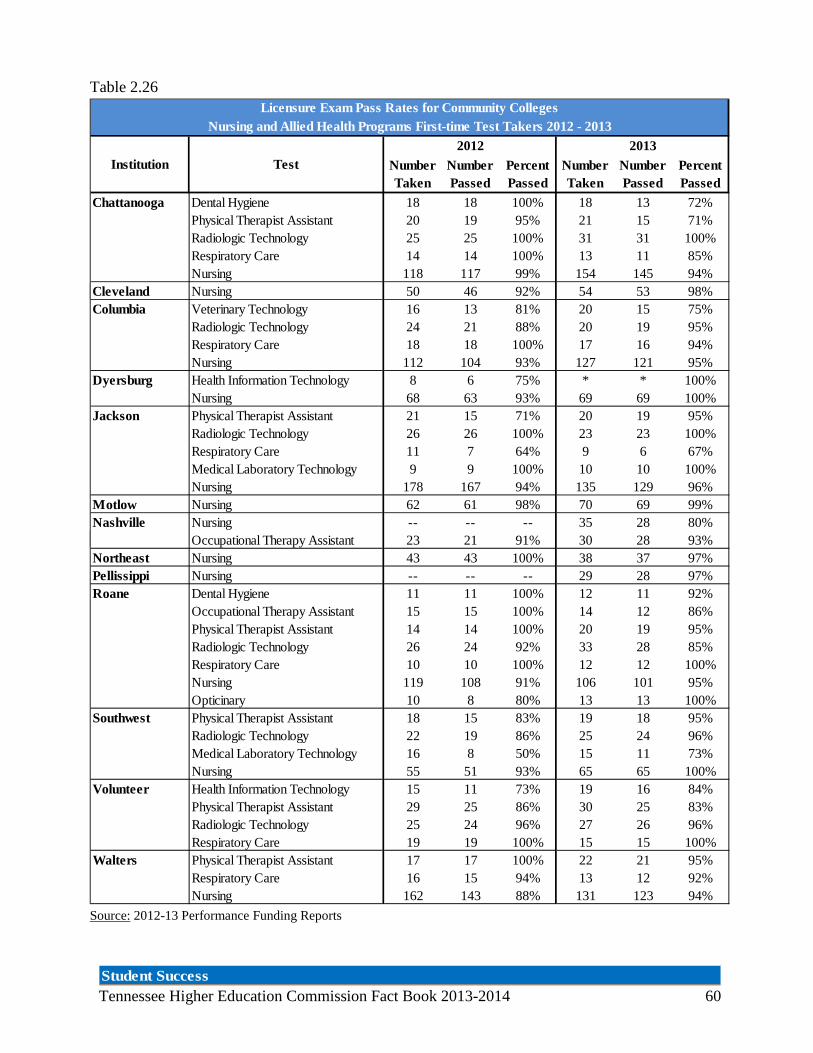
Table 2.26
Source: 2012-13 Performance Funding Reports
Number Taken
Number Passed
Percent Passed
Number Taken
Number Passed
Percent Passed
Chattanooga Dental Hygiene 18 18 100% 18 13 72%Physical Therapist Assistant 20 19 95% 21 15 71%Radiologic Technology 25 25 100% 31 31 100%Respiratory Care 14 14 100% 13 11 85%Nursing 118 117 99% 154 145 94%
Cleveland Nursing 50 46 92% 54 53 98%Columbia Veterinary Technology 16 13 81% 20 15 75%
Radiologic Technology 24 21 88% 20 19 95%Respiratory Care 18 18 100% 17 16 94%Nursing 112 104 93% 127 121 95%
Dyersburg Health Information Technology 8 6 75% * * 100%Nursing 68 63 93% 69 69 100%
Jackson Physical Therapist Assistant 21 15 71% 20 19 95%Radiologic Technology 26 26 100% 23 23 100%Respiratory Care 11 7 64% 9 6 67%Medical Laboratory Technology 9 9 100% 10 10 100%Nursing 178 167 94% 135 129 96%
Motlow Nursing 62 61 98% 70 69 99%Nashville Nursing -- -- -- 35 28 80%
Occupational Therapy Assistant 23 21 91% 30 28 93%Northeast Nursing 43 43 100% 38 37 97%Pellissippi Nursing -- -- -- 29 28 97%Roane Dental Hygiene 11 11 100% 12 11 92%
Occupational Therapy Assistant 15 15 100% 14 12 86%Physical Therapist Assistant 14 14 100% 20 19 95%Radiologic Technology 26 24 92% 33 28 85%Respiratory Care 10 10 100% 12 12 100%Nursing 119 108 91% 106 101 95%Opticinary 10 8 80% 13 13 100%
Southwest Physical Therapist Assistant 18 15 83% 19 18 95%Radiologic Technology 22 19 86% 25 24 96%Medical Laboratory Technology 16 8 50% 15 11 73%Nursing 55 51 93% 65 65 100%
Volunteer Health Information Technology 15 11 73% 19 16 84%Physical Therapist Assistant 29 25 86% 30 25 83%Radiologic Technology 25 24 96% 27 26 96%Respiratory Care 19 19 100% 15 15 100%
Walters Physical Therapist Assistant 17 17 100% 22 21 95%Respiratory Care 16 15 94% 13 12 92%Nursing 162 143 88% 131 123 94%
Licensure Exam Pass Rates for Community CollegesNursing and Allied Health Programs First-time Test Takers 2012 - 2013
Institution Test 2012 2013
Tennessee Higher Education Commission Fact Book 2013-2014 60 Student Success

Table 2.27
Program # of Grads Who
Took Exam# of Grads Who
Passed Exam% Passed
Practical Nursing 17 17 100.0%
Athens Total 17 17 100.0%
Aesthetics 9 9 100.0%
Commercial Trucking 151 151 100.0%
Cosmetology 20 20 100.0%
Cosmetology Instructor * * 100.0%
Manicurist * * 100.0%
Massage Therapy 9 9 100.0%
Practical Nursing 90 86 95.6%
Chattanooga Total 282 278 98.6%
Practical Nursing 30 29 96.7%
Covington Total 30 29 96.7%
Practical Nursing 39 35 89.7%
Crossville Total 39 35 89.7%
Practical Nursing 14 14 100.0%
Crump Total 14 14 100.0%
Cosmetology 20 16 80.0%
Dental Assistant 13 13 100.0%
Practical Nursing 83 82 98.8%
Dickson Total 116 111 95.7%
Practical Nursing 139 129 92.8%
Elizabethton Total 139 129 92.8%
Cosmetology * * 100.0%
Practical Nursing * * 83.3%
Harriman Total 20 17 85.0%
Practical Nursing 68 64 94.1%Hartsville Total 68 64 94.1%
Covington
Tennessee Colleges of Applied TechnologyLicensure Pass Rates 2013
Athens
Chattanooga
Crossville
Crump
Dickson
Hartsville
Elizabethton
Harriman
Tennessee Higher Education Commission Fact Book 2013-2014 61 Student Success

Table 2.27 continued
Program # of Grads Who
Took Exam# of Grads Who
Passed Exam% Passed
Cosmetology 8 8 100.0%
Cosmetology (Diploma) 8 8 100.0%
Practical Nursing 53 48 90.6%Hohenwald Total 69 64 92.8%
Practical Nursing 27 27 100.0%Jacksboro Total 27 27 100.0%
Practical Nursing 77 69 89.6%
Truck Driving 32 32 100.0%Jackson Total 109 101 92.7%
Cosmetology 9 9 100.0%
Practical Nursing 64 61 95.3%
Truck Driving 40 40 100.0%Knoxville Total 113 110 97.3%
Cosmetology 9 9 100.0%
Practical Nursing 83 83 100.0%Livingston Total 92 92 100.0%
Practical Nursing 34 33 97.1%McMinnville Total 34 33 97.1%
Aircraft Mechanics 46 46 100.0%Barbering 10 10 100.0%
Cosmetology 6 6 100.0%
Dental Assistant 23 23 100.0%
Pharmacy Technology 19 19 100.0%
Practical Nursing 39 39 100.0%
Truck Driving 46 46 100.0%
Memphis Total 189 189 100.0%
Aviation Maintenance 14 14 100.0%Practical Nursing 63 57 90.5%
Morristown Total 77 71 92.2%
McMinnville
Memphis
Morristown
Livingston
TCAT Licensure Pass Rates continued
Hohenwald
Jacksboro
Jackson
Knoxville
Tennessee Higher Education Commission Fact Book 2013-2014 62 Student Success

Table 2.27
Source: TBR
Program # of Grads Who
Took Exam# of Grads Who
Passed Exam% Passed
Cosmetology 6 6 100.0%
Practical Nursing 53 53 100.0%
Murfreesboro Total 59 59 100.0%
Aesthetics Technology 19 19 100.0%Aircraft Mechanics (Aviation Main 11 11 100.0%
Cosmetology Instructor 7 7 100.0%
Practical Nursing 46 44 95.7%
Truck Driving 27 27 100.0%
Nashville Total 110 108 98.2%
Practical Nursing 34 34 100.0%Newbern Total 34 34 100.0%
Cosmetology (Diploma) * * 100.0%
Practical Nursing (Diploma) * * 100.0%
Oneida Total 32 32 100.0%
Cosmetology * * 75.0%
Practical Nursing * * 85.4%
Paris Total 86 73 84.9%
Practical Nursing 23 21 91.3%Pulaski Total 23 21 91.3%
Patient Care Technician 21 21 100%Practical Nursing 34 30 88.2%
Ripley Total 55 51 92.7%
Practical Nursing 47 46 97.9%Truck Driver 26 25 96.2%
Shelbyville Total 73 71 97.3%
Practical Nursing 14 14 100.0%Whiteville Total 14 14 100.0%
Grand Total 1,921 1,844 96.0%
Whiteville
Murfreesboro
Nashville
Newbern
Oneida
Paris
Pulaski
Ripley
Shelbyville
TCAT Licensure Pass Rates continued
Tennessee Higher Education Commission Fact Book 2013-2014 63 Student Success
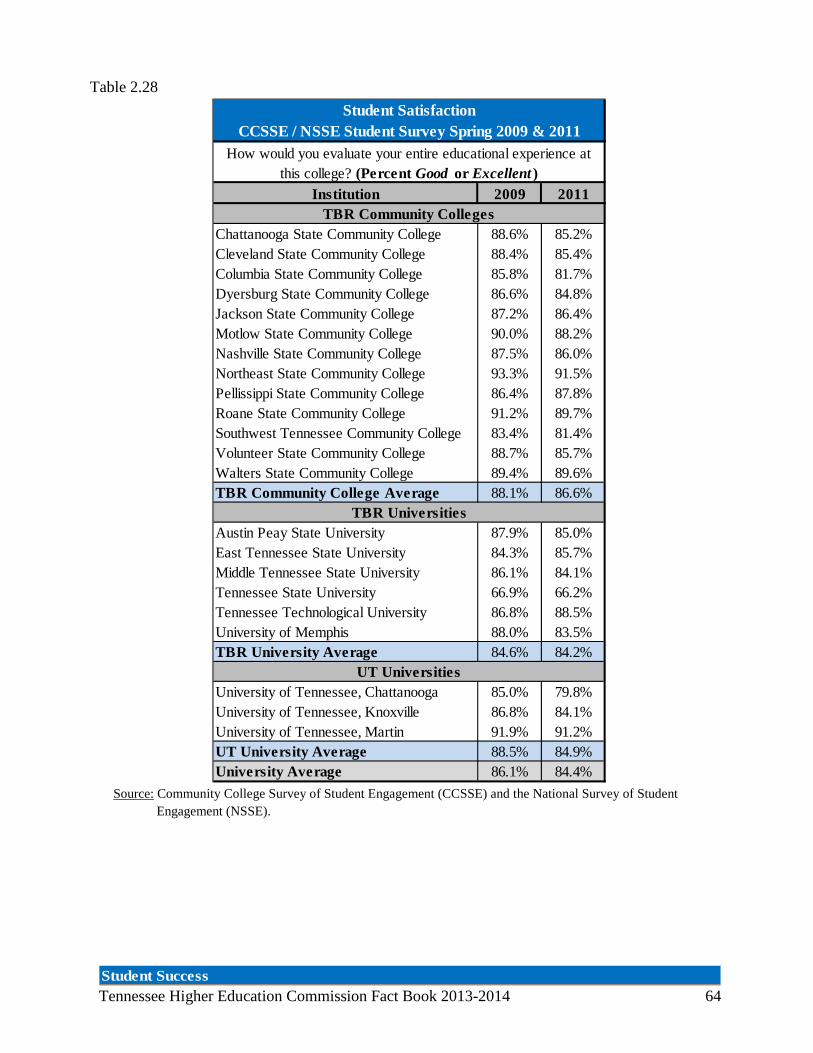
Table 2.28
Source: Community College Survey of Student Engagement (CCSSE) and the National Survey of Student Engagement (NSSE).
Institution 2009 2011
Chattanooga State Community College 88.6% 85.2%Cleveland State Community College 88.4% 85.4%Columbia State Community College 85.8% 81.7%Dyersburg State Community College 86.6% 84.8%Jackson State Community College 87.2% 86.4%Motlow State Community College 90.0% 88.2%Nashville State Community College 87.5% 86.0%Northeast State Community College 93.3% 91.5%Pellissippi State Community College 86.4% 87.8%Roane State Community College 91.2% 89.7%Southwest Tennessee Community College 83.4% 81.4%Volunteer State Community College 88.7% 85.7%Walters State Community College 89.4% 89.6%TBR Community College Average 88.1% 86.6%
Austin Peay State University 87.9% 85.0%East Tennessee State University 84.3% 85.7%Middle Tennessee State University 86.1% 84.1%Tennessee State University 66.9% 66.2%Tennessee Technological University 86.8% 88.5%University of Memphis 88.0% 83.5%TBR University Average 84.6% 84.2%
University of Tennessee, Chattanooga 85.0% 79.8%University of Tennessee, Knoxville 86.8% 84.1%University of Tennessee, Martin 91.9% 91.2%UT University Average 88.5% 84.9%University Average 86.1% 84.4%
UT Universities
Student SatisfactionCCSSE / NSSE Student Survey Spring 2009 & 2011
How would you evaluate your entire educational experience at this college? (Percent Good or Excellent )
TBR Universities
TBR Community Colleges
Tennessee Higher Education Commission Fact Book 2013-2014 64 Student Success

Tennessee Higher Education Commission Fact Book 2013-2014 65 Academic and Fiscal Trends

Table 3.1
Source: THEC Academic Affairs Notes: Pre-baccalaureate programs include certificates and Associate of Arts/Science and Associate of Applied Science degrees. The post-baccalaureate programs include all graduate and professional programs and certificates. Program counts include duplicate program offerings where institutions may offer certificate, associates (AA/AS/AAS) or bachelors (BA/BS) in the same field. THEC provides a more detailed searchable academic programs database at: //thec.ppr.tn.gov/APISearch.
Major Taxonomy Pre-Baccalaureate
Baccalaureate Post-baccalaureate
Agriculture 6 13 18Architecture and Related Services 0 2 4Area, Ethnic, Cultural, and Gender Studies 0 4 8Basic Skills 15 0 0Biological and Biomedical Sciences 1 10 31Business, Management, Marketing, and Related Support Services 60 52 29Communication Technologies 7 0 1Communication, Journalism, and Related Programs 0 14 9Computer and Information Sciences and Support Services 38 9 17Construction Trades 4 0 0Education 13 30 100Engineering 1 32 58Engineering Technologies/Technicians 75 11 16English Language and Literature/Letters 0 10 12Family and Consumer Sciences/Human Sciences 26 10 6Foreign languages, Literatures, and Linguistics 0 14 7Health Professions and Related Clinical Sciences 132 27 94History 0 10 10Legal Professions and Studies 8 1 1Liberal Arts and Sciences, General Studies and Humanities 35 8 4Library Science 0 0 1Mathematics and Statistics 0 12 11Mechanic and Repair Technologies/Technicians 14 0 0Multi/Interdisciplinary Studies 0 10 10Natural Resources and Conservation 0 6 6Parks, Recreation, Leisure and Fitness Studies 0 14 14Personal and Culinary Services 4 0 0Philosophy and Religious Studies 0 8 4Physical Sciences 0 27 17Precision Production 2 0 0Psychology 0 12 25Public Administration and Social Service Professions 3 10 18Science Technologies/Technicians 5 0 0Security and Protective Services 17 8 7Social Sciences 2 38 22Transportation and Materials Moving 0 1 1Visual and Performing Arts 29 41 15Grand Total 497 444 576
Academic Program InventoryPublic Colleges and Universities March 2014
Tennessee Higher Education Commission Fact Book 2013-2014 66 Academic and Fiscal Trends

Table 3.2
Source: THEC Academic Affairs, Performance Funding Reports 2012-13 Notes: Within the state’s Performance Funding quality assurance program, institutions are required to evaluate undergraduate and graduate programs. The accreditation process satisfies the Performance Funding requirements for programs that are eligible for accreditation. Other programs must undergo evaluation by external consultants or trained teams of auditors. Currently, 562 programs are eligible for accreditation. Eligibility is determined when all Tennessee institutions agree on a specific accreditor as best representing qualitative standards for each discipline.
InstitutionNumber of Accredited
ProgramsTotal Accreditable
Programs Percent Accredited
Austin Peay State University 21 25 84.0%East Tennessee State University 52 58 89.7%Middle Tennessee State University 49 53 92.5%Tennessee State University 44 45 97.8%Tennessee Technological University 34 34 100.0%University of Memphis 67 71 94.4%TBR University Total 267 286 93.4%
University of Tennessee, Chattanooga 34 35 97.1%University of Tennessee, Knoxville 62 66 93.9%University of Tennessee, Martin 22 23 95.7%UT University Total 118 124 95.2%University Total 385 410 93.9%
Chattanooga State Community College 25 26 96.2%Cleveland State Community College 3 4 75.0%Columbia State Community College 7 8 87.5%Dyersburg State Community College 3 6 50.0%Jackson State Community College 9 10 90.0%Motlow State Community College 2 5 40.0%Nashville State Community College 10 12 83.3%Northeast State Community College 9 10 90.0%Pellissippi State Community College 5 7 71.4%Roane State Community College 15 16 93.8%Southwest Tennessee Community College 19 20 95.0%Volunteer State Community College 13 15 86.7%Walters State Community College 12 13 92.3%Community College Total 132 152 86.8%Grand Total 517 562 92.0%
Program Accreditation StatusAcademic Year 2012-2013
TBR Universities
UT Universities
TBR Community Colleges
Tennessee Higher Education Commission Fact Book 2013-2014 67 Academic and Fiscal Trends
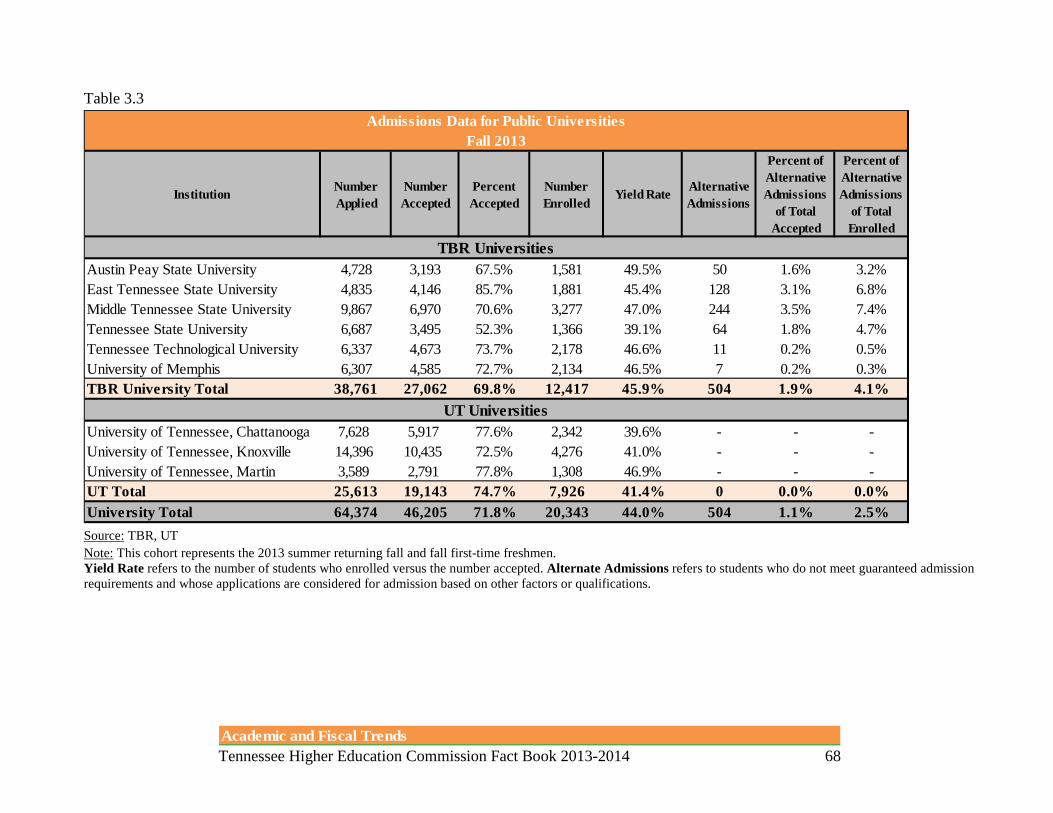
Table 3.3
Source: TBR, UT Note: This cohort represents the 2013 summer returning fall and fall first-time freshmen. Yield Rate refers to the number of students who enrolled versus the number accepted. Alternate Admissions refers to students who do not meet guaranteed admission requirements and whose applications are considered for admission based on other factors or qualifications.
Institution Number Applied
Number Accepted
Percent Accepted
Number Enrolled
Yield Rate Alternative Admissions
Percent of Alternative Admissions
of Total Accepted
Percent of Alternative Admissions
of Total Enrolled
Austin Peay State University 4,728 3,193 67.5% 1,581 49.5% 50 1.6% 3.2%East Tennessee State University 4,835 4,146 85.7% 1,881 45.4% 128 3.1% 6.8%Middle Tennessee State University 9,867 6,970 70.6% 3,277 47.0% 244 3.5% 7.4%Tennessee State University 6,687 3,495 52.3% 1,366 39.1% 64 1.8% 4.7%Tennessee Technological University 6,337 4,673 73.7% 2,178 46.6% 11 0.2% 0.5%University of Memphis 6,307 4,585 72.7% 2,134 46.5% 7 0.2% 0.3%TBR University Total 38,761 27,062 69.8% 12,417 45.9% 504 1.9% 4.1%
University of Tennessee, Chattanooga 7,628 5,917 77.6% 2,342 39.6% - - -University of Tennessee, Knoxville 14,396 10,435 72.5% 4,276 41.0% - - -University of Tennessee, Martin 3,589 2,791 77.8% 1,308 46.9% - - -UT Total 25,613 19,143 74.7% 7,926 41.4% 0 0.0% 0.0%University Total 64,374 46,205 71.8% 20,343 44.0% 504 1.1% 2.5%
Admissions Data for Public UniversitiesFall 2013
TBR Universities
UT Universities
Tennessee Higher Education Commission Fact Book 2013-2014 68 Academic and Fiscal Trends

Table 3.4
Source: TBR, UT Note: Other Employee includes professional non-faculty staff, administrators, and other non-instructional staff. At the University of Tennessee at Chattanooga and Martin, adjunct faculty are included as either full-time or part-time faculty.
InstitutionFull-Time
FacultyPart-Time
FacultyAdjunct Faculty
Graduate Assistant
Other Employee Total
Austin Peay State University 57.2% 0.0% 33.1% 0.0% 9.7% 100.0%East Tennessee State University 49.8% 22.2% 9.4% 11.0% 7.6% 100.0%Middle Tennessee State University 71.0% 0.0% 18.4% 6.8% 3.8% 100.0%Tennessee State University 61.9% 2.6% 26.7% 0.4% 8.4% 100.0%Tennessee Technological University 61.6% 1.4% 11.1% 4.6% 21.2% 100.0%University of Memphis 37.7% 23.2% 3.0% 17.7% 18.3% 100.0%TBR University Share of Total 56.9% 8.5% 16.2% 7.6% 10.7% 100.0%
University of Tennessee, Chattanooga 67.7% 24.4% - 0.8% 7.0% 100.0%University of Tennessee, Knoxville 67.2% 1.9% 7.7% 18.0% 5.1% 100.0%University of Tennessee, Martin 67.7% 23.0% - - 9.3% 100.0%
Chattanooga State Community College 50.9% 0.2% 44.6% 0.0% 4.3% 100.0%Cleveland State Community College 64.9% 0.0% 32.7% 0.0% 2.4% 100.0%Columbia State Community College 58.5% 0.5% 39.5% 0.0% 1.5% 100.0%Dyersburg State Community College 54.4% 0.0% 43.5% 0.0% 2.1% 100.0%Jackson State Community College 50.1% 0.2% 49.7% 0.0% 0.0% 100.0%Motlow State Community College 52.2% 0.0% 45.7% 0.0% 2.0% 100.0%Nashville State Community College 50.2% 0.0% 48.9% 0.0% 0.9% 100.0%Northeast State Community College 43.7% 0.0% 54.6% 0.0% 1.6% 100.0%Pellissippi State Community College 54.6% 0.0% 45.4% 0.0% 0.0% 100.0%Roane State Community College 49.5% 1.4% 44.4% 0.0% 4.7% 100.0%Southwest Tennessee Community College 50.9% 0.0% 48.1% 0.0% 0.9% 100.0%Volunteer State Community College 52.4% 0.0% 46.1% 0.0% 1.6% 100.0%Walters State Community College 63.2% 0.2% 36.0% 0.0% 0.6% 100.0%TBR Community College Share of Total 52.7% 0.2% 45.4% 0.0% 1.7% 100.0%
Community Colleges
TBR Universities
Lower Division Instructional CoursesBy Type of Instructor Fall 2013
UT Universities
Tennessee Higher Education Commission Fact Book 2013-2014 69 Academic and Fiscal Trends

Table 3.5
Source: SREB "State Data Exchange: 2012-2013 Indicators Report" pgs. 4 & 12. Notes: Courses are termed “e-learning” when more than 50 percent of the content is delivered electronically. Florida four year institutions used an 80 percent rule to define e-learning, and Florida and Mississippi two year colleges used a 75 percent rule to define e-learning, so figures for those states are lower than they would have been had they used the 50 percent rule.
PercentChange
from 2011-2012
PercentChange
from 2011-2012
Alabama 11.1% -0.7% 17.8% -0.1%Arkansas 12.8% 1.1% 22.6% 0.9%Delaware 2.4% -0.4% 15.1% -1.2%Florida 20.6% 2.3% 23.5% -5.4%Georgia 7.9% 7.9% 17.5% --Kentucky 12.3% 1.3% 32.2% 2.8%Louisiana -- -- -- --Maryland 21.8% 3.4% 15.7% 0.9%Mississippi 10.4% 1.4% 19.4% -0.1%North Carolina 9.6% 0.4% 34.4% 2.7%Oklahoma 13.6% -0.5% 26.1% -1.8%South Carolina 4.5% 0.8% 18.7% 0.5%Tennessee 14.9% 0.7% 25.3% 1.8%Texas 11.4% 1.4% 20.9% 2.3%Virginia 4.1% 0.2% 26.7% 1.1%West Virginia 10.6% 0.7% 20.4% 0.4%
Percent of Undergraduate Instruction through e-LearningPublic Institutions
2012-2013Four-Year Institutions Two-Year Colleges
Tennessee Higher Education Commission Fact Book 2013-2014 70 Academic and Fiscal Trends

Table 3.6
Source: THEC Fiscal Affairs analysis of SREB data Note: Peer institutions used in this analysis are comparable SREB public institutions selected by THEC in conjunction with UT and TBR.
Table 3.7
Source: THEC Fiscal Affairs analysis of SREB data
Institution Average Faculty
Salary Peer Average Faculty Salary
Percent of Peer Average
Austin Peay State University $59,874 $64,156 93%East Tennessee State University $58,717 $69,976 84%Middle Tennessee State University $61,349 $74,499 82%Tennessee State University $60,896 $67,948 90%Tennessee Technological University $66,057 $67,800 97%University of Memphis $74,106 $80,858 92%TBR University Average $63,500 $70,873 90%
University of Tennessee, Chattanooga $66,805 $66,574 100%University of Tennessee, Knoxville $86,618 $91,345 95%University of Tennessee, Martin $55,989 $62,766 89%UT University Average $69,804 $73,561 95%University Average $65,601 $71,769 91%TBR Community College Average $46,686 $51,562 91%
Public Universities & Community CollegesPeer Faculty Salary Comparison 2012-2013
TBR Universities
UT Universities
Tennessee $36,285 TN as % Alabama $50,346 72%Georgia $40,727 89%Kentucky $40,647 89%Louisiana $37,666 96%Oklahoma $45,153 80%
Average Salary ComparisonTN Colleges of Applied Technology
Tennessee Higher Education Commission Fact Book 2013-2014 71 Academic and Fiscal Trends

Average Full-Time Faculty Salary, All Ranks Public Universities
Figure 3.1
Community Colleges Figure 3.2
Source: THEC Fiscal Affairs Note: *The formula for calculating weighted average salaries changed in 2012-13 because IPEDS changed the categories of contract length in the HR survey. Nine-month equivalent salaries are now calculated by dividing the total salary outlay by the total number of service months and multiplying by 9. As such, 2012-13 is not directly comparable to prior years. Dollars are unadjusted for inflation. Data includes all institutions.
Tennessee Higher Education Commission Fact Book 2013-2014 72 Academic and Fiscal Trends
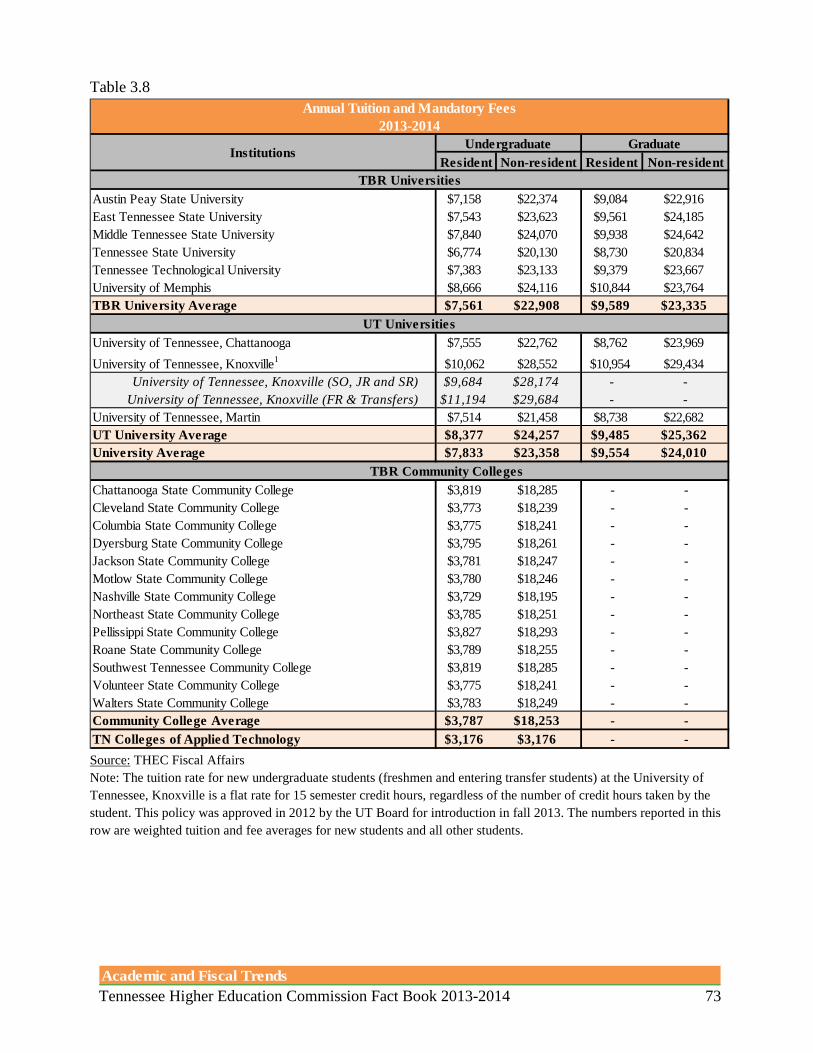
Table 3.8
Source: THEC Fiscal Affairs Note: The tuition rate for new undergraduate students (freshmen and entering transfer students) at the University of Tennessee, Knoxville is a flat rate for 15 semester credit hours, regardless of the number of credit hours taken by the student. This policy was approved in 2012 by the UT Board for introduction in fall 2013. The numbers reported in this row are weighted tuition and fee averages for new students and all other students.
Resident Non-resident Resident Non-resident
Austin Peay State University $7,158 $22,374 $9,084 $22,916East Tennessee State University $7,543 $23,623 $9,561 $24,185Middle Tennessee State University $7,840 $24,070 $9,938 $24,642Tennessee State University $6,774 $20,130 $8,730 $20,834Tennessee Technological University $7,383 $23,133 $9,379 $23,667University of Memphis $8,666 $24,116 $10,844 $23,764TBR University Average $7,561 $22,908 $9,589 $23,335
University of Tennessee, Chattanooga $7,555 $22,762 $8,762 $23,969University of Tennessee, Knoxville1 $10,062 $28,552 $10,954 $29,434
University of Tennessee, Knoxville (SO, JR and SR) $9,684 $28,174 - -University of Tennessee, Knoxville (FR & Transfers) $11,194 $29,684 - -
University of Tennessee, Martin $7,514 $21,458 $8,738 $22,682UT University Average $8,377 $24,257 $9,485 $25,362University Average $7,833 $23,358 $9,554 $24,010
Chattanooga State Community College $3,819 $18,285 - -Cleveland State Community College $3,773 $18,239 - -Columbia State Community College $3,775 $18,241 - -Dyersburg State Community College $3,795 $18,261 - -Jackson State Community College $3,781 $18,247 - -Motlow State Community College $3,780 $18,246 - -Nashville State Community College $3,729 $18,195 - -Northeast State Community College $3,785 $18,251 - -Pellissippi State Community College $3,827 $18,293 - -Roane State Community College $3,789 $18,255 - -Southwest Tennessee Community College $3,819 $18,285 - -Volunteer State Community College $3,775 $18,241 - -Walters State Community College $3,783 $18,249 - -Community College Average $3,787 $18,253 - -TN Colleges of Applied Technology $3,176 $3,176 - -
TBR Universities
UT Universities
TBR Community Colleges
Annual Tuition and Mandatory Fees2013-2014
Institutions Undergraduate Graduate
Tennessee Higher Education Commission Fact Book 2013-2014 73 Academic and Fiscal Trends

Table 3.9
Source: THEC Fiscal Affairs Note: The tuition rate for new undergraduate students (freshmen and entering transfer students) at the University of Tennessee, Knoxville is a flat rate for 15 semester credit hours, regardless of the number of credit hours taken by the student. This policy was approved in 2012 by the UT Board for introduction in fall 2013. The numbers reported in this row are weighted tuition and fee averages for new students and all other students. Dollars are unadjusted for inflation.
Institutions 2003-04 2008-09 2012-13 2013-141 Year
Change 5 Year
Change 10 Year Change
Austin Peay State University $4,004 $5,526 $6,918 $7,158 3.5% 29.5% 78.8%East Tennessee State University $3,839 $5,201 $6,997 $7,543 7.8% 45.0% 96.5%Middle Tennessee State University $3,990 $5,700 $7,492 $7,840 4.6% 37.5% 96.5%Tennessee State University $3,788 $5,102 $6,702 $6,774 1.1% 32.8% 78.8%Tennessee Technological University $3,750 $5,244 $6,948 $7,383 6.3% 40.8% 96.9%University of Memphis $4,234 $6,128 $8,234 $8,666 5.2% 41.4% 104.7%TBR University Average $3,934 $5,484 $7,215 $7,561 4.8% 37.9% 92.2%
University of Tennessee, Chattanooga $3,852 $5,310 $7,212 $7,555 4.8% 42.3% 96.1%University of Tennessee, Knoxville1 $4,450 $6,250 $9,092 $10,062 10.7% 61.0% 126.1%
University of Tennessee, Knoxville (SO, JR and SR) $4,450 $6,250 $9,092 $9,684 6.5% 54.9% 117.6%University of Tennessee, Knoxville (FR & Transfers) $4,450 $6,250 $9,092 $11,194 23.1% 79.1% 151.6%
University of Tennessee, Martin $3,830 $5,255 $7,056 $7,514 6.5% 43.0% 96.2%UT University Average $4,044 $5,605 $7,787 $8,377 7.6% 49.5% 107.1%University Average $3,971 $5,524 $7,406 $7,833 5.8% 41.8% 97.3%
Chattanooga State Community College $2,095 $2,797 $3,717 $3,819 2.7% 36.5% 82.3%Cleveland State Community College $2,067 $2,769 $3,671 $3,773 2.8% 36.3% 82.5%Columbia State Community College $2,055 $2,747 $3,673 $3,775 2.8% 37.4% 83.7%Dyersburg State Community College $2,055 $2,777 $3,693 $3,795 2.8% 36.7% 84.7%Jackson State Community College $2,057 $2,759 $3,679 $3,781 2.8% 37.0% 83.8%Motlow State Community College $2,059 $2,765 $3,678 $3,780 2.8% 36.7% 83.6%Nashville State Community College $2,049 $2,731 $3,627 $3,729 2.8% 36.5% 82.0%Northeast State Community College $2,075 $2,787 $3,683 $3,785 2.8% 35.8% 82.4%Pellissippi State Community College $2,085 $2,799 $3,719 $3,827 2.9% 36.7% 83.5%Roane State Community College $2,069 $2,787 $3,687 $3,789 2.8% 36.0% 83.1%Southwest Tennessee Community College $2,055 $2,791 $3,717 $3,819 2.7% 36.8% 85.8%Volunteer State Community College $2,061 $2,767 $3,669 $3,775 2.9% 36.4% 83.2%Walters State Community College $2,059 $2,775 $3,681 $3,783 2.8% 36.3% 83.7%Community College Average $2,065 $2,773 $3,684 $3,787 2.8% 36.6% 83.4%TN Colleges of Applied Technology $1,548 $2,285 $3,146 $3,176 1.0% 39.0% 105.2%
UT Universities
TBR Community Colleges
Annual Tuition and Mandatory Fees Resident Undergraduate Student
TBR Universities
Tennessee Higher Education Commission Fact Book 2013-2014 74 Academic and Fiscal Trends
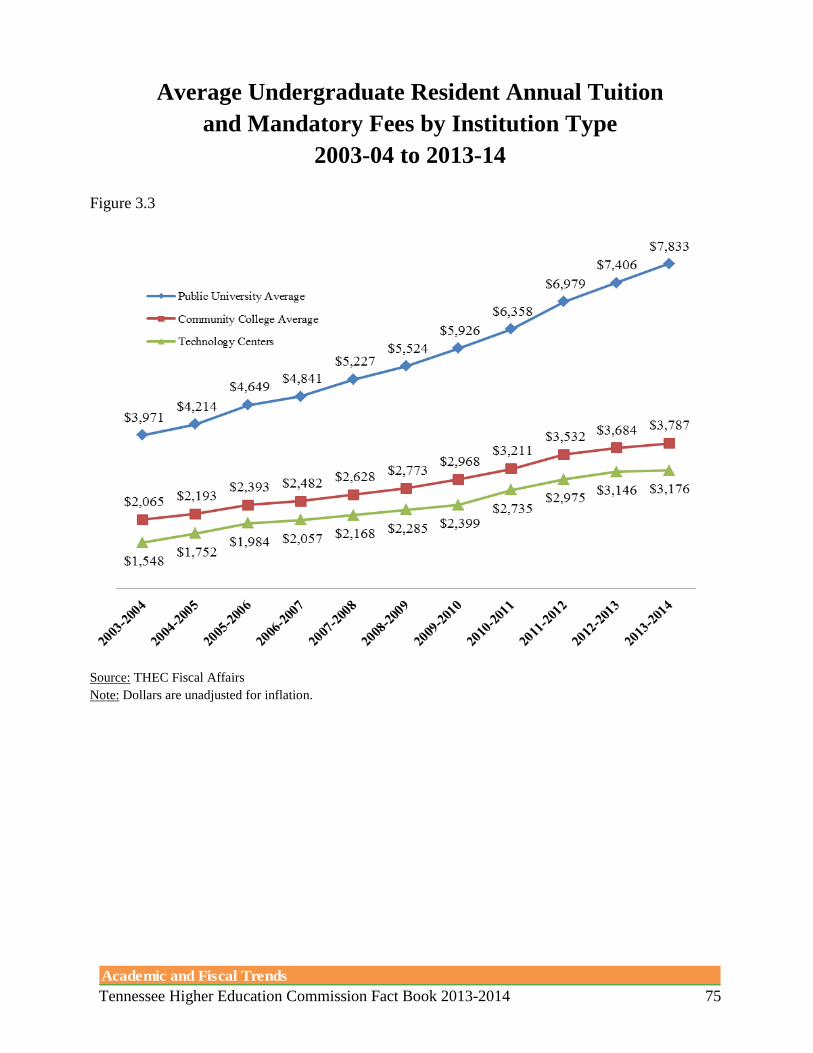
Average Undergraduate Resident Annual Tuition and Mandatory Fees by Institution Type
2003-04 to 2013-14 Figure 3.3
Source: THEC Fiscal Affairs Note: Dollars are unadjusted for inflation.
Tennessee Higher Education Commission Fact Book 2013-2014 75 Academic and Fiscal Trends

Table 3.10
Table 3.11
Source: THEC Fiscal Affairs analysis of SREB and National Center for Education Statistics data.
2002-03 2007-08 2012-13United States $4,046 $5,943 $8,070SREB States $3,253 $4,980 $6,858Alabama $3,532 $5,040 $8,275Arkansas $3,458 $5,689 $7,065Delaware $4,873 $7,148 $9,509Florida $2,696 $3,514 $6,235Georgia $2,576 $3,601 $6,486Kentucky $3,126 $5,817 $7,692Louisiana $2,515 $3,595 $5,418Maryland $4,974 $6,550 $7,664Mississippi $3,536 $4,447 $5,856North Carolina $2,795 $4,045 $5,873Oklahoma $2,346 $3,841 $5,046South Carolina $4,704 $7,735 $9,776Tennessee $3,454 $5,062 $7,081Texas $3,278 $5,428 $7,494Virginia $4,277 $6,597 $9,433West Virginia $2,816 $4,462 $5,775
Median Full-Time Tuition & FeesPublic University Resident
2002-03 2007-08 2012-13United States $1,483 $2,061 $2,792SREB States $1,488 $2,069 $3,072Alabama $2,040 $2,700 $4,140Arkansas $1,600 $1,990 $2,740Delaware $1,806 $2,490 $3,242Florida $1,583 $2,035 $3,074Georgia $1,522 $2,089 $3,581Kentucky $1,536 $3,450 $4,200Louisiana $1,490 $1,901 $2,911Maryland $2,553 $3,065 $3,776Mississippi $1,402 $1,740 $2,244North Carolina $1,128 $1,409 $2,281Oklahoma $1,626 $2,519 $3,188South Carolina $2,136 $3,190 $3,740Tennessee $1,735 $2,627 $3,683Texas $1,088 $1,614 $2,341Virginia $1,488 $2,404 $3,735West Virginia $1,560 $2,748 $3,120
Median Full-Time Tuition & FeesPublic Community College Resident
Tennessee Higher Education Commission Fact Book 2013-2014 76 Academic and Fiscal Trends

Note: All dollars are unadjusted for inflation.
Share of Family Income Needed to Pay for College 2010-2011
Figure 3.4
Share of Family Income Needed to Pay for College 2011-2012
Figure 3.5
Source: SREB Fact Book on Higher Education 2013, Table 64.
Tennessee Higher Education Commission Fact Book 2013-2014 77 Academic and Fiscal Trends
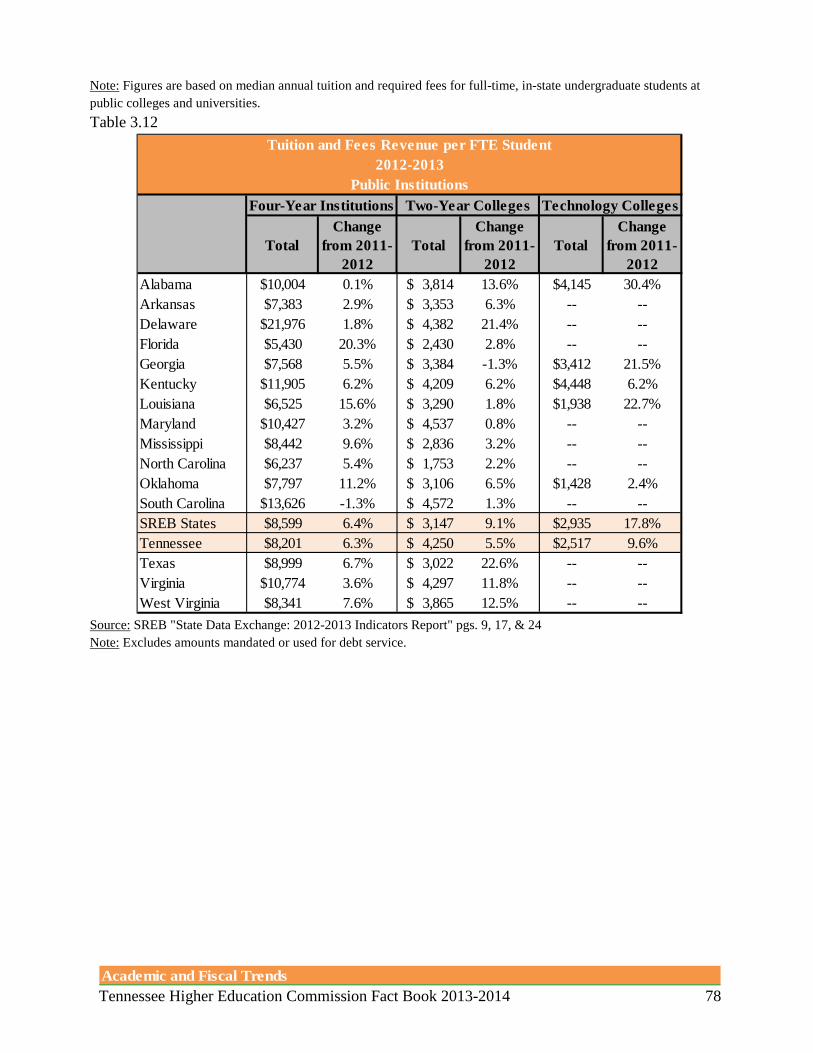
Note: Figures are based on median annual tuition and required fees for full-time, in-state undergraduate students at public colleges and universities. Table 3.12
Source: SREB "State Data Exchange: 2012-2013 Indicators Report" pgs. 9, 17, & 24 Note: Excludes amounts mandated or used for debt service.
TotalChange
from 2011-2012
TotalChange
from 2011-2012
TotalChange
from 2011-2012
Alabama $10,004 0.1% 3,814$ 13.6% $4,145 30.4%Arkansas $7,383 2.9% 3,353$ 6.3% -- --Delaware $21,976 1.8% 4,382$ 21.4% -- --Florida $5,430 20.3% 2,430$ 2.8% -- --Georgia $7,568 5.5% 3,384$ -1.3% $3,412 21.5%Kentucky $11,905 6.2% 4,209$ 6.2% $4,448 6.2%Louisiana $6,525 15.6% 3,290$ 1.8% $1,938 22.7%Maryland $10,427 3.2% 4,537$ 0.8% -- --Mississippi $8,442 9.6% 2,836$ 3.2% -- --North Carolina $6,237 5.4% 1,753$ 2.2% -- --Oklahoma $7,797 11.2% 3,106$ 6.5% $1,428 2.4%South Carolina $13,626 -1.3% 4,572$ 1.3% -- --SREB States $8,599 6.4% 3,147$ 9.1% $2,935 17.8%Tennessee $8,201 6.3% 4,250$ 5.5% $2,517 9.6%Texas $8,999 6.7% 3,022$ 22.6% -- --Virginia $10,774 3.6% 4,297$ 11.8% -- --West Virginia $8,341 7.6% 3,865$ 12.5% -- --
Tuition and Fees Revenue per FTE Student2012-2013
Public InstitutionsFour-Year Institutions Two-Year Colleges Technology Colleges
Tennessee Higher Education Commission Fact Book 2013-2014 78 Academic and Fiscal Trends
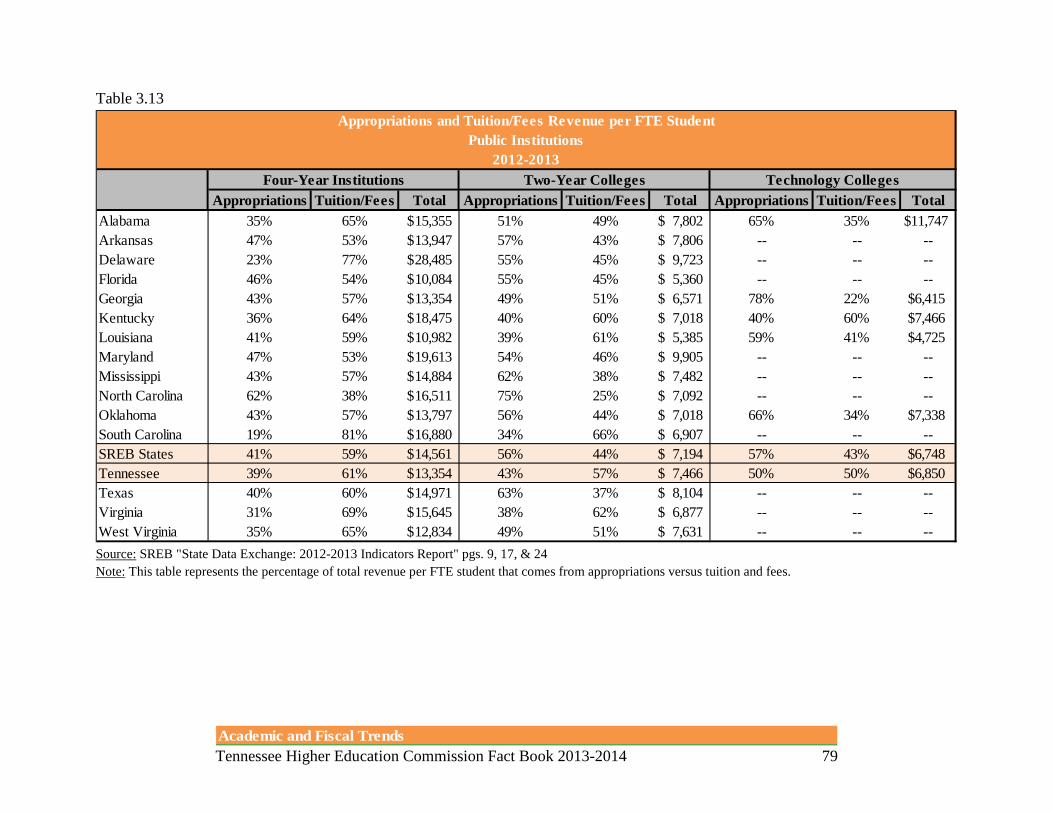
Table 3.13
Source: SREB "State Data Exchange: 2012-2013 Indicators Report" pgs. 9, 17, & 24 Note: This table represents the percentage of total revenue per FTE student that comes from appropriations versus tuition and fees.
Appropriations Tuition/Fees Total Appropriations Tuition/Fees Total Appropriations Tuition/Fees TotalAlabama 35% 65% 15,355$ 51% 49% 7,802$ 65% 35% $11,747Arkansas 47% 53% 13,947$ 57% 43% 7,806$ -- -- --Delaware 23% 77% 28,485$ 55% 45% 9,723$ -- -- --Florida 46% 54% 10,084$ 55% 45% 5,360$ -- -- --Georgia 43% 57% 13,354$ 49% 51% 6,571$ 78% 22% $6,415Kentucky 36% 64% 18,475$ 40% 60% 7,018$ 40% 60% $7,466Louisiana 41% 59% 10,982$ 39% 61% 5,385$ 59% 41% $4,725Maryland 47% 53% 19,613$ 54% 46% 9,905$ -- -- --Mississippi 43% 57% 14,884$ 62% 38% 7,482$ -- -- --North Carolina 62% 38% 16,511$ 75% 25% 7,092$ -- -- --Oklahoma 43% 57% 13,797$ 56% 44% 7,018$ 66% 34% $7,338South Carolina 19% 81% 16,880$ 34% 66% 6,907$ -- -- --SREB States 41% 59% 14,561$ 56% 44% 7,194$ 57% 43% $6,748Tennessee 39% 61% 13,354$ 43% 57% 7,466$ 50% 50% $6,850Texas 40% 60% 14,971$ 63% 37% 8,104$ -- -- --Virginia 31% 69% 15,645$ 38% 62% 6,877$ -- -- --West Virginia 35% 65% 12,834$ 49% 51% 7,631$ -- -- --
Appropriations and Tuition/Fees Revenue per FTE StudentPublic Institutions
2012-2013Four-Year Institutions Two-Year Colleges Technology Colleges
Tennessee Higher Education Commission Fact Book 2013-2014 79 Academic and Fiscal Trends

Table 3.14
Source: SREB "State Data Exchange: 2012-2013 Indicators Report" pgs. 9, 17, & 24 Note: Includes state general purpose and educational special purpose appropriations to campuses.
TotalChange
from 2011-2012
TotalChange
from 2011-2012
TotalChange
from 2011-2012
Alabama 5,351$ -1.0% 3,988$ 8.9% 7,602$ 17.4%Arkansas 6,564$ -0.7% 4,453$ 5.9% -- --Delaware 6,508$ -0.5% 5,341$ 4.5% -- --Florida 4,654$ -22.7% 2,930$ 9.6% -- --Georgia 5,785$ 2.4% 3,187$ 3.7% 3,438$ 24.6%Kentucky 6,570$ -3.0% 2,809$ 1.2% 3,018$ -10.7%Louisiana 4,457$ -10.2% 2,095$ -7.1% 2,788$ -17.3%Maryland 9,186$ -0.3% 5,368$ -3.1% -- --Mississippi 6,442$ -0.1% 4,646$ 27.9% -- --North Carolina 10,273$ 4.4% 5,339$ 5.0% -- --Oklahoma 6,000$ 4.6% 3,912$ 6.2% 4,987$ 0.4%South Carolina 3,253$ 14.9% 2,334$ 15.5% -- --SREB States 5,961$ -3.2% 4,047$ 6.8% 3,813$ 13.1%Tennessee 5,153$ 4.2% 3,216$ 9.9% 4,821$ 6.5%Texas 5,972$ -7.0% 5,082$ 6.7% -- --Virginia 4,871$ 4.9% 2,580$ 2.9% -- --West Virginia 4,493$ 2.5% 3,766$ 11.2% -- --
Appropriations per FTE Student2012-2013
Public InstitutionsFour-Year Institutions Two-Year Colleges Technology Colleges
Tennessee Higher Education Commission Fact Book 2013-2014 80 Academic and Fiscal Trends

Table 3.15
Source: SREB; "Appropriations of State Tax Funds for Operating Expenses Related to Higher Education as Percentages of State Taxes"; Updated June 2013 Notes: State appropriations include funds for medical and health programs, state-level financial aid programs for students, state funds for private colleges and universities, and state funds for coordinating or governing boards of public colleges and universities. State appropriations exclude dollars for capital construction and debt payments. Also excluded are funds from sources other than state tax funds, including all funds from student fees, federal sources, and local sources. Seven SREB states, excluding Tennessee, also provide significant additional local funding for higher education operations.
2001-02 2006-07United States 11.2 10.5 9.5SREB States 13.6 13.6 13.3Alabama 16.6 19.8 17.3 2Arkansas 12.5 11.4 11.6 16Delaware 8.9 8.2 7.1 39Florida 10.4 10.9 11.2 18Georgia 11.9 16.3 16.5 3Kentucky 13.2 12.9 12.1 15Louisiana 13.9 15.0 14.0 8Maryland 11.9 10.0 10.1 25Mississippi 16.1 14.7 14.2 7North Carolina 15.7 16.8 17.5 1Oklahoma 12.6 13.2 12.8 13South Carolina 13.0 14.5 11.2 17Tennessee 13.3 14.1 13.0 12Texas 17.5 15.6 15.0 6Virginia 12.5 10.7 9.3 26West Virginia 11.5 10.0 10.6 20
State and Local Appropriations Related to Higher Education as Percentages of State Taxes
2011-12National
Rank
Tennessee Higher Education Commission Fact Book 2013-2014 81 Academic and Fiscal Trends
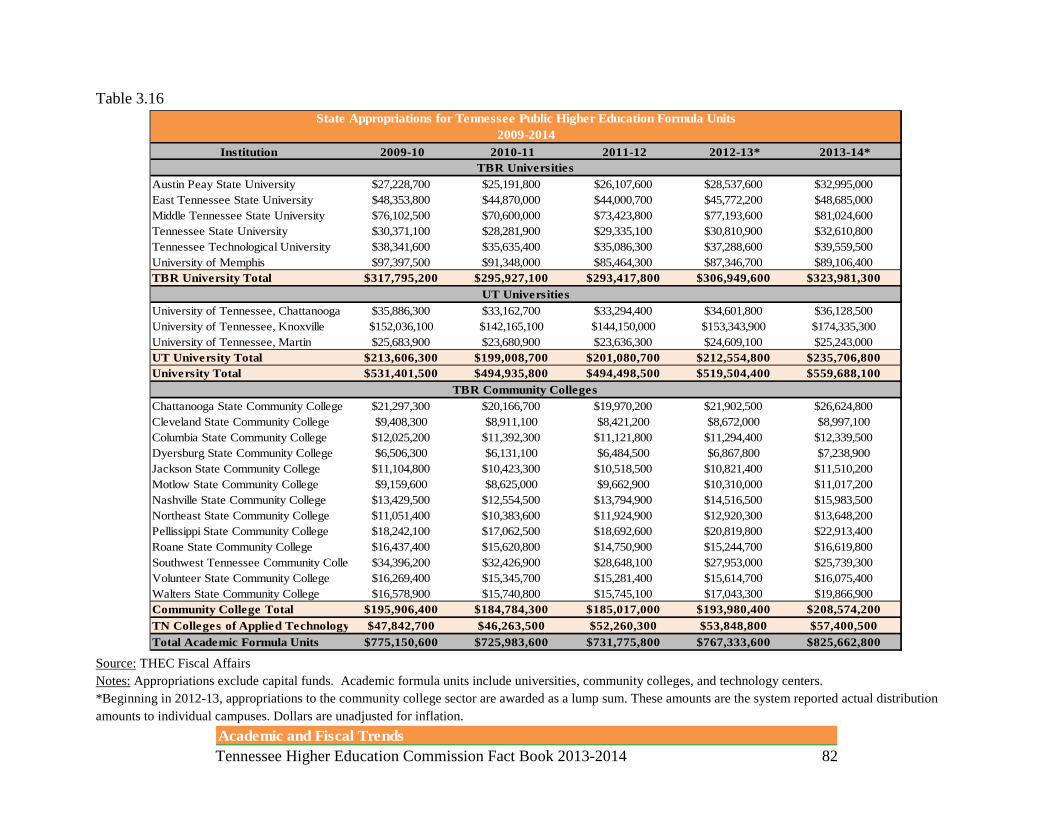
Table 3.16
Source: THEC Fiscal Affairs Notes: Appropriations exclude capital funds. Academic formula units include universities, community colleges, and technology centers. *Beginning in 2012-13, appropriations to the community college sector are awarded as a lump sum. These amounts are the system reported actual distribution amounts to individual campuses. Dollars are unadjusted for inflation.
Institution 2009-10 2010-11 2011-12 2012-13* 2013-14*
Austin Peay State University $27,228,700 $25,191,800 $26,107,600 $28,537,600 $32,995,000East Tennessee State University $48,353,800 $44,870,000 $44,000,700 $45,772,200 $48,685,000Middle Tennessee State University $76,102,500 $70,600,000 $73,423,800 $77,193,600 $81,024,600Tennessee State University $30,371,100 $28,281,900 $29,335,100 $30,810,900 $32,610,800Tennessee Technological University $38,341,600 $35,635,400 $35,086,300 $37,288,600 $39,559,500University of Memphis $97,397,500 $91,348,000 $85,464,300 $87,346,700 $89,106,400TBR University Total $317,795,200 $295,927,100 $293,417,800 $306,949,600 $323,981,300
University of Tennessee, Chattanooga $35,886,300 $33,162,700 $33,294,400 $34,601,800 $36,128,500University of Tennessee, Knoxville $152,036,100 $142,165,100 $144,150,000 $153,343,900 $174,335,300University of Tennessee, Martin $25,683,900 $23,680,900 $23,636,300 $24,609,100 $25,243,000UT University Total $213,606,300 $199,008,700 $201,080,700 $212,554,800 $235,706,800University Total $531,401,500 $494,935,800 $494,498,500 $519,504,400 $559,688,100
Chattanooga State Community College $21,297,300 $20,166,700 $19,970,200 $21,902,500 $26,624,800Cleveland State Community College $9,408,300 $8,911,100 $8,421,200 $8,672,000 $8,997,100Columbia State Community College $12,025,200 $11,392,300 $11,121,800 $11,294,400 $12,339,500Dyersburg State Community College $6,506,300 $6,131,100 $6,484,500 $6,867,800 $7,238,900Jackson State Community College $11,104,800 $10,423,300 $10,518,500 $10,821,400 $11,510,200Motlow State Community College $9,159,600 $8,625,000 $9,662,900 $10,310,000 $11,017,200Nashville State Community College $13,429,500 $12,554,500 $13,794,900 $14,516,500 $15,983,500Northeast State Community College $11,051,400 $10,383,600 $11,924,900 $12,920,300 $13,648,200Pellissippi State Community College $18,242,100 $17,062,500 $18,692,600 $20,819,800 $22,913,400Roane State Community College $16,437,400 $15,620,800 $14,750,900 $15,244,700 $16,619,800Southwest Tennessee Community Colle $34,396,200 $32,426,900 $28,648,100 $27,953,000 $25,739,300Volunteer State Community College $16,269,400 $15,345,700 $15,281,400 $15,614,700 $16,075,400Walters State Community College $16,578,900 $15,740,800 $15,745,100 $17,043,300 $19,866,900Community College Total $195,906,400 $184,784,300 $185,017,000 $193,980,400 $208,574,200TN Colleges of Applied Technology $47,842,700 $46,263,500 $52,260,300 $53,848,800 $57,400,500Total Academic Formula Units $775,150,600 $725,983,600 $731,775,800 $767,333,600 $825,662,800
State Appropriations for Tennessee Public Higher Education Formula Units2009-2014
TBR Universities
UT Universities
TBR Community Colleges
Tennessee Higher Education Commission Fact Book 2013-2014 82 Academic and Fiscal Trends

Table 3.17
Source: THEC Fiscal Affairs Notes: Appropriations exclude capital funds; Academic formula units include universities, community colleges, and technology centers. Dollars are unadjusted for inflation. Total Operating is the sum of Table 3.16 and 3.17.
Institution 2009-10 2010-11 2011-12 2012-13 2013-14Medical Education $164,531,500 $158,102,800 $160,820,800 $170,061,100 $180,352,100ETSU College of Medicine $26,297,600 $25,377,900 $25,859,200 $27,321,000 $28,893,900ETSU Family Practice $5,333,500 $5,150,800 $5,322,000 $5,731,700 $6,117,800UT College of Medicine $44,057,000 $42,524,700 $42,820,200 $44,883,300 $47,065,400UT Family Practice $9,487,500 $9,169,900 $9,313,200 $9,870,100 $10,458,800UT Memphis $64,637,400 $61,842,100 $63,089,600 $66,869,800 $71,363,200UT College of Vet Medicine $14,718,500 $14,037,400 $14,416,600 $15,385,200 $16,453,000Research and Public Service $72,928,500 $71,091,200 $72,392,000 $76,234,300 $80,174,900UT Ag. Experiment Station $23,377,800 $22,674,300 $23,111,900 $24,342,600 $25,438,800UT Ag. Extension Service $28,143,100 $27,180,600 $27,825,100 $29,431,800 $30,836,900TSU McMinnville Center $521,500 $527,900 $527,300 $543,300 $560,400TSU Institute of Ag. & Envir Research $2,109,800 $2,156,200 $2,145,000 $2,208,900 $2,280,500TSU Coop Education $2,371,700 $2,918,300 $2,918,200 $3,010,500 $3,110,400TSU McIntire-Stennis Forestry Research $185,400 $171,900 $170,600 $174,100 $179,400UT Space Institute $7,465,900 $7,191,600 $7,276,600 $7,603,400 $7,896,700UT Inst. for Public Service $4,705,100 $4,296,800 $4,341,200 $4,541,300 $5,232,400UT County Tech Asst. Service $1,491,700 $1,477,400 $1,521,800 $1,646,200 $1,753,200UT Municipal Tech Adv. Service $2,556,500 $2,496,200 $2,554,300 $2,732,200 $2,886,200Other Specialized Units $62,197,800 $61,789,100 $62,127,100 $69,377,200 $76,402,700UT University-Wide Admn. $4,353,700 $4,113,800 $4,209,000 $4,440,900 $4,589,300TN Board of Regents Admn. $4,429,300 $4,392,800 $4,563,400 $4,881,800 $5,104,200TN Student Assistance Corp. $48,589,500 $48,567,100 $48,579,200 $55,205,400 $61,586,800TN Higher Education Comm. $2,186,500 $2,160,300 $2,224,500 $2,292,100 $2,479,200TN Foreign Language Institute $349,100 $338,100 $352,800 $378,600 $410,300Contract Education $2,289,700 $2,217,000 $2,198,200 $2,178,400 $2,232,900Program Initiatives $43,852,600 $42,560,200 $42,455,300 $42,472,200 $43,794,000Campus Centers of Excellence $17,717,700 $17,238,700 $17,328,000 $17,538,300 $18,193,700Campus Centers of Emphasis $1,269,200 $1,240,700 $1,247,600 $1,265,900 $1,313,300Ned McWherter Scholars $401,800 $401,800 $401,800 $401,800 $411,800UT Access & Diversity $5,833,900 $5,648,700 $5,600,600 $5,550,100 $5,688,900TBR Access & Diversity $10,313,200 $9,977,400 $9,892,900 $9,803,700 $10,048,800THEC Grants $2,436,500 $2,359,200 $2,339,200 $2,318,100 $2,403,300Research Initiative $5,880,300 $5,693,700 $5,645,200 $5,594,300 $5,734,200Total Non-Formula Units $343,510,400 $333,543,300 $337,795,200 $358,144,800 $380,723,700Total Operating $1,118,661,000 $1,059,526,900 $1,069,571,000 $1,125,478,400 $1,206,386,500
State Appropriations for Tennessee Public Higher Education Non-Formula Units and Specialized Programs2009-2014
Tennessee Higher Education Commission Fact Book 2013-2014 83 Academic and Fiscal Trends

Table 3.18
Source: THEC Fiscal Affairs Notes: State appropriations are recurring general operating revenues. The American Recovery and Reinvestment Act (ARRA) provided non-recurring federal funds to Tennessee higher education over the three year period from FY 08-09 to FY 10-11. ARRA also included a Maintenance of Effort (MoE) provision that required states to maintain funding for FY08-09 to FY10-11 at FY05-06 levels in order to qualify for ARRA funds. Tuition and fees include all in-state and out-of-state tuition and mandatory fee revenues. Dollars are adjusted for inflation using the Commonfund Institute Higher Education Price Index (HEPI).
Academic YearState
Appropriations ARRA/MoETuition &
Fees* FTETotal Revenue
per FTEStudent Share
Public University 10 Year Percent Change -22.9% - 61.2% 13.3% 5.3% 17.6%2003-04 $737,552,100 - $743,991,700 100,304 $14,771 50.2%2004-05 $753,634,000 - $781,314,200 102,726 $14,942 50.9%2005-06 $738,339,200 - $824,728,300 103,636 $15,082 52.8%2006-07 $751,818,000 - $827,006,800 105,500 $14,965 52.4%2007-08 $783,706,800 - $867,745,000 107,394 $15,378 52.5%2008-09 $676,755,900 $62,572,900 $885,478,300 109,298 $14,866 54.5%2009-10 $557,847,900 $165,630,200 $949,044,000 113,260 $14,767 56.7%2010-11 $520,097,400 $198,521,700 $1,037,563,500 117,310 $14,970 59.1%2011-12 $518,995,700 - $1,096,770,500 116,933 $13,818 67.9%2012-13 $538,958,100 - $1,167,398,800 115,432 $14,782 68.4%2013-14 $568,407,900 - $1,199,186,600 113,615 $15,558 67.8%Community College 10 Year Percent Change -14.9% - 57.5% 15.1% 0.7% 15.3%2003-04 $247,257,100 - $181,850,300 49,013 $8,755 42.4%2004-05 $252,843,600 - $186,678,400 49,238 $8,926 42.5%2005-06 $246,610,200 - $192,931,100 48,315 $9,097 43.9%2006-07 $252,047,700 - $195,179,500 49,300 $9,072 43.6%2007-08 $259,882,900 - $204,191,800 49,194 $9,434 44.0%2008-09 $233,962,300 $15,560,200 $220,363,800 51,302 $9,159 46.9%2009-10 $205,656,100 $37,647,900 $261,082,600 59,993 $8,407 51.8%2010-11 $193,369,700 $47,519,200 $286,085,000 62,973 $8,368 54.3%2011-12 $195,070,500 - $292,730,400 61,343 $7,952 60.0%2012-13 $201,225,500 - $292,024,100 58,656 $8,409 59.2%2013-14 $210,511,800 - $286,414,400 56,392 $8,812 57.6%
Revenue per FTE Historical AnalysisAcademic Years 2003-04 to 2013-14
Tennessee Higher Education Commission Fact Book 2013-2014 84 Academic and Fiscal Trends

Table 3.19
Source: THEC Fiscal Affairs and SREB Notes: Awards include associate's, bachelor's, master's and doctoral degrees granted at universities. Awards do not include post-baccalaureate certificates, UT Medical Health Science Center degrees, or ETSU first professional degrees. All State Appropriations and Tuition & Fees amounts are presented in 2013 Inflation Adjusted Dollars.
Academic YearState
Appropriations ARRA/MoE Tuition & FeesTotal
AwardsTotal Revenue
per AwardStudent Share
Public Universities 10 Year Percent Chan -31.2% - 68.0% 30.0% -11.2% 45.6%2002-03 $783,904,000 $694,875,100 21,754 $67,977 47.0%2003-04 $737,552,100 - $743,991,700 22,222 $66,670 50.2%2004-05 $753,634,000 - $781,314,200 22,651 $67,765 50.9%2005-06 $738,339,200 - $824,728,300 22,738 $68,743 52.8%2006-07 $751,818,000 - $827,006,800 23,660 $66,730 52.4%2007-08 $783,706,800 - $867,745,000 23,813 $69,351 52.5%2008-09 $676,755,900 $62,572,900 $885,478,300 25,875 $62,794 54.5%2009-10 $557,847,900 $165,630,200 $949,044,000 25,300 $66,108 56.7%2010-11 $520,097,400 $198,521,700 $1,037,563,500 26,638 $65,928 59.1%2011-12 $518,995,700 - $1,096,770,500 27,339 $59,101 67.9%2012-13 $538,958,100 - $1,167,398,800 28,274 $60,351 68.4%
Revenue per Student Award Historical AnalysisAcademic Years 2002-03 to 2012-13
Tennessee Higher Education Commission Fact Book 2013-2014 85 Academic and Fiscal Trends
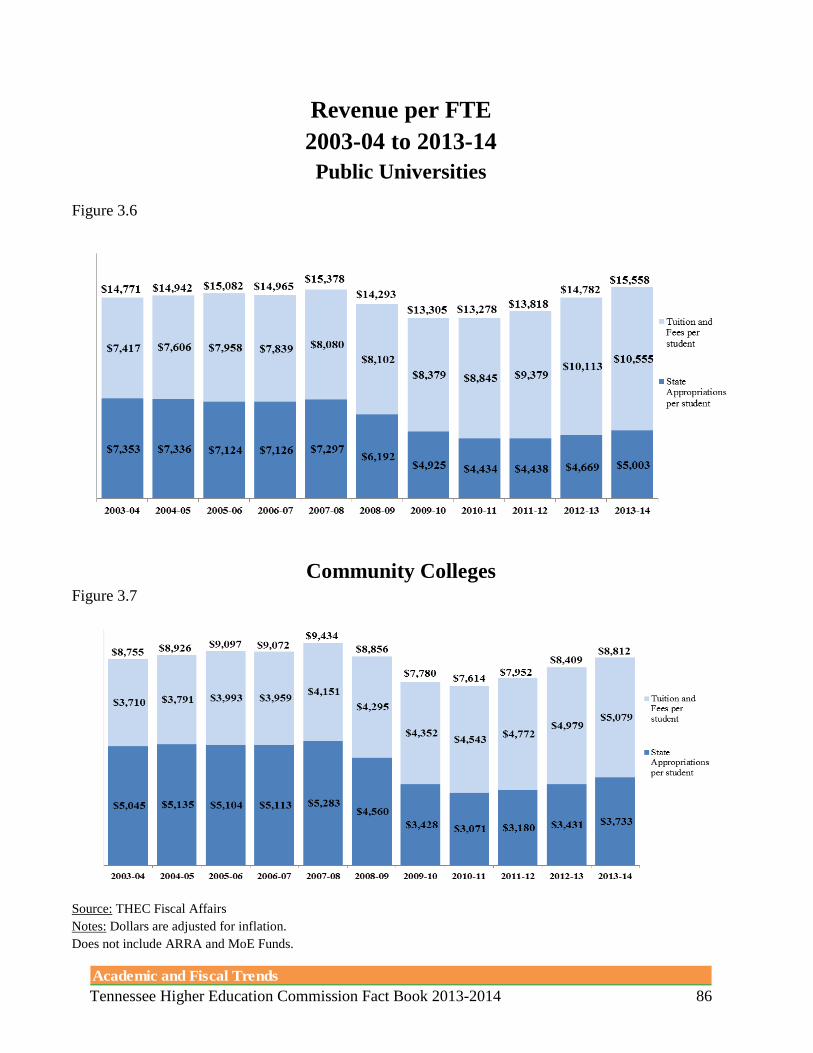
Revenue per FTE 2003-04 to 2013-14 Public Universities
Figure 3.6
Community Colleges Figure 3.7
Source: THEC Fiscal Affairs Notes: Dollars are adjusted for inflation. Does not include ARRA and MoE Funds.
Tennessee Higher Education Commission Fact Book 2013-2014 86 Academic and Fiscal Trends

Student Share of Revenue per FTE 2003-04 to 2013-14
Figure 3.8
Source: THEC Fiscal Affairs Note: Student share of total revenue per FTE is defined as tuition and fees as a percent of total revenue from state appropriations and tuition and fees.
Tennessee Higher Education Commission Fact Book 2013-2014 87 Academic and Fiscal Trends

Table 3.20
Source: National Association of State Student Grant & Aid Programs 43rd Annual Survey, Table 13 Note: Estimated Number of Awards is calculated by dividing Total Aid Awards by Total FTE.
Rank StateTotal 2011-2012
FTETotal 2011-12
Aid Awards
Estimated Number of
Awards/FTE1 Georgia 448,356 260,970 0.5822 South Carolina 208,255 116,927 0.5613 Oklahoma 186,906 104,886 0.5614 Tennessee 295,573 164,160 0.5555 Kentucky 220,176 121,565 0.5526 Puerto Rico 242,315 133,107 0.5497 Nevada 84,697 44,759 0.5288 New Mexico 110,204 50,869 0.4629 Louisiana 214,331 94,281 0.440
10 Nebraska 110,359 47,409 0.43011 North Carolina 449,885 186,671 0.41512 West Virginia 114,340 46,782 0.40913 Vermont 37,799 15,170 0.40114 Florida 876,842 349,523 0.39915 Minnesota 327,515 124,687 0.38116 Massachusetts 414,882 157,947 0.38117 Maine 56,053 20,694 0.36918 Washington 297,174 104,040 0.35019 Arkansas 140,918 48,855 0.34720 New Jersey 358,803 123,402 0.34421 Virginia 435,099 146,182 0.33622 New York 1,083,619 350,958 0.32423 Pennsylvania 656,288 203,543 0.31024 Texas 1,116,402 331,467 0.29725 Indiana 361,990 104,643 0.28926 Oregon 196,150 56,040 0.28627 Colorado 272,692 77,796 0.28528 Wisconsin 288,977 75,453 0.26129 Illinois 657,922 170,623 0.25930 Rhode Island 73,245 18,497 0.25331 North Dakota 45,012 10,460 0.23232 Missouri 341,621 78,707 0.23033 Wyoming 26,958 6,204 0.23034 Delaware 45,787 10,244 0.22435 Maryland 269,308 55,105 0.20536 Alaska 23,094 4,405 0.19137 Ohio 585,767 109,488 0.18738 Mississippi 153,250 27,161 0.17739 Connecticut 163,966 28,759 0.17540 Idaho 72,808 10,961 0.15141 Michigan 508,527 73,926 0.14542 Montana 44,899 6,238 0.13943 California 1,915,028 250,239 0.13144 Washington, DC 72,897 7,173 0.09845 Iowa 291,141 25,292 0.08746 South Dakota 42,287 3,631 0.08647 Kansas 162,709 12,250 0.07548 Alabama 252,156 16,211 0.06449 Hawaii 56,312 1,986 0.03550 Utah 207,073 4,658 0.02251 Arizona 650,728 7,704 0.01252 New Hampshire 62,331 - -
Nation 16,331,426 4,602,708 0.282
2011-2012Undergraduate Scholarship and Grant Awards per Enrollment, by State
Tennessee Higher Education Commission Fact Book 2013-2014 88 Academic and Fiscal Trends

Table 3.21
Source: National Association of State Student Grant & Aid Programs 43rd Annual Survey, Table 12 Note: The national average in the first column ($650) represents the national total of undergraduate grant aid ($9.2 billion) divided by the estimated 14,239,975 in undergraduate FTE. The national average in the second column ($482) represents need based grant aid of $6.8 billion divided by the estimated 14,239,975 in undergraduate FTE.
Rank State Estimated UG Aid Dollars/ UG FTE
Rank StateEstimated Need-based
UG Aid Dollars/ UG FTE
1 South Carolina 1711 1 Washington 10772 Georgia 1418 2 New Jersey 10613 Tennessee 1410 3 New York 10244 Arkansas 1153 4 California 8755 New Jersey 1105 5 Pennsylvania 8176 Washington 1087 6 Indiana 7767 New York 1058 7 Illinios 7478 West Virginia 1043 8 North Carolina 6689 Louisianna 1039 9 Texas 61410 Kentucky 995 10 Minnesota 59511 New Mexico 923 11 Vermont 56412 California 875 12 Oklahoma 48413 Pennsylvania 817 13 Kentucky 45914 North Carolina 817 14 West Virginia 44615 Washington, D.C. 812 15 Wisconsin 42916 Indiana 777 16 Virginia 39217 Illinois 776 17 Maryland 38018 Nevada 663 18 Connecticut 37319 Florida 620 19 Nevada 36320 Texas 614 20 Delaware 35221 Minnesota 596 21 Tennessee 31322 Vermont 567 22 Maine 31223 Virginia 552 23 Colorado 29324 Oklahoma 549 24 South Carolina 27325 Delaware 516 25 Massachusetts 25626 Wisconsin 440 26 Oregon 25127 Maryland 398 27 Puerto Rico 24428 Connecticut 375 28 North Dakota 23329 Missouri 334 29 New Mexico 23130 North Dakota 333 30 Missouri 20731 Maine 312 31 Iowa 20132 Colorado 295 32 Michigan 19433 Massachusetts 278 33 Rhode Island 19334 Alaska 272 34 Florida 18835 Oregon 251 35 Nebraska 16436 Puerto Rico 244 36 Ohio 14437 Iowa 221 37 Louisiana 14238 Ohio 209 38 Alaska 13239 Michigan 197 39 Kansas 12340 Rhode Island 193 40 Montana 12241 Mississippi 166 41 Alabama 7642 Nebraska 164 42 Hawaii 7643 Montana 155 43 Arkansas 6844 Kansas 124 44 Washington DC 3545 South Dakota 107 45 Arizona 2946 Idaho 93 46 Mississippi 2847 Alabama 85 47 Idaho 2648 Hawaii 76 48 Utah 1649 Utah 47 49 Georgia --50 Arizona 29 50 New Hampshire --51 New Hampshire -- 51 South Dakota --52 Wyoming -- 52 Wyoming --
Nation $650 Total $482
Undergraduate Scholarship and Grant Dollars per Undergraduate Enrollment, by State 2011-2012
Tennessee Higher Education Commission Fact Book 2013-2014 89 Academic and Fiscal Trends
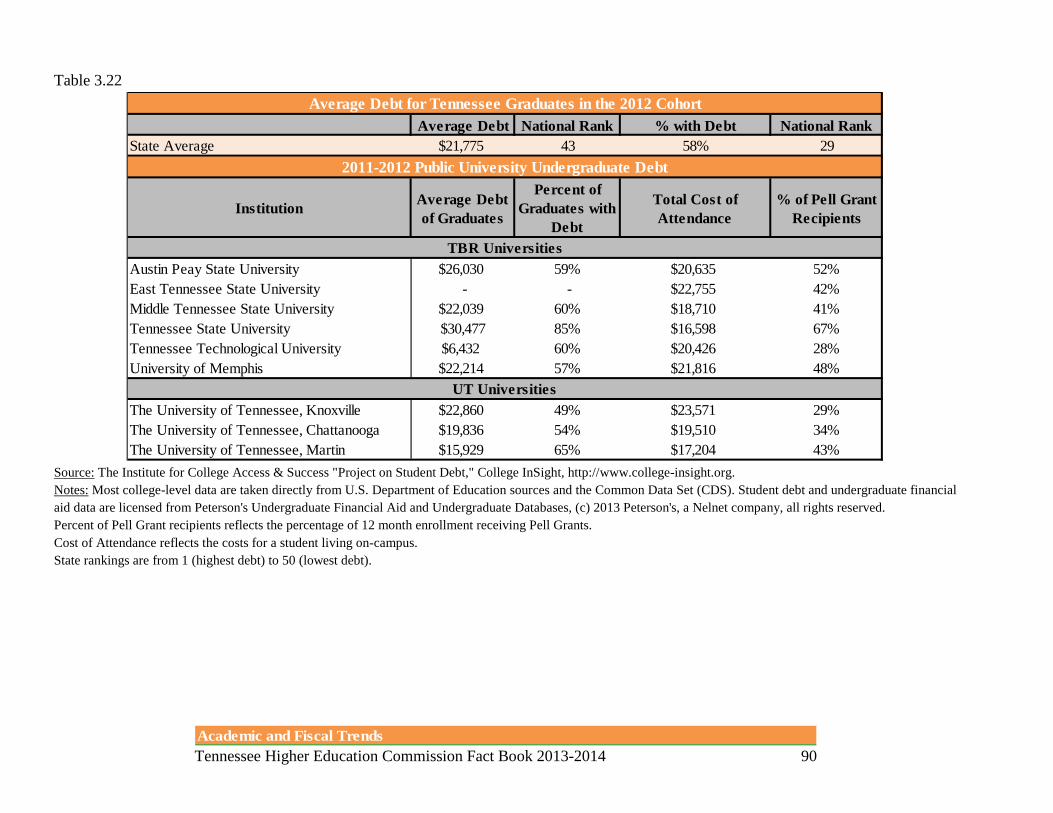
Table 3.22
Source: The Institute for College Access & Success "Project on Student Debt," College InSight, http://www.college-insight.org. Notes: Most college-level data are taken directly from U.S. Department of Education sources and the Common Data Set (CDS). Student debt and undergraduate financial aid data are licensed from Peterson's Undergraduate Financial Aid and Undergraduate Databases, (c) 2013 Peterson's, a Nelnet company, all rights reserved. Percent of Pell Grant recipients reflects the percentage of 12 month enrollment receiving Pell Grants. Cost of Attendance reflects the costs for a student living on-campus. State rankings are from 1 (highest debt) to 50 (lowest debt).
Average Debt National Rank % with Debt National RankState Average $21,775 43 58% 29
Institution Average Debt of Graduates
Percent of Graduates with
Debt
Total Cost of Attendance
% of Pell Grant Recipients
Austin Peay State University $26,030 59% $20,635 52%East Tennessee State University - - $22,755 42%Middle Tennessee State University $22,039 60% $18,710 41%Tennessee State University $30,477 85% $16,598 67%Tennessee Technological University $6,432 60% $20,426 28%University of Memphis $22,214 57% $21,816 48%
The University of Tennessee, Knoxville $22,860 49% $23,571 29%The University of Tennessee, Chattanooga $19,836 54% $19,510 34%The University of Tennessee, Martin $15,929 65% $17,204 43%
UT Universities
Average Debt for Tennessee Graduates in the 2012 Cohort
2011-2012 Public University Undergraduate Debt
TBR Universities
Tennessee Higher Education Commission Fact Book 2013-2014 90 Academic and Fiscal Trends

Table 3.23
Source: U.S. Department of Education "Official Cohort Default Rates for Schools" www2.ed.gov accessed February 12, 2014. Note: A school subject to loss of eligibility to participate in the Federal Family Education Loan (FFEL) Program, William D. Ford Federal Direct Loan (Direct Loan) Program, and/or Federal Pell Grant (Pell Grant) Program has FY 2009, FY 2010, and FY 2011 official cohort default rates that are 25% or greater.
Number of Borrowers in Default
Number of Borrowers in Repay
Official Default
Rate
Number of Borrowers in Default
Number of Borrowers in Repay
Official Default
Rate
Number of Borrowers in Default
Number of Borrowers in Repay
Official Default
Rate
Chattanooga State Community College 306 1,759 17.3% 403 2,353 17.1% 441 2,929 15.0%Cleveland State Community College 53 386 13.7% 60 464 12.9% 84 610 13.7%Columbia State Community College 82 648 12.6% 71 697 10.1% 91 724 12.5%Dyersburg State Community College 61 442 13.8% 81 633 12.7% 133 834 15.9%Jackson State Community College - - - - - - - - -Motlow State Community College 40 382 10.4% 63 419 15.0% 98 531 18.4%Nashville State Community College 156 1,144 13.6% 182 1,432 12.7% 243 1,762 13.7%Northeast State Community College 142 792 17.9% 162 891 18.1% 190 995 19.0%Pellissippi State Community College 148 1,090 13.5% 213 1,393 15.2% 286 1,926 14.8%Roane State Community College 65 577 11.2% 93 773 12.0% 89 842 10.5%Southwest Tennessee Community College - - - - - - - - -Volunteer State Community College 134 1,121 11.9% 156 1,369 11.3% 180 1,497 12.0%Walters State Community College 70 506 13.8% 112 640 17.5% 100 716 13.9%
Austin Peay State University 256 2,412 10.6% 264 2,653 9.9% 271 2,832 9.5%East Tennessee State University 272 2,544 10.6% 267 2,828 9.4% 297 2,977 9.9%Middle Tennessee State University 427 4,939 8.6% 457 5,471 8.3% 505 5,903 8.5%Tennessee State University 268 2,626 10.2% 233 2,557 9.1% 238 2,790 8.5%Tennessee Technological University 48 1,870 2.5% 101 1,990 5.0% 145 2,123 6.8%University of Memphis 251 4,149 6.0% 300 4,439 6.7% 519 5,073 10.2%
University of Tennessee, Chattanooga 147 1,732 8.4% 144 1,971 7.3% 132 2,040 6.4%University of Tennessee, Knoxville 251 4,908 5.1% 316 4,931 6.4% 214 5,276 4.0%University of Tennessee, Martin 161 1,375 11.7% 150 1,374 10.9% 173 1,700 10.1%
TBR Universities
UT Universities
TBR Community Colleges
Two-Year Cohort Default Rates for Schools Participating in Title IV Student Financial Assistance Programs2009-2011
Institution Name
Cohort Year 2009 Cohort Year 2010 Cohort Year 2011
Tennessee Higher Education Commission Fact Book 2013-2014 91 Academic and Fiscal Trends
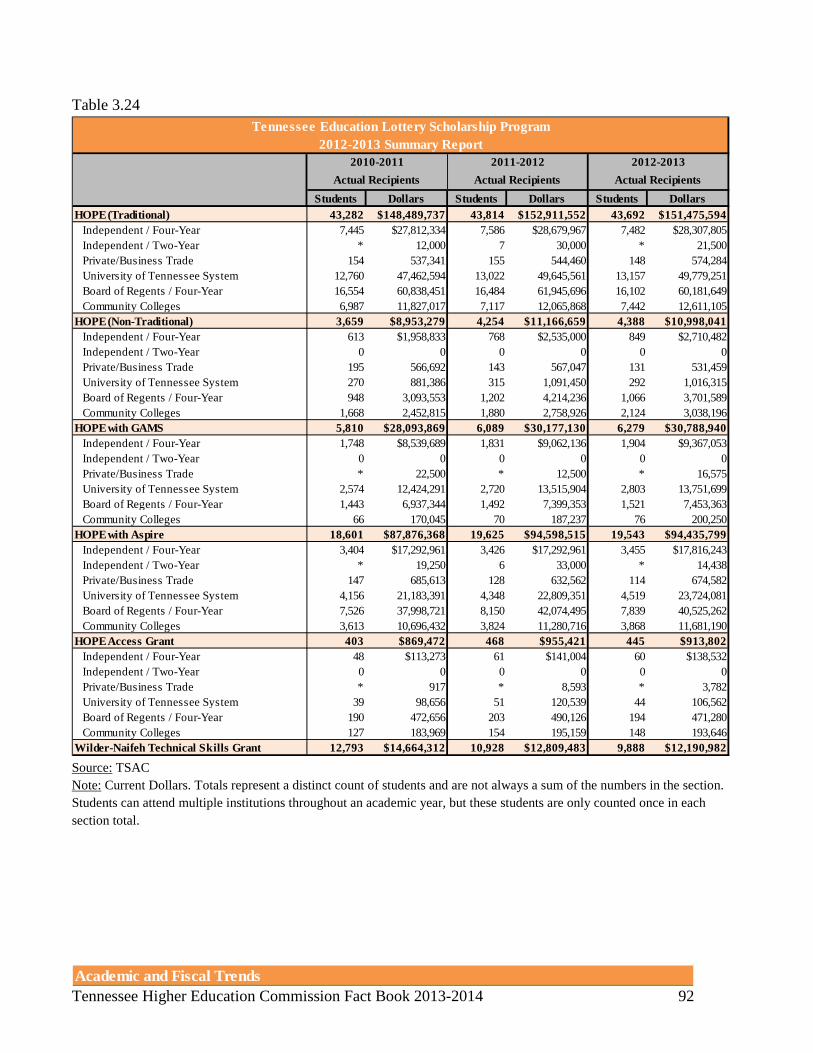
Table 3.24
Source: TSAC Note: Current Dollars. Totals represent a distinct count of students and are not always a sum of the numbers in the section. Students can attend multiple institutions throughout an academic year, but these students are only counted once in each section total.
Students Dollars Students Dollars Students DollarsHOPE (Traditional) 43,282 $148,489,737 43,814 $152,911,552 43,692 $151,475,594
Independent / Four-Year 7,445 $27,812,334 7,586 $28,679,967 7,482 $28,307,805Independent / Two-Year * 12,000 7 30,000 * 21,500Private/Business Trade 154 537,341 155 544,460 148 574,284University of Tennessee System 12,760 47,462,594 13,022 49,645,561 13,157 49,779,251Board of Regents / Four-Year 16,554 60,838,451 16,484 61,945,696 16,102 60,181,649Community Colleges 6,987 11,827,017 7,117 12,065,868 7,442 12,611,105
HOPE (Non-Traditional) 3,659 $8,953,279 4,254 $11,166,659 4,388 $10,998,041Independent / Four-Year 613 $1,958,833 768 $2,535,000 849 $2,710,482Independent / Two-Year 0 0 0 0 0 0Private/Business Trade 195 566,692 143 567,047 131 531,459University of Tennessee System 270 881,386 315 1,091,450 292 1,016,315Board of Regents / Four-Year 948 3,093,553 1,202 4,214,236 1,066 3,701,589Community Colleges 1,668 2,452,815 1,880 2,758,926 2,124 3,038,196
HOPE with GAMS 5,810 $28,093,869 6,089 $30,177,130 6,279 $30,788,940Independent / Four-Year 1,748 $8,539,689 1,831 $9,062,136 1,904 $9,367,053Independent / Two-Year 0 0 0 0 0 0Private/Business Trade * 22,500 * 12,500 * 16,575University of Tennessee System 2,574 12,424,291 2,720 13,515,904 2,803 13,751,699Board of Regents / Four-Year 1,443 6,937,344 1,492 7,399,353 1,521 7,453,363Community Colleges 66 170,045 70 187,237 76 200,250
HOPE with Aspire 18,601 $87,876,368 19,625 $94,598,515 19,543 $94,435,799Independent / Four-Year 3,404 $17,292,961 3,426 $17,292,961 3,455 $17,816,243Independent / Two-Year * 19,250 6 33,000 * 14,438Private/Business Trade 147 685,613 128 632,562 114 674,582University of Tennessee System 4,156 21,183,391 4,348 22,809,351 4,519 23,724,081Board of Regents / Four-Year 7,526 37,998,721 8,150 42,074,495 7,839 40,525,262Community Colleges 3,613 10,696,432 3,824 11,280,716 3,868 11,681,190
HOPE Access Grant 403 $869,472 468 $955,421 445 $913,802Independent / Four-Year 48 $113,273 61 $141,004 60 $138,532Independent / Two-Year 0 0 0 0 0 0Private/Business Trade * 917 * 8,593 * 3,782University of Tennessee System 39 98,656 51 120,539 44 106,562Board of Regents / Four-Year 190 472,656 203 490,126 194 471,280Community Colleges 127 183,969 154 195,159 148 193,646
Wilder-Naifeh Technical Skills Grant 12,793 $14,664,312 10,928 $12,809,483 9,888 $12,190,982
Tennessee Education Lottery Scholarship Program2012-2013 Summary Report
2010-2011 2011-2012 2012-2013Actual Recipients Actual Recipients Actual Recipients
Tennessee Higher Education Commission Fact Book 2013-2014 92 Academic and Fiscal Trends

Table 3.24 continued
Source: TSAC Note: Current Dollars. Totals represent a distinct count of students and are not always a sum of the numbers in the section. Students can attend multiple institutions throughout an academic year, but these students are only counted once in each section total.
Students Dollars Students Dollars Students DollarsHOPE Foster Care Grant 51 $251,584 64 $354,155 61 $307,854
Independent / Four-Year * $22,260 8 $48,860 7 $37,060Independent / Two-Year 0 0 0 0 0 0Private/Business Trade 0 0 0 0 0 0University of Tennessee System 17 101,500 15 96,188 7 42,515Board of Regents / Four-Year 22 105,074 34 191,989 33 197,862Community Colleges 8 22,750 7 17,118 12 28,992TN College of Applied Technology 0 0 0 0 * 1,425
Dual Enrollment Grant 16,404 $7,194,005 16,995 $8,743,539 17,759 $9,882,137Independent / Four-Year 1,741 $737,023 1,488 $754,219 1,683 $868,276Independent / Two-Year 0 0 0 0 0 0Private/Business Trade * 300 226 74,100 278 115,500University of Tennessee System 1,199 562,780 744 353,800 674 386,594Board of Regents / Four-Year 931 474,800 947 513,500 1,206 728,084Community Colleges 11,122 4,762,837 12,001 6,373,820 12,612 7,183,133TN College of Applied Technology 1,631 656,265 1,806 674,100 1,523 600,550
Math & Science Teachers Program 18 $36,000 18 $36,000 * $18,000Independent / Four-Year 0 $0 0 $0 0 $0University of Tennessee System 7 14,000 8 16,000 * 10,000Board of Regents / Four-Year 11 22,000 10 20,000 * 8,000
Helping Heroes Grant 503 $680,000 510 $805,730 486 $765,855Independent / Four-Year 35 $46,500 56 $90,500 63 $104,000Independent / Two-Year 0 0 0 0 0 0Private/Business Trade * 3,000 * 3,000 6 7,500University of Tennessee System 51 75,000 55 96,500 62 105,500Board of Regents / Four-Year 259 375,500 240 390,230 222 360,355Community Colleges 156 180,000 157 225,500 133 188,500
Rural Health Loan Forgiveness 45 $481,049 38 $423,730 * $126,325Independent / Four-Year 34 $381,620 27 $298,777 12 $117,975Private/Business Trade * $16,000 * $12,000 0 $0University of Tennessee System * 42,633 * 60,000 * 8,350Board of Regents / Four-Year * 40,796 * 52,953 0 0
All Programs 101,569 $297,589,674 102,803 $312,981,914 102,573 $311,903,329Independent / Four-Year 15,072 $56,904,493 15,251 $59,378,854 15,515 $59,467,426Independent / Two-Year 8 31,250 13 63,000 10 35,938Private/Business Trade 507 1,832,363 662 1,854,262 683 1,923,682University of Tennessee System 21,077 82,846,231 21,283 87,805,293 21,564 88,930,867Board of Regents / Four-Year 27,889 110,358,895 28,767 117,292,578 28,187 113,627,447Community Colleges 23,747 30,295,865 25,210 33,104,344 26,415 35,125,012Technology Centers 14,424 15,320,577 12,734 13,483,583 11,413 12,792,957
Tennessee Education Lottery Scholarship Program2012-2013 Summary Report Continued
2010-2011 2011-2012 2012-2013Actual Recipients Actual Recipients Actual Recipients
Tennessee Higher Education Commission Fact Book 2013-2014 93 Academic and Fiscal Trends

Table 3.25
Source: TSAC Note: Current Dollars. Totals represent a distinct count of students and are not always a sum of the numbers in the section. Students can attend multiple institutions throughout an academic year, but these students are only counted once in each section total.
Students Dollars Students Dollars Students DollarsIndependent / Four -Year 7,445 $27,812,334 7,586 $28,679,967 7,482 $28,307,805Aquinas College 32 $102,500 47 $102,500 30 $84,000Baptist Mem. Coll. Health & Sci. 101 360,125 94 360,125 112 446,825Belmont University 666 2,518,375 683 2,518,375 687 2,557,850Bethel University 305 1,151,750 318 1,151,750 362 1,370,375Bryan College 156 566,500 171 566,500 176 670,750Carson Newman College 509 1,872,200 546 1,872,200 519 1,990,400Christian Brothers University 311 1,175,500 315 1,175,500 271 1,032,000Cumberland University 263 989,500 296 989,500 289 1,051,500Fisk University 27 102,000 22 102,000 24 97,000Freed Hardeman University 303 1,144,000 311 1,144,000 307 1,150,175Hiwassee College * $28,000 30 $28,000 38 $137,000Johnson University 55 200,000 59 200,000 76 269,500King College 217 816,000 204 816,000 184 678,000Knoxville College 0 0 0 0 0 0Lambuth University 94 342,000 0 342,000 0 0Lane College 21 76,000 15 76,000 10 41,000Lee University 552 2,078,375 602 2,078,375 621 2,462,375LeMoyne-Owen College 22 81,601 18 81,601 11 38,000Lincoln Memorial University 300 1,136,150 348 1,136,150 324 1,211,000Lipscomb University 684 2,565,750 669 2,565,750 669 2,560,250Martin Methodist University 174 647,000 168 647,000 202 801,975Maryville College 361 1,345,800 358 1,345,800 341 1,261,600Memphis College of Art 35 127,500 38 127,500 36 141,000Milligan College 207 775,000 208 775,000 198 751,700Rhodes College 152 567,125 155 567,125 151 564,000Southern Adventist University 218 802,500 223 802,500 225 851,200Tennessee Temple University * 4,000 17 4,000 20 80,000Tennessee Wesleyan College 324 1,229,368 324 1,229,368 310 1,165,834Trevecca Nazarene University 212 781,500 242 781,500 260 963,700Tusculum College 207 758,000 184 758,000 162 578,700Union University 538 1,983,750 527 1,983,750 514 1,937,125University of the South 125 466,000 140 466,000 133 497,730Vanderbilt University 196 728,840 191 728,840 154 566,741Watkins Inst. Coll. Of Art & Des. 50 175,625 51 175,625 51 178,500Welch College 30 114,000 25 114,000 33 120,000Independent / Two-Year * $12,000 7 $30,000 * $21,500John A. Gupton College * 12,000 7 30,000 * 21,500
Tennessee Education Lottery Scholarship ProgramTraditional HOPE Awards By Institution
2010-2011 2011-2012 2012-2013Actual Recipients Actual Recipients Actual Recipients
Tennessee Higher Education Commission Fact Book 2013-2014 94 Academic and Fiscal Trends

Table 3.25 Continued
Source: TSAC Note: Current Dollars. Totals represent a distinct count of students and are not always a sum of the numbers in the section. Students can attend multiple institutions throughout an academic year, but these students are only counted once in each section total.
Students Dollars Students Dollars Students DollarsPrivate / Business & Trade 154 $537,341 155 $544,460 148 $574,284Art Institute of Tennessee-Nashville 68 $236,008 64 $216,532 57 $199,500O'More College of Design 56 $209,000 48 $179,300 48 $188,700South College 25 79,333 34 117,128 28 115,084Victory University * 13,000 9 31,500 21 71,000University of Tennessee System 12,760 $47,462,594 13,022 $49,645,561 13,157 $49,779,251University of TN, Chattanooga 3,142 $11,652,121 3,441 $13,045,268 3,621 $13,726,997University of TN, Health Sci. Ctr. 22 84,000 24 98,000 23 108,000University of TN, Knoxville 7,785 29,050,390 7,758 29,685,938 7,751 29,457,399University of TN, Martin 1,835 6,676,083 1,819 6,816,355 1,776 6,486,855Board of Regents / Four Year 16,554 $60,838,451 16,484 $61,945,697 16,102 $60,181,649Austin Peay State University 1,668 $6,064,603 1,652 $6,137,245 1,652 $6,179,546East Tennessee State University 1,836 10,486,405 2,938 11,044,158 2,781 10,502,070ETSU School of Pharmacy 0 0 0 0 0 0Middle Tennessee State University 5,647 20,702,909 5,317 20,073,081 4,984 18,622,459Tennessee State University 390 1,424,607 383 1,424,251 375 1,379,825Tennessee Technological Univer. 3,035 11,109,717 3,204 11,991,087 3,193 11,890,975University of Memphis 3,012 11,050,210 3,025 11,275,875 3,151 11,606,774Community Colleges 6,987 $11,827,017 7,117 $12,065,869 7,422 $12,611,105Chattanooga State Com Coll 502 $833,625 493 $816,000 510 $840,425Cleveland State Comm College 300 525,555 309 545,809 371 629,505Columbia State Comm College 662 1,113,750 612 1,022,500 630 1,072,475Dyersburg State Comm College 178 301,250 219 373,125 225 362,217Jackson State Comm College 424 696,765 397 668,677 396 659,935Motlow State Comm College 492 824,104 514 890,124 522 880,885Nashville State Comm College 254 410,272 293 455,546 285 427,586Northeast State Comm Coll 544 962,500 532 921,125 590 1,028,684Pellissippi State Comm Coll 1,042 1,735,250 1,094 1,808,474 1,128 1,941,117Roane State Community College 779 1,353,736 769 1,340,189 760 1,294,338Southwest Tennessee Comm Coll 302 488,500 291 451,041 300 472,150Volunteer State Community Coll 741 1,243,660 851 1,454,746 907 1,537,909Walters State Community College 784 1,338,051 760 1,318,513 840 1,463,879Total Awards By Institution Type 43,282 $148,489,737 43,814 $152,911,554 43,692 $151,475,594Independent / Four-Year 7,445 $27,812,334 7,586 $28,679,967 7,482 $28,307,805Independent / Two-Year * 12,000 7 30,000 * 21,500Private / Business & Trade 154 537,341 155 544,460 148 574,284University of Tennessee System 12,760 47,462,594 13,022 49,645,561 13,157 49,779,251Board of Regents / Four-Year 16,554 60,838,451 16,484 61,945,697 16,102 60,181,649Community Colleges 6,987 11,827,017 7,117 12,065,869 7,422 12,611,105
Tennessee Education Lottery Scholarship ProgramTraditional HOPE Awards By Institution
2010-2011 2011-2012 2012-2013Actual Recipients Actual Recipients Actual Recipients
Tennessee Higher Education Commission Fact Book 2013-2014 95 Academic and Fiscal Trends

Table 3.26
Table 3.27
Source: TSAC Note: Totals represent a distinct count of students and are not always a sum of the numbers in the section. Students can attend multiple institutions throughout an academic year, but these students are only counted once in each section total.
Award NameNumber of Recipients Total Awarded
Dependent Children Scholarship 22 $186,728 Graduate Nursing Loan Forgiveness 60 $269,500 Minority Teaching Fellows 107 $471,800 Ned McWherter Scholars 196 $565,093 Robert C. Byrd Honors Scholarship 298 $432,375 Tennessee Student Assistance Award 32,958 $61,105,256 Tennessee Teaching Scholars 157 $693,121 Grand Total 34,454 $63,723,873
Tennessee Student Assistance CorporationNon-Lottery Awards By Program 2012-2013
Institution TypeNumber of Recipients Total Awarded
Independent/Four-Year 6,584 $22,856,715 Independent/Two-Year 22 $30,000University of Tennessee System 4,843 $9,288,138Board of Regents/Four-Year 10,470 $18,822,350Board of Regents/Two-Year 8,964 $8,628,334Technology Centers 1,246 $818,998Proprietary Institutions 2,280 $3,212,213Out-of-State Institutions 45 $67,125Grand Total 34,454 $63,723,873
Tennessee Student Assistance CorporationNon-Lottery Awards By Sector 2012-2013
Tennessee Higher Education Commission Fact Book 2013-2014 96 Academic and Fiscal Trends

Section 4:
Outcomes Funding Formula
Tennessee Higher Education Commission Fact Book 2013-2014 97 Outcomes Funding Formula

THEC Outcomes Funding Formula Definitions
Outcome Definition University and Community College Outcomes
Student Progression The number of students reaching 24, 48, or 72 credit hours at a University (12, 24, or 36 at a Community College).
Transfers Out The number of students who, after accumulating 12 credit hours, transferred to another institution.
Awards per 100 FTE The combined total of associate's and bachelor's degrees (associate's and certificates for community colleges) conferred, in an academic year, for every 100 undergraduate FTE.
University Outcomes Bachelor’s and Associate’s Degrees The total number of bachelor’s and associate’s degrees
conferred in an academic year. Master’s and Ed Specialist Degrees The total number of master’s and education specialist degrees
conferred in an academic year. Doctoral and Law Degrees The total number of doctoral and law degrees conferred in an
academic year. Research and Service Expenditures on activities eligible for indirect cost allocation.
Primarily externally generated funding for research, service, or instruction.
Six-Year Graduation Rate The six-year graduation rate of first-time, full-time freshmen who begin in the summer or fall semester.
Community College Outcomes Dual Enrollment The number of high school students taking degree-credit
courses in an academic year. Associate’s Degrees The total number of associate’s degrees conferred in an
academic year. 1 to 2 Year Certificates The total number of certificates, requiring 24 or more credit
hours, granted during an academic year. General education certificates are excluded from this metric.
Less than 1 Year Certificates The total number of certificates, requiring less than 24 credit hours, granted during an academic year if certificate is the highest credential earned.
Job Placements The number of placeable graduates who obtain employment in a related field over the course of a full academic year.
Remedial and Developmental Success
The number of full-time and part-time students who were enrolled in any remedial or developmental course or instruction who then successfully completed college level courses in a subsequent semester within three years of initial enrollment.
Workforce Training The total number of technical training contact hours in an academic year. These activities provide technical or soft skills without carrying institutional credit.
Note: Detailed definitions and other formula information can be found on THEC’s website: www.tn.gov/thec.
Tennessee Higher Education Commission Fact Book 2013-2014 98 Outcomes Funding Formula
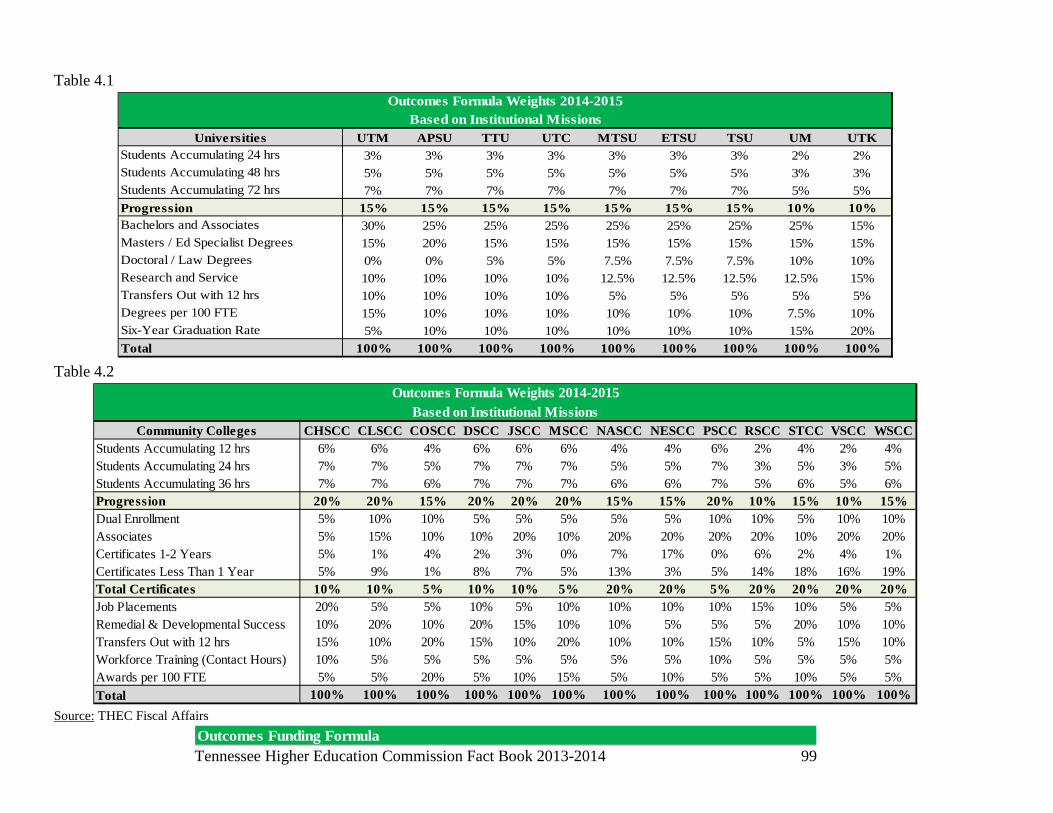
Table 4.1
Table 4.2
Source: THEC Fiscal Affairs
Universities UTM APSU TTU UTC MTSU ETSU TSU UM UTKStudents Accumulating 24 hrs 3% 3% 3% 3% 3% 3% 3% 2% 2%Students Accumulating 48 hrs 5% 5% 5% 5% 5% 5% 5% 3% 3%Students Accumulating 72 hrs 7% 7% 7% 7% 7% 7% 7% 5% 5%Progression 15% 15% 15% 15% 15% 15% 15% 10% 10%Bachelors and Associates 30% 25% 25% 25% 25% 25% 25% 25% 15%Masters / Ed Specialist Degrees 15% 20% 15% 15% 15% 15% 15% 15% 15%Doctoral / Law Degrees 0% 0% 5% 5% 7.5% 7.5% 7.5% 10% 10%Research and Service 10% 10% 10% 10% 12.5% 12.5% 12.5% 12.5% 15%Transfers Out with 12 hrs 10% 10% 10% 10% 5% 5% 5% 5% 5%Degrees per 100 FTE 15% 10% 10% 10% 10% 10% 10% 7.5% 10%Six-Year Graduation Rate 5% 10% 10% 10% 10% 10% 10% 15% 20%Total 100% 100% 100% 100% 100% 100% 100% 100% 100%
Outcomes Formula Weights 2014-2015Based on Institutional Missions
Community Colleges CHSCC CLSCC COSCC DSCC JSCC MSCC NASCC NESCC PSCC RSCC STCC VSCC WSCCStudents Accumulating 12 hrs 6% 6% 4% 6% 6% 6% 4% 4% 6% 2% 4% 2% 4%Students Accumulating 24 hrs 7% 7% 5% 7% 7% 7% 5% 5% 7% 3% 5% 3% 5%Students Accumulating 36 hrs 7% 7% 6% 7% 7% 7% 6% 6% 7% 5% 6% 5% 6%Progression 20% 20% 15% 20% 20% 20% 15% 15% 20% 10% 15% 10% 15%Dual Enrollment 5% 10% 10% 5% 5% 5% 5% 5% 10% 10% 5% 10% 10%Associates 5% 15% 10% 10% 20% 10% 20% 20% 20% 20% 10% 20% 20%Certificates 1-2 Years 5% 1% 4% 2% 3% 0% 7% 17% 0% 6% 2% 4% 1%Certificates Less Than 1 Year 5% 9% 1% 8% 7% 5% 13% 3% 5% 14% 18% 16% 19%Total Certificates 10% 10% 5% 10% 10% 5% 20% 20% 5% 20% 20% 20% 20%Job Placements 20% 5% 5% 10% 5% 10% 10% 10% 10% 15% 10% 5% 5%Remedial & Developmental Success 10% 20% 10% 20% 15% 10% 10% 5% 5% 5% 20% 10% 10%Transfers Out with 12 hrs 15% 10% 20% 15% 10% 20% 10% 10% 15% 10% 5% 15% 10%Workforce Training (Contact Hours) 10% 5% 5% 5% 5% 5% 5% 5% 10% 5% 5% 5% 5%Awards per 100 FTE 5% 5% 20% 5% 10% 15% 5% 10% 5% 5% 10% 5% 5%Total 100% 100% 100% 100% 100% 100% 100% 100% 100% 100% 100% 100% 100%
Outcomes Formula Weights 2014-2015Based on Institutional Missions
Tennessee Higher Education Commission Fact Book 2013-2014 99 Outcomes Funding Formula

Table 4.3
Source: THEC Fiscal Affairs Notes: Data reflect individual year outcomes, not three-year averages. In some instances, the Funding Formula uses slightly different data definitions than other tables included in the Fact Book. The data, formula definitions, and other information can be found on THEC’s website: www.tn.gov/thec.
2012-13 1,217 1,155 1,203 1,247 122 0 $2,001,804 264 18.52 0.532011-12 1,261 1,163 1,206 1,116 132 0 $3,036,994 260 16.33 0.572010-11 1,351 1,283 1,299 1,038 131 0 $3,646,780 223 15.04 0.59
2012-13 1,463 1,476 1,466 1,725 304 0 $2,614,188 219 20.46 0.422011-12 1,502 1,433 1,386 1,553 326 0 $3,601,246 227 18.26 0.432010-11 1,582 1,354 1,309 1,468 296 0 $3,489,372 173 17.95 0.44
2012-13 1,830 1,562 1,605 1,830 376 12 $8,873,329 343 20.22 0.572011-12 1,645 1,545 1,728 1,696 444 18 $9,586,009 355 19.02 0.562010-11 1,589 1,559 1,592 1,603 644 21 $10,396,768 266 18.77 0.56
2012-13 2,067 1,581 1,633 1,638 446 68 $10,409,340 606 17.94 0.502011-12 1,721 1,519 1,634 1,514 490 54 $11,444,947 573 16.91 0.522010-11 1,853 1,712 1,696 1,320 432 60 $10,350,479 429 15.38 0.52
2012-13 2,799 3,211 3,734 4,159 1,010 23 $13,498,343 678 21.18 0.522011-12 3,297 3,458 3,804 3,911 925 20 $30,655,961 726 18.87 0.522010-11 3,430 3,380 3,788 3,868 923 20 $28,349,988 470 18.37 0.52
2012-13 1,764 1,709 1,879 2,314 576 86 $22,836,711 417 21.05 0.482011-12 1,823 1,716 2,040 2,146 609 83 $23,159,718 391 18.92 0.482010-11 1,816 1,745 1,919 2,028 630 79 $24,085,480 338 18.28 0.51
2012-13 994 839 915 1,066 417 66 $31,582,168 235 18.05 0.332011-12 976 901 892 1,098 434 72 $31,029,229 228 17.59 0.382010-11 999 861 861 1,081 377 67 $33,644,726 178 17.74 0.38
2012-13 2,135 2,394 2,625 2,887 1,064 259 $51,992,967 492 19.57 0.472011-12 2,324 2,321 2,491 2,724 1,009 271 $55,561,194 521 17.94 0.442010-11 2,241 2,228 2,486 2,678 1,042 256 $62,442,725 263 17.98 0.45
2012-13 3,331 3,864 4,187 4,407 1,607 565 $154,378,165 609 22.77 0.732011-12 3,264 3,844 4,020 4,539 1,583 571 $149,350,434 599 23.38 0.722010-11 3,854 3,925 4,246 4,332 1,515 481 $151,215,597 444 21.92 0.70
FY 2014-15 Outcomes Funding Formula DataUniversities
Academic Year
24 Credit Hours
48 Credit Hours
72 Credit Hours
Bachelor's &
Associate's
Master's & Ed Spec
Doctoral & Law
Research & Service
Transfers Out
Degrees per 100
FTE
Graduation Rate
UTM
APSU
UTK
TTU
UTC
MTSU
ETSU
TSU
UM
Tennessee Higher Education Commission Fact Book 2013-2014 100 Outcomes Funding Formula

Table 4.4
Source: THEC Fiscal Affairs Notes: Data reflect individual year outcomes, not three-year averages. In some instances, the Funding Formula uses slightly different data definitions than other tables included in the Fact Book.
2012-13 2,318 1,801 1,591 1,253 1,002 229 194 381 2,875 561 149,621 17.832011-12 2,351 1,872 1,646 1,155 896 146 105 407 2,849 531 241,977 14.722010-11 2,716 1,969 1,647 1,095 842 123 28 429 2,159 440 163,770 13.32
2012-13 1,060 716 605 615 372 29 153 190 1,023 205 7,596 15.892011-12 1,164 817 659 627 370 49 166 216 944 236 4,014 15.742010-11 1,141 897 744 626 354 39 145 200 836 201 7,276 14.54
2012-13 1,538 1,284 1,012 843 599 52 * 212 1,553 413 63,095 18.712011-12 1,558 1,304 1,050 791 611 47 * 234 1,465 449 54,072 18.192010-11 1,620 1,412 1,140 674 540 51 0 240 1,248 410 67,122 15.29
2012-13 959 625 542 887 300 26 17 121 1,198 242 7,114 14.702011-12 1,039 780 542 803 280 32 11 101 1,157 218 6,027 13.342010-11 1,122 707 530 765 260 15 * 98 857 190 5,909 11.28
2012-13 1,127 899 691 800 509 34 41 357 1,435 294 17,853 18.232011-12 1,194 921 782 815 554 34 25 284 1,408 280 14,019 17.382010-11 1,351 1,010 847 971 576 0 22 279 1,171 288 17,182 15.84
2012-13 1,363 1,044 901 859 568 * 22 73 1,620 499 5,493 18.702011-12 1,410 1,133 962 854 627 0 45 105 1,692 540 8,803 19.122010-11 1,457 1,139 993 787 526 0 28 70 1,440 508 5,513 15.21
2012-13 2,338 1,824 1,611 1,119 624 99 233 363 3,152 638 35,965 11.212011-12 2,305 1,937 1,717 997 718 113 117 335 3,024 675 39,563 12.662010-11 2,375 2,048 1,671 1,092 531 38 107 263 2,491 552 32,948 8.92
2012-13 1,664 1,348 1,125 723 720 104 25 275 2,129 379 6,434 18.362011-12 1,485 1,326 1,217 585 764 110 10 261 1,855 404 6,558 18.652010-11 1,744 1,480 1,262 566 696 132 * 249 1,475 366 5,556 16.66
2012-13 2,823 2,346 1,947 1,213 1,258 0 1,152 310 3,140 840 45,598 16.902011-12 3,001 2,350 2,012 1,525 1,101 0 190 395 2,760 736 46,118 13.972010-11 2,943 2,490 2,092 1,245 932 0 * 189 1,986 614 62,867 11.97
2012-13 1,642 1,256 1,111 1,632 787 77 9 389 1,767 445 116,535 20.242011-12 1,687 1,269 1,107 1,655 804 91 22 391 1,650 486 82,250 19.992010-11 1,784 1,414 1,189 1,372 771 60 31 427 1,342 413 94,910 17.75
2012-13 2,976 2,446 1,911 407 897 63 344 434 4,740 769 75,009 11.902011-12 3,898 3,072 2,360 409 808 49 305 487 4,687 778 74,172 9.032010-11 4,127 3,186 2,348 367 841 63 339 366 3,912 675 53,211 9.40
2012-13 2,037 1,597 1,365 1,792 787 73 399 448 2,426 585 74,639 16.002011-12 2,132 1,684 1,446 1,566 763 88 205 387 2,329 627 95,564 14.662010-11 2,469 1,781 1,490 1,519 723 82 310 278 1,966 536 71,174 13.12
2012-13 1,927 1,311 1,112 1,407 838 14 226 473 1,846 385 194,026 19.372011-12 1,976 1,393 1,173 1,261 791 18 265 544 1,817 479 197,866 17.362010-11 1,988 1,474 1,329 1,011 720 16 256 501 1,545 409 129,099 14.80
Volunteer
Walters
Dyersburg
Jackson
Motlow
Roane
Southwest
Northeast
Pellissippi
Nashville
Chattanooga
Cleveland
Columbia
1-2 Yr. Certificate
Less Than 1 Yr.
Certificate
Job Placements
R&D Success
Transfers Out
12 CreditHours
24 CreditHours
36 Credit Hours
Dual Enrollment Associate's
FY 2014-2015 Outcomes Funding Formula DataCommunity Colleges
Academic Year
Contact Hours
Awards per 100 FTE
Tennessee Higher Education Commission Fact Book 2013-2014 101 Outcomes Funding Formula

Page Intentionally Left Blank
Tennessee Higher Education Commission Fact Book 2013-2014 102 Outcomes Funding Formula
Section 5:
Tennessee Higher Education Commission Fact Book 2013-2014 103 Glossary

Definitions Auxiliary Enterprise: An entity that exists to furnish goods or services to students, faculty, or staff, and that charges a fee directly related to the cost of the goods or services (essentially self-supporting). Examples include: residence halls, food services, college stores, parking garages, etc. Census Date: The traditional date on which the first degree credit headcount and full-time equivalent enrollment reports are generated for all Tennessee public institutions. Beginning Fall 2010, institutions also reported end-of-term data. All headcount and FTE enrollment reports show the historical 14th day census. Table 1.3 provides an end-of-term enrollment figure. Degree Credit: Credit that the institution designates as regular, occupational, certificate, extension or co-op. Formula Units: Academic entities that derive their operating funds from the public higher education funding formula. Includes public universities, community colleges, and colleges of applied technology. Full Time Equivalent (FTE) Enrollment: For undergraduate students, fall term FTE is the total number of credits attempted divided by 12. For graduate students, the fall term FTE is the total number of credits attempted divided by 9. For students in clock hour courses, the academic year FTE is the total number of clock hours divided by 900. Full-Time Student: A student who is enrolled for 12 or more hours of degree credit in a semester. Mandatory Fees: A required fee for all students. Non-Formula Units: Non-academic entities that derive their operating funds from public higher education funding other than the outcomes based formula. Includes all entities other than universities, community colleges, and technology centers. Examples include the UT Veterinary School, the Space Institute, and the Centers of Excellence. Part-Time Student: A student who is enrolled for less than 12 hours of degree credit in a semester. Restricted Current Funds: Funds expendable for operating purposes but restricted by donors or other outside agencies as to the specific purpose for which they must be expended. Southern Regional Education Board (SREB): The nation’s first interstate compact for higher education, the SREB is a coalition of educators, government officials, and civic leaders interested in advancing knowledge and improving the social and economic life of the South. Special Student: At the undergraduate level, a student who does not hold a Bachelor’s or advanced degree and who is not working toward a certificate or degree. At the graduate level, a student who holds a bachelor’s degree or higher, is not working toward a degree and is not a post-doctoral student. Tennessee College of Applied Technology (TCAT): There are 27 colleges of applied technology across the state that are governed by the Board of Regents. The workforce development mission of the TCATs is to give Tennessee residents the opportunity to obtain the technical skills and professional training necessary for advancement in today's competitive job market. The non-credit bearing Regents Online Continuing Education Program (ROCE), the non-credit bearing Special Interest Course, and the Continuing Education Unit (CEU) are excluded from TCAT total headcount. University of Tennessee Health Science Center (UT HSC) FTE: The number of full time students cannot be reliably calculated based on credit hours due to the high (and variable) number of credit hours taken by students in the health professions. Many programs are year round, with ‘semesters’ lasting 6 months, and students are enrolled in a number of sequential courses during this period. In addition, many of the courses involve clerkship experiences requiring 40 hours per week for 4 or more weeks such that credit hours accumulate quickly. Since the curriculum is fixed for most of these programs and students proceed in a lock step manner without options to pursue coursework part time, UT HSC reports FTE based on the number of students enrolled in each of the professional programs. Exceptions that allow for part time students (e.g. in the graduate school and in Nursing) occur in some programs and are tracked for the THEC report.
Tennessee Higher Education Commission Fact Book 2013-2014 104 Glossary
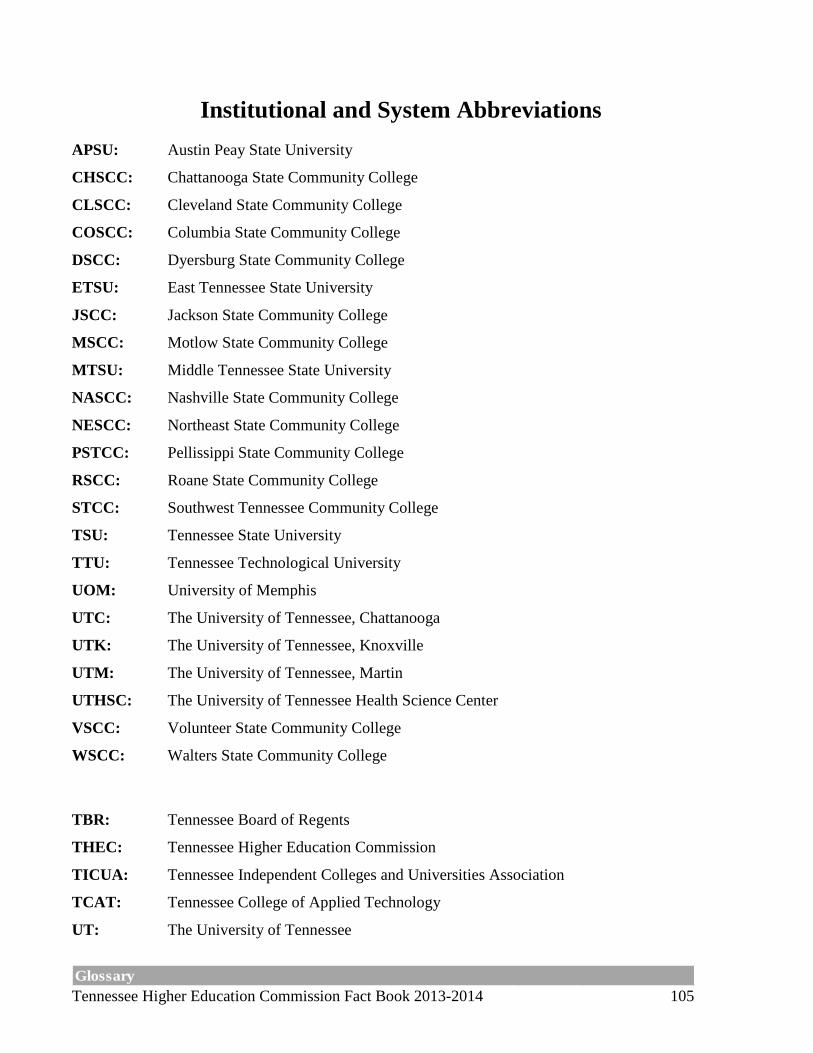
Institutional and System Abbreviations APSU: Austin Peay State University
CHSCC: Chattanooga State Community College
CLSCC: Cleveland State Community College
COSCC: Columbia State Community College
DSCC: Dyersburg State Community College
ETSU: East Tennessee State University
JSCC: Jackson State Community College
MSCC: Motlow State Community College
MTSU: Middle Tennessee State University
NASCC: Nashville State Community College
NESCC: Northeast State Community College
PSTCC: Pellissippi State Community College
RSCC: Roane State Community College
STCC: Southwest Tennessee Community College
TSU: Tennessee State University
TTU: Tennessee Technological University
UOM: University of Memphis
UTC: The University of Tennessee, Chattanooga
UTK: The University of Tennessee, Knoxville
UTM: The University of Tennessee, Martin
UTHSC: The University of Tennessee Health Science Center
VSCC: Volunteer State Community College
WSCC: Walters State Community College
TBR: Tennessee Board of Regents
THEC: Tennessee Higher Education Commission
TICUA: Tennessee Independent Colleges and Universities Association
TCAT: Tennessee College of Applied Technology
UT: The University of Tennessee
Tennessee Higher Education Commission Fact Book 2013-2014 105 Glossary


![Use of Modular Multilevel Cascade Inverter as a …cascaded chopper cells is theoretically possible [6]. When a DSCC is applied to an ac motor drive, the DSCC would suffer from ac-voltage](https://img.dokumen.tips/doc/110x75/5e7ec9f5ac76a82de7313291/use-of-modular-multilevel-cascade-inverter-as-a-cascaded-chopper-cells-is-theoretically.jpg)