Embed Size (px)
Citation preview

PROJECT REPORT
For the
Fauquier, Fairfax, Frederick (MD), and Jefferson County Acquisition and Classification for FEMA Region 3
FY 12 VA LiDAR
And
Final FEMA Region 3 FY 12 VA LiDAR Vertical Accuracy Assessment
USGS Contract:
G12PD00040
Prepared for:
United States Geological Survey
Prepared by:
Dewberry
8401 Arlington Blvd.
Fairfax, VA 22031-4666
Report Date: November 30, 2012

FEMA Region 3 FY 12 VA LiDAR TO #G12PD00040 November 30, 2012 Page 2 of 20
Table of Contents
1 Executive Summary ......................................................................................................................... 3
2 Project Tiling Footprint and Coordinate System ............................................................................... 3
3 LiDAR Acquisition, Calibration and Control Survey Report ................................................................ 4
4 Vertical Accuracy Assessment .......................................................................................................... 4
Classified LiDAR – Vertical Accuracy Results ......................................................................................... 6
Raw LAS Swaths – Vertical Accuracy Results ........................................................................................ 7
DEMs – Vertical Accuracy Results ........................................................................................................ 8
5 LiDAR Processing & Qualitative Assessment ................................................................................... 10
5.1 LiDAR Classification Methodology ................................................................................................ 10
5.2 LiDAR Processing Conclusion ........................................................................................................ 12
5.3 Classified LiDAR QA\QC Checklist ................................................................................................. 12
6 Breakline Production ..................................................................................................................... 14
6.1 Breakline Production Methodology ........................................................................................ 14
6.2 Breakline Qualitative Assessment ........................................................................................... 14
6.3 Breakline Topology Rules ....................................................................................................... 15
6.4 Breakline QA/QC Checklist ..................................................................................................... 15
7 DEM Production & Qualitative Assessment .................................................................................... 17
7.1 DEM Production Methodology ..................................................................................................... 17
7.2 DEM Qualitative Assessment ....................................................................................................... 19
7.3 DEM QA/QC Checklist .................................................................................................................. 19
8 Conclusion ..................................................................................................................................... 20

FEMA Region 3 FY 12 VA LiDAR TO #G12PD00040 November 30, 2012 Page 3 of 20
1 Executive Summary
The primary purpose of this project was to develop a consistent and accurate surface elevation
dataset derived from high-accuracy Light Detection and Ranging (LiDAR) technology for
Fairfax, Fauquier, Frederick, and Jefferson County. The FEMA Region 3 FY 12 LiDAR project
area encompasses 12 counties: Berkeley (WV), Clarke (VA), Fairfax (VA), Fauquier (VA),
Frederick (MD), Frederick (VA), Jefferson (WV), Loudoun (VA), Morgan (WV), Washington
(MD), Allegany (MD), and St. Mary/Golden Beach (MD). The deliverables, as required in the
task order, are classified point cloud data (LAS), raw swath cloud data, hydro-flattened bare-
earth DEMs, breaklines, metadata, and reports. This report documents the development of the
deliverable products, including the planning, acquisition, and processing of the LiDAR data as
well as the derivation of LiDAR products.
Dewberry served as the prime contractor for the project. In addition to project management,
Dewberry was responsible for LiDAR classification, breakline production, DEM development
and quality assurance. Dewberry’s staff performed the final post-processing of the LAS files for
the project, produced the breaklines used to enhance the LiDAR-derived surface, generated the 1
meter DEMs, and performed quality assurance inspections on all subcontractor generated data
and reports. GeoDigital International, Inc. (Geodigital) performed the LiDAR data acquisition
including data calibration. Their reports can be found in the separate Appendices.
This report covers the counties of Fauquier, Fairfax, Frederick (MD), and Jefferson, which were
produced as one delivery lot.
2 Project Tiling Footprint and
Coordinate System
The LiDAR delivery consists of two thousand
one hundred and fifty (2,150) tiles (Figure 1).
Each tile’s extent is 1500 meters by 1500
meters. This conforms to the US National
Grid.
The projection information is:
Horizontal Datum: NAD83
Vertical Datum: NAVD88
Projection: UTM
Zone: 18N
Units (Horizontal & Vertical): Meters
Geoid: Geoid09
Figure 1 - Tile grid and project boundary of the delivered
area.

FEMA Region 3 FY 12 VA LiDAR TO #G12PD00040 November 30, 2012 Page 4 of 20
3 LiDAR Acquisition, Calibration and Control Survey Report
The LiDAR acquisition was completed in forty six flight missions between February 15th
and
April 14th
. Geodigital provided an Acquisition Report (located in separate Appendix A)
documenting all of the steps in their acquisition process. Their report includes the LiDAR
collection parameters, planned flight path maps, flight line trajectories, forward/reverse or
combined separation plots, estimated position accuracy reports, and the flight log. Geodigital’s
Geodetic Control Survey Report (located in separate Appendix B) contains a thorough review of
control used, including the final coordinates of the control, a map of the fully constrained control
network, details of the constrained GPS network, new control station descriptions, and published
control station descriptions. Geodigital’s LiDAR Data Calibration Report (located in separate
Appendix C) contains details of the LiDAR data processing and calibration as well as their
vertical accuracy assessment.
4 Vertical Accuracy Assessment
Prior to delivery of acquired LiDAR data to Dewberry, Geodigital verified that the data met
fundamental accuracy requirements (vertical accuracy NSSDA RMSEZ = 12.5cm, NSSDA
AccuracyZ 95% = 24.5 cm) or better; in open, non-vegetated terrain) when compared to
kinematic and static GPS checkpoints.
The LiDAR dataset was tested by Geodigital to 0.1207m vertical accuracy at the 95% confidence
level based on consolidated RMSEz (0.0615m x 1.9600) when compared to 100 GPS static check
points.
Dewberry then independently collected survey checkpoints and used those checkpoints to verify
the accuracy of the LiDAR. Figure 2 shows the distribution of these check points throughout
entire FEMA Region 3 FY 2012 VA LiDAR project area.
FEMA Region 3 FY 12 VA LiDAR TO #G12PD00040 November 30, 2012 Page 5 of 20
e
Figure 2 – Checkpoint Map shows that checkpoints are well distributed throughout project area.
FEMA’s “Guidelines and Specifications for Flood Hazard Mapping Partners” contains Appendix
A, Guidance for Aerial Mapping and Surveying, which requires a minimum of 60 test points; 20
checkpoints each in a minimum of three land cover categories representative of the floodplain.
FEMA’s Procedure Memorandum No. 61,“Standards for Lidar and Other High Quality Digital
Topography”, specifies that the positional accuracy of LiDAR shall be in accordance with
ASPRS/NDEP standards for accuracy testing as well as the USGS “Lidar Guidelines and Base
Specifications, v13.” All of these standards and guidelines require testing for Fundamental
Vertical Accuracy (FVA), Supplemental Vertical Accuracy (SVA), and Consolidated Vertical
Accuracy (CVA), using a minimum of 20 checkpoints each in a minimum of three land cover
categories for a minimum total of 60 QA/QC checkpoints.
FVA (Fundamental Vertical Accuracy) is determined with check points located only in the open
terrain land cover category (grass, dirt, sand, and/or rocks) , where there is a very high
probability that the LiDAR sensor will have detected the bare-earth ground surface and where
random errors are expected to follow a normal error distribution. The FVA determines how well
the calibrated LiDAR sensor performed. With a normal error distribution, the vertical accuracy

FEMA Region 3 FY 12 VA LiDAR TO #G12PD00040 November 30, 2012 Page 6 of 20
at the 95% confidence level is computed as the vertical root mean square error (RMSEz) of the
checkpoints x 1.9600. The second method of testing vertical accuracy, endorsed by the National
Digital Elevation Program (NDEP) and American Society for Photogrammetry and Remote
Sensing (ASPRS) uses the 95th percentile to report vertical accuracy in each of the other land
cover categories (defined as Supplemental Vertical Accuracy – SVA) and all land cover
categories combined (defined as Consolidated Vertical Accuracy – CVA). The 95th percentile
method is used when vertical errors may not follow a normal error distribution, as in vegetated
terrain.
For the FEMA Region 3 FY 12 LiDAR project, the scope of work required FVA (Accuracyz at
the 95% confidence level) to be 24.5 cm or less based on an RMSEZ of 12.5 cm x 1.9600. FVA
is to be tested in open, non-vegetated terrain against the raw-swath LAS, classified LAS, and
DEMs. The CVA is required to be 36.3 cm or less based on the 95th
percentile. The CVA is to
be tested in all land cover categories against both the classified LAS and DEMs. The SVA has
target values of 36.3 cm based on the 95th
percentile. SVA is tested in individual land cover
categories against both the classified LAS and DEMs. Individual land cover categories may
exceed the target SVA value as long as the overall CVA is within specified tolerances.
The following sections contain tables that list the vertical accuracy results for classified LAS,
raw-swath LAS, and the DEMs. The tables represent consolidated calculations for the entire
FEMA Region 3 FY 12 LiDAR project area.
Classified LiDAR – Vertical Accuracy Results
The RMSEZ is 0.10 meters in open terrain which meets the project specifications of 0.125
meters. The fundamental vertical accuracy is 0.20 meters which meets the project specifications
of 0.245. The consolidated vertical accuracy is 0.26 meters which meets project specifications of
0.363 meters. All individual land cover categories meet the specified target SVA value of 0.363
meters. Additional details and the supplemental vertical accuracy for each land cover category
can be found in the tables below.
Table 1 – Overall Descriptive Statistics for Checkpoints– Classified LAS
100 % of Totals
RMSEZ (m)
Spec = 0.125 m1
Mean
(m)
Median
(m)
Skew
Std
Dev
(m)
# of
Points
Min
(m)
Max
(m)
Consolidated 0.09 0.09 -0.04 0.09 206 -0.19 0.43
Open Terrain 0.10 0.06 0.07 -0.89 0.08 42 -0.19 0.21
Weeds/Crop 0.11 0.12 -0.58 0.09 40 -0.13 0.27
Forest 0.10 0.09 0.96 0.10 41 -0.08 0.43
Urban 0.04 0.04 -0.44 0.08 42 -0.15 0.17
Brush/Low Trees 0.13 0.12 0.08 0.08 41 -0.06 0.32 1Specification for Open Terrain points only.

FEMA Region 3 FY 12 VA LiDAR TO #G12PD00040 November 30, 2012 Page 7 of 20
Table 2 – FVA, SVA, and CVA values for the FEMA Region 3 FY 12 LiDAR project area – Classified LAS
Land Cover
Category # of Points
FVA ―
Fundamental
Vertical Accuracy
(RMSEz x 1.9600)
Spec = 0.245 m
CVA ―
Consolidated
Vertical
Accuracy (95th
Percentile) Spec
= 0.363 m
SVA ―
Supplemental Vertical
Accuracy (95th
Percentile)
Target = 0.363 m
Consolidated 206 0.23
Open Terrain 42 0.20
Weeds/Crop 40 0.25
Forest 41 0.22
Urban 42 0.16
Brush/Low Trees 41 0.24
Table 3 lists the 5% outliers that are larger than the 95th percentile.
Table 3 – 5% Outliers
Point ID
NAD83 UTM North Zone 18 NAVD88
LiDAR - Z (m) Delta Z Absolute
Delta Z Easting - X (m) Northing - Y (m) Survey -Z (m)
FO-29 755459.7339 4372316.654 191.339 191.7665 0.428 0.428
FO-13 262788.713 4328245.526 148.797 149.1241 0.327 0.327
GWC-2 684933.142 4383704.807 237.873 238.1968 0.324 0.324
BLT-2 683019.169 4379885.971 224.116 224.3864 0.270 0.270
BLT-3 682091.319 4388365.356 757.8 758.0639 0.264 0.264
GWC-4 695966.537 4396012.540 244.038 244.2962 0.258 0.258
BLT-27 282010.403 4347175.963 80.737 80.9898 0.253 0.253
BLT-8 731867.5678 4379348.031 338.871 339.1169 0.246 0.246
GWC-15 312631.445 4372113.523 142.413 142.6548 0.242 0.242
GWC-9 725834.3024 4374157.517 188.218 188.4491 0.231 0.231
Raw LAS Swaths – Vertical Accuracy Results
The RMSEZ is 0.11 meters in open terrain which meets project specifications of 0.125 meters.
The fundamental vertical accuracy is 0.21 meters which meets project specifications of 0.245
meters. Additional details can be found in the tables below.

FEMA Region 3 FY 12 VA LiDAR TO #G12PD00040 November 30, 2012 Page 8 of 20
Table 4 – Overall Descriptive Statistics for Checkpoints– Raw-Swath LAS
100 % of Totals
RMSEZ (m)
Spec=0.125 m
Mean
(m)
Median
(m) Skew
Std Dev
(m)
# of
Points
Min
(m)
Max
(m)
Open Terrain 0.11 0.07 0.07 -0.86 0.08 42 -0.19 0.21
Table 5 – FVA value for FEMA Region 3 FY 12 LiDAR project area – Raw-Swath LAS
Land Cover Category # of Points FVA ― Fundamental VerAcal Accuracy
(RMSEZ x 1.9600) Spec = 0.245 m
Open Terrain 42 0.21
DEMs – Vertical Accuracy Results
The RMSEZ is 0.10 meters in open terrain which meets project specifications of 0.125 meters.
The fundamental vertical accuracy is 0.19 meters which meets project specifications of 0.245
meters. The consolidated vertical accuracy is 0.23 meters which meets project specifications of
0.363 meters. All individual land cover categories meet the specified target SVA value of 0.363
meters. Additional details and the supplemental vertical accuracy for each land cover category
can be found in the tables below.
Table 6 – Overall Descriptive Statistics for Checkpoints– DEMs
100 % of Totals
RMSEZ (m)
Spec = 0.125 m1
Mean
(m)
Median
(m)
Skew
Std
Dev
(m)
# of
Points
Min
(m)
Max
(m)
Consolidated 0.09 0.09 0.10 0.09 206 -0.17 0.43
Open Terrain 0.10 0.06 0.07 -0.88 0.08 42 -0.17 0.21
Weeds/Crop 0.11 0.13 -0.29 0.09 40 -0.12 0.33
Forest 0.10 0.11 1.01 0.09 41 -0.09 0.43
Urban 0.04 0.05 -0.36 0.07 42 -0.14 0.18
Brush/Low Trees 0.13 0.11 0.08 0.08 41 -0.03 0.32 1Specification for Open Terrain points only.

FEMA Region 3 FY 12 VA LiDAR TO #G12PD00040 November 30, 2012 Page 9 of 20
Table 7 –FVA, SVA, and CVA values for FEMA Region 3 FY 12 LiDAR project area – DEM
Land Cover
Category # of Points
FVA ―
Fundamental
Vertical Accuracy
(RMSEz x 1.9600)
Spec = 0.245 m
CVA ―
Consolidated
Vertical
Accuracy (95th
Percentile) Spec
= 0.363 m
SVA ―
Supplemental Vertical
Accuracy (95th
Percentile)
Target = 0.363 m
Consolidated 206 0.23
Open Terrain 42 0.19 0.17
Weeds/Crop 40 0.26
Forest 41 0.21
Urban 42 0.16
Brush/Low Trees 41 0.26
Table 8 lists the 5% outliers that are larger than the 95th percentile.
Table 8 – 5% Outliers
Point ID
NAD83 UTM North Zone 18 NAVD88
LiDAR - Z (m) Delta Z Absolute
Delta Z Easting - X (m) Northing - Y (m) Survey -Z (m)
FO-29 4372492.434 239263.05 191.339 191.768691 0.430 0.430
BLT-2 4384876.251 167452.274 224.116 224.441614 0.326 0.326
FO-13 4328245.526 262788.713 148.797 149.120044 0.323 0.323
GWC-2 4388562.37 169618.725 237.873 238.192895 0.320 0.320
BLT-27 4347175.963 282010.403 80.737 81.00413 0.267 0.267
GWC-15 4372113.523 312631.445 142.413 142.679241 0.266 0.266
BLT-3 4393406.772 167091.974 757.8 758.057243 0.257 0.257
GWC-4 4400115.416 181459.659 244.038 244.294399 0.256 0.256
BLT-7 218113.787 4397103.694 275.667 275.909379 0.242 0.242
GWC-9 4374157.517 725834.3024 188.218 188.449421 0.231 0.231
Based on the vertical accuracy testing conducted by Geodigital and Dewberry, the LiDAR
dataset for FEMA Region 3 FY 12 LiDAR project satisfies the pre-defined vertical accuracy
criteria.

FEMA Region 3 FY 12 VA LiDAR TO #G12PD00040 November 30, 2012 Page 10 of 20
5 LiDAR Processing & Qualitative Assessment
5.1 LiDAR Classification Methodology
The LiDAR is tiled into 1500 m x 1500 m tiles named using the US National Grid tiling scheme.
The data were processed using GeoCue and TerraScan software. The initial step was to setup the
GeoCue project, which is done by importing the project defined tile boundary index. The
acquired 3D laser point clouds, in LAS binary format, were imported into the GeoCue project
and divided into tiles. Once tiled, the laser points were tested to ensure calibration accuracy
from flightline to flightline. This check was done by creating a set of deltaZ ortho images. This
process measured the relative accuracy between flight lines, or how well one flight line fits an
overlapping flight line vertically. No issues were found during this step.
After the above checks, the data was classified using a proprietary routine in TerraScan. This
routine classified out any obvious outliers from the dataset. The ground layer was then extracted
from the point cloud. The ground extraction process encompassed in this routine takes place by
building an iterative surface model. This surface model was generated using three main
parameters: building size, iteration angle, and iteration distance. The initial model was based on
low points being selected by a "roaming window" with the assumption that these are the ground
points. The size of this roaming window was determined by the building size parameter. The low
points were triangulated and the remaining points were evaluated and subsequently added to the
model if they met the iteration angle and distance constraints. This process was repeated until no
additional points were added within iterations. A second critical parameter was the maximum
terrain angle constraint, which determined the maximum terrain angle allowed within the
classification model.
Once the automated classification finished, each tile was imported into TerraScan and a surface
model was created to examine the ground classification. Low lying buildings, porches, bridges,
and small vegetation artifacts are often not caught during automated classification. These errors
were inspected and edited during this step. Dewberry analysts visually reviewed the ground
surface model and corrected errors in the ground classification, such as vegetation and buildings
that are present following the initial processing. Dewberry analysts employed 3D visualization
techniques to view the point cloud at multiple angles and in profile to ensure that non-ground
points were removed from the ground classification.
After the ground classification corrections were complete, the dataset was processed through a
water classification routine that utilized the breaklines compiled by Dewberry to automatically
classify hydrographic features. The water classification routine selects points within the
breakline polygon and automatically classifies them as class 9, water. The water classification
routine also buffers the breakline polygon by 2 feet and classifies points with that buffered
polygon to class 10, ignored ground for DEM production. The ground class for this data set is

FEMA Region 3 FY 12 VA LiDAR TO #G12PD00040 November 30, 2012 Page 11 of 20
comprised of Class 2. Once the data classification was finalized, the LAS format 1.0 format
points were converted to LAS 1.2 Point Data Record Format 1 and converted to the required
ASPRS classification scheme.
• Class 1 = Unclassified, and used for all other features that do not fit into the Classes 2, 7,
9, or 10, including vegetation, buildings, etc.
• Class 2 = Ground
• Class 7 = Noise
• Class 9 = Water
• Class 10 = Ignored Ground due to breakline proximity.
• Class 11 = Withheld
The following fields within the LAS files are populated to the following precision:
• GPS Time (0.000001 second precision)
• Easting (0.01 meter precision)
• Northing (0.01 meter precision)
• Elevation (0.01 meter precision)
• Intensity (integer value - 12 bit dynamic range)
• Number of Returns (integer - range of 1-4)
• Return number (integer range of 1-4)
• Scan Direction Flag (integer - range 0-1)
• Classification (integer)
• Scan Angle Rank (integer)
• Edge of flight line (integer, range 0-1)
• User bit field (integer - flight line information encoded)
The LAS file also contains a Variable length record in the file header that defines the spatial
reference information:
Horizontal Datum: NAD83
Vertical Datum: NAVD88
Projection: UTM
Zone: 18N
Units (Horizontal & Vertical): Meters
Geoid: Geoid09
Following the completion of LiDAR point classification, the Dewberry qualitative assessment
process flow for the project incorporated the following reviews:
1. Format: Using TerraScan, Dewberry verified that all points were classified into valid
classes according to project specifications.

FEMA Region 3 FY 12 VA LiDAR TO #G12PD00040 November 30, 2012 Page 12 of 20
a. LAS format 1.2, point data record format 1
b. All points contain populated intensity values.
c. All LAS files contain Variable Length Records with georeferencing
information.
d. All LiDAR points in the LAS files are classified in accordance with project
specifications.
2. Spatial Reference Checks: The LAS files were imported into the GeoCue processing
environment. As part of the Dewberry process workflow, the GeoCue import
produced a minimum bounding polygon for each data file. This minimum bounding
polygon was one of the tools used in conjunction with the statistical analysis to verify
spatial reference integrity.
a. No issues were identified with the spatial referencing of this dataset.
3. Data density, data voids: The LAS files are used to produce Digital Elevation Models
using the commercial software package “QT Modeler” which creates a 3-dimensional
data model derived from ground points in the LAS files. Grid spacing is based on the
project density deliverable requirement for un-obscured areas.
a. Acceptable voids (areas with no LiDAR returns in the LAS files) that are
present in the majority of LiDAR projects include voids caused by bodies of
water. These are considered to be acceptable voids.
b. Dewberry identified no unacceptable data voids within the dataset.
4. Bare earth quality: Dewberry assured the cleanliness of the bare earth during
classification by removing all artifacts, including vegetation, buildings, bridges, and
other features not valid for inclusion in the ground surface model.
5.2 LiDAR Processing Conclusion
Based on the procedures and quality assurance checks, the classification conforms to project
specifications set by the scope of work. All issues found during the qualitative QC were
resolved. The dataset conforms to project specifications for format and header values.
The quality control steps taken by Dewberry to assure the classified LAS meet project
specifications are outlined in the QA Checklist below.
.
5.3 Classified LiDAR QA\QC Checklist
Overview
Correct number of files delivered and all files adhere to project format specifications
LAS statistics are run to check for inconsistencies

FEMA Region 3 FY 12 VA LiDAR TO #G12PD00040 November 30, 2012 Page 13 of 20
Dewberry quantitative review process is completed
Dewberry qualitative review process is completed
Create LAS extent geometry
Data Inventory and Coverage
All tiles present and labeled according to the project tile grid
Dewberry Quantitative Review Process
LAS statistics review:
LAS format 1.2
Point data record format 1
Georeference information is populated and accurate
- NAD1983 UTM Zone18N, meters
- NAVD88 - Geoid09 (Meters)
GPS time recorded as Adjusted GPS Time, with 0.01 precision
Points have intensity values
Files contain multiple returns (minimum First, Last, and one Intermediate)
Scan angle < 40°
Data meets Nominal Pulse Spacing requirement: <=0.5 meters
Tested on single swath, first return data only;
Tested on geometrically usable portion (90%) of swath
Data passes Geometric Grid Data Density Test
Tested on 1 meter grid
Tested on first return data only
At least 90% of grid cells contain at least 1 point
Data tested for vertical accuracy
Checkpoint inventory

FEMA Region 3 FY 12 VA LiDAR TO #G12PD00040 November 30, 2012 Page 14 of 20
Vertical accuracy assessment. LiDAR tested to meet requirements.
Completion Comments: Complete – Approved
6 Breakline Production
6.1 Breakline Production Methodology
Dewberry used GeoCue software to develop LiDAR stereo models of the project area so the
LiDAR derived data could be viewed in 3-D stereo using Socet Set softcopy photogrammetric
software. Using LiDARgrammetry procedures with LiDAR intensity imagery, Dewberry stereo-
compiled the five types of hard breaklines in accordance with the project’s Data Dictionary. All
drainage breaklines were monotonically enforced to show downhill flow. Water bodies were
reviewed in stereo and the lowest elevation was applied to the entire waterbody.
6.2 Breakline Qualitative Assessment
Dewberry completed breakline qualitative assessments according to a defined workflow. The
following workflow diagram represents the steps taken by Dewberry to provide a thorough
qualitative assessment of the breakline data (Figure 3).
Figure 3 – Breakline Workflow
FEMA Region 3 FY 12 VA LiDAR TO #G12PD00040 November 30, 2012 Page 15 of 20
6.3 Breakline Topology Rules
Automated checks were applied on hydro features to validate the 3D connectivity of the feature
and the monotonicity of the hydrographic breaklines. Dewberry’s major concern was that the
hydrographic breaklines have a continuous flow downhill and that breaklines do not undulate.
Error points were generated at each vertex not complying with the tested rules and these
potential edit calls were then visually validated during the visual evaluation of the data. This step
also helped validate that breakline vertices did not have excessive minimum or maximum
elevations and that elevations were consistent with adjacent vertex elevations.
The next step was to compare the elevation of the breakline vertices against the elevation
extracted from the ESRI Terrain built from the LiDAR ground points, keeping in mind that a
discrepancy is expected because of the hydro-enforcement applied to the breaklines and because
of the interpolated imagery used to acquire the breaklines. A given tolerance was used to ensure
that the elevations did not differ drastically from the LiDAR.
Dewberry’s final check for the breaklines was to perform a full qualitative analysis. Dewberry
compared the breaklines against LiDAR intensity images to ensure breaklines were captured in
the required locations. The quality control steps taken by Dewberry are outlined in the QA
Checklist below.
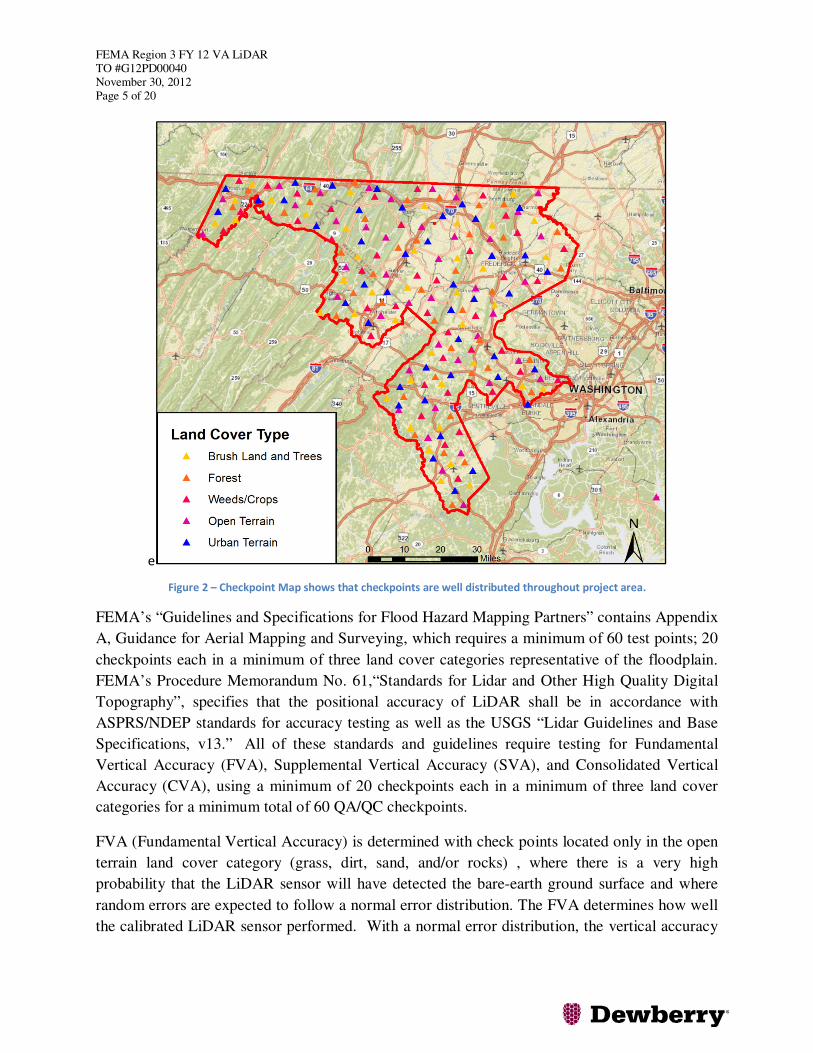
6.4 Breakline QA/QC Checklist
Overview
All Feature Classes are present in a geodatabase (GDB)
All features have been loaded into the GDB correctly. Ensure feature classes with
subtypes are domained correctly.
The breakline topology inside of the GDB has been validated. See Data Dictionary for
specific rules
Projection/coordinate system of GDB is accurate with project specifications
Perform Completeness check on breaklines using either intensity or ortho imagery
Check entire dataset for missing features that were not captured, but should be to meet
baseline specifications or for consistency (See Data Dictionary for specific collection
rules). NHD data will be used to help evaluate completeness of collected hydrographic
features. Features should be collected consistently across tile bounds within a dataset as
well as be collected consistently between datasets.

FEMA Region 3 FY 12 VA LiDAR TO #G12PD00040 November 30, 2012 Page 16 of 20
Check to make sure breaklines are compiled to correct tile grid boundary and there is full
coverage without overlap
Check to make sure breaklines are correctly edge-matched to adjoining datasets if
applicable. Ensure breaklines from one dataset join breaklines from another dataset that
are coded the same and all connecting vertices between the two datasets match in X,Y,
and Z (elevation). There should be no breaklines abruptly ending at dataset boundaries
and no discrepancies of Z-elevation in overlapping vertices between datasets.
Compare Breakline Z elevations to LiDAR elevations
Using a terrain created from LiDAR ground points and water points and GeoFIRM tools,
drape breaklines on terrain to compare Z values. Breakline elevations should be at or
below the elevations of the immediately surrounding terrain. Z value differences should
generally be limited to within 1 FT. This should be performed before other breakline
checks are completed.
Perform automated data checks using PLTS
The following data checks were performed utilizing ESRI’s PLTS extension. These checks
allowed automated validation of 100% of the data. Error records were either written to a table
for future correction, or browsed for immediate correction. PLTS checks should always be
performed on the full dataset.
Perform “adjacent vertex elevation change check” on the Inland Ponds feature class
(Elevation Difference Tolerance=.001 meters). This check will return Waterbodies
whose vertices are not all identical. This tool is found under “Z Value Checks.”
Perform “unnecessary polygon boundaries check” on waterbodies and Streams feature
classes. This tool is found under “Topology Checks.”
Perform “duplicate geometry check”. Attributes do not need to be checked during this
tool. This tool is found under “Duplicate Geometry Checks.”
Perform “geometry on geometry check”. Spatial relationship is contains, attributes do
not need to be checked. This tool is found under “Feature on Feature Checks.”
Perform “polygon overlap/gap is sliver check”. Maximum Polygon Area is not required.
This tool is found under “Feature on Feature Checks.”
Perform Dewberry Proprietary Tool Checks

FEMA Region 3 FY 12 VA LiDAR TO #G12PD00040 November 30, 2012 Page 17 of 20
Perform monotonicity check on inland streams features using
“A3_checkMonotonicityStreamLines.” This tool looks at line direction as well as
elevation. Features in the output shapefile attributed with a “d” are correct
monotonically, but were compiled from low elevation to high elevation. These errors can
be ignored. Features in the output shapefile attributed with an “m” are not correct
monotonically and need elevations to be corrected. Input features for this tool need to be
in a geodatabase. Z tolerance is .01 meters. Polygons need to be exported as lines for the
monotonicity tool.
Perform connectivity check between (tidal waters to inland streams), (tidal waters to
inland ponds), (inland ponds to inland streams) using the tool
“07_CheckConnectivityForHydro.” The input for this tool needs to be in a geodatabase.
The output is a shapefile showing the location of overlapping vertices from the polygon
features and polyline features that are at different Z-elevation. The unnecessary polygon
boundary check must be run and all errors fixed prior to performing connectivity check.
If there are exceptions to the polygon boundary rule then that feature class must be
checked against itself, i.e. inland streams to inland streams.
Completion Comments: Complete – Approved
7 DEM Production & Qualitative Assessment
7.1 DEM Production Methodology
Dewberry used ESRI and Global Mapper software for the DEM production and QC process.
ArcGIS software was used to generate the products and the QC was performed in both ArcGIS
and Global Mapper. The DEM workflow is shown in Figure 4 and described below.

FEMA Region 3 FY 12 VA LiDAR TO #G12PD00040 November 30, 2012 Page 18 of 20
Figure 4 – Dewberry’s DEM Workflow
1. Classify Water Points: LAS point falling within hydrographic breaklines shall be
classified to ASPRS class 9 using TerraScan. Breaklines must be prepared correctly prior
to performing this task.
2. Classify Ignored Ground Points: Classify points in close proximity to the breaklines
from Ground to class 10 (Ignored Ground). Close proximity will be defined as equal to
the nominal point spacing on either side of the breakline. Breaklines will be buffered
using this specification and the subsequent file will need to be prepared in the same
manner as the water breaklines for classification. This process will be performed after
the water points have been classified and only run on remaining ground points.
3. Terrain Processing: A Terrain will be generated using the Breaklines and LAS data that
has been imported into ArcGIS as a Multipoint File. If the final DEMs are to be clipped
to a project boundary that boundary will be used during the generation of the Terrain.
4. Create DEM Zones for Processing: Create DEM Zones that are buffered by 14m around
the edges. Zones should be created in a logical manner to minimize the number of zones
without creating zones to large for processing. Dewberry will make zones no larger than

FEMA Region 3 FY 12 VA LiDAR TO #G12PD00040 November 30, 2012 Page 19 of 20
200 square miles (taking into account that a DEM will fill in the entire extent not just
where LiDAR is present). Once the first zone is created it must be verified against the
tile grid to ensure that the cells line up perfectly with the tile grid edge.
5. Convert Terrain to Raster: Convert Terrain to raster using the DEM Zones created in
step 4. Utilizing the natural neighbors interpolation method. In the environmental
properties set the extents of the raster to the buffered Zone. For each subsequent zone,
the first DEM will be utilized as the snap raster to ensure that zones consistently snap to
one another.
6. Perform Initial QAQC on Zones: During the initial QA process anomalies will be
identified and corrective polygons will be created.
7. Correct Issues on Zones: Corrections on zones will be performed following Dewberry’s
in-house correction process.
8. Extract Individual Tiles: Individual Tiles will be extracted from the zones utilizing the
Dewberry created tool.
9. Final QA: Final QA will be performed on the dataset to ensure that tile boundaries are
seamless.
7.2 DEM Qualitative Assessment
Dewberry performed a comprehensive qualitative assessment of the DEM deliverables to ensure
that all tiled DEM products were delivered with the proper extents, were free of processing
artifacts, and contained the proper referencing information. This process was performed in
ArcGIS software with the use of a tool set Dewberry developed to verify that the raster extents
match those of the tile grid and contain the correct projection information. The DEM data was
reviewed at a scale of 1:5000 to scan for artifacts caused by the DEM generation process and to
examine the hydro-flattened features. To perform this review, Dewberry created HillShade
models and overlaid a partially transparent colorized elevation model. Upon completion of this
review, the DEM data was loaded into Global Mapper to ensure that all files were readable and
that no artifacts existed between tiles.
The quality control steps taken by Dewberry are outlined in the QA Checklist below.
7.3 DEM QA/QC Checklist
Overview
Correct number of files is delivered and all files are in IMG Format
All files are visually inspected to be free of artifacts and processing anomalies
DEM extent geometry shapefile is created
Review
All files are tiled with a 1 meter cell size

FEMA Region 3 FY 12 VA LiDAR TO #G12PD00040 November 30, 2012 Page 20 of 20
Georeference information is populated and accurate
NAD1983 UTM Zone18N, meters
Vertical accuracy is verified by comparing the LAS to the DEM
Water Bodies, wide streams and rivers and other non-tidal water bodies as defined in Section
III are hydro-flattened within the DEM
Manually review bare-earth DEMs with a hillshade to check for processing issues or any
general anomalies enforcement process or any general anomalies that may be present
Completion Comments: Complete – Approved
8 Conclusion
Dewberry was contracted for the collection and processing of LiDAR data and the creation of
LiDAR-derived products for this project. The LiDAR data were required to meet a Fundamental
Vertical Accuracy of 0.245 meters. Based on Dewberry’s many quality control checks including
the use of independently collected checkpoints, the data meets this specification. The LiDAR
data tested 0.20 m at the 95% confidence level in open terrain. Dewberry’s many quality control
checks ensure the data meet not only quantitative requirements, but qualitative requirements as
well. Based on the scope of work, all delivered products for the project conform to the required
specifications.
This is the final deliverable lot for the FEMA Region 3 FY 12 VA LiDAR project. Once this lot
has been accepted by USGS, Dewberry will submit DEMs of the requested counties in a state
plan coordinate system. The DEMs will conform to the Orthophotography and high-resolution
elevation tile grid developed by the Virginia Geographic Information Network.


![[대학내일20대연구소]201211 창업을대하는대학생들의생각을엿보다(20121127)](https://img.dokumen.tips/doc/110x75/55a424931a28abae278b48af/20201211-20121127.jpg)