Embed Size (px)
Citation preview

2012 ANNUAL REPORT

STABILITYGROWTH
PCA IS THE fourth largest PRODUCER OF CONTAINERBOARD AND CORRUGATED PRODUCTS IN THE UNITED
STATES, WITH 2012 net sales OF $2.8 billion. OUR NETWORK INCLUDES 4 CONTAINERBOARD MILLS AND 71 BOX
PLANTS STRATEGICALLY LOCATED ACROSS THE COUNTRY. PCA’S COMMON STOCK IS LISTED ON THE NEW YORK
STOCK EXCHANGE UNDER THE TICKER SYMBOL “PKG.”
AT PACKAGING CORPORATION OF AMERICA, WE ARE focused ON A single line of business, AND IT SHOWS.
THE CORNERSTONE OF OUR BUSINESS IS THE relationship BETWEEN OUR customers AND OUR people.
OUR SUCCESS IS MADE POSSIBLE BY A HIGHLY ENGAGED, results-oriented workforce OPERATING IN AN
entrepreneurial culture AND IS DRIVEN BY adding value TO OUR CUSTOMERS’ BUSINESSES.
UNITED STATES SECURITIES AND EXCHANGE COMMISSIONWashington, D.C. 20549
Form 10-KANNUAL REPORT PURSUANT TO SECTION 13 OR 15(d)
OF THE SECURITIES EXCHANGE ACT OF 1934For the fiscal year ended December 31, 2012
Commission file number 1-15399
PACKAGING CORPORATION OF AMERICA(Exact Name of Registrant as Specified in its Charter)
Delaware 36-4277050(State or Other Jurisdiction of
Incorporation or Organization)(I.R.S. Employer
Identification No.)
1955 West Field Court, Lake Forest, Illinois 60045(Address of Principal Executive Offices) (Zip Code)
Registrant’s telephone number, including area code(847) 482-3000
Securities registered pursuant to Section 12(b) of the Act:
Title of Each ClassName of Each Exchange
on Which Registered
Common Stock, $0.01 par value New York Stock ExchangeSecurities registered pursuant to Section 12(g) of the Act:
None
Indicate by check mark if the Registrant is a well-known seasoned issuer, as defined in Rule 405 of the SecuritiesAct. Yes Í No ‘
Indicate by check mark if the Registrant is not required to file reports pursuant to Section 13 or Section 15(d) of theAct. Yes ‘ No Í
Indicate by check mark whether the Registrant (1) has filed all reports required to be filed by Section 13 or 15(d) of the SecuritiesExchange Act of 1934 during the preceding 12 months (or for such shorter period that the Registrant was required to file such reports),and (2) has been subject to such filing requirements for the past 90 days. Yes Í No ‘
Indicate by check mark whether the registrant has submitted electronically and posted on its corporate Web site, if any, everyInteractive Data File required to be submitted and posted pursuant to Rule 405 of Regulation S-T during the preceding 12 months (or forsuch shorter period that the registrant was required to submit and post such files). Yes Í No ‘
Indicate by check mark if disclosure of delinquent filers pursuant to Item 405 of Regulation S-K is not contained herein, and will notbe contained, to the best of Registrant’s knowledge, in definitive proxy or information statements incorporated by reference in Part III ofthis Form 10-K or any amendment to this Form 10-K. Í
Indicate by check mark whether the registrant is a large accelerated filer, an accelerated filer, a non-accelerated filer, or a smallerreporting company. See the definitions of “large accelerated filer,” “accelerated filer” and “smaller reporting company” in Rule 12b-2 ofthe Exchange Act. (Check one):Large accelerated filer Í Accelerated filer ‘ Non-accelerated filer ‘ Smaller reporting company ‘
(Do not check if a smaller reporting company)Indicate by check mark whether the Registrant is a shell company (as defined in Rule 12b-2 of the Exchange
Act). Yes ‘ No Í
At June 30, 2012, the last business day of the Registrant’s most recently completed second fiscal quarter, the aggregate market valueof the Registrant’s common equity held by nonaffiliates was approximately $2,713,990,063 based on the closing sale price as reported onthe New York Stock Exchange. This calculation of market value has been made for the purposes of this report only and should not beconsidered as an admission or conclusion by the Registrant that any person is in fact an affiliate of the Registrant.
On February 22, 2013, there were 98,175,675 shares of Common Stock outstanding.DOCUMENTS INCORPORATED BY REFERENCE
Specified portions of the Proxy Statement for the Registrant’s 2013 Annual Meeting of Stockholders are incorporated by reference tothe extent indicated in Part III of this Form 10-K.
INDEX
Page
PART I
Item 1. Business . . . . . . . . . . . . . . . . . . . . . . . . . . . . . . . . . . . . . . . . . . . . . . . . . . . . . . . . . . . . . . . . . . . . 3
Item 1A. Risk Factors . . . . . . . . . . . . . . . . . . . . . . . . . . . . . . . . . . . . . . . . . . . . . . . . . . . . . . . . . . . . . . . . . 8
Item 1B. Unresolved Staff Comments . . . . . . . . . . . . . . . . . . . . . . . . . . . . . . . . . . . . . . . . . . . . . . . . . . . . . 10
Item 2. Properties . . . . . . . . . . . . . . . . . . . . . . . . . . . . . . . . . . . . . . . . . . . . . . . . . . . . . . . . . . . . . . . . . . . 11
Item 3. Legal Proceedings . . . . . . . . . . . . . . . . . . . . . . . . . . . . . . . . . . . . . . . . . . . . . . . . . . . . . . . . . . . . . 11
Item 4. Mine Safety Disclosures . . . . . . . . . . . . . . . . . . . . . . . . . . . . . . . . . . . . . . . . . . . . . . . . . . . . . . . . 11
Item 4.1 Executive Officers of the Registrant . . . . . . . . . . . . . . . . . . . . . . . . . . . . . . . . . . . . . . . . . . . . . . 12PART II
Item 5. Market for Registrant’s Common Equity, Related Stockholder Matters and Issuer Purchases ofEquity Securities . . . . . . . . . . . . . . . . . . . . . . . . . . . . . . . . . . . . . . . . . . . . . . . . . . . . . . . . . . . . . . 13
Item 6. Selected Financial Data . . . . . . . . . . . . . . . . . . . . . . . . . . . . . . . . . . . . . . . . . . . . . . . . . . . . . . . . 16
Item 7. Management’s Discussion and Analysis of Financial Condition and Results of Operations . . . 16
Item 7A. Quantitative and Qualitative Disclosures About Market Risk . . . . . . . . . . . . . . . . . . . . . . . . . . . 31
Item 8. Financial Statements and Supplementary Data . . . . . . . . . . . . . . . . . . . . . . . . . . . . . . . . . . . . . . 31
Item 9. Changes in and Disagreements with Accountants on Accounting and Financial Disclosures . . . 31
Item 9A. Controls and Procedures . . . . . . . . . . . . . . . . . . . . . . . . . . . . . . . . . . . . . . . . . . . . . . . . . . . . . . . . 31
Item 9B. Other Information . . . . . . . . . . . . . . . . . . . . . . . . . . . . . . . . . . . . . . . . . . . . . . . . . . . . . . . . . . . . . 32
PART III
Item 10. Directors, Executive Officers and Corporate Governance . . . . . . . . . . . . . . . . . . . . . . . . . . . . . . 32
Item 11. Executive Compensation . . . . . . . . . . . . . . . . . . . . . . . . . . . . . . . . . . . . . . . . . . . . . . . . . . . . . . . 33
Item 12. Security Ownership of Certain Beneficial Owners and Management and Related StockholderMatters . . . . . . . . . . . . . . . . . . . . . . . . . . . . . . . . . . . . . . . . . . . . . . . . . . . . . . . . . . . . . . . . . . . . . 33
Item 13. Certain Relationships and Related Transactions, and Director Independence . . . . . . . . . . . . . . . 33
Item 14. Principal Accountant Fees and Services . . . . . . . . . . . . . . . . . . . . . . . . . . . . . . . . . . . . . . . . . . . . 33
PART IV
Item 15. Exhibits, Financial Statement Schedules . . . . . . . . . . . . . . . . . . . . . . . . . . . . . . . . . . . . . . . . . . . 34
SIGNATURES . . . . . . . . . . . . . . . . . . . . . . . . . . . . . . . . . . . . . . . . . . . . . . . . . . . . . . . . . . . . . . . . . . . . . . . . 38
INDEX TO FINANCIAL STATEMENTS . . . . . . . . . . . . . . . . . . . . . . . . . . . . . . . . . . . . . . . . . . . . . . . . . F-1
2
PART I
Item 1. BUSINESS
General
Packaging Corporation of America (“we”, “us”, “our”, “PCA” or the “Company”) is the fourth largestproducer of containerboard in the United States in terms of production capacity. During 2012, we produced2.6 million tons of containerboard at our mills, of which about 83% was consumed in PCA’s corrugated productsmanufacturing plants, 10% was sold in the export market and 7% was sold to domestic customers. Ourcorrugated products manufacturing plants sold about 34.7 billion square feet (BSF) of corrugated products. Ournet sales to third parties totaled $2.8 billion in 2012.
Containerboard Production and Corrugated Shipments
FirstQuarter
SecondQuarter
ThirdQuarter
FourthQuarter
FullYear
Containerboard Production (thousand tons) . . . . . . . . . 2012 640 638 670 652 2,6002011 602 606 650 641 2,4992010 569 589 646 639 2,443
Corrugated Shipments (BSF) . . . . . . . . . . . . . . . . . . . . 2012 8.5 8.8 8.6 8.8 34.72011 7.8 8.2 8.3 8.2 32.52010 7.6 7.9 7.8 7.7 31.0
In 2012, we produced 1.6 million tons of kraft linerboard at our mills in Counce, Tennessee and Valdosta,Georgia, and 1.0 million tons of semi-chemical corrugating medium at our mills in Tomahawk, Wisconsin andFiler City, Michigan.
Our corrugated products manufacturing plants produce a wide variety of corrugated packaging products,including conventional shipping containers used to protect and transport manufactured goods, multi-color boxesand displays with strong visual appeal that help to merchandise the packaged product in retail locations. Inaddition, we are a large producer of meat boxes and wax-coated boxes for the agricultural industry.
Industry Overview
The primary end-use markets for corrugated products are shown below (as reported in the most recent 2011Fibre Box Association annual report):
Food, beverages and agricultural products . . . . . . . . . . . . . . . . . . . . . . . . . . . . . . . . . . . . . . . . . . . . 52%
Paper products . . . . . . . . . . . . . . . . . . . . . . . . . . . . . . . . . . . . . . . . . . . . . . . . . . . . . . . . . . . . . . . . . . 16%
Petroleum, plastic, synthetic and rubber products . . . . . . . . . . . . . . . . . . . . . . . . . . . . . . . . . . . . . . 11%
General retail and wholesale trade . . . . . . . . . . . . . . . . . . . . . . . . . . . . . . . . . . . . . . . . . . . . . . . . . . 6%
Miscellaneous manufacturing . . . . . . . . . . . . . . . . . . . . . . . . . . . . . . . . . . . . . . . . . . . . . . . . . . . . . . 6%
Appliances, vehicles, and metal products . . . . . . . . . . . . . . . . . . . . . . . . . . . . . . . . . . . . . . . . . . . . . 5%
Textile mill products and apparel . . . . . . . . . . . . . . . . . . . . . . . . . . . . . . . . . . . . . . . . . . . . . . . . . . . 2%
Other . . . . . . . . . . . . . . . . . . . . . . . . . . . . . . . . . . . . . . . . . . . . . . . . . . . . . . . . . . . . . . . . . . . . . . . . . 2%
Corrugated products plants tend to be located in close proximity to customers to minimize freight costs. TheU.S. corrugated products industry consists of approximately 570 companies and 1,240 plants.
Containerboard, which includes both linerboard and corrugating medium, is the principal raw material usedto manufacture corrugated products. Linerboard is used as the inner and outer facings, or liners, of corrugated
3
products. Corrugating medium is fluted and laminated to linerboard to produce corrugated sheets. The sheets aresubsequently printed, cut, folded and glued to produce corrugated products.
Containerboard may be manufactured from both softwood and hardwood fibers, as well as from recycledfibers from used corrugated and waste from converting operations in corrugated products plants. Kraft linerboardis made predominantly from softwoods like pine. Semi-chemical corrugating medium is made from hardwoodssuch as oak. The finished paper product is wound into large rolls, which are slit to size as required, and shippedto converters.
PCA Operations and Products
Containerboard Mills
Our two linerboard mills can manufacture a broad range of linerboard grades ranging from 26 lb. to 96 lb.Our two semi-chemical corrugating medium mills can manufacture grades ranging in weight from 20 lb. to 47 lb.Mill capacities described below are estimated based on expected mix of paper basis weights, and production canexceed estimated capacity if a higher-than-estimated mix of heavier grade paper is produced. All four of ourmills have completed an extensive independent review process to become ISO 9002 certified. ISO 9002 is aninternational quality certification that verifies a facility maintains and follows stringent procedures formanufacturing, sales and customer service.
The following four paragraphs describe our containerboard mills’ annual practical maximum capacity, 2012actual production and production capabilities.
Counce. Our Counce, Tennessee mill is one of the largest kraft linerboard mills in the United States. Itsyear-end 2012 annual estimated production capacity, as reported to the American Forest and Paper Association(“AF&PA”), is 1,057,000 tons. In 2012, we produced 1,056,000 tons of kraft linerboard on two paper machinesat Counce. The mill produces a broad range of basis weights from 26 lb. to 90 lb. The mill also produces avariety of performance and specialty grades of linerboard.
Valdosta. Our Valdosta, Georgia mill is a kraft linerboard mill. Its year-end 2012 annual estimatedproduction capacity, as reported to the AF&PA, is 559,000 tons. In 2012, our single paper machine at Valdostaproduced 561,000 tons of kraft linerboard. Valdosta produces a range of basis weights from 35 lb. to 96 lb.
Tomahawk. Our Tomahawk, Wisconsin mill is one of the largest semi-chemical corrugating medium millsin the United States. Its year-end 2012 annual estimated production capacity, as reported to the AF&PA, is545,000 tons. In 2012, we produced 543,000 tons of semi-chemical corrugating medium on two paper machinesat Tomahawk. The Tomahawk mill produces a broad range of basis weights from 23 lb. to 47 lb. and a variety ofperformance and specialty grades of corrugating medium.
Filer City. Our Filer City, Michigan mill is a semi-chemical corrugating medium mill. Its year-end 2012annual estimated production capacity on three paper machines, as reported to the AF&PA is 439,000 tons. In2012, we produced 440,000 tons of corrugating medium on three paper machines at Filer City. Filer Cityproduces corrugating medium grades ranging in basis weight from 20 lb. to 47 lb.
Corrugated Products
We operate 71 corrugated manufacturing operations, a technical and development center, seven regionalgraphic design centers, a rotogravure printing operation and a complement of packaging supplies and distributioncenters. Of the 71 manufacturing facilities, 41 operate as combining operations, commonly called corrugatedplants, which manufacture corrugated sheets and finished corrugated containers. The remaining 30manufacturing facilities, commonly called sheet plants, procure combined sheets and manufacture finishedcorrugated containers.
4
We have corrugated manufacturing operations in 26 states in the U.S., with no manufacturing facilitiesoutside of the continental U.S. Each corrugated plant, for the most part, serves a market radius of around150 miles. Our sheet plants are generally located in close proximity to our larger corrugated plants, whichenables us to offer additional services and converting capabilities such as small volume and quick turnarounditems.
We produce a wide variety of products ranging from basic corrugated shipping containers to specializedpackaging such as wax-coated boxes for the agriculture industry. We also have multi-color printing capabilitiesto make high-impact graphics boxes and displays that offer customers more attractive packaging.
Timberland
We currently lease the cutting rights to approximately 88,000 acres of timberland located near our Counce,Tennessee and Valdosta, Georgia mills. Virtually all of the acres under cutting rights agreements are locatedwithin 100 miles of these two mills which results in lower wood transportation costs and provides a secure sourceof wood fiber. These leased cutting rights agreements have terms with about 11 years remaining, on average. Inaddition, we have in place supply agreements covering approximately 318,000 acres with the majority of theacreage covered by the supply agreements located in close proximity to our Counce mill.
PCA also participates in the Sustainable Forestry Initiative (SFI) and is certified under the SFI sourcingstandards. These standards are aimed at ensuring the long-term health and conservation of forestry resources.PCA is committed to sourcing wood fiber through environmentally, socially and economically sustainablepractices and promoting resource and conservation stewardship ethics.
Sales and Marketing
Our corrugated products are sold through a direct sales and marketing organization. We have salesrepresentatives and a sales manager at most of our corrugated manufacturing operations and also have corporateaccount managers who serve customer accounts with a national presence. Additionally, our graphic designcenters maintain an on-site dedicated graphics sales force. In addition to direct sales and marketing personnel, weutilize new product development engineers and product graphics and design specialists. These individuals arelocated at both the corrugated plants and the graphic design centers. General marketing support is located at ourcorporate headquarters.
Our containerboard sales group is responsible for the sale of linerboard and corrugating medium to ourcorrugated plants, to other domestic customers and to the export market. This group handles order processing forall shipments of containerboard from our mills to our corrugated plants. These personnel also coordinate andexecute all containerboard trade agreements with other containerboard manufacturers.
Distribution
Containerboard produced in our mills is shipped by rail or truck. Rail shipments typically represent from50% to 55% of the tons shipped and the remaining 45% to 50% is comprised of truck shipments. Our individualmills do not own or maintain outside warehousing facilities.
Our corrugated products are delivered by truck due to our large number of customers and their demand fortimely service. Our converting operations typically service customers within a 150 miles radius. We use third-party warehouses for short-term storage of corrugated products.
5
Customers
PCA’s corrugated products group sells to approximately 9,500 customers in over 18,000 locations. Abouttwo-thirds of our corrugated products sales are to regional and local accounts, which are broadly diversifiedacross industries and geographic locations. The remaining one-third consists primarily of national accounts whohave multiple locations and are served by a number of PCA plants.
Major Raw Materials Used
Fiber supply. Fiber is the single largest cost in the manufacture of containerboard. PCA consumes bothwood fiber and recycled fiber in its containerboard mills. We have no 100% recycled mills, or those mills whosefiber consumption consists solely of recycled fiber. To reduce our fiber costs, we have invested in processes andequipment to ensure a high degree of fiber flexibility. Our mill system has the capability to shift a portion of itsfiber consumption between softwood, hardwood and recycled sources. All of our mills, other than our Valdostamill, can utilize some recycled fiber in their containerboard production. Our ability to use various types of virginand recycled fiber helps mitigate the impact of changes in the prices of various fibers. Our corrugatedmanufacturing operations generate recycled fiber as a by-product from the manufacturing process, which is soldto our mills directly or through trade agreements. During 2012, our containerboard mills consumedapproximately 564,000 tons of recycled fiber, and our corrugated converting operations generated approximately197,000 tons of recycled fiber. As a result, PCA was a net recycled fiber buyer of 367,000 tons, or 14% of PCA’stotal mill fiber requirements.
Energy supply. Energy at PCA’s four mills is obtained through purchased or self-generated fuels andelectricity. Fuel sources include by-products of the containerboard manufacturing and pulping process, includingblack liquor and wood waste, and natural gas, purchased wood waste, coal and oil. Each of PCA’s mills self-generates process steam requirements from by-products (black liquor and wood waste), as well as from thevarious purchased fuels. The process steam is used throughout the production process and also to generateelectricity.
In 2012, PCA’s four mills consumed about 47 million MMBTU’s of fuel to produce both steam andelectricity. Of the 47 million MMBTU’s consumed, about 68% was from mill generated by-products, and 32%was from purchased fuels. Of the 32% in purchased fuels, 52% was from natural gas, 26% from purchased woodwaste, and 15% was from coal.
In 2012, our mills purchased approximately 7.6 million CkWh (hundred kilowatt hours) of electricity, or theequivalent of 2.6 million MMBTU’s. Approximately 55% of the electricity consumed by our four mills in 2012was generated on-site.
In 2012, PCA’s corrugated products plants consumed about 2.0 million MMBTU’s of natural gas.
Competition
According to industry sources, corrugated products are produced by about 570 U.S. companies operatingapproximately 1,240 plants. Most corrugated products are manufactured to the customer’s specifications.Corrugated producers generally sell within a 150-mile radius of their plants and compete with other corrugatedproducers in their local market.
The larger, multi-plant integrated companies may also solicit larger, multi-plant customers who purchase forall of their facilities on a consolidated basis. These customers are often referred to as national or corporateaccounts.
Corrugated products businesses seek to differentiate themselves through pricing, quality, service, design andproduct innovation. We compete for both local and national account business, and we compete against producers
6
of other types of packaging products. On a national level, our primary competitors include International PaperCompany, Georgia-Pacific (owned by Koch Industries, Inc.) and Rock-Tenn Company. However, with ourstrategic focus on local and regional accounts, we also compete with the smaller, independent converters.
Our principal competitors with respect to sales of our containerboard produced but not consumed at our owncorrugated products plants are a number of large, diversified paper companies, including International PaperCompany, Georgia-Pacific and Rock-Tenn Company, as well as other regional manufacturers. Containerboard isgenerally considered a commodity-type product and can be purchased from numerous suppliers.
Employees
As of December 31, 2012, we had approximately 8,600 employees. Approximately 2,600 of theseemployees were salaried and approximately 6,000 were hourly. Approximately 75% of our hourly employees arerepresented by unions. The majority of our unionized employees are represented by the United Steel Workers(USW), the International Brotherhood of Teamsters (IBT) and the International Association of Machinists(IAM).
Based on an agreement reached with the USW in 2008, the existing labor agreements at our containerboardmills covering USW-represented employees (91% of mill hourly workforce) were extended five years. With thisextension, the USW contracts at our mills are currently set to expire between September 2013 and June 2015.Agreements with other union mill employees (9% of mill hourly workforce) expire between October 2014 andJune 2017. Based on an agreement reached with the USW in 2009, the labor agreement at 25 corrugated plantscovering USW represented employees was extended up to five years. Contracts for unionized corrugatedproducts plant employees expire between November 2012 and March 2018. We are currently in negotiations torenew or extend any union contracts that have recently expired or are expiring in the near future.
During 2012, we experienced no work stoppages and have experienced no instances of significant workstoppages in the ten years prior to 2012. We believe we have satisfactory labor relations with our employees.
Environmental Matters
Compliance with environmental requirements is a significant factor in our business operations. We commitsubstantial resources to maintaining environmental compliance and managing environmental risk. We are subjectto, and must comply with, a variety of federal, state and local environmental laws, particularly those relating toair and water quality, waste disposal and the cleanup of contaminated soil and groundwater. The most significantof these laws affecting us are:
1. Resource Conservation and Recovery Act (RCRA)
2. Clean Water Act (CWA)
3. Clean Air Act (CAA)
4. The Emergency Planning and Community Right-to-Know-Act (EPCRA)
5. Toxic Substance Control Act (TSCA)
6. Safe Drinking Water Act (SDWA)
We believe that we are currently in material compliance with these and all applicable environmental rulesand regulations. Because environmental regulations are constantly evolving, we have incurred, and will continueto incur, costs to maintain compliance with these and other environmental laws. For the years endedDecember 31, 2012, 2011, and 2010, we spent $25.8 million, $26.0 million and $24.6 million, respectively, tocomply with the requirements of these and other environmental laws. We work diligently to anticipate andbudget for the impact of applicable environmental regulations, and do not currently expect that future
7
environmental compliance obligations will materially affect our business or financial condition. For a furtherdiscussion of the financial impact of our compliance with environmental laws, please see “ Item 7.Management’s Discussion and Analysis of Financial Condition and Results of Operations — EnvironmentalMatters.”
Available Information
PCA’s internet website address is www.packagingcorp.com. Our annual reports on Form 10-K, quarterlyreports on Form 10-Q, current reports on Form 8-K, and amendments to those reports filed or furnished pursuantto Section 13 or 15(d) of the Securities Exchange Act of 1934 are available free of charge through our website assoon as reasonably practicable after they are electronically filed with, or furnished to, the Securities andExchange Commission. In addition, our Code of Ethics may be accessed in the Investor Relations section ofPCA’s website. PCA’s website and the information contained or incorporated therein are not intended to beincorporated into this report.
Financial Information About Segments
We operate as one segment and our revenues are generated primarily in one geographic segment. See“Segment Information” of Note 2 — Summary of Significant Accounting Policies contained in the “Notes toConsolidated Financial Statements.”
Item 1A. RISK FACTORS
Some of the statements in this report and, in particular, statements found in Management’s Discussion andAnalysis of Financial Condition and Results of Operations, that are not historical in nature are forward-lookingstatements within the meaning of the Private Securities Litigation Reform Act of 1995. Forward-lookingstatements include statements about our expectations regarding our future liquidity, earnings, expenditures andfinancial condition. These statements are often identified by the words “will,” “should,” “anticipate,” “believe,”“expect,” “intend,” “estimate,” “hope,” or similar expressions. These statements reflect management’s currentviews with respect to future events and are subject to risks and uncertainties. There are important factors thatcould cause actual results to differ materially from those in forward-looking statements, many of which arebeyond our control. These factors, risks and uncertainties include, but are not limited to, the factors describedbelow.
Our actual results, performance or achievement could differ materially from those expressed in, or impliedby, these forward-looking statements, and accordingly, we can give no assurances that any of the eventsanticipated by the forward-looking statements will transpire or occur, or if any of them do so, what impact theywill have on our results of operations or financial condition. In view of these uncertainties, investors arecautioned not to place undue reliance on these forward-looking statements. We expressly disclaim any obligationto publicly revise any forward-looking statements that have been made to reflect the occurrence of events afterthe date hereof.
Industry Risks
Industry Cyclicality — Imbalances of supply and demand for containerboard could affect the price at whichwe can sell containerboard and corrugated products, and as a result, could result in lower selling prices andearnings.
The price of containerboard could fall if the supply of containerboard available for sale in the marketexceeds the demand. The demand for containerboard is driven by market needs for containerboard in the UnitedStates and abroad to manufacture corrugated shipping containers. Market needs or demand are driven by bothglobal and U.S. business conditions. If supply exceeds demand, prices for containerboard and corrugatedproducts could decline, resulting in decreased earnings and cash generated from operations.
8
Competition — The intensity of competition in the containerboard and corrugated packaging industry couldresult in downward pressure on pricing and volume, which could lower earnings and cash generated fromoperations.
The containerboard and corrugated products industry is highly competitive, with no single containerboard orcorrugated packaging producer having a dominant position. Containerboard cannot generally be differentiated byproducer, which tends to intensify price competition. The corrugated packaging industry is also sensitive tochanges in economic conditions, as well as other factors including innovation, design, quality and service. To theextent that one or more competitors are more successful than we are with respect to any key competitive factor,our business could be adversely affected. Our products also compete, to some extent, with various otherpackaging materials, including products made of paper, plastics, wood and various types of metal. The intensityof competition could lead to a reduction in our market share as well as lower sales prices for our products, bothof which could reduce our earnings and cash flow.
Company Risks
Cost of Fiber — An increase in the cost of fiber could increase our manufacturing costs and lower ourearnings.
PCA has supply agreements at market prices for wood fiber to be consumed at our Counce, Tennessee andValdosta, Georgia mills on approximately 318,000 acres of timberland. In addition to these supply agreements,PCA also secures wood fiber from various other sources at market prices.
The market price of wood fiber varies based upon availability, source and the costs of fuels used in theharvesting and transportation of wood fiber. The cost and availability of wood fiber can also be impacted byweather and general logging conditions.
PCA purchases recycled fiber for use at three of its four containerboard mills. PCA currently purchases, netof recycled fiber generated at its box plants, 350,000 to 450,000 tons of recycled fiber per year. The amount ofrecycled fiber purchased each year varies based upon production and the prices of both recycled fiber and woodfiber.
The increase in demand of products manufactured, in whole or in part, from recycled fiber, on a globalbasis, has caused an occasional tightening in the supply of recycled fiber. These periods of supply and demandimbalance have tended to create significant price volatility. Periods of higher recycled fiber costs and unusualprice volatility have occurred in the past and may occur again in the future, which could result in lower orvolatile earnings.
Cost of Purchased Energy and Chemicals — An increase in the cost of purchased energy and chemicalscould lead to higher manufacturing costs, resulting in reduced earnings.
PCA has the capability to use various types of purchased fuels in its manufacturing operations, includingcoal, bark, natural gas and oil. Energy prices, in particular prices for oil and natural gas, have fluctuateddramatically in the past. New and more stringent environmental regulations may discourage, or make moreexpensive, the use of certain fuels. In addition, costs for key chemicals used in our manufacturing also fluctuate.These fluctuations impact our manufacturing costs and result in earnings volatility. If energy and chemical pricesrise, our production costs and transportation costs will increase, which will lead to higher manufacturing costsand reduced earnings.
9
Material Disruption of Manufacturing — A material disruption at one of our manufacturing facilitiescould prevent us from meeting customer demand, reduce our sales and/or negatively impact our results ofoperations and financial condition.
Our business depends on continuous operation of our facilities, particularly at our mills. Any of ourmanufacturing facilities, or any of our machines within such facilities, could cease operations unexpectedly for along period of time due to a number of events, including unscheduled maintenance outages; prolonged powerfailures; an equipment failure; fire; explosion of a boiler; labor difficulties; natural catastrophes; terrorism;governmental regulations; and other operational problems. These events could cause us to be unable to serviceour customers and lead to higher costs and reduced earnings.
Environmental Matters — PCA may incur significant environmental liabilities with respect to both past andfuture operations.
We are subject to, and must comply with, a variety of federal, state and local environmental laws,particularly those relating to air and water quality, waste disposal and the cleanup of contaminated soil andgroundwater. Because environmental regulations are constantly evolving, we have incurred, and will continue toincur, costs to maintain compliance with those laws. See Item 7. “Management’s Discussion and Analysis ofFinancial Condition and Results of Operations — Environmental Matters” for certain estimates of expenditureswe expect to make for environmental compliance in the next few years. New and more stringent environmentalregulations, including new U.S. Environmental Protection Agency rules relating to industrial boiler emissionsknown as the Boiler MACT rules, are expected to require us to incur significant additional capital expenditures tomodify or replace certain of our boilers. In addition, environmental regulations may increase the cost of our rawmaterials and purchased energy. Although we have established reserves to provide for known environmentalliabilities as of the date of this filing, these reserves may change over time due to the enactment of newenvironmental laws or regulations or changes in existing laws or regulations, which might require additionalsignificant environmental expenditures.
Investment Risks
Market Price of our Common Stock — The market price of our common stock may be volatile, which couldcause the value of your investment to decline.
Securities markets worldwide periodically experience significant price declines and volume fluctuations.This market volatility, as well as general economic, market or political conditions, could reduce the market priceof our common stock in spite of our operating performance. In addition, our operating results could be below theexpectations of public market analysts and investors, and in response, the market price of our common stockcould decrease significantly.
General Risks
Economic Conditions — Our earnings and cash generated from operations could be lower if the economyweakens.
Our operations and financial performance are directly impacted by changes in the U.S. economy, and to alesser extent, by global economic conditions. A weakening in the economy could reduce the demand for ourproducts and ultimately lower our earnings and cash flows. Lower earnings and reduced cash flow could impactour ability to fund operations, capital requirements, and common stock dividend payments.
Item 1B. UNRESOLVED STAFF COMMENTS
None.
10
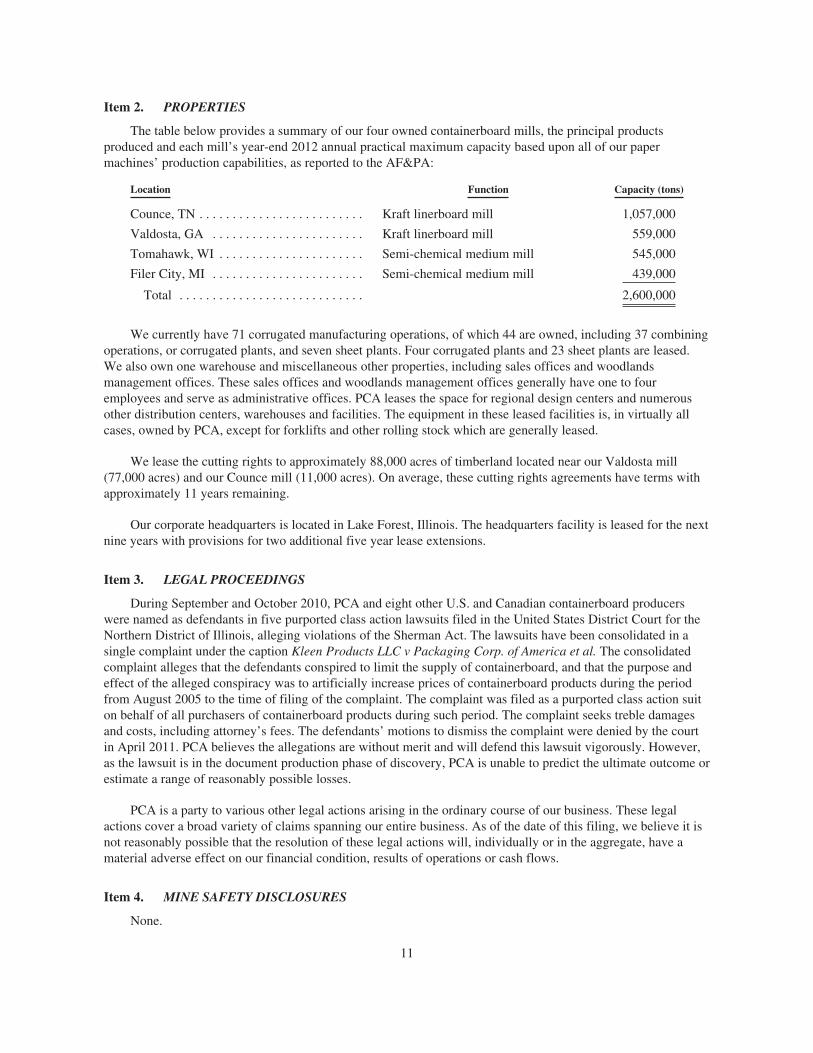
Item 2. PROPERTIES
The table below provides a summary of our four owned containerboard mills, the principal productsproduced and each mill’s year-end 2012 annual practical maximum capacity based upon all of our papermachines’ production capabilities, as reported to the AF&PA:
Location Function Capacity (tons)
Counce, TN . . . . . . . . . . . . . . . . . . . . . . . . . Kraft linerboard mill 1,057,000
Valdosta, GA . . . . . . . . . . . . . . . . . . . . . . . Kraft linerboard mill 559,000
Tomahawk, WI . . . . . . . . . . . . . . . . . . . . . . Semi-chemical medium mill 545,000
Filer City, MI . . . . . . . . . . . . . . . . . . . . . . . Semi-chemical medium mill 439,000
Total . . . . . . . . . . . . . . . . . . . . . . . . . . . . 2,600,000
We currently have 71 corrugated manufacturing operations, of which 44 are owned, including 37 combiningoperations, or corrugated plants, and seven sheet plants. Four corrugated plants and 23 sheet plants are leased.We also own one warehouse and miscellaneous other properties, including sales offices and woodlandsmanagement offices. These sales offices and woodlands management offices generally have one to fouremployees and serve as administrative offices. PCA leases the space for regional design centers and numerousother distribution centers, warehouses and facilities. The equipment in these leased facilities is, in virtually allcases, owned by PCA, except for forklifts and other rolling stock which are generally leased.
We lease the cutting rights to approximately 88,000 acres of timberland located near our Valdosta mill(77,000 acres) and our Counce mill (11,000 acres). On average, these cutting rights agreements have terms withapproximately 11 years remaining.
Our corporate headquarters is located in Lake Forest, Illinois. The headquarters facility is leased for the nextnine years with provisions for two additional five year lease extensions.
Item 3. LEGAL PROCEEDINGS
During September and October 2010, PCA and eight other U.S. and Canadian containerboard producerswere named as defendants in five purported class action lawsuits filed in the United States District Court for theNorthern District of Illinois, alleging violations of the Sherman Act. The lawsuits have been consolidated in asingle complaint under the caption Kleen Products LLC v Packaging Corp. of America et al. The consolidatedcomplaint alleges that the defendants conspired to limit the supply of containerboard, and that the purpose andeffect of the alleged conspiracy was to artificially increase prices of containerboard products during the periodfrom August 2005 to the time of filing of the complaint. The complaint was filed as a purported class action suiton behalf of all purchasers of containerboard products during such period. The complaint seeks treble damagesand costs, including attorney’s fees. The defendants’ motions to dismiss the complaint were denied by the courtin April 2011. PCA believes the allegations are without merit and will defend this lawsuit vigorously. However,as the lawsuit is in the document production phase of discovery, PCA is unable to predict the ultimate outcome orestimate a range of reasonably possible losses.
PCA is a party to various other legal actions arising in the ordinary course of our business. These legalactions cover a broad variety of claims spanning our entire business. As of the date of this filing, we believe it isnot reasonably possible that the resolution of these legal actions will, individually or in the aggregate, have amaterial adverse effect on our financial condition, results of operations or cash flows.
Item 4. MINE SAFETY DISCLOSURES
None.
11
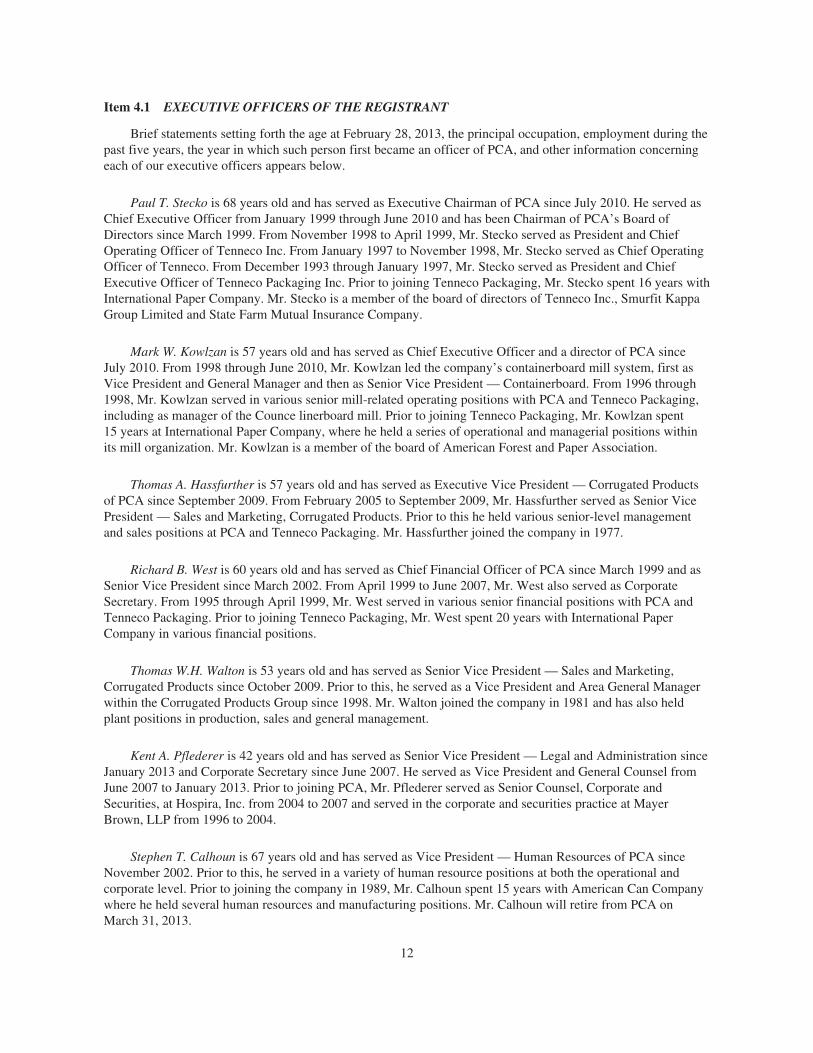
Item 4.1 EXECUTIVE OFFICERS OF THE REGISTRANT
Brief statements setting forth the age at February 28, 2013, the principal occupation, employment during thepast five years, the year in which such person first became an officer of PCA, and other information concerningeach of our executive officers appears below.
Paul T. Stecko is 68 years old and has served as Executive Chairman of PCA since July 2010. He served asChief Executive Officer from January 1999 through June 2010 and has been Chairman of PCA’s Board ofDirectors since March 1999. From November 1998 to April 1999, Mr. Stecko served as President and ChiefOperating Officer of Tenneco Inc. From January 1997 to November 1998, Mr. Stecko served as Chief OperatingOfficer of Tenneco. From December 1993 through January 1997, Mr. Stecko served as President and ChiefExecutive Officer of Tenneco Packaging Inc. Prior to joining Tenneco Packaging, Mr. Stecko spent 16 years withInternational Paper Company. Mr. Stecko is a member of the board of directors of Tenneco Inc., Smurfit KappaGroup Limited and State Farm Mutual Insurance Company.
Mark W. Kowlzan is 57 years old and has served as Chief Executive Officer and a director of PCA sinceJuly 2010. From 1998 through June 2010, Mr. Kowlzan led the company’s containerboard mill system, first asVice President and General Manager and then as Senior Vice President — Containerboard. From 1996 through1998, Mr. Kowlzan served in various senior mill-related operating positions with PCA and Tenneco Packaging,including as manager of the Counce linerboard mill. Prior to joining Tenneco Packaging, Mr. Kowlzan spent15 years at International Paper Company, where he held a series of operational and managerial positions withinits mill organization. Mr. Kowlzan is a member of the board of American Forest and Paper Association.
Thomas A. Hassfurther is 57 years old and has served as Executive Vice President — Corrugated Productsof PCA since September 2009. From February 2005 to September 2009, Mr. Hassfurther served as Senior VicePresident — Sales and Marketing, Corrugated Products. Prior to this he held various senior-level managementand sales positions at PCA and Tenneco Packaging. Mr. Hassfurther joined the company in 1977.
Richard B. West is 60 years old and has served as Chief Financial Officer of PCA since March 1999 and asSenior Vice President since March 2002. From April 1999 to June 2007, Mr. West also served as CorporateSecretary. From 1995 through April 1999, Mr. West served in various senior financial positions with PCA andTenneco Packaging. Prior to joining Tenneco Packaging, Mr. West spent 20 years with International PaperCompany in various financial positions.
Thomas W.H. Walton is 53 years old and has served as Senior Vice President — Sales and Marketing,Corrugated Products since October 2009. Prior to this, he served as a Vice President and Area General Managerwithin the Corrugated Products Group since 1998. Mr. Walton joined the company in 1981 and has also heldplant positions in production, sales and general management.
Kent A. Pflederer is 42 years old and has served as Senior Vice President — Legal and Administration sinceJanuary 2013 and Corporate Secretary since June 2007. He served as Vice President and General Counsel fromJune 2007 to January 2013. Prior to joining PCA, Mr. Pflederer served as Senior Counsel, Corporate andSecurities, at Hospira, Inc. from 2004 to 2007 and served in the corporate and securities practice at MayerBrown, LLP from 1996 to 2004.
Stephen T. Calhoun is 67 years old and has served as Vice President — Human Resources of PCA sinceNovember 2002. Prior to this, he served in a variety of human resource positions at both the operational andcorporate level. Prior to joining the company in 1989, Mr. Calhoun spent 15 years with American Can Companywhere he held several human resources and manufacturing positions. Mr. Calhoun will retire from PCA onMarch 31, 2013.
12
Charles J. Carter is 53 years old and has served as Vice President — Containerboard Mill Operations sinceJanuary 2011. From March 2010 to January 2011, Mr. Carter served as PCA’s Director of PapermakingTechnology. Prior to joining PCA in 2010, Mr. Carter spent 28 years with various pulp and paper companies inmanagerial and technical positions of increasing responsibility, most recently as Vice President and GeneralManager of the Calhoun, Tennessee mill of Abitibi Bowater from 2007 to 2010 and as manager ofSP Newsprint’s Dublin, Georgia mill from 1999 to 2007.
PART II
Item 5. MARKET FOR THE REGISTRANT’S COMMON EQUITY, RELATED STOCKHOLDERMATTERS AND ISSUER PURCHASES OF EQUITY SECURITIES
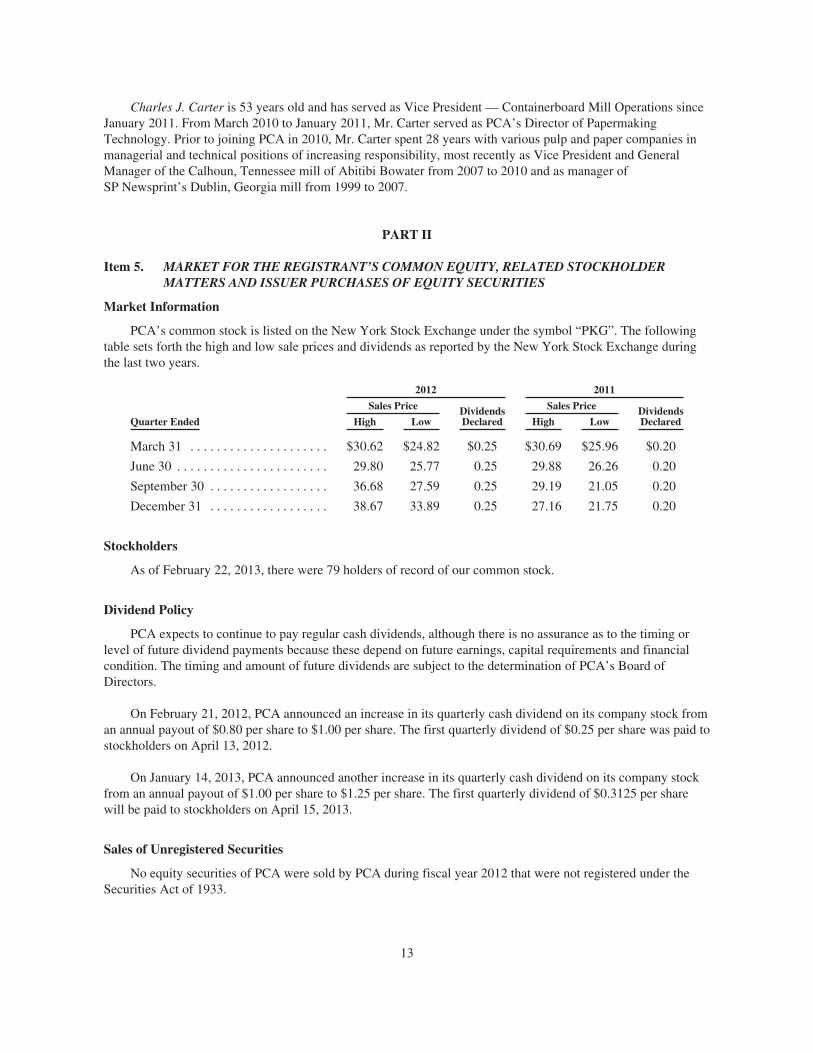
Market Information
PCA’s common stock is listed on the New York Stock Exchange under the symbol “PKG”. The followingtable sets forth the high and low sale prices and dividends as reported by the New York Stock Exchange duringthe last two years.
2012 2011
Sales Price DividendsDeclared
Sales Price DividendsDeclaredQuarter Ended High Low High Low
March 31 . . . . . . . . . . . . . . . . . . . . . $30.62 $24.82 $0.25 $30.69 $25.96 $0.20
June 30 . . . . . . . . . . . . . . . . . . . . . . . 29.80 25.77 0.25 29.88 26.26 0.20
September 30 . . . . . . . . . . . . . . . . . . 36.68 27.59 0.25 29.19 21.05 0.20
December 31 . . . . . . . . . . . . . . . . . . 38.67 33.89 0.25 27.16 21.75 0.20
Stockholders
As of February 22, 2013, there were 79 holders of record of our common stock.
Dividend Policy
PCA expects to continue to pay regular cash dividends, although there is no assurance as to the timing orlevel of future dividend payments because these depend on future earnings, capital requirements and financialcondition. The timing and amount of future dividends are subject to the determination of PCA’s Board ofDirectors.
On February 21, 2012, PCA announced an increase in its quarterly cash dividend on its company stock froman annual payout of $0.80 per share to $1.00 per share. The first quarterly dividend of $0.25 per share was paid tostockholders on April 13, 2012.
On January 14, 2013, PCA announced another increase in its quarterly cash dividend on its company stockfrom an annual payout of $1.00 per share to $1.25 per share. The first quarterly dividend of $0.3125 per sharewill be paid to stockholders on April 15, 2013.
Sales of Unregistered Securities
No equity securities of PCA were sold by PCA during fiscal year 2012 that were not registered under theSecurities Act of 1933.
13
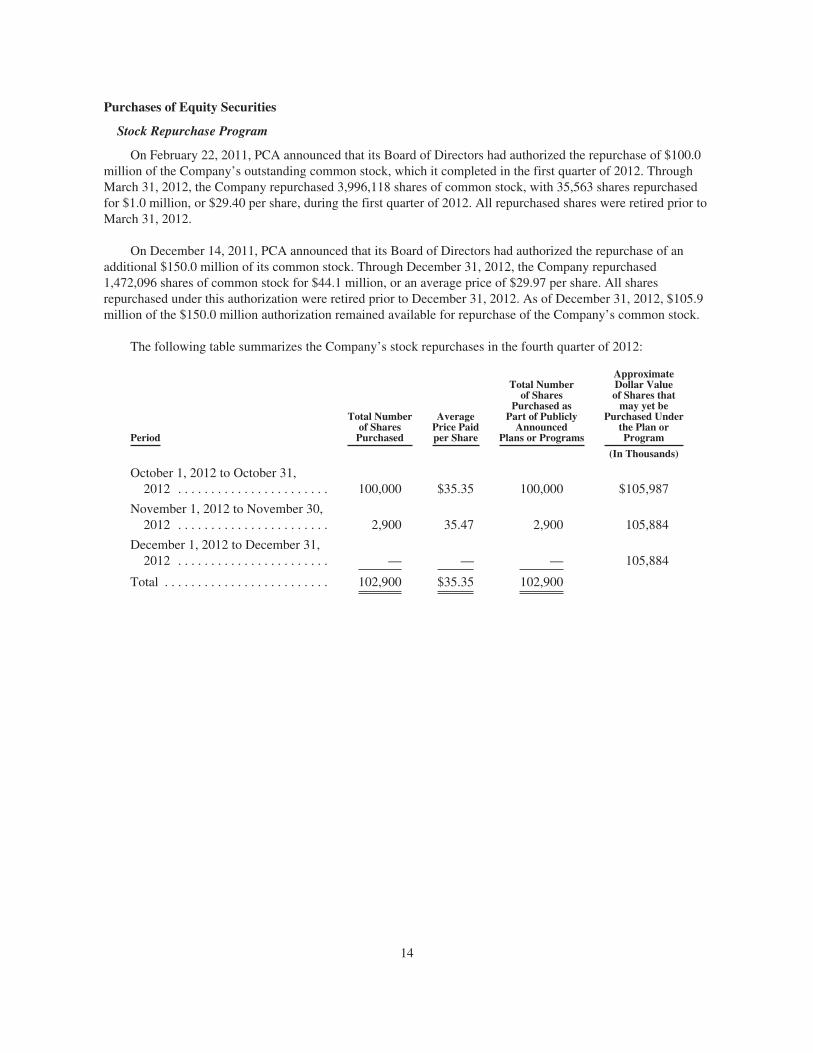
Purchases of Equity Securities
Stock Repurchase Program
On February 22, 2011, PCA announced that its Board of Directors had authorized the repurchase of $100.0million of the Company’s outstanding common stock, which it completed in the first quarter of 2012. ThroughMarch 31, 2012, the Company repurchased 3,996,118 shares of common stock, with 35,563 shares repurchasedfor $1.0 million, or $29.40 per share, during the first quarter of 2012. All repurchased shares were retired prior toMarch 31, 2012.
On December 14, 2011, PCA announced that its Board of Directors had authorized the repurchase of anadditional $150.0 million of its common stock. Through December 31, 2012, the Company repurchased1,472,096 shares of common stock for $44.1 million, or an average price of $29.97 per share. All sharesrepurchased under this authorization were retired prior to December 31, 2012. As of December 31, 2012, $105.9million of the $150.0 million authorization remained available for repurchase of the Company’s common stock.
The following table summarizes the Company’s stock repurchases in the fourth quarter of 2012:
Period
Total Numberof Shares
Purchased
AveragePrice Paidper Share
Total Numberof Shares
Purchased asPart of Publicly
AnnouncedPlans or Programs
ApproximateDollar Valueof Shares that
may yet bePurchased Under
the Plan orProgram
(In Thousands)
October 1, 2012 to October 31,2012 . . . . . . . . . . . . . . . . . . . . . . . 100,000 $35.35 100,000 $105,987
November 1, 2012 to November 30,2012 . . . . . . . . . . . . . . . . . . . . . . . 2,900 35.47 2,900 105,884
December 1, 2012 to December 31,2012 . . . . . . . . . . . . . . . . . . . . . . . — — — 105,884
Total . . . . . . . . . . . . . . . . . . . . . . . . . 102,900 $35.35 102,900
14
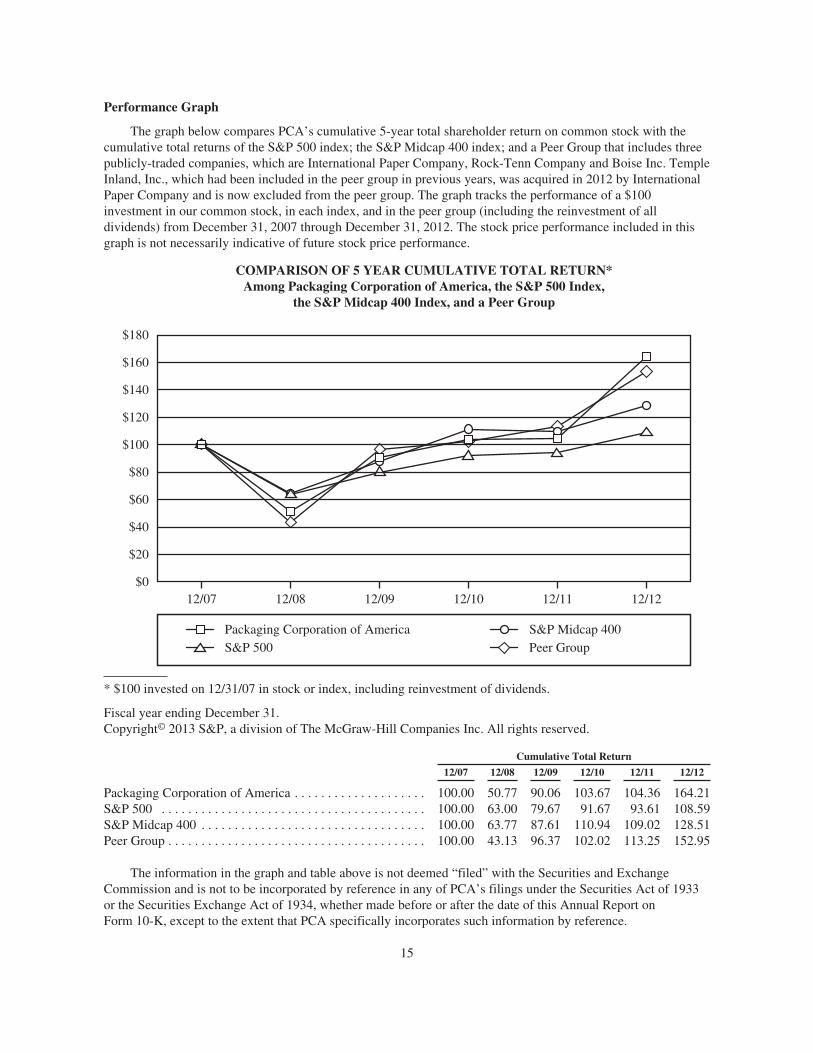
Performance Graph
The graph below compares PCA’s cumulative 5-year total shareholder return on common stock with thecumulative total returns of the S&P 500 index; the S&P Midcap 400 index; and a Peer Group that includes threepublicly-traded companies, which are International Paper Company, Rock-Tenn Company and Boise Inc. TempleInland, Inc., which had been included in the peer group in previous years, was acquired in 2012 by InternationalPaper Company and is now excluded from the peer group. The graph tracks the performance of a $100investment in our common stock, in each index, and in the peer group (including the reinvestment of alldividends) from December 31, 2007 through December 31, 2012. The stock price performance included in thisgraph is not necessarily indicative of future stock price performance.
COMPARISON OF 5 YEAR CUMULATIVE TOTAL RETURN*Among Packaging Corporation of America, the S&P 500 Index,
the S&P Midcap 400 Index, and a Peer Group
12/1212/1112/1012/0912/0812/07$0
$20
$40
$100
$60
$80
$120
$140
$180
$160
Packaging Corporation of AmericaS&P 500
S&P Midcap 400Peer Group
* $100 invested on 12/31/07 in stock or index, including reinvestment of dividends.
Fiscal year ending December 31.Copyright© 2013 S&P, a division of The McGraw-Hill Companies Inc. All rights reserved.
Cumulative Total Return
12/07 12/08 12/09 12/10 12/11 12/12
Packaging Corporation of America . . . . . . . . . . . . . . . . . . . . 100.00 50.77 90.06 103.67 104.36 164.21S&P 500 . . . . . . . . . . . . . . . . . . . . . . . . . . . . . . . . . . . . . . . . 100.00 63.00 79.67 91.67 93.61 108.59S&P Midcap 400 . . . . . . . . . . . . . . . . . . . . . . . . . . . . . . . . . . 100.00 63.77 87.61 110.94 109.02 128.51Peer Group . . . . . . . . . . . . . . . . . . . . . . . . . . . . . . . . . . . . . . . 100.00 43.13 96.37 102.02 113.25 152.95
The information in the graph and table above is not deemed “filed” with the Securities and ExchangeCommission and is not to be incorporated by reference in any of PCA’s filings under the Securities Act of 1933or the Securities Exchange Act of 1934, whether made before or after the date of this Annual Report onForm 10-K, except to the extent that PCA specifically incorporates such information by reference.
15
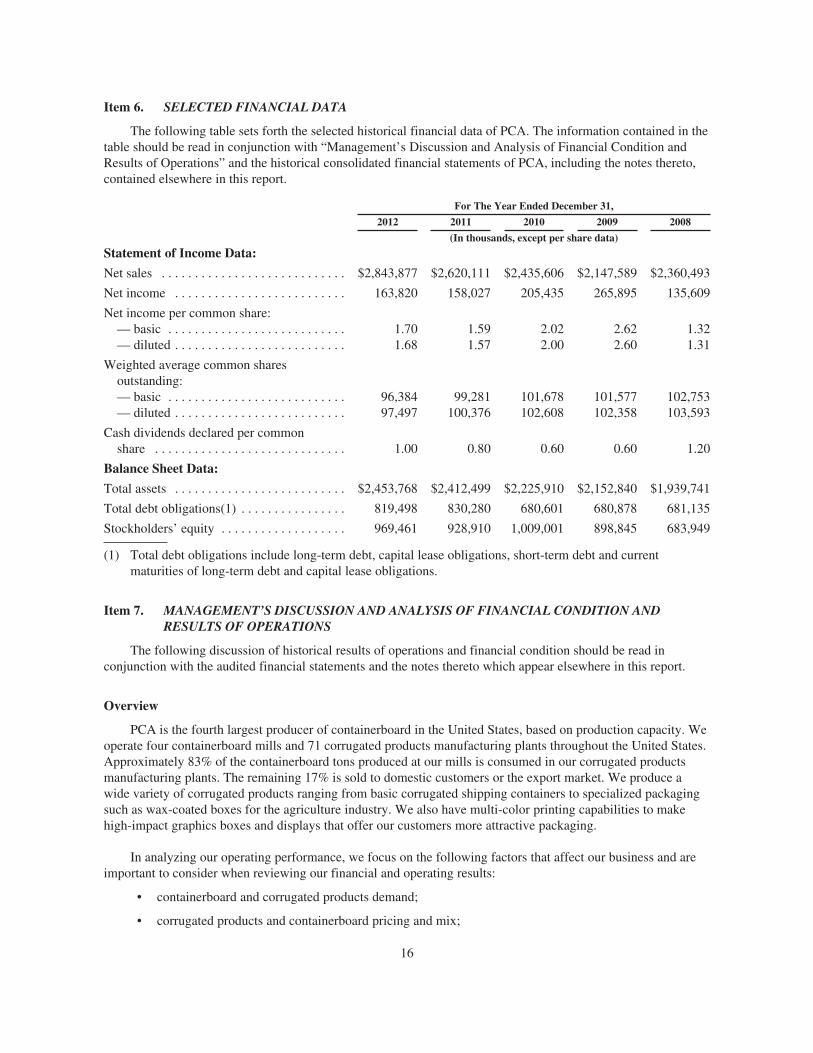
Item 6. SELECTED FINANCIAL DATA
The following table sets forth the selected historical financial data of PCA. The information contained in thetable should be read in conjunction with “Management’s Discussion and Analysis of Financial Condition andResults of Operations” and the historical consolidated financial statements of PCA, including the notes thereto,contained elsewhere in this report.
For The Year Ended December 31,
2012 2011 2010 2009 2008
(In thousands, except per share data)
Statement of Income Data:
Net sales . . . . . . . . . . . . . . . . . . . . . . . . . . . . $2,843,877 $2,620,111 $2,435,606 $2,147,589 $2,360,493
Net income . . . . . . . . . . . . . . . . . . . . . . . . . . 163,820 158,027 205,435 265,895 135,609
Net income per common share:— basic . . . . . . . . . . . . . . . . . . . . . . . . . . . 1.70 1.59 2.02 2.62 1.32— diluted . . . . . . . . . . . . . . . . . . . . . . . . . . 1.68 1.57 2.00 2.60 1.31
Weighted average common sharesoutstanding:— basic . . . . . . . . . . . . . . . . . . . . . . . . . . . 96,384 99,281 101,678 101,577 102,753— diluted . . . . . . . . . . . . . . . . . . . . . . . . . . 97,497 100,376 102,608 102,358 103,593
Cash dividends declared per commonshare . . . . . . . . . . . . . . . . . . . . . . . . . . . . . 1.00 0.80 0.60 0.60 1.20
Balance Sheet Data:
Total assets . . . . . . . . . . . . . . . . . . . . . . . . . . $2,453,768 $2,412,499 $2,225,910 $2,152,840 $1,939,741
Total debt obligations(1) . . . . . . . . . . . . . . . . 819,498 830,280 680,601 680,878 681,135
Stockholders’ equity . . . . . . . . . . . . . . . . . . . 969,461 928,910 1,009,001 898,845 683,949
(1) Total debt obligations include long-term debt, capital lease obligations, short-term debt and currentmaturities of long-term debt and capital lease obligations.
Item 7. MANAGEMENT’S DISCUSSION AND ANALYSIS OF FINANCIAL CONDITION ANDRESULTS OF OPERATIONS
The following discussion of historical results of operations and financial condition should be read inconjunction with the audited financial statements and the notes thereto which appear elsewhere in this report.
Overview
PCA is the fourth largest producer of containerboard in the United States, based on production capacity. Weoperate four containerboard mills and 71 corrugated products manufacturing plants throughout the United States.Approximately 83% of the containerboard tons produced at our mills is consumed in our corrugated productsmanufacturing plants. The remaining 17% is sold to domestic customers or the export market. We produce awide variety of corrugated products ranging from basic corrugated shipping containers to specialized packagingsuch as wax-coated boxes for the agriculture industry. We also have multi-color printing capabilities to makehigh-impact graphics boxes and displays that offer our customers more attractive packaging.
In analyzing our operating performance, we focus on the following factors that affect our business and areimportant to consider when reviewing our financial and operating results:
• containerboard and corrugated products demand;
• corrugated products and containerboard pricing and mix;
16
• cost trends and volatility for our major costs, including wood and recycled fiber, purchased fuels,electricity, labor and fringe benefits and transportation costs; and
• cash flow from operations and capital expenditures.
Historically, supply and demand, as well as industry-wide inventory levels, have influenced prices ofcontainerboard and corrugated products. In addition to U.S. shipments, approximately 10% of domesticallyproduced containerboard has been exported for use in other countries.
The market for containerboard and corrugated products is generally subject to changes in the U.S. economy.The U.S. economy improved modestly in 2012 as real GDP increased 2.2% compared to a 1.8% increase in 2011as reported by the U. S. Department of Commerce. Trade publications reported that industry-wide corrugatedproducts shipments increased 0.2% in 2012 compared to 2011 and containerboard production was 0.6% higherthan in 2011. PCA benefitted from improved demand that exceeded the industry average, as well as theacquisition of four corrugated products plants made during 2011 and 2012, and for the year, our corrugatedproducts shipments were up 6.6% compared to 2011. PCA also set a new record for annual production at itsmills, with containerboard production increasing by 4.0%, from 2,499,000 tons in 2011 to 2,600,000 tons in2012. Trade publications reported that industry containerboard inventories at the end of December 2012 were2.18 million tons, the second lowest year-ending level since 1980.
Average prices for containerboard and corrugated products were higher during 2012 compared to 2011.Published containerboard prices increased by $50 per ton in September 2012.
Increased pricing and higher demand along with lower costs for energy and recycled fiber improved PCA’s2012 earnings compared to 2011. However, these positive factors were partially offset by higher costs for laborand benefits, transportation, depreciation and interest expense. Energy costs were lower, reflecting the benefits ofour completed major energy projects as well as lower prices paid for purchased fuels and electricity whichdecreased approximately 10% in 2012 compared to the 2011 average. Published recycled fiber costs decreased in2012, on average, approximately 30% compared to 2011. Wood fiber costs in 2012 were essentially unchangedfrom 2011 levels. Transportation costs increased 3% from prior year levels as average diesel prices, as reportedby the U.S. Department of Energy, increased 3% from the 2011 average price. Labor related costs increasedreflecting annual merit increases and higher costs for medical insurance, pensions and incentives.
Special items impacting 2012 earnings included (a) net charges of $19.6 million, or $0.21 per share, relatingto alternative energy tax credits described in Note 15 to the consolidated financial statements, (b) charges of$16.0 million, or $0.16 per share, from the Company’s debt refinancing completed in July 2012, and (c) chargesof $1.4 million, or $0.01 per share, from plant closures. Excluding these special items, PCA earned net income of$200.7 million ($2.06 per diluted share) for the full year 2012. This compares with $161.8 million ($1.61 perdiluted share) for 2011, which excludes charges of $4.8 million, or $0.05 per share, from asset disposals relatedto major energy projects and $1.0 million of income, or $0.01 per share, from an adjustment related to medicalbenefits reserves. Management excludes these special items and uses non-GAAP measures to focus on PCA’son-going operations and assess its operating performance and believes that it is useful to investors because itenables them to perform meaningful comparisons of past and present operating results. Reconciliations of non-GAAP measures used in this Item 7 to the most comparable measure reported in accordance with GAAP areincluded elsewhere in Item 7 under “Reconciliations of Non-GAAP Financial Measures to Reported Amounts.”
In the first quarter of 2013, our containerboard production should be lower and operating costs highercompared to the fourth quarter with two less mill production days and mill annual maintenance downtime. Wealso expect higher energy costs with colder weather, and a pattern of extremely wet weather put pressure onwood costs and availability in the U.S. South during January. Corrugated products volume will be seasonallylower, and we expect higher costs for recycled fiber and labor and benefits. These items will be partially offset
17
by higher average corrugated products prices with a full quarter’s realization of fourth quarter price increases.Considering all of these items, we expect first quarter earnings to be lower than fourth quarter 2012 earnings,excluding special items, of $0.61 per diluted share.
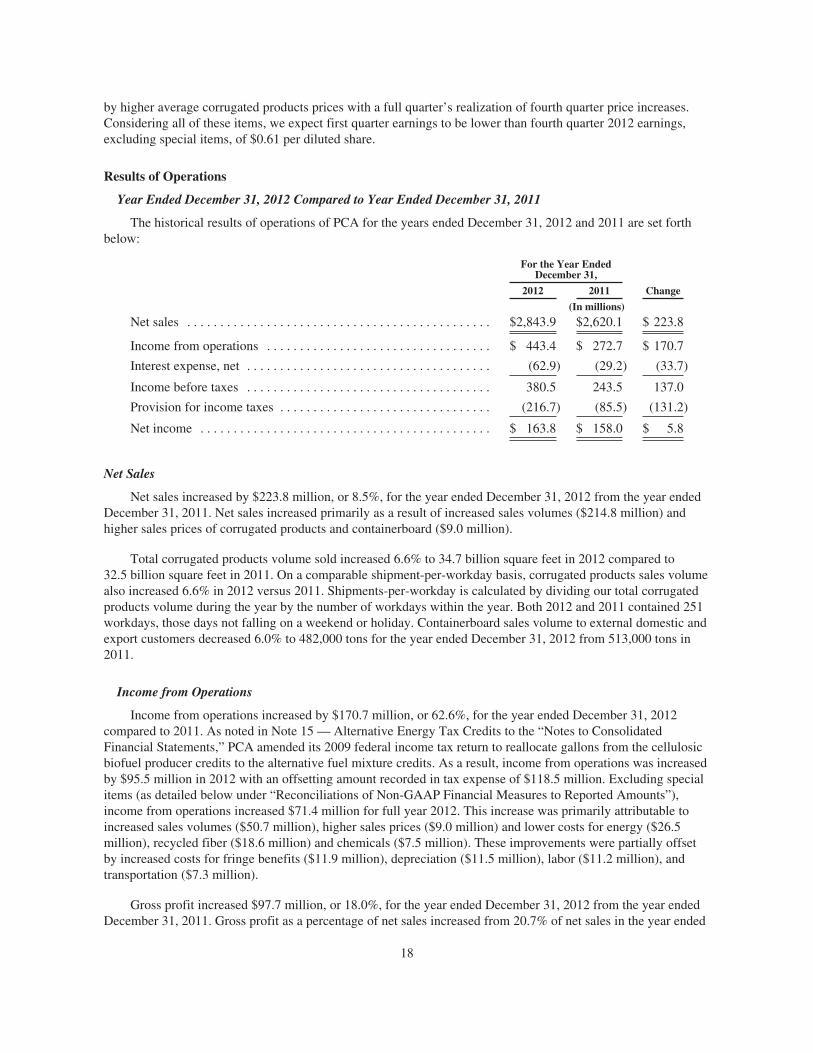
Results of Operations
Year Ended December 31, 2012 Compared to Year Ended December 31, 2011
The historical results of operations of PCA for the years ended December 31, 2012 and 2011 are set forthbelow:
For the Year EndedDecember 31,
2012 2011 Change
(In millions)
Net sales . . . . . . . . . . . . . . . . . . . . . . . . . . . . . . . . . . . . . . . . . . . . . . $2,843.9 $2,620.1 $ 223.8
Income from operations . . . . . . . . . . . . . . . . . . . . . . . . . . . . . . . . . . $ 443.4 $ 272.7 $ 170.7
Interest expense, net . . . . . . . . . . . . . . . . . . . . . . . . . . . . . . . . . . . . . (62.9) (29.2) (33.7)
Income before taxes . . . . . . . . . . . . . . . . . . . . . . . . . . . . . . . . . . . . . 380.5 243.5 137.0
Provision for income taxes . . . . . . . . . . . . . . . . . . . . . . . . . . . . . . . . (216.7) (85.5) (131.2)
Net income . . . . . . . . . . . . . . . . . . . . . . . . . . . . . . . . . . . . . . . . . . . . $ 163.8 $ 158.0 $ 5.8
Net Sales
Net sales increased by $223.8 million, or 8.5%, for the year ended December 31, 2012 from the year endedDecember 31, 2011. Net sales increased primarily as a result of increased sales volumes ($214.8 million) andhigher sales prices of corrugated products and containerboard ($9.0 million).
Total corrugated products volume sold increased 6.6% to 34.7 billion square feet in 2012 compared to32.5 billion square feet in 2011. On a comparable shipment-per-workday basis, corrugated products sales volumealso increased 6.6% in 2012 versus 2011. Shipments-per-workday is calculated by dividing our total corrugatedproducts volume during the year by the number of workdays within the year. Both 2012 and 2011 contained 251workdays, those days not falling on a weekend or holiday. Containerboard sales volume to external domestic andexport customers decreased 6.0% to 482,000 tons for the year ended December 31, 2012 from 513,000 tons in2011.
Income from Operations
Income from operations increased by $170.7 million, or 62.6%, for the year ended December 31, 2012compared to 2011. As noted in Note 15 — Alternative Energy Tax Credits to the “Notes to ConsolidatedFinancial Statements,” PCA amended its 2009 federal income tax return to reallocate gallons from the cellulosicbiofuel producer credits to the alternative fuel mixture credits. As a result, income from operations was increasedby $95.5 million in 2012 with an offsetting amount recorded in tax expense of $118.5 million. Excluding specialitems (as detailed below under “Reconciliations of Non-GAAP Financial Measures to Reported Amounts”),income from operations increased $71.4 million for full year 2012. This increase was primarily attributable toincreased sales volumes ($50.7 million), higher sales prices ($9.0 million) and lower costs for energy ($26.5million), recycled fiber ($18.6 million) and chemicals ($7.5 million). These improvements were partially offsetby increased costs for fringe benefits ($11.9 million), depreciation ($11.5 million), labor ($11.2 million), andtransportation ($7.3 million).
Gross profit increased $97.7 million, or 18.0%, for the year ended December 31, 2012 from the year endedDecember 31, 2011. Gross profit as a percentage of net sales increased from 20.7% of net sales in the year ended
18
December 31, 2011 to 22.5% of net sales in the year ended December 31, 2012 primarily due to increasedvolume and prices and reduced costs described above.
Selling and administrative expenses increased $16.8 million, or 8.7%, for the year ended December 31,2012 from the year ended December 31, 2011, primarily as a result of increased costs for salaries ($8.3 million),depreciation ($3.3 million), fringe benefits ($3.0 million), and incentive compensation ($2.5 million).
Corporate overhead for the year ended December 31, 2012 increased $4.6 million, or 7.1%, from the yearended December 31, 2011. The increase was primarily attributable to increased salary and fringe benefitsexpense ($3.8 million) and higher depreciation ($0.6 million).
Other expense, net, increased $1.1 million, or 9.9% for the year ended December 31, 2012 compared to theyear ended December 31, 2011. The increase was primarily due to increased fixed asset disposal costs ($1.1million).
Interest Expense, Net and Income Taxes
Net interest expense increased $33.7 million, or 115.4%, for the year ended December 31, 2012 compared tothe year ended December 31, 2011. The higher interest expense included a $21.3 million premium paid as part ofthe July 2012 redemption of the Company’s 5.75% notes due in 2013 (see Note 8—Debt contained in the “Notesto Consolidated Financial Statements”) and a $3.4 million charge from settling the Company’s 2011 treasurylock prior to its maturity (see Note 9—Derivative Instruments and Hedging Activities contained in the “Notes toConsolidated Financial Statements”). The remaining $9.0 million increase in interest expense was primarily aresult of lower capitalized interest ($6.3 million) related primarily to the Counce, Tennessee linerboard mill andValdosta, Georgia linerboard mill major energy projects and additional interest expense ($2.1 million) related toPCA’s term loan of $150.0 million borrowed in October 2011.
PCA’s effective tax rate was 57.0% for the year ended December 31, 2012, which included a 22.5% higherrate from amending our 2009 tax return in 2012 related to alternative energy tax credits as described in Note 15of the consolidated financial statements. Excluding the amendment, the 2012 effective tax rate would have been34.5% for the year ended December 31, 2012, compared to 35.1% for the year ended December 31, 2011. Theeffective tax rate varies from the U.S. federal statutory tax rate of 35.0% principally due to the impact of thealternative energy tax credits in 2012, state and local income taxes and the domestic manufacturers’ deduction.PCA had no material changes to its reserve for unrecognized tax benefits under ASC 740, “Income Taxes,”during 2012 but does expect a significant change within the next twelve months as described in Note 14 to theconsolidated financial statements.
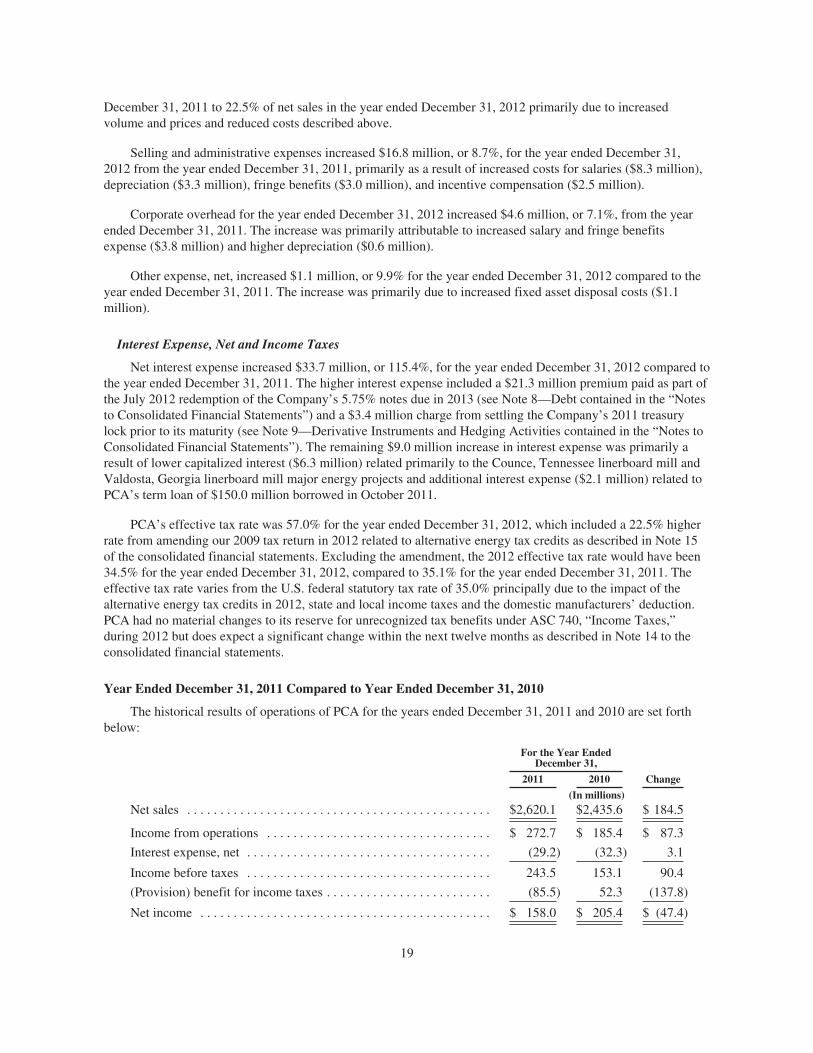
Year Ended December 31, 2011 Compared to Year Ended December 31, 2010
The historical results of operations of PCA for the years ended December 31, 2011 and 2010 are set forthbelow:
For the Year EndedDecember 31,
2011 2010 Change
(In millions)Net sales . . . . . . . . . . . . . . . . . . . . . . . . . . . . . . . . . . . . . . . . . . . . . . $2,620.1 $2,435.6 $ 184.5
Income from operations . . . . . . . . . . . . . . . . . . . . . . . . . . . . . . . . . . $ 272.7 $ 185.4 $ 87.3
Interest expense, net . . . . . . . . . . . . . . . . . . . . . . . . . . . . . . . . . . . . . (29.2) (32.3) 3.1
Income before taxes . . . . . . . . . . . . . . . . . . . . . . . . . . . . . . . . . . . . . 243.5 153.1 90.4
(Provision) benefit for income taxes . . . . . . . . . . . . . . . . . . . . . . . . . (85.5) 52.3 (137.8)
Net income . . . . . . . . . . . . . . . . . . . . . . . . . . . . . . . . . . . . . . . . . . . . $ 158.0 $ 205.4 $ (47.4)
19
Net Sales
Net sales increased by $184.5 million, or 7.6%, for the year ended December 31, 2011 from the year endedDecember 31, 2010. Net sales increased primarily as a result of increased sales volumes of corrugated productsand containerboard ($122.6 million) and higher sales prices of corrugated products and containerboard($61.9 million).
Total corrugated products volume sold increased 5.0% to 32.5 billion square feet in 2011 compared to31.0 billion square feet in 2010. On a comparable shipment-per-workday basis, corrugated products sales volumealso increased 5.0% in 2011 versus 2010. Shipments-per-workday is calculated by dividing our total corrugatedproducts volume during the year by the number of workdays within the year. Both 2011 and 2010 contained 251workdays, those days not falling on a weekend or holiday. Containerboard sales volume to external domestic andexport customers increased 1.2% to 513,000 tons for the year ended December 31, 2011 from 507,000 tons in2010.
Income from Operations
Income from operations increased by $87.3 million, or 47.1%, for the year ended December 31, 2011compared to 2010. As noted in Note 15 to the consolidated financial statements, our 2010 income fromoperations was reduced primarily due to reversing a portion of our 2009 alternative fuel mixture credits out ofincome from operations ($96.0 million) in order to claim cellulosic biofuel credits which were recorded in theprovision for income taxes ($135.5 million) in 2010. In addition, income from operations included alternativefuel mixture credits in the amount of $9.2 million in 2010. Excluding special items (as detailed below under“Reconciliations of Non-GAAP Financial Measures to Reported Amounts”), income from operations decreased$6.8 million for full year 2011. This decrease was primarily attributable to increased costs for transportation($20.5 million), chemicals ($16.7 million), labor ($13.4 million), recycled fiber ($10.0 million), medical andworkers’ compensation ($8.9 million), depreciation ($8.1 million), energy ($4.8 million), the impact of severewinter weather in first quarter 2011 ($3.5 million), legal services ($2.3 million), travel, entertainment andmeetings ($1.9 million), warehousing requirements ($1.7 million), building repairs ($1.5 million), environmentalexpenses ($1.4 million) and other fringe benefits ($1.2 million). These increases were partially offset byincreased sales prices of corrugated products and containerboard ($61.9 million) and higher sales volume($29.4 million).
Gross profit increased $9.7 million, or 1.8%, for the year ended December 31, 2011 from the year endedDecember 31, 2010. Gross profit as a percentage of net sales decreased from 21.9% of net sales in the year endedDecember 31, 2010 to 20.7% of net sales in the year ended December 31, 2011 primarily due to cost increases ona per unit basis described above.
Selling and administrative expenses increased $11.5 million, or 6.3%, for the year ended December 31,2011 from the year ended December 31, 2010, primarily as a result of increased salary expense ($4.3 million)reflecting annual merit increases, fringe benefits ($1.3 million), warehouse costs related to customerrequirements ($1.7 million), travel and meeting costs ($1.6 million) and other increased costs which wereindividually insignificant.
Corporate overhead for the year ended December 31, 2011 increased $6.4 million, or 11.1%, from the yearended December 31, 2010. The increase was primarily attributable to increased salary and fringe benefitexpenses ($4.0 million) and increased costs for professional services related to legal matters ($2.3 million).
Other expense, net, decreased $9.2 million, or 46.3% for the year ended December 31, 2011 compared to theyear ended December 31, 2010. The decrease was primarily due to closure costs at two facilities ($4.2 million)and costs related to the write-off of paper machine assets at Tomahawk ($2.8 million) in 2010 in addition toreduced fixed asset disposal costs ($1.6 million).
20
Interest Expense, Net and Income Taxes
Net interest expense decreased by $3.1 million, or 9.6%, for the year ended December 31, 2011 compared tothe year ended December 31, 2010, primarily as a result of higher capitalized interest ($2.2 million) related to theCounce and Valdosta major energy projects.
PCA’s effective tax rate was 35.1% for the year ended December 31, 2011 compared to (34.2)% for the yearended December 31, 2010. The effective tax rate varies from the U.S. federal statutory tax rate of 35.0%principally due to the impact of the alternative energy tax credits in 2010, state and local income taxes and thedomestic manufacturers’ deduction. PCA recorded a material change in its reserve for unrecognized tax benefitsunder ASC 740, “Income Taxes,” of $102.0 million in the fourth quarter of 2010 due to the amendment of the2009 federal income tax return to claim gallons of alternative fuels produced at the Filer City, Michigan mill.Due to the proprietary nature of the biofuel process at the Filer City mill, uncertainty as to total fuel gallonsqualifying for the credit exists, which caused the additional reserve.
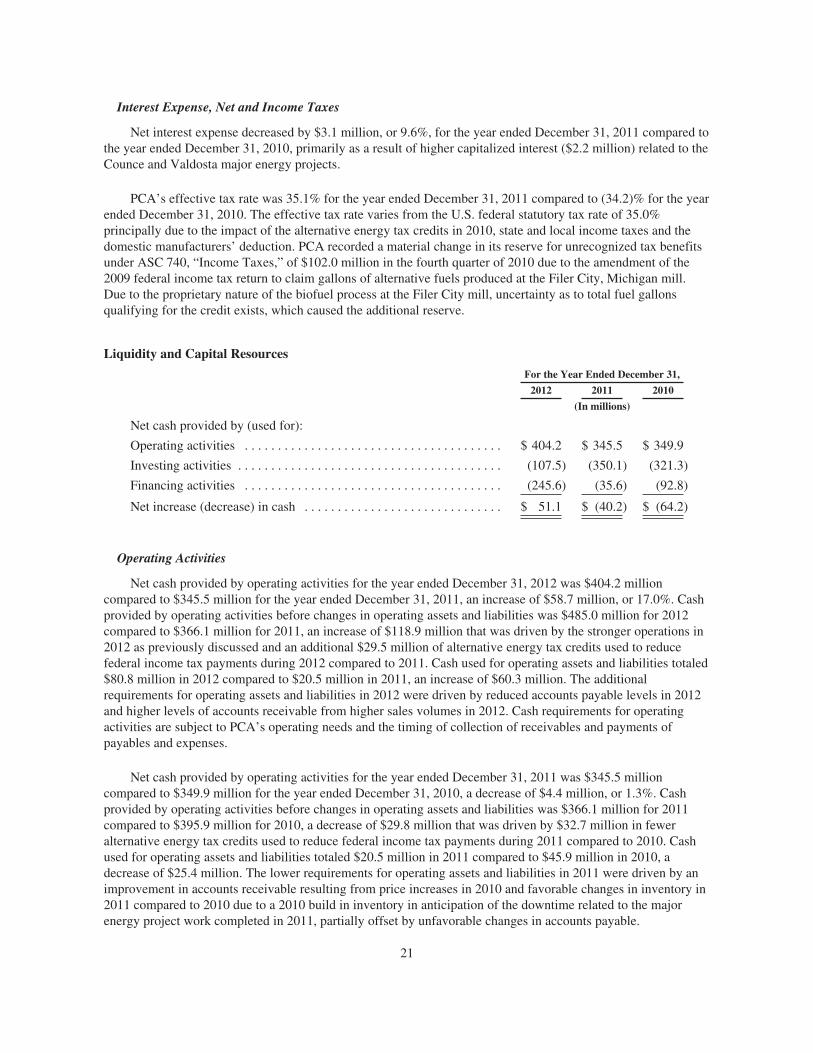
Liquidity and Capital Resources
For the Year Ended December 31,
2012 2011 2010
(In millions)
Net cash provided by (used for):
Operating activities . . . . . . . . . . . . . . . . . . . . . . . . . . . . . . . . . . . . . . . $ 404.2 $ 345.5 $ 349.9
Investing activities . . . . . . . . . . . . . . . . . . . . . . . . . . . . . . . . . . . . . . . . (107.5) (350.1) (321.3)
Financing activities . . . . . . . . . . . . . . . . . . . . . . . . . . . . . . . . . . . . . . . (245.6) (35.6) (92.8)
Net increase (decrease) in cash . . . . . . . . . . . . . . . . . . . . . . . . . . . . . . $ 51.1 $ (40.2) $ (64.2)
Operating Activities
Net cash provided by operating activities for the year ended December 31, 2012 was $404.2 millioncompared to $345.5 million for the year ended December 31, 2011, an increase of $58.7 million, or 17.0%. Cashprovided by operating activities before changes in operating assets and liabilities was $485.0 million for 2012compared to $366.1 million for 2011, an increase of $118.9 million that was driven by the stronger operations in2012 as previously discussed and an additional $29.5 million of alternative energy tax credits used to reducefederal income tax payments during 2012 compared to 2011. Cash used for operating assets and liabilities totaled$80.8 million in 2012 compared to $20.5 million in 2011, an increase of $60.3 million. The additionalrequirements for operating assets and liabilities in 2012 were driven by reduced accounts payable levels in 2012and higher levels of accounts receivable from higher sales volumes in 2012. Cash requirements for operatingactivities are subject to PCA’s operating needs and the timing of collection of receivables and payments ofpayables and expenses.
Net cash provided by operating activities for the year ended December 31, 2011 was $345.5 millioncompared to $349.9 million for the year ended December 31, 2010, a decrease of $4.4 million, or 1.3%. Cashprovided by operating activities before changes in operating assets and liabilities was $366.1 million for 2011compared to $395.9 million for 2010, a decrease of $29.8 million that was driven by $32.7 million in feweralternative energy tax credits used to reduce federal income tax payments during 2011 compared to 2010. Cashused for operating assets and liabilities totaled $20.5 million in 2011 compared to $45.9 million in 2010, adecrease of $25.4 million. The lower requirements for operating assets and liabilities in 2011 were driven by animprovement in accounts receivable resulting from price increases in 2010 and favorable changes in inventory in2011 compared to 2010 due to a 2010 build in inventory in anticipation of the downtime related to the majorenergy project work completed in 2011, partially offset by unfavorable changes in accounts payable.
21
Investing Activities
Net cash used for investing activities for the year ended December 31, 2012 decreased $242.7 million, or69.3%, to $107.5 million, compared to the year ended December 31, 2011. The decrease was related to loweradditions to property, plant and equipment of $151.7 million as our major energy projects were completed in2011, the receipt of $57.4 million in grant proceeds from the U.S. Treasury in 2012 (see Note 19 — U.S.Treasury Grant in the “Notes to Consolidated Financial Statements”), and lower cost of acquisitions of $21.9million and lower additions to long term assets of $12.0 million during 2012 compared to 2011.
Net cash used for investing activities for the year ended December 31, 2011 was $350.1 million, an increaseof $28.8 million, or 9.0%, compared to the year ended December 31, 2010. The increase was primarily related to$57.3 million in corrugated products business acquisitions completed in 2011 and higher additions to other long-term assets of $10.4 million in 2011 compared to 2010. This was partially offset by lower additions to property,plant and equipment of $40.0 million during the year ended December 31, 2011 compared to the same period in2010, primarily due to reduced spending ($55.9 million) on the major energy projects.
As of December 31, 2012, PCA had commitments for general purpose capital expenditures of $27.0 million.PCA believes that cash-on-hand combined with cash flow from operations will be sufficient to fund thesecommitments.
Financing Activities
Net cash used for financing activities totaled $245.6 million for the year ended December 31, 2012compared to $35.6 million for the same period in 2011, an increase of $210.0 million. Payments on long-termdebt, net of proceeds received, were a use of cash of $40.1 million in 2012 compared to a source of cash of$149.3 million in 2011, or a difference of $189.4 million (as discussed in more detail below). Please seeNote 8 — Debt in the “Notes to Consolidated Financial Statements” for a discussion of debt refinancingactivities in 2011 and 2012. Additionally, PCA paid an additional $75.4 million to settle treasury locks in 2012compared to 2011 (please see Note 9 – Derivative Instruments and Hedging Activities in the “Notes toConsolidated Financial Statements” for additional information). Also in 2012, the Company paid higherdividends of $41.8 million (including the $24.5 million of dividends that would have been paid in January of2013 but were accelerated to December of 2012). This was partially offset by lower repurchases of PCA commonstock of $79.9 million and higher proceeds received from stock option exercises of $15.7 million during 2012compared to 2011.
Net cash used for financing activities for the year ended December 31, 2011 was $35.6 million compared to$92.8 million for the year ended December 31, 2010, a decrease of $57.2 million, or 61.6%. During 2011, PCArepurchased an additional $86.1 million of its common stock and paid an additional $14.2 million in dividendsthan it did in 2010. This was more than offset by $150.0 million in proceeds received from borrowing under anew term loan in 2011 and $9.9 million in proceeds received from settling treasury locks in February 2011.
On November 29, 2000, PCA established an on-balance sheet securitization program for its trade accountsreceivable with a $150.0 million receivables-backed revolving credit facility. On October 11, 2011, PCAamended the receivables credit facility agreement to extend the termination date to October 11, 2014 andincrease the borrowing capacity from $150.0 million to $200.0 million. As of December 31, 2012, PCA had$91.0 million in additional borrowing capacity available under this facility and $109.0 million of borrowings wasoutstanding.
On October 11, 2011, PCA replaced its senior credit facility that was scheduled to terminate in April 2013with a new senior credit facility that provides a $150.0 million term loan facility, which PCA fully borrowed, anda $250.0 million revolving credit facility, including a $50.0 million subfacility for letters of credit. Borrowingsmay be used for general corporate purposes and bear interest at LIBOR plus a margin that is determined basedupon PCA’s credit ratings. PCA is required to make quarterly principal payments on the term loan of $3.8million beginning March 31, 2012 through September 30, 2016, with the balance due at maturity. The new senior
22
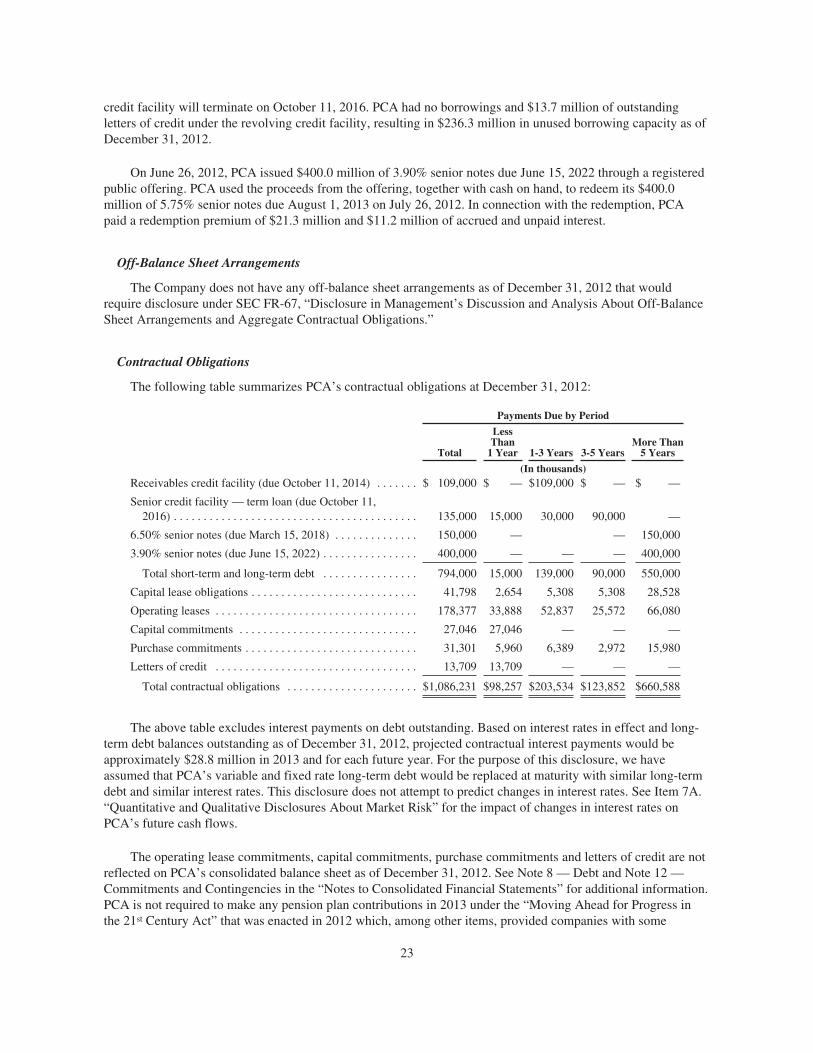
credit facility will terminate on October 11, 2016. PCA had no borrowings and $13.7 million of outstandingletters of credit under the revolving credit facility, resulting in $236.3 million in unused borrowing capacity as ofDecember 31, 2012.
On June 26, 2012, PCA issued $400.0 million of 3.90% senior notes due June 15, 2022 through a registeredpublic offering. PCA used the proceeds from the offering, together with cash on hand, to redeem its $400.0million of 5.75% senior notes due August 1, 2013 on July 26, 2012. In connection with the redemption, PCApaid a redemption premium of $21.3 million and $11.2 million of accrued and unpaid interest.
Off-Balance Sheet Arrangements
The Company does not have any off-balance sheet arrangements as of December 31, 2012 that wouldrequire disclosure under SEC FR-67, “Disclosure in Management’s Discussion and Analysis About Off-BalanceSheet Arrangements and Aggregate Contractual Obligations.”
Contractual Obligations
The following table summarizes PCA’s contractual obligations at December 31, 2012:
Payments Due by Period
Total
LessThan
1 Year 1-3 Years 3-5 YearsMore Than
5 Years
(In thousands)Receivables credit facility (due October 11, 2014) . . . . . . . $ 109,000 $ — $109,000 $ — $ —
Senior credit facility — term loan (due October 11,2016) . . . . . . . . . . . . . . . . . . . . . . . . . . . . . . . . . . . . . . . . . 135,000 15,000 30,000 90,000 —
6.50% senior notes (due March 15, 2018) . . . . . . . . . . . . . . 150,000 — — 150,000
3.90% senior notes (due June 15, 2022) . . . . . . . . . . . . . . . . 400,000 — — — 400,000
Total short-term and long-term debt . . . . . . . . . . . . . . . . 794,000 15,000 139,000 90,000 550,000
Capital lease obligations . . . . . . . . . . . . . . . . . . . . . . . . . . . . 41,798 2,654 5,308 5,308 28,528
Operating leases . . . . . . . . . . . . . . . . . . . . . . . . . . . . . . . . . . 178,377 33,888 52,837 25,572 66,080
Capital commitments . . . . . . . . . . . . . . . . . . . . . . . . . . . . . . 27,046 27,046 — — —
Purchase commitments . . . . . . . . . . . . . . . . . . . . . . . . . . . . . 31,301 5,960 6,389 2,972 15,980
Letters of credit . . . . . . . . . . . . . . . . . . . . . . . . . . . . . . . . . . 13,709 13,709 — — —
Total contractual obligations . . . . . . . . . . . . . . . . . . . . . . $1,086,231 $98,257 $203,534 $123,852 $660,588
The above table excludes interest payments on debt outstanding. Based on interest rates in effect and long-term debt balances outstanding as of December 31, 2012, projected contractual interest payments would beapproximately $28.8 million in 2013 and for each future year. For the purpose of this disclosure, we haveassumed that PCA’s variable and fixed rate long-term debt would be replaced at maturity with similar long-termdebt and similar interest rates. This disclosure does not attempt to predict changes in interest rates. See Item 7A.“Quantitative and Qualitative Disclosures About Market Risk” for the impact of changes in interest rates onPCA’s future cash flows.
The operating lease commitments, capital commitments, purchase commitments and letters of credit are notreflected on PCA’s consolidated balance sheet as of December 31, 2012. See Note 8 — Debt and Note 12 —Commitments and Contingencies in the “Notes to Consolidated Financial Statements” for additional information.PCA is not required to make any pension plan contributions in 2013 under the “Moving Ahead for Progress inthe 21st Century Act” that was enacted in 2012 which, among other items, provided companies with some
23
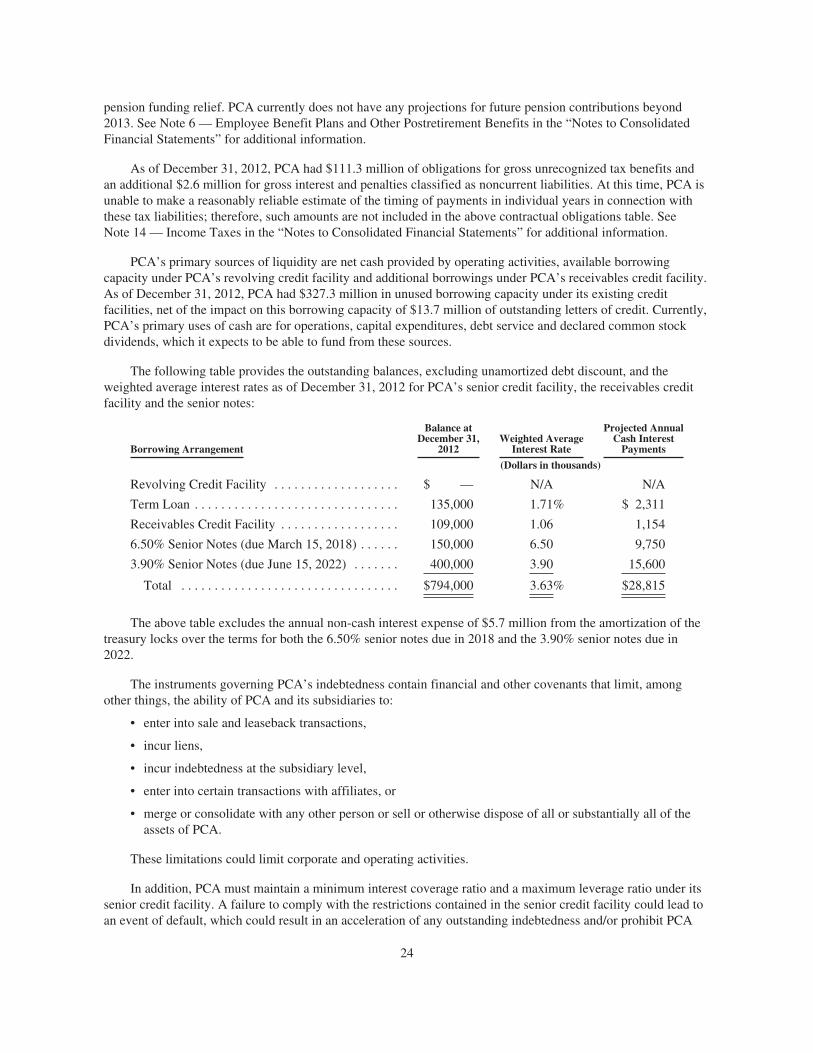
pension funding relief. PCA currently does not have any projections for future pension contributions beyond2013. See Note 6 — Employee Benefit Plans and Other Postretirement Benefits in the “Notes to ConsolidatedFinancial Statements” for additional information.
As of December 31, 2012, PCA had $111.3 million of obligations for gross unrecognized tax benefits andan additional $2.6 million for gross interest and penalties classified as noncurrent liabilities. At this time, PCA isunable to make a reasonably reliable estimate of the timing of payments in individual years in connection withthese tax liabilities; therefore, such amounts are not included in the above contractual obligations table. SeeNote 14 — Income Taxes in the “Notes to Consolidated Financial Statements” for additional information.
PCA’s primary sources of liquidity are net cash provided by operating activities, available borrowingcapacity under PCA’s revolving credit facility and additional borrowings under PCA’s receivables credit facility.As of December 31, 2012, PCA had $327.3 million in unused borrowing capacity under its existing creditfacilities, net of the impact on this borrowing capacity of $13.7 million of outstanding letters of credit. Currently,PCA’s primary uses of cash are for operations, capital expenditures, debt service and declared common stockdividends, which it expects to be able to fund from these sources.
The following table provides the outstanding balances, excluding unamortized debt discount, and theweighted average interest rates as of December 31, 2012 for PCA’s senior credit facility, the receivables creditfacility and the senior notes:
Borrowing Arrangement
Balance atDecember 31,
2012Weighted Average
Interest Rate
Projected AnnualCash Interest
Payments
(Dollars in thousands)
Revolving Credit Facility . . . . . . . . . . . . . . . . . . . $ — N/A N/A
Term Loan . . . . . . . . . . . . . . . . . . . . . . . . . . . . . . . 135,000 1.71% $ 2,311
Receivables Credit Facility . . . . . . . . . . . . . . . . . . 109,000 1.06 1,154
6.50% Senior Notes (due March 15, 2018) . . . . . . 150,000 6.50 9,750
3.90% Senior Notes (due June 15, 2022) . . . . . . . 400,000 3.90 15,600
Total . . . . . . . . . . . . . . . . . . . . . . . . . . . . . . . . . $794,000 3.63% $28,815
The above table excludes the annual non-cash interest expense of $5.7 million from the amortization of thetreasury locks over the terms for both the 6.50% senior notes due in 2018 and the 3.90% senior notes due in2022.
The instruments governing PCA’s indebtedness contain financial and other covenants that limit, amongother things, the ability of PCA and its subsidiaries to:
• enter into sale and leaseback transactions,
• incur liens,
• incur indebtedness at the subsidiary level,
• enter into certain transactions with affiliates, or
• merge or consolidate with any other person or sell or otherwise dispose of all or substantially all of theassets of PCA.
These limitations could limit corporate and operating activities.
In addition, PCA must maintain a minimum interest coverage ratio and a maximum leverage ratio under itssenior credit facility. A failure to comply with the restrictions contained in the senior credit facility could lead toan event of default, which could result in an acceleration of any outstanding indebtedness and/or prohibit PCA
24
from drawing on its senior credit facility. Such acceleration may also constitute events of default under the seniornotes indentures and the receivables credit facility. At December 31, 2012, PCA was in compliance with thesecovenants.
PCA currently expects to incur normal capital expenditures of about $125.0 million in 2013, primarily formaintenance capital, cost reduction, business growth and environmental compliance, plus $50.0 million for eitherbox plant acquisitions or strategic investments in our existing box plants.
PCA believes that net cash generated from operating activities, cash on hand, available borrowings under itscommitted credit facilities and available capital through access to capital markets will be adequate to meet itsliquidity and capital requirements, including payments of any declared common stock dividends, for theforeseeable future. As its debt or credit facilities become due, PCA will need to repay, extend or replace suchfacilities. Its ability to do so will be subject to future economic conditions and financial, business and otherfactors, many of which are beyond PCA’s control.
Environmental Matters
PCA is subject to, and must comply with, a variety of federal, state and local environmental laws,particularly those relating to air and water quality, waste disposal and the cleanup of contaminated soil andgroundwater. The most significant of these laws affecting the Company are:
• Resource Conservation and Recovery Act (RCRA);
• Clean Water Act (CWA);
• Clean Air Act (CAA);
• The Emergency Planning and Community Right-to-Know-Act (EPCRA);
• Toxic Substance Control Act (TSCA); and
• Safe Drinking Water Act (SDWA).
PCA believes that it is currently in material compliance with these and all applicable environmental rulesand regulations. Because environmental regulations are constantly evolving, the Company has incurred, and willcontinue to incur, costs to maintain compliance with these and other environmental laws. The Company worksdiligently to anticipate and budget for the impact of applicable environmental regulations, and does not currentlyexpect that future environmental compliance obligations will materially affect its business or financial condition.For the years ended December 31, 2012, 2011 and 2010, we spent $25.8 million, $26.0 million and $24.6million, respectively, to comply with the requirements of these and other environmental laws.
As is the case with any industrial operation, PCA has, in the past, incurred costs associated with theremediation of soil or groundwater contamination, as required by the federal Comprehensive EnvironmentalResponse, Compensation and Liability Act, commonly known as the federal “Superfund” law, and analogousstate laws. Cleanup requirements arise with respect to properties the Company currently owns or operates, formerfacilities and off-site facilities where the Company has disposed of hazardous substances. As part of the sale toPCA of the containerboard and corrugated products business of Pactiv Corporation in April 1999, Pactiv agreedto retain all liability for all former facilities and all sites associated with pre-closing off-site waste disposal.Pactiv also retained environmentally impaired real property in Filer City, Michigan unrelated to current milloperations.
In 2004, the U.S. Environmental Protection Agency (the “EPA”) published the Boiler MACT regulations,establishing air emissions standards and certain other requirements for industrial boilers. These regulations werevacated and remanded by the U.S. Court of Appeals for the D.C. Circuit in 2007. The EPA proposed finalregulations in March 2011, and concurrently announced its intent to reconsider certain provisions of the finalrule. In December 2011, the EPA published proposed rules containing changes to the March 2011 rules and
25
requested public comment on several of the rule revisions. After reviewing public comments, the EPA publisheda revised final rule in January 2013. The January 2013 rule establishes a three year deadline for compliancewhich states are authorized to extend by an additional year if they so elect. PCA is currently assessing the impactof these regulations, which are expected to require modifications to or replacement of certain of PCA’s boilers.PCA currently estimates that compliance with the final rule will require capital expenditures between $45.0million and $55.0 million over the next three years. Due to the complexity of these regulations, and the potentialfor additional future regulatory or judicial modification to these regulations, this estimate is subject to furtherrevisions. We currently estimate capital expenditures to comply with Boiler MACT regulations in 2013 of up to$10.0 million and expect other environmental capital expenditures of about $2.0 million in 2013. Total capitalexpenditures for environmental matters were $1.8 million, $2.8 million and $1.1 million for 2012, 2011 and2010, respectively.
Because liability for remediation costs under environmental laws is strict, meaning that liability is imposedwithout fault, joint and several, meaning that liability is imposed on each party without regard to contribution,and retroactive, PCA could receive notifications of cleanup liability in the future and this liability could bematerial. From 1994 through 2012, remediation costs at PCA’s mills and corrugated plants totaled approximately$3.2 million. As of December 31, 2012, PCA maintained an environmental reserve of $11.7 million relating toon-site landfills and surface impoundments as well as ongoing and anticipated remedial projects. As of this filing,the Company believes that it is not reasonably possible that future environmental expenses above the$11.7 million accrued as of December 31, 2012 will have a material impact on its financial condition, results ofoperations and cash flows.
While legislation regarding the regulation of greenhouse gas emissions has been proposed at the federallevel, it is uncertain whether such legislation will be passed and, if so, what the breadth and scope of suchlegislation will be. The result of the regulation of greenhouse gas emissions could be an increase in our futureenvironmental compliance costs, through caps, taxes or additional capital expenditures to modify facilities, whichmay be material. However, climate change legislation and the resulting future energy policy could also provideus with opportunities if the use of renewable energy is encouraged. We currently generate a significant portion ofour power requirements for our mills using bark, black liquor and biomass as fuel, which are derived fromrenewable resources. While we believe we are well-positioned to take advantage of any renewable energyincentives, it is uncertain what the ultimate costs and opportunities of any climate change legislation will be andhow our business and industry will be affected.
Critical Accounting Policies
Management’s discussion and analysis of PCA’s financial condition and results of operations are basedupon the Company’s consolidated financial statements, which have been prepared in accordance with accountingprinciples generally accepted in the United States of America. The preparation of these financial statementsrequires the Company to make estimates and judgments that affect the reported amounts of assets, liabilities,revenues and expenses, and related disclosures of contingent assets and liabilities. On an ongoing basis, PCAevaluates its estimates, including those related to bad debts, inventories, goodwill and intangible assets, pensionsand other postretirement benefits, income taxes, environmental liabilities, stock based compensation, andcontingencies and litigation. PCA bases its estimates on historical experience and on various other assumptionsthat are believed to be reasonable under the circumstances, the results of which form the basis for makingjudgments about the carrying values of assets and liabilities that are not readily apparent from other sources.Actual results may differ from these estimates under different assumptions or conditions.
PCA believes the following critical accounting policies affect its more significant judgments and estimatesused in the preparation of its consolidated financial statements. For a further discussion on the application of theseand other accounting policies, see Note 2 — Summary of Significant Accounting Policies in the “Notes toConsolidated Financial Statements” included elsewhere in this report.
26
Accounts Receivable — Allowance for Doubtful Accounts and Customer Deductions
PCA evaluates the collectibility of its accounts receivable based upon a combination of factors. Incircumstances where the Company is aware of a specific customer’s inability to meet its financial obligations(e.g., bankruptcy filings, substantial downgrading of credit sources), PCA records a specific reserve for bad debtsagainst amounts due to reduce the net recorded receivable to the amount the Company reasonably believes willbe collected. For all other customers, the Company recognizes reserves for bad debts based on its historicalcollection experience. If the Company’s collection experience deteriorates (i.e., higher than expected defaults oran unexpected material adverse change in a major customer’s ability to meet its financial obligations), PCA’sestimates of the recoverability of amounts due could be reduced by a material amount.
The customer deductions reserve represents the estimated amount required for customer returns, allowancesand earned discounts. Based on PCA’s experience, customer returns, allowances and earned discounts haveaveraged 1.0% of its gross selling price. Accordingly, the Company reserves 1.0% of its open customer accountsreceivable balance for these items.
As of December 31, 2012, the balance in the allowance for doubtful accounts reserve was $1.9 million,which was unchanged compared to the December 31, 2011 reserve. For the year ended December 31, 2012, theCompany recorded expense related to doubtful accounts of $1.0 million compared to expense of $0.1 millionrecorded during the year ended December 31, 2011. The increase in bad debt expense of $0.9 million was due toexpense from customers who had filed for bankruptcy or had liquidated. For the year ended December 31, 2011,the Company recorded expense of $0.1 million related to doubtful accounts compared to income of $0.9 millionin 2010. The income in 2010 of $0.9 million was primarily due to a $1.0 million reduction in the allowance fordoubtful accounts reserve to reflect the low level of actual losses over the previous three years.
Inventories
PCA records its inventories at the lower of cost or market and includes all costs directly associated withmanufacturing products: materials, labor and manufacturing overhead. The estimated market value is based onassumptions for future demand and related pricing. If actual market conditions are less favorable than thoseprojected by management, reductions in the carrying value of inventories may be required. Raw materials, workin process and finished goods valued using the last-in, first-out (“LIFO”) cost method comprised 58% and 61%of inventories at current cost at December 31, 2012 and 2011, respectively. Supplies and materials inventoriesare valued using a moving average cost.
Pension and Postretirement Benefits
The Company accounts for defined benefit pension plans and postretirement plans in accordance withAccounting Standards Codification (“ASC”) 715, “Compensation — Retirement Benefits.”
One of the principal assumptions used to calculate net periodic pension cost is the expected long-term rateof return on plan assets. The expected long-term rate of return on plan assets may result in recognized returns thatare greater or less than the actual returns on those plan assets in any given year. Over time, however, the expectedlong-term rate of return on plan assets is designed to approximate the actual long term returns.
The discount rate assumptions used to calculate net periodic pension and postretirement costs reflect therates available on high-quality, fixed-income debt instruments on December 31. The rate of compensationincrease is another significant assumption used to calculate net periodic pension cost and is determined by PCAbased upon annual reviews.
For postretirement health care plan accounting, PCA reviews external data and its own historical trends forhealth care costs to determine the health care cost trend rate assumption.
27
Environmental Liabilities
PCA accounts for its retirement obligations related to its landfills under ASC 410, “Asset Retirement andEnvironmental Obligations,” which requires legal obligations associated with the retirement of long-lived assetsto be recognized at their fair value at the time that the obligations are incurred. Upon initial recognition of aliability, that cost is capitalized as part of the related long-lived asset and amortized to expense over the usefullife of the asset.
The potential costs for various environmental matters are uncertain due to such factors as the unknownmagnitude of possible cleanup costs, the complexity and evolving nature of governmental laws and regulationsand their interpretations, and the timing, varying costs and effectiveness of alternative cleanup technologies.Liabilities recorded for environmental contingencies are estimates of the probable costs based upon availableinformation and assumptions. Because of these uncertainties, however, the Company’s estimates may change.PCA believes that any additional costs identified as further information becomes available would not have amaterial effect on its financial statements.
In connection with the sale to PCA of the containerboard and corrugated products business of PactivCorporation in April 1999, Pactiv agreed to retain all liability for all former facilities and all sites associated withoff-site waste disposal prior to April 12, 1999. Pactiv also retained the environmental liability for a closedlandfill located near the Filer City mill.
Revenue Recognition
PCA recognizes revenue as title to the products is transferred to customers. Shipping and handling costs areincluded in cost of sales. Shipping and handling billings to a customer are included in net sales. In addition, PCAoffers volume rebates to certain of its customers. The total cost of these programs is estimated and accrued as areduction to net sales at the time of the respective sale.
Impairment of Goodwill and Long-Lived Assets
Goodwill is tested for impairment annually at year end or sooner if events or changes in circumstancesindicate that the carrying amount may exceed fair value. Recoverability of goodwill is determined by comparingthe fair value of the reporting unit with its carrying value, including goodwill. If the carrying amount of thereporting unit exceeds the fair value, the implied fair value of the reporting unit’s goodwill is compared to thecarrying amount of its goodwill to determine if a write-down to fair value is necessary.
Long-lived assets other than goodwill are reviewed for impairment whenever events or changes incircumstances indicate that the carrying amount of any long-lived asset may not be fully recoverable. In the eventthat facts and circumstances indicate that the carrying amount of any long-lived assets may be impaired, anevaluation of recoverability would be performed. If an evaluation were required, the estimated futureundiscounted cash flows associated with the asset (or group of assets) would be compared to the asset’s (or groupof assets’) carrying amount to determine if a write-down to fair value is required.
Stock-Based Compensation
PCA measures and records stock-based compensation cost in accordance with ASC 718, “Compensation —Stock Compensation.” Stock compensation cost includes: (a) compensation cost for all share-based paymentsgranted prior to, but not vested as of January 1, 2006, the effective date of ASC 718, and (b) compensation costsfor all share-based payments granted subsequent to January 1, 2006. The grant date fair value is estimated inaccordance with the provisions of ASC 718.
PCA recognizes compensation expense associated with option awards ratably over their vesting periods.The Company uses the Black-Scholes-Merton option-pricing model to estimate the fair value of each optiongrant as of the date of grant. Expected volatilities are based on historical volatility of the Company’s commonstock. The expected life of the option is estimated using historical data pertaining to option exercises and
28
employee terminations. Separate groups of employees that have similar historical exercise behavior areconsidered separately for estimating the expected life. The risk-free interest rate is based on U.S. Treasury yieldsin effect at the time of grant. The Company has not granted any option awards since 2007.
The fair value of restricted stock awards is determined based on the closing price of PCA’s common stockon the grant date. The Company generally recognizes compensation expense associated with restricted stockawards ratably over their vesting periods. As PCA’s Board of Directors has the ability to accelerate the vesting ofrestricted stock upon an employee’s retirement, the Company accelerates the recognition of compensationexpense for certain employees approaching normal retirement age.
Income Taxes
PCA’s annual tax rate is determined based on income, statutory tax rates and the tax impacts of itemstreated differently for tax purposes than for financial reporting purposes. Tax law requires some items to beincluded in the tax return at different times than the items reflected in the financial statements. As a result, theannual tax rate in the financial statements is different than the rate reported on PCA’s tax return. Some of thesedifferences are permanent, such as expenses that are not deductible in the tax return, and some differences aretemporary, reversing over time, such as depreciation expense. These temporary differences create deferred taxassets and liabilities.
Inherent in determining the annual tax rate are judgments regarding business plans, planning opportunitiesand expectations about future outcomes. Significant management judgments are required for the following items:
• Management reviews PCA’s deferred tax assets for realizability. Valuation allowances are establishedwhen management believes that it is more likely than not that some portion of the deferred tax assets willnot be realized. Changes in valuation allowances from period to period are included in the tax provision.
• PCA establishes accruals for unrecognized tax benefits when, despite the belief that PCA’s tax returnpositions are fully supported, PCA believes that an uncertain tax position does not meet the recognitionthreshold of ASC 740, “Income Taxes.” The tax contingency accruals are adjusted in light of changingfacts and circumstances, such as the progress of tax audits, the expiration of the statute of limitations forthe relevant taxing authority to examine a tax return, case law and emerging legislation. While it isdifficult to predict the final outcome or timing of resolution for any particular tax matter, PCA believesthat the accruals for unrecognized tax benefits at December 31, 2012 reflect the likely outcome of knowntax contingencies as of such date in accordance with accounting for uncertainty in income taxes underASC 740.
29
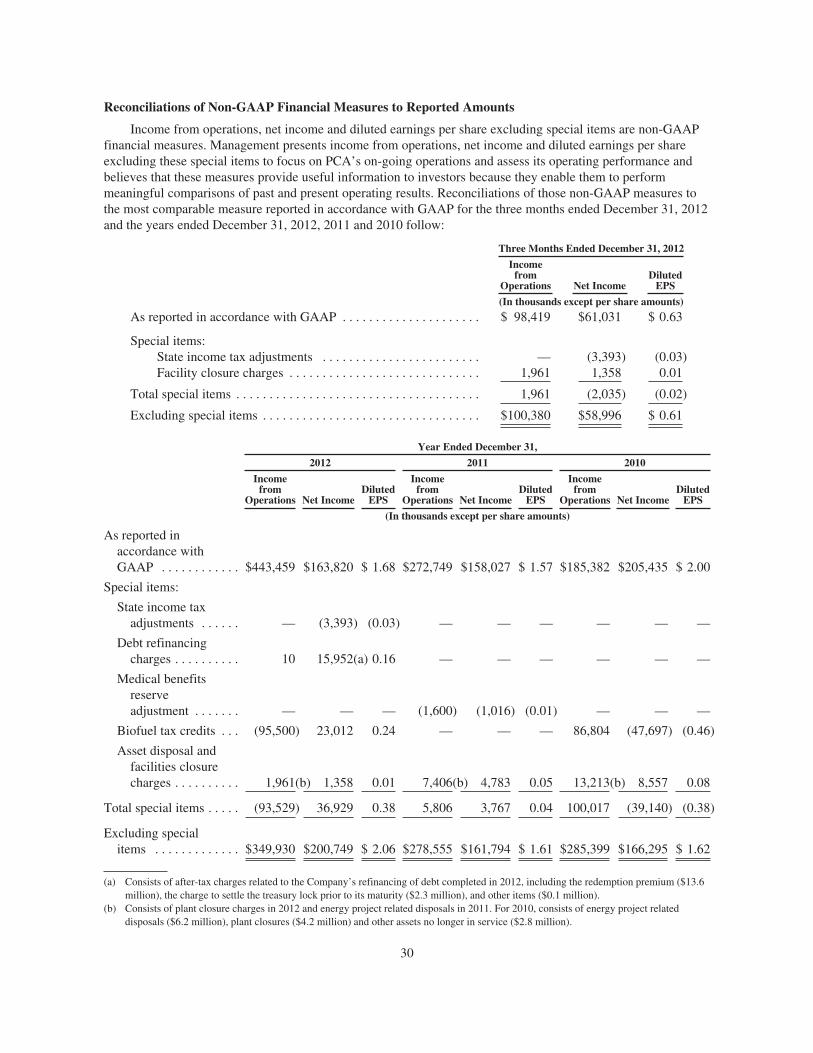
Reconciliations of Non-GAAP Financial Measures to Reported Amounts
Income from operations, net income and diluted earnings per share excluding special items are non-GAAPfinancial measures. Management presents income from operations, net income and diluted earnings per shareexcluding these special items to focus on PCA’s on-going operations and assess its operating performance andbelieves that these measures provide useful information to investors because they enable them to performmeaningful comparisons of past and present operating results. Reconciliations of those non-GAAP measures tothe most comparable measure reported in accordance with GAAP for the three months ended December 31, 2012and the years ended December 31, 2012, 2011 and 2010 follow:
Three Months Ended December 31, 2012
Incomefrom
Operations Net IncomeDiluted
EPS
(In thousands except per share amounts)
As reported in accordance with GAAP . . . . . . . . . . . . . . . . . . . . . $ 98,419 $61,031 $ 0.63
Special items:State income tax adjustments . . . . . . . . . . . . . . . . . . . . . . . . — (3,393) (0.03)Facility closure charges . . . . . . . . . . . . . . . . . . . . . . . . . . . . . 1,961 1,358 0.01
Total special items . . . . . . . . . . . . . . . . . . . . . . . . . . . . . . . . . . . . . 1,961 (2,035) (0.02)
Excluding special items . . . . . . . . . . . . . . . . . . . . . . . . . . . . . . . . . $100,380 $58,996 $ 0.61
Year Ended December 31,
2012 2011 2010
Incomefrom
Operations Net IncomeDiluted
EPS
Incomefrom
Operations Net IncomeDiluted
EPS
Incomefrom
Operations Net IncomeDiluted
EPS
(In thousands except per share amounts)
As reported inaccordance withGAAP . . . . . . . . . . . . $443,459 $163,820 $ 1.68 $272,749 $158,027 $ 1.57 $185,382 $205,435 $ 2.00
Special items:
State income taxadjustments . . . . . . — (3,393) (0.03) — — — — — —
Debt refinancingcharges . . . . . . . . . . 10 15,952(a) 0.16 — — — — — —
Medical benefitsreserveadjustment . . . . . . . — — — (1,600) (1,016) (0.01) — — —
Biofuel tax credits . . . (95,500) 23,012 0.24 — — — 86,804 (47,697) (0.46)
Asset disposal andfacilities closurecharges . . . . . . . . . . 1,961(b) 1,358 0.01 7,406(b) 4,783 0.05 13,213(b) 8,557 0.08
Total special items . . . . . (93,529) 36,929 0.38 5,806 3,767 0.04 100,017 (39,140) (0.38)
Excluding specialitems . . . . . . . . . . . . . $349,930 $200,749 $ 2.06 $278,555 $161,794 $ 1.61 $285,399 $166,295 $ 1.62
(a) Consists of after-tax charges related to the Company’s refinancing of debt completed in 2012, including the redemption premium ($13.6million), the charge to settle the treasury lock prior to its maturity ($2.3 million), and other items ($0.1 million).
(b) Consists of plant closure charges in 2012 and energy project related disposals in 2011. For 2010, consists of energy project relateddisposals ($6.2 million), plant closures ($4.2 million) and other assets no longer in service ($2.8 million).
30
Item 7A. QUANTITATIVE AND QUALITATIVE DISCLOSURES ABOUT MARKET RISK
PCA is exposed to the impact of interest rate changes and changes in the market value of its financialinstruments. PCA periodically enters into derivatives in order to minimize these risks, but not for tradingpurposes. For a discussion of derivatives and hedging activities, see Note 9 — Derivative Instruments andHedging Activities to the “Notes to Consolidated Financial Statements” included elsewhere in the report.
The interest rates on approximately 69% of PCA’s debt are fixed. A one percent increase in interest ratesrelated to variable rate debt would have resulted in an increase in interest expense and a corresponding decreasein income before taxes of $2.4 million annually.
Item 8. FINANCIAL STATEMENTS AND SUPPLEMENTARY DATA
The response to this item is included in a separate section of this report beginning on page F-1, which isincorporated by reference herein.
Item 9. CHANGES IN AND DISAGREEMENTS WITH ACCOUNTANTS ON ACCOUNTING ANDFINANCIAL DISCLOSURES
None.
Item 9A. CONTROLS AND PROCEDURES
Controls and Procedures
PCA maintains disclosure controls and procedures (as defined in Rule 13a-15(e) of the Securities ExchangeAct of 1934) that are designed to provide reasonable assurance that information required to be disclosed inPCA’s filings under the Securities Exchange Act is recorded, processed, summarized and reported within theperiods specified in the rules and forms of the SEC and that such information is accumulated and communicatedto PCA’s management, including its Chief Executive Officer and Chief Financial Officer, as appropriate, toallow timely decisions regarding required disclosure.
Prior to filing this report, PCA completed an evaluation under the supervision and with the participation ofPCA’s management, including PCA’s Chief Executive Officer and Chief Financial Officer, of the effectivenessof the design and operation of PCA’s disclosure controls and procedures as of December 31, 2012. Theevaluation of PCA’s disclosure controls and procedures included a review of the controls’ objectives and design,PCA’s implementation of the controls and the effect of the controls on the information generated for use in thisreport. Based on this evaluation, PCA’s Chief Executive Officer and Chief Financial Officer concluded thatPCA’s disclosure controls and procedures were effective at the reasonable assurance level as of December 31,2012.
During the quarter ended December 31, 2012, there were no changes in internal controls over financialreporting that have materially affected, or are reasonably likely to materially affect, PCA’s internal control overfinancial reporting.
Management’s Report on Internal Control Over Financial Reporting
PCA’s management is responsible for establishing and maintaining adequate internal control over financialreporting, as such term is defined in Exchange Act Rule 13a-15(f). Internal control over financial reporting is aprocess designed to provide reasonable assurance regarding the reliability of financial reporting and thepreparation of financial statements for external purposes in accordance with generally accepted accountingprinciples. Internal control over financial reporting includes those policies and procedures that (1) pertain to themaintenance of records that, in reasonable detail, accurately and fairly reflect the transactions and dispositions of
31
the Company’s assets; (2) provide reasonable assurance that transactions are recorded as necessary to permitpreparation of financial statements in accordance with generally accepted accounting principles, and that receiptsand expenditures are being made only with proper authorizations; and (3) provide reasonable assurance regardingprevention or timely detection of unauthorized acquisition, use, or disposition of the Company’s assets that couldhave a material effect on the financial statements.
Because of its inherent limitations, PCA’s internal control over financial reporting may not prevent or detectmisstatements. A control system, no matter how well conceived and operated, can provide only reasonable, notabsolute, assurance that objectives of the control system are met. Because of the inherent limitations in all controlsystems, no evaluation of controls can provide absolute assurance that all control issues and instances of fraud, ifany, have been detected. Also, projections of any evaluation of effectiveness to future periods are subject to therisk that controls become inadequate because of changes in conditions, or that the degree of compliance with thepolicies and procedures may deteriorate.
PCA’s management, under the supervision of and with the participation of the Chief Executive Officer andChief Financial Officer, assessed the Company’s internal control over financial reporting as of December 31,2012, based on criteria for effective control over financial reporting described in “Internal Control — IntegratedFramework” issued by the Committee of Sponsoring Organizations of the Treadway Commission. Based on thisassessment, PCA’s management concluded that its internal control over financial reporting was effective as ofDecember 31, 2012, based on the specified criteria.
Ernst & Young LLP, the independent registered public accounting firm that audited PCA’s financialstatements included in this Form 10-K, has also audited the effectiveness of the Company’s internal control overfinancial reporting. Their attestation report precedes PCA’s audited financial statements included elsewhere inthis report.
Item 9B. OTHER INFORMATION
Because this Annual Report on Form 10-K is being filed within four business days after the applicabletriggering event, the below disclosure is being made under Part II, Item 9B of this Annual Report on From 10-Kinstead of under Item 5.02 (Departure of Directors or Certain Officers; Election of Directors; Appointment ofCertain Officers; Compensatory Arrangements of Certain Officers) of Form 8-K.
On February 28, 2013, PCA approved amendments to PCA’s Supplemental Executive Retirement Plan. Theamended plan replaces the 35-year service cap applicable to payment of benefits to Thomas A. Hassfurther andThomas W.H. Walton with a 45-year cap. The amendments to the plan are filed herewith as Exhibits 10.22 and10.23 hereto, which are incorporated by reference herein.
PART III
Item 10. DIRECTORS, EXECUTIVE OFFICERS AND CORPORATE GOVERNANCE
Information regarding PCA’s executive officers required by this Item 10 is set forth in Item 4.1 of Part I ofthis report.
The following information required by this Item 10 will be included in PCA’s Proxy Statement for the 2013Annual Meeting of Stockholders and is incorporated by reference herein:
• Information regarding PCA’s directors included under the caption “Election of Directors”
• Information regarding PCA’s Audit Committee and financial experts included under the caption “Electionof Directors — Audit Committee”
• Information regarding PCA’s code of ethics included under the caption “Election of Directors — Code ofEthics”
32
• Information regarding PCA’s stockholder nominating procedures included under the captions “Election ofDirectors — Nominating and Governance Committee,” “Other Information — Recommendations forBoard — Nominated Director Nominees,” and “Other Information — Procedures for NominatingDirectors or Bringing Business Before the 2014 Annual Meeting”
• Information regarding compliance with Section 16(a) of the Securities Exchange Act of 1934 includedunder the caption “Section 16(a) Beneficial Ownership Reporting Compliance”
Item 11. EXECUTIVE COMPENSATION
Information with respect to executive compensation required by this Item 11 will be included in PCA’sProxy Statement under the captions “Compensation Discussion and Analysis,” “Executive Officer and DirectorCompensation” (including all subcaptions and tables thereunder) and “Board Committees — CompensationCommittee” and is incorporated herein by reference.
Item 12. SECURITY OWNERSHIP OF CERTAIN BENEFICIAL OWNERS AND MANAGEMENT ANDRELATED STOCKHOLDER MATTERS
Information with respect to security ownership of certain beneficial owners and management required bythis Item 12 will be included in PCA’s Proxy Statement under the caption “Ownership of Our Stock” and isincorporated herein by reference.
Authorization of Securities under Equity Compensation Plans. Securities authorized for issuance underequity compensation plans at December 31, 2012 are as follows:
Plan Category
Number ofSecurities to
be IssuedUpon Exercise of
OutstandingOptions and
Rights(a)
WeightedAverageExercisePrice of
OutstandingOptions and
Rights
Number ofSecuritiesRemaining
Available forFuture
IssuanceUnder EquityCompensation
Plans(b)
Equity compensation plans approved by security holders . . . . . . . . . 278,580 $23.65 509,042
Equity compensation plans not approved by security holders . . . . . . — — —
Total . . . . . . . . . . . . . . . . . . . . . . . . . . . . . . . . . . . . . . . . . . . . . . . . 278,580 $23.65 509,042
(a) Does not include 1,771,664 shares of unvested restricted stock granted pursuant to our Amended andRestated 1999 Long-Term Equity Incentive Plan.
(b) Excludes securities reflected in the first column, “Number of securities to be issued upon exercise ofoutstanding options and rights.”
Item 13. CERTAIN RELATIONSHIPS AND RELATED TRANSACTIONS, AND DIRECTORINDEPENDENCE
Information with respect to certain relationships and related transactions and director independence requiredby this Item 13 will be included in PCA’s Proxy Statement under the captions “Transactions with RelatedPersons” and “Election of Directors — Determination of Director Independence,” respectively, and isincorporated herein by reference.
Item 14. PRINCIPAL ACCOUNTANT FEES AND SERVICES
Information with respect to fees and services of the principal accountant required by this Item 14 will beincluded in PCA’s Proxy Statement under the caption “Ratification of Appointment of the Independent
33
Registered Public Accounting Firm” under the subcaptions “— Fees to the Independent Registered PublicAccounting Firm” and “— Audit Committee Preapproval Policy for Audit and Non-Audit Fees” and areincorporated herein by reference.
PART IV
Item 15. EXHIBITS, FINANCIAL STATEMENT SCHEDULES
(a) The following documents are filed as a part of this report:
(1) The financial statements listed in the “Index to Financial Statements.”
(2) Financial Statement Schedule.
The following consolidated financial statement schedule of PCA for the years ended December 31, 2012,2011 and 2010 is included in this report.
Schedule II — Packaging Corporation of America — Valuation and Qualifying Accounts.
Description
BalanceBeginning of
Year
Chargedto
Expenses Deductions
BalanceEnd ofYear
(Dollars in thousands)
Year ended December 31, 2012:
Deducted from assets accounts:
Allowance for doubtful accounts . . . . . . . . . . . . $1,906 $ 1,043 $ (1,040)(1)$1,909
Reserve for customer deductions . . . . . . . . . . . . 3,128 31,045 (30,729)(2) 3,444
Total . . . . . . . . . . . . . . . . . . . . . . . . . . . . . . . . $5,034 $32,088 $(31,769) $5,353
Year ended December 31, 2011:
Deducted from assets accounts:
Allowance for doubtful accounts . . . . . . . . . . . . $2,493 $ 143 $ (730)(1)$1,906
Reserve for customer deductions . . . . . . . . . . . . 2,920 30,009 (29,801)(2) 3,128
Total . . . . . . . . . . . . . . . . . . . . . . . . . . . . . . . . $5,413 $30,152 $(30,531) $5,034
Year ended December 31, 2010:
Deducted from assets accounts:
Allowance for doubtful accounts . . . . . . . . . . . . $3,909 $ (937) $ (479)(1)$2,493
Reserve for customer deductions . . . . . . . . . . . . 2,439 27,007 (26,526)(2) 2,920
Total . . . . . . . . . . . . . . . . . . . . . . . . . . . . . . . . $6,348 $26,070 $(27,005) $5,413
(1) Consists primarily of uncollectable accounts written off, net of recoveries, during the year.
(2) Consists primarily of discounts taken by customers during the year.
All other schedules for which provision is made in the applicable accounting regulations of the Securitiesand Exchange Commission are not required under the related instructions, are inapplicable or not material, or theinformation called for thereby is otherwise included in the financial statements or the accompanying notes to thefinancial statements and therefore, have been omitted.
34
(b) ExhibitsExhibitNumber Description
2.1 Contribution Agreement, dated as of January 25, 1999, among Pactiv Corporation (formerly knownas Tenneco Packaging Inc.) (“Pactiv”), PCA Holdings LLC (“PCA Holdings”) and PackagingCorporation of America (“PCA”). (Incorporated herein by reference to Exhibit 2.1 to PCA’sregistration Statement on Form S-4, Registration No. 333-79511).
2.2 Letter Agreement Amending the Contribution Agreement, dated as of April 12, 1999, among Pactiv,PCA Holdings and PCA. (Incorporated herein by reference to Exhibit 2.2 to PCA’s RegistrationStatement on Form S-4, Registration No. 333-79511).
3.1 Restated Certificate of Incorporation of PCA. (Incorporated herein by reference to Exhibit 3.1 toPCA’s Registration Statement on Form S-4, Registration No. 333-79511).
3.2 Certificate of Amendment to Restated Certificate of Incorporation of PCA. (Incorporated herein byreference to Exhibit 3.2 to PCA’s Registration Statement on Form S-4, Registration No. 333-109437.)
3.3 Amended and Restated By-laws of PCA. (Incorporated herein by reference to Exhibit 3.1 to PCA’sCurrent Report on Form 8-K filed December 7, 2012, File No. 1-15399.)
4.1 Form of certificate representing shares of common stock. (Incorporated herein by reference toExhibit 4.9 to PCA’s Registration Statement on Form S-1, Registration No. 333-86963.)
4.2 Indenture, dated as of July 21, 2003, between PCA and U.S. Bank National Association.(Incorporated herein by reference to Exhibit 4.2 to PCA’s Quarterly Report on Form 10-Q for theperiod ended June 30, 2003, File No. 1-15399.)
4.3 First Supplemental Indenture, dated as of July 21, 2003, between PCA and U.S. Bank NationalAssociation. (Incorporated herein by reference to Exhibit 4.3 to PCA’s Quarterly Report onForm 10-Q for the period ended June 30, 2003, File No. 1-15399.)
4.4 Form of Rule 144A Global Note. (Incorporated herein by reference to Exhibit 4.5 to PCA’s QuarterlyReport on Form 10-Q for the period ended June 30, 2003, File No. 1-15399.)
4.5 Officers’ Certificate, dated March 25, 2008, pursuant to Section 301 of the Indenture, dated July 21,2003, by and between PCA and U.S. Bank National Association (Incorporated herein by reference toExhibit 4.1 to PCA’s Current Report on Form 8-K filed March 25, 2008, File No. 1-15399.)
4.6 6.50% Senior Notes due 2018. (Incorporated herein by reference to Exhibit 4.2 to PCA’s CurrentReport on Form 8-K filed March 25, 2008, File No. 1-15399.)
4.7 Officers’ Certificate and 3.90% Senior Notes due 2022. (Incorporated herein by reference toExhibit 4.2 to PCA’s Current Report of Form 8-K filed June 26, 2012, File No. 1-15399)
10.1 Five Year Credit Agreement, dated as of October 11, 2011, by and among PCA and the lenders andagents named therein. (Incorporated herein by reference to Exhibit 10.1 to PCA’s Current Report onForm 8-K filed October 12, 2011, File No. 1-15399.)
10.2 Amended and Restated Credit and Security Agreement, dated as of September 19, 2008, by andamong PCA and the lenders and agents named therein. (Incorporated herein by reference toExhibit 10.2 to PCA’s Quarterly Report on Form 10-Q for the period ended September 30, 2010,File No. 1-15399.)
10.3 Amendment No. 1 to Amended and Restated Credit and Security Agreement, dated as of April 14,2009, by and among PCA and the lenders and agents named therein. (Incorporated herein byreference to Exhibit 10.1 to PCA’s Current Report on Form 8-K filed April 16, 2009, FileNo. 1-15399.)
35
ExhibitNumber Description
10.4 Amendment No. 2 to Amended and Restated Credit and Security Agreement, dated as of April 20,2010, by and among PCA and the lenders and agents named therein. (Incorporated herein byreference to Exhibit 10.1 to PCA’s Current Report on Form 8-K filed April 15, 2010, FileNo. 1-15399.)
10.5 Amendment No. 3 to Amended and Restated Credit and Security Agreement, dated as of March 1,2011, by and among PCA and the lenders and agents named therein. (Incorporated herein byreference to Exhibit 10.1 to PCA’s Current Report on Form 8-K filed March 2, 2011, FileNo. 1-15399.)
10.6 Amendment No. 4 to Amended and Restated Credit and Security Agreement, dated as of October 11,2011, by and among PCA and the lenders and agents named therein. (Incorporated herein byreference to Exhibit 10.1 to PCA’s Current Report on Form 8-K filed October 12, 2011, FileNo. 1-15399.)
10.7 Receivables Sale Agreement, dated as of November 29, 2000, between PCC and PCA. (Incorporatedherein by reference to Exhibit 10.24 to PCA’s Annual Report on Form 10-K for the fiscal year endedDecember 31, 2001, File No. 1-15399.)
10.8 Purchase and Sale Agreement, dated as of November 29, 2000, between PCC and PRC.(Incorporated herein by reference to Exhibit 10.25 to PCA’s Annual Report on Form 10-K for thefiscal year ended December 31, 2001. File No. 1-15399.)
10.9 Packaging Corporation of America Thrift Plan for Hourly Employees and First Amendment ofPackaging Corporation of America Thrift Plan for Hourly Employees, effective February 1, 2000.(Incorporated herein by reference to Exhibit 4.5 to PCA’s Registration Statement on Form S-8,Registration No. 333-33176.)*
10.10 Packaging Corporation of America Retirement Savings Plan, effective February 1, 2000.(Incorporated herein by reference to Exhibit 4.6 to PCA’s Registration Statement on Form S-8,Registration No. 333-33176.)*
10.11 Form of Stock Option Agreement for employees under the Amended and Restated 1999 Long-termEquity Incentive Plan. (Incorporated herein by reference to Exhibit 10.1 to PCA’s Current Report onForm 8-K, dated March 14, 2006, File No. 1-15399.)*
10.12 Form of Stock Option Agreement for non-employee directors under the Amended and Restated 1999Long-term Equity Incentive Plan. (Incorporated herein by reference to Exhibit 10.2 to PCA’s CurrentReport on Form 8-K, dated March 14, 2006, File No. 1-15399.)*
10.13 Form of Restricted Stock Award Agreement for employees and non-employee directors under theAmended and Restated 1999 Long-term Equity Incentive Plan. (Incorporated herein by reference toExhibit 10.3 to PCA’s Current Report on Form 8-K, dated March 14, 2006, File No. 1-15399.)*
10.14 Packaging Corporation of America Supplemental Executive Retirement Plan, as Amended andRestated Effective as of January 1, 2005. (Incorporated herein by reference to Exhibit 10.31 toPCA’s Annual Report on Form 10-K for the year ended December 31, 2006, File No. 1-15399.)*
10.15 Packaging Corporation of America Deferred Compensation Plan, effective as of January 1, 2009.(Incorporated herein by reference to Exhibit 10.15 to PCA’s Annual Report on Form 10-K for theyear ended December 31, 2008, File No. 1-15399.)*
10.16 Packaging Corporation of America Amended and Restated Executive Incentive Compensation Plan,effective as of February 28, 2007. (Incorporated herein by reference to Exhibit 10.32 to PCA’sAnnual Report on Form 10-K for the year ended December 31, 2006, File No. 1-15399.)*
10.17 First Amendment of Packaging Corporation of America Supplemental Executive Retirement Plan,effective as of January 1, 2008. (Incorporated herein by reference to Exhibit 10.17 to PCA’s AnnualReport on Form 10-K for the year ended December 31, 2008, file No. 1-15399.)*
36
ExhibitNumber Description
10.18 Amended and Restated 1999 Long-Term Equity Incentive Plan, effective as of May 27, 2009.(Incorporated herein by reference to Appendix A to PCA’s Definitive Proxy Statement onSchedule 14A, filed with the Commission on April 21, 2009, File No 1-15399.)*
10.19 PCA Performance Incentive Plan, effective as of May 11, 2010. (Incorporated herein by reference toAppendix A to PCA’s Definitive Proxy Statement on Schedule 14A, filed with the Commission onMarch 30, 2010, File No. 1-15399.)*
10.20 Employment Agreement, dated June 28, 2010, between Packaging Corporation of America andPaul T. Stecko. (Incorporated herein by reference to Exhibit 10.1 to the Current Report on Form 8-K,dated June 29, 2010, File No. 1-15399.)*
10.21 Form of Restricted Stock Award Agreement for February 22, 2011 Retention Awards to Mark W.Kowlzan and Thomas A. Hassfurther. (Incorporated herein by reference to Exhibit 10.22 to PCA’sAnnual Report on Form 10-K for the fiscal year ended December 31, 2010, File No. 1-15399.)*
10.22 Second Amendment of Packaging Corporation of America Supplemental Executive Retirement Plan,effective as of February 28, 2013.*†
10.23 Third Amendment of Packaging Corporation of America Supplemental Executive Retirement Plan,effective as of February 28, 2013.*†
12.1 Statement Regarding Computation of Ratio of Earnings to Fixed Charges†
21.1 Subsidiaries of the Registrant.†
23.1 Consent of Ernst & Young LLP.†
24.1 Powers of Attorney.†
31.1 Certification of Chief Executive Officer, As Adopted Pursuant to Section 302 of the Sarbanes-OxleyAct of 2002.†
31.2 Certification of Chief Financial Officer, As Adopted Pursuant to Section 302 of the Sarbanes-OxleyAct of 2002.†
32.1 Certification of Chief Executive Officer Pursuant to 18 U.S.C. §1350, As Adopted Pursuant toSection 906 of the Sarbanes-Oxley Act of 2002.†
32.2 Certification of Chief Financial Officer Pursuant to 18 U.S.C. §1350, As Adopted Pursuant toSection 906 of the Sarbanes-Oxley Act of 2002.†
101 The following financial information from Packaging Corporation of America’s Annual Report onForm 10-K for the year ended December 31, 2012, formatted in XBRL (eXtensible BusinessReporting Language): (i) Consolidated Balance Sheets at December 31, 2012 and 2011,(ii) Consolidated Statements of Income for the years ended December 31, 2012, 2011 and 2010,(iii) Consolidated Statements of Changes in Stockholders’ Equity for the years ended December 31,2012, 2011 and 2010, (iv) Consolidated Statements of Cash Flows for the years ended December 31,2012, 2011 and 2010, (v) the Notes to Consolidated Financial Statements, and (vi) FinancialStatement Schedule-Valuation and Qualifying Accounts.
* Management contract or compensatory plan or arrangement.† Filed herewith.
37
SIGNATURES
Pursuant to the requirements of Section 13 or 15(d) of the Securities Exchange Act of 1934, the registranthas duly caused this report to be signed on its behalf by the undersigned, thereunto duly authorized onFebruary 28, 2013.
Packaging Corporation of America
By: /S/ MARK W. KOWLZAN
Name: Mark W. KowlzanTitle: Chief Executive Officer
By: /S/ RICHARD B. WEST
Name: Richard B. WestTitle: Senior Vice President and Chief
Financial Officer
Pursuant to the requirements of the Securities Exchange Act of 1934, this report has been signed below bythe following persons on behalf of the registrant and in the capacities indicated on February 28, 2013.
Signature Title
/s/ MARK W. KOWLZAN
Mark W. Kowlzan
Chief Executive Officer and Director(Principal Executive Officer)
/S/ RICHARD B. WEST
Richard B. West
Senior Vice President and Chief Financial Officer(Principal Financial and Accounting Officer)
*
Paul T. Stecko
Executive Chairman
*
Cheryl K. Beebe
Director
*
Hasan Jameel
Director
*
Robert C. Lyons
Director
*
Samuel M. Mencoff
Director
*
Roger B. Porter
Director
*
Thomas S. Souleles
Director
*
James D. Woodrum
Director
*By: /s/ RICHARD B. WEST
Richard B. West(Attorney-In-Fact)
38
INDEX TO FINANCIAL STATEMENTS
Packaging Corporation of America Consolidated Financial StatementsReport of independent registered public accounting firm . . . . . . . . . . . . . . . . . . . . . . . . . . . . . . . . . . . . . . . . . F-2Consolidated balance sheets as of December 31, 2012 and 2011 . . . . . . . . . . . . . . . . . . . . . . . . . . . . . . . . . . . F-4Consolidated statements of income and comprehensive income for the years ended December 31, 2012,
2011 and 2010 . . . . . . . . . . . . . . . . . . . . . . . . . . . . . . . . . . . . . . . . . . . . . . . . . . . . . . . . . . . . . . . . . . . . . . . . F-5Consolidated statements of changes in stockholders’ equity for the years ended December 31, 2012, 2011
and 2010 . . . . . . . . . . . . . . . . . . . . . . . . . . . . . . . . . . . . . . . . . . . . . . . . . . . . . . . . . . . . . . . . . . . . . . . . . . . . . F-6Consolidated statements of cash flows for the years ended December 31, 2012, 2011 and 2010 . . . . . . . . . . F-7Notes to consolidated financial statements . . . . . . . . . . . . . . . . . . . . . . . . . . . . . . . . . . . . . . . . . . . . . . . . . . . . F-8
F-1
REPORT OF INDEPENDENT REGISTERED PUBLIC ACCOUNTING FIRM
Packaging Corporation of AmericaBoard of Directors and Stockholders
We have audited the accompanying consolidated balance sheets of Packaging Corporation of America (the“Company”) as of December 31, 2012 and 2011, and the related consolidated statements of income andcomprehensive income, changes in stockholders’ equity, and cash flows for each of the three years in the periodended December 31, 2012. Our audits also included the financial statement schedule listed in the index atItem 15(a). These financial statements and schedule are the responsibility of the Company’s management. Ourresponsibility is to express an opinion on these financial statements and schedule based on our audits.
We conducted our audits in accordance with the standards of the Public Company Accounting OversightBoard (United States). Those standards require that we plan and perform the audit to obtain reasonable assuranceabout whether the financial statements are free of material misstatement. An audit includes examining, on a testbasis, evidence supporting the amounts and disclosures in the financial statements. An audit also includesassessing the accounting principles used and significant estimates made by management, as well as evaluatingthe overall financial statement presentation. We believe that our audits provide a reasonable basis for ouropinion.
In our opinion, the financial statements referred to above present fairly, in all material respects, theconsolidated financial position of Packaging Corporation of America at December 31, 2012 and 2011, and theconsolidated results of its operations and its cash flows for each of the three years in the period endedDecember 31, 2012, in conformity with U.S. generally accepted accounting principles. Also, in our opinion, therelated financial statement schedule, when considered in relation to the basic financial statements taken as awhole, presents fairly, in all material respects, the information set forth therein.
We also have audited, in accordance with the standards of the Public Company Accounting Oversight Board(United States), Packaging Corporation of America’s internal control over financial reporting as of December 31,2012, based on criteria established in Internal Control — Integrated Framework issued by the Committee ofSponsoring Organizations of the Treadway Commission and our report dated February 28, 2013 expressed anunqualified opinion thereon.
/s/ Ernst & Young LLP
Chicago, IllinoisFebruary 28, 2013
F-2
REPORT OF INDEPENDENT REGISTERED PUBLIC ACCOUNTING FIRM
Packaging Corporation of AmericaBoard of Directors and Stockholders
We have audited Packaging Corporation of America’s internal control over financial reporting as ofDecember 31, 2012, based on criteria established in Internal Control — Integrated Framework issued by theCommittee of Sponsoring Organizations of the Treadway Commission (the COSO criteria). PackagingCorporation of America’s management is responsible for maintaining effective internal control over financialreporting, and for its assessment of the effectiveness of internal control over financial reporting included inManagement’s Report on Internal Control over Financial Reporting. Our responsibility is to express an opinionon the company’s internal control over financial reporting based on our audit.
We conducted our audit in accordance with the standards of the Public Company Accounting OversightBoard (United States). Those standards require that we plan and perform the audit to obtain reasonable assuranceabout whether effective internal control over financial reporting was maintained in all material respects. Ouraudit included obtaining an understanding of internal control over financial reporting, evaluating management’sassessment, testing and evaluating the design and operating effectiveness of internal control, and performing suchother procedures as we considered necessary in the circumstances. We believe that our audit provides areasonable basis for our opinion.
A company’s internal control over financial reporting is a process designed to provide reasonable assuranceregarding the reliability of financial reporting and the preparation of financial statements for external purposes inaccordance with generally accepted accounting principles. A company’s internal control over financial reportingincludes those policies and procedures that (1) pertain to the maintenance of records that, in reasonable detail,accurately and fairly reflect the transactions and dispositions of the assets of the company; (2) provide reasonableassurance that transactions are recorded as necessary to permit preparation of financial statements in accordancewith generally accepted accounting principles, and that receipts and expenditures of the company are being madeonly in accordance with authorizations of management and directors of the company; and (3) provide reasonableassurance regarding prevention or timely detection of unauthorized acquisition, use, or disposition of thecompany’s assets that could have a material effect on the financial statements.
Because of its inherent limitations, internal control over financial reporting may not prevent or detectmisstatements. Also, projections of any evaluation of effectiveness to future periods are subject to the risk thatcontrols may become inadequate because of changes in conditions, or that the degree of compliance with thepolicies or procedures may deteriorate.
In our opinion, Packaging Corporation of America maintained, in all material respects, effective internalcontrol over financial reporting as of December 31, 2012, based on the COSO criteria.
We also have audited, in accordance with the standards of the Public Company Accounting Oversight Board(United States), the consolidated balance sheets of Packaging Corporation of America as of December 31, 2012and 2011, and the related consolidated statements of income and comprehensive income, changes instockholders’ equity, and cash flows for each of the three years in the period ended December 31, 2012, and ourreport dated February 28, 2013, expressed an unqualified opinion thereon.
/s/ Ernst & Young LLP
Chicago, IllinoisFebruary 28, 2013
F-3
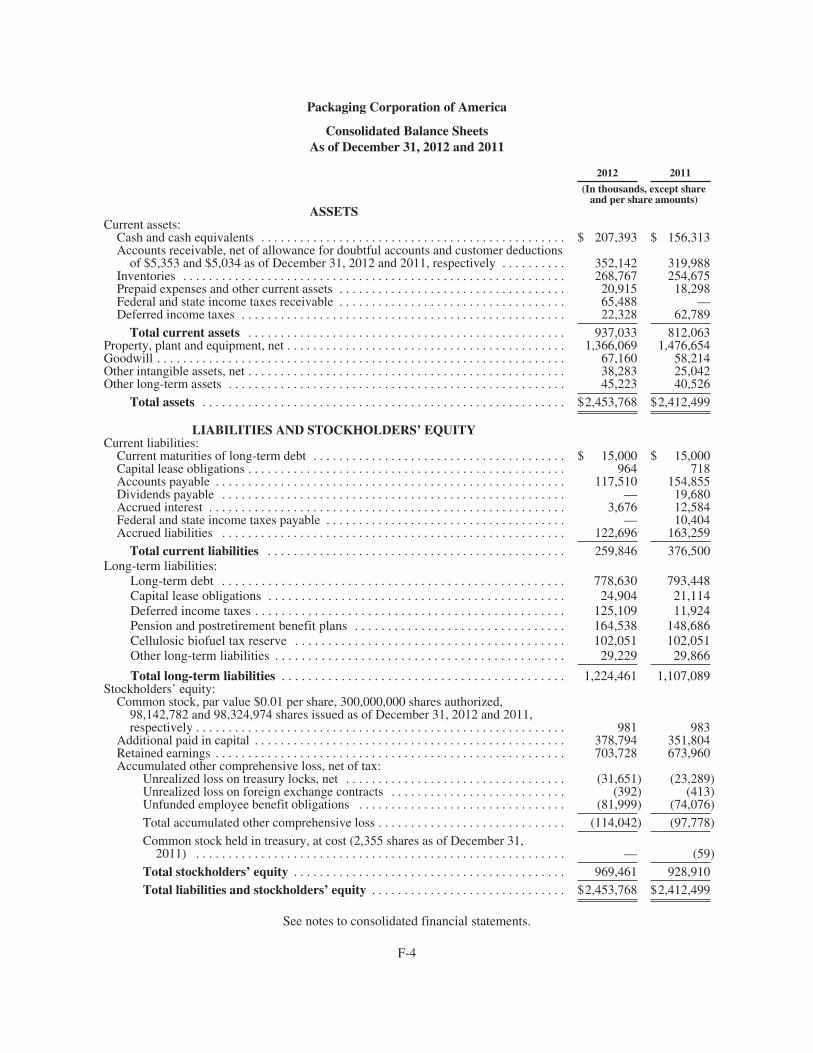
Packaging Corporation of America
Consolidated Balance SheetsAs of December 31, 2012 and 2011
2012 2011
(In thousands, except shareand per share amounts)
ASSETSCurrent assets:
Cash and cash equivalents . . . . . . . . . . . . . . . . . . . . . . . . . . . . . . . . . . . . . . . . . . . . . . . $ 207,393 $ 156,313Accounts receivable, net of allowance for doubtful accounts and customer deductions
of $5,353 and $5,034 as of December 31, 2012 and 2011, respectively . . . . . . . . . . 352,142 319,988Inventories . . . . . . . . . . . . . . . . . . . . . . . . . . . . . . . . . . . . . . . . . . . . . . . . . . . . . . . . . . . 268,767 254,675Prepaid expenses and other current assets . . . . . . . . . . . . . . . . . . . . . . . . . . . . . . . . . . . 20,915 18,298Federal and state income taxes receivable . . . . . . . . . . . . . . . . . . . . . . . . . . . . . . . . . . . 65,488 —Deferred income taxes . . . . . . . . . . . . . . . . . . . . . . . . . . . . . . . . . . . . . . . . . . . . . . . . . . 22,328 62,789
Total current assets . . . . . . . . . . . . . . . . . . . . . . . . . . . . . . . . . . . . . . . . . . . . . . . . . 937,033 812,063Property, plant and equipment, net . . . . . . . . . . . . . . . . . . . . . . . . . . . . . . . . . . . . . . . . . . . 1,366,069 1,476,654Goodwill . . . . . . . . . . . . . . . . . . . . . . . . . . . . . . . . . . . . . . . . . . . . . . . . . . . . . . . . . . . . . . . 67,160 58,214Other intangible assets, net . . . . . . . . . . . . . . . . . . . . . . . . . . . . . . . . . . . . . . . . . . . . . . . . . 38,283 25,042Other long-term assets . . . . . . . . . . . . . . . . . . . . . . . . . . . . . . . . . . . . . . . . . . . . . . . . . . . . 45,223 40,526
Total assets . . . . . . . . . . . . . . . . . . . . . . . . . . . . . . . . . . . . . . . . . . . . . . . . . . . . . . . . $2,453,768 $2,412,499
LIABILITIES AND STOCKHOLDERS’ EQUITYCurrent liabilities:
Current maturities of long-term debt . . . . . . . . . . . . . . . . . . . . . . . . . . . . . . . . . . . . . . . $ 15,000 $ 15,000Capital lease obligations . . . . . . . . . . . . . . . . . . . . . . . . . . . . . . . . . . . . . . . . . . . . . . . . . 964 718Accounts payable . . . . . . . . . . . . . . . . . . . . . . . . . . . . . . . . . . . . . . . . . . . . . . . . . . . . . . 117,510 154,855Dividends payable . . . . . . . . . . . . . . . . . . . . . . . . . . . . . . . . . . . . . . . . . . . . . . . . . . . . . — 19,680Accrued interest . . . . . . . . . . . . . . . . . . . . . . . . . . . . . . . . . . . . . . . . . . . . . . . . . . . . . . . 3,676 12,584Federal and state income taxes payable . . . . . . . . . . . . . . . . . . . . . . . . . . . . . . . . . . . . . — 10,404Accrued liabilities . . . . . . . . . . . . . . . . . . . . . . . . . . . . . . . . . . . . . . . . . . . . . . . . . . . . . 122,696 163,259
Total current liabilities . . . . . . . . . . . . . . . . . . . . . . . . . . . . . . . . . . . . . . . . . . . . . . 259,846 376,500Long-term liabilities:
Long-term debt . . . . . . . . . . . . . . . . . . . . . . . . . . . . . . . . . . . . . . . . . . . . . . . . . . . . 778,630 793,448Capital lease obligations . . . . . . . . . . . . . . . . . . . . . . . . . . . . . . . . . . . . . . . . . . . . . 24,904 21,114Deferred income taxes . . . . . . . . . . . . . . . . . . . . . . . . . . . . . . . . . . . . . . . . . . . . . . . 125,109 11,924Pension and postretirement benefit plans . . . . . . . . . . . . . . . . . . . . . . . . . . . . . . . . 164,538 148,686Cellulosic biofuel tax reserve . . . . . . . . . . . . . . . . . . . . . . . . . . . . . . . . . . . . . . . . . 102,051 102,051Other long-term liabilities . . . . . . . . . . . . . . . . . . . . . . . . . . . . . . . . . . . . . . . . . . . . 29,229 29,866
Total long-term liabilities . . . . . . . . . . . . . . . . . . . . . . . . . . . . . . . . . . . . . . . . . . . 1,224,461 1,107,089Stockholders’ equity:
Common stock, par value $0.01 per share, 300,000,000 shares authorized,98,142,782 and 98,324,974 shares issued as of December 31, 2012 and 2011,respectively . . . . . . . . . . . . . . . . . . . . . . . . . . . . . . . . . . . . . . . . . . . . . . . . . . . . . . . . . 981 983
Additional paid in capital . . . . . . . . . . . . . . . . . . . . . . . . . . . . . . . . . . . . . . . . . . . . . . . . 378,794 351,804Retained earnings . . . . . . . . . . . . . . . . . . . . . . . . . . . . . . . . . . . . . . . . . . . . . . . . . . . . . . 703,728 673,960Accumulated other comprehensive loss, net of tax:
Unrealized loss on treasury locks, net . . . . . . . . . . . . . . . . . . . . . . . . . . . . . . . . . . (31,651) (23,289)Unrealized loss on foreign exchange contracts . . . . . . . . . . . . . . . . . . . . . . . . . . . (392) (413)Unfunded employee benefit obligations . . . . . . . . . . . . . . . . . . . . . . . . . . . . . . . . (81,999) (74,076)Total accumulated other comprehensive loss . . . . . . . . . . . . . . . . . . . . . . . . . . . . . (114,042) (97,778)Common stock held in treasury, at cost (2,355 shares as of December 31,
2011) . . . . . . . . . . . . . . . . . . . . . . . . . . . . . . . . . . . . . . . . . . . . . . . . . . . . . . . . . — (59)Total stockholders’ equity . . . . . . . . . . . . . . . . . . . . . . . . . . . . . . . . . . . . . . . . . . 969,461 928,910Total liabilities and stockholders’ equity . . . . . . . . . . . . . . . . . . . . . . . . . . . . . . $2,453,768 $2,412,499
See notes to consolidated financial statements.
F-4
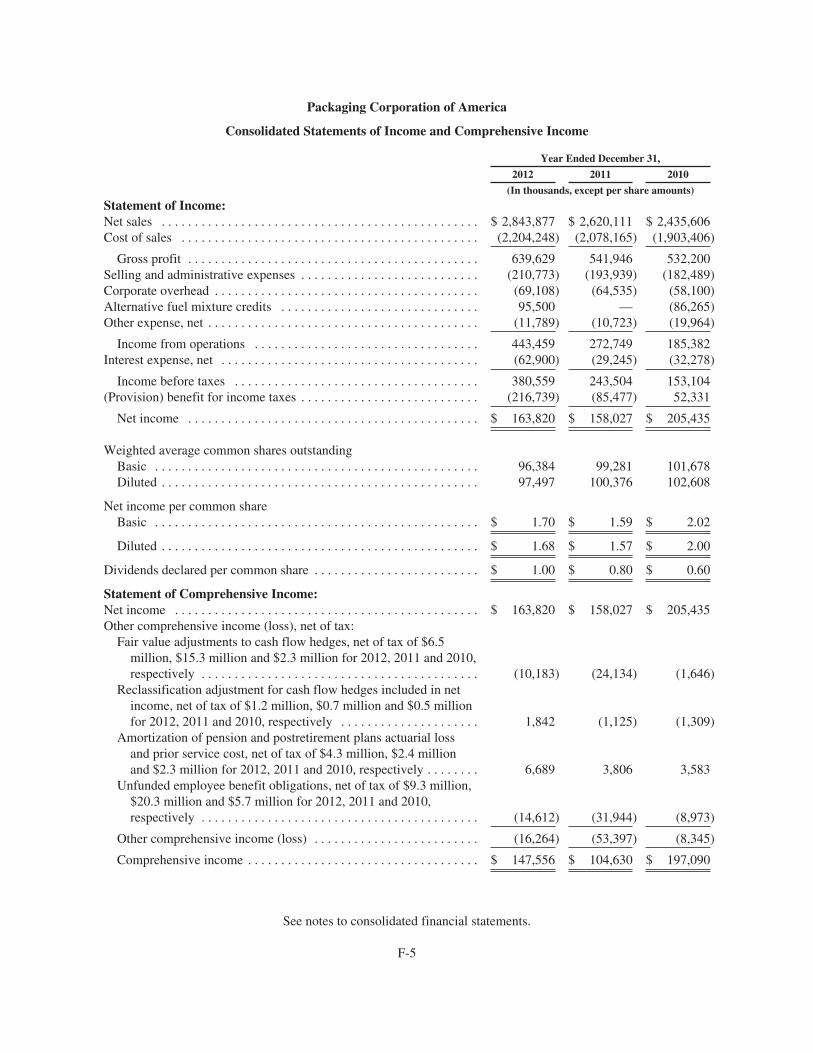
Packaging Corporation of America
Consolidated Statements of Income and Comprehensive Income
Year Ended December 31,
2012 2011 2010
(In thousands, except per share amounts)
Statement of Income:Net sales . . . . . . . . . . . . . . . . . . . . . . . . . . . . . . . . . . . . . . . . . . . . . . . . $ 2,843,877 $ 2,620,111 $ 2,435,606Cost of sales . . . . . . . . . . . . . . . . . . . . . . . . . . . . . . . . . . . . . . . . . . . . . (2,204,248) (2,078,165) (1,903,406)
Gross profit . . . . . . . . . . . . . . . . . . . . . . . . . . . . . . . . . . . . . . . . . . . . 639,629 541,946 532,200Selling and administrative expenses . . . . . . . . . . . . . . . . . . . . . . . . . . . (210,773) (193,939) (182,489)Corporate overhead . . . . . . . . . . . . . . . . . . . . . . . . . . . . . . . . . . . . . . . . (69,108) (64,535) (58,100)Alternative fuel mixture credits . . . . . . . . . . . . . . . . . . . . . . . . . . . . . . 95,500 — (86,265)Other expense, net . . . . . . . . . . . . . . . . . . . . . . . . . . . . . . . . . . . . . . . . . (11,789) (10,723) (19,964)
Income from operations . . . . . . . . . . . . . . . . . . . . . . . . . . . . . . . . . . 443,459 272,749 185,382Interest expense, net . . . . . . . . . . . . . . . . . . . . . . . . . . . . . . . . . . . . . . . (62,900) (29,245) (32,278)
Income before taxes . . . . . . . . . . . . . . . . . . . . . . . . . . . . . . . . . . . . . 380,559 243,504 153,104(Provision) benefit for income taxes . . . . . . . . . . . . . . . . . . . . . . . . . . . (216,739) (85,477) 52,331
Net income . . . . . . . . . . . . . . . . . . . . . . . . . . . . . . . . . . . . . . . . . . . . $ 163,820 $ 158,027 $ 205,435
Weighted average common shares outstandingBasic . . . . . . . . . . . . . . . . . . . . . . . . . . . . . . . . . . . . . . . . . . . . . . . . . 96,384 99,281 101,678Diluted . . . . . . . . . . . . . . . . . . . . . . . . . . . . . . . . . . . . . . . . . . . . . . . . 97,497 100,376 102,608
Net income per common shareBasic . . . . . . . . . . . . . . . . . . . . . . . . . . . . . . . . . . . . . . . . . . . . . . . . . $ 1.70 $ 1.59 $ 2.02
Diluted . . . . . . . . . . . . . . . . . . . . . . . . . . . . . . . . . . . . . . . . . . . . . . . . $ 1.68 $ 1.57 $ 2.00
Dividends declared per common share . . . . . . . . . . . . . . . . . . . . . . . . . $ 1.00 $ 0.80 $ 0.60
Statement of Comprehensive Income:Net income . . . . . . . . . . . . . . . . . . . . . . . . . . . . . . . . . . . . . . . . . . . . . . $ 163,820 $ 158,027 $ 205,435Other comprehensive income (loss), net of tax:
Fair value adjustments to cash flow hedges, net of tax of $6.5million, $15.3 million and $2.3 million for 2012, 2011 and 2010,respectively . . . . . . . . . . . . . . . . . . . . . . . . . . . . . . . . . . . . . . . . . . (10,183) (24,134) (1,646)
Reclassification adjustment for cash flow hedges included in netincome, net of tax of $1.2 million, $0.7 million and $0.5 millionfor 2012, 2011 and 2010, respectively . . . . . . . . . . . . . . . . . . . . . 1,842 (1,125) (1,309)
Amortization of pension and postretirement plans actuarial lossand prior service cost, net of tax of $4.3 million, $2.4 millionand $2.3 million for 2012, 2011 and 2010, respectively . . . . . . . . 6,689 3,806 3,583
Unfunded employee benefit obligations, net of tax of $9.3 million,$20.3 million and $5.7 million for 2012, 2011 and 2010,respectively . . . . . . . . . . . . . . . . . . . . . . . . . . . . . . . . . . . . . . . . . . (14,612) (31,944) (8,973)
Other comprehensive income (loss) . . . . . . . . . . . . . . . . . . . . . . . . . (16,264) (53,397) (8,345)
Comprehensive income . . . . . . . . . . . . . . . . . . . . . . . . . . . . . . . . . . . $ 147,556 $ 104,630 $ 197,090
See notes to consolidated financial statements.
F-5
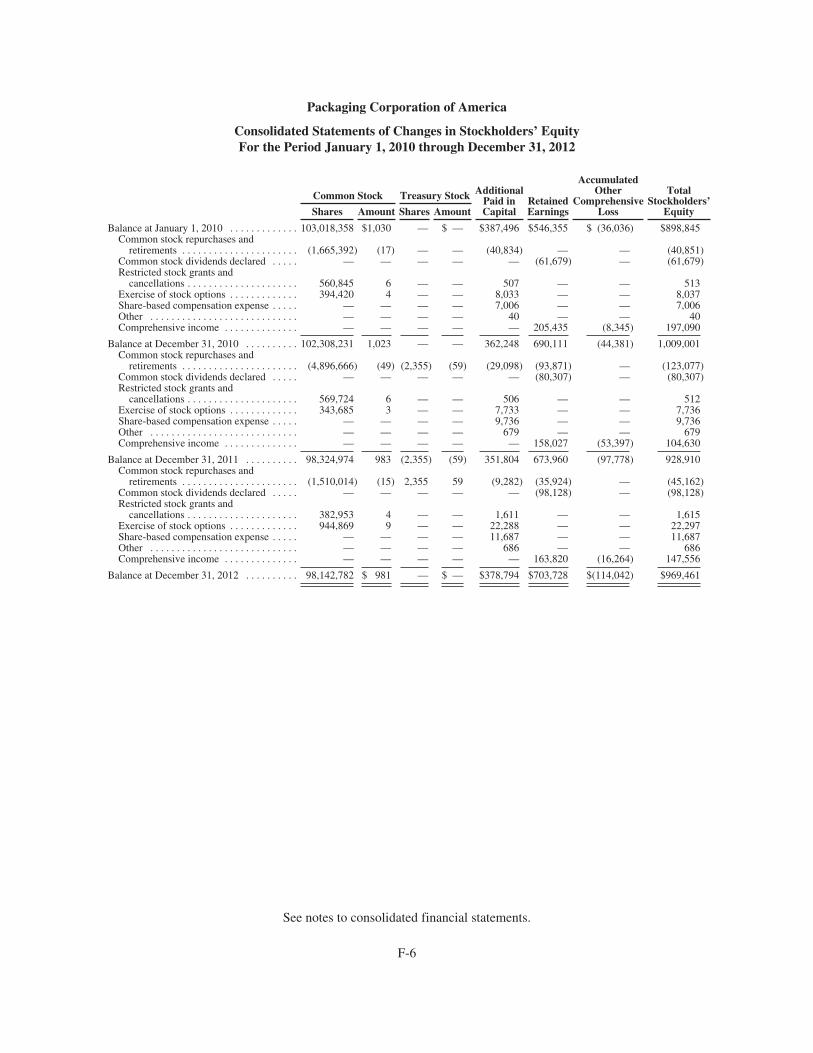
Packaging Corporation of America
Consolidated Statements of Changes in Stockholders’ EquityFor the Period January 1, 2010 through December 31, 2012
AdditionalPaid inCapital
RetainedEarnings
AccumulatedOther
ComprehensiveLoss
TotalStockholders’
Equity
Common Stock Treasury Stock
Shares Amount Shares Amount
Balance at January 1, 2010 . . . . . . . . . . . . . 103,018,358 $1,030 — $ — $387,496 $546,355 $ (36,036) $898,845Common stock repurchases and
retirements . . . . . . . . . . . . . . . . . . . . . . (1,665,392) (17) — — (40,834) — — (40,851)Common stock dividends declared . . . . . — — — — — (61,679) — (61,679)Restricted stock grants and
cancellations . . . . . . . . . . . . . . . . . . . . . 560,845 6 — — 507 — — 513Exercise of stock options . . . . . . . . . . . . . 394,420 4 — — 8,033 — — 8,037Share-based compensation expense . . . . . — — — — 7,006 — — 7,006Other . . . . . . . . . . . . . . . . . . . . . . . . . . . . — — — — 40 — — 40Comprehensive income . . . . . . . . . . . . . . — — — — — 205,435 (8,345) 197,090
Balance at December 31, 2010 . . . . . . . . . . 102,308,231 1,023 — — 362,248 690,111 (44,381) 1,009,001Common stock repurchases and
retirements . . . . . . . . . . . . . . . . . . . . . . (4,896,666) (49) (2,355) (59) (29,098) (93,871) — (123,077)Common stock dividends declared . . . . . — — — — — (80,307) — (80,307)Restricted stock grants and
cancellations . . . . . . . . . . . . . . . . . . . . . 569,724 6 — — 506 — — 512Exercise of stock options . . . . . . . . . . . . . 343,685 3 — — 7,733 — — 7,736Share-based compensation expense . . . . . — — — — 9,736 — — 9,736Other . . . . . . . . . . . . . . . . . . . . . . . . . . . . — — — — 679 — — 679Comprehensive income . . . . . . . . . . . . . . — — — — — 158,027 (53,397) 104,630
Balance at December 31, 2011 . . . . . . . . . . 98,324,974 983 (2,355) (59) 351,804 673,960 (97,778) 928,910Common stock repurchases and
retirements . . . . . . . . . . . . . . . . . . . . . . (1,510,014) (15) 2,355 59 (9,282) (35,924) — (45,162)Common stock dividends declared . . . . . — — — — — (98,128) — (98,128)Restricted stock grants and
cancellations . . . . . . . . . . . . . . . . . . . . . 382,953 4 — — 1,611 — — 1,615Exercise of stock options . . . . . . . . . . . . . 944,869 9 — — 22,288 — — 22,297Share-based compensation expense . . . . . — — — — 11,687 — — 11,687Other . . . . . . . . . . . . . . . . . . . . . . . . . . . . — — — — 686 — — 686Comprehensive income . . . . . . . . . . . . . . — — — — — 163,820 (16,264) 147,556
Balance at December 31, 2012 . . . . . . . . . . 98,142,782 $ 981 — $ — $378,794 $703,728 $(114,042) $969,461
See notes to consolidated financial statements.
F-6
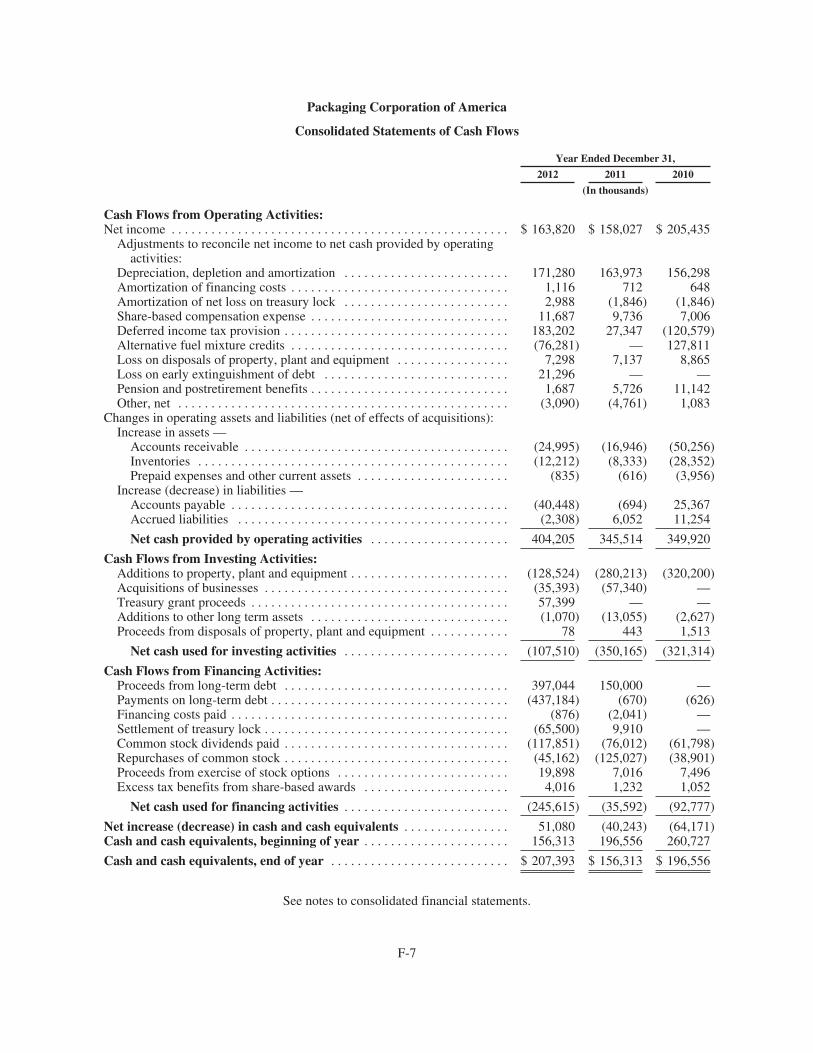
Packaging Corporation of America
Consolidated Statements of Cash Flows
Year Ended December 31,
2012 2011 2010
(In thousands)
Cash Flows from Operating Activities:Net income . . . . . . . . . . . . . . . . . . . . . . . . . . . . . . . . . . . . . . . . . . . . . . . . . . . $ 163,820 $ 158,027 $ 205,435
Adjustments to reconcile net income to net cash provided by operatingactivities:
Depreciation, depletion and amortization . . . . . . . . . . . . . . . . . . . . . . . . . 171,280 163,973 156,298Amortization of financing costs . . . . . . . . . . . . . . . . . . . . . . . . . . . . . . . . . 1,116 712 648Amortization of net loss on treasury lock . . . . . . . . . . . . . . . . . . . . . . . . . 2,988 (1,846) (1,846)Share-based compensation expense . . . . . . . . . . . . . . . . . . . . . . . . . . . . . . 11,687 9,736 7,006Deferred income tax provision . . . . . . . . . . . . . . . . . . . . . . . . . . . . . . . . . . 183,202 27,347 (120,579)Alternative fuel mixture credits . . . . . . . . . . . . . . . . . . . . . . . . . . . . . . . . . (76,281) — 127,811Loss on disposals of property, plant and equipment . . . . . . . . . . . . . . . . . 7,298 7,137 8,865Loss on early extinguishment of debt . . . . . . . . . . . . . . . . . . . . . . . . . . . . 21,296 — —Pension and postretirement benefits . . . . . . . . . . . . . . . . . . . . . . . . . . . . . . 1,687 5,726 11,142Other, net . . . . . . . . . . . . . . . . . . . . . . . . . . . . . . . . . . . . . . . . . . . . . . . . . . (3,090) (4,761) 1,083
Changes in operating assets and liabilities (net of effects of acquisitions):Increase in assets —
Accounts receivable . . . . . . . . . . . . . . . . . . . . . . . . . . . . . . . . . . . . . . . . (24,995) (16,946) (50,256)Inventories . . . . . . . . . . . . . . . . . . . . . . . . . . . . . . . . . . . . . . . . . . . . . . . (12,212) (8,333) (28,352)Prepaid expenses and other current assets . . . . . . . . . . . . . . . . . . . . . . . (835) (616) (3,956)
Increase (decrease) in liabilities —Accounts payable . . . . . . . . . . . . . . . . . . . . . . . . . . . . . . . . . . . . . . . . . . (40,448) (694) 25,367Accrued liabilities . . . . . . . . . . . . . . . . . . . . . . . . . . . . . . . . . . . . . . . . . (2,308) 6,052 11,254
Net cash provided by operating activities . . . . . . . . . . . . . . . . . . . . . 404,205 345,514 349,920
Cash Flows from Investing Activities:Additions to property, plant and equipment . . . . . . . . . . . . . . . . . . . . . . . . (128,524) (280,213) (320,200)Acquisitions of businesses . . . . . . . . . . . . . . . . . . . . . . . . . . . . . . . . . . . . . (35,393) (57,340) —Treasury grant proceeds . . . . . . . . . . . . . . . . . . . . . . . . . . . . . . . . . . . . . . . 57,399 — —Additions to other long term assets . . . . . . . . . . . . . . . . . . . . . . . . . . . . . . (1,070) (13,055) (2,627)Proceeds from disposals of property, plant and equipment . . . . . . . . . . . . 78 443 1,513
Net cash used for investing activities . . . . . . . . . . . . . . . . . . . . . . . . . (107,510) (350,165) (321,314)
Cash Flows from Financing Activities:Proceeds from long-term debt . . . . . . . . . . . . . . . . . . . . . . . . . . . . . . . . . . 397,044 150,000 —Payments on long-term debt . . . . . . . . . . . . . . . . . . . . . . . . . . . . . . . . . . . . (437,184) (670) (626)Financing costs paid . . . . . . . . . . . . . . . . . . . . . . . . . . . . . . . . . . . . . . . . . . (876) (2,041) —Settlement of treasury lock . . . . . . . . . . . . . . . . . . . . . . . . . . . . . . . . . . . . . (65,500) 9,910 —Common stock dividends paid . . . . . . . . . . . . . . . . . . . . . . . . . . . . . . . . . . (117,851) (76,012) (61,798)Repurchases of common stock . . . . . . . . . . . . . . . . . . . . . . . . . . . . . . . . . . (45,162) (125,027) (38,901)Proceeds from exercise of stock options . . . . . . . . . . . . . . . . . . . . . . . . . . 19,898 7,016 7,496Excess tax benefits from share-based awards . . . . . . . . . . . . . . . . . . . . . . 4,016 1,232 1,052
Net cash used for financing activities . . . . . . . . . . . . . . . . . . . . . . . . . (245,615) (35,592) (92,777)
Net increase (decrease) in cash and cash equivalents . . . . . . . . . . . . . . . . 51,080 (40,243) (64,171)Cash and cash equivalents, beginning of year . . . . . . . . . . . . . . . . . . . . . . 156,313 196,556 260,727
Cash and cash equivalents, end of year . . . . . . . . . . . . . . . . . . . . . . . . . . . $ 207,393 $ 156,313 $ 196,556
See notes to consolidated financial statements.
F-7
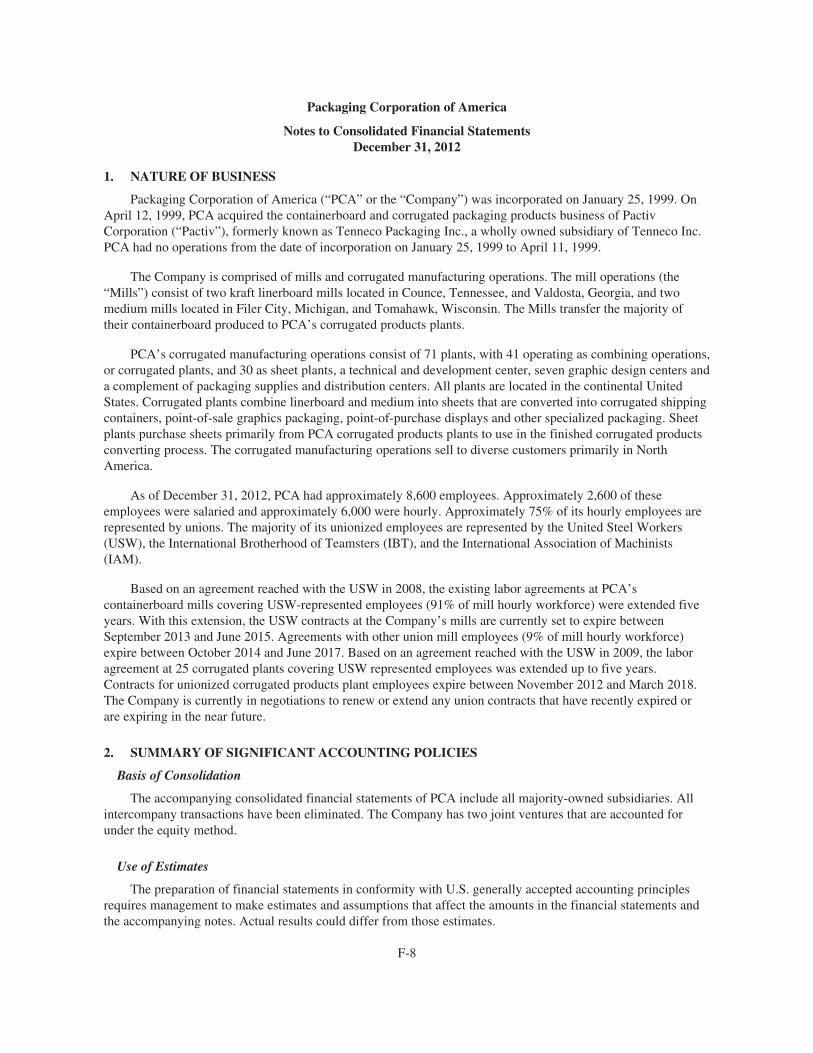
Packaging Corporation of America
Notes to Consolidated Financial StatementsDecember 31, 2012
1. NATURE OF BUSINESS
Packaging Corporation of America (“PCA” or the “Company”) was incorporated on January 25, 1999. OnApril 12, 1999, PCA acquired the containerboard and corrugated packaging products business of PactivCorporation (“Pactiv”), formerly known as Tenneco Packaging Inc., a wholly owned subsidiary of Tenneco Inc.PCA had no operations from the date of incorporation on January 25, 1999 to April 11, 1999.
The Company is comprised of mills and corrugated manufacturing operations. The mill operations (the“Mills”) consist of two kraft linerboard mills located in Counce, Tennessee, and Valdosta, Georgia, and twomedium mills located in Filer City, Michigan, and Tomahawk, Wisconsin. The Mills transfer the majority oftheir containerboard produced to PCA’s corrugated products plants.
PCA’s corrugated manufacturing operations consist of 71 plants, with 41 operating as combining operations,or corrugated plants, and 30 as sheet plants, a technical and development center, seven graphic design centers anda complement of packaging supplies and distribution centers. All plants are located in the continental UnitedStates. Corrugated plants combine linerboard and medium into sheets that are converted into corrugated shippingcontainers, point-of-sale graphics packaging, point-of-purchase displays and other specialized packaging. Sheetplants purchase sheets primarily from PCA corrugated products plants to use in the finished corrugated productsconverting process. The corrugated manufacturing operations sell to diverse customers primarily in NorthAmerica.
As of December 31, 2012, PCA had approximately 8,600 employees. Approximately 2,600 of theseemployees were salaried and approximately 6,000 were hourly. Approximately 75% of its hourly employees arerepresented by unions. The majority of its unionized employees are represented by the United Steel Workers(USW), the International Brotherhood of Teamsters (IBT), and the International Association of Machinists(IAM).
Based on an agreement reached with the USW in 2008, the existing labor agreements at PCA’scontainerboard mills covering USW-represented employees (91% of mill hourly workforce) were extended fiveyears. With this extension, the USW contracts at the Company’s mills are currently set to expire betweenSeptember 2013 and June 2015. Agreements with other union mill employees (9% of mill hourly workforce)expire between October 2014 and June 2017. Based on an agreement reached with the USW in 2009, the laboragreement at 25 corrugated plants covering USW represented employees was extended up to five years.Contracts for unionized corrugated products plant employees expire between November 2012 and March 2018.The Company is currently in negotiations to renew or extend any union contracts that have recently expired orare expiring in the near future.
2. SUMMARY OF SIGNIFICANT ACCOUNTING POLICIES
Basis of Consolidation
The accompanying consolidated financial statements of PCA include all majority-owned subsidiaries. Allintercompany transactions have been eliminated. The Company has two joint ventures that are accounted forunder the equity method.
Use of Estimates
The preparation of financial statements in conformity with U.S. generally accepted accounting principlesrequires management to make estimates and assumptions that affect the amounts in the financial statements andthe accompanying notes. Actual results could differ from those estimates.
F-8
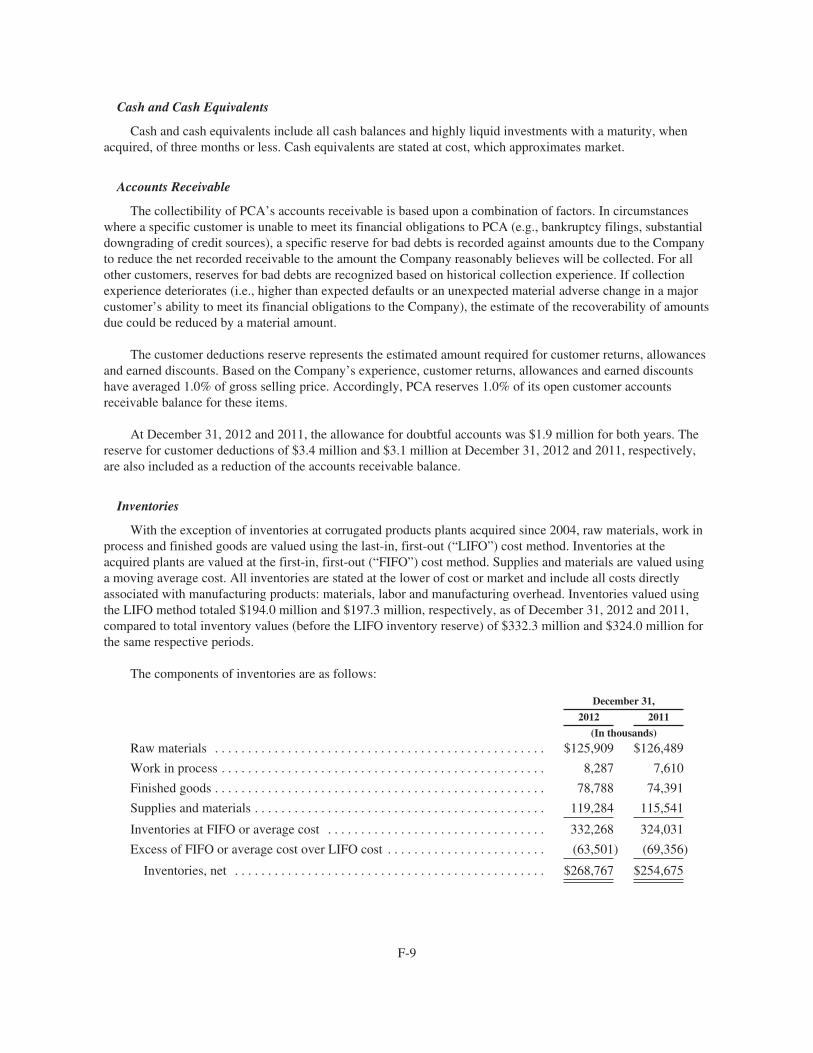
Cash and Cash Equivalents
Cash and cash equivalents include all cash balances and highly liquid investments with a maturity, whenacquired, of three months or less. Cash equivalents are stated at cost, which approximates market.
Accounts Receivable
The collectibility of PCA’s accounts receivable is based upon a combination of factors. In circumstanceswhere a specific customer is unable to meet its financial obligations to PCA (e.g., bankruptcy filings, substantialdowngrading of credit sources), a specific reserve for bad debts is recorded against amounts due to the Companyto reduce the net recorded receivable to the amount the Company reasonably believes will be collected. For allother customers, reserves for bad debts are recognized based on historical collection experience. If collectionexperience deteriorates (i.e., higher than expected defaults or an unexpected material adverse change in a majorcustomer’s ability to meet its financial obligations to the Company), the estimate of the recoverability of amountsdue could be reduced by a material amount.
The customer deductions reserve represents the estimated amount required for customer returns, allowancesand earned discounts. Based on the Company’s experience, customer returns, allowances and earned discountshave averaged 1.0% of gross selling price. Accordingly, PCA reserves 1.0% of its open customer accountsreceivable balance for these items.
At December 31, 2012 and 2011, the allowance for doubtful accounts was $1.9 million for both years. Thereserve for customer deductions of $3.4 million and $3.1 million at December 31, 2012 and 2011, respectively,are also included as a reduction of the accounts receivable balance.
Inventories
With the exception of inventories at corrugated products plants acquired since 2004, raw materials, work inprocess and finished goods are valued using the last-in, first-out (“LIFO”) cost method. Inventories at theacquired plants are valued at the first-in, first-out (“FIFO”) cost method. Supplies and materials are valued usinga moving average cost. All inventories are stated at the lower of cost or market and include all costs directlyassociated with manufacturing products: materials, labor and manufacturing overhead. Inventories valued usingthe LIFO method totaled $194.0 million and $197.3 million, respectively, as of December 31, 2012 and 2011,compared to total inventory values (before the LIFO inventory reserve) of $332.3 million and $324.0 million forthe same respective periods.
The components of inventories are as follows:
December 31,
2012 2011
(In thousands)
Raw materials . . . . . . . . . . . . . . . . . . . . . . . . . . . . . . . . . . . . . . . . . . . . . . . . . . $125,909 $126,489
Work in process . . . . . . . . . . . . . . . . . . . . . . . . . . . . . . . . . . . . . . . . . . . . . . . . . 8,287 7,610
Finished goods . . . . . . . . . . . . . . . . . . . . . . . . . . . . . . . . . . . . . . . . . . . . . . . . . . 78,788 74,391
Supplies and materials . . . . . . . . . . . . . . . . . . . . . . . . . . . . . . . . . . . . . . . . . . . . 119,284 115,541
Inventories at FIFO or average cost . . . . . . . . . . . . . . . . . . . . . . . . . . . . . . . . . 332,268 324,031
Excess of FIFO or average cost over LIFO cost . . . . . . . . . . . . . . . . . . . . . . . . (63,501) (69,356)
Inventories, net . . . . . . . . . . . . . . . . . . . . . . . . . . . . . . . . . . . . . . . . . . . . . . . $268,767 $254,675
F-9
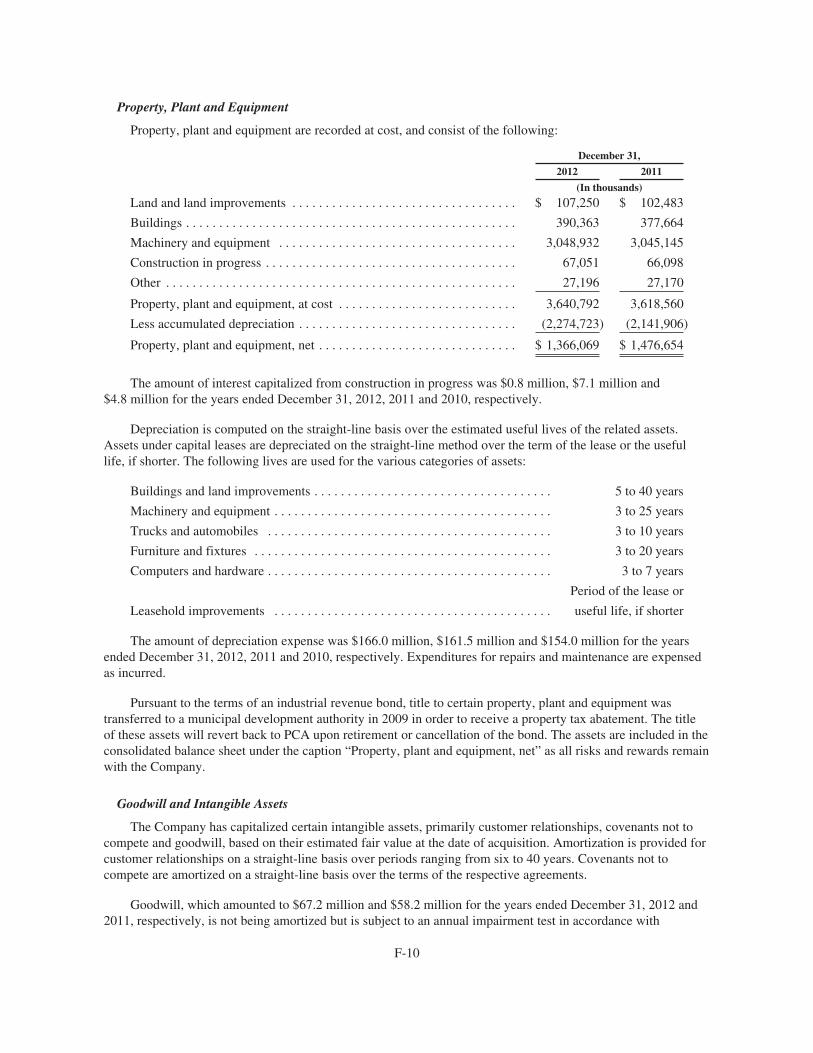
Property, Plant and Equipment
Property, plant and equipment are recorded at cost, and consist of the following:
December 31,
2012 2011
(In thousands)
Land and land improvements . . . . . . . . . . . . . . . . . . . . . . . . . . . . . . . . . . $ 107,250 $ 102,483
Buildings . . . . . . . . . . . . . . . . . . . . . . . . . . . . . . . . . . . . . . . . . . . . . . . . . . 390,363 377,664
Machinery and equipment . . . . . . . . . . . . . . . . . . . . . . . . . . . . . . . . . . . . 3,048,932 3,045,145
Construction in progress . . . . . . . . . . . . . . . . . . . . . . . . . . . . . . . . . . . . . . 67,051 66,098
Other . . . . . . . . . . . . . . . . . . . . . . . . . . . . . . . . . . . . . . . . . . . . . . . . . . . . . 27,196 27,170
Property, plant and equipment, at cost . . . . . . . . . . . . . . . . . . . . . . . . . . . 3,640,792 3,618,560
Less accumulated depreciation . . . . . . . . . . . . . . . . . . . . . . . . . . . . . . . . . (2,274,723) (2,141,906)
Property, plant and equipment, net . . . . . . . . . . . . . . . . . . . . . . . . . . . . . . $ 1,366,069 $ 1,476,654
The amount of interest capitalized from construction in progress was $0.8 million, $7.1 million and$4.8 million for the years ended December 31, 2012, 2011 and 2010, respectively.
Depreciation is computed on the straight-line basis over the estimated useful lives of the related assets.Assets under capital leases are depreciated on the straight-line method over the term of the lease or the usefullife, if shorter. The following lives are used for the various categories of assets:
Buildings and land improvements . . . . . . . . . . . . . . . . . . . . . . . . . . . . . . . . . . . . 5 to 40 years
Machinery and equipment . . . . . . . . . . . . . . . . . . . . . . . . . . . . . . . . . . . . . . . . . . 3 to 25 years
Trucks and automobiles . . . . . . . . . . . . . . . . . . . . . . . . . . . . . . . . . . . . . . . . . . . 3 to 10 years
Furniture and fixtures . . . . . . . . . . . . . . . . . . . . . . . . . . . . . . . . . . . . . . . . . . . . . 3 to 20 years
Computers and hardware . . . . . . . . . . . . . . . . . . . . . . . . . . . . . . . . . . . . . . . . . . . 3 to 7 years
Period of the lease or
Leasehold improvements . . . . . . . . . . . . . . . . . . . . . . . . . . . . . . . . . . . . . . . . . . useful life, if shorter
The amount of depreciation expense was $166.0 million, $161.5 million and $154.0 million for the yearsended December 31, 2012, 2011 and 2010, respectively. Expenditures for repairs and maintenance are expensedas incurred.
Pursuant to the terms of an industrial revenue bond, title to certain property, plant and equipment wastransferred to a municipal development authority in 2009 in order to receive a property tax abatement. The titleof these assets will revert back to PCA upon retirement or cancellation of the bond. The assets are included in theconsolidated balance sheet under the caption “Property, plant and equipment, net” as all risks and rewards remainwith the Company.
Goodwill and Intangible Assets
The Company has capitalized certain intangible assets, primarily customer relationships, covenants not tocompete and goodwill, based on their estimated fair value at the date of acquisition. Amortization is provided forcustomer relationships on a straight-line basis over periods ranging from six to 40 years. Covenants not tocompete are amortized on a straight-line basis over the terms of the respective agreements.
Goodwill, which amounted to $67.2 million and $58.2 million for the years ended December 31, 2012 and2011, respectively, is not being amortized but is subject to an annual impairment test in accordance with
F-10
Accounting Standards Codification (“ASC”) 350, “Intangibles — Goodwill and Other.” The Company performsthe impairment test at year end or sooner if events or changes in circumstances indicate that the carrying amountmay exceed fair value. Recoverability of goodwill is determined by comparing the fair value of the reporting unitwith its carrying value, including goodwill. If the carrying amount of the reporting unit exceeds the fair value, theimplied fair value of the reporting unit’s goodwill is compared to the carrying amount of its goodwill todetermine if a write-down to fair value is necessary. The Company concluded that no impairment of goodwillexisted at the time of the annual impairment tests in 2012, 2011 and 2010.
Other Long-Term Assets
PCA has capitalized certain costs related to obtaining its financing. These costs are amortized to interestexpense using the effective interest rate method over the terms of the senior credit facilities and senior notes,which range from five to ten years. Unamortized deferred financing costs were $5.0 million and $2.6 million asof December 31, 2012 and 2011, respectively.
PCA leases the cutting rights to approximately 88,000 acres of timberland and capitalizes the annual leasepayments and reforestation costs associated with these leases. These costs are recorded as depletion when timberis harvested and used in PCA’s business operations or sold to customers. Capitalized long-term lease costs were$27.4 million and $26.2 million as of December 31, 2012 and 2011, respectively. The amount of depletionexpense was $0.7 million, $0.04 million and $0.5 million for the years ended December 31, 2012, 2011 and2010, respectively.
PCA capitalizes certain costs related to the purchase and development of software which is used in itsbusiness operations. The costs attributable to these software systems are amortized over their estimated usefullives based on various factors such as the effects of obsolescence, technology and other economic factors. Netcapitalized software costs were $1.1 million and $1.9 million for the years ended December 31, 2012 and 2011,respectively. Software amortization expense was $0.9 million, $0.6 million and $0.6 million for the years endedDecember 31, 2012, 2011 and 2010, respectively.
Impairment of Long-Lived Assets
Long-lived assets other than goodwill are reviewed for impairment in accordance with provisions ofASC 360, “Property, Plant and Equipment.” In the event that facts and circumstances indicate that the carryingamount of any long-lived assets may be impaired, an evaluation of recoverability would be performed. If anevaluation is required, the estimated future undiscounted cash flows associated with the asset (or group of assets)would be compared to the asset’s (or group of assets’) carrying amount to determine if a write-down to fair valueis required. The Company concluded that no impairment of long-lived assets existed in 2012, 2011 and 2010.
Pension and Postretirement Benefits
One of the principal assumptions used to calculate net periodic pension cost is the expected long-term rateof return on plan assets. The expected long-term rate of return on plan assets may result in recognized returns thatare greater or less than the actual returns on those plan assets in any given year. Over time, however, the expectedlong-term rate of return on plan assets is designed to approximate the actual long term returns.
The discount rate assumptions used to calculate net periodic pension and postretirement cost reflect the ratesavailable on high-quality, fixed-income debt instruments on December 31st of each year. The rate ofcompensation increase is another significant assumption used to calculate net periodic pension cost and isdetermined by the Company based upon annual reviews.
For postretirement health care plan accounting, the Company reviews external data and its own historicaltrends for health care costs to determine the health care cost trend rate assumption.
F-11
Environmental Matters
Environmental expenditures related to existing conditions resulting from past or current operations fromwhich no current or future benefit is discernible are expensed as incurred. Environmental expenditures thatextend the life of the related property or mitigate or prevent future environmental contamination are capitalized.Liabilities are recorded for environmental contingencies when such costs are probable and reasonably estimable.These liabilities are adjusted as further information develops or circumstances change.
Asset Retirement Obligations
The Company accounts for its retirement obligations related to its landfills under ASC 410, “AssetRetirement and Environmental Obligations,” which requires legal obligations associated with the retirement oflong-lived assets to be recognized at their fair value at the time that the obligations are incurred. Upon initialrecognition of a liability, that cost is capitalized as part of the related long-lived asset and amortized to expenseover the useful life of the asset.
Income Taxes
PCA utilizes the liability method of accounting for income taxes whereby it recognizes deferred tax assetsand liabilities for the future tax consequences of temporary differences between the tax basis of assets andliabilities and their reported amounts in the financial statements. Deferred tax assets will be reduced by avaluation allowance if, based upon management’s estimates, it is more likely than not that a portion of thedeferred tax assets will not be realized in a future period. The estimates utilized in the recognition of deferred taxassets are subject to revision in future periods based on new facts or circumstances.
PCA’s practice is to recognize interest and penalties related to unrecognized tax benefits in income taxexpense.
Fair Value of Financial Instruments
PCA measures the fair value of its financial instruments in accordance with ASC 820, “Fair ValueMeasurements and Disclosures.” The guidance defines fair value as the price that would be received to sell anasset or paid to transfer a liability in an orderly transaction between market participants. It is determined based onassumptions that market participants would use in pricing an asset or liability. As a basis for considering suchassumptions, ASC 820 establishes the following hierarchy that prioritizes the inputs to valuation methodologiesused to measure fair value:
Level 1 — Valuations based on quoted prices for identical assets and liabilities in active markets.
Level 2 — Valuations based on observable inputs other than quoted prices included in Level 1, such asquoted prices for similar assets and liabilities in active markets, quoted prices for identical or similar assetsand liabilities in markets that are not active, or other inputs that are observable or can be corroborated byobservable market data.
Level 3 — Valuations based on unobservable inputs in which there is little or no market data, whichrequire the reporting entity to develop its own assumptions.
The Company measures the fair value of money market funds based on quoted prices in active markets foridentical assets or liabilities. See Note 6 for information about PCA’s pension plans’ assets measured at fair valueand Note 10 for information about PCA’s assets and liabilities measured at fair value.
Planned Major Maintenance Activities
The Company accounts for its planned major maintenance activities in accordance with ASC 360,“Property, Plant, and Equipment,” using the deferral method. All maintenance costs incurred during the year areexpensed in the year in which the maintenance activity occurs.
F-12
Revenue Recognition
The Company recognizes revenue as title to the products is transferred to customers. Shipping and handlingbillings to a customer are included in net sales. Shipping and handling costs are included in cost of sales. Inaddition, the Company offers volume rebates to certain of its customers. The total cost of these programs isestimated and accrued as a reduction to net sales at the time of the respective sale.
Research and Development
Research and development costs are expensed as incurred. The amount charged to expense was$11.3 million, $12.5 million and $10.9 million for the years ended December 31, 2012, 2011 and 2010,respectively.
Trade Agreements
PCA regularly trades containerboard with other manufacturers primarily to reduce shipping costs. Theseagreements are entered into with other producers on an annual basis, pursuant to which both parties agree to shipan identical number of tons of containerboard to each other within the agreement period. These agreements lowertransportation costs by allowing each party’s containerboard mills to ship containerboard to the other party’sclosest corrugated products plant. PCA tracks each shipment to ensure that the other party’s shipments to PCAmatch PCA’s shipments to the other party during the agreement period. Such transfers are possible becausecontainerboard is a commodity product with no distinguishing product characteristics. These transactions areaccounted for at carrying value, and revenue is not recorded as the transactions do not represent the culminationof an earnings process. The transactions are recorded into inventory accounts, and no income is recorded untilsuch inventory is converted to a finished product and sold to an end-use customer.
Segment Information
PCA is engaged in one line of business: the integrated manufacture and sale of packaging materials, boxesand containers for industrial and consumer markets. No single customer accounts for more than 10% of total netsales.
Derivative Instruments and Hedging Activities
The Company records its derivatives in accordance with ASC 815, “Derivatives and Hedging.” Theguidance requires the Company to recognize derivative instruments as either assets or liabilities in the balancesheet at fair value. The accounting for changes in the fair value of a derivative depends on the intended use anddesignation of the derivative instrument. For a derivative designated as a fair value hedge, the gain or loss on thederivative is recognized in earnings in the period of change in fair value together with the offsetting gain or losson the hedged item. For a derivative instrument designated as a cash flow hedge, the effective portion of thederivative’s gain or loss is initially reported as a component of accumulated other comprehensive income (loss)(“OCI”) and is subsequently recognized in earnings when the hedged exposure affects earnings. The ineffectiveportion of the gain or loss is recognized in earnings.
Recent Accounting Pronouncements
In July 2012, the Financial Accounting Standards Board (“FASB”) issued Accounting Standards Update(“ASU”) 2012-02, “Intangibles — Goodwill and Other (Topic 350) — Testing Indefinite-Lived Intangible Assetsfor Impairment.” The amendments in this ASU allow an entity to first assess qualitative factors to determinewhether it is necessary to perform a quantitative impairment test. An entity would not be required to calculate thefair value of an indefinite-lived intangible asset unless the entity determines, based on a qualitative assessment,that it is more likely than not that the indefinite-lived intangible asset is impaired. The amendments in this ASUare effective for annual and interim impairment tests performed for fiscal years beginning after September 15,
F-13
2012. Early adoption is permitted. The Company will comply with the provisions of ASU 2012-02 upon itsadoption on January 1, 2013. The Company does not expect the adoption of this guidance to have any impact onits financial position, results of operations or cash flows.
In December 2011, the FASB issued ASU 2011-12, “Comprehensive Income (Topic 220) — Deferral of theEffective Date for Amendments to the Presentation of Reclassifications of Items Out of Accumulated OtherComprehensive Income in Accounting Standards Update No. 2011-05.” This ASU effectively defers only thosechanges in Update 2011-05 as discussed below that relate to the presentation of reclassification adjustments outof accumulated other comprehensive income and gives the FASB additional time to redeliberate the presentationrequirements for reclassification adjustments. The amendments in this ASU are effective for public entities forfiscal years, and interim periods within those years, beginning after December 15, 2011. The Company hascomplied with the provisions of ASU 2011-12 upon its adoption on January 1, 2012.
In September 2011, the FASB issued ASU 2011-08, “Intangibles — Goodwill and Other (Topic 350) —Testing Goodwill for Impairment,” which simplifies how entities test goodwill for impairment. The amendmentsin this update provide an entity the option to make a qualitative evaluation about the likelihood of goodwillimpairment to determine whether it should calculate the fair value of a reporting unit. ASU 2011-08 is effectivefor annual and interim goodwill impairment tests performed for fiscal years beginning after December 15, 2011.The adoption of this guidance on January 1, 2012 did not impact the Company’s financial position, results ofoperations or cash flows.
In June 2011, the FASB issued ASU 2011-05, “Comprehensive Income (Topic 220) — Presentation ofComprehensive Income.” The amendments in this ASU require that all nonowner changes in stockholders’ equitybe presented either in a single continuous statement of comprehensive income or in two separate but consecutivestatements. The provisions in this update should be applied retrospectively and are effective for fiscal years, andinterim periods within those years, beginning after December 15, 2011. The Company has complied with theadditional provisions of ASU 2011-05 upon its adoption on January 1, 2012. See Consolidated Statements ofIncome and Comprehensive Income for additional information.
In May 2011, the FASB issued ASU 2011-04, “Fair Value Measurement (Topic 820) — Amendments toAchieve Common Fair Value Measurement and Disclosure Requirements in U.S. GAAP and IFRSs.” Theamendments in this ASU clarify the application of existing fair value measurement and disclosure requirements,which will improve the comparability of fair value measurements presented and disclosed in financial statementsprepared in accordance with U.S. GAAP and IFRSs. ASU 2011-04 is effective for interim and annual periodsbeginning after December 15, 2011. The adoption of this guidance did not have any impact on the Company’sfinancial position, results of operations or cash flows. See Note 10 for additional information.
F-14
3. EARNINGS PER SHARE
The following table sets forth the computation of basic and diluted income per common share for theperiods presented.
Year Ended December 31,
2012 2011 2010
(In thousands, except per share data)
Numerator:
Net income . . . . . . . . . . . . . . . . . . . . . . . . . . . . . . . . . . . . . . . . $163,820 $158,027 $205,435
Denominator:
Basic common shares outstanding . . . . . . . . . . . . . . . . . . . . . . 96,384 99,281 101,678
Effect of dilutive securities:
Stock options and unvested restricted stock . . . . . . . . . . . . . . . 1,113 1,095 930
Diluted common shares outstanding . . . . . . . . . . . . . . . . . . . . . . 97,497 100,376 102,608
Basic income per common share . . . . . . . . . . . . . . . . . . . . . . . . . $ 1.70 $ 1.59 $ 2.02Diluted income per common share . . . . . . . . . . . . . . . . . . . . . . . $ 1.68 $ 1.57 $ 2.00
Options to purchase 0.6 million shares at December 31, 2010 were not included in the computation ofdiluted common shares outstanding as their exercise price exceeded the average market price of the Company’scommon stock for the related reporting period. All outstanding options to purchase shares at December 31, 2012and 2011 were included in the computation of diluted common shares outstanding.
4. STOCK-BASED COMPENSATION
In October 1999, the Company adopted a long-term equity incentive plan, which allows for grants of stockoptions, stock appreciation rights, restricted stock and performance awards to directors, officers and employeesof PCA, as well as others who engage in services for PCA. The plan, which will terminate on October 19, 2014,provides for the issuance of up to 8,550,000 shares of common stock over the life of the plan. As ofDecember 31, 2012, options and restricted stock for 8,040,958 shares have been granted, net of forfeitures.Forfeitures are added back to the pool of shares of common stock available to be granted at a future date.
A summary of the Company’s stock option activity and related information follows:
Options
Weighted-Average
Exercise Price
Weighted-Average
RemainingContractualTerm (years)
AggregateIntrinsic
Value
(In thousands)
Outstanding at December 31, 2009 . . . . . 1,973,301 20.92
Exercised . . . . . . . . . . . . . . . . . . . . . . . (394,420) 19.01
Forfeited . . . . . . . . . . . . . . . . . . . . . . . . (10,497) 24.62
Outstanding at December 31, 2010 . . . . . 1,568,384 21.38
Exercised . . . . . . . . . . . . . . . . . . . . . . . (343,685) 20.34
Outstanding at December 31, 2011 . . . . . 1,224,699 21.64Exercised . . . . . . . . . . . . . . . . . . . . . . . (944,869) 21.06
Forfeited . . . . . . . . . . . . . . . . . . . . . . . . (1,250) 23.09
Outstanding and exercisable atDecember 31, 2012 . . . . . . . . . . . . . . . . 278,580 $23.65 1.3 $4,130
F-15
The total intrinsic value of options exercised during the years ended December 31, 2012, 2011, and 2010was $9.5 million, $2.8 million, and $2.4 million, respectively. As of December 31, 2012, there is nounrecognized compensation cost related to stock option awards granted under the Company’s equity incentiveplan as all outstanding awards have vested.
A summary of the Company’s restricted stock activity follows:
2012 2011 2010
Shares
Fair MarketValue atDate ofGrant Shares
Fair MarketValue atDate ofGrant Shares
Fair MarketValue atDate ofGrant
(Dollars in thousands)
Restricted stock at January 1 . . . . . . 1,817,745 $40,655 1,478,000 $30,600 1,235,505 $24,718
Granted . . . . . . . . . . . . . . . . . . . . . 394,928 10,846 575,694 16,005 573,440 12,693
Vested . . . . . . . . . . . . . . . . . . . . . . (429,034) (9,722) (229,979) (5,816) (318,350) (6,563)
Cancellations . . . . . . . . . . . . . . . . (11,975) (257) (5,970) (134) (12,595) (248)
Restricted stock at December 31 . . . 1,771,664 $41,522 1,817,745 $40,655 1,478,000 $30,600
Compensation expense for both stock options, which were fully vested at June 30, 2010, and restricted stockrecognized in the consolidated statements of income for the years ended December 31, 2012, 2011 and 2010 wasas follows:
Year Ended December 31,
2012 2011 2010
(In thousands)
Stock options . . . . . . . . . . . . . . . . . . . . . . . . . . . . . . . . . . . . . . . . . . . . $ — $ — $ 226Restricted stock . . . . . . . . . . . . . . . . . . . . . . . . . . . . . . . . . . . . . . . . . . 11,687 9,736 6,780
Impact on income before income taxes . . . . . . . . . . . . . . . . . . . . . . . . 11,687 9,736 7,006Income tax benefit . . . . . . . . . . . . . . . . . . . . . . . . . . . . . . . . . . . . . . . . (4,543) (3,784) (2,721)
Impact on net income . . . . . . . . . . . . . . . . . . . . . . . . . . . . . . . . . . . . . $ 7,144 $ 5,952 $ 4,285
The Company uses the Black-Scholes-Merton option-pricing model to estimate the fair value of each optiongrant as of the date of grant. Expected volatilities are based on historical volatility of the Company’s commonstock. The expected life of the option is estimated using historical data pertaining to option exercises andemployee terminations. Separate groups of employees that have similar historical exercise behavior areconsidered separately for estimating the expected life. The risk-free interest rate is based on U.S. Treasury yieldsin effect at the time of grant.
The fair value of restricted stock is determined based on the closing price of the Company’s common stock on thegrant date. Restricted stock awards granted to employees generally vest at the end of a four-year period, and stockawards granted to directors vest immediately. The Company generally recognizes compensation expense associatedwith restricted stock awards ratably over their vesting periods. As PCA’s Board of Directors has the ability toaccelerate vesting of restricted stock upon an employee’s retirement, the Company accelerates the recognition ofcompensation expense for certain employees approaching normal retirement age. As of December 31, 2012, there was$21.1 million of total unrecognized compensation costs related to the restricted stock awards. The Company expects torecognize the cost of these stock awards over a weighted-average period of 2.5 years.
F-16
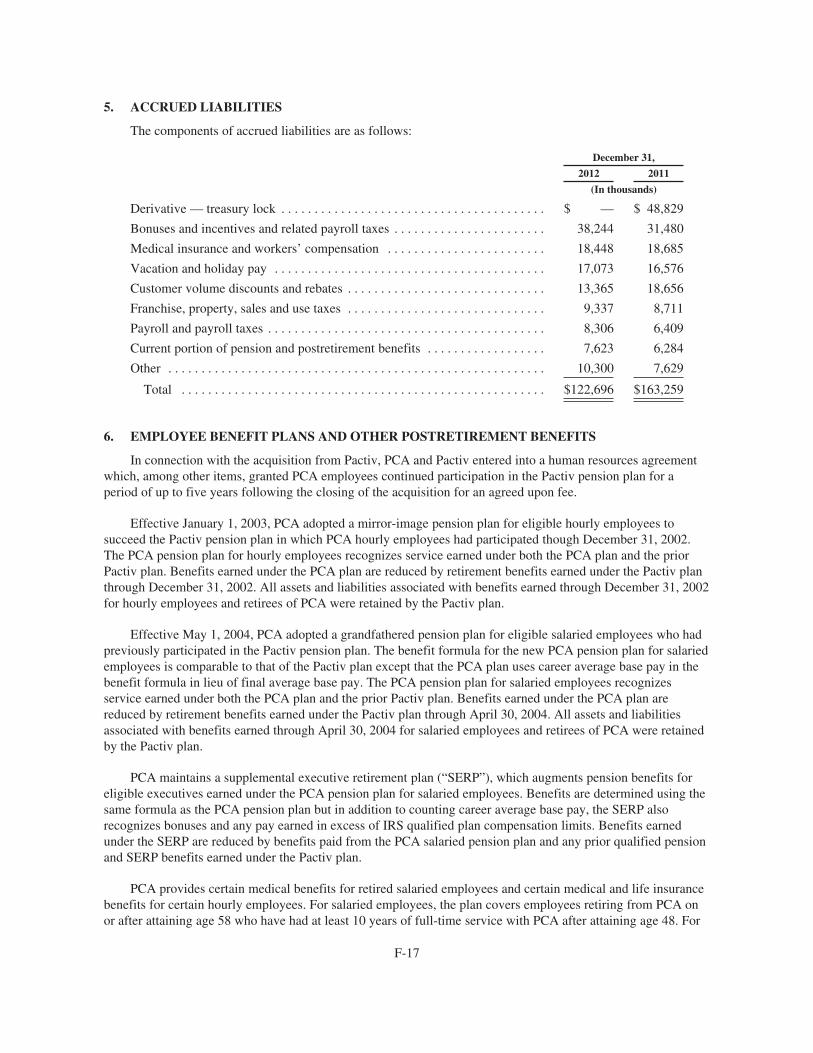
5. ACCRUED LIABILITIES
The components of accrued liabilities are as follows:
December 31,
2012 2011
(In thousands)
Derivative — treasury lock . . . . . . . . . . . . . . . . . . . . . . . . . . . . . . . . . . . . . . . . $ — $ 48,829
Bonuses and incentives and related payroll taxes . . . . . . . . . . . . . . . . . . . . . . . 38,244 31,480
Medical insurance and workers’ compensation . . . . . . . . . . . . . . . . . . . . . . . . 18,448 18,685
Vacation and holiday pay . . . . . . . . . . . . . . . . . . . . . . . . . . . . . . . . . . . . . . . . . 17,073 16,576
Customer volume discounts and rebates . . . . . . . . . . . . . . . . . . . . . . . . . . . . . . 13,365 18,656
Franchise, property, sales and use taxes . . . . . . . . . . . . . . . . . . . . . . . . . . . . . . 9,337 8,711
Payroll and payroll taxes . . . . . . . . . . . . . . . . . . . . . . . . . . . . . . . . . . . . . . . . . . 8,306 6,409
Current portion of pension and postretirement benefits . . . . . . . . . . . . . . . . . . 7,623 6,284
Other . . . . . . . . . . . . . . . . . . . . . . . . . . . . . . . . . . . . . . . . . . . . . . . . . . . . . . . . . 10,300 7,629
Total . . . . . . . . . . . . . . . . . . . . . . . . . . . . . . . . . . . . . . . . . . . . . . . . . . . . . . . $122,696 $163,259
6. EMPLOYEE BENEFIT PLANS AND OTHER POSTRETIREMENT BENEFITS
In connection with the acquisition from Pactiv, PCA and Pactiv entered into a human resources agreementwhich, among other items, granted PCA employees continued participation in the Pactiv pension plan for aperiod of up to five years following the closing of the acquisition for an agreed upon fee.
Effective January 1, 2003, PCA adopted a mirror-image pension plan for eligible hourly employees tosucceed the Pactiv pension plan in which PCA hourly employees had participated though December 31, 2002.The PCA pension plan for hourly employees recognizes service earned under both the PCA plan and the priorPactiv plan. Benefits earned under the PCA plan are reduced by retirement benefits earned under the Pactiv planthrough December 31, 2002. All assets and liabilities associated with benefits earned through December 31, 2002for hourly employees and retirees of PCA were retained by the Pactiv plan.
Effective May 1, 2004, PCA adopted a grandfathered pension plan for eligible salaried employees who hadpreviously participated in the Pactiv pension plan. The benefit formula for the new PCA pension plan for salariedemployees is comparable to that of the Pactiv plan except that the PCA plan uses career average base pay in thebenefit formula in lieu of final average base pay. The PCA pension plan for salaried employees recognizesservice earned under both the PCA plan and the prior Pactiv plan. Benefits earned under the PCA plan arereduced by retirement benefits earned under the Pactiv plan through April 30, 2004. All assets and liabilitiesassociated with benefits earned through April 30, 2004 for salaried employees and retirees of PCA were retainedby the Pactiv plan.
PCA maintains a supplemental executive retirement plan (“SERP”), which augments pension benefits foreligible executives earned under the PCA pension plan for salaried employees. Benefits are determined using thesame formula as the PCA pension plan but in addition to counting career average base pay, the SERP alsorecognizes bonuses and any pay earned in excess of IRS qualified plan compensation limits. Benefits earnedunder the SERP are reduced by benefits paid from the PCA salaried pension plan and any prior qualified pensionand SERP benefits earned under the Pactiv plan.
PCA provides certain medical benefits for retired salaried employees and certain medical and life insurancebenefits for certain hourly employees. For salaried employees, the plan covers employees retiring from PCA onor after attaining age 58 who have had at least 10 years of full-time service with PCA after attaining age 48. For
F-17
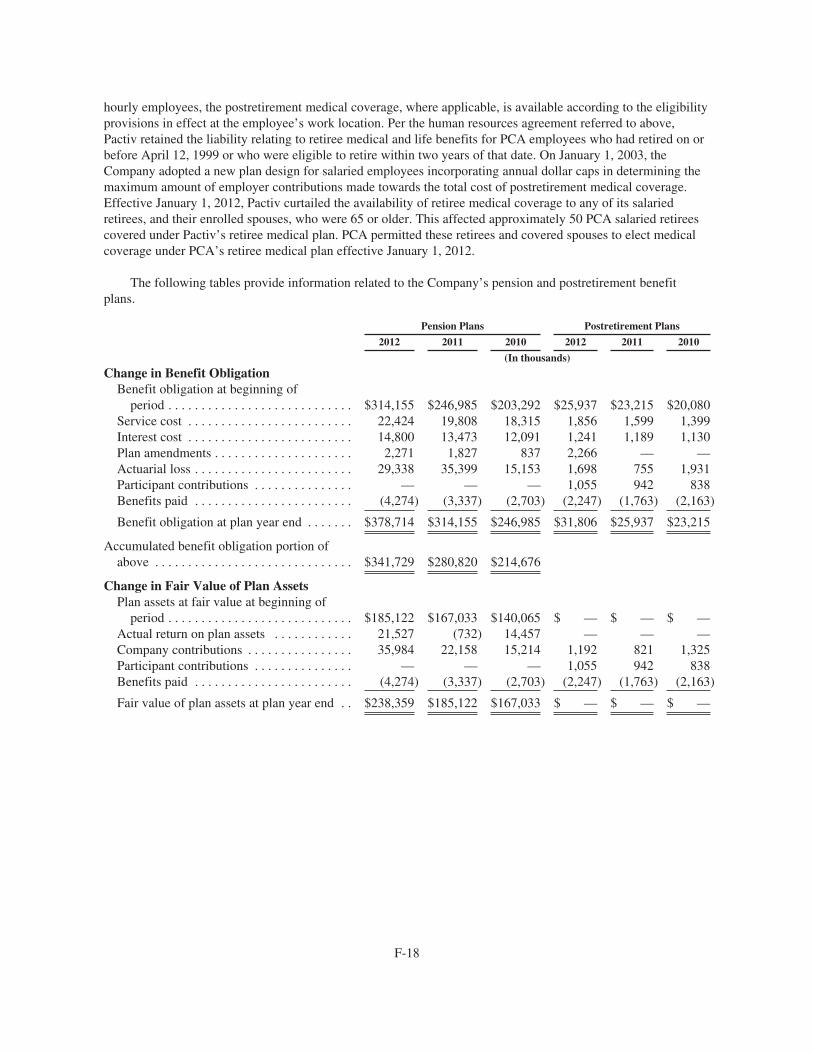
hourly employees, the postretirement medical coverage, where applicable, is available according to the eligibilityprovisions in effect at the employee’s work location. Per the human resources agreement referred to above,Pactiv retained the liability relating to retiree medical and life benefits for PCA employees who had retired on orbefore April 12, 1999 or who were eligible to retire within two years of that date. On January 1, 2003, theCompany adopted a new plan design for salaried employees incorporating annual dollar caps in determining themaximum amount of employer contributions made towards the total cost of postretirement medical coverage.Effective January 1, 2012, Pactiv curtailed the availability of retiree medical coverage to any of its salariedretirees, and their enrolled spouses, who were 65 or older. This affected approximately 50 PCA salaried retireescovered under Pactiv’s retiree medical plan. PCA permitted these retirees and covered spouses to elect medicalcoverage under PCA’s retiree medical plan effective January 1, 2012.
The following tables provide information related to the Company’s pension and postretirement benefitplans.
Pension Plans Postretirement Plans
2012 2011 2010 2012 2011 2010
(In thousands)
Change in Benefit ObligationBenefit obligation at beginning of
period . . . . . . . . . . . . . . . . . . . . . . . . . . . . $314,155 $246,985 $203,292 $25,937 $23,215 $20,080Service cost . . . . . . . . . . . . . . . . . . . . . . . . . 22,424 19,808 18,315 1,856 1,599 1,399Interest cost . . . . . . . . . . . . . . . . . . . . . . . . . 14,800 13,473 12,091 1,241 1,189 1,130Plan amendments . . . . . . . . . . . . . . . . . . . . . 2,271 1,827 837 2,266 — —Actuarial loss . . . . . . . . . . . . . . . . . . . . . . . . 29,338 35,399 15,153 1,698 755 1,931Participant contributions . . . . . . . . . . . . . . . — — — 1,055 942 838Benefits paid . . . . . . . . . . . . . . . . . . . . . . . . (4,274) (3,337) (2,703) (2,247) (1,763) (2,163)
Benefit obligation at plan year end . . . . . . . $378,714 $314,155 $246,985 $31,806 $25,937 $23,215
Accumulated benefit obligation portion ofabove . . . . . . . . . . . . . . . . . . . . . . . . . . . . . . $341,729 $280,820 $214,676
Change in Fair Value of Plan AssetsPlan assets at fair value at beginning of
period . . . . . . . . . . . . . . . . . . . . . . . . . . . . $185,122 $167,033 $140,065 $ — $ — $ —Actual return on plan assets . . . . . . . . . . . . 21,527 (732) 14,457 — — —Company contributions . . . . . . . . . . . . . . . . 35,984 22,158 15,214 1,192 821 1,325Participant contributions . . . . . . . . . . . . . . . — — — 1,055 942 838Benefits paid . . . . . . . . . . . . . . . . . . . . . . . . (4,274) (3,337) (2,703) (2,247) (1,763) (2,163)
Fair value of plan assets at plan year end . . $238,359 $185,122 $167,033 $ — $ — $ —
F-18
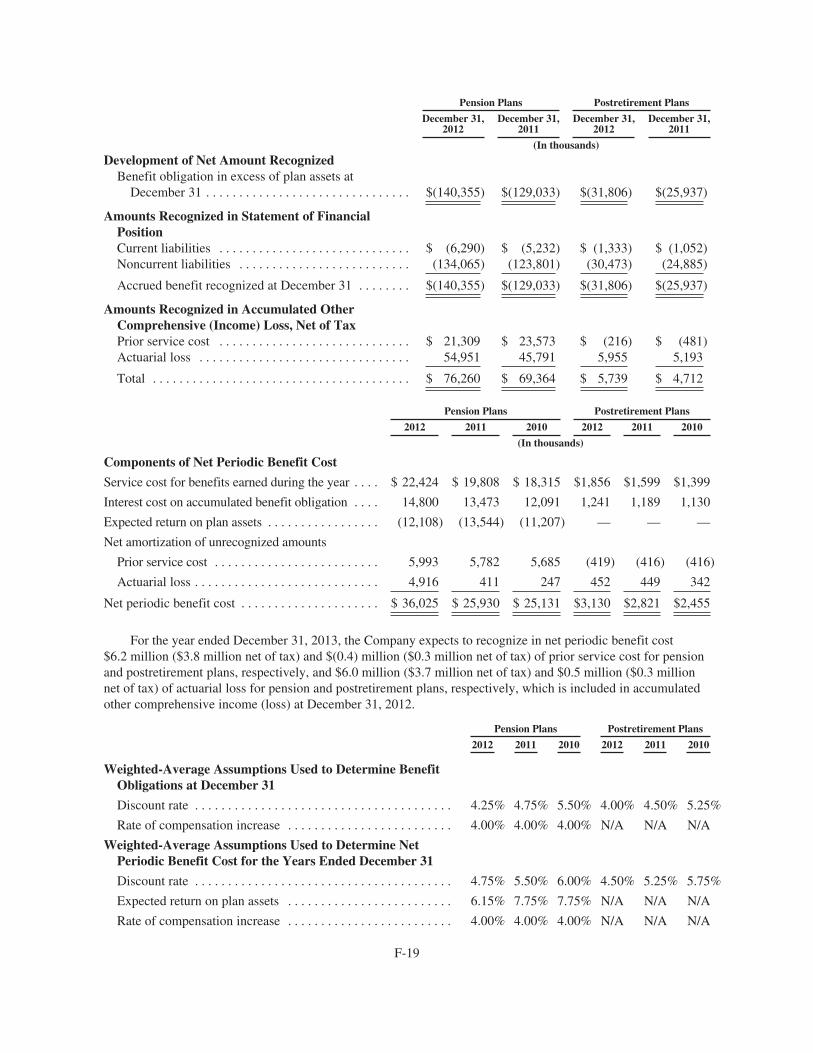
Pension Plans Postretirement Plans
December 31,2012
December 31,2011
December 31,2012
December 31,2011
(In thousands)
Development of Net Amount RecognizedBenefit obligation in excess of plan assets at
December 31 . . . . . . . . . . . . . . . . . . . . . . . . . . . . . . . $(140,355) $(129,033) $(31,806) $(25,937)
Amounts Recognized in Statement of FinancialPositionCurrent liabilities . . . . . . . . . . . . . . . . . . . . . . . . . . . . . $ (6,290) $ (5,232) $ (1,333) $ (1,052)Noncurrent liabilities . . . . . . . . . . . . . . . . . . . . . . . . . . (134,065) (123,801) (30,473) (24,885)
Accrued benefit recognized at December 31 . . . . . . . . $(140,355) $(129,033) $(31,806) $(25,937)
Amounts Recognized in Accumulated OtherComprehensive (Income) Loss, Net of TaxPrior service cost . . . . . . . . . . . . . . . . . . . . . . . . . . . . . $ 21,309 $ 23,573 $ (216) $ (481)Actuarial loss . . . . . . . . . . . . . . . . . . . . . . . . . . . . . . . . 54,951 45,791 5,955 5,193
Total . . . . . . . . . . . . . . . . . . . . . . . . . . . . . . . . . . . . . . . $ 76,260 $ 69,364 $ 5,739 $ 4,712
Pension Plans Postretirement Plans
2012 2011 2010 2012 2011 2010
(In thousands)
Components of Net Periodic Benefit Cost
Service cost for benefits earned during the year . . . . $ 22,424 $ 19,808 $ 18,315 $1,856 $1,599 $1,399
Interest cost on accumulated benefit obligation . . . . 14,800 13,473 12,091 1,241 1,189 1,130
Expected return on plan assets . . . . . . . . . . . . . . . . . (12,108) (13,544) (11,207) — — —
Net amortization of unrecognized amounts
Prior service cost . . . . . . . . . . . . . . . . . . . . . . . . . 5,993 5,782 5,685 (419) (416) (416)
Actuarial loss . . . . . . . . . . . . . . . . . . . . . . . . . . . . 4,916 411 247 452 449 342
Net periodic benefit cost . . . . . . . . . . . . . . . . . . . . . $ 36,025 $ 25,930 $ 25,131 $3,130 $2,821 $2,455
For the year ended December 31, 2013, the Company expects to recognize in net periodic benefit cost$6.2 million ($3.8 million net of tax) and $(0.4) million ($0.3 million net of tax) of prior service cost for pensionand postretirement plans, respectively, and $6.0 million ($3.7 million net of tax) and $0.5 million ($0.3 millionnet of tax) of actuarial loss for pension and postretirement plans, respectively, which is included in accumulatedother comprehensive income (loss) at December 31, 2012.
Pension Plans Postretirement Plans
2012 2011 2010 2012 2011 2010
Weighted-Average Assumptions Used to Determine BenefitObligations at December 31
Discount rate . . . . . . . . . . . . . . . . . . . . . . . . . . . . . . . . . . . . . . . 4.25% 4.75% 5.50% 4.00% 4.50% 5.25%
Rate of compensation increase . . . . . . . . . . . . . . . . . . . . . . . . . 4.00% 4.00% 4.00% N/A N/A N/A
Weighted-Average Assumptions Used to Determine NetPeriodic Benefit Cost for the Years Ended December 31
Discount rate . . . . . . . . . . . . . . . . . . . . . . . . . . . . . . . . . . . . . . . 4.75% 5.50% 6.00% 4.50% 5.25% 5.75%
Expected return on plan assets . . . . . . . . . . . . . . . . . . . . . . . . . 6.15% 7.75% 7.75% N/A N/A N/A
Rate of compensation increase . . . . . . . . . . . . . . . . . . . . . . . . . 4.00% 4.00% 4.00% N/A N/A N/A
F-19
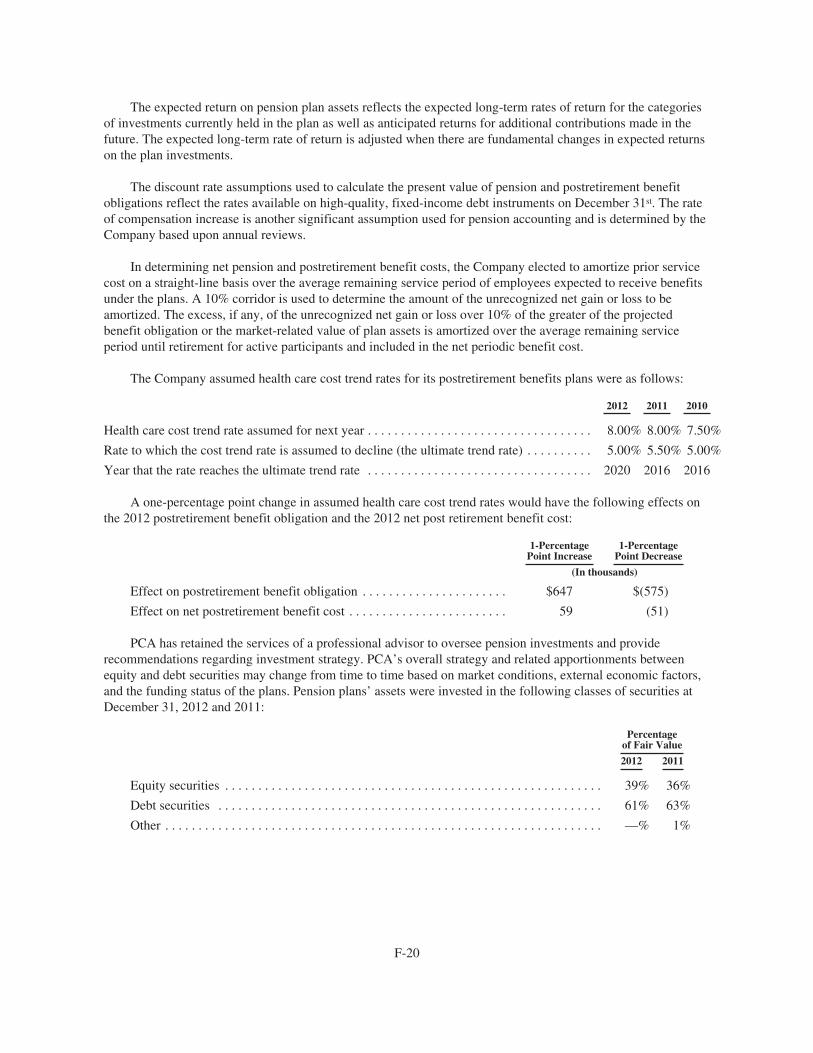
The expected return on pension plan assets reflects the expected long-term rates of return for the categoriesof investments currently held in the plan as well as anticipated returns for additional contributions made in thefuture. The expected long-term rate of return is adjusted when there are fundamental changes in expected returnson the plan investments.
The discount rate assumptions used to calculate the present value of pension and postretirement benefitobligations reflect the rates available on high-quality, fixed-income debt instruments on December 31st. The rateof compensation increase is another significant assumption used for pension accounting and is determined by theCompany based upon annual reviews.
In determining net pension and postretirement benefit costs, the Company elected to amortize prior servicecost on a straight-line basis over the average remaining service period of employees expected to receive benefitsunder the plans. A 10% corridor is used to determine the amount of the unrecognized net gain or loss to beamortized. The excess, if any, of the unrecognized net gain or loss over 10% of the greater of the projectedbenefit obligation or the market-related value of plan assets is amortized over the average remaining serviceperiod until retirement for active participants and included in the net periodic benefit cost.
The Company assumed health care cost trend rates for its postretirement benefits plans were as follows:
2012 2011 2010
Health care cost trend rate assumed for next year . . . . . . . . . . . . . . . . . . . . . . . . . . . . . . . . . . 8.00% 8.00% 7.50%
Rate to which the cost trend rate is assumed to decline (the ultimate trend rate) . . . . . . . . . . 5.00% 5.50% 5.00%
Year that the rate reaches the ultimate trend rate . . . . . . . . . . . . . . . . . . . . . . . . . . . . . . . . . . 2020 2016 2016
A one-percentage point change in assumed health care cost trend rates would have the following effects onthe 2012 postretirement benefit obligation and the 2012 net post retirement benefit cost:
1-PercentagePoint Increase
1-PercentagePoint Decrease
(In thousands)
Effect on postretirement benefit obligation . . . . . . . . . . . . . . . . . . . . . . $647 $(575)
Effect on net postretirement benefit cost . . . . . . . . . . . . . . . . . . . . . . . . 59 (51)
PCA has retained the services of a professional advisor to oversee pension investments and providerecommendations regarding investment strategy. PCA’s overall strategy and related apportionments betweenequity and debt securities may change from time to time based on market conditions, external economic factors,and the funding status of the plans. Pension plans’ assets were invested in the following classes of securities atDecember 31, 2012 and 2011:
Percentageof Fair Value
2012 2011
Equity securities . . . . . . . . . . . . . . . . . . . . . . . . . . . . . . . . . . . . . . . . . . . . . . . . . . . . . . . . . 39% 36%
Debt securities . . . . . . . . . . . . . . . . . . . . . . . . . . . . . . . . . . . . . . . . . . . . . . . . . . . . . . . . . . 61% 63%
Other . . . . . . . . . . . . . . . . . . . . . . . . . . . . . . . . . . . . . . . . . . . . . . . . . . . . . . . . . . . . . . . . . . —% 1%
F-20
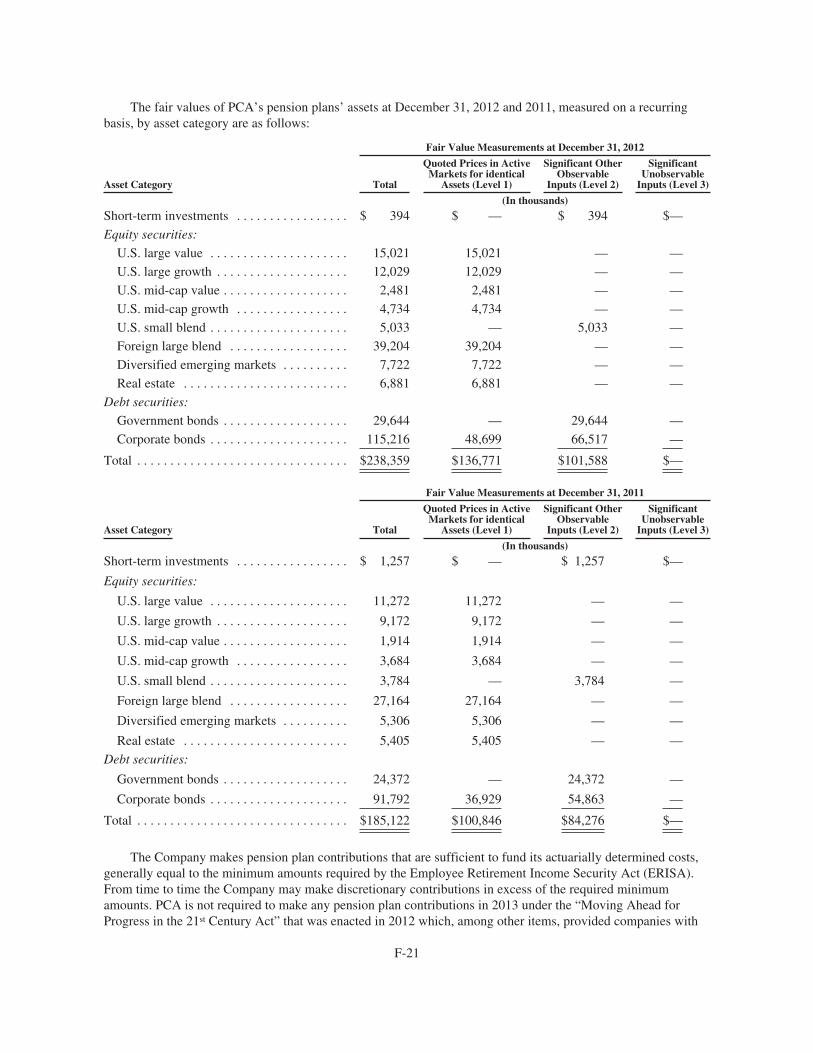
The fair values of PCA’s pension plans’ assets at December 31, 2012 and 2011, measured on a recurringbasis, by asset category are as follows:
Fair Value Measurements at December 31, 2012
Asset Category Total
Quoted Prices in ActiveMarkets for identical
Assets (Level 1)
Significant OtherObservable
Inputs (Level 2)
SignificantUnobservable
Inputs (Level 3)
(In thousands)
Short-term investments . . . . . . . . . . . . . . . . . $ 394 $ — $ 394 $—
Equity securities:
U.S. large value . . . . . . . . . . . . . . . . . . . . . 15,021 15,021 — —
U.S. large growth . . . . . . . . . . . . . . . . . . . . 12,029 12,029 — —
U.S. mid-cap value . . . . . . . . . . . . . . . . . . . 2,481 2,481 — —
U.S. mid-cap growth . . . . . . . . . . . . . . . . . 4,734 4,734 — —
U.S. small blend . . . . . . . . . . . . . . . . . . . . . 5,033 — 5,033 —
Foreign large blend . . . . . . . . . . . . . . . . . . 39,204 39,204 — —
Diversified emerging markets . . . . . . . . . . 7,722 7,722 — —
Real estate . . . . . . . . . . . . . . . . . . . . . . . . . 6,881 6,881 — —
Debt securities:
Government bonds . . . . . . . . . . . . . . . . . . . 29,644 — 29,644 —
Corporate bonds . . . . . . . . . . . . . . . . . . . . . 115,216 48,699 66,517 —
Total . . . . . . . . . . . . . . . . . . . . . . . . . . . . . . . . $238,359 $136,771 $101,588 $—
Fair Value Measurements at December 31, 2011
Asset Category Total
Quoted Prices in ActiveMarkets for identical
Assets (Level 1)
Significant OtherObservable
Inputs (Level 2)
SignificantUnobservable
Inputs (Level 3)
(In thousands)
Short-term investments . . . . . . . . . . . . . . . . . $ 1,257 $ — $ 1,257 $—
Equity securities:
U.S. large value . . . . . . . . . . . . . . . . . . . . . 11,272 11,272 — —
U.S. large growth . . . . . . . . . . . . . . . . . . . . 9,172 9,172 — —
U.S. mid-cap value . . . . . . . . . . . . . . . . . . . 1,914 1,914 — —
U.S. mid-cap growth . . . . . . . . . . . . . . . . . 3,684 3,684 — —
U.S. small blend . . . . . . . . . . . . . . . . . . . . . 3,784 — 3,784 —
Foreign large blend . . . . . . . . . . . . . . . . . . 27,164 27,164 — —
Diversified emerging markets . . . . . . . . . . 5,306 5,306 — —
Real estate . . . . . . . . . . . . . . . . . . . . . . . . . 5,405 5,405 — —
Debt securities:
Government bonds . . . . . . . . . . . . . . . . . . . 24,372 — 24,372 —
Corporate bonds . . . . . . . . . . . . . . . . . . . . . 91,792 36,929 54,863 —
Total . . . . . . . . . . . . . . . . . . . . . . . . . . . . . . . . $185,122 $100,846 $84,276 $—
The Company makes pension plan contributions that are sufficient to fund its actuarially determined costs,generally equal to the minimum amounts required by the Employee Retirement Income Security Act (ERISA).From time to time the Company may make discretionary contributions in excess of the required minimumamounts. PCA is not required to make any pension plan contributions in 2013 under the “Moving Ahead forProgress in the 21st Century Act” that was enacted in 2012 which, among other items, provided companies with
F-21
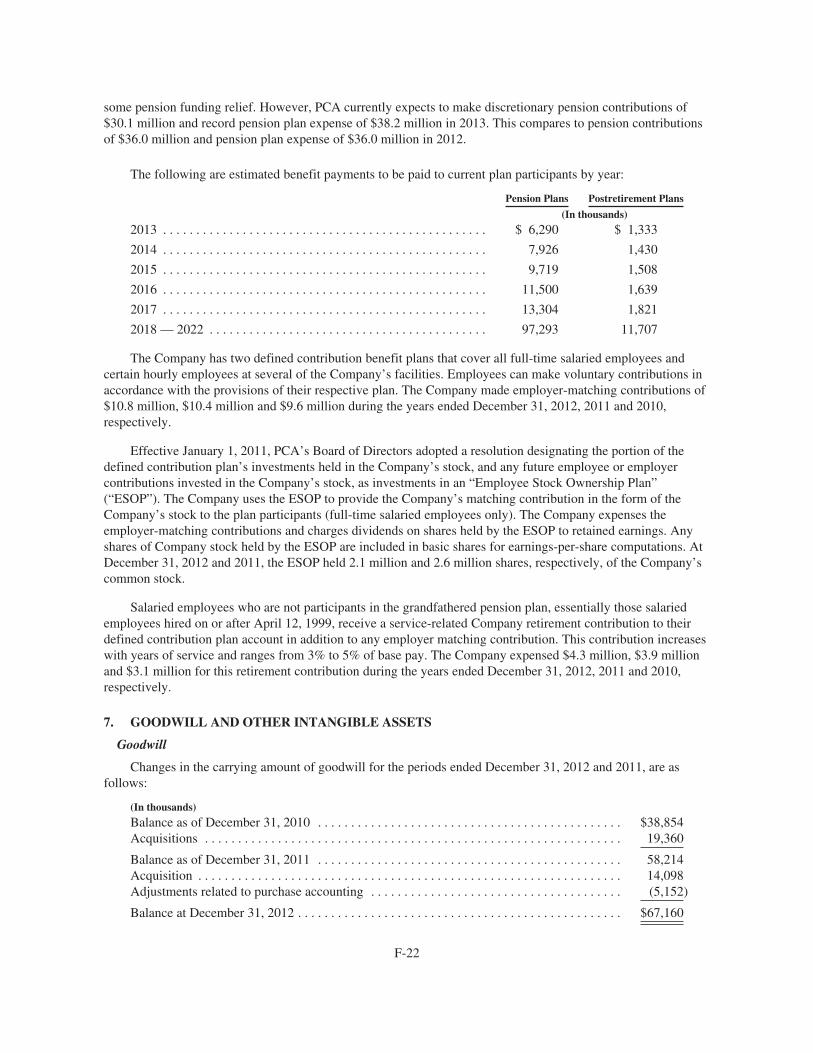
some pension funding relief. However, PCA currently expects to make discretionary pension contributions of$30.1 million and record pension plan expense of $38.2 million in 2013. This compares to pension contributionsof $36.0 million and pension plan expense of $36.0 million in 2012.
The following are estimated benefit payments to be paid to current plan participants by year:
Pension Plans Postretirement Plans
(In thousands)
2013 . . . . . . . . . . . . . . . . . . . . . . . . . . . . . . . . . . . . . . . . . . . . . . . . . $ 6,290 $ 1,333
2014 . . . . . . . . . . . . . . . . . . . . . . . . . . . . . . . . . . . . . . . . . . . . . . . . . 7,926 1,430
2015 . . . . . . . . . . . . . . . . . . . . . . . . . . . . . . . . . . . . . . . . . . . . . . . . . 9,719 1,508
2016 . . . . . . . . . . . . . . . . . . . . . . . . . . . . . . . . . . . . . . . . . . . . . . . . . 11,500 1,639
2017 . . . . . . . . . . . . . . . . . . . . . . . . . . . . . . . . . . . . . . . . . . . . . . . . . 13,304 1,821
2018 — 2022 . . . . . . . . . . . . . . . . . . . . . . . . . . . . . . . . . . . . . . . . . . 97,293 11,707
The Company has two defined contribution benefit plans that cover all full-time salaried employees andcertain hourly employees at several of the Company’s facilities. Employees can make voluntary contributions inaccordance with the provisions of their respective plan. The Company made employer-matching contributions of$10.8 million, $10.4 million and $9.6 million during the years ended December 31, 2012, 2011 and 2010,respectively.
Effective January 1, 2011, PCA’s Board of Directors adopted a resolution designating the portion of thedefined contribution plan’s investments held in the Company’s stock, and any future employee or employercontributions invested in the Company’s stock, as investments in an “Employee Stock Ownership Plan”(“ESOP”). The Company uses the ESOP to provide the Company’s matching contribution in the form of theCompany’s stock to the plan participants (full-time salaried employees only). The Company expenses theemployer-matching contributions and charges dividends on shares held by the ESOP to retained earnings. Anyshares of Company stock held by the ESOP are included in basic shares for earnings-per-share computations. AtDecember 31, 2012 and 2011, the ESOP held 2.1 million and 2.6 million shares, respectively, of the Company’scommon stock.
Salaried employees who are not participants in the grandfathered pension plan, essentially those salariedemployees hired on or after April 12, 1999, receive a service-related Company retirement contribution to theirdefined contribution plan account in addition to any employer matching contribution. This contribution increaseswith years of service and ranges from 3% to 5% of base pay. The Company expensed $4.3 million, $3.9 millionand $3.1 million for this retirement contribution during the years ended December 31, 2012, 2011 and 2010,respectively.
7. GOODWILL AND OTHER INTANGIBLE ASSETS
Goodwill
Changes in the carrying amount of goodwill for the periods ended December 31, 2012 and 2011, are asfollows:
(In thousands)
Balance as of December 31, 2010 . . . . . . . . . . . . . . . . . . . . . . . . . . . . . . . . . . . . . . . . . . . . . . $38,854Acquisitions . . . . . . . . . . . . . . . . . . . . . . . . . . . . . . . . . . . . . . . . . . . . . . . . . . . . . . . . . . . . . . . 19,360
Balance as of December 31, 2011 . . . . . . . . . . . . . . . . . . . . . . . . . . . . . . . . . . . . . . . . . . . . . . 58,214Acquisition . . . . . . . . . . . . . . . . . . . . . . . . . . . . . . . . . . . . . . . . . . . . . . . . . . . . . . . . . . . . . . . . 14,098Adjustments related to purchase accounting . . . . . . . . . . . . . . . . . . . . . . . . . . . . . . . . . . . . . . (5,152)
Balance at December 31, 2012 . . . . . . . . . . . . . . . . . . . . . . . . . . . . . . . . . . . . . . . . . . . . . . . . . $67,160
F-22
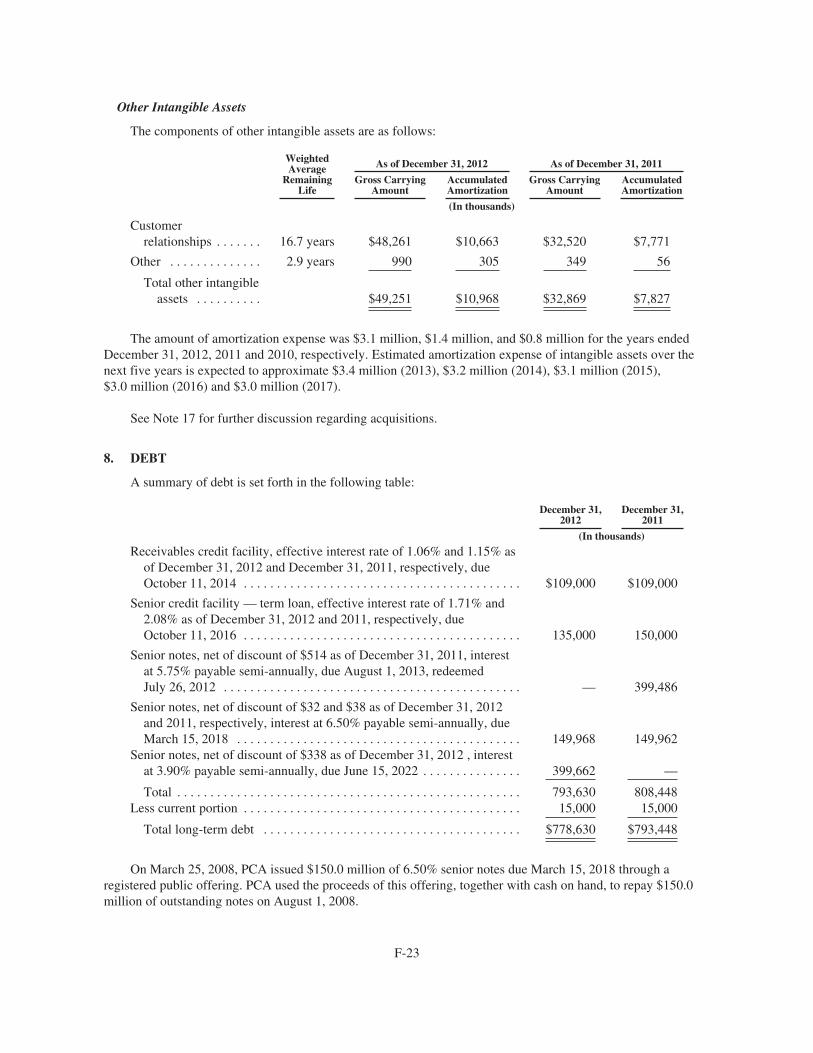
Other Intangible Assets
The components of other intangible assets are as follows:
WeightedAverage
RemainingLife
As of December 31, 2012 As of December 31, 2011
Gross CarryingAmount
AccumulatedAmortization
Gross CarryingAmount
AccumulatedAmortization
(In thousands)
Customerrelationships . . . . . . . 16.7 years $48,261 $10,663 $32,520 $7,771
Other . . . . . . . . . . . . . . 2.9 years 990 305 349 56
Total other intangibleassets . . . . . . . . . . $49,251 $10,968 $32,869 $7,827
The amount of amortization expense was $3.1 million, $1.4 million, and $0.8 million for the years endedDecember 31, 2012, 2011 and 2010, respectively. Estimated amortization expense of intangible assets over thenext five years is expected to approximate $3.4 million (2013), $3.2 million (2014), $3.1 million (2015),$3.0 million (2016) and $3.0 million (2017).
See Note 17 for further discussion regarding acquisitions.
8. DEBT
A summary of debt is set forth in the following table:
December 31,2012
December 31,2011
(In thousands)
Receivables credit facility, effective interest rate of 1.06% and 1.15% asof December 31, 2012 and December 31, 2011, respectively, dueOctober 11, 2014 . . . . . . . . . . . . . . . . . . . . . . . . . . . . . . . . . . . . . . . . . . $109,000 $109,000
Senior credit facility — term loan, effective interest rate of 1.71% and2.08% as of December 31, 2012 and 2011, respectively, dueOctober 11, 2016 . . . . . . . . . . . . . . . . . . . . . . . . . . . . . . . . . . . . . . . . . . 135,000 150,000
Senior notes, net of discount of $514 as of December 31, 2011, interestat 5.75% payable semi-annually, due August 1, 2013, redeemedJuly 26, 2012 . . . . . . . . . . . . . . . . . . . . . . . . . . . . . . . . . . . . . . . . . . . . . — 399,486
Senior notes, net of discount of $32 and $38 as of December 31, 2012and 2011, respectively, interest at 6.50% payable semi-annually, dueMarch 15, 2018 . . . . . . . . . . . . . . . . . . . . . . . . . . . . . . . . . . . . . . . . . . . 149,968 149,962
Senior notes, net of discount of $338 as of December 31, 2012 , interestat 3.90% payable semi-annually, due June 15, 2022 . . . . . . . . . . . . . . . 399,662 —
Total . . . . . . . . . . . . . . . . . . . . . . . . . . . . . . . . . . . . . . . . . . . . . . . . . . . . 793,630 808,448Less current portion . . . . . . . . . . . . . . . . . . . . . . . . . . . . . . . . . . . . . . . . . . 15,000 15,000
Total long-term debt . . . . . . . . . . . . . . . . . . . . . . . . . . . . . . . . . . . . . . . $778,630 $793,448
On March 25, 2008, PCA issued $150.0 million of 6.50% senior notes due March 15, 2018 through aregistered public offering. PCA used the proceeds of this offering, together with cash on hand, to repay $150.0million of outstanding notes on August 1, 2008.
F-23
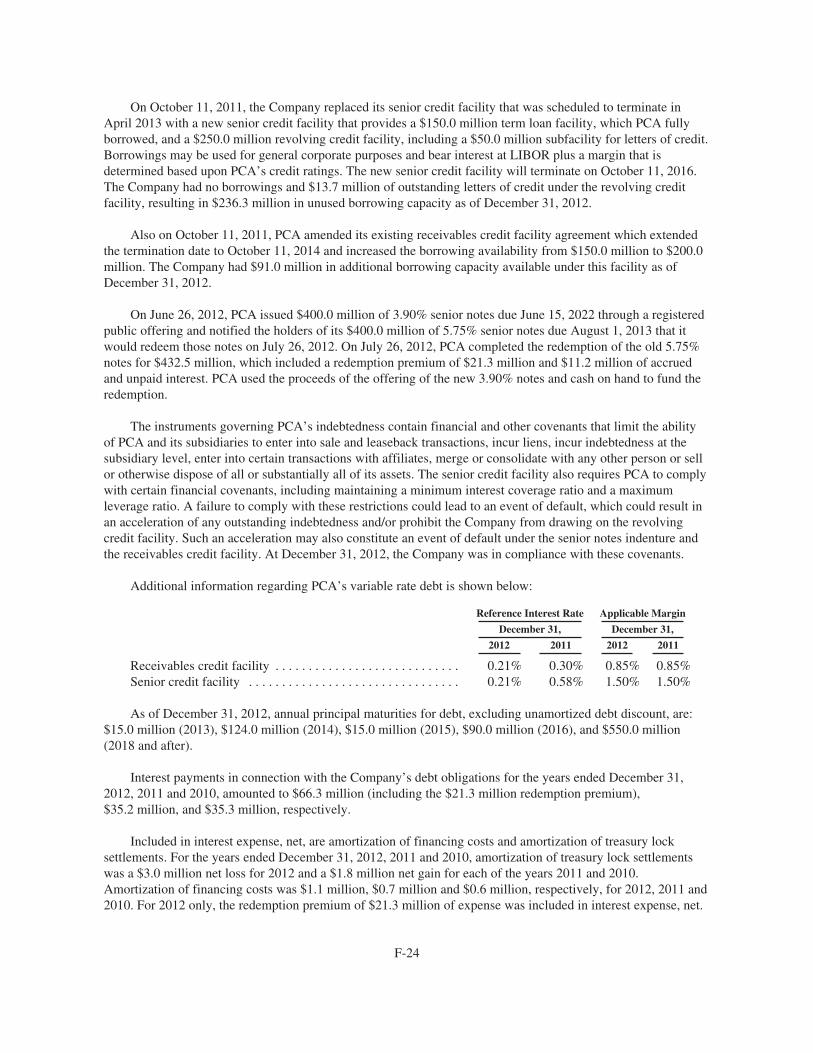
On October 11, 2011, the Company replaced its senior credit facility that was scheduled to terminate inApril 2013 with a new senior credit facility that provides a $150.0 million term loan facility, which PCA fullyborrowed, and a $250.0 million revolving credit facility, including a $50.0 million subfacility for letters of credit.Borrowings may be used for general corporate purposes and bear interest at LIBOR plus a margin that isdetermined based upon PCA’s credit ratings. The new senior credit facility will terminate on October 11, 2016.The Company had no borrowings and $13.7 million of outstanding letters of credit under the revolving creditfacility, resulting in $236.3 million in unused borrowing capacity as of December 31, 2012.
Also on October 11, 2011, PCA amended its existing receivables credit facility agreement which extendedthe termination date to October 11, 2014 and increased the borrowing availability from $150.0 million to $200.0million. The Company had $91.0 million in additional borrowing capacity available under this facility as ofDecember 31, 2012.
On June 26, 2012, PCA issued $400.0 million of 3.90% senior notes due June 15, 2022 through a registeredpublic offering and notified the holders of its $400.0 million of 5.75% senior notes due August 1, 2013 that itwould redeem those notes on July 26, 2012. On July 26, 2012, PCA completed the redemption of the old 5.75%notes for $432.5 million, which included a redemption premium of $21.3 million and $11.2 million of accruedand unpaid interest. PCA used the proceeds of the offering of the new 3.90% notes and cash on hand to fund theredemption.
The instruments governing PCA’s indebtedness contain financial and other covenants that limit the abilityof PCA and its subsidiaries to enter into sale and leaseback transactions, incur liens, incur indebtedness at thesubsidiary level, enter into certain transactions with affiliates, merge or consolidate with any other person or sellor otherwise dispose of all or substantially all of its assets. The senior credit facility also requires PCA to complywith certain financial covenants, including maintaining a minimum interest coverage ratio and a maximumleverage ratio. A failure to comply with these restrictions could lead to an event of default, which could result inan acceleration of any outstanding indebtedness and/or prohibit the Company from drawing on the revolvingcredit facility. Such an acceleration may also constitute an event of default under the senior notes indenture andthe receivables credit facility. At December 31, 2012, the Company was in compliance with these covenants.
Additional information regarding PCA’s variable rate debt is shown below:
Reference Interest Rate Applicable Margin
December 31, December 31,
2012 2011 2012 2011
Receivables credit facility . . . . . . . . . . . . . . . . . . . . . . . . . . . . 0.21% 0.30% 0.85% 0.85%Senior credit facility . . . . . . . . . . . . . . . . . . . . . . . . . . . . . . . . 0.21% 0.58% 1.50% 1.50%
As of December 31, 2012, annual principal maturities for debt, excluding unamortized debt discount, are:$15.0 million (2013), $124.0 million (2014), $15.0 million (2015), $90.0 million (2016), and $550.0 million(2018 and after).
Interest payments in connection with the Company’s debt obligations for the years ended December 31,2012, 2011 and 2010, amounted to $66.3 million (including the $21.3 million redemption premium),$35.2 million, and $35.3 million, respectively.
Included in interest expense, net, are amortization of financing costs and amortization of treasury locksettlements. For the years ended December 31, 2012, 2011 and 2010, amortization of treasury lock settlementswas a $3.0 million net loss for 2012 and a $1.8 million net gain for each of the years 2011 and 2010.Amortization of financing costs was $1.1 million, $0.7 million and $0.6 million, respectively, for 2012, 2011 and2010. For 2012 only, the redemption premium of $21.3 million of expense was included in interest expense, net.
F-24
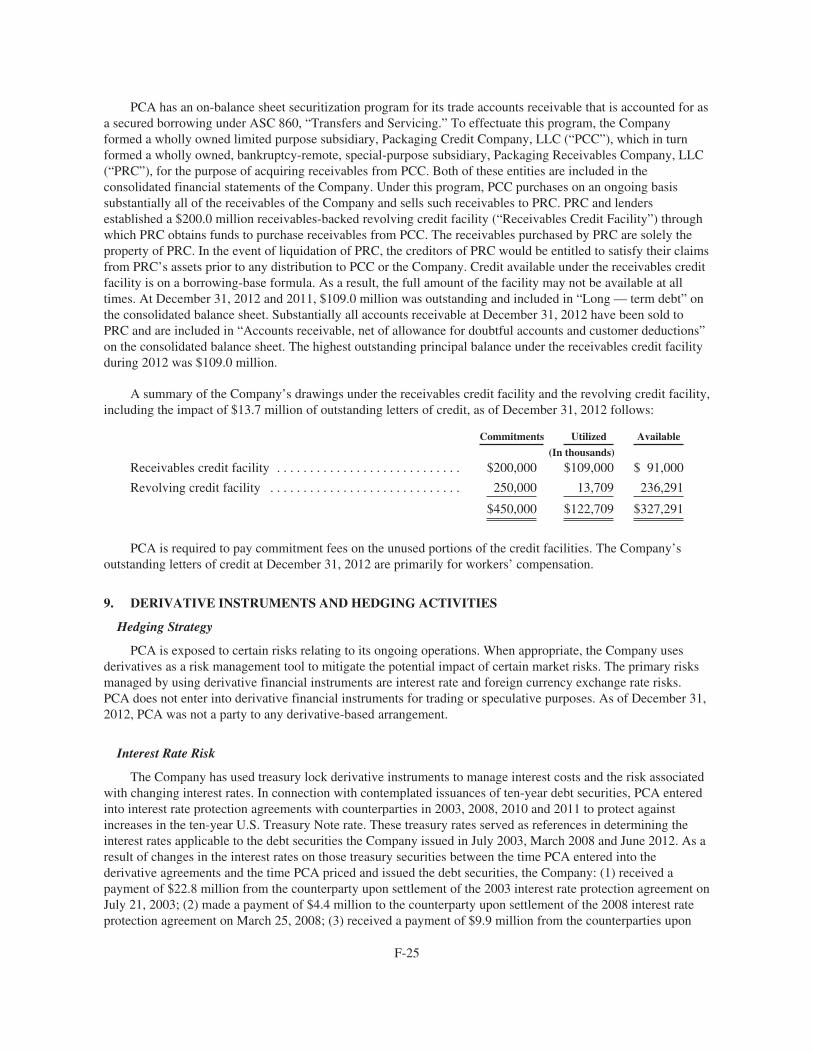
PCA has an on-balance sheet securitization program for its trade accounts receivable that is accounted for asa secured borrowing under ASC 860, “Transfers and Servicing.” To effectuate this program, the Companyformed a wholly owned limited purpose subsidiary, Packaging Credit Company, LLC (“PCC”), which in turnformed a wholly owned, bankruptcy-remote, special-purpose subsidiary, Packaging Receivables Company, LLC(“PRC”), for the purpose of acquiring receivables from PCC. Both of these entities are included in theconsolidated financial statements of the Company. Under this program, PCC purchases on an ongoing basissubstantially all of the receivables of the Company and sells such receivables to PRC. PRC and lendersestablished a $200.0 million receivables-backed revolving credit facility (“Receivables Credit Facility”) throughwhich PRC obtains funds to purchase receivables from PCC. The receivables purchased by PRC are solely theproperty of PRC. In the event of liquidation of PRC, the creditors of PRC would be entitled to satisfy their claimsfrom PRC’s assets prior to any distribution to PCC or the Company. Credit available under the receivables creditfacility is on a borrowing-base formula. As a result, the full amount of the facility may not be available at alltimes. At December 31, 2012 and 2011, $109.0 million was outstanding and included in “Long — term debt” onthe consolidated balance sheet. Substantially all accounts receivable at December 31, 2012 have been sold toPRC and are included in “Accounts receivable, net of allowance for doubtful accounts and customer deductions”on the consolidated balance sheet. The highest outstanding principal balance under the receivables credit facilityduring 2012 was $109.0 million.
A summary of the Company’s drawings under the receivables credit facility and the revolving credit facility,including the impact of $13.7 million of outstanding letters of credit, as of December 31, 2012 follows:
Commitments Utilized Available
(In thousands)
Receivables credit facility . . . . . . . . . . . . . . . . . . . . . . . . . . . . $200,000 $109,000 $ 91,000
Revolving credit facility . . . . . . . . . . . . . . . . . . . . . . . . . . . . . 250,000 13,709 236,291
$450,000 $122,709 $327,291
PCA is required to pay commitment fees on the unused portions of the credit facilities. The Company’soutstanding letters of credit at December 31, 2012 are primarily for workers’ compensation.
9. DERIVATIVE INSTRUMENTS AND HEDGING ACTIVITIES
Hedging Strategy
PCA is exposed to certain risks relating to its ongoing operations. When appropriate, the Company usesderivatives as a risk management tool to mitigate the potential impact of certain market risks. The primary risksmanaged by using derivative financial instruments are interest rate and foreign currency exchange rate risks.PCA does not enter into derivative financial instruments for trading or speculative purposes. As of December 31,2012, PCA was not a party to any derivative-based arrangement.
Interest Rate Risk
The Company has used treasury lock derivative instruments to manage interest costs and the risk associatedwith changing interest rates. In connection with contemplated issuances of ten-year debt securities, PCA enteredinto interest rate protection agreements with counterparties in 2003, 2008, 2010 and 2011 to protect againstincreases in the ten-year U.S. Treasury Note rate. These treasury rates served as references in determining theinterest rates applicable to the debt securities the Company issued in July 2003, March 2008 and June 2012. As aresult of changes in the interest rates on those treasury securities between the time PCA entered into thederivative agreements and the time PCA priced and issued the debt securities, the Company: (1) received apayment of $22.8 million from the counterparty upon settlement of the 2003 interest rate protection agreement onJuly 21, 2003; (2) made a payment of $4.4 million to the counterparty upon settlement of the 2008 interest rateprotection agreement on March 25, 2008; (3) received a payment of $9.9 million from the counterparties upon
F-25
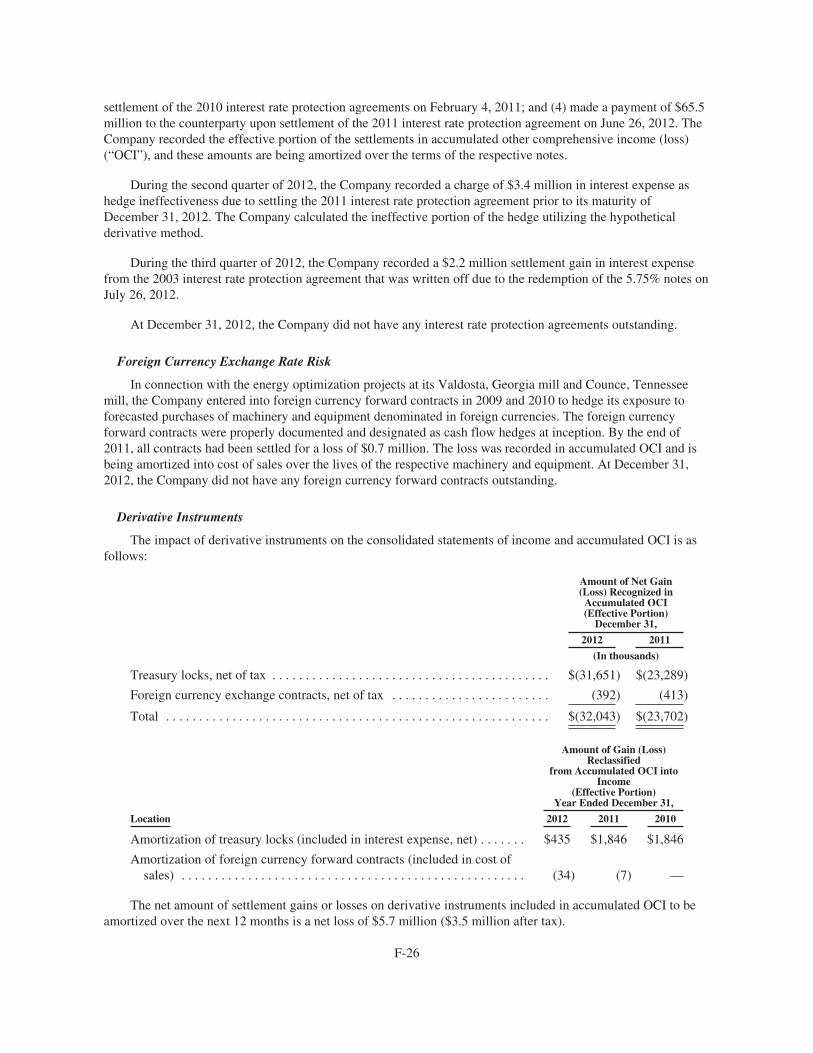
settlement of the 2010 interest rate protection agreements on February 4, 2011; and (4) made a payment of $65.5million to the counterparty upon settlement of the 2011 interest rate protection agreement on June 26, 2012. TheCompany recorded the effective portion of the settlements in accumulated other comprehensive income (loss)(“OCI”), and these amounts are being amortized over the terms of the respective notes.
During the second quarter of 2012, the Company recorded a charge of $3.4 million in interest expense ashedge ineffectiveness due to settling the 2011 interest rate protection agreement prior to its maturity ofDecember 31, 2012. The Company calculated the ineffective portion of the hedge utilizing the hypotheticalderivative method.
During the third quarter of 2012, the Company recorded a $2.2 million settlement gain in interest expensefrom the 2003 interest rate protection agreement that was written off due to the redemption of the 5.75% notes onJuly 26, 2012.
At December 31, 2012, the Company did not have any interest rate protection agreements outstanding.
Foreign Currency Exchange Rate Risk
In connection with the energy optimization projects at its Valdosta, Georgia mill and Counce, Tennesseemill, the Company entered into foreign currency forward contracts in 2009 and 2010 to hedge its exposure toforecasted purchases of machinery and equipment denominated in foreign currencies. The foreign currencyforward contracts were properly documented and designated as cash flow hedges at inception. By the end of2011, all contracts had been settled for a loss of $0.7 million. The loss was recorded in accumulated OCI and isbeing amortized into cost of sales over the lives of the respective machinery and equipment. At December 31,2012, the Company did not have any foreign currency forward contracts outstanding.
Derivative Instruments
The impact of derivative instruments on the consolidated statements of income and accumulated OCI is asfollows:
Amount of Net Gain(Loss) Recognized in
Accumulated OCI(Effective Portion)
December 31,
2012 2011
(In thousands)
Treasury locks, net of tax . . . . . . . . . . . . . . . . . . . . . . . . . . . . . . . . . . . . . . . . . . $(31,651) $(23,289)
Foreign currency exchange contracts, net of tax . . . . . . . . . . . . . . . . . . . . . . . . (392) (413)
Total . . . . . . . . . . . . . . . . . . . . . . . . . . . . . . . . . . . . . . . . . . . . . . . . . . . . . . . . . . $(32,043) $(23,702)
Amount of Gain (Loss)Reclassified
from Accumulated OCI intoIncome
(Effective Portion)Year Ended December 31,
Location 2012 2011 2010
Amortization of treasury locks (included in interest expense, net) . . . . . . . $435 $1,846 $1,846
Amortization of foreign currency forward contracts (included in cost ofsales) . . . . . . . . . . . . . . . . . . . . . . . . . . . . . . . . . . . . . . . . . . . . . . . . . . . . (34) (7) —
The net amount of settlement gains or losses on derivative instruments included in accumulated OCI to beamortized over the next 12 months is a net loss of $5.7 million ($3.5 million after tax).
F-26
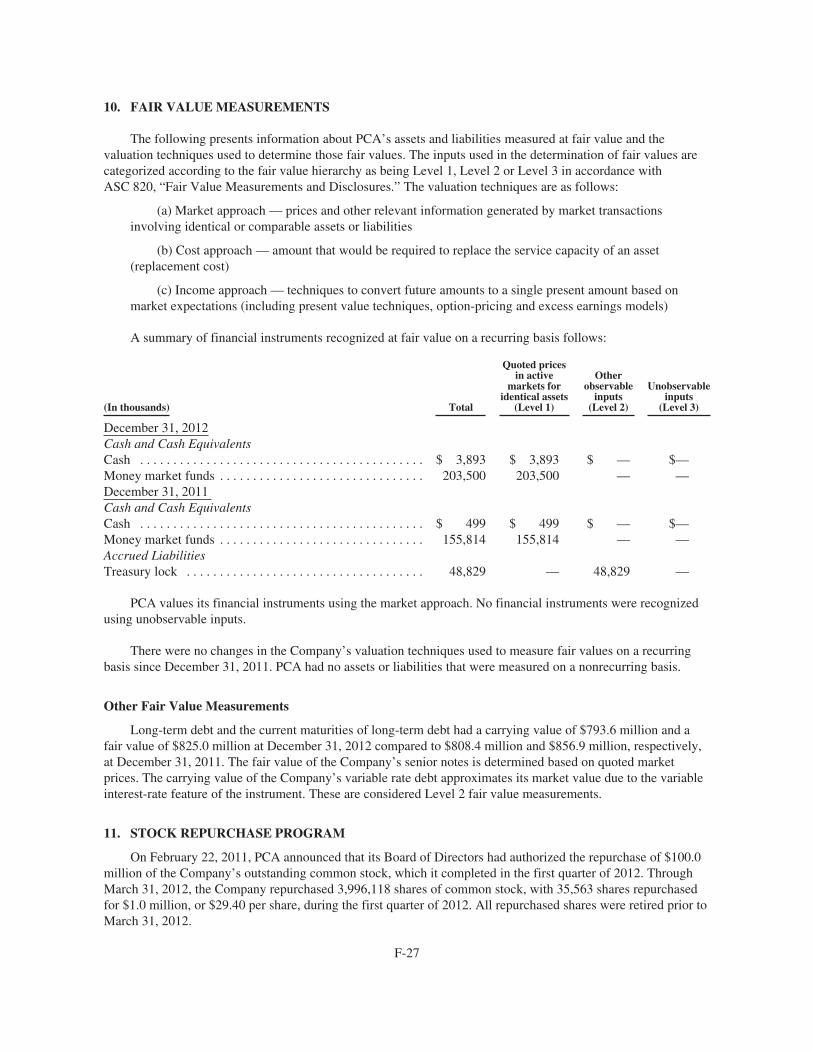
10. FAIR VALUE MEASUREMENTS
The following presents information about PCA’s assets and liabilities measured at fair value and thevaluation techniques used to determine those fair values. The inputs used in the determination of fair values arecategorized according to the fair value hierarchy as being Level 1, Level 2 or Level 3 in accordance withASC 820, “Fair Value Measurements and Disclosures.” The valuation techniques are as follows:
(a) Market approach — prices and other relevant information generated by market transactionsinvolving identical or comparable assets or liabilities
(b) Cost approach — amount that would be required to replace the service capacity of an asset(replacement cost)
(c) Income approach — techniques to convert future amounts to a single present amount based onmarket expectations (including present value techniques, option-pricing and excess earnings models)
A summary of financial instruments recognized at fair value on a recurring basis follows:
(In thousands) Total
Quoted pricesin active
markets foridentical assets
(Level 1)
Otherobservable
inputs(Level 2)
Unobservableinputs
(Level 3)
December 31, 2012Cash and Cash EquivalentsCash . . . . . . . . . . . . . . . . . . . . . . . . . . . . . . . . . . . . . . . . . . . $ 3,893 $ 3,893 $ — $—Money market funds . . . . . . . . . . . . . . . . . . . . . . . . . . . . . . . 203,500 203,500 — —December 31, 2011Cash and Cash EquivalentsCash . . . . . . . . . . . . . . . . . . . . . . . . . . . . . . . . . . . . . . . . . . . $ 499 $ 499 $ — $—Money market funds . . . . . . . . . . . . . . . . . . . . . . . . . . . . . . . 155,814 155,814 — —Accrued LiabilitiesTreasury lock . . . . . . . . . . . . . . . . . . . . . . . . . . . . . . . . . . . . 48,829 — 48,829 —
PCA values its financial instruments using the market approach. No financial instruments were recognizedusing unobservable inputs.
There were no changes in the Company’s valuation techniques used to measure fair values on a recurringbasis since December 31, 2011. PCA had no assets or liabilities that were measured on a nonrecurring basis.
Other Fair Value Measurements
Long-term debt and the current maturities of long-term debt had a carrying value of $793.6 million and afair value of $825.0 million at December 31, 2012 compared to $808.4 million and $856.9 million, respectively,at December 31, 2011. The fair value of the Company’s senior notes is determined based on quoted marketprices. The carrying value of the Company’s variable rate debt approximates its market value due to the variableinterest-rate feature of the instrument. These are considered Level 2 fair value measurements.
11. STOCK REPURCHASE PROGRAM
On February 22, 2011, PCA announced that its Board of Directors had authorized the repurchase of $100.0million of the Company’s outstanding common stock, which it completed in the first quarter of 2012. ThroughMarch 31, 2012, the Company repurchased 3,996,118 shares of common stock, with 35,563 shares repurchasedfor $1.0 million, or $29.40 per share, during the first quarter of 2012. All repurchased shares were retired prior toMarch 31, 2012.
F-27
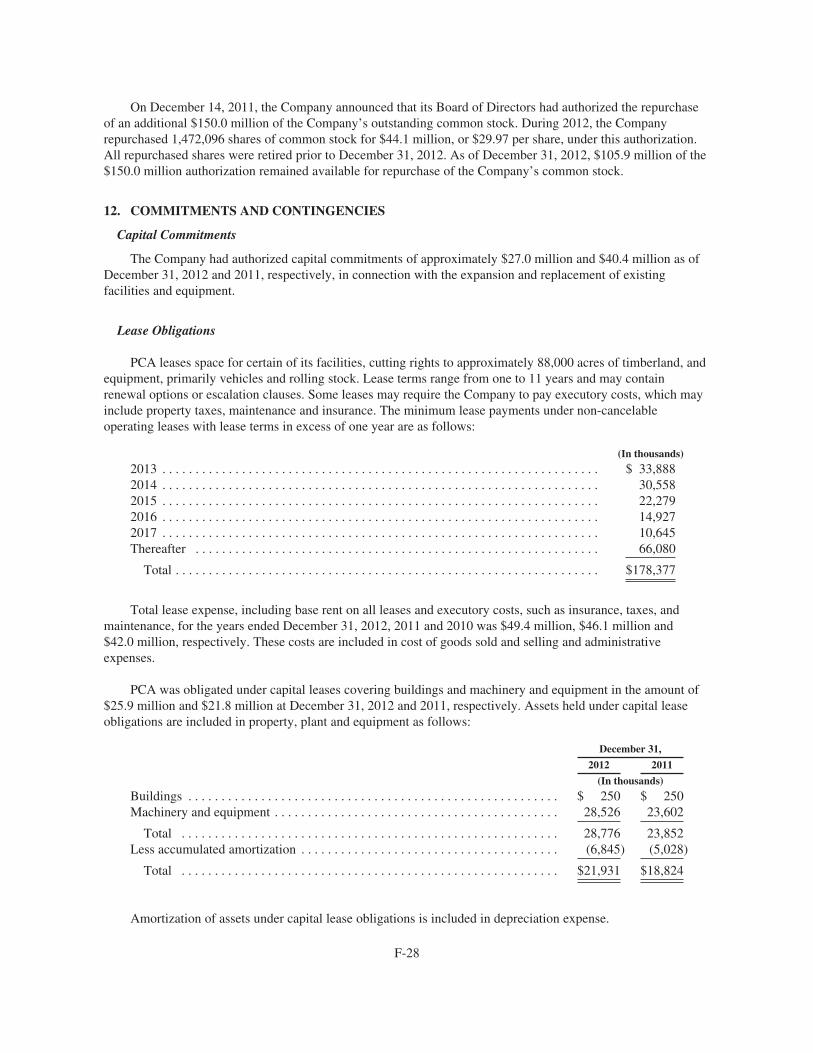
On December 14, 2011, the Company announced that its Board of Directors had authorized the repurchaseof an additional $150.0 million of the Company’s outstanding common stock. During 2012, the Companyrepurchased 1,472,096 shares of common stock for $44.1 million, or $29.97 per share, under this authorization.All repurchased shares were retired prior to December 31, 2012. As of December 31, 2012, $105.9 million of the$150.0 million authorization remained available for repurchase of the Company’s common stock.
12. COMMITMENTS AND CONTINGENCIES
Capital Commitments
The Company had authorized capital commitments of approximately $27.0 million and $40.4 million as ofDecember 31, 2012 and 2011, respectively, in connection with the expansion and replacement of existingfacilities and equipment.
Lease Obligations
PCA leases space for certain of its facilities, cutting rights to approximately 88,000 acres of timberland, andequipment, primarily vehicles and rolling stock. Lease terms range from one to 11 years and may containrenewal options or escalation clauses. Some leases may require the Company to pay executory costs, which mayinclude property taxes, maintenance and insurance. The minimum lease payments under non-cancelableoperating leases with lease terms in excess of one year are as follows:
(In thousands)
2013 . . . . . . . . . . . . . . . . . . . . . . . . . . . . . . . . . . . . . . . . . . . . . . . . . . . . . . . . . . . . . . . . . . $ 33,8882014 . . . . . . . . . . . . . . . . . . . . . . . . . . . . . . . . . . . . . . . . . . . . . . . . . . . . . . . . . . . . . . . . . . 30,5582015 . . . . . . . . . . . . . . . . . . . . . . . . . . . . . . . . . . . . . . . . . . . . . . . . . . . . . . . . . . . . . . . . . . 22,2792016 . . . . . . . . . . . . . . . . . . . . . . . . . . . . . . . . . . . . . . . . . . . . . . . . . . . . . . . . . . . . . . . . . . 14,9272017 . . . . . . . . . . . . . . . . . . . . . . . . . . . . . . . . . . . . . . . . . . . . . . . . . . . . . . . . . . . . . . . . . . 10,645Thereafter . . . . . . . . . . . . . . . . . . . . . . . . . . . . . . . . . . . . . . . . . . . . . . . . . . . . . . . . . . . . . 66,080
Total . . . . . . . . . . . . . . . . . . . . . . . . . . . . . . . . . . . . . . . . . . . . . . . . . . . . . . . . . . . . . . . . $178,377
Total lease expense, including base rent on all leases and executory costs, such as insurance, taxes, andmaintenance, for the years ended December 31, 2012, 2011 and 2010 was $49.4 million, $46.1 million and$42.0 million, respectively. These costs are included in cost of goods sold and selling and administrativeexpenses.
PCA was obligated under capital leases covering buildings and machinery and equipment in the amount of$25.9 million and $21.8 million at December 31, 2012 and 2011, respectively. Assets held under capital leaseobligations are included in property, plant and equipment as follows:
December 31,
2012 2011
(In thousands)
Buildings . . . . . . . . . . . . . . . . . . . . . . . . . . . . . . . . . . . . . . . . . . . . . . . . . . . . . . . . $ 250 $ 250Machinery and equipment . . . . . . . . . . . . . . . . . . . . . . . . . . . . . . . . . . . . . . . . . . . 28,526 23,602
Total . . . . . . . . . . . . . . . . . . . . . . . . . . . . . . . . . . . . . . . . . . . . . . . . . . . . . . . . . 28,776 23,852Less accumulated amortization . . . . . . . . . . . . . . . . . . . . . . . . . . . . . . . . . . . . . . . (6,845) (5,028)
Total . . . . . . . . . . . . . . . . . . . . . . . . . . . . . . . . . . . . . . . . . . . . . . . . . . . . . . . . . $21,931 $18,824
Amortization of assets under capital lease obligations is included in depreciation expense.
F-28
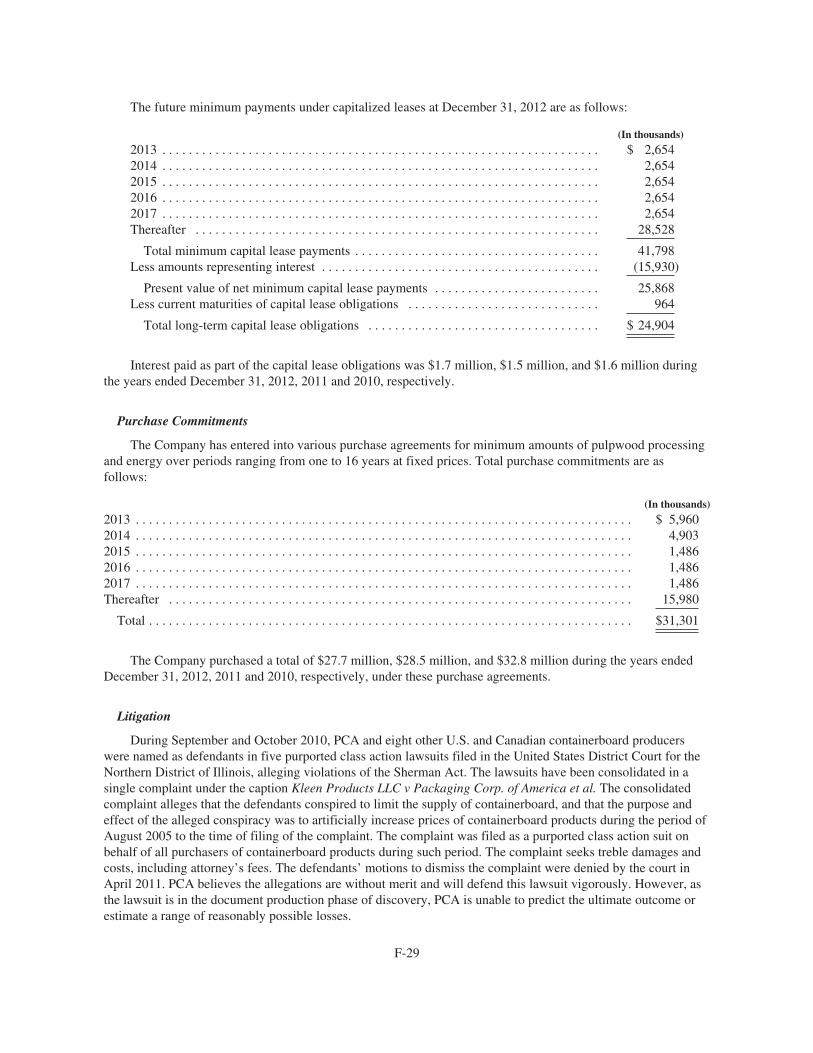
The future minimum payments under capitalized leases at December 31, 2012 are as follows:
(In thousands)
2013 . . . . . . . . . . . . . . . . . . . . . . . . . . . . . . . . . . . . . . . . . . . . . . . . . . . . . . . . . . . . . . . . . . $ 2,6542014 . . . . . . . . . . . . . . . . . . . . . . . . . . . . . . . . . . . . . . . . . . . . . . . . . . . . . . . . . . . . . . . . . . 2,6542015 . . . . . . . . . . . . . . . . . . . . . . . . . . . . . . . . . . . . . . . . . . . . . . . . . . . . . . . . . . . . . . . . . . 2,6542016 . . . . . . . . . . . . . . . . . . . . . . . . . . . . . . . . . . . . . . . . . . . . . . . . . . . . . . . . . . . . . . . . . . 2,6542017 . . . . . . . . . . . . . . . . . . . . . . . . . . . . . . . . . . . . . . . . . . . . . . . . . . . . . . . . . . . . . . . . . . 2,654Thereafter . . . . . . . . . . . . . . . . . . . . . . . . . . . . . . . . . . . . . . . . . . . . . . . . . . . . . . . . . . . . . 28,528
Total minimum capital lease payments . . . . . . . . . . . . . . . . . . . . . . . . . . . . . . . . . . . . . 41,798Less amounts representing interest . . . . . . . . . . . . . . . . . . . . . . . . . . . . . . . . . . . . . . . . . . (15,930)
Present value of net minimum capital lease payments . . . . . . . . . . . . . . . . . . . . . . . . . 25,868Less current maturities of capital lease obligations . . . . . . . . . . . . . . . . . . . . . . . . . . . . . 964
Total long-term capital lease obligations . . . . . . . . . . . . . . . . . . . . . . . . . . . . . . . . . . . $ 24,904
Interest paid as part of the capital lease obligations was $1.7 million, $1.5 million, and $1.6 million duringthe years ended December 31, 2012, 2011 and 2010, respectively.
Purchase Commitments
The Company has entered into various purchase agreements for minimum amounts of pulpwood processingand energy over periods ranging from one to 16 years at fixed prices. Total purchase commitments are asfollows:
(In thousands)
2013 . . . . . . . . . . . . . . . . . . . . . . . . . . . . . . . . . . . . . . . . . . . . . . . . . . . . . . . . . . . . . . . . . . . . . . . . . . . $ 5,9602014 . . . . . . . . . . . . . . . . . . . . . . . . . . . . . . . . . . . . . . . . . . . . . . . . . . . . . . . . . . . . . . . . . . . . . . . . . . . 4,9032015 . . . . . . . . . . . . . . . . . . . . . . . . . . . . . . . . . . . . . . . . . . . . . . . . . . . . . . . . . . . . . . . . . . . . . . . . . . . 1,4862016 . . . . . . . . . . . . . . . . . . . . . . . . . . . . . . . . . . . . . . . . . . . . . . . . . . . . . . . . . . . . . . . . . . . . . . . . . . . 1,4862017 . . . . . . . . . . . . . . . . . . . . . . . . . . . . . . . . . . . . . . . . . . . . . . . . . . . . . . . . . . . . . . . . . . . . . . . . . . . 1,486Thereafter . . . . . . . . . . . . . . . . . . . . . . . . . . . . . . . . . . . . . . . . . . . . . . . . . . . . . . . . . . . . . . . . . . . . . . 15,980
Total . . . . . . . . . . . . . . . . . . . . . . . . . . . . . . . . . . . . . . . . . . . . . . . . . . . . . . . . . . . . . . . . . . . . . . . . . $31,301
The Company purchased a total of $27.7 million, $28.5 million, and $32.8 million during the years endedDecember 31, 2012, 2011 and 2010, respectively, under these purchase agreements.
Litigation
During September and October 2010, PCA and eight other U.S. and Canadian containerboard producerswere named as defendants in five purported class action lawsuits filed in the United States District Court for theNorthern District of Illinois, alleging violations of the Sherman Act. The lawsuits have been consolidated in asingle complaint under the caption Kleen Products LLC v Packaging Corp. of America et al. The consolidatedcomplaint alleges that the defendants conspired to limit the supply of containerboard, and that the purpose andeffect of the alleged conspiracy was to artificially increase prices of containerboard products during the period ofAugust 2005 to the time of filing of the complaint. The complaint was filed as a purported class action suit onbehalf of all purchasers of containerboard products during such period. The complaint seeks treble damages andcosts, including attorney’s fees. The defendants’ motions to dismiss the complaint were denied by the court inApril 2011. PCA believes the allegations are without merit and will defend this lawsuit vigorously. However, asthe lawsuit is in the document production phase of discovery, PCA is unable to predict the ultimate outcome orestimate a range of reasonably possible losses.
F-29
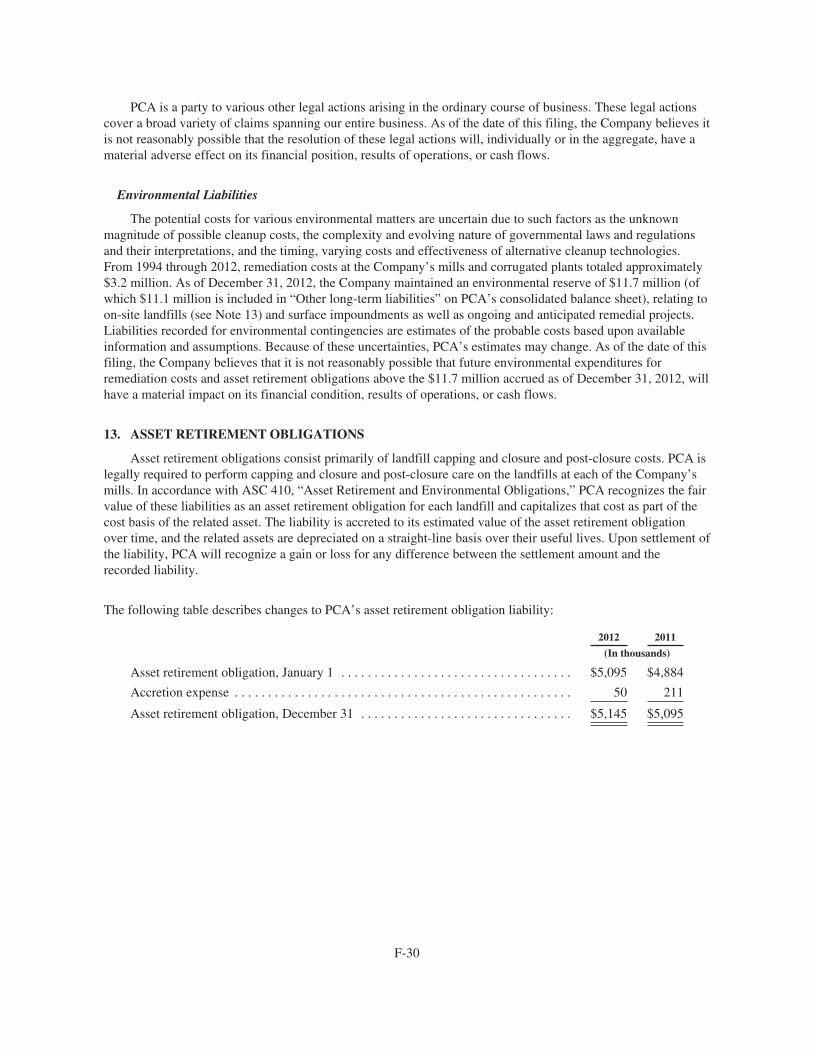
PCA is a party to various other legal actions arising in the ordinary course of business. These legal actionscover a broad variety of claims spanning our entire business. As of the date of this filing, the Company believes itis not reasonably possible that the resolution of these legal actions will, individually or in the aggregate, have amaterial adverse effect on its financial position, results of operations, or cash flows.
Environmental Liabilities
The potential costs for various environmental matters are uncertain due to such factors as the unknownmagnitude of possible cleanup costs, the complexity and evolving nature of governmental laws and regulationsand their interpretations, and the timing, varying costs and effectiveness of alternative cleanup technologies.From 1994 through 2012, remediation costs at the Company’s mills and corrugated plants totaled approximately$3.2 million. As of December 31, 2012, the Company maintained an environmental reserve of $11.7 million (ofwhich $11.1 million is included in “Other long-term liabilities” on PCA’s consolidated balance sheet), relating toon-site landfills (see Note 13) and surface impoundments as well as ongoing and anticipated remedial projects.Liabilities recorded for environmental contingencies are estimates of the probable costs based upon availableinformation and assumptions. Because of these uncertainties, PCA’s estimates may change. As of the date of thisfiling, the Company believes that it is not reasonably possible that future environmental expenditures forremediation costs and asset retirement obligations above the $11.7 million accrued as of December 31, 2012, willhave a material impact on its financial condition, results of operations, or cash flows.
13. ASSET RETIREMENT OBLIGATIONS
Asset retirement obligations consist primarily of landfill capping and closure and post-closure costs. PCA islegally required to perform capping and closure and post-closure care on the landfills at each of the Company’smills. In accordance with ASC 410, “Asset Retirement and Environmental Obligations,” PCA recognizes the fairvalue of these liabilities as an asset retirement obligation for each landfill and capitalizes that cost as part of thecost basis of the related asset. The liability is accreted to its estimated value of the asset retirement obligationover time, and the related assets are depreciated on a straight-line basis over their useful lives. Upon settlement ofthe liability, PCA will recognize a gain or loss for any difference between the settlement amount and therecorded liability.
The following table describes changes to PCA’s asset retirement obligation liability:
2012 2011
(In thousands)
Asset retirement obligation, January 1 . . . . . . . . . . . . . . . . . . . . . . . . . . . . . . . . . . . $5,095 $4,884
Accretion expense . . . . . . . . . . . . . . . . . . . . . . . . . . . . . . . . . . . . . . . . . . . . . . . . . . . 50 211
Asset retirement obligation, December 31 . . . . . . . . . . . . . . . . . . . . . . . . . . . . . . . . $5,145 $5,095
F-30
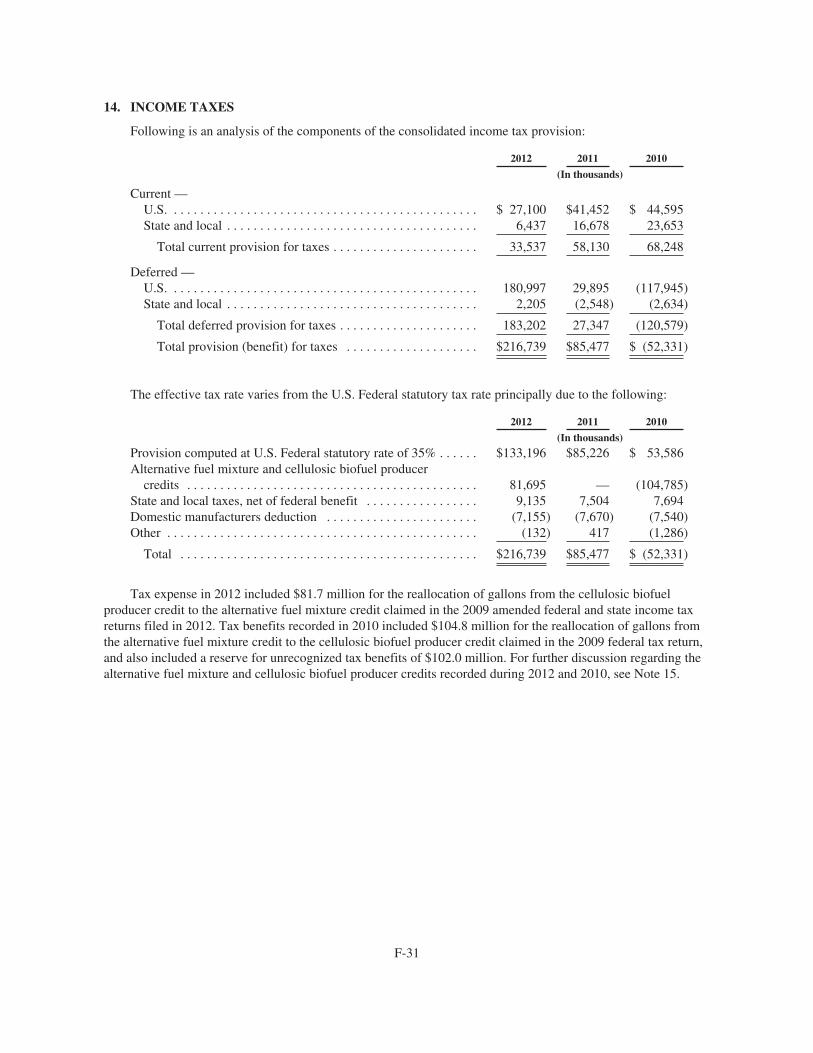
14. INCOME TAXES
Following is an analysis of the components of the consolidated income tax provision:
2012 2011 2010
(In thousands)
Current —U.S. . . . . . . . . . . . . . . . . . . . . . . . . . . . . . . . . . . . . . . . . . . . . . . $ 27,100 $41,452 $ 44,595State and local . . . . . . . . . . . . . . . . . . . . . . . . . . . . . . . . . . . . . . 6,437 16,678 23,653
Total current provision for taxes . . . . . . . . . . . . . . . . . . . . . . 33,537 58,130 68,248
Deferred —U.S. . . . . . . . . . . . . . . . . . . . . . . . . . . . . . . . . . . . . . . . . . . . . . . 180,997 29,895 (117,945)State and local . . . . . . . . . . . . . . . . . . . . . . . . . . . . . . . . . . . . . . 2,205 (2,548) (2,634)
Total deferred provision for taxes . . . . . . . . . . . . . . . . . . . . . 183,202 27,347 (120,579)
Total provision (benefit) for taxes . . . . . . . . . . . . . . . . . . . . $216,739 $85,477 $ (52,331)
The effective tax rate varies from the U.S. Federal statutory tax rate principally due to the following:
2012 2011 2010
(In thousands)
Provision computed at U.S. Federal statutory rate of 35% . . . . . . $133,196 $85,226 $ 53,586Alternative fuel mixture and cellulosic biofuel producer
credits . . . . . . . . . . . . . . . . . . . . . . . . . . . . . . . . . . . . . . . . . . . . 81,695 — (104,785)State and local taxes, net of federal benefit . . . . . . . . . . . . . . . . . 9,135 7,504 7,694Domestic manufacturers deduction . . . . . . . . . . . . . . . . . . . . . . . (7,155) (7,670) (7,540)Other . . . . . . . . . . . . . . . . . . . . . . . . . . . . . . . . . . . . . . . . . . . . . . . (132) 417 (1,286)
Total . . . . . . . . . . . . . . . . . . . . . . . . . . . . . . . . . . . . . . . . . . . . . $216,739 $85,477 $ (52,331)
Tax expense in 2012 included $81.7 million for the reallocation of gallons from the cellulosic biofuelproducer credit to the alternative fuel mixture credit claimed in the 2009 amended federal and state income taxreturns filed in 2012. Tax benefits recorded in 2010 included $104.8 million for the reallocation of gallons fromthe alternative fuel mixture credit to the cellulosic biofuel producer credit claimed in the 2009 federal tax return,and also included a reserve for unrecognized tax benefits of $102.0 million. For further discussion regarding thealternative fuel mixture and cellulosic biofuel producer credits recorded during 2012 and 2010, see Note 15.
F-31
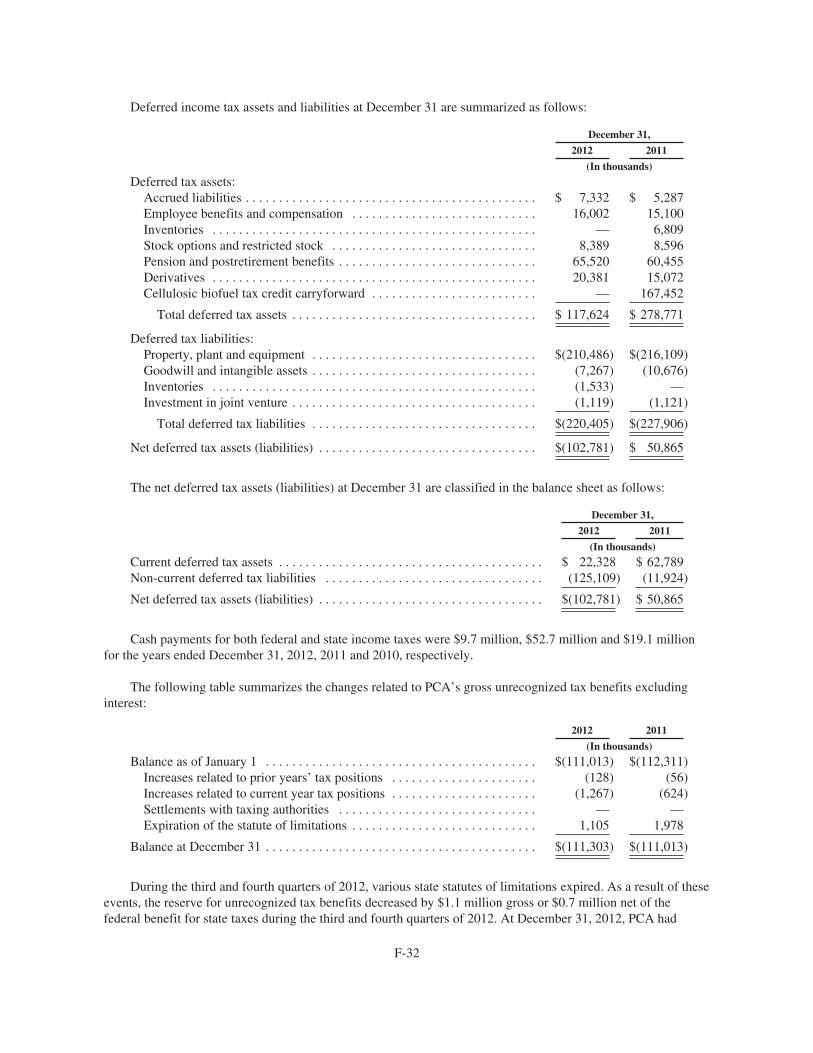
Deferred income tax assets and liabilities at December 31 are summarized as follows:
December 31,
2012 2011
(In thousands)
Deferred tax assets:Accrued liabilities . . . . . . . . . . . . . . . . . . . . . . . . . . . . . . . . . . . . . . . . . . . . $ 7,332 $ 5,287Employee benefits and compensation . . . . . . . . . . . . . . . . . . . . . . . . . . . . 16,002 15,100Inventories . . . . . . . . . . . . . . . . . . . . . . . . . . . . . . . . . . . . . . . . . . . . . . . . . — 6,809Stock options and restricted stock . . . . . . . . . . . . . . . . . . . . . . . . . . . . . . . 8,389 8,596Pension and postretirement benefits . . . . . . . . . . . . . . . . . . . . . . . . . . . . . . 65,520 60,455Derivatives . . . . . . . . . . . . . . . . . . . . . . . . . . . . . . . . . . . . . . . . . . . . . . . . . 20,381 15,072Cellulosic biofuel tax credit carryforward . . . . . . . . . . . . . . . . . . . . . . . . . — 167,452
Total deferred tax assets . . . . . . . . . . . . . . . . . . . . . . . . . . . . . . . . . . . . . $ 117,624 $ 278,771
Deferred tax liabilities:Property, plant and equipment . . . . . . . . . . . . . . . . . . . . . . . . . . . . . . . . . . $(210,486) $(216,109)Goodwill and intangible assets . . . . . . . . . . . . . . . . . . . . . . . . . . . . . . . . . . (7,267) (10,676)Inventories . . . . . . . . . . . . . . . . . . . . . . . . . . . . . . . . . . . . . . . . . . . . . . . . . (1,533) —Investment in joint venture . . . . . . . . . . . . . . . . . . . . . . . . . . . . . . . . . . . . . (1,119) (1,121)
Total deferred tax liabilities . . . . . . . . . . . . . . . . . . . . . . . . . . . . . . . . . . $(220,405) $(227,906)
Net deferred tax assets (liabilities) . . . . . . . . . . . . . . . . . . . . . . . . . . . . . . . . . $(102,781) $ 50,865
The net deferred tax assets (liabilities) at December 31 are classified in the balance sheet as follows:
December 31,
2012 2011
(In thousands)
Current deferred tax assets . . . . . . . . . . . . . . . . . . . . . . . . . . . . . . . . . . . . . . . . $ 22,328 $ 62,789Non-current deferred tax liabilities . . . . . . . . . . . . . . . . . . . . . . . . . . . . . . . . . (125,109) (11,924)
Net deferred tax assets (liabilities) . . . . . . . . . . . . . . . . . . . . . . . . . . . . . . . . . . $(102,781) $ 50,865
Cash payments for both federal and state income taxes were $9.7 million, $52.7 million and $19.1 millionfor the years ended December 31, 2012, 2011 and 2010, respectively.
The following table summarizes the changes related to PCA’s gross unrecognized tax benefits excludinginterest:
2012 2011
(In thousands)
Balance as of January 1 . . . . . . . . . . . . . . . . . . . . . . . . . . . . . . . . . . . . . . . . . $(111,013) $(112,311)Increases related to prior years’ tax positions . . . . . . . . . . . . . . . . . . . . . . (128) (56)Increases related to current year tax positions . . . . . . . . . . . . . . . . . . . . . . (1,267) (624)Settlements with taxing authorities . . . . . . . . . . . . . . . . . . . . . . . . . . . . . . — —Expiration of the statute of limitations . . . . . . . . . . . . . . . . . . . . . . . . . . . . 1,105 1,978
Balance at December 31 . . . . . . . . . . . . . . . . . . . . . . . . . . . . . . . . . . . . . . . . . $(111,303) $(111,013)
During the third and fourth quarters of 2012, various state statutes of limitations expired. As a result of theseevents, the reserve for unrecognized tax benefits decreased by $1.1 million gross or $0.7 million net of thefederal benefit for state taxes during the third and fourth quarters of 2012. At December 31, 2012, PCA had
F-32
recorded a $111.3 million reserve for unrecognized tax benefits, excluding interest and penalties. Of the total,$107.0 million (net of the federal benefit for state taxes) would impact the effective tax rate if recognized. Theincrease in reserve in 2010 is attributable to alternative energy tax credits as described in Note 15.
PCA recognizes interest and penalties related to unrecognized tax benefits as part of its income tax expense.During the years ended December 31, 2012 and 2011, PCA recorded $0.3 million gross ($0.2 million net) and$0.2 million gross ($0.16 million net), respectively, in its statement of income, increasing the accrual for interestto $2.5 million gross ($1.6 million net) and $2.2 million gross ($1.4 million, net) at December 31, 2012 and2011, respectively. Less than $0.1 million of accrual for penalties was made.
PCA and its subsidiaries are subject to U.S. federal income taxes, as well as income taxes of multiple stateand city jurisdictions. A federal examination of the tax years 2002 and 2004 has been concluded. The tax years2008 — 2012 remain open to federal examination. The tax years 2002 — 2012 remain open to stateexaminations. During March of 2011, the Internal Revenue Service (IRS) started an audit of PCA’s 2008 and2009 tax years. PCA expects the reserve for unrecognized tax benefits for alternative energy tax credits related tothe Filer City mill process to change significantly within the next twelve months due to the anticipatedconclusion of the IRS exam. PCA estimates the change in reserve for unrecognized tax benefits to be between $0and $105.0 million.
15. ALTERNATIVE ENERGY TAX CREDITS
The Company generates black liquor as a by-product of its pulp manufacturing process, which entitled it tocertain federal income tax credits. When black liquor is mixed with diesel, it is considered an alternative fuel thatwas eligible for a $0.50 per gallon refundable alternative fuel mixture credit for gallons produced beforeDecember 31, 2009. Black liquor is also eligible for a $1.01 per gallon taxable cellulosic biofuel producer creditfor gallons of black liquor produced and used in 2009. The Company first recorded income relating to thesecredits in its income statement for the year ended December 31, 2009.
During 2010, the Internal Revenue Service (IRS) released guidance related to the alternative energy creditswhich resulted in: (1) the Company releasing a reserve that was established in 2009 for ambiguity in thecalculation of the alternative fuel mixture credit; (2) reallocation of gallons of black liquor from the alternativefuel mixture credit to the cellulosic biofuel credit; and (3) the determination that the Company’s proprietarybiofuel process at its Filer City, Michigan mill would likely qualify for the cellulosic biofuel producer credit. TheCompany amended its 2009 federal income tax return in December 2010 to claim the additional Filer Citygallons. As a result of these changes, the Company recorded a charge of $(86.3) million in “Alternative fuelmixture credits” and a $135.5 million benefit in the “(Provision) benefit for income taxes.” Additional expensesof $1.6 million related to the alternative energy tax credits were also recorded, resulting in total income of $47.7million recorded in 2010. In addition, the Company recorded in 2010 a reserve for unrecognized tax benefitsunder ASC 740, “Income Taxes,” of $102.0 million (net of the federal benefit for state taxes) because the IRSguidelines do not specifically address the unique and proprietary nature of the Filer City mill process anduncertainty exists.
The cellulosic biofuel producer credit is a taxable credit. However, the laws governing the taxability of thealternative fuel mixture credit are not completely defined. The IRS has not issued definitive guidance regardingsuch taxability. PCA believes that the manner in which the credit was claimed will not subject the Company tofederal or state income taxes on such benefits. If it is determined that any of the alternative fuel mixture creditsare subject to taxation, PCA will be required to pay those taxes and take a corresponding charge to its netincome.
On February 3, 2012, PCA again amended its 2009 federal tax return to reallocate claimed gallons fromcellulosic biofuel producer credits to alternative fuel mixture credits. As a result of this change, the Companyrecorded a charge of $(118.5) million in “(Provision) benefit for income taxes” and income of $95.5 million in“Alternative fuel mixture credits,” together resulting in a first quarter 2012 non-cash, after-tax charge of $23.0
F-33
million. In the fourth quarter of 2012, PCA recorded after-tax income of $3.4 million for the amendment of the2009 state income tax returns related to the federal amendment filed in February 2012. The net impact of thesechanges resulted in a non-cash, after-tax charge of $19.6 million for the year ended December 31, 2012.
As discussed in Note 14, the IRS began its review of PCA’s 2008 and 2009 federal income tax returnsincluding the alternative energy tax credits claimed. Pending the outcome of this audit, PCA expects the reservefor unrecognized tax benefits related to the Filer City mill process to change significantly within the next twelvemonths.
16. RELATED PARTY TRANSACTIONS
At December 31, 2012 and 2011, PCA owned approximately 29% of Southern Timber Venture, LLC(“STV”) and had not guaranteed the debt of STV and has no future funding requirements. There is no carryingvalue of the Company’s investment in STV under the equity method at December 31, 2012 and 2011. PCA didnot receive any dividends from STV in 2012, 2011 or 2010.
PCA purchased pulpwood directly from STV for its Valdosta mill until November 2010, when STV sold itstimberlands to another entity. PCA purchased $2.7 million of pulpwood for its Valdosta, Georgia mill from STVduring the year ended December 31, 2010.
17. ACQUISITIONS
During 2011 and 2012, PCA acquired four corrugated products manufacturers located in Illinois, Alabama,Colorado and Pennsylvania. Information regarding the acquisitions is as follows:
Amount Allocated To
Date ofAcquisition
PurchasePrice Goodwill
CustomerRelationships
Other IntangibleAssets
(In thousands) Amount Useful Life Amount Useful Life
Field Packaging GroupChicago, Illinois . . . . . . . . . . . . . . 4/14/2011 $26,942 $11,459 $ 9,520 10 years $220 3 years
Packaging Materials CompanyHuntsville, Alabama . . . . . . . . . . . 9/10/2011 8,602 1,490 — — — —
Colorado ContainerDenver, Colorado . . . . . . . . . . . . . 11/30/2011 21,796 5,782 5,800 10 years 210 3 years
Packaging SpecialistsPittsburgh, Pennsylvania . . . . . . . . 3/16/2012 35,393 9,576 15,500 15 years 560 4 years
Purchase price in excess of amounts allocated to goodwill and intangible assets were allocated to assetsacquired and liabilities assumed. Sales and total assets of the acquisitions were not material to the Company’soverall sales and total assets prior to the acquisitions. Operating results of the acquisitions subsequent to theirpurchase dates are included in the Company’s operating results. The Company has allocated the purchase price tothe assets acquired and liabilities assumed. Amounts allocated to goodwill are deductible for tax purposes.
18. VALDOSTA MILL FIRE INSURANCE RECOVERY
On April 4, 2011, the Company’s Valdosta, Georgia mill had a fire in the turbine generator room. The fireresulted in production and sales volume losses of 11,000 tons and significant repair and demolition expenses toaffected buildings and equipment. PCA was insured for the lost production, replacement value of destroyedassets, and related expenses, subject to a $3.0 million deductible. The Company filed an insurance claim for thetotal cost of the fire and received $9.4 million, net of the $3.0 million deductible, for losses incurred and capital
F-34
expenditures during 2011. The $9.4 million in insurance proceeds is included in net cash provided by operatingactivities ($5.5 million) and in net cash used for investing activities ($3.9 million) based on the nature of thereimbursement.
During 2012, the Company received an additional $1.4 million in insurance proceeds for capitalexpenditures which is included in net cash used for investing activities based on the nature of the reimbursement.
19. U.S. TREASURY GRANT
On April 5, 2012, PCA’s application for a U.S. Treasury Section 1603 Grant for Specified Energy propertywas approved for the Valdosta energy project. The Company received the grant proceeds of $57.4 million onApril 11, 2012 and recorded the proceeds as a reduction to the cost of the related property, plant and equipment.These proceeds will be amortized ratably over the estimated useful lives of the related equipment.
20. SUBSEQUENT EVENTS
The Company has evaluated subsequent events through the filing date of this Form 10-K and determinedthere were no events to disclose.
21. QUARTERLY FINANCIAL DATA (UNAUDITED)
Fiscal Quarter
First Second Third Fourth Total
(In thousands, except per share amounts)
2012:Net sales . . . . . . . . . . . . . . . . . . . . . . . . . . . $671,357 $712,468 $723,473 $736,579 $2,843,877
Gross profit . . . . . . . . . . . . . . . . . . . . . . . . . 145,019 158,108 162,552 173,950 639,629
Income from operations . . . . . . . . . . . . . . . 169,110 83,858 92,072 98,419 443,459
Net income . . . . . . . . . . . . . . . . . . . . . . . . . 17,844 45,154 39,791 61,031 163,820
Basic earnings per share . . . . . . . . . . . . . . . 0.18 0.47 0.41 0.63 1.70
Diluted earnings per share . . . . . . . . . . . . . 0.18 0.46 0.41 0.63 1.68
Stock price — high . . . . . . . . . . . . . . . . . . . 30.62 29.80 36.68 38.67 38.67
Stock price — low . . . . . . . . . . . . . . . . . . . 24.82 25.77 27.59 33.89 24.82
2011:Net sales . . . . . . . . . . . . . . . . . . . . . . . . . . . $629,500 $665,481 $670,824 $654,306 $2,620,111
Gross profit . . . . . . . . . . . . . . . . . . . . . . . . . 133,141 136,901 137,747 134,157 541,946
Income from operations . . . . . . . . . . . . . . . 65,903 67,859 71,180 67,807 272,749
Net income . . . . . . . . . . . . . . . . . . . . . . . . . 37,417 39,368 41,777 39,465 158,027
Basic earnings per share . . . . . . . . . . . . . . . 0.37 0.39 0.42 0.41 1.59
Diluted earnings per share . . . . . . . . . . . . . 0.37 0.39 0.42 0.40 1.57
Stock price — high . . . . . . . . . . . . . . . . . . . 30.69 29.88 29.19 27.16 30.69
Stock price — low . . . . . . . . . . . . . . . . . . . 25.96 26.26 21.05 21.75 21.05
Note: The sum of the quarters may not equal the total of the respective year’s earnings per share on either abasic or diluted basis due to changes in the weighted average shares outstanding throughout the year.
During the three months ended March 31, 2012, PCA amended its 2009 federal income tax return to reducethe gallons claimed as cellulosic biofuel producer credits previously recorded as a tax benefit and to increasethose gallons claimed as alternative fuel mixture credits previously recorded as income. The increase in gallons
F-35
claimed as alternative fuel mixture credits resulted in an increase in income from operations of $95.5 million.The decrease in gallons claimed as cellulosic biofuel producer credits resulted in a decrease in tax benefits of$118.5 million, for a total decrease in net income of $23.0 million, or $0.24 per share.
For the three months ended June 30, 2012 and September 30, 2012, net income decreased by $2.5 million or$0.025 per share, and $13.5 million or $0.14 per share, respectively, due to debt refinancing charges.
For the three months ended December 31, 2012, net income increased by $3.4 million, or $0.03 per share,from state income tax adjustments, partially offset by $1.4 million, or $0.01 per share, from plant closurecharges.
For the three months ended March 31, June 30, September 30, and December 31, 2011 net incomedecreased by $2.1 million or $0.02 per share, $1.2 million or $0.01 per share, $1.0 million or $0.01 per share, and$0.5 million, or $0.005 per share, respectively, due to asset disposal charges related to major energy projects.
For the three months ended June 30, 2011, net income increased by $1.0 million or $0.01 per share due to anadjustment to reserves related to medical benefits.
F-36
Exhibit 31.1
CERTIFICATION
I, Mark W. Kowlzan, certify that:
(1) I have reviewed this annual report on Form 10-K of Packaging Corporation of America (PCA);
(2) Based on my knowledge, this annual report does not contain any untrue statement of a material fact oromit to state a material fact necessary to make the statements made, in light of the circumstances under whichsuch statements were made, not misleading with respect to the period covered by this annual report;
(3) Based on my knowledge, the financial statements, and other financial information included in thisannual report, fairly present in all material respects the financial condition, results of operations and cash flowsof PCA as of, and for, the periods presented in this annual report;
(4) PCA’s other certifying officer and I are responsible for establishing and maintaining disclosure controlsand procedures (as defined in Exchange Act Rules 13a-15(e) and 15d-15(e)) and internal control over financialreporting (as defined in Exchange Act Rules 13a-15(f) and 15d-15(f)) for PCA and have:
a) designed such disclosure controls and procedures, or caused such disclosure controls and proceduresto be designed under our supervision, to ensure that material information relating to PCA, including itsconsolidated subsidiaries, is made known to us by others within those entities, particularly during the periodin which this report is being prepared;
b) designed such internal control over financial reporting, or caused such internal control over financialreporting to be designed under our supervision, to provide reasonable assurance regarding the reliability offinancial reporting and the preparation of financial statements for external purposes in accordance withgenerally accepted accounting principles;
c) evaluated the effectiveness of PCA’s disclosure controls and procedures and presented in this reportour conclusions about the effectiveness of the disclosure controls and procedures, as of the end of the periodcovered by this report based on such evaluation; and
d) disclosed in this report any change in PCA’s internal control over financial reporting that occurredduring PCA’s most recent fiscal quarter (PCA’s fourth fiscal quarter in the case of an annual report) that hasmaterially affected, or is reasonably likely to materially affect, PCA’s internal control over financialreporting; and
(5) PCA’s other certifying officer and I have disclosed, based on our most recent evaluation of internalcontrol over financial reporting, to PCA’s auditors and the Audit Committee of PCA’s Board of Directors (orpersons performing the equivalent functions):
a) all significant deficiencies and material weaknesses in the design or operation of internal controlover financial reporting which are reasonably likely to adversely affect PCA’s ability to record, process,summarize and report financial information; and
b) any fraud, whether or not material, that involves management or other employees who have asignificant role in PCA’s internal control over financial reporting.
/s/ MARK W. KOWLZAN
Mark W. KowlzanChief Executive Officer
Dated: February 28, 2013
Exhibit 31.2
CERTIFICATION
I, Richard B. West, certify that:
(1) I have reviewed this annual report on Form 10-K of Packaging Corporation of America (PCA);
(2) Based on my knowledge, this annual report does not contain any untrue statement of a material fact oromit to state a material fact necessary to make the statements made, in light of the circumstances under whichsuch statements were made, not misleading with respect to the period covered by this annual report;
(3) Based on my knowledge, the financial statements, and other financial information included in thisannual report, fairly present in all material respects the financial condition, results of operations and cash flowsof PCA as of, and for, the periods presented in this annual report;
(4) PCA’s other certifying officer and I are responsible for establishing and maintaining disclosure controlsand procedures (as defined in Exchange Act Rules 13a-15(e) and 15d-15(e)) and internal control over financialreporting (as defined in Exchange Act Rules 13a-15(f) and 15d-15(f)) for PCA and have:
a) designed such disclosure controls and procedures, or caused such disclosure controls and proceduresto be designed under our supervision, to ensure that material information relating to PCA, including itsconsolidated subsidiaries, is made known to us by others within those entities, particularly during the periodin which this report is being prepared;
b) designed such internal control over financial reporting, or caused such internal control over financialreporting to be designed under our supervision, to provide reasonable assurance regarding the reliability offinancial reporting and the preparation of financial statements for external purposes in accordance withgenerally accepted accounting principles;
c) evaluated the effectiveness of PCA’s disclosure controls and procedures and presented in this reportour conclusions about the effectiveness of the disclosure controls and procedures, as of the end of the periodcovered by this report based on such evaluation; and
d) disclosed in this report any change in PCA’s internal control over financial reporting that occurredduring PCA’s most recent fiscal quarter (PCA’s fourth fiscal quarter in the case of an annual report) that hasmaterially affected, or is reasonably likely to materially affect, PCA’s internal control over financialreporting; and
(5) PCA’s other certifying officer and I have disclosed, based on our most recent evaluation of internalcontrol over financial reporting, to PCA’s auditors and the Audit Committee of PCA’s Board of Directors (orpersons performing the equivalent functions):
a) all significant deficiencies and material weaknesses in the design or operation of internal controlover financial reporting which are reasonably likely to adversely affect PCA’s ability to record, process,summarize and report financial information; and
b) any fraud, whether or not material, that involves management or other employees who have asignificant role in PCA’s internal control over financial reporting.
/s/ RICHARD B. WEST
Richard B. WestSenior Vice President and Chief Financial Officer
Dated: February 28, 2013
Exhibit 32.1
CERTIFICATION OF CHIEF EXECUTIVE OFFICERPURSUANT TO 18 U.S.C. §1350,AS ADOPTED PURSUANT TO
SECTION 906 OF THE SARBANES-OXLEY ACT OF 2002
I, Mark W. Kowlzan, Chief Executive Officer of Packaging Corporation of America (the “Company”),certify, pursuant to 18 U.S.C. § 1350, as adopted pursuant to Section 906 of the Sarbanes-Oxley Act of 2002, thatto my knowledge:
(1) The Annual Report of the Company on Form 10-K for the period ended December 31, 2012 fullycomplies with the requirements of Section 13(a) or 15(d) of the Securities Exchange Act of 1934; and
(2) The information contained in such Report fairly presents, in all material respects, the financialcondition and results of operations of the Company.
/s/ MARK W. KOWLZAN
Mark W. KowlzanChief Executive Officer
February 28, 2013
Exhibit 32.2
CERTIFICATION OF CHIEF FINANCIAL OFFICERPURSUANT TO 18 U.S.C. §1350,AS ADOPTED PURSUANT TO
SECTION 906 OF THE SARBANES-OXLEY ACT OF 2002
I, Richard B. West, Chief Financial Officer of Packaging Corporation of America (the “Company”), certify,pursuant to 18 U.S.C. § 1350, as adopted pursuant to Section 906 of the Sarbanes-Oxley Act of 2002, that to myknowledge:
(1) The Annual Report of the Company on Form 10-K for the period ended December 31, 2012 fullycomplies with the requirements of Section 13(a) or 15(d) of the Securities Exchange Act of 1934; and
(2) The information contained in such Report fairly presents, in all material respects, the financialcondition and results of operations of the Company.
/s/ RICHARD B. WEST
Richard B. WestSenior Vice President and Chief Financial Officer
February 28, 2013
Directors Officers
Cheryl K. BeebeExecutive Vice President andChief Financial Officer,Ingredion Incorporated
Hasan JameelEllis Signe Olsen Professor,North Carolina State University
Mark W. KowlzanChief Executive Officer,Packaging Corporation of America
Robert C. LyonsSenior Vice President andChief Financial Officer,GATX Corporation
Samuel M. MencoffCo-Chief Executive Officer,Madison Dearborn Partners, LLC
Roger B. PorterIBM Professor of Business andGovernment,Harvard University
Thomas S. SoulelesManaging Director,Madison Dearborn Partners, LLC
Paul T. SteckoExecutive Chairman,Packaging Corporation of America
James D. WoodrumAssociate Dean,Executive & Evening MBA ProgramUniversity of Wisconsin — Madison
Pamela A. BarnesVice President,Treasury and SEC Reporting
Charles G. ColbyVice President,Area General Manager
Bruce K. EllsberryVice President,Area General Manager
Donald R. HaagVice President,Manufacturing Services
Jeffrey S. KaserVice President,Area General Manager
Peter A. MartensVice President, Finance
James A. McKeeVice President,Area General Manager
Darla J. OlivierVice President, Tax
Bruce A. RidleyVice President,EH&S andOperations Services
Robert A. SchneiderVice President,Chief Information Officer
Donald R. ShirleyVice President,Corporate Process Technology
W. Brett SweeneyVice President,Area General Manager
Executive Officers
Paul T. SteckoExecutive Chairman
Mark W. KowlzanChief Executive Officer
Thomas A. HassfurtherExecutive Vice President,Corrugated Products
Richard B. WestSenior Vice President andChief Financial Officer
Kent A. PfledererSenior Vice President,Legal and Administrationand Corporate Secretary
Thomas W. H. WaltonSenior Vice President, Salesand Marketing, Corrugated Products
Charles J. CarterVice President,Containerboard Mill Operations
Stephen T. Calhoun*Vice President, Human Resources
* Retiring March 31, 2013.
Shareholder Information
Annual MeetingThe annual meeting of shareholders will be held at 8:30 a.m., central time, on May 1, 2013, at the Company’soffice located at 1955 West Field Court, Lake Forest, IL 60045.
Shareholder ServicesTo transfer securities, change address or replace lost certificates, please contact:
Packaging Corporation of America Shareholder Servicesc/o Computershare Trust Company N.A., P.O. Box 43069, Providence, RI 02940-3069Toll Free: (877) 282-1168 Outside North America: (781) 575-2723
Stock Exchange InformationPackaging Corporation of America’s common stock is listed on the New York Stock Exchange under thesymbol PKG.
CertificationsOn June 7, 2012, the Company filed with the New York Stock Exchange (the “NYSE”) the Annual CEOCertification regarding the Company’s compliance with the NYSE’s Corporate Governance listing standards asrequired by Section 303A. 12(a) of the New York Stock Exchange Listed Company Manual. In addition, theCompany has filed as exhibits to this Annual Report on Form 10-K for the year ended December 31, 2012, theapplicable certifications of its Chief Executive Officer and its Chief Financial Officer required under Section 302of the Sarbanes-Oxley Act of 2002, regarding the quality of the Company’s public disclosures.
Website: www.packagingcorp.comCorporate news releases, Forms 10-K and 10-Q, annual reports and a variety of additional information ofpotential interest to investors are available through the Company’s website.
Requests for InformationAdditional information is available without charge. For additional copies of annual reports, Forms 10-K and10-Q or other financial information, please contact:
Investor Relations, Packaging Corporation of America, 1955 West Field Court, Lake Forest, IL 60045Toll Free: (877) 454-2509

INNOVATIONSERVICE
MILLS
COMBINING PLANTS
SHEET/SPECIALTY PLANTS
HEADQUARTERS
PCA IS A LARGE COMPANY WITH A SMALL-COMPANY FEEL. THANKS TO OUR strategic positioning ACROSS THE
NATION, PCA OFFERS OUR CUSTOMERS broad expertise AND economies of scale, WHILE OUR MULTIPLE PLANT
LOCATIONS PUT US IN THE RIGHT PLACE AT THE RIGHT TIME TO EFFECTIVELY meet THE local needs OF OUR CUSTOMERS.
Containerboard Mills
Linerboard
Counce, TN
Valdosta, GA
Medium
Filer City, MI
Tomahawk, WI
Packaging and Supply Centers
Baltimore, MD
Liverpool, NY
Manheim, PA
Miami, FL
Orlando, FL
Reno, NV
Thomasville, GA
Vineland, NJ
Vista, CA
Westfield, MA
Winchester, VA
Corrugated Products Manufacturing Facilities
Akron, OH
Allentown, PA
Arlington, TX
Ashland, OH
Atlanta, GA
Baltimore, MD
Bedford Park, IL (2)
Burlington, WI
Chelmsford, MA
Cheswick, PA
Chicago, IL
Colby, WI
Commerce City, CO
Conrad, IA
Denver, CO
Donna, TX
Edmore, MI
El Paso, TX
Fairfield, OH
Franklin, WI
Fridley, MN
Garland, TX
Gas City, IN
Golden Valley, MN
Grandville, MI
Hanover, PA
Harrisonburg, VA
High Point, NC
Honea Path, SC
Huntsville, AL
Jackson, TN
Jacksonville, FL
Knoxville, TN
Lancaster, PA
Los Angeles, CA
Marshalltown, IA
Miami Gardens, FL
Middletown, OH
Milwaukee, WI
Minneapolis, MN
Morganton, NC
Muskogee, OK
Newark, OH
Newberry, SC
Northampton, MA
Northglenn, CO
Olive Branch, MS
Omaha, NE
Opelika, AL
Oxnard, CA
Pearl, MS
Phoenix, AZ
Pittsburgh, PA
Plano, TX
Plymouth, MI
Reading, PA
Richmond, VA
Roanoke, VA
Rutherfordton, NC
Salisbury, NC
Salt Lake City, UT (2)
South Gate, CA
Syracuse, NY
Traverse City, MI
Trexlertown, PA
Vincennes, IN
Waco, TX
Watertown, NY
Winter Haven, FL
Resource and Support Centers
Honea Path, SC
Winter Haven, FL
Creative Design Centers
Bentonville, AR
Fairfield, OH
Hackettstown, NJ
Marlton, NJ
Mooresville, NC
South Gate, CA
Hong Kong
Technical Center
Mundelein, IL
Corporate Headquarters
Lake Forest, IL
When you choose Packaging Corporation of America,
you work with people who do the right things for
each other and for our customers. We believe
in utilizing the power of strong collaborative
relationships, bound by the trust we have earned,
to deliver innovative packaging solutions and an
outstanding service experience.
Packaging Corporation of America
1955 West Field Court
Lake Forest, Illinois 60045
(800) 456-4725
www.packagingcorp.com
© 2013 Packaging Corporation of America. All rights reserved.