Embed Size (px)
Citation preview
1
Charts and Graphs
2011 Park/Recreation User Survey
Figur
Source: 2
Co
Source: 2
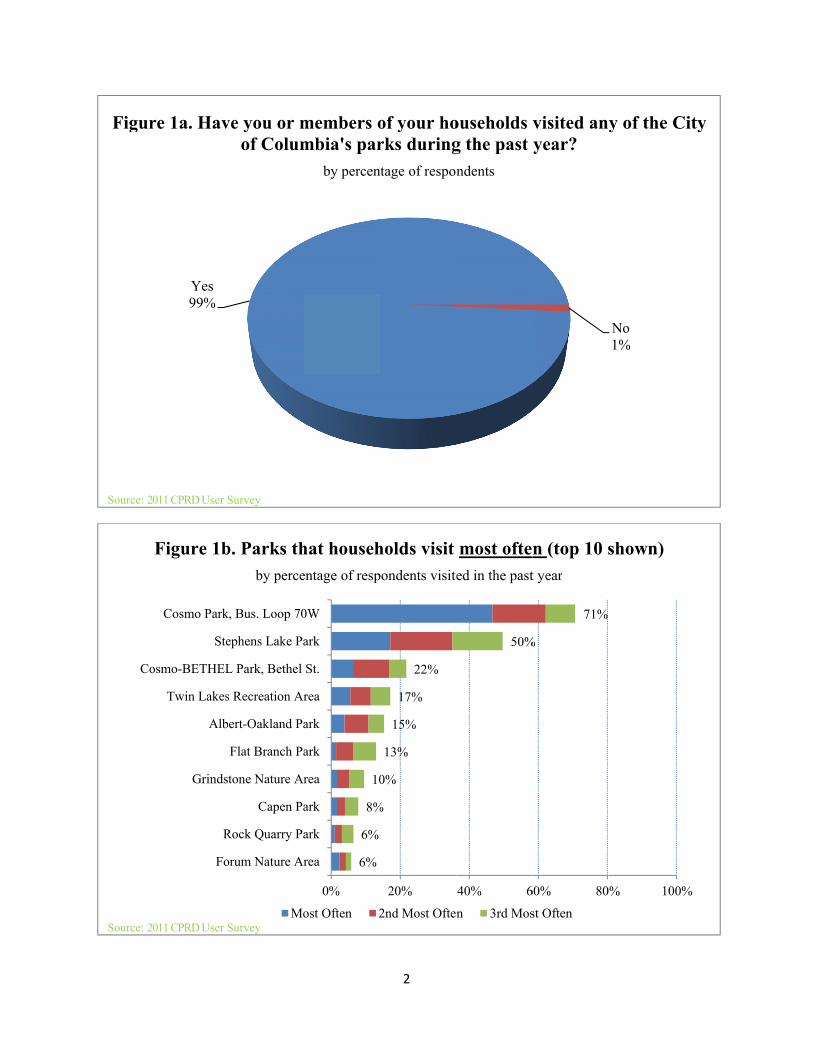
Yes99%
re 1a. Hav
2011 CPRD User S
Fo
R
Grinds
Alb
Twin Lakes
osmo-BETHEL
Ste
Cosmo Park
Figure 1b
2011 CPRD User S
ve you or mof Colum
Survey
orum Nature Ar
Rock Quarry Pa
Capen Pa
tone Nature Ar
Flat Branch Pa
ert-Oakland Pa
s Recreation Ar
L Park, Bethel
ephens Lake Pa
k, Bus. Loop 70
Mo
b. Parks thby perce
Survey
members ombia's par
by percen
6%
6%
8%
10
0%
rea
ark
ark
rea
ark
ark
rea
St.
ark
0W
ost Often 2
hat househentage of resp
2
of your horks duringtage of respon
%
0%
13%
15%
17%
22%
20%
2nd Most Often
holds visit pondents visite
ouseholds g the past ndents
50%
40% 6
n 3rd Mos
most ofteed in the past
visited anyear?
%
71%
60% 80
st Often
n (top 10 st year
No1%
y of the C
0% 100%
shown)
City
%
Source: 2
GrindstTw
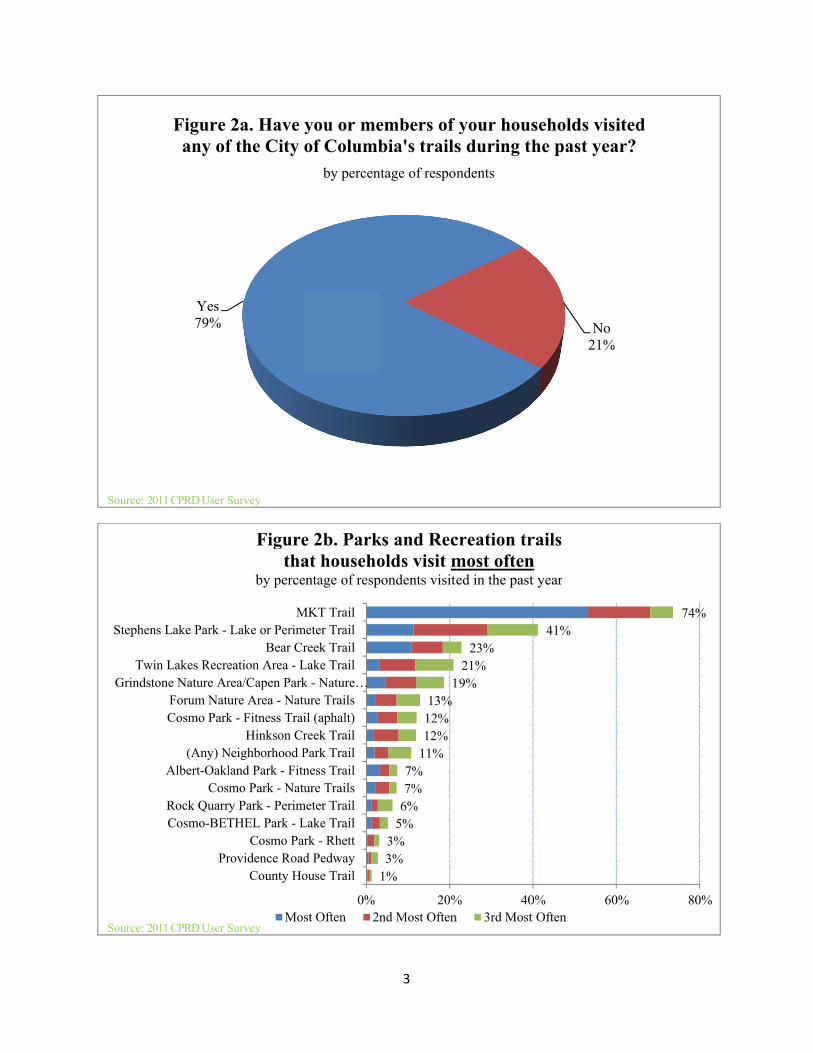
Stephen
Source: 2
Yes79%
Figureany of
2011 CPRD User S
Pr
Cosmo-BETRock Quarr
CosAlbert-Oakl
(Any) N
Cosmo ParkForum Natu
tone Nature Arwin Lakes Recre
ns Lake Park -
2011 CPRD User S
2a. Have f the City
Survey
County Horovidence Road
Cosmo ParTHEL Park - Lry Park - Perimsmo Park - Natuland Park - Fitn
Neighborhood PHinkson Cr
k - Fitness Traiure Area - Naturea/Capen Parkeation Area - L
Bear CrLake or Perim
M
Mos
Figuretha
by perce
Survey
you or meof Columb
by percen
0%
ouse Traild Pedwayrk - Rhett
Lake Trailmeter Trail
ure Trailsness TrailPark Trailreek Trailil (aphalt)ure Trailsk - Nature…Lake Trailreek Trail
meter TrailMKT Trail
st Often 2n
e 2b. Parkat househoentage of resp
3
embers of bia's trails
ntage of respon
1%3%3%
5%6%7%7%
11%12%12%13%
1
20%nd Most Often
ks and Recolds visit mpondents visite
your houss during thndents
19%21%
23%
% 40n 3rd Most
creation trmost oftened in the past
No21%
seholds vihe past ye
41%
0% 6t Often
railsnt year
o%
sitedear?
7
60%
74%
80%

Fa
Po
Don
Source: 2
A
H
Ac
Source: 2
air, 7%
oor, 1%
n't know, 2%
Figure 3of all t
2011 CPRD User S
Archery range (AmeOutdoor bas
Football/l
Armory Mountain
Historic home/farm (Boating and
Skateboard/rollerStephens Lake Ac
Off-leash areStephens Lak
Softball/bSprayground
NSwi
tivity & Recreation C
P
Walking, hiking, and
Figurethat
2011 CPRD User S
3. Overallthe City of
Survey
0.42
NoneOther
rican Legion)ketball courtsacrosse fields
Disc golfSports Centern biking trails(Nifong Park)d fishing areasTennis courtsGolf coursesSoccer fields
r hockey parkctivity Centereas/dog parkse swim beach
baseball fieldsds/spray parksNatural Areasimming poolsCenter (ARC)
PlaygroundsPicnic shelters
Nature trailsd biking trails
0.0%
e 4a. City ot househol
Survey
, how wouf Columbi
by percen
4%2%2.3%
7%9%9%10%
12%12%13%15%
16%
10.0% 20.0
of Columblds have v
by percen
4
Excellent,
uld you rata's parks/tage of respon
%21%22%
25%26%
30%32%
3
0% 30.0% 4
bia parks avisited over
tage of respon
, 35%
te the phy/trails youndents
35%36%37%
40%
40.0% 50.0%
and recrear the past ndents
ysical cond have visit
55%56%57%
60.0% 70.0
ation facil12 month
Good, 55%
ditionted?
81%
% 80.0%
litieshs
%

5
2%1%1%
3%3%3%
4%5%5%5%
8%9%
10%14%14%
15%17%
18%19%
21%24%
25%29%
33%69%
0% 10% 20% 30% 40% 50% 60% 70%
OtherArchery range (American Legion)
Outdoor basketball courtsHistoric home/farm (Nifong Park)
Armory Sports CenterBoating and fishing areas
Disc golfMountain biking trails
Tennis courtsFootball/lacrosse fields
Stephens Lake Activity CenterStephens Lake swim beach
Golf courses (LA Nickell or Lake of the Woods)Spraygrounds/spray parks
Soccer fieldsOff-leash areas/dog parks
Natural areas (Grindstone, Forum, Garth)Skateboard/roller hockey park
Swimming poolsPicnic shelters
Activity and Recreation Center (ARC)Softball/baseball fields
Nature trailsPlaygrounds
Walking, hiking, and biking trails
Most Often 2nd Most Often 3rd Most Often 4th Most Often
Figure 4b. Parks and recreation facilities that households visit most oftenby percentage of respondents
Source: 2011 CPRD User Survey
30%9%
1%1%1%1%
2%3%3%
5%5%5%
6%6%6%
8%8%
12%12%13%
24%
0% 5% 10% 15% 20% 25% 30% 35%
NoneOther
City does not have quality programsAccessibility/disability issue at facilities
Poor customer service by staffHealth issues
No access to public transportationI do not know where the City facilities are located
Rules are too restrictiveNo interest in programs offered
Lack of trails/sidewalks to parksFacilities are not well maintained
No one to go withNot enough shade/trees
Members of my household use facilities from other…Facilities do not have the right equipment
Hours of operation are not convenientParks do not contain the facilities we need
Fees are too expensivePersonal security/safety
Location of City facilities is not close to my home
Figure 5. Reasons that prevent households fromusing Columbia's parks and recreation facilities
by percentage of respondents
Source: 2011 CPRD User Survey

Source: 2
Do
Comm
Source: 2
N29
Figurespace
2011 CPRD User S
not use recre
Youth-atSe
Adaptivemunity Recre
Life EnricOutdoor/na
GFitness/ex
Youth an
Figure 7ahous
b
2011 CPRD User S
No9%
e 6. Do yoes areas w
Survey
ation programOthe
t-risk programenior programe programmination programchment classeature educatio
VolunteerisGolf programxercise classe
AquaticSpecial Evennd adult sport
. City of Cseholds haby percentage
Survey
u feel therithin walk
by percen
3%1%2%
4%6
msermsmsngmsesonm
msescsntsts
0%
Columbia pave particie of responden
6
re are suffking distanntage of respon
%6%
8%10%10%
11%16
10% 2
parks andipated ovents (multiple c
Not8
Yes62%
ficient parnce of youndents
22%
6%
20% 30
d recreatioer the pastchoices could
t sure8%
rks and grur residenc
31%34%
0% 40
on programt 12 monthd be made)
reence?
47%
% 50%
ms that hs
%
%

7
9%1%2%
4%7%8%9%
11%11%
18%30%
34%47%
0% 10% 20% 30% 40% 50%
OtherYouth at-risk programs
Senior programsAdaptive programming
Life Enrichment classesCommunity Recreation programs
VolunteerismGolf programs
Outdoor/nature educationFitness/exercise classes
AquaticsSpecial events
Youth and adult sports
Most Often 2nd Most Often 3rd Most Often 4th Most Often
Figure 7b. Parks and recreation programs that households visit most oftenby percentage of respondents
Source: 2011 CPRD User Survey
14%3%3%
4%5%5%5%
6%6%
8%8%8%9%
10%10%
11%11%
12%12%
13%14%14%
15%18%18%
19%20%
21%23%
25%26%
30%39%
0% 5% 10% 15% 20% 25% 30% 35% 40% 45%
NoneFacilities for the disabled
Equestrian trailsFootball/lacrosse fields
Outdoor tennis courtsArchery ranges/deer management areas
Outdoor basketball courtsGolf courses
Indoor shelters/meeting spaceIndoor basketball/volleyball courts
Nature interpretive centerMountain bike trails
Outdoor running/walking tracksPark shelters and picnic areas
Indoor fitness and exercise facilitiesBaseball and softball fields
Bird/wildlife watching areasPlayground equipment and play areas
Spraygrounds/spray parksOutdoor pool and aquatic areas
Indoor swimming pools/leisure poolsCommunity gardens
Nature trailsSledding hills and cross country skiing
Skateboard parks/bike parksOutdoor amphitheaters/theaters
Soccer fieldsOff-leash dog parks
Walking and biking trailsBoating and fishing areas
Large community parksIce skating facilities
Small (2-10 acres) neighborhood parks
Figure 8. Need for more parks and recreation facilitiesby percentage of respondents
Source: 2011 CPRD User Survey

8
2%2%
3%3%3%
3%4%
5%5%
5%6%
6%7%
7%7%
7%8%
8%8%
10%10%10%
11%12%
13%13%
14%16%
18%20%
22%24%
0% 5% 10% 15% 20% 25%
Equestrian trailsFacilities for the disabledOutdoor basketball courts
Outdoor tennis courtsIndoor shelters/meeting space
Archery ranges/deer management areasFootball/lacrosse fields
Outdoor amphitheaters/theatersGolf courses
Mountain bike trailsOutdoor running/walking tracks
Indoor basketball/volleyball courtsNature interpretive center
Bird/wildlife watching areasSoccer fields
Park shelters and picnic areasSpraygrounds/spray parksBoating and fishing areas
Indoor fitness and exercise facilitiesLarge community parks
Community gardensPlayground equipment and play areas
Baseball and softball fieldsIndoor swimming pools/leisure pools
Sledding hills and cross country skiingOutdoor pool and aquatic areas
Nature trailsOff-leash dog parks
Skateboard parks/bike parksSmall (2-10 acres) neighborhood parks
Ice skating facilitiesWalking and biking trails
1st Choice 2nd Choice 3rd Choice 4th Choice
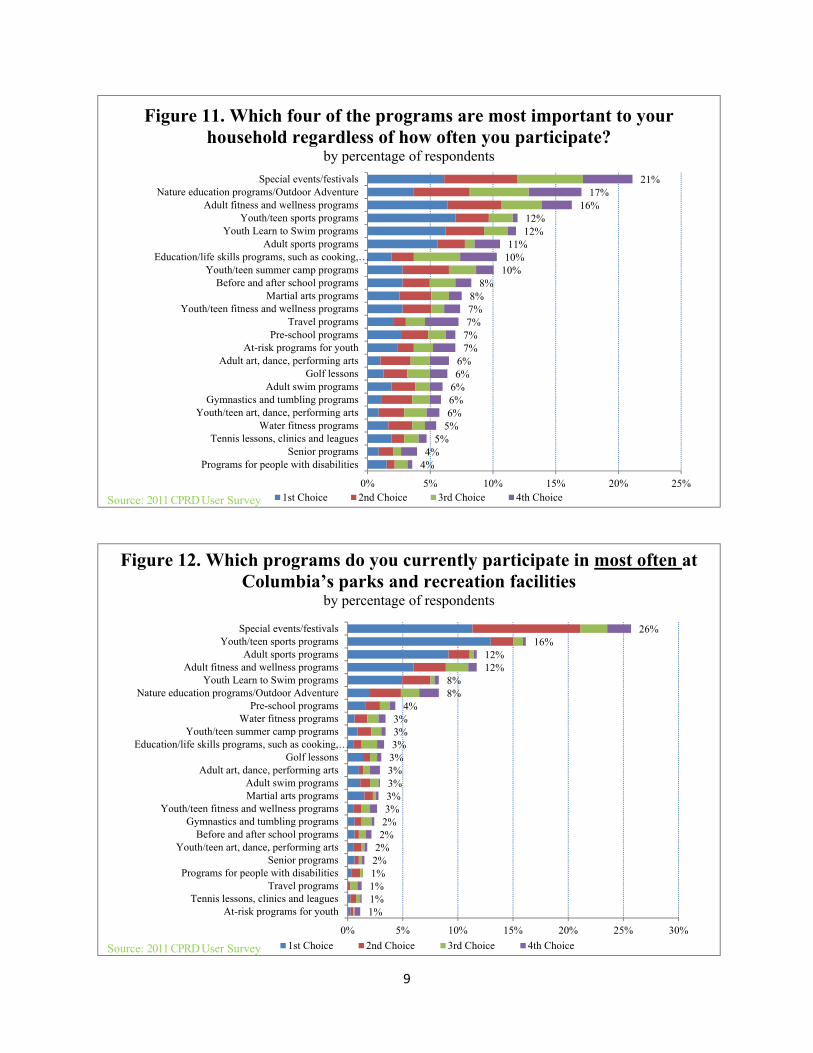
Figure 9. Which four of the facilities are most important to your household regardless of how often you utilize it?
by percentage of respondents
Source: 2011 CPRD User Survey
42%3%3%
5%6%6%7%7%8%8%8%8%8%9%9%10%10%10%11%
12%12%
16%17%17%
NonePrograms for people with disabilities
Senior programsAt-risk programs for youth
Adult swim programsGolf lessons
Tennis lessons, clinics and leaguesWater fitness programs
Pre-school programsYouth/teen art, dance, performing arts
Travel programsMartial art programs
Gymnastics and tumbling programsAdult art, dance, performing arts
Youth/teen fitness and wellness programsBefore and after school programs
Youth /teen summer camp programsAdult sports programs
Youth Learn to Swim programsYouth/teen sports programs
Education/life skills programs, such as cooking,…Nature education programs/Outdoor Adventure
Adult fitness and wellness programsSpecial events/festivals
0% 10% 20% 30% 40%
Figure 10. Households that have a need for more recreation programsby percentage of respondents (multiple choices could be made)
Source: 2011 CPRD User Survey
9
4%4%
5%5%6%6%6%6%6%
7%7%7%7%8%
8%10%10%11%
12%12%
16%17%
21%
0% 5% 10% 15% 20% 25%
Programs for people with disabilitiesSenior programs
Tennis lessons, clinics and leaguesWater fitness programs
Youth/teen art, dance, performing artsGymnastics and tumbling programs
Adult swim programsGolf lessons
Adult art, dance, performing artsAt-risk programs for youth
Pre-school programsTravel programs
Youth/teen fitness and wellness programsMartial arts programs
Before and after school programsYouth/teen summer camp programs
Education/life skills programs, such as cooking,…Adult sports programs
Youth Learn to Swim programsYouth/teen sports programs
Adult fitness and wellness programsNature education programs/Outdoor Adventure
Special events/festivals
1st Choice 2nd Choice 3rd Choice 4th Choice
Figure 11. Which four of the programs are most important to your household regardless of how often you participate?
by percentage of respondents
Source: 2011 CPRD User Survey
1%1%1%1%2%2%2%2%3%3%3%3%3%3%3%3%
4%8%8%
12%12%
16%26%
0% 5% 10% 15% 20% 25% 30%
At-risk programs for youthTennis lessons, clinics and leagues
Travel programsPrograms for people with disabilities
Senior programsYouth/teen art, dance, performing arts
Before and after school programsGymnastics and tumbling programs
Youth/teen fitness and wellness programsMartial arts programsAdult swim programs
Adult art, dance, performing artsGolf lessons
Education/life skills programs, such as cooking,…Youth/teen summer camp programs
Water fitness programsPre-school programs
Nature education programs/Outdoor AdventureYouth Learn to Swim programs
Adult fitness and wellness programsAdult sports programs
Youth/teen sports programsSpecial events/festivals
1st Choice 2nd Choice 3rd Choice 4th Choice
Figure 12. Which programs do you currently participate in most often at Columbia’s parks and recreation facilities
by percentage of respondents
Source: 2011 CPRD User Survey

10
1%1%
3%5%6%
13%14%14%
20%23%24%
28%30%
49%61%
63%
Online school district "Virtual Backpack"Twitter
OtherInfo displayed at P&R facilityConversations with P&R staff
TelevisionFacebook
Flyers/Newsletter in mailSchool flyers/newsletters
Repeat customerRadio
Newspaper articles/advertisementsE-mail bulletins or E-newsletters
From friends and neighbors"Leisure Times" Activity Guide
Parks and Recreation Website
0% 10% 20% 30% 40% 50% 60% 70%
Figure 13. Ways respondents learn about City of Columbia Parks and Recreation Department programs and activities
by percentage of respondents
Source: 2011 CPRD User Survey
8%10%
0.4%1%
2%3%3%
6%6%
7%7%
9%9%
11%15%
NoneOther
KWWC 90.5 FMKJLU 88.9 FM
KCOU 88.1 FMKTGR 1580 AM
KSSZ 93.9 FMKPLA 101.5 FMKCMQ 96.7 FMKOPN 89.5 FM
KFRU 1400 AMKBXR 102.3 FMKOQL 106.1 FM
KCLR 99.3 FMKBIA 91.3 FM
0% 5% 10% 15% 20%
Figure 14. What one radio station do you listen to the most?by percentage of respondents
Source: 2011 CPRD User Survey

DevelD
Further dev
Develop
Acquire laA
AcquAcquire laUpgrade/im
Fix up/
Source: 2
SoS
Figu
Source: 2
Acquire
Dop new outdoor Develop a permavelop Gans Cree
DeveloDevelop
DevelopDevelop new
new hard surfacDeve
and for developinAcquire land for uire land to presnd for preservatimprove existing /repair older park
V
F
2011 CPRD User S
omewhat Satisfied
37%
ure 16. Lefrom
2011 CPRD User S
e and develop a nDevelop e
Develop new off-swimming poolanent indoor ice
ek Recreation Arop new indoor rep an outdoor ice
p new indoor muw youth and aduce walking and belop new nature/ng athletic fieldsdeveloping neig
serve open spaceion and develop pools/sports fie
k facilities/shelte
Very Supportive
Figure 15.to impro
Survey
Ne
vel of satim the Colu
Survey
new golf courseequestrian trails-leash dog parksl/aquatic facility-skating facilityrea/Philips Lakeecreation center-skating facility
ulti-sports centerult athletic fieldsbiking trails that/education trailss & recreational
ghborhood parkse and protect the
walking/hikinglds/golf coursesers/playgrounds
Somewhat
Indicate sve the par
by percent
eutral8%
sfaction wumbia Park
by percen
11
10%9%
23%23%
35%28%30%30%29%
27%43
34%41%42%
4
17%28
…
…
…
……
0% 10% 20%Supportive
support forks and retage of respon
Very Dissa1%
with the ovks and Retage of respon
3%
%%48%52%
56%73%
%8%
36%40%
337353634
% 30% 40%Not Supportive
or variousecreation sndents
atisfied
verall valuecreation Dndents
%30%
7%5%6%9%
45%36%
45%43%45%
39%36%
3
65%52%
12
50% 60% 70%e Not Sure
s actionssystem
SomewhatDissatisfied
3%
Very Satis51%
ue househoDepartme
%%33%
24%
32%28%27%
2%28%26%23%
21%16%15%
12%9%8%9%8%
8%11%109%9%
23%78%9%8%564444
% 80% 90%
t d
sfied
olds receivnt
%
1%
%%%%%
7%%%%5%6%4%4%4%4%3%
2%
100%
ve

Figu
Source: 2
Pr
Develop
F
Source: 2
High Priority42%
ure 17. Howm
2011 CPRD User S
rovide webcam
Develop o
Provide wire
Develop mob
p online reserv
Very Supp
Figure 18.tec
2011 CPRD User S
y
w high of maintainin
Survey
ms at various p
online golf tee
Dev
eless internet a
ile application
vation system
portive
Indicate lchnology w
Survey
a priorityng the con
by percen
parks and faci
e time reserva
velop online vi
access in the p
ns for smartph
for picnic she
Somewhat S
level of suwithin the
by percen
12
y do you fendition of entage of respon
16%
18%
14%
27
lities
tions
ideos
parks
hones
elters
0%Supportive
upport for parks and
ntage of respon
Mediu
Very Hig46
eel city offiexisting fandents
7%
42%
50%
27%
31%
43%
3
20% 40%Not Supp
various ad recreationdents
Very Low Pr0%
um Priority12%
gh Priority6%
ficials shouacilities?
35%
35%
40
42%
31%
27
% 60%portive
actions to ion system
riority
Low Priority0.4%
uld place o
%
7%
34%
15%
6%
14%
20%
16%
4
8%
80% 10Not Sure
improve m
y
on
4%
%
4%
00%

Grpa
Figuho
Source: 2
Source: 2
eater use of puarks and facilit
31%
ure 19. Duow much y
2011 CPRD User S
Female63%
2011 CPRD User S
ublic ties
ring the pyou make u
Survey
Figu
Survey
past 12 mouse of pub
recreatby percen
ure 20a. Deby percen
13
onths, haveblic parks,tion facilittage of respon
emographntage of respon
Spa
e you and , playgrouties?ndents
did not a2%
hics: Gendndents
Less uparks a
Same use of puakrs and facilit
in the past62%
your famunds, pools
answer%
der
use of public and facilities
7%
ublic ies as
ily changes or other
Male35%
ed

Nati
Source: 2
35-64
Source: 2
American I
ive Hawaiian o
2011 CPRD User S
4 years, 38%
Figure 20
2011 CPRD User S
ndian or Alask
or other Pacific
Hispanic o
Figure 2
Survey
c. Demogr
Survey
2
0%
1%
1
1
2
2
Other
ka Native
Islander
Mixed
Asian
or Latino
Black
White
0%
20b. Demoby percen
65
raphics: Aby percent
14
2%
%
%
%
1%
2%
2%
10% 20% 3
ographics: tage of respon
5+ years, 2%
Ages of peotage of respon
30% 40% 50
Race/Ethndents
20-34
ople in houndents
% 60% 70%
hnicity
19 an
4 years, 21%
usehold in
9
% 80% 90% 1
nd younger, 39%
n group
2%
100%

0%
2%
4%
6%
8%
10%
12%
14%
16%
18%
20%
Source: 2
Source: 2
9%
1
Under 5years
5-9
Figur
2011 CPRD User S
Yes75%
Fig
2011 CPRD User S
1% 11%
years 10-14years
re 20d. De
Survey
gure 20e. D
Survey
8%
4 15-19years
mographiby percent
Demograpby percent
15
6%
15
20-24years
25-yea
ics: Ages otage of respon
hics: Livetage of respon
%
18%
-34ars
35-44years
of people indents
e Within Cndents
13%
44-54years
5y
in househo
did no
Do
No23%
City Limits
7%
2%
55-64years
65+year
old
ot answer1%
on't Know1%
o%
s
%
+rs

6
Source: 2
6520227%
Figur
2011 CPRD User S
6520118%
re 20f. Dem
Survey
1
mographicby percen
16
cs: What itage of respon
O1
is your homndents
Other10%
6520345%
me zip codde?