Embed Size (px)
Citation preview

| 1 |
29th July 2011
2011 First Half Results Presentation
| 2 | | 2 |
Advertising & Broadcasting

| 3 |
Total Market*
Mediaset
Total Market excluding Mediaset
Rai
Newspapers
Magazines
Radio
Internet**
5M2011 vs. 5M2010
-3.1%
-1.9%
-3.9%
-7.4%
-4.0%
-1.4%
-8.4%
+14.8%
ITALY 2011 5M | Advertising market trend
Source: Nielsen (January-May)* Excluding Cards, Direct Mail* * Excluding keywords, search advertising, FCP source

| 4 |
ITALY | TV Consumption trend (2003-2011)
Source: Auditel (1 January – 30 June of each year)
Average Daily minutes
230235
230 233228 230
241
254
265
251243
238
254249254248
220215
2003 2004 2005 2006 2007 2008 2009 2010 2011
Individuals
15-64 years

| 5 |
24 Hours
38.8%
33.9%
38.2%
38.3%
35.0%
31.2%
35.3%
34.9%
MEDIASET 2011 1H | Commercial target Audience Share
2010 2011
(15-64 yrs, January-June)
Source: Auditel
Prime Time

| 6 |
MEDIASET 2011 1H | Multichannel Audience Share24 Hours – Individuals
MS DTT (Free+Pay)
RAI DTT*
SKY Channels
FOX Channels
Disney
Discovery
3.1%
2.7%
3.1%
1.7%
0.9%
0.4%
5.5%
4.4%
3.6%
1.6%
0.7%
1.1%
2010 2011
Source: Company elaborations on Auditel data

| 7 |
35.0%
3.9%
38.9%
2.5%
41.4%
31.2%
4.9%
36.1%
33.0%
3.5%
36.5%
2.0%
38.5%
36.4%
4.4%
40.9%
Generalist (C5+I1+R4)
Multichannel FTA (4)
Subtotal
Pay TV Channels
Total
Generalist (R1+R2+R3)
Multichannel FTA (11)
Total
Individuals 15-64 yrs
Source: Auditel (1 January – 30 June 2011); Pay TV Channels, Company elaborations on Auditel data
24 hoursMEDIASET 2011 1H | Audience Share
| 8 |
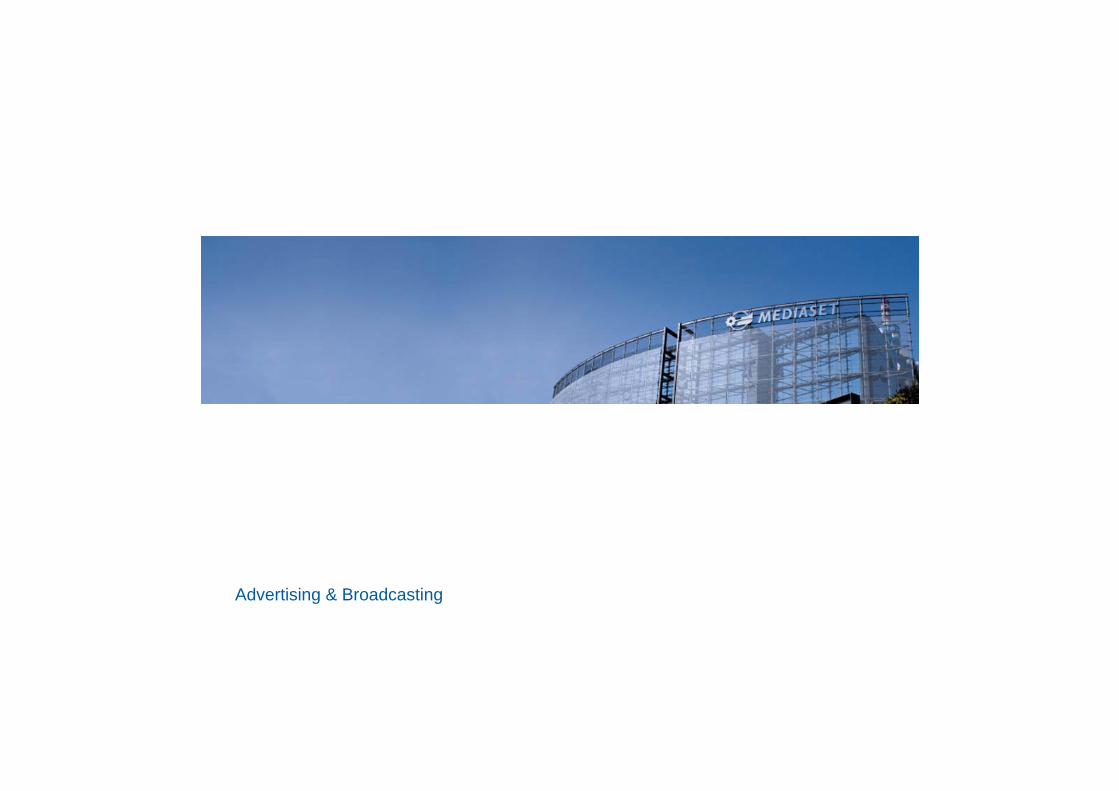
1H 2010 1H 2011
1,454.4 1,407.6
FTA Core channels +FTA multichannelEuro ml
MEDIASET 2011 1H | FTA Advertising revenues
-3.2%

| 9 |
1H 2010 1H 2011
1,487.5 1,454.8
FTA + Pay TVEuro ml
MEDIASET 2011 1H | Total TV Advertising revenues
-2.2%

| 10 |
MEDIASET 2011 1H | Advertising Breakdown by Sector
Note: including FTA core + FTA multichannel + Web
-10.1%
-8.6%
+2.2%
-24.5%
-11.3%
FOOD
BEVERAGES
PERSONAL CARE
HOUSEKEEPING
TOILETRIES
1H 10 vs. 1H 09 1H 11 vs. 1H 10
+18.3%
-0.8%
+12.1%
+21.6%
+6.5%
FINANCE/INSURANCE -15.4% -15.3%
+12.9% -10.8%GROCERY

| 11 |
MEDIASET 2011 1H | Advertising Breakdown by Sector
TELECOM
AUTOMOTIVE
PHARMACEUTICAL
+0.9%
+4.4%
-1.8%
1H 10 vs. 1H 09 1H 11 vs. 1H 10
-1.8%
+1.8%
+1.9%
Note: including FTA core + FTA multichannel + Web

| 12 |
RETAIL
MEDIA/PUBLISHING
BUSINESS & INDUSTRIAL
LEISURE
MEDIASET 2011 1H | Advertising Breakdown by Sector
+31.7%
-20.2%
+1.4%
+5.7%
1H 10 vs. 1H 09 1H 11 vs. 1H 10
+10.7%
+9.3%
+48.5%
+64.0%
Note: including FTA core + FTA multichannel + Web
| 13 |
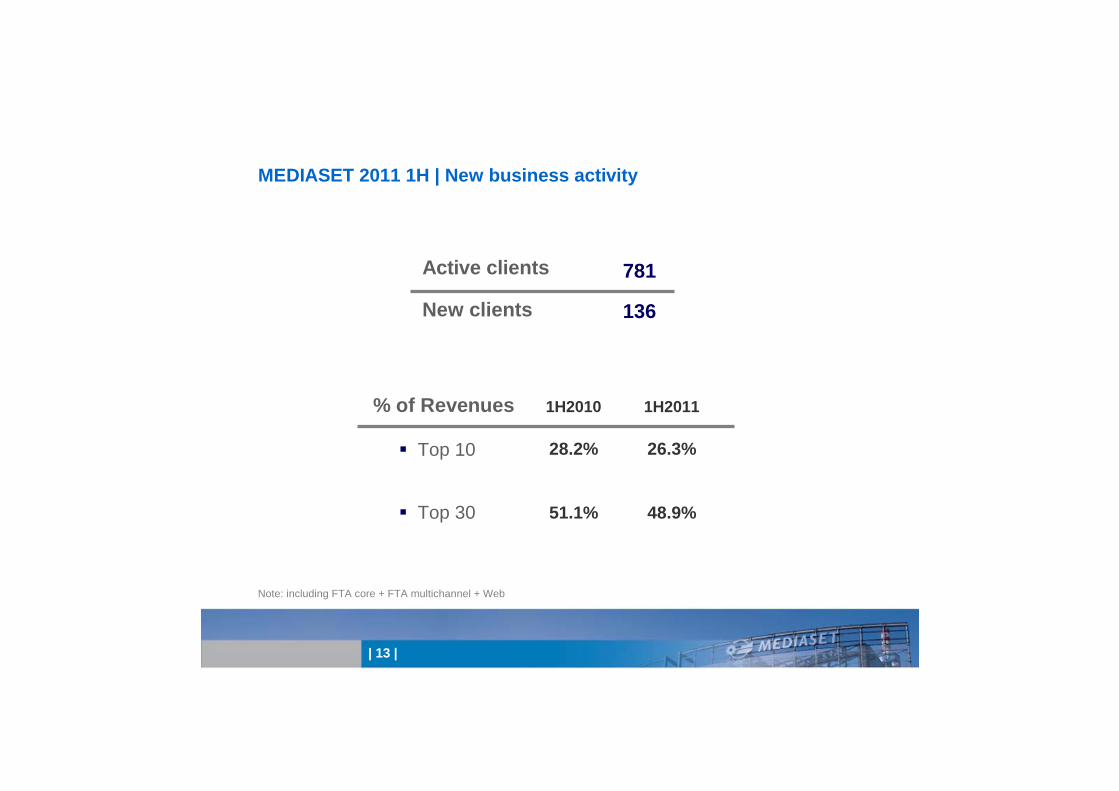
MEDIASET 2011 1H | New business activity
Note: including FTA core + FTA multichannel + Web
781
136
Active clients
New clients
1H2010
28.2%
51.1%
1H2011
26.3%
48.9%
Top 10
Top 30
% of Revenues

| 14 |
Financials

| 15 |
MEDIASET GROUP 2011 1H | P&L Highlights
Net Consolidated Revenues
EBITDA
EBIT
NET PROFIT (Reported)
NET PROFIT (Pro-forma)
Group Net Financial Position
(Euro ml.) 1H 2010
2,277.8
1,084.2
485.2
241.6
237.6*
(1,476.3)
1H 2011
2,253.4
967.0
341.5
164.4
164.4
(1,805.5)
* Pro-forma P&L consolidated accounts under IFRS of Telecinco’s Group and Sogecuatro’s Group; Mediaset stake in Telecinco 42.2%

| 16 |
MEDIASET ITALIAN BUSINESS 2011 1H | P&L Results
Net Consolidated RevenuesPersonnel Costs
Other Operating Costs
EBITDARights Amortisation
Other Amortisation & Depreciation
Operating ProfitFinancial Income (Losses)
Associates
Pre-Tax ProfitTaxes
NET PROFIT
(Euro ml.) 1H 2011
1,712.9(236.6)
(732.1)
744.2(432.4)
(72.8)
239.1(19.4)
(6.5)
213.2(84.6)
128.4
1H 2010
1,817.2(228.0)
(728.3)
860.9(443.2)
(78.7)
339.0(12.7)
(2.1)
324.2(129.3)
191.5

| 17 |
FTA TV
Network Operator
Pay TV
Other Activities
Intra-company Eliminations
Adjustments
TOTAL
Total NetRevenues
1,243.4
106.0
343.8
145.2
(93.6)
(31.9)
1,712.9
OperatingProfit
246.0
(3.3)
(23.7)
7.2
-
13.0
239.1
(Euro ml.) Total Costs(including D&A)
(997.4)
(109.3)
(367.5)
(138.0)
93.6
45.0
(1,473.8)
MEDIASET ITALIAN BUSINESS 2011 1H | Operations Breakdown

| 18 |
(Euro ml.)
Total Net TV RevenuesFTA TV Advertising Revenues
o/w Multichannel Advertising Revenues
Commissions
Other TV Revenues
Net Intra-company Items
Total TV CostsPersonnel
TV Operating Costs
TV Rights Amortisations
Other D&A
Net Intra-company Items
FTA TV Operating Profit
1,279.51,454.4
11.8
(216.5)
39.8
1.8
(937.8)(189.6)
(404.2)
(276.0)
(26.2)
(41.7)
341.6
MEDIASET ITALIAN BUSINESS | FTA TV
1,243.41,407.6
49.6
(209.3)
27.5
17.7
(997.4)(197.4)
(447.2)
(285.3)
(24.5)
(43.0)
246.0
1H 2010 1H 2011

| 19 |
Total Net Revenues3rd Party Revenues
Other Revenues
Net intra-company Items
Total CostsPersonnel
Other Operating Costs
Other Amortisation & Depreciation
Network Operator Operating Profit
(Euro ml.)
106.026.2
4.1
75.7
(109.3)(19.5)
(55.6)
(34.2)
(3.3)
MEDIASET ITALIAN BUSINESS | Network Operator
98.725.5
3.0
70.3
(102.8)(18.9)
(52.4)
(31.5)
(4.1)
1H 2010 1H 2011

| 20 |
MEDIASET PREMIUM | Active Clients
4,429,000
4,219,000
31 March 2011 30 June 2011
1,904,000Subscribers
(Easy-pay clients)1,902,000

| 21 |
Total Net Pay TV Revenues
Pay TV Revenues
Advertising Revenues
Other Revenues
Commissions
Total Pay TV CostsPersonnel
Other Operating Costs
Rights Amortisations and Other D&A
Net intra-company items
Pay TV Operating Profit
(Euro ml.)
343.8
263.9
47.2
39.7
(7.0)
(367.5)(9.7)
(172.0)
(155.9)
(30.0)
(23.7)
MEDIASET ITALIAN BUSINESS | Pay TV
393.9
229.7
33.1
135.9
(4.8)
(402.7)(9.3)
(180.8)
(186.2)
(26.4)
(8.8)
1H 2010 1H 2011

| 22 |
173.043.9
55.5
11.3
40.9
21.0
0.4
(154.8)(10.1)
(91.9)
(48.4)
(4.5)
18.2
Total Net RevenuesMedusa 3° Party revenues
Medusa intra-company revenues
Multimedia
Mediashopping
Other Non-TV Revenues
Net Intra-company Items
Total CostsPersonnel
Other Operating Cost
Right Amortisations and Other D&A
Net Intra-company Items
Other Activities Operating Profit
(Euro ml.)
145.269.3
31.9
12.0
21.6
10.1
0.2
(138.0)(9.9)
(57.3)
(50.2)
(20.6)
7.2
MEDIASET ITALIAN BUSINESS | Other Activities1H 2010 1H 2011

| 23 |
329.6 263.6
65.5 59.7
19.4 15.9
46.737.5
(Euro ml.) TV rights and cinema
Pay TV rights
DTT
Technical & immaterial
Total Investments
MEDIASET ITALIAN BUSINESS 2011 1H | Investments
452.0 385.9
1H 20111H 2010

| 24 |
MEDIASET ITALIAN BUSINESS 2011 1H | Cash Flow Statement
Initial Net Financial Position (01/01)
Cash Flow from Core Activities
Cash Flow from Operations
Investments
Disinvestments
Change in Net Working Capital (CNWC)
Equity (Investments)/Disinvestment
Free Cash Flow
Cashed in Dividends
Change in Equity
Total Net Cash Flow
Final Net Financial Position (30/06)
Group Net Financial Position (30/06)
(Euro ml.) 1H 2010
(1,396.0)
241.7
729.0
(452.0)
1.4
(36.7)
2.1
243.8
(224.3)
-
19.5
(1,376.5)
(1,476.3)
1H 2011
(1,562.1)
180.0
654.0
(385.9)
0.5
(88.5)
(1.1)
178.9
(336.7)
-
(157.8)
(1,719.9)
(1,805.5)

| 25 |
Deal with DMT
| 26 |
• LEADING TOWER OPERATOR IN ITALY
• RELEVANT SYNERGIES AND EFFICIENCIES EXPECTED
• DEAL ACCRETIVE FROM YEAR 1 (2012)
DEAL WITH DMT | HIGHLIGHTS

| 27 |
• The Transaction will create a nationwide infrastructure for Telecommunication and
Media companies
• Relevant strategic positioning with significant scale and scope
– National breadth and extensive local presence with approx. 2,300
property/available sites (approx. 3,000 sites under management)
– Compelling array of communication services
• Hosting
• Maintenance
• Network Management
DEAL WITH DMT | STRATEGIC RATIONALE
A Full Service Operationg Model with a Premier Nationwide Network

| 28 |
STRUCTURE• All shares combination• Ownership and Management:
– Shareholding structure post Transaction: 65.67% Mediaset Group (“EI”) and 34.32% DMT Shareholders
– Experienced Management Team• DMT System and all the winding-up companies of DMT Group, not related to EIT, to be disposed
before the closing of the TransactionVALUATION• Combined Transaction value of approx. €1.0bn with an Equity Value of approx. €800m• Leverage post Transaction envisaged of approx. 3x EBITDA Combined 2011• Expected sustainable dividend policyTIMING• Expected closing at December 2011, subject to approvals of:
– Minority shareholders of DMT, according to whitewash mechanism provided by art. 49, comma 1, lett. g) of the Issuer Regulations and, hence, in regime of Tender Offer exemption (art. 106 TUF)
– Antitrust
DEAL WITH DMT | STRUCTURE
| 29 |
MEDIASET SPANISH BUSINESS | Back up Slides

| 30 |
MEDIASET ESPAÑA 2011 1H | P&L Results
Net Consolidated Revenues
Personnel Costs
Other Operating Costs
TV rights amortisation
Non recurring costs
EBITDA
Amortisation & Depreciation
EBIT
Financial Income (Losses)
Associates
Pre-Tax Profit
Taxes
NET PROFIT Reported
NET PROFIT Adjusted*
(Euro ml.)
* Net profit adjusted excludes all non cash item’s impact like PPA amortization (both on Sogecuatro and Endemol)** Pro-forma P&L consolidated accounts under IFRS of Telecinco’s Group and Sogecuatro’s Group
1H 2011
461.0
(39.0)
(206.8)
(72.3)
(8.1)
151.0
(4.8)
146.3
4.9
(20.5)
130.6
(28.1)
107.4
114.4
1H 2010 1H 2010**
631.8
(56.1)
(331.2)
(114.7)
(8.1)
137.9
(5.4)
132.5
4.8
(20.5)
116.8
(23.9)
97.7
104.7
540.9
(54.2)
(251.3)
(111.4)
(12.7)
111.3
(8.9)
102.4
2.5
(1.6)
103.3
(18.1)
85.1
89.1
| 31 |
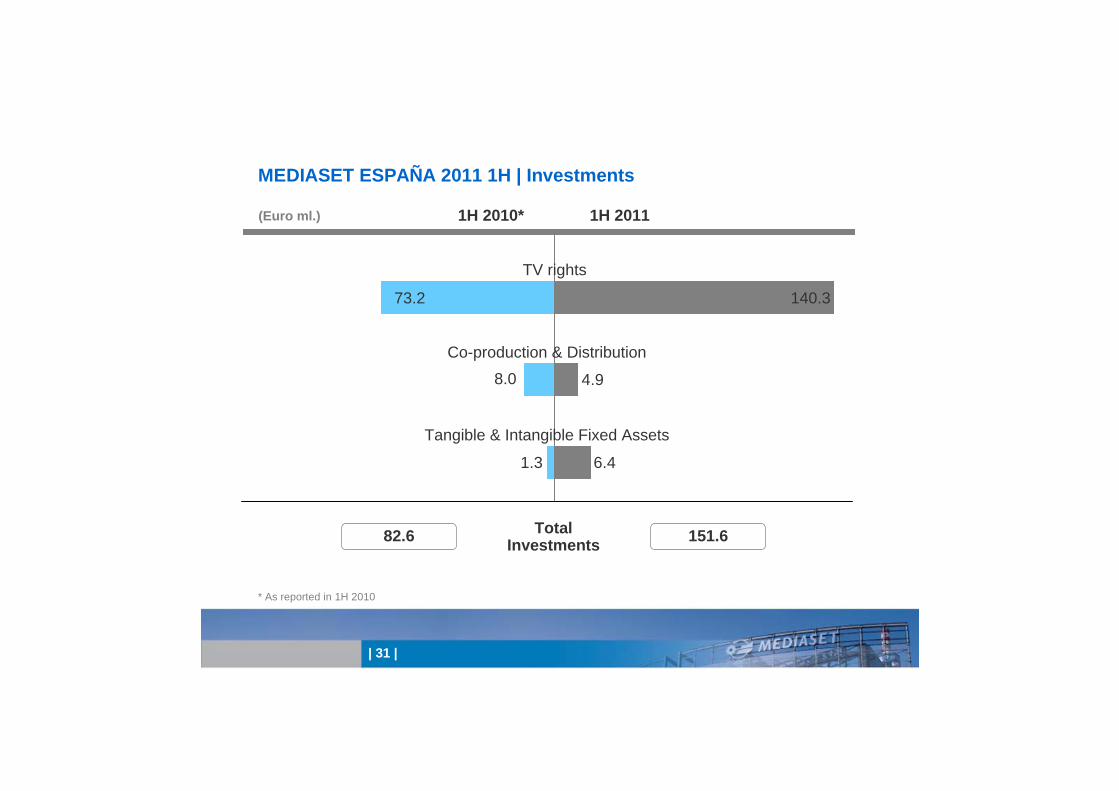
1H 20111H 2010*
73.2 140.3
4.9
1.3
TV rights
Co-production & Distribution
Tangible & Intangible Fixed Assets
Total Investments
MEDIASET ESPAÑA 2011 1H | Investments
82.6 151.6
(Euro ml.)
6.4
* As reported in 1H 2010
8.0

| 32 |
Initial Net Financial Position (01/01)
Free Cash Flow
Cash Flow from Operations
Investments
Change in Net Working Capital (CNWC)
Change in Equity
Equity (Investments)/Disinvest.
Dividends
Treasury Shares
Total Net Cash Flow
Final Net Financial Position (30/06)
(Euro ml.)
MEDIASET ESPAÑA 2011 1H | Cash Flow Statement
1H 2011
(156.0)
130.6
199.4
(82.6)
13.8
1.0
(27.9)
(47.4)
-
56.3
(99.8)
1H 2010*
(28.0)
60.4
212.3
(151.6)
(0.2)
0.4
19.9
(138.3)
-
(57.6)
(85.6)
* As reported in 1H 2010

| 33 |
Forward-looking StatementsStatements contained in this document, particularly the ones regarding any Mediaset Group possible or assumed future performance, are or may be forward looking statements and in thisrespect they involve some risks and uncertainties.
Mediaset Group actual results and developments may differ materially from the onesexpressed or implied by the above statements depending on a variety of factors.
Any reference to past performance of Mediaset Group shall not be taken as an indication of future performance.
This announcement does not constitute an offer to sell or the solicitation of an offer to buy the securities discussed herein.
The executive responsible for the preparation of the Mediaset S.p.A. accounts, Luca Marconcini, declares that, as per para. 2 art. 154-bis, of the “Testo Unico della Finanza”, that the accounting information contained in this document corresponds to that contained in the company’s books.
Investor Relations Department:
Tel: +39 02 2514.7008Fax: +39 02 2514.6719Email: [email protected]: www.mediaset.it/investor/
![CMS490 INSTALLATION INSTRUCTIONS · Installation Instructions CMS490 3 DIMENSIONS LEGEND 34.9 1.38 22.4 0.88 88.9 3.50 0.88 34.9 1.38 88.9 3.50 DIMENSIONS: [MILLIMETERS] INCHES Tighten](https://img.dokumen.tips/doc/110x75/5f4dea82e142fe03b9093a55/cms490-installation-installation-instructions-cms490-3-dimensions-legend-349-138.jpg)