Embed Size (px)
Citation preview
Remedial Action Contract for Remedial Response, Enforcement Oversight, and Non-Time Cr itical
Removal Activities at Sites of Release or Threatened Release of Hazardous Substances in EPA Region VIII
U.S. EPA Contract No. EP-W-05-049
Sampling and Analysis Plan Supplemental Activity-based Sampling Libby Asbestos Site, Operable Unit 4
Work Assignment No.: 229-RICO-08BC Libby Asbestos Superfund Project,
OU4 Remedial Investigation/Feasibility Study EPA Work Assignment Manager : Victor Ketellapper
CDM Project Manager : Dee War ren
June 18, 2010
Prepared for : U.S. Environmental Protection Agency
Region VIII 1595 Wynkoop Street
Denver , Colorado 80202
Prepared by: CDM Federal Programs Corporation
555 17th Street, Suite 1100 Denver , Colorado 80202
With Technical Assistance from: SRC, Inc.
999 18th Street, Suite 1975 Denver , Colorado 80202

PAGE INTENTIONALLY LEFT BLANK

PAGE INTENTIONALLY LEFT BLANK
Distribution List Victor Ketellapper (1 copy) U.S. Environmental Protection Agency, Region 8 1595 Wynkoop Street; 8EPR-SR Denver, Colorado 80202-1129 Nicole Bein (1 copy) U.S. Environmental Protection Agency, Region 8 1595 Wynkoop Street; 8EPR-SR Denver, Colorado 80202-1129 David L. Berry (1 electronic SAP) U.S. Environmental Protection Agency, Region 8 1595 Wynkoop Street; 8EPR-PS Denver, Colorado 80202-1129 EPA Information Center (5 copies) 108 East 9th Street Libby, Montana 59923 William Barrett (1 copy) U.S. Environmental Protection Agency National Risk Management Research Laboratory 26 West Martin Luther King Drive, MS-445 Cincinnati, Ohio 45268 Jonathan Thornburg (1 copy) RTI International 3040 Cornwallis Road Research Triangle Park, North Carolina 27709 Catherine LeCours (1 copy) Montana Department of Environmental Quality 1100 North Last Chance Gulch Helena, Montana 59601 Richard Sloan (1 copy) Montana Department of Environmental Quality 1100 North Last Chance Gulch Helena, Montana 59601 Doug Kent (1 copy) TechLaw, Inc. ESAT Region 8 16194 W 45th Drive Golden, Colorado 80403
Mike Noble (1 copy) Libby Area Technical Advisory Group 6669 Farm to Market Road Libby, Montana 59923 Bill Brattin (1 electronic SAP) SRC, Inc. 999 18th Street, Suite 1975 Denver, Colorado 80202 Naresh Batta (1 electronic SAP) Batta Environmental Associates, Inc. Delaware Industrial Park 6 Garfield Way Newark, Delaware 19713-5817 Robert DeMalo (1 electronic SAP) EMSL Analytical Inc. 107 Haddon Avenue Westmont, New Jersey 08108 Ron Mahoney (1 electronic SAP) EMSL Analytical Inc. 107 4th Street West Libby, Montana 59923 Kyeong Corbin (1 electronic SAP) Hygeia Laboratories Inc. 82 West Sierra Madre Boulevard Sierra Madre, California 91024 Michael Mount (1 electronic SAP) MAS 3945 Lakefield Court Suwannee, Georgia 30024 Jeanne Orr (1 electronic SAP) Reservoirs Environmental Services Inc. 5801 Logan Street, Suite 100 Denver, Colorado 80216 Nick Raines (5 copies, 1 electronic SAP) CDM 60 Port Boulevard, Suite 201 Libby, Montana 59923

PAGE INTENTIONALLY LEFT BLANK
i
OU4 ABS SAP
Contents
Section 1 Introduction 1.1 Objectives ................................................................................................................... 1-3 1.2 Project Schedule and Deliverables ......................................................................... 1-3
Section 2 Site Background 2.1 Site Description ......................................................................................................... 2-1 2.2 Historic ABS Efforts ................................................................................................. 2-1
2.2.1 Indoor ABS ................................................................................................. 2-3 2.2.2 Outdoor ABS .............................................................................................. 2-4
Section 3 Data Quality Objectives 3.1 Step 1: State the Problem ......................................................................................... 3-1 3.2 Step 2: Identify the Goal of the Study .................................................................... 3-2 3.3 Step 3: Identify Information Inputs ........................................................................ 3-2
3.3.1 Exposure Scenarios ................................................................................... 3-2 3.3.2 Air Sampling Method ............................................................................... 3-4 3.3.3 Soil Sampling Method .............................................................................. 3-4 3.3.4 Target Analyte List .................................................................................... 3-4
3.4 Step 4: Define the Bounds of the Study ................................................................. 3-4 3.4.1 Spatial Bounds ........................................................................................... 3-4 3.4.2 Temporal Bounds ...................................................................................... 3-5
3.5 Step 5: Define the Analytic Approach ................................................................... 3-5 3.6 Step 6: Specify Acceptance Criteria ........................................................................ 3-6 3.7 Step 7: Develop the Plan for Obtaining Data ........................................................ 3-7
3.7.1 Selection of Sampling Locations .............................................................. 3-7 3.7.2 Optimizing Number of Air Samples ...................................................... 3-8 3.7.3 Optimizing Number of Soil Samples ...................................................... 3-9 3.7.4 Optimizing ABS Air Sample Strategy .................................................. 3-11 3.7.5 Specifying the TEM Stopping Rules ..................................................... 3-12 3.7.6 Refining the Study Design ..................................................................... 3-18
Section 4 Sampling Program 4.1 Pre-Sampling Activities ........................................................................................... 4-1
4.1.1 Field Planning Meeting ............................................................................ 4-1 4.1.2 Training Requirements ............................................................................. 4-2 4.1.3 Inventory and Procurement of Equipment and Supplies .................... 4-3 4.1.4 Identify Sampling Locations .................................................................... 4-3
4.2 Property Screening ................................................................................................... 4-4 4.2.1 Soil Sample Collection .............................................................................. 4-4 4.2.2 Visual Inspection ....................................................................................... 4-4 4.2.3 Property Screening Documentation – Sketches .................................... 4-6

Contents
ii
OU4 ABS SAP
4.3 Sample Collection ..................................................................................................... 4-6 4.3.1 Soil Sample Collection .............................................................................. 4-6 4.3.2 Air Sample Collection ............................................................................... 4-8 4.3.3 Pump Calibration .................................................................................... 4-10
4.4 General Processes ................................................................................................... 4-11 4.4.1 Sample Labeling and Identification ...................................................... 4-11 4.4.2 Field Logbooks ......................................................................................... 4-11 4.4.3 Field Sample Data Sheets ....................................................................... 4-13 4.4.4 Photographic Documentation................................................................ 4-13 4.4.5 Videographic Documentation ............................................................... 4-13 4.4.6 GPS Point Collection ............................................................................... 4-13 4.4.7 Field Equipment Maintenance .............................................................. 4-14 4.4.8 Equipment Decontamination ................................................................. 4-14 4.4.9 Handling IDW ......................................................................................... 4-15 4.4.10 Field Sample Custody and Documentation ......................................... 4-15 4.4.11 Chain-of-Custody Records ..................................................................... 4-16 4.4.12 Sample Packaging and Shipping ........................................................... 4-16
4.5 Quality Assurance/Quality Control Activities .................................................. 4-17 4.5.1 Modification Documentation ................................................................. 4-17 4.5.2 Field Surveillances and Audits .............................................................. 4-17 4.5.3 Field QC Samples .................................................................................... 4-18
Section 5 Processing Facility and Laboratory Operations 5.1 Soil Samples ............................................................................................................... 5-1 5.2 Air Samples ............................................................................................................... 5-3
5.2.1 TEM Analytical Sensitivity/Stopping Rules ......................................... 5-3 5.2.1.1 Field Samples .............................................................................. 5-3 5.2.1.2 Field Blanks and Lot Blanks ...................................................... 5-3
5.3 Prioritization of Air Sample Analysis .................................................................... 5-3 5.4 Holding Times........................................................................................................... 5-4 5.5 Custody Procedures ................................................................................................. 5-4 5.6 Facility QA/QC ........................................................................................................ 5-4
5.6.1 General ........................................................................................................ 5-4 5.6.2 Facility QC Samples .................................................................................. 5-5
5.7 Facility Documentation and Reporting ................................................................. 5-5 5.8 Laboratory Nonconformance .................................................................................. 5-6
Section 6 Assessments and Oversight 6.1 Assessments .............................................................................................................. 6-1 6.2 Corrective Actions .................................................................................................... 6-1 6.3 Reports to Management ........................................................................................... 6-2
Contents
iii
OU4 ABS SAP
Section 7 Data Review and Validation 7.1 Data Review and Verification Requirements...................................................................... 7-1 7.2 DQO Reconciliation ................................................................................................................ 7-1
Section 8 References ........................................................................................................................... 8-1
Appendices Appendix A Script for Activity-based Sampling Scenarios Appendix B Interim Approach for Evaluation of Uncertainty around the Mean of a
Set of Asbestos Concentration Values Appendix C ABS Property Background and Sampling Form Appendix D Standard Operating Procedures Appendix E Summary of Preparation and Analytical Requirements for Asbestos Appendix F Record of Modification Form
Figures 3-1 Scenario 4 Driving Boundaries 3-2 Scenario 5 Bicycle Routes 3-3 Relationship Between Number of Structures Observed and Relative
Uncertainty
Tables 3-1 ABS Air Sample Collection Summary 3-2 ABS Soil Sample Collection Summary 3-3 Estimating Target Sensitivity for TEM Analysis of ABS Air Samples 3-4 Estimating Maximum Area Examined for TEM Analysis of ABS Air Samples 4-1 Scenario Areas and Activities Summary 4-2 Summary of Field Quality Control Samples
iv OU4 ABS SAP
Acronyms ABS activity-based sampling ACM asbestos-containing material ASTM American Society for Testing and Materials bgs below ground surface CDM CDM Federal Programs Corporation CFR Code of Federal Regulations COC chain of custody record DQOs data quality objectives EDD electronic data deliverable EFA effective filter area EPC exposure point concentration eFSDS electronic field sample data sheet EPA U.S. Environmental Protection Agency EPC exposure point concentration EF exposure frequency ET exposure time f/cc fibers per cubic centimeter FSDS field sample data sheet FTL field team leader GOA grid opening area GPS global positioning system GSD geometric standard deviation HASP Health and Safety Plan HAZWOPER Hazardous Waste Operations and Emergency Response ID identification IDW investigation-derived waste IFM investigation field manager IUR inhalation unit risk ISO International Organization for Standardization L liters L/min liters per minute LA Libby amphibole asbestos LC laboratory coordinator MCE mixed cellulose ester MET meteorological mm millimeter mm2 square millimeter mph miles per hour N/A not applicable OSWER Office of Solid Waste and Emergency Response OU4 operable unit 4 PCM phase contrast microscopy PCME PCM-equivalent PDOP position dilution of precision PLM polarized light microscopy

Acronyms
v
OU4 ABS SAP
PLM-VE PLM visual area estimation method PLM-Grav PLM gravimetric method PPE personal protective equipment QA quality assurance QC quality control RBC risk-based concentration RBF risk-based fraction RME reasonable maximum exposure RPD relative percent difference s/cc structures per cubic centimeter SAP sampling and analysis plan Site Libby Asbestos Superfund Site SOP standard operating procedure SRC SRC, Inc. SQAPP Supplemental Quality Assurance Project Plan TEM transmission electron microscopy TS target sensitivity TWF time weighting factor UCL upper confidence limit UR unit risk V air sample volume VWC volumetric water content cc-1 per cubic centimeter µm microns °F degrees Fahrenheit ≥ greater than or equal to < less than 95UCL 95 percent upper confidence limit of the arithmetic mean
1-1
OU4 ABS SAP
Section 1 Introduction This document serves as the supplemental activity-based sampling (ABS) plan for outdoor air exposures in operable unit 4 (OU4) of the Libby Asbestos Superfund Site (Site). The efforts described in this sampling and analysis plan (SAP) will be conducted to collect data to fill data gaps in the OU4 conceptual site model for use in the cumulative risk assessment and will be supplemented in the future as additional data gaps are identified. This includes the collection and analysis of personal air samples for people who engage in activities that disturb soil or other potential source materials during these activities, as well as collection and analysis of soil samples collected from areas where the activities occur. This SAP describes the collection of data needed to characterize potential exposures to residents within OU4 during the following routine outdoor activities:
Resident working in yard
Resident working in garden
Child playing on unpaved driveways
Driving a car or truck on paved and unpaved roads
Riding bicycles
Data required to determine potential exposures for activities upon driveways, and during driving, biking, and gardening, have not previously been collected at OU4, or only collected on a limited basis. The previous OU4 Outdoor ABS efforts conducted in 2007 and 2008 did include residential scenarios conducted in the yard (i.e., raking, child’s play, and mowing). This original effort focused on the collection of samples that were specific to each activity performed at different levels of Libby amphibole asbestos (LA) contamination as determined by polarized light microscopy by visual area estimation (PLM-VE).
In PLM-VE, soil levels are categorized semi-quantitatively into “bins,” as follows:
PLM-VE Bin Meaning A Asbestos not detected B1 Asbestos is detected at a level estimated to be ≤ 0.2% B2 Asbestos is detected at a level estimated to be > 0.2% but < 1% C Asbestos is detected at a level estimated to be ≥ 1%
For example, one personal air sample was collected during a raking scenario at a location of soil with trace LA results. The purpose of this design was to try to establish an LA air concentration associated with an LA soil concentration.
Section 1 Introduction
1-2
OU4 ABS SAP
The new ABS approach described in this SAP will characterize a property as the whole exposure unit with all similar use areas sampled together (regardless of soil analytical result). This change was made so the affect of varying levels of contamination on the overall exposure potential at a residence can be evaluated. Another important difference from the previous OU4 Outdoor ABS efforts and the effort describe in this SAP is that the previous effort focused solely on the efficacy of property cleanups such that all properties sampled during the previous OU4 Outdoor ABS activities were post-cleanup properties. That is, each property had undergone a removal action or was screened and did not meet the removal criteria identified by EPA (EPA 2003). The properties that will be used for the activities in this SAP will collect information from post-cleanup properties as well as properties requiring a cleanup.
This SAP contains all the elements required for both a field sampling plan and quality assurance project plan, and has been developed in accordance with the U.S. Environmental Protection Agency (EPA) Requirements for Quality Assurance Project Plans, EPA QA/R-5 (EPA 2001), and the Guidance on Systematic Planning Using the Data Quality Objectives Process, EPA QA/G4 (EPA 2006).
The purpose of this SAP is to describe the sampling objectives, locations, measurement methods, and data quality objectives (DQOs) for the activity-based personal air sampling program. The SAP is organized as follows:
Section 1 – Introduction
Section 2 – Site Background
Section 3 – Data Quality Objectives
Section 4 – Sampling Program
Section 5 – Processing Facility and Laboratory Operations
Section 6 – Assessments and Oversight
Section 7 – Data Review and Validation
Section 8 – References
As evaluations of data specific to these activities described in the SAP occur, additional sampling efforts may be required. If additional sampling efforts are required, SAPs specific to those efforts will be generated prior to sample collection.

Section 1 Introduction
1-3
OU4 ABS SAP
1.1 Objectives This section defines the objectives of the sampling program and the intended use of data.
As determined by previous investigations conducted at the Site, LA is present in multiple environmental media in Libby including: indoor air, outdoor ambient air, indoor dust, vermiculite insulation, and soils. As a result, residents of Libby may be exposed to LA, and these exposures may pose a risk of cancer and/or non-cancer effects. The objective of this sampling program is to collect data of sufficient representativeness and quality to evaluate any potential exposures and inhalation risk from LA when outdoor soils or other potential source materials are disturbed by residents of Libby while engaged in specific activities under present site conditions.
The specific objectives of the sampling program described in this SAP include the collection of data that will be used to determine the potential exposures from LA inhalation risk to residents who perform the following activities:
1. Adult yard work (raking, mowing, and digging)
2. Adult garden work (digging with a trowel and rototilling)
3. Child playing on unpaved driveways
4. Driving on paved and unpaved roads
5. Riding bicycles
1.2 Project Schedule and Deliverables Sampling is expected to begin in July 2010. Once the initial data set is evaluated by EPA risk assessment and management teams, additional samples may be pulled from archive for analysis and/or additional data collection may be deemed necessary to support final decision-making.
2-1
OU4 ABS SAP
Section 2 Site Background 2.1 Site Description Libby is a community in northwestern Montana located 7 miles southwest of an open pit vermiculite mine that operated from the 1920s until 1990. The mine began limited operations in the 1920s and was operated on a larger scale by the W.R. Grace Company from approximately 1963 to 1990. Studies at the Site reveal that the vermiculite from the mine contains amphibole-type asbestos, referred to in this SAP as LA.
Epidemiological studies at the Site revealed that workers at the mine had an increased risk of developing asbestos-related lung disease (McDonald et al. 1986, Amandus and Wheeler 1987, Amandus et al. 1987, Sullivan 2007, Rohs et al. 2007). Additionally, radiographic abnormalities were observed in 17.8 percent of the general population of Libby including former workers, family members of workers, and individuals with no specific pathway of exposure (Peipins et al. 2003). Although the mine has ceased operations, historic or continuing releases of LA from mine related materials could be serving as a source of ongoing exposure and risk to current and future residents and workers in the area. Since 1999, EPA has conducted sampling and cleanup activities at the Site related to asbestos-related health problems in the Libby population. The Site was listed on the Superfund National Priorities List in October 2002.
2.2 Historic ABS Efforts Previous residential ABS activities conducted at OU4 are detailed in the Draft Final OU4 Remedial Investigation Report (CDM Federal Programs Corporation [CDM] 2010) and include the following programs:
Phase 2 Investigation
Post-Cleanup Evaluation Study (CDM 2003)
Supplemental Remedial Investigation
Cumulative Risk Assessment Study
2007-2008 Indoor and Outdoor ABS Program
Flower Creek ABS Study
School ABS Study
Details regarding the 2007-2008 indoor and outdoor ABS program are described in the reminder of this section. Details on the other ABS programs mentioned above can be found in the Draft Final OU4 Remedial Investigation Report (CDM 2010).
Section 2 Site Background
2-2
OU4 ABS SAP
EPA collected initial data beginning in 2005 to evaluate human exposure to LA and the efficacy of cleanup activities. Although the data widely varied, a discernable correlation between elevated LA levels in soil (by the polarized light microscopy visual area estimation method [PLM-VE]) and elevated levels of LA in air was determined. While informative, these initial data were not sufficient to support reliable risk assessment or risk management decisions because of the following:
Not enough samples were collected to adequately limit statistical uncertainty.
Not enough samples were collected to ensure adequate spatial and temporal (seasonal) representativeness of the data.
Scenario locations were stratified solely on the analytical results by PLM-VE and did not consider the presence of vermiculite in soil.
The PLM-VE method, which has a practical quantification limit of about 0.2 percent (by weight) for LA, may not be sensitive enough to identify levels in soils that, when disturbed, generate asbestos levels in air that are of potential concern.
Therefore, in 2007, EPA began collecting additional data to support risk management decisions and to further evaluate the efficacy and protectiveness of the cleanup strategy. The process of monitoring LA fiber releases during scripted activities is referred to as ABS. The ABS program consisted of both indoor and outdoor sampling at properties where EPA had previously investigated LA sources and had either taken cleanup action or else determined that no cleanup action was needed under the current removal action protocol. In both circumstances, these properties are referred to as “post cleanup.”
The primary ABS objective was to determine if remaining indoor and outdoor risks in post-cleanup properties were within acceptable limits. Personal air samples were collected instead of stationary air samples to more closely represent the breathing zone of individuals engaged in the scripted activities and more closely simulate the potential exposure of residents to LA. The secondary ABS objective was to collect representative data about characteristics of property contamination in order to develop a method for predicting indoor and outdoor air measurements at other properties at OU4 and help guide future removal decisions at the Site. For this reason, dust and soil samples were also collected as part of the ABS program in an attempt to quantify LA concentrations in potential source materials that were disturbed during ABS. This section summarizes the ABS activities conducted in accordance with Sampling and Analysis Plan for Activity-based Indoor Air Exposures in Operable Unit 4 (EPA 2007a) and Sampling and Analysis Plan for Activity-based Outdoor Air Exposures in Operable Unit 4 (EPA 2007b). A summary of analytical results and ABS findings can be found in Activity-based Sampling Summary Report, Operable Unit 4 (EPA 2010a).
Section 2 Site Background
2-3
OU4 ABS SAP
2.2.1 Indoor ABS Indoor ABS was repeated at each of 80 participating houses once a quarter over one year. The first Indoor ABS event began in July 2007 and the fourth Indoor ABS event ended in June 2008.
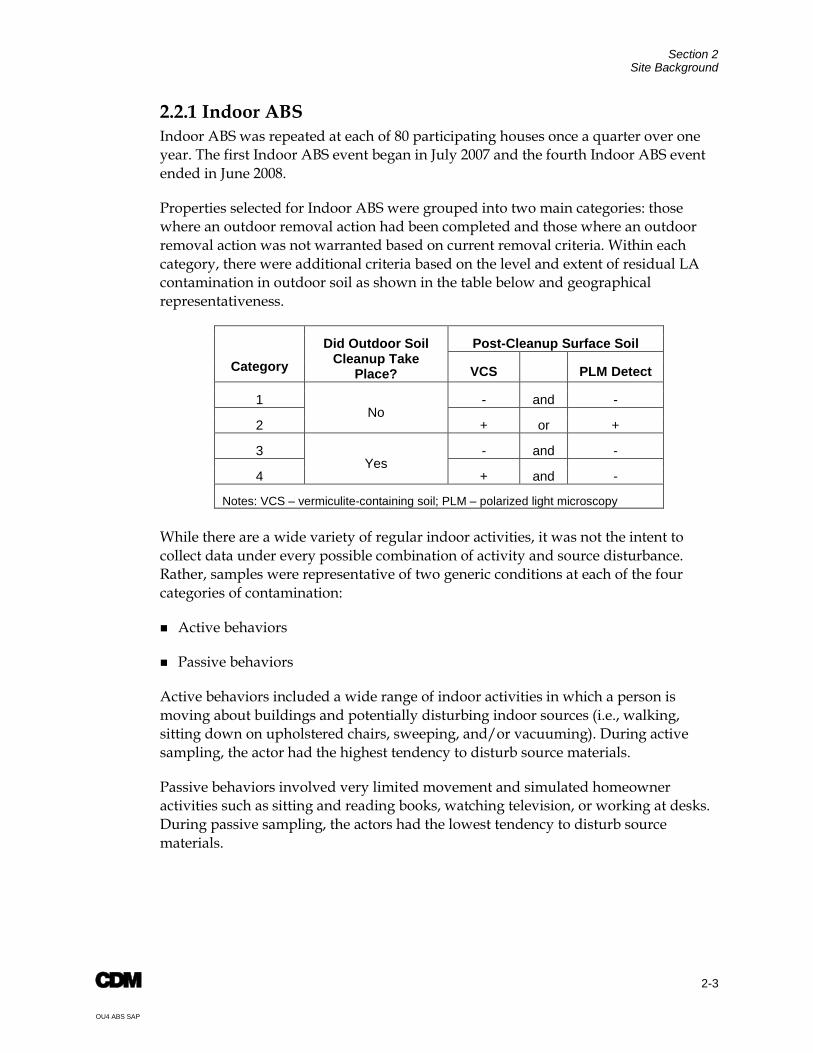
Properties selected for Indoor ABS were grouped into two main categories: those where an outdoor removal action had been completed and those where an outdoor removal action was not warranted based on current removal criteria. Within each category, there were additional criteria based on the level and extent of residual LA contamination in outdoor soil as shown in the table below and geographical representativeness.
Category
Did Outdoor Soil Cleanup Take
Place?
Post-Cleanup Surface Soil
VCS PLM Detect
1 No
- and -
2 + or +
3 Yes
- and -
4 + and -
Notes: VCS – vermiculite-containing soil; PLM – polarized light microscopy While there are a wide variety of regular indoor activities, it was not the intent to collect data under every possible combination of activity and source disturbance. Rather, samples were representative of two generic conditions at each of the four categories of contamination:
Active behaviors
Passive behaviors
Active behaviors included a wide range of indoor activities in which a person is moving about buildings and potentially disturbing indoor sources (i.e., walking, sitting down on upholstered chairs, sweeping, and/or vacuuming). During active sampling, the actor had the highest tendency to disturb source materials.
Passive behaviors involved very limited movement and simulated homeowner activities such as sitting and reading books, watching television, or working at desks. During passive sampling, the actors had the lowest tendency to disturb source materials.
Section 2 Site Background
2-4
OU4 ABS SAP
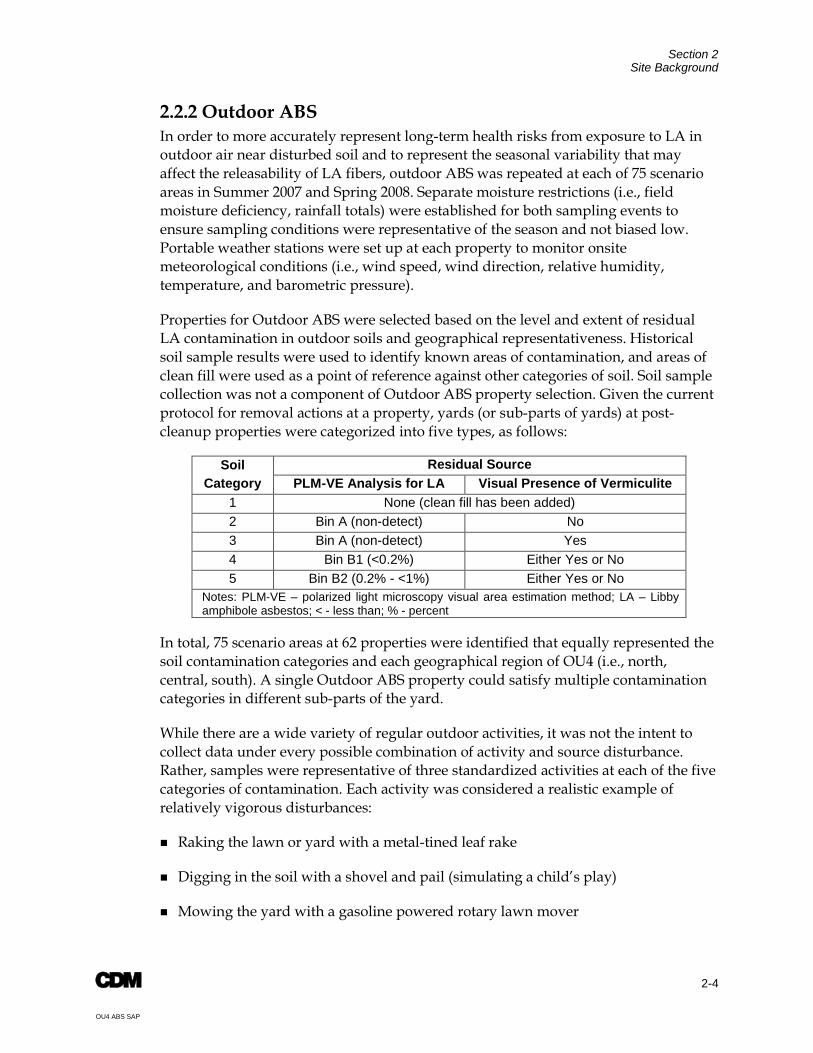
2.2.2 Outdoor ABS In order to more accurately represent long-term health risks from exposure to LA in outdoor air near disturbed soil and to represent the seasonal variability that may affect the releasability of LA fibers, outdoor ABS was repeated at each of 75 scenario areas in Summer 2007 and Spring 2008. Separate moisture restrictions (i.e., field moisture deficiency, rainfall totals) were established for both sampling events to ensure sampling conditions were representative of the season and not biased low. Portable weather stations were set up at each property to monitor onsite meteorological conditions (i.e., wind speed, wind direction, relative humidity, temperature, and barometric pressure).
Properties for Outdoor ABS were selected based on the level and extent of residual LA contamination in outdoor soils and geographical representativeness. Historical soil sample results were used to identify known areas of contamination, and areas of clean fill were used as a point of reference against other categories of soil. Soil sample collection was not a component of Outdoor ABS property selection. Given the current protocol for removal actions at a property, yards (or sub-parts of yards) at post-cleanup properties were categorized into five types, as follows:
Soil Category
Residual Source PLM-VE Analysis for LA Visual Presence of Vermiculite
1 None (clean fill has been added) 2 Bin A (non-detect) No 3 Bin A (non-detect) Yes 4 Bin B1 (<0.2%) Either Yes or No 5 Bin B2 (0.2% - <1%) Either Yes or No
Notes: PLM-VE – polarized light microscopy visual area estimation method; LA – Libby amphibole asbestos; < - less than; % - percent
In total, 75 scenario areas at 62 properties were identified that equally represented the soil contamination categories and each geographical region of OU4 (i.e., north, central, south). A single Outdoor ABS property could satisfy multiple contamination categories in different sub-parts of the yard.
While there are a wide variety of regular outdoor activities, it was not the intent to collect data under every possible combination of activity and source disturbance. Rather, samples were representative of three standardized activities at each of the five categories of contamination. Each activity was considered a realistic example of relatively vigorous disturbances:
Raking the lawn or yard with a metal-tined leaf rake
Digging in the soil with a shovel and pail (simulating a child’s play)
Mowing the yard with a gasoline powered rotary lawn mover
3-1
OU4 ABS SAP
Section 3 Data Quality Objectives Data Quality Objectives (DQOs) are statements that define the type, quality, quantity, purpose and use of data to be collected. The design of a study is closely tied to the DQOs, which serve as the basis for important decisions regarding key design features such as the number and location of samples to be collected and the types of analyses to be performed. EPA has developed a seven-step process for establishing DQOs to help ensure that data collected during a field sampling program will be adequate to support reliable site-specific risk management decision-making (EPA 2001, 2006). These seven steps are listed below:
1. State the problem that the study is designed to address
2. Identify the goal of the study
3. Identify the types of information inputs needed
4. Define the bounds (in space and time) of the study
5. Define the analytic approach
6. Define the acceptable limits on decision errors
7. Optimize the study design using information identified in Steps 1-6
The following paragraphs implement the DQO process for this study.
3.1 Step 1: State the Problem Evaluating risks to humans from exposure to asbestos in air is most reliably achieved by collection of data on the level of asbestos in breathing zone air during realistic and representative activities that may disturb asbestos-contaminated source media such as soil or dust as described in Framework for Investigating Asbestos-Contaminated Sites (EPA 2008). This is generally referred to as ABS.
EPA has collected outdoor ABS air samples to evaluate exposure of residents in OU4 from soil disturbances in their yards (EPA 2007b). These investigations focused on several representative residential activities (raking, mowing, and child’s play) performed in selected sub-areas of yards at “post-cleanup properties”1
1 The term "post-cleanup property" is used to indicate any property where EPA investigated sources and
either performed cleanup actions or else determined that no cleanup action was needed under the current decision-making protocol (EPA 2003b).
. However, ABS data have not yet been collected from activities that span an entire property, and have not yet been collected at properties where cleanup actions are warranted (per EPA 2003) but have not yet been performed. Therefore, additional ABS data are needed to address these limitations.

Section 3 Data Quality Objectives
3-2
OU4 ABS SAP
In addition, ABS studies have not yet been performed to evaluate a variety of other exposure scenarios of potential concern in OU4, including disturbances of soils in residential gardens and driveways, driving along roads in Libby, or riding bicycles along roads/trails in Libby. Therefore, additional ABS data are needed to characterize exposures under these scenarios from post-cleanup properties and properties where cleanup actions are still required.
3.2 Step 2: Identify the Goal of the Study The goal of this study is to obtain sufficient data to allow EPA to complete an exposure assessment and an evaluation of risks to residents in OU4 from exposure to LA in air during realistic and representative activities. ABS air data collected as part of this study may be combined with ABS air data from other OU4 studies. The additional data will either be used directly to evaluate risks at sampled exposure areas or used to develop relationships between LA in soil and LA in ABS air which can be utilized to estimate exposure and risk for properties where ABS was not performed. The risk assessment will provide information that may be used by risk managers to decide whether or not response actions are needed to protect individuals from unacceptable risks from LA in OU4.
3.3 Step 3: Identify Information Inputs The information needed to characterize human exposures in OU4 consists of reliable measurements of LA concentrations in breathing zone air under realistic and representative exposure scenarios that are characteristic of the activities engaged in by residents and workers in OU4.
3.3.1 Exposure Scenarios People may disturb soil or other LA source materials in OU4 by a wide variety of different activities. Conceptually, the ideal data set would include ABS data from many different types of disturbance that span the full range of activities that may occur in OU4. However, it is not feasible to evaluate every possible type of disturbance. Rather, this ABS program will focus on five scenarios which are considered to be realistic and representative examples of disturbances in OU4. These scenarios are described briefly below and are described in detail in Appendix A.
ABS Scenario 1: Working in Residential Yards This scenario includes three disturbance activities of residential yard soil which are considered to be realistic examples of relatively vigorous (high-end) disturbances:
Raking the lawn or yard with a metal-tined leaf rake
Digging in the soil with a shovel
Mowing the yard with a gasoline powered rotary lawn mower
Section 3 Data Quality Objectives
3-3
OU4 ABS SAP
Because risk is related to the long-term average exposure across all of these activities, the ABS samples will be composites that include all three types of disturbance activities.
ABS Scenario 2: Working in Residential Gardens This scenario includes two disturbance activities of residential garden soil which are considered to be realistic examples of relatively vigorous (high-end) disturbances:
Rototilling
Digging with a trowel
Similar to ABS Scenario 1, because risk is related to the long-term average exposure across both of these activities, the ABS air samples will be composites that include both types of disturbance activities.
ABS Scenario 3: Child Playing on an Unpaved Driveway This scenario simulates child play/digging that may reasonably occur on a gravel or dirt driveway, such as riding bicycles, playing with toys, playing basketball, etc. ABS samples will be representative of a composite exposure scenario across various activities.
ABS Scenario 4: Driving on Roads in Libby This scenario will evaluate exposures from driving in a car on roads and alleys in the town of Libby. Because roads and alleys in Libby include both paved and unpaved surfaces, ABS air samples should be representative of a composite exposure scenario across the variety of road surfaces that may be encountered in Libby.
In some cases, cars in Libby may be contaminated with LA in soil or dust derived mainly from historic sources, and disturbance of this interior soil or dust might result in exposures that are higher than would be experienced due to releases from current sources. In order to ensure that the measures of ABS air while driving are determined mainly by the release of LA from current outdoor sources, all vehicles used in these tests should be obtained from a location outside of Libby. These vehicles will be used for no other purposes during the sampling event.
ABS Scenario 5: Riding Bicycles in Libby This scenario will evaluate exposures from riding bicycles on roads and trails in Libby. This recreational activity is selected because it is believed that soil disturbances associated with this activity will be at the high-end of the range of possible exposures when compared to other recreational activities such as walking or running. Because very young children may be exposed during bicycle riding activities via transport in an attached bicycle trailer, this scenario includes ABS air samples representative of both adult bicycle riders and children in attached bicycle trailers.
Section 3 Data Quality Objectives
3-4
OU4 ABS SAP
3.3.2 Air Sampling Method Experience at Libby and at other sites has demonstrated that, in general, personal air samples (i.e., samples that collect air in the breathing zone of a person) tend to have higher concentrations than air samples collected by a stationary monitor (EPA 2007c), especially if the person is engaged in an activity that disturbs an asbestos source such as contaminated soil. Because of this, this study will focus on the collection of personal air samples during ABS. ABS measurements are obtained by drawing a known volume of air through a filter that is located in the breathing zone of the individual performing the disturbance activity and measuring the number of LA structures that become deposited on the filter surface.
3.3.3 Soil Sampling Method Residential Yards, Gardens, Driveways Because it is not feasible, due to both time and cost considerations, to perform ABS at every property in Libby, it is expected that risk managers will rely upon an extrapolation of ABS results between areas of similar contamination in soil to make risk management decisions. This extrapolation will rely upon establishing a relationship between various metrics of LA and vermiculite in soil and measurements of LA in ABS air. Therefore, measurements of LA and vermiculite in soil are needed for each type of ABS area (i.e., yards, gardens, driveways).
Roads and Bicycle Routes in Libby Because the driving and bicycle riding scenarios will be representative of all roads, alleys and paths in OU4, it will not be necessary to perform extrapolation of ABS air data for roads and bicycle routes in Libby from soil data. Therefore, no soil sampling will be needed for these ABS scenarios. If it is later determined that a response action is needed on roads or bicycle routes, future sampling may be needed to identify potential target areas for cleanup.
3.3.4 Target Analyte List Each ABS air sample and soil sample that is collected will be analyzed for asbestos. Specific analytical methods and requirements are provided in Section 5. For ABS air samples, results should include the size attributes (length, width) of each asbestos structure observed, along with the mineral classification (LA, other amphibole, chrysotile). For soil samples, results should include estimates of the percentage of LA in soil.
3.4 Step 4: Define the Bounds of the Study 3.4.1 Spatial Bounds The spatial bounds of this study are restricted to properties, roads, and recreational paths located within OU4 of the Site. This OU includes most current residential and commercial properties in the community. Note, however, that the results of this study may also be useful in assessing similar conditions in other OUs at the Site.
Section 3 Data Quality Objectives
3-5
OU4 ABS SAP
3.4.2 Temporal Bounds The release of LA from soil into air is expected to depend on several factors that may tend to vary over time, including, for example, the soil moisture content and the amount of ground cover. Therefore, ABS data should, to the extent practicable, be collected over a sufficient time frame to ensure the data are representative of the true long-term mean concentration level.
In general, it is expected that human exposures to LA in outdoor air are more likely to occur when snow cover is limited or absent, and that releases will tend to be higher during dry than wet conditions. Based on this, ideal ABS data sets would be collected in the interval between late spring and early fall. However, in order to help ensure that data are not biased low, ABS sampling may be restricted to summer months, when conditions for release are generally favorable. For yard, garden and driveway scenarios, ABS sampling should not occur if there is standing water present or if the average volumetric water content (VWC) is greater than 30 percent via field probe instrumentation.
In addition, meteorological (MET) weather station data will be downloaded from the National Oceanic Atmospheric Administration (NOAA) station in Libby on days when ABS activities are scheduled.
It should be noted that samples collected in the summer months may tend to overestimate true long-term average exposure concentrations. Consequently, if risks based on summer-only sampling are judged to fall within a level of concern, then additional sampling in spring and/or fall may be needed to derive a more appropriate estimate of the long-term average.
3.5 Step 5: Define the Analytic Approach EPA will use the outdoor ABS results to estimate potential risks to individuals from various exposure scenarios in OU4 and determine whether remedial action is needed to protect human health. At present, EPA has not developed a quantitative procedure for evaluating non-cancer risks, but has developed a method for quantification of cancer risk (EPA 2008). Because each person can be exposed from more than one source, the total cancer risk is calculated by summing the risks from each applicable exposure pathway.
EPA guidance contained in Office of Solid Waste and Emergency Response (OSWER) Directive #9355.0-30, “Role of the Baseline Risk Assessment in Superfund Remedy Selection Decisions” (EPA 1991) indicates that where the cumulative cancer risk to an individual based on reasonable maximum exposure (RME) is less than 1E-04 and the non-cancer hazard quotient is less than 1, remedial action is generally not warranted unless there are adverse environmental impacts. The guidance also states that a risk manager may decide that a risk level lower than 1E-04 is unacceptable and that remedial action is warranted where there are uncertainties in the risk assessment results.
Section 3 Data Quality Objectives
3-6
OU4 ABS SAP
As noted above, because it is not feasible to perform ABS at every property in Libby, risk managers will extrapolate ABS results between properties with similar LA contamination in soil to make risk management decisions. This extrapolation will rely upon establishing a relationship between one or more metrics of LA in soil and measurements of LA in ABS air. This relationship may be quantitative (e.g., regression based on fluidized bed results or visible scores calculated from visual vermiculite inspection results) or semi-quantitative (e.g., soil bins based on PLM-VE). The OU4 ABS Summary Report (EPA 2010a) provides examples of the types of quantitative and semi-quantitative soil-to-air relationships that will be evaluated. Provided that a soil-to-air relationship can be established, EPA will use this relationship to estimate ABS air concentrations from measured soil results at locations where ABS has not been performed. Exposure point concentrations (EPCs) of LA in air for use in characterizing potential risks in the OU4 human health risk assessment will be estimated from soil using these established relationships.
For roads and bicycle routes, the outdoor ABS air data from these exposure scenarios will be used directly to estimate EPCs of LA in air for use in characterizing potential risks in the OU4 human health risk assessment, so no extrapolation is needed. The EPC will be calculated from LA air measurements over multiple ABS rounds of sampling.
3.6 Step 6: Specify Acceptance Criteria In making decisions about human health risks in OU4, two types of decision errors are possible:
A false negative decision error would occur if a risk manager decides that exposure to LA in OU4 is not of health concern, when, in fact, it is of concern.
A false positive decision error would occur if a risk manager decides that exposure to LA in OU4 is above a level of concern, when, in fact, it is not.
EPA is most concerned about guarding against the occurrence of false negative decision errors, since an error of this type may leave humans exposed to unacceptable levels of LA in OU4. In general, EPA seeks to limit the probability of a false negative decision error to no more than about 5 percent by using the 95 percent upper confidence limit of the arithmetic mean (95UCL) rather than the sample mean in risk calculations. Use of the 95UCL to estimate risk helps account for limitations in the data, ensuring that risk estimates are more likely to overestimate than underestimate the true risk level.
However, at present, EPA has not developed a method for estimating the 95UCL of a data set of asbestos measurements in air. Therefore, until an approved method is developed, risk estimates will be based on the sample mean rather than the 95UCL. This approach means that risk estimates may be either higher or lower than the true risk.
Section 3 Data Quality Objectives
3-7
OU4 ABS SAP
EPA is also concerned with the probability of making false positive decision errors. Although this type of decision error does not result in unacceptable human exposure, it may result in unnecessary expenditure of resources. In general, EPA seeks to limit the probability of a false positive decision error to no more than about 20 to 30 percent when the true risk is less than one-half of the level of concern.
3.7 Step 7: Develop the Plan for Obtaining Data 3.7.1 Selection of Sampling Locations ABS Scenario 1: Working in Residential Yards Properties selected for evaluation will be drawn from four categories, as follows:
Category 1: No soil cleanup required; PLM-VE Bin B1 in all or a portion of the yard; presence/absence of visible vermiculite is not a selection criteria.
Category 2: Soil cleanup has occurred in the yard; no visible vermiculite present in the yard.
Category 3: Soil cleanup has occurred in the yard; visible vermiculite present in the portion of the yard not affected by the removal action.
Category 4: Soil cleanup is required, but action not yet taken; PLM-VE Bin B2 or Bin C in all or a portion of the yard; presence/absence of visible vermiculite is not a selection criteria.
This stratification will be useful for the extrapolation of results between properties, and may help establish a quantitative relationship between soil and air. To the extent possible, the selected properties in each category should provide a reasonable spatial representation of OU4.
ABS Scenario 2: Working in Residential Gardens Gardens selected for ABS evaluation will be drawn from the following two categories:
Vis -: No soil cleanup required in the garden; no visible vermiculite present in the garden
Vis +: Soil cleanup is needed in the garden; visible vermiculite present in the garden
To the extent possible, the selected properties of each type should provide a reasonable spatial representation of OU4 and may occur at the same property selected for the yard or driveway scenarios.
Section 3 Data Quality Objectives
3-8
OU4 ABS SAP
ABS Scenario 3: Child Playing on an Unpaved Driveway Driveways selected for ABS evaluation will be drawn from the following two categories:
Vis -: No soil cleanup required; in the driveway; no visible vermiculite present in the driveway
Vis +: Soil cleanup is needed in the driveway; visible vermiculite present in the driveway
To the extent possible, the selected properties of each type should provide a reasonable spatial representation of OU4 and may occur at the same property selected for the yard or garden scenarios.
ABS Scenario 4: Driving on Roads in Libby To the extent feasible, this investigation will represent all roads and alleys (both paved and unpaved) in and about the town of Libby. Study boundaries for this part of the investigation are shown in Figure 3-1. Approximate boundaries of this scenario are as follows:
North/East Boundary: 7 Mile Marker on Highway 37 (including Kootenai River Road and Em Kayan Village, but not Pipe Creek Road)
South Boundary: 37.5 Mile Marker on Highway 2 (extending an additional 1.5 miles south on Farm to Market Road)
West Boundary: 30 Mile Marker on Highway 2
ABS Scenario 5: Riding Bicycles in Libby To the extent feasible, this investigation will include all trails and roads in Libby that are frequently used for recreational purposes by bike riders. Because it is expected that some riders will tend to favor the use of trails/roads in a sub-area of Libby rather than riding at random across the entire community, the areas evaluated should be divided into three sectors, as shown in Figure 3-2.
3.7.2 Optimizing Number of Air Samples As discussed above, the number of samples collected for each scenario should be sufficient to limit the uncertainty in the EPC such that the probability of false negative or false positive decision errors is within the tolerances specified in Step 6 of the DQO process. The number of samples needed depends on the degree between-sample variability and the proximity of EPA to the decision rule. If the between-sample variability is low, or if the EPC is not near a decision rule, then the number of samples needed is usually relatively low. However, if between-sample variability is high and if the EPC is relatively near a decision rule, then the number of samples needed is usually higher.
Section 3 Data Quality Objectives
3-9
OU4 ABS SAP
The narrative in Appendix B describes how the uncertainty around the mean of a sample depends on sample size and on the underlying variability. In this example, it is assumed the data are distributed lognormally, and variability is characterized by the geometric standard deviation (GSD). When the GSD is relatively low (e.g., less than 3), a data set of size 10 is usually enough to limit the uncertainty around the sample mean to within a factor of about 2.0. However, if the variability is large (e.g., GSD = 10), then a data set of size 20-40 may be needed to limit the uncertainty to within a factor of about 3.0.
At present, data are not available to estimate how close the mean concentration of LA in ABS air is to a level of human health concern for the scenarios to be evaluated, or on the magnitude of the underlying variability. In the absence of such data, the target number of samples to be collected and analyzed in this effort for each scenario is 20-30. It is expected that this should be sufficient to support decision-making if the between-sample variability is not too large and if the observed mean concentration is not too close to a decision threshold. Additional sampling may be needed to support decision-making in cases where the data are variable and/or are near a decision threshold.
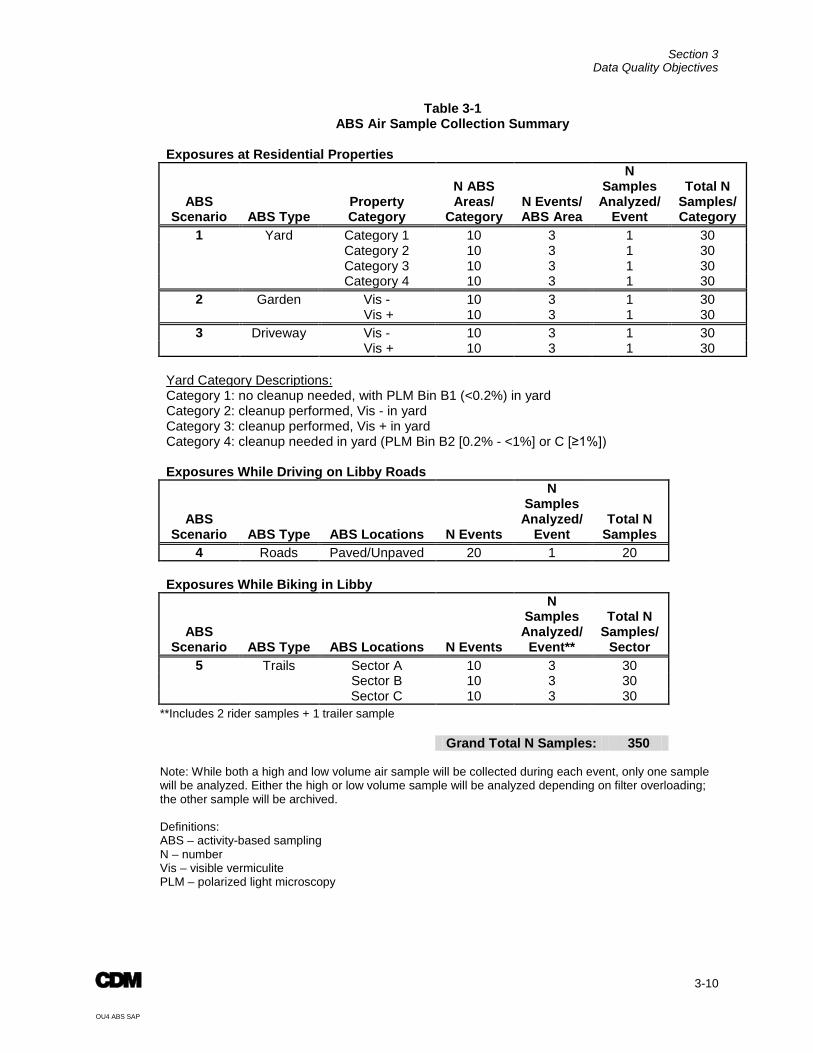
Table 3-1 presents a recommended sampling design that will be adequate to collect the target number of air samples for each ABS scenario. As shown, for ABS Scenarios 1-3, ten ABS areas per property category will be evaluated, and ABS activities will be repeated three times at each ABS area. This recommended sampling design will provide a total of 30 samples per property category for each ABS scenario. For ABS Scenario 4, the ABS activity will be repeated 20 times to provide an adequate number of ABS air samples. For ABS Scenario 5, three samples (two riders + one trailer) will be collected during each sampling event, and ABS activities will be repeated 10 times in each sector. This recommended sampling design will provide a total of 30 samples per sector.
3.7.3 Optimizing Number of Soil Samples Current methods for the evaluation of LA levels in soil include PLM-VE and visual inspection for vermiculite. Both methods are inherently subjective, and both methods tend to yield somewhat variable results. Therefore, reliable characterization of soil levels in an ABS location requires several repeat measures to help minimize the effects of random variation. For the purposes of this study, soil levels will be measured by both PLM-VE and visual inspection during each sampling event to correlate with the event-specific air data. Measurements by other newly developed methods (e.g., fluidized bed) may also be performed to help strengthen the characterization of the level of LA in soil. For residential yards, gardens, and driveways, soil samples should be a composite representative of the entire ABS area. Yard soil composite samples should include sampling points from each of the two digging sub-areas to ensure that these areas are represented in the composite soil sample.
Section 3 Data Quality Objectives
3-10
OU4 ABS SAP
Table 3-1 ABS Air Sample Collection Summary
Exposures at Residential Properties
ABS Scenario ABS Type
Property Category
N ABS Areas/
Category N Events/ ABS Area
N Samples Analyzed/
Event
Total N Samples/ Category
1 Yard Category 1 10 3 1 30 Category 2 10 3 1 30 Category 3 10 3 1 30 Category 4 10 3 1 30 2 Garden Vis - 10 3 1 30 Vis + 10 3 1 30 3 Driveway Vis - 10 3 1 30 Vis + 10 3 1 30
Yard Category Descriptions: Category 1: no cleanup needed, with PLM Bin B1 (<0.2%) in yard Category 2: cleanup performed, Vis - in yard Category 3: cleanup performed, Vis + in yard Category 4: cleanup needed in yard (PLM Bin B2 [0.2% - <1%] or C [≥1%]) Exposures While Driving on Libby Roads
ABS Scenario ABS Type ABS Locations N Events
N Samples Analyzed/
Event Total N
Samples 4 Roads Paved/Unpaved 20 1 20
Exposures While Biking in Libby
ABS Scenario ABS Type ABS Locations N Events
N Samples Analyzed/
Event**
Total N Samples/
Sector 5 Trails Sector A 10 3 30 Sector B 10 3 30 Sector C 10 3 30
**Includes 2 rider samples + 1 trailer sample Grand Total N Samples: 350
Note: While both a high and low volume air sample will be collected during each event, only one sample will be analyzed. Either the high or low volume sample will be analyzed depending on filter overloading; the other sample will be archived. Definitions: ABS – activity-based sampling N – number Vis – visible vermiculite PLM – polarized light microscopy
Section 3 Data Quality Objectives
3-11
OU4 ABS SAP
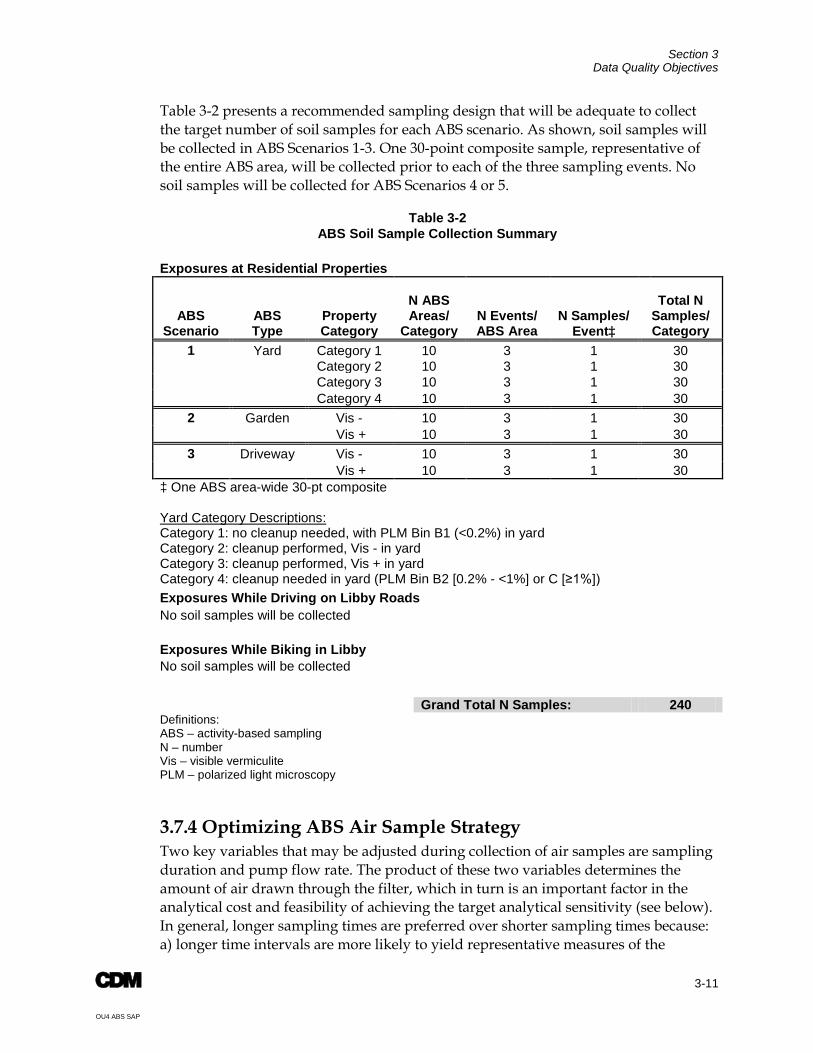
Table 3-2 presents a recommended sampling design that will be adequate to collect the target number of soil samples for each ABS scenario. As shown, soil samples will be collected in ABS Scenarios 1-3. One 30-point composite sample, representative of the entire ABS area, will be collected prior to each of the three sampling events. No soil samples will be collected for ABS Scenarios 4 or 5.
Table 3-2 ABS Soil Sample Collection Summary
Exposures at Residential Properties
ABS Scenario
ABS Type
Property Category
N ABS Areas/
Category N Events/ ABS Area
N Samples/ Event‡
Total N Samples/ Category
1 Yard Category 1 10 3 1 30 Category 2 10 3 1 30 Category 3 10 3 1 30 Category 4 10 3 1 30 2 Garden Vis - 10 3 1 30 Vis + 10 3 1 30 3 Driveway Vis - 10 3 1 30 Vis + 10 3 1 30
‡ One ABS area-wide 30-pt composite Yard Category Descriptions: Category 1: no cleanup needed, with PLM Bin B1 (<0.2%) in yard Category 2: cleanup performed, Vis - in yard Category 3: cleanup performed, Vis + in yard Category 4: cleanup needed in yard (PLM Bin B2 [0.2% - <1%] or C [≥1%]) Exposures While Driving on Libby Roads No soil samples will be collected Exposures While Biking in Libby No soil samples will be collected
Grand Total N Samples: 240 Definitions: ABS – activity-based sampling N – number Vis – visible vermiculite PLM – polarized light microscopy
3.7.4 Optimizing ABS Air Sample Strategy Two key variables that may be adjusted during collection of air samples are sampling duration and pump flow rate. The product of these two variables determines the amount of air drawn through the filter, which in turn is an important factor in the analytical cost and feasibility of achieving the target analytical sensitivity (see below). In general, longer sampling times are preferred over shorter sampling times because: a) longer time intervals are more likely to yield representative measures of the
Section 3 Data Quality Objectives
3-12
OU4 ABS SAP
average concentration (as opposed to short-term fluctuations); and b) longer collection times are associated with higher volumes, which makes it easier to achieve the target analytical sensitivity. Likewise, higher flow rates are generally preferred over lower flow rates because high flow results in high volumes drawn through the filter over shorter sampling times.
For the purposes of this investigation, ABS air samples collected during soil disturbance at residences (i.e., yard, garden, and driveway evaluations) and during bicycle riding will use a sampling duration of 60 minutes and pump flow rate of 4 L/min. ABS air samples collected while driving on Libby roads will use a sampling duration of 120 minutes and a pump flow rate of 8-10 L/min.
In cases where the air being sampled contains a significant level of dust, high air volumes may lead to overloading of the filter with dust particles. In this case, the filter cannot be examined directly, but must undergo an indirect preparation. In order to provide an alternative filter for use in cases where the primary filter is overloaded, each individual will wear a backup filter cassette attached to a pump running at about one-half of the flow rate of the primary pump (e.g., 2 L/min). Whenever possible, the filter from the high flow pump (e.g., 4 L/min) should be selected for analysis. In cases where the high flow filter is overloaded or is damaged, the low flow filter should be analyzed.
3.7.5 Specifying the TEM Stopping Rules In general, three alternative stopping rules are specified to ensure data collected by TEM analysis are adequate:
1. The target analytical sensitivity to be achieved
2. A maximum number of structures to be counted
3. A maximum area of filter to be examined
The basis for each of these values for this study is presented below.
Target Analytical Sensitivity The level of analytical sensitivity needed to ensure that analysis of ABS air samples will be adequate is derived by finding the concentration of LA in ABS air that might be of potential concern, and then ensuring that if an ABS sample were encountered that had a true concentration equal to that level of concern, it would be quantified with reasonable accuracy.
Section 3 Data Quality Objectives
3-13
OU4 ABS SAP
At present, EPA has not developed a quantitative procedure for evaluating non-cancer risks associated with inhalation exposure to asbestos, but has developed a method for quantification of cancer risk (EPA 2008). The basic equation is:
Risk = EPC ∙ TWF ∙ IURa,d
where:
EPC = Exposure point concentration of asbestos structures in inhaled air (structures per cubic centimeter [s/cc])
TWF = Time weighting factor to account for less than continuous exposure (unitless). The value of the TWF term ranges from zero to one, and describes the average fraction of full time that exposure occurs in the time interval being evaluated. The general equation is (EPA 2008):
TWF = ET/24 ∙ EF/365
where:
ET = Average exposure time (hrs/day) on days when exposure is occurring
EF = Average exposure frequency (days/year) in years when exposure is occurring
IURa,d = Inhalation unit risk (UR) (fibers per cubic centimeter [f/cc]) based on continuous exposure beginning at age “a” and continuing for duration “d” years. EPA (2008) provides a table (Table E-4) of UR values for a range of start ages and exposure durations.
It is important to recognize that the value of EPC must be expressed in units of phase contrast microscopy (PCM) s/cc. This is because the current risk model for estimation of cancer risk from inhalation exposure to asbestos (EPA 2008) is based on cumulative exposure expressed as PCM f/cc-years. The concentration of PCM fibers in ABS air could be measured directly using PCM, but EPA believes it is better to measure the concentration of total LA structures using TEM, and then to compute the number of structures observed in TEM that meet the counting requirements for PCM2
2 In the PCM method (NIOSH 7400), a fiber is counted if it has a length of 5 um or longer and
an aspect ratio of at least 3:1. Although there is no thickness rule, particles thinner than about 0.25 um are not usually detectable by PCM. Hence, the counting rules for PCME are: length ≥ 5 um, aspect ratio ≥ 3, thickness > 0.25 um.
. These are referred to as PCM-equivalent (PCME) structures. The concentration of PCME structures (measured by TEM) is an estimate of the concentration value that would have been obtained if the sample were analyzed by PCM. Since the number of PCME
Section 3 Data Quality Objectives
3-14
OU4 ABS SAP
structures released under the scenarios being evaluated is not yet known, for the purpose of determining target analytical sensitivity, the number of PCME structures is based on the average ratio of PCME to total LA structures measured in other outdoor ABS samples collected from OU4. This is referred to as the “risk-based fraction” (RBFPCME), and the calculation is performed as follows:
EPC(PCME LA) = EPC(total LA) ∙ RBFPCME
Combining the equations above and rearranging to solve for the concentration of LA that corresponds to a specified risk level yields the following:
EPC(PCME LA) = Target Risk / [ RBFPCME ∙ TWF ∙ IURa,d]
For convenience, the concentration of LA that corresponds to a specified risk level is referred to as a Risk-Based Concentration (RBC).
Table 3-3 identifies the exposure parameters that have been selected to calculate the RBC for each of the ABS scenarios being investigated in this SAP. These exposure parameters are intended to be conservative, which helps ensure that the target analytical sensitivity will be adequate. Exposure parameters used in the OU4 human health risk assessment may be different than those used here.
Table 3-3 shows the calculation of the RBC for each ABS scenario. The value of the RBFPCME is based on available data from the 2007/2008 OU4 outdoor ABS study (EPA 2010a), which indicated that 1,651 out of 4,800 total LA structures were PCME (RBFPCME = 0.34). The target risk employed in these calculations is 1E-05 in all cases. It is important to emphasize that choice of 1E-05 as the “target risk” is not a risk management decision about the need for remedial action. Rather, this choice is strictly for the purposes of deriving an analytical sensitivity that will be adequate for this ABS program. All actual evaluations of human health risk will be presented in the human health risk assessment for OU4.
Table 3-3 shows the calculation of the target analytical sensitivity for each ABS scenario based on the RBC values. In all cases, the target analytical sensitivity is set so that, on average, about three LA structures would be counted in a sample whose true concentration was equal to the RBC:
Target Sensitivity (cc)-1 = RBC (s/cc) / 3 LA structures
This level of analytical sensitivity should be sufficient to allow reliable quantitation of ABS samples that approach or exceed a risk level of about 1E-05.
Section 3 Data Quality Objectives
3-15
OU4 ABS SAP
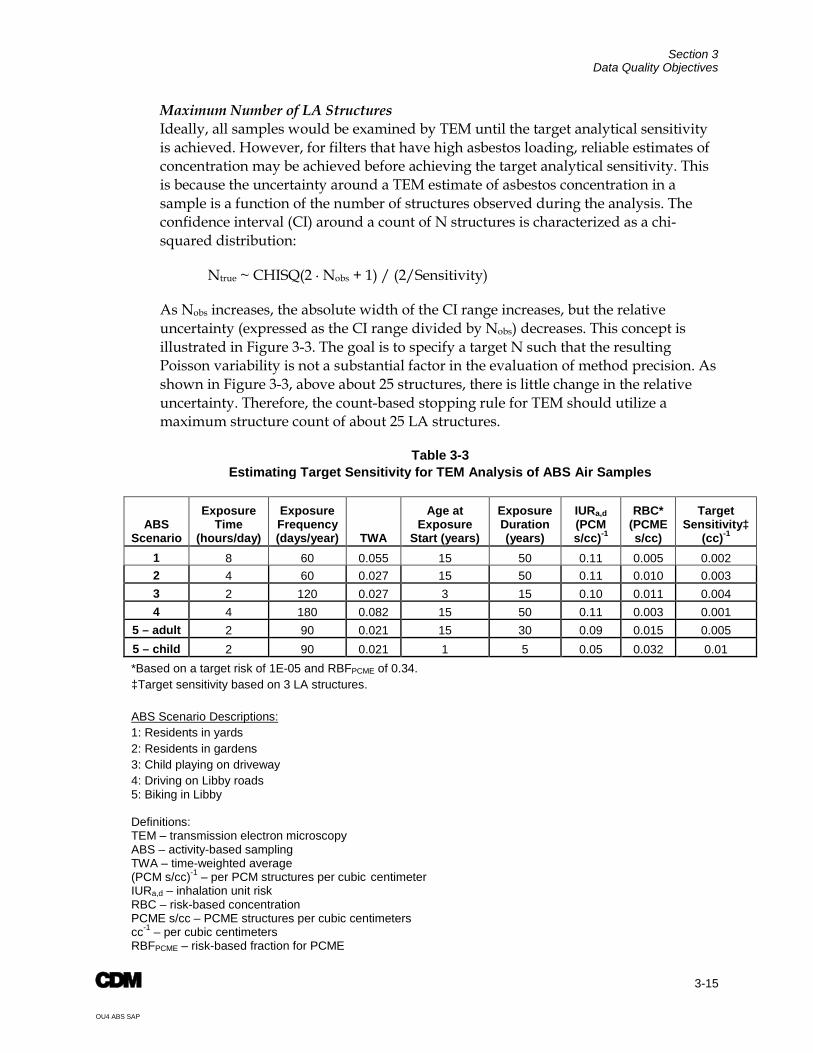
Maximum Number of LA Structures Ideally, all samples would be examined by TEM until the target analytical sensitivity is achieved. However, for filters that have high asbestos loading, reliable estimates of concentration may be achieved before achieving the target analytical sensitivity. This is because the uncertainty around a TEM estimate of asbestos concentration in a sample is a function of the number of structures observed during the analysis. The confidence interval (CI) around a count of N structures is characterized as a chi-squared distribution:
Ntrue ~ CHISQ(2 ∙ Nobs + 1) / (2/Sensitivity)
As Nobs increases, the absolute width of the CI range increases, but the relative uncertainty (expressed as the CI range divided by Nobs) decreases. This concept is illustrated in Figure 3-3. The goal is to specify a target N such that the resulting Poisson variability is not a substantial factor in the evaluation of method precision. As shown in Figure 3-3, above about 25 structures, there is little change in the relative uncertainty. Therefore, the count-based stopping rule for TEM should utilize a maximum structure count of about 25 LA structures.
Table 3-3 Estimating Target Sensitivity for TEM Analysis of ABS Air Samples
ABS
Scenario
Exposure Time
(hours/day)
Exposure Frequency (days/year) TWA
Age at Exposure
Start (years)
Exposure Duration (years)
IURa,d (PCM s/cc)-1
RBC* (PCME s/cc)
Target Sensitivity‡
(cc)-1 1 8 60 0.055 15 50 0.11 0.005 0.002 2 4 60 0.027 15 50 0.11 0.010 0.003 3 2 120 0.027 3 15 0.10 0.011 0.004 4 4 180 0.082 15 50 0.11 0.003 0.001
5 – adult 2 90 0.021 15 30 0.09 0.015 0.005 5 – child 2 90 0.021 1 5 0.05 0.032 0.01 *Based on a target risk of 1E-05 and RBFPCME of 0.34.
‡Target sensitivity based on 3 LA structures.
ABS Scenario Descriptions: 1: Residents in yards 2: Residents in gardens 3: Child playing on driveway 4: Driving on Libby roads 5: Biking in Libby
Definitions: TEM – transmission electron microscopy ABS – activity-based sampling TWA – time-weighted average (PCM s/cc)-1 – per PCM structures per cubic centimeter IURa,d – inhalation unit risk RBC – risk-based concentration PCME s/cc – PCME structures per cubic centimeters cc-1 – per cubic centimeters RBFPCME – risk-based fraction for PCME
Section 3 Data Quality Objectives
3-16
OU4 ABS SAP
Maximum Area to be Examined The number of grid openings that must be examined to achieve the target analytical sensitivity is calculated as:
GOx = EFA / (TS ∙ GOA ∙ V ∙ 1000 ∙ f)
where:
EFA = Effective filter area (assumed to be 385 mm2)
TS = Target analytical sensitivity (cc)-1
GOA = grid opening area (assumed to be 0.01 mm2)
V = sample air volume (L)
1000 = L/cc (conversion factor)
f = indirect preparation dilution factor (assumed to be 1 for direct preparation)
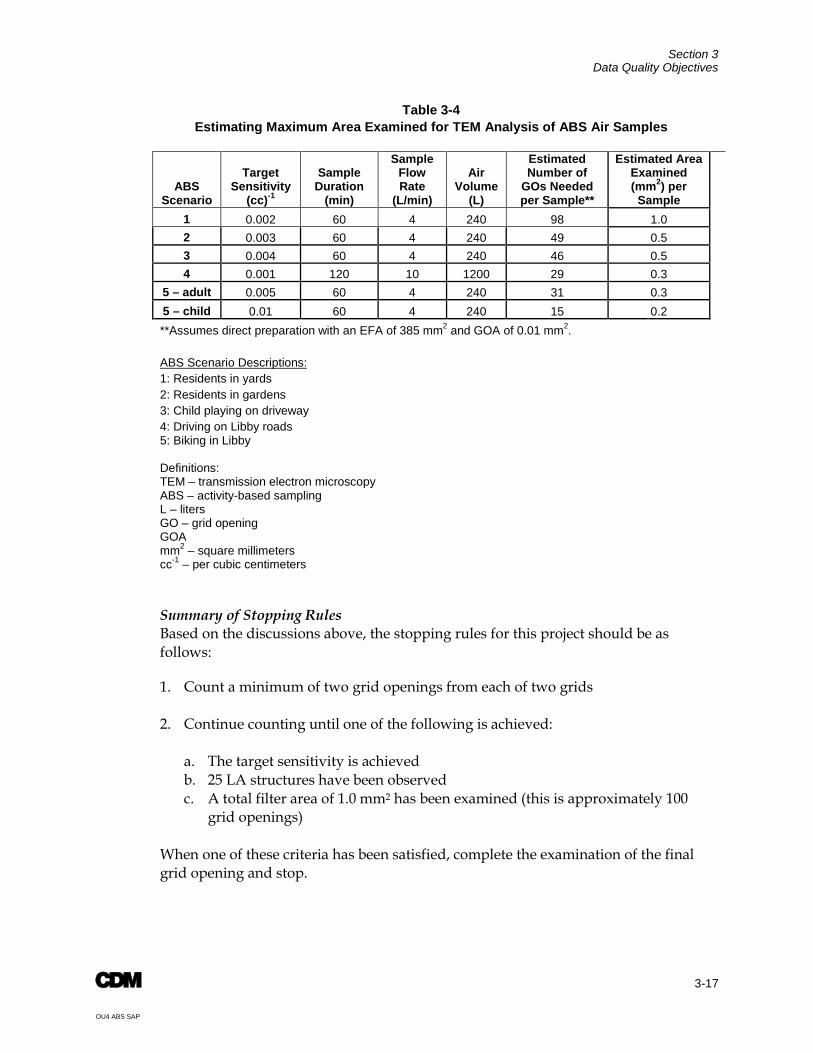
Table 3-4 presents the estimated number of grid openings required to achieve the target analytical sensitivity for each ABS scenario assuming that direct preparation of the high volume sample is possible. As seen, the number of grid openings required is usually less than about 50 grid openings. Assuming that each grid opening has an area of about 0.01 square millimeters (mm2), this would correspond to an area examined of about 0.5 mm2.
In the event that analysis of the low volume sample is needed (due to particulate overloading on the high volume filter) or if an indirect preparation of the low volume sample is necessary, it is possible that the number of grid openings that would need to be examined to achieve the target analytical sensitivity may be cost or time prohibitive. In order to limit the maximum effort expended on any one sample, a maximum area examined of 1.0 mm2 is identified for this project. Assuming that each grid opening has an area of about 0.01 mm2, this would correspond to about 100 grid openings.
Section 3 Data Quality Objectives
3-17
OU4 ABS SAP
Table 3-4 Estimating Maximum Area Examined for TEM Analysis of ABS Air Samples
ABS Scenario
Target Sensitivity
(cc)-1
Sample Duration
(min)
Sample Flow Rate
(L/min)
Air Volume
(L)
Estimated Number of
GOs Needed per Sample**
Estimated Area Examined (mm2) per
Sample 1 0.002 60 4 240 98 1.0 2 0.003 60 4 240 49 0.5 3 0.004 60 4 240 46 0.5 4 0.001 120 10 1200 29 0.3
5 – adult 0.005 60 4 240 31 0.3 5 – child 0.01 60 4 240 15 0.2 **Assumes direct preparation with an EFA of 385 mm2 and GOA of 0.01 mm2. ABS Scenario Descriptions: 1: Residents in yards 2: Residents in gardens 3: Child playing on driveway 4: Driving on Libby roads 5: Biking in Libby Definitions: TEM – transmission electron microscopy ABS – activity-based sampling L – liters GO – grid opening GOA mm2 – square millimeters cc-1 – per cubic centimeters
Summary of Stopping Rules Based on the discussions above, the stopping rules for this project should be as follows:
1. Count a minimum of two grid openings from each of two grids 2. Continue counting until one of the following is achieved: a. The target sensitivity is achieved b. 25 LA structures have been observed c. A total filter area of 1.0 mm2 has been examined (this is approximately 100
grid openings) When one of these criteria has been satisfied, complete the examination of the final grid opening and stop.

Section 3 Data Quality Objectives
3-18
OU4 ABS SAP
3.7.6 Refining the Study Design In accord with EPA’s DQO process, it is expected that the ABS program described in this document may be modified periodically as data are obtained. For example, the target analytical sensitivity may be either increased or decreased, depending on the detection frequency, mean values, and sample variability observed in initial samples results. Sampling durations and pump flow rates may be modified if a high frequency of filter overloading is reported. The design may also be revised if new methods for evaluating cancer or non-cancer effects are developed and approved for used by EPA.
4-1
OU4 ABS SAP
Section 4 Sampling Program This section provides the details related to the sampling program required to meet the DQOs (Section 3).
4.1 Pre-Sampling Activities Prior to beginning field sampling activities, a field planning meeting will be conducted, any required trainings will be conducted, and an inventory of equipment and supplies will be performed to ensure that all necessary supplies and equipment are available and in good working order. In addition, sampling locations will be identified, and community coordination will be conducted.
4.1.1 Field Planning Meeting The field planning meeting will be conducted by the assigned CDM field team leader (FTL) and attended by the field staff, a member of the CDM quality assurance (QA) staff, CDM sample coordinator, and a member of the CDM field health and safety staff. The EPA Remedial Project Manager will be notified of the meeting's date and time. The agenda will be reviewed and approved by the QA staff and the health and safety officer prior to the meeting. The meeting will briefly discuss and clarify the following:
Objectives and scope of the fieldwork
Equipment and training needs
Field operating procedures, schedules of events, and individual assignments
Required quality control (QC) measures
Health and safety requirements
Documents governing fieldwork that must be on site
Any changes in the field planning documents
A written agenda, reviewed by the CDM QA staff, will be distributed and an attendance list signed. Copies of these documents are maintained in the project files. Additional meetings will be held when required by the documents governing fieldwork or when the scope of the assignment changes significantly. The field team personnel will perform the following activities before and during field activities, as applicable:
Review and understand applicable governing documents
Ensure that all sample analyses are scheduled through the EPA laboratory coordinator (LC)
Section 4 Sampling Program
4-2
OU4 ABS SAP
Obtain required sample containers and other supplies
Obtain and check field sampling equipment
Obtain and maintain personal protective equipment (PPE)
4.1.2 Training Requirements Prior to starting work at the Libby field office, any new team member must complete the following, at a minimum:
Read the Comprehensive Site Health and Safety Program (CDM 2006) – documented on plan signature sheet and required reading report
Read the Libby Asbestos Project Health and Safety Plan (HASP) (CDM 2008a) – documented on plan signature sheet and required reading report
Read the HASP for 2010 OU4 ABS - documented on plan signature sheet and required reading report
Attend an orientation session with the Site health and safety officer – documented on orientation session attendance sheet
Read and understand all relevant governing documents – documented on required reading report
Occupational Safety and Health Administration 40-Hour Hazardous Waste Operations and Emergency Response (HAZWOPER) and relevant 8-hour refreshers – documented by training certificates
Current 40-hour HAZWOPER medical clearance
Respiratory protection training as required by 29 Code of Federal Regulations (CFR) 1910.134 – documented by training certificate
Asbestos awareness training as required by 29 CFR 1910.1001 – documented by training certificate
Sample collection techniques – documented on orientation session attendance sheet and/or field planning meeting agenda
All training documentation will be stored in the Libby project files.

Section 4 Sampling Program
4-3
OU4 ABS SAP
4.1.3 Inventory and Procurement of Equipment and Supplies The following equipment will be required for sampling activities, and any required equipment not already contained in the field equipment supply inventory will be procured prior to initiation of sampling activities:
Field logbook
Indelible ink pen
Digital camera
Video camera
Air sampling equipment: 25 millimeter (mm) diameter MCE filter cassette (0.8 µm pore), high and low flow rate battery-powered air sampling pumps, rotameter, tygon tubing
Soil sampling equipment: trowel and steel bowl
Field moisture meter
Activity-specific equipment: sampling backpack, 20–28 inch wide metal leaf rake, shovel, tarp, lawn mower, bicycle, bicycle trailer (child carrier), trowel, motorized garden tiller, etc.
Toughbook laptop equipped with Mobile Surveyor application (for completing forms/surveys)
Sample labels
Custody seals
Zip-top bags
PPE, as required by the HASP
Land survey or aerial photo
4.1.4 Identify Sampling Locations Prior to the start of field activities, sampling locations will be identified, and community coordination will be conducted. The property owner of each selected sampling location will be contacted to determine willingness to participate. Access agreements will be obtained prior to the start of sample collection. Property-specific information will be collected for each sampling location and recorded on the ABS Property Background and Sampling Form (Appendix C).
Section 4 Sampling Program
4-4
OU4 ABS SAP
Sampling locations will be selected based on the criteria listed in Section 3.7.1. The target number of sampling locations is depicted in Table 4-1. To the extent possible, the ten locations for Scenarios 1, 2, and 3 will be selected to provide an evenly distributed representation of OU4.
Individual properties may be used for a combination of Scenarios 1, 2, and 3.
4.2 Property Screening Prior to the start of field activities, each candidate property will be screened to determine if it meets the requirements detailed in Table 3-1. The following sections outline the property screening activities that will be performed.
For Scenario 1, Categories 2 and 3, properties will be selected from those where removal actions were completed prior to 2009. In general, Category 2 properties will be selected from the 2007-2008 removal seasons and Category 3 properties will be selected from the 2003-2006 removal seasons.
Screening will focus on the high traffic areas. Only the heavily used areas immediately surrounding the residence will be screened and included in the subsequent ABS air sampling. Limited use areas (i.e., overgrown, infrequently maintained) will not be included in the screening or sampling.
4.2.1 Soil Sample Collection During property screening activities, soil samples will only be collected from areas where polarized light microscopy (PLM) Bin B1 and B2 soils are expected (i.e., areas within Category 1 and 4 properties that have sample results indicating PLM Bin B1 and B2 from previous sampling). Soil samples previously collected from a targeted area that meets current sampling protocol (i.e., 30-point composite with visual vermiculite inspection) will be utilized, and those areas will not require sampling.
Soil samples will be collected and homogenized in accordance with the Site-specific standard operating procedure (SOP) CDM-LIBBY-05, Revision 2 (Soil Sample Collection at Residential and Commercial Properties [Appendix D]). In order to ensure that sufficient sample is available for potential future analysis, the mass of the composite sample must be no less than 2.0 kilograms.
4.2.2 Visual Inspection During property screening activities, a visual inspection will be completed at Scenario 1 properties with stipulations on the presence of visible vermiculite (i.e., Category 2 and 3), and all Scenario 2 and 3 properties. The visual inspection will be completed only within the area planned to be used during ABS activities. Properties selected for Category 3, Scenario 2, and Scenario 3 will represent a range of visible vermiculite, if possible.
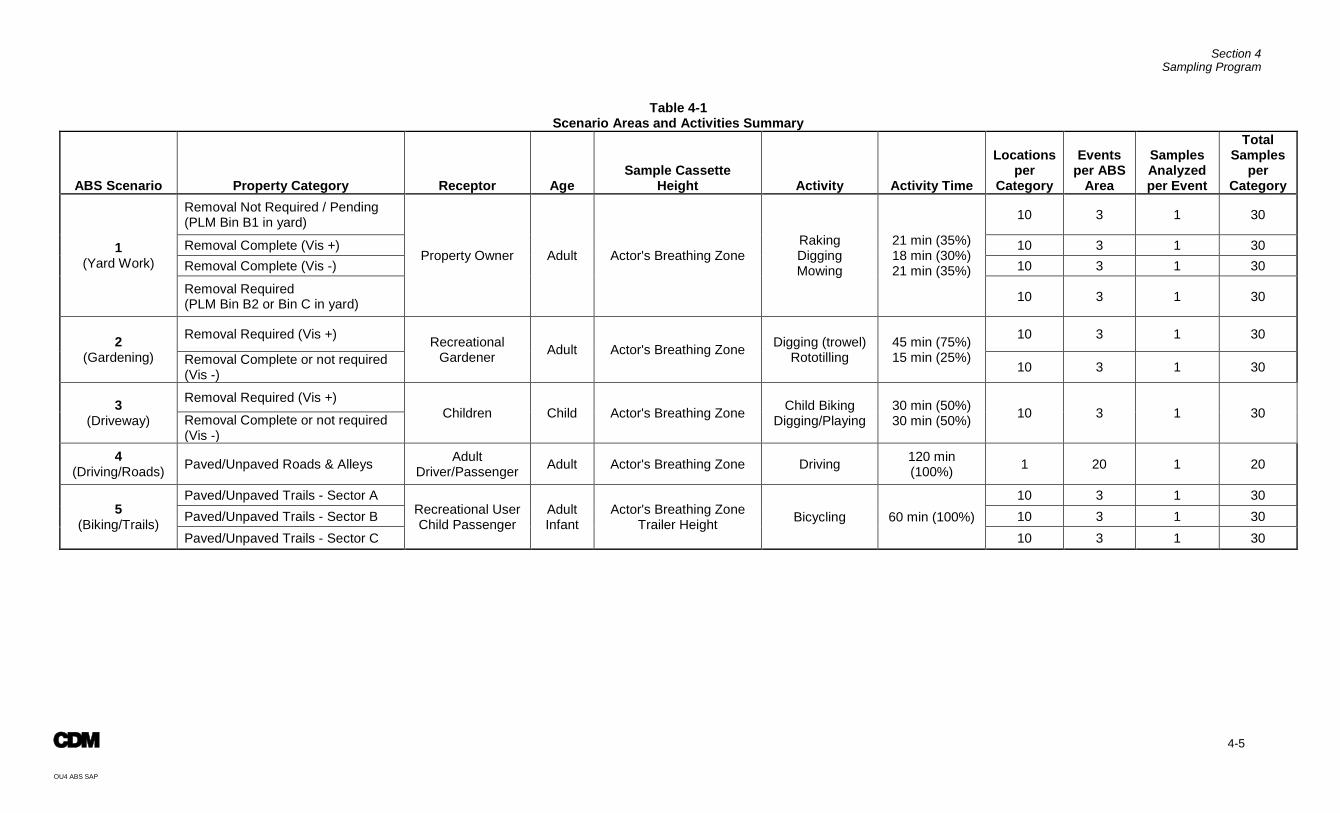
Section 4 Sampling Program
4-5
OU4 ABS SAP
Table 4-1 Scenario Areas and Activities Summary
ABS Scenario Property Category Receptor Age Sample Cassette
Height Activity Activity Time
Locations per
Category
Events per ABS
Area
Samples Analyzed per Event
Total Samples
per Category
1 (Yard Work)
Removal Not Required / Pending (PLM Bin B1 in yard)
Property Owner Adult Actor's Breathing Zone Raking Digging Mowing
21 min (35%) 18 min (30%) 21 min (35%)
10 3 1 30
Removal Complete (Vis +) 10 3 1 30 Removal Complete (Vis -) 10 3 1 30
Removal Required (PLM Bin B2 or Bin C in yard) 10 3 1 30
2 (Gardening)
Removal Required (Vis +) Recreational Gardener Adult Actor's Breathing Zone Digging (trowel)
Rototilling 45 min (75%) 15 min (25%)
10 3 1 30
Removal Complete or not required (Vis -) 10 3 1 30
3 (Driveway)
Removal Required (Vis +) Children Child Actor's Breathing Zone Child Biking
Digging/Playing 30 min (50%) 30 min (50%) 10 3 1 30 Removal Complete or not required
(Vis -) 4
(Driving/Roads) Paved/Unpaved Roads & Alleys Adult Driver/Passenger Adult Actor's Breathing Zone Driving 120 min
(100%) 1 20 1 20
5 (Biking/Trails)
Paved/Unpaved Trails - Sector A Recreational User Child Passenger
Adult Infant
Actor's Breathing Zone Trailer Height Bicycling 60 min (100%)
10 3 1 30 Paved/Unpaved Trails - Sector B 10 3 1 30 Paved/Unpaved Trails - Sector C 10 3 1 30
Section 4 Sampling Program
4-6
OU4 ABS SAP
All visual inspections will be completed in accordance with the Site-specific SOP CDM-LIBBY-06, Revision 1 (Semi-Quantitative Visual Estimation of Vermiculite in Soil [Appendix D]) with the following modifications:
The entire area will be inspected for visual vermiculite regardless of previous investigation results or removal activities.
The approximate location and level of any visible vermiculite will be documented on a field sketch that also details the location of each scenario area.
4.2.3 Property Screening Documentation - Sketches The ABS screening team will develop a sketch for each property screened as part of this SAP. A land survey, aerial photo or previously developed field sketch will be used as the baseline for each sketch. Property sketches will include visual inspection locations/results, soil sampling locations/results, and the approximate location of the ABS scenario area(s). Locations to be used for the digging activity in Scenario 1 will also be clearly noted on the property sketch.
Although sketches are not expected to be scaled drawings, the ABS screening team will estimate the percentage of the yard utilized in Scenario 1 that have differing visual, PLM or removal (i.e., clean fill) characteristics. This information will be documented in the field logbooks.
Example 1: Category 1 - 25% of yard is PLM-, Vis - and 75% of yard is PLM B1
Example 2: Category 2 - 75% of yard is clean fill, 25% is PLM-, Vis -
4.3 Sample Collection This section describes the sample collection procedures for air and soil.
4.3.1 Soil Sample Collection One 30-point composite soil sample will be collected from each scenario area during each of the three sampling events. Gravel alleys or unpaved roads that will be utilized during Scenarios 4 and 5 (Driving/Roads/Trails) will not be soil sampled. To represent scenario areas that span an entire yard, composite locations will be collected from the entire yard regardless of previous sampling activities and results. At least two aliquots will be collected from the pre-selected locations where the digging activities will occur.
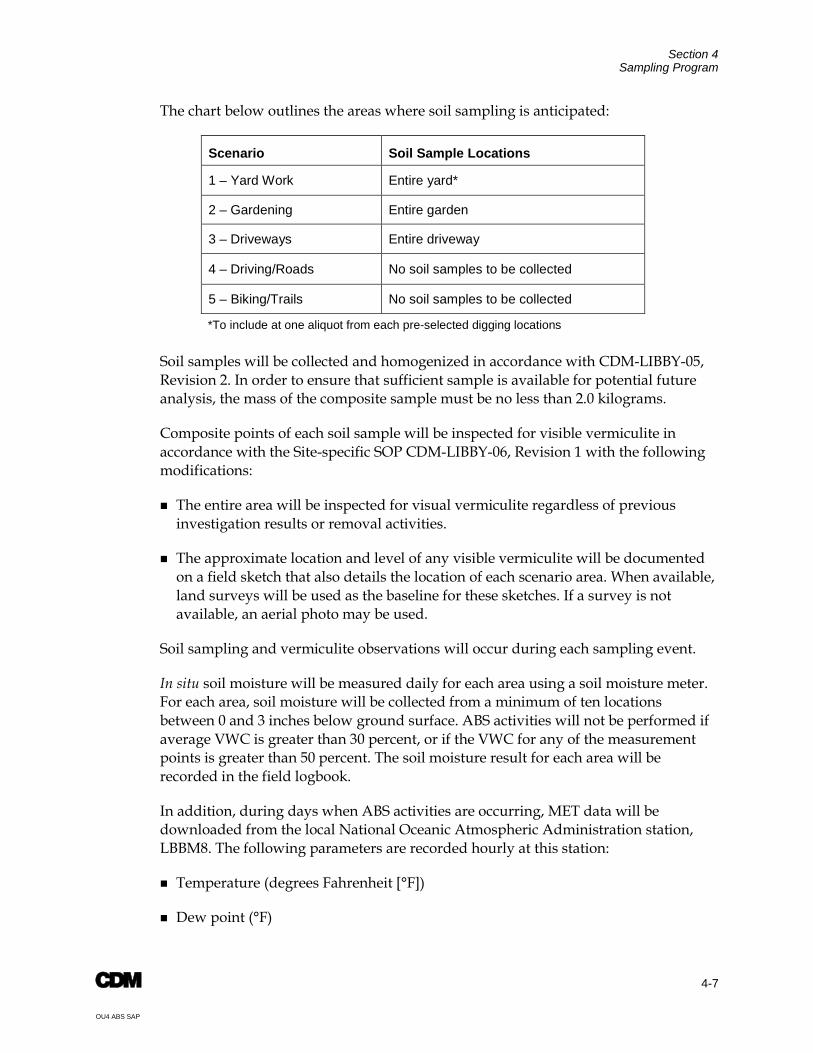
Section 4 Sampling Program
4-7
OU4 ABS SAP
The chart below outlines the areas where soil sampling is anticipated:
Scenario Soil Sample Locations
1 – Yard Work Entire yard*
2 – Gardening Entire garden
3 – Driveways Entire driveway
4 – Driving/Roads No soil samples to be collected
5 – Biking/Trails No soil samples to be collected
*To include at one aliquot from each pre-selected digging locations Soil samples will be collected and homogenized in accordance with CDM-LIBBY-05, Revision 2. In order to ensure that sufficient sample is available for potential future analysis, the mass of the composite sample must be no less than 2.0 kilograms.
Composite points of each soil sample will be inspected for visible vermiculite in accordance with the Site-specific SOP CDM-LIBBY-06, Revision 1 with the following modifications:
The entire area will be inspected for visual vermiculite regardless of previous investigation results or removal activities.
The approximate location and level of any visible vermiculite will be documented on a field sketch that also details the location of each scenario area. When available, land surveys will be used as the baseline for these sketches. If a survey is not available, an aerial photo may be used.
Soil sampling and vermiculite observations will occur during each sampling event.
In situ soil moisture will be measured daily for each area using a soil moisture meter. For each area, soil moisture will be collected from a minimum of ten locations between 0 and 3 inches below ground surface. ABS activities will not be performed if average VWC is greater than 30 percent, or if the VWC for any of the measurement points is greater than 50 percent. The soil moisture result for each area will be recorded in the field logbook.
In addition, during days when ABS activities are occurring, MET data will be downloaded from the local National Oceanic Atmospheric Administration station, LBBM8. The following parameters are recorded hourly at this station:
Temperature (degrees Fahrenheit [°F])
Dew point (°F)

Section 4 Sampling Program
4-8
OU4 ABS SAP
Relative humidity (percent)
Wind speed (miles per hour [mph])
Wind gusts (mph)
Wind direction
Solar radiation (watts per square meter per hour)
Precipitation (inches)
Extent of vegetative cover will be estimated at the start of each sampling event and will be recorded in the field logbook.
4.3.2 Air Sample Collection Sampling will occur over a 1-hour time interval for Scenarios 1, 2, 3, and 5 and will be repeated three times at each of the sampling locations. Repetitions will be conducted over a period of up to 10 weeks, with a minimum of 14 days between repetitions. Each time interval will be subdivided by the number of representative activities as detailed in Table 4-1. Scenario 4 will be conducted over a 2-hour time interval.
Personal air samples will be collected from EPA contractors who will perform activities in accordance with the scenario scripts provided in Appendix A. At each location selected for evaluation, one or two actors will engage in the prescribed activities in each of the scenario areas. Activities will be conducted in the order outlined in the scenario scripts (e.g., activities in the yard scenario will begin with raking, followed by digging, then finish with mowing).
Individual properties may meet the requirements of more than one property category and therefore multiple scenarios may be completed at those properties. No more than one activity will be conducted at any given time on one property, or adjacent properties. If multiple scenarios are being conducted at one property, the order of activities will proceed from the area of least contamination first.
SOP EPA-LIBBY-01, Revision 1 will be used for collection of personal air samples during this effort. A copy of this SOP is presented in Appendix D. All air samples will be collected using cassettes that contain a 25 mm diameter MCE filter with a pore size of 0.8 μm.
During Scenarios 1, 2, and 3, one participant will perform the scripted activities and will collect two personal air samples at two flow rates using two different types of pumps. The primary sample will be collected using battery-powered sampling pumps capable of operating at high flow rates. The specific model selected for this sampling event is the F&J L-15P personal Air Sampling Pump. The pump flow rate will be adjusted to 4 L/min, to result in sample volumes of at least 240 L. In addition, a battery-powered sampling pump capable of operating at low flow rates will be used
Section 4 Sampling Program
4-9
OU4 ABS SAP
to generate a backup air sample in the event the primary sample is damaged or overloaded. The specific model selected for this sampling event is SKC 224-PCXR4. The pump flow rate will be adjusted to 2 L/min, to result in sample volumes of at least 120 L.
During Scenario 4, one participant will perform the scripted activities and will collect two personal air samples. The primary sample will be collected utilizing a F&J DF-40L-8 pump adjusted to 10 L/min, while the backup sample will be collected utilizing the same pump and flow rates as the backup samples indicated above. Due to the duration of this activity, the resulting sample volumes will be 1200 L for the primary sample and 240 L for the backup sample.
During Scenario 5, two participants will don air monitors while performing the scripted activities. The personal air samples will be collected using the same battery-powered sampling pumps and flow rates indicated above. In addition, one bicycle will be fitted with a child carrier trailer. One primary sample will be collected from within the trailer using the F&J L-15P battery-powered high-flow sampling pump. The pump flow rate will be adjusted to 4 L/minute, to result in sample volumes of at least 240 L.
The air sampling pumps will be carried in backpacks worn by the participants or otherwise placed immediately next to the participant. The monitoring cassette will be affixed to the shoulder of the participant such that the cassette is within the breathing zone of the participant. The breathing zone can be visualized as a hemisphere approximately 6 to 9 inches around an individual's face.
The top cover from the cowl extension on the sampling cassette will be removed (i.e., open-face) and the cassette will be oriented face down. The participants will monitor the cassettes throughout the scenario to ensure that they remain directed towards the activity and are free of obstructions.
If it is necessary to relieve a participant in a scenario, a relief (backup) participant will be properly suited in time to make the exchange. When the relief participant is ready, the active participant will stop, remove the backpack, pass it to the relief participant, and assist the relief participant with donning and adjusting the backpack. The exchange is anticipated to take less than 60 seconds, so the sampling pumps and event time clock will not be halted during the exchange. If the exchange requires more than 60 seconds, the pump and event clock will be stopped until the activity is re-initiated. If the personnel exchange coincides with a scheduled flow rate verification (as described below), the total time must not exceed 120 seconds.
Section 4 Sampling Program
4-10
OU4 ABS SAP
Health and Safety Air Monitoring As part of this investigation, personal air samples will also be collected on the first three days of sampling for ongoing health and safety monitoring. The health and safety samples will be collected using an additional low volume sampling pump and are not intended for use in the risk assessment. To differentiate these samples from the other personal air samples collected as part of this sampling effort, "PCM" will be used in the Sample Location Description field of the electronic field sample data sheet (eFSDS). These samples will be collected and analyzed in accordance with the Response Action SAP, Revision 1 (CDM 2008b) and will represent both the time-weighted average and excursion sampling periods.
4.3.3 Pump Calibration Each air sampling pump will be calibrated at the start of each day's sampling period using a rotometer that has been calibrated to a primary calibration source. The primary calibration standard used at the Site is a Bios DryCal® DC-Lite. For pre-sampling purposes, calibration will be considered complete when ±5 percent of the desired flow rate is attained, as determined by three measurements with the calibrator using a cassette reserved for calibration (from the same lot of the sample cassettes to be used in the field).
Pump flow rates will be verified at 60-minute intervals or when participants are relieved from an activity by a backup participant, whichever occurs sooner. If at any time the observed flow rates are ±10 percent of the target rate, the sampling pump should be re-calibrated, if possible. If at any time an air sampling pump is found to have faulted or the observed flow rates are 25 percent below (due to heavy particulate loading or a pump malfunction) or 50 percent above the target rate, the pump will be replaced or the activity will be terminated. Collection of air samples will continue, regardless of the amount of particulate loading on the filters, unless the flow rate is affected. At the beginning of the sampling program, flow rates and particulate loading may be checked more frequently as conditions require, establishing expected conditions.
For post-sampling calibration, three separate constant flow calibration readings will be obtained with the sampling cassette inline and those flow readings will be averaged. If the flow rate changes by more than 5 percent during the sampling period, the average of the pre- and post-sampling rates will be used to calculate the total sample volume.
Samples for which there is more than a 30 percent difference from initial calibration to end calibration will be invalidated. The sample collector will record the pump serial number, sample number, initial flow rate, sample start/end times, sample locations, and final flow rate, as well as mark the sample "void," in the field logbook and eFSDS. These samples will not be submitted for analysis.
Section 4 Sampling Program
4-11
OU4 ABS SAP
To prevent potential cross-contamination, each rotameter used for field calibration will be transported to and from each sampling location in a sealed zip-top plastic bag. The cap and calibration cassette used at the end of the rotameter tubing will be replaced each morning after it is used.
4.4 General Processes This section describes the general field processes that will be used to support the sampling described in this SAP and includes references to CDM SOPs and investigation-specific modifications to established project procedures when applicable.
4.4.1 Sample Labeling and Identification Samples will be labeled with sample identification (ID) numbers supplied by field administrative staff, and will be signed out by the sampling teams (i.e., controlled). For air samples, one sample label will be placed on the sampling cassette, one sample label will be affixed to the inside of the plastic bag used to hold the sampling cassette during transport. In addition, the sample ID number will also be written on the outside of the plastic bag. For soil samples, the labels will be affixed to both the inner and outer sample bags and the sample ID number will be written on the outside of each bag.
Sample ID numbers will identify the samples collected during this sampling effort by having the following format:
EX-10###
where:
EX = Exterior ABS
10### = A sequential five-digit number (starting with 10 to correlate samples collected under this 2010 SAP)
4.4.2 Field Logbooks Field logbooks will be maintained in accordance with CDM SOP 4-1, Field Logbook Content and Control (Appendix D). The log is an accounting of activities at the site and will duly note problems or deviations from the governing plans and observations related to the SAP. Notations on the following will be recorded daily:
Project
Logbook number
Property owner
Address
Section 4 Sampling Program
4-12
OU4 ABS SAP
Date
Author
Title of guidance document(s)
Activities/purpose
Personnel onsite
Weather
PPE
Serial number(s) of equipment
Calibration of equipment performed
Initial/final flow rates and times
Sample ID(s)
Sample location(s)
Pre-sampling vegetative condition
Soil moisture
Samples were relinquished
Deviations from guidance documents
Direction received from FTL or government personnel
Field logbooks will be completed daily prior to leaving the site. As described in CDM SOP 4-1, logbook corrections will be completed with a single line strikeout, initial, and date. The correct information should be entered in close proximity to the erroneous entry.
The field administrative staff will manage the logbooks by assigning unique ID numbers to each logbook, tracking who each logbook was assigned to, the investigation activities to be recorded in each logbook, the date the logbook was signed out, and the date the logbook was returned. As logbooks are completed, originals will be maintained in the CDM office in Libby, Montana. Copies of logbooks will be provided to EPA and SRC, Inc. (SRC) via project e-room within one week after completion of the ABS program.
Section 4 Sampling Program
4-13
OU4 ABS SAP
4.4.3 Field Sample Data Sheets eFSDSs, which record specifics related to sample collection, will be completed for each sample in accordance with CDM-LIBBY-15.
4.4.4 Photographic Documentation Photographs will be collected to document representative examples of ABS scenarios performed, sampling locations and site conditions during ABS activities, pre-sampling conditions of vegetation, and at any other location the field sampling personnel determine necessary, with a digital camera in accordance with CDM SOP 4-2, Photographic Documentation of Field Activities with the following exceptions.
Digital photographs will be archived on the CDM Libby Server (secure) with nightly backup. These files will be archived until project closeout, at which point project management will determine a long-term electronic file storage system. Electronic captions will be used to describe the photographs instead of maintaining photographic logs in daily logbook entries.
Photograph file names will be in the format:
Address_EXABS_date
where:
EXABS indicates Exterior ABS
The date is formatted as MM-DD-YY
4.4.5 Videographic Documentation A digital video will be prepared to document a representative example of ABS scenarios at locations and will include any special conditions or circumstances that arise during the activity. File names will be in the same format as photographic documentation listed above.
4.4.6 GPS Point Collection Global positioning system (GPS) location coordinates will be collected for soil samples, and digging locations in accordance with Site-Specific SOP CDM-LIBBY-09; GPS Coordinate Collection and Handling (Appendix D). General procedures used for GPS point collection are discussed below:
For composite soil samples, a GPS point is collected at the approximate center of each sample area. In the case of an irregularly shaped sample area or sample area that is non-continuous, such as a flowerbed that wraps around a house, a GPS point is collected at the center of the largest continuous sample area.
Section 4 Sampling Program
4-14
OU4 ABS SAP
For discrete digging sub-locations, a GPS point will be logged as an "interest point" and include the location ID number, address, and description in the comments field.
GPS data are not collected for the following types of samples:
Soil duplicates – the same location ID number is used for the parent and the field duplicate samples, resulting in the same X, Y coordinates.
Personal air samples – the locations for these samples are the same coordinates assigned to the property where the samples were collected.
To ensure proper collection of GPS data, the following criteria have been established at the site for data with accuracy to ±1 meter:
The operator of the GPS unit must be standing at the sample location before the data collection begins.
Once the unit begins collection of location data, the operator must remain standing at the sample location until the minimum required data points have been collected.
A minimum of 30 data points must be collected at each XY coordinate.
GPS collection is completed when the position dilution of precision (PDOP) is less than 4.5.
GPS data collected as part of the driving scenario (i.e., Scenario 4) will be provided to EPA and SRC within one week of collection. This data will be provided electronically, placed in the project e-room.
4.4.7 Field Equipment Maintenance Field equipment maintenance will be conducted and documented as described in CDM SOP 5-1, Control of Measurement and Test Equipment (Appendix D).
When a piece of equipment is found to be operating incorrectly, the piece of equipment will be labeled out-of-order and placed in a separate area from the rest of the sampling equipment. The person who identified the equipment as out-of-order will notify the FTL overseeing the investigation activities. It is the responsibility of the FTL to facilitate repair of the equipment. This may include having appropriately trained field team members complete the repair or shipment to the manufacturer.
4.4.8 Equipment Decontamination Decontamination of activity-specific equipment, air sampling pumps, and soil sampling equipment will be conducted in accordance with CDM SOP 4-5, Field Equipment Decontamination at Non-Radioactive Sites (Appendix D), with the following exceptions:
Section 4 Sampling Program
4-15
OU4 ABS SAP
Section 4.0, Required Equipment - Plastic sheeting will not be used during decontamination procedures. American Society for Testing and Materials (ASTM) Type II water will not be used. Rather, locally available de-ionized water will be used.
Section 5.0, Procedures - Decontamination water will not be captured and will be discharged to the ground at the worksite.
Section 5.3, Sampling Equipment Decontamination – Sampling equipment that has been decontaminated will not be wrapped in plastic sheeting or aluminum foil. As stated in CDM SOP 4-5, Section 5.0, all equipment will be decontaminated before and after use (i.e., rinse with locally available de-ionized water).
Section 5.6, Waste Disposal - Decontamination water will not be captured and will not be packaged, labeled, or stored as investigation derived waste (IDW). Decontamination water will be discharged to the ground at the worksite.
Materials used in the decontamination process will be disposed of as IDW as described below.
4.4.9 Handling IDW Any disposable equipment or other investigation-derived waste (IDW) will be handled in accordance with CDM SOP 2-2, Guide to Handling of IDW (Appendix D), with the following modification:
Section 5.2, Offsite Disposal – All IDW (not including excess soil volume) will be collected in transparent garbage bags and marked “IDW” with an indelible ink marker. These bags will be deposited into the asbestos contaminated waste stream for appropriate disposal at the local landfill. Excess soil volume will be returned to the use area from where it was collected.
4.4.10 Field Sample Custody and Documentation Sample custody and documentation will follow the requirements specified in CDM SOP 1-2, Sample Custody (Appendix D) with the following clarifications:
5.1 Transfer of Custody and Shipment –
A chain of custody (COC) record will not be completed in the field. Initial sample custody will be documented through the collection of sample information using eFSDS or hard copy FSDS, along with a physical sample.
Sample labels/tags will be limited to a unique sample ID, which will be clearly indicated using pre-printed labels or handwritten on the zip-top sample bag for air samples, and both the inner and outer zip-top bag for soil samples.
Sampling teams will securely place a custody seal on each individual sample.
Section 4 Sampling Program
4-16
OU4 ABS SAP
All teams will ensure that samples, while in their possession, are maintained in a secure manner to prevent tampering, damage, or loss.
Whether sample information is collected electronically in the field or data-entered using hard copy FSDSs, field teams will follow the steps outlined in CDM-LIBBY-15 to synchronize sample information with the CDM’s Libby Central Server. Once data synchronization is complete, field teams can then relinquish samples directly to sample coordination staff or to a designated secure sample storage location. Once samples are received/retrieved, sample coordination staff will cross reference electronic sample IDs (from eFSDSs) with those on the physical samples, and will ultimately produce COC records and prepare the samples for transfer or shipping, as discussed in Sections 4.3.11 and 4.3.12.
4.4.11 Chain-of-Custody Records For the Libby project, the COC record is employed as physical evidence of sample custody and condition from the sample coordination team to the receiving facility. A completed COC record is required to accompany each batch of samples, whether it is hand-delivered to the EPA LC or shipped to a processing or analytical facility.
The sample coordination team will produce COC records in accordance with CDM-LIBBY-15. Only quality-checked sample information will be used for COC records. In the event that electronic systems are unavailable (e.g., due to a power outage), hard copy COC records will be employed. Any hard copy COC records will be data-entered as soon as electronic systems are back online.
For hand-deliveries, a sample coordinator will relinquish samples and corresponding COC records to the EPA LC under strict custody. During relinquishment, the sample coordinator will complete the following information in the designated spaces at the bottom of the COC record: signature, company name, date, and time. The EPA LC will also complete the required information and will make a note regarding sample condition (e.g., OK – accept). The sample coordinator will retain the bottom copy of the COC record for the CDM’s project record.
4.4.12 Sample Packaging and Shipping Samples will be packaged and shipped in accordance with CDM SOP 2-1, Packaging and Shipping of Environmental Samples (Appendix D) with the following modifications:
1.4 Required Equipment – Vermiculite (or other absorbent material) or ice will not be used for packaging or shipping samples.
1.5 Procedures – No vermiculite or other absorbent material will be used to pack the samples. No ice will be used.
Section 4 Sampling Program
4-17
OU4 ABS SAP
Samples will be hand-delivered to the EPA LC, picked up by a delivery service courier, or shipped by a delivery service to the designated facility or laboratory, as applicable. For hand-deliveries, the sample coordinator will package samples for transit such that they are contained and secure (i.e., will not be excessively jostled). Clean plastic totes with the lids secured or sample coolers may be used for this purpose.
For samples requiring shipment, prior to sealing the shipping container, the sample coordinator will complete the following information in the designated spaces at the bottom of the COC record: signature, company name, date, and time. The sample coordinator will retain the bottom copy of the COC record for the CDM’s project record.
4.5 Quality Assurance/Quality Control Activities 4.5.1 Modification Documentation All deviations from this SAP and associated guidance documents will be recorded on the Libby Asbestos Project Record of Modification Form for Field Activities. The modification form will be used to document all permanent and temporary changes to procedures contained in guidance documents governing investigation work. In addition, the Record of Modification Form will be used to document any information of interest as requested by EPA project management. As field modifications to governing documents are implemented, the FTL will communicate the changes to the field teams conducting activities associated with the modification. When the EPA project management team determines the need, revised governing documents may be issued to incorporate modifications.
Field modification forms are completed by the FTL overseeing the investigation. Once a form is completed, a technical review is completed by the CDM project manager or designate, and then reviewed and approved by the EPA project leader or designate.
A record is kept to track the person who completed each form and a brief description of the modification documented on each form. Each completed modification form is assigned a unique ID number and maintained at the CDM office in Libby, Montana by a QA staff member.
4.5.2 Field Surveillances and Audits The quality of field processes is evaluated by field surveillances and audits conducted by CDM and/or EPA. This section describes each of these evaluations.
Field surveillances consist of periodic observations made to evaluate continued adherence to investigation-specific governing documents. Field surveillances are conducted for each investigation conducted at the Site, and are most often performed by the CDM investigation field manager (IFM) or investigation assigned FTL.
Section 4 Sampling Program
4-18
OU4 ABS SAP
The schedule for performing field surveillances is dependent on the duration of the investigation, frequency of execution, and magnitude of process changes. At a minimum, field surveillances will be performed daily during the first week of implementation. Following the first week, surveillances will be conducted once a month or as necessary when field processes are revised or other QA/QC procedures indicate potential deficiencies.
When deficiencies are observed during the surveillances, the observer will immediately discuss the observation with the field team member and retrain the team member if required. If the observer finds deficiencies across multiple field members or teams, the IFM or FTL will plan and hold an investigation-specific field meeting. At this meeting the observations made will be discussed as well as any corrective actions required (i.e., retraining).
The observer will document that surveillances have occurred in the appropriate field logbook. The logbook will also be used to record any field meetings that were conducted including topics discussed, person conducting the meeting, and field team members attending the meeting.
Field audits are broader in scope than surveillances and are independent evaluations conducted by qualified technical or QA staff that are independent of the activities audited. Field audits can be conducted by CDM, internal EPA staff, or EPA contracted auditors. A field audit (to be combined with an audit of other Site field/sampling activities) is anticipated for this ABS field work.
4.5.3 Field QC Samples Field QC samples will be collected for air and soil samples as described below. It is expected that drying air sample cassettes will not be required for this activity given the low relative humidity conditions in which sampling will take place. Table 4-2 summarizes the collection frequency for these QC samples and indicates corrective actions that may be required based on their results.
Lot Blanks – Before air samples are collected, cassette lot blanks from each filter lot will be randomly selected and submitted for analysis at a minimum frequency of one lot blank per 500 cassettes. The lot blanks will be analyzed for asbestos fibers by the same method as will be used for field sample analysis. The entire batch of cassettes will be rejected if any asbestos fiber is detected on the lot blanks. Only lots of filters with acceptable lot blank results are placed in the general supply area for use by project personnel.
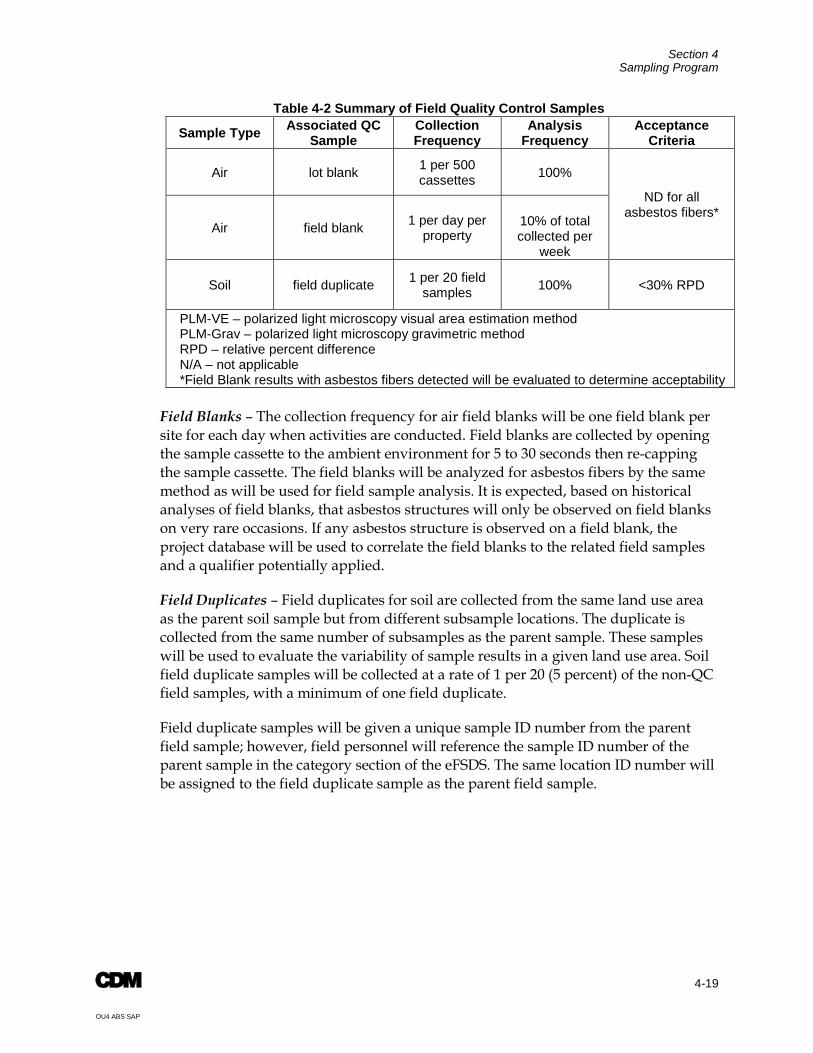
Section 4 Sampling Program
4-19
OU4 ABS SAP
Table 4-2 Summary of Field Quality Control Samples
Sample Type Associated QC Sample
Collection Frequency
Analysis Frequency
Acceptance Criteria
Air lot blank 1 per 500 cassettes 100%
ND for all asbestos fibers*
Air field blank 1 per day per property
10% of total collected per
week
Soil field duplicate 1 per 20 field samples 100% <30% RPD
PLM-VE – polarized light microscopy visual area estimation method PLM-Grav – polarized light microscopy gravimetric method RPD – relative percent difference N/A – not applicable *Field Blank results with asbestos fibers detected will be evaluated to determine acceptability
Field Blanks – The collection frequency for air field blanks will be one field blank per site for each day when activities are conducted. Field blanks are collected by opening the sample cassette to the ambient environment for 5 to 30 seconds then re-capping the sample cassette. The field blanks will be analyzed for asbestos fibers by the same method as will be used for field sample analysis. It is expected, based on historical analyses of field blanks, that asbestos structures will only be observed on field blanks on very rare occasions. If any asbestos structure is observed on a field blank, the project database will be used to correlate the field blanks to the related field samples and a qualifier potentially applied.
Field Duplicates – Field duplicates for soil are collected from the same land use area as the parent soil sample but from different subsample locations. The duplicate is collected from the same number of subsamples as the parent sample. These samples will be used to evaluate the variability of sample results in a given land use area. Soil field duplicate samples will be collected at a rate of 1 per 20 (5 percent) of the non-QC field samples, with a minimum of one field duplicate.
Field duplicate samples will be given a unique sample ID number from the parent field sample; however, field personnel will reference the sample ID number of the parent sample in the category section of the eFSDS. The same location ID number will be assigned to the field duplicate sample as the parent field sample.
5-1
OU4 ABS SAP
Section 5 Processing Facility and Laboratory Operations This section discusses the analytical, custody and documentation, QA/QC, and data management requirements to be employed by processing facilities and laboratories (herein referred to as facilities) in support of ABS activities.
EPA will be responsible for all sample analysis, including any sample processing prior to analysis. CDM will be responsible for relinquishing all samples to the EPA LC, or facility as designated by the EPA LC. The CDM sample coordinator will also be responsible for communicating with the EPA LC to relay pertinent sample and analysis information including sample quantities; special sample handling requirements, processing, or analysis concerns; and requested turnaround times.
For this investigation, all samples will be maintained via COC record, as produced by the CDM sample coordinator. An approved summary sheet specifying the preparation and analytical requirements for samples collected as part of this investigation will be attached to the COC record for all samples submitted. The summary sheet will be distributed by EPA, and reviewed and approved by all participating laboratories prior to any sample handling. The investigation-specific summary sheet (unapproved) is provided in Appendix E.
5.1 Soil Samples ABS soil samples may be analyzed by three different analytical methods: 1) TEM of air filters generated from fluidized bed using OEAFIELDSOP-102, Revision 0.0 (EPA 2010b); 2) PLM-VE in accordance with SRC-LIBBY-03, Revision 2 (SRC 2008); or 3) PLM using stereomicroscopic examination and gravimetric evaluation (PLM-Grav) in accordance with SRC-LIBBY-01, Revision 2 (SRC 2004).
Each analytical method requires different sample preparation techniques, as described below:
1. All soil samples will be dried as detailed in ISSI-LIBBY-01, Revision 10 (SRC 2007). To avoid burning/ashing of the soil samples during the drying process, the soil samples will be visually screened before they are loaded into the oven. Samples that appear to have elevated organic matter (i.e., a significant amount of wood chips/bark) pose a risk of igniting during the drying process. Therefore, once ten samples have been identified as elevated organic matter samples, they will be batched together and dried at 50 degrees Celsius. The samples will be checked every 4 hours to ensure that they are not burning.
2. Each sample will be split into three approximately equal portions: 1) archive; 2) fluidized bed aliquot; and 3) PLM-VE and PLM-Grav aliquot.
3. The archive aliquot will be stored in accordance with ISSI-LIBBY-01, Revision 10.
Section 5 Processing Facility and Laboratory Operations
5-2
OU4 ABS SAP
4. The fluidized bed aliquot will be prepared for analysis as follows:
a. Assemble the sieves: using 8-inch sieves (brass or steel) with two opening sizes (6.3 mm and 0.85 mm [U.S. Standard Sieve No. 20]), set up the receiver pan and lid so that the pan with the largest opening is on top and the collection pan is on the bottom.
b. Put the sample in the sieve; put the lid on the top sieve and shake the sieves back and forth.
c. Use the material collected in the bottom pan as the sample.
d. Archive any material retained on the sieves.
e. Wipe or brush off any visible material on sieves or pans under a ventilation hood prior to decontamination.
f. Decontaminate used sieves and pans between sieving exercises under the ventilation hood using a wet wash and high-efficiency particulate air vacuum to dry and remove any residual material left on the sieves or pans. Decontaminate used sieves and pans between each sample.
g. A sieving blank will be created after every tenth sample. This sample will be analyzed by fluidized bed and PLM-VE.
5. The PLM-VE and PLM-Grav aliquots will be prepared using ISSI-LIBBY-01, Revision 10 and the procedures included in the Soil Preparation Work Plan (TechLaw 2007). In brief, the PLM-VE/Grav aliquot is sieved into coarse (greater than ¼ -inch) and fine fractions. The fine fraction is ground to reduce particles to a diameter of 250 microns (µm) or less; this fine-ground portion is then split into four aliquots.
One aliquot of the fine-ground sample will be analyzed for asbestos using PLM-VE in accordance with SRC-LIBBY-03, with all applicable project-specific laboratory modifications (e.g., LB-000073). If there is a coarse fraction of the sample, it will be analyzed for asbestos using PLM-Grav in accordance with SRC-LIBBY-01. PLM-VE and PLM-Grav results will be recorded on the most current version of the project-specific PLM laboratory bench sheets and electronic data deliverable (EDD) spreadsheets. Details of the analytical requirements for the air filters resulting from the fluidized bed preparation will be provided at a later date (i.e., following completion of the fluidized bed method evaluation studies). The analysis request section of the COC record will indicate the requested analyses (e.g., fluidized bed, PLM-VE/PLM-Grav). It is the responsibility of the soil preparation facility to specify the appropriate analytical method as it corresponds to the specific sample fraction being submitted for analysis (i.e., PLM-VE for fine-ground fractions or PLM-Grav for coarse fractions) on their COC records to the analytical laboratory.
Section 5 Processing Facility and Laboratory Operations
5-3
OU4 ABS SAP
5.2 Air Samples The high volume personal air samples collected as part of this investigation will be submitted for asbestos analysis using TEM in accordance with ISO 10312 counting protocols (ISO 1995), with all applicable project-specific laboratory modifications. These modifications include the most recent versions of LB-000019, LB-000028, LB-000029, LB-000030, LB-000031, LB-000053, LB-000066, LB-000084, and LB-000085. All asbestos structures (including not only LA but all other asbestos types as well) that have appropriate selective area electron diffraction patterns and energy dispersive x-ray analysis spectra, and having length greater than or equal to 0.5 µm and an aspect ratio (length:width) greater than or equal to 3:1, will be recorded on the most current version of the project-specific TEM laboratory bench sheet and EDD spreadsheet.
The personal air samples collected for the ongoing health and safety monitoring will be analyzed in accordance with the Response Action SAP, Revision 1 (CDM 2008b), as indicated by the COC record and corresponding Analytical Requirements Summary #LIBRA0408 (see also Appendix E).
5.2.1 TEM Analytical Sensitivity/Stopping Rules 5.2.1.1 Field Samples For field samples, a minimum of two grid openings in each of two grids must be examined. Analysis should continue until one of the following is achieved:
The ABS scenario-specific target sensitivity is reached):
ABS Scenario 1: 0.002 cc-1 ABS Scenario 2: 0.003 cc-1 ABS Scenario 3: 0.004 cc-1 ABS Scenario 4: 0.001 cc-1 ABS Scenario 5: 0.005 cc-1 (adult); 0.01 cc-1 (trailer)
25 countable LA structures are observed.
An area of 1.0 mm2 of filter is examined (this is approximately 100 grid openings).
When one of these goals is achieved, complete the final grid opening and stop.
5.2.1.2 Field Blanks and Lot Blanks For field blanks and lot blanks, count an area of 0.1 mm2 (approximately 10 grid openings) and stop.
5.3 Prioritization of Air Sample Analysis As described in Section 3.7, whenever possible, the filter from the high flow pump (e.g., 4 L/min) should be selected for analysis. In cases where the high flow filter is overloaded or is damaged, the low flow filter should be analyzed. Unanalyzed samples will be archived and maintained under COC record at the CDM Libby office.
Section 5 Processing Facility and Laboratory Operations
5-4
OU4 ABS SAP
Once analyzed, all samples will be archived under COC record at the laboratory until further notice.
5.4 Holding Times For the samples specified for collection in this SAP, no holding time requirements will be employed.
5.5 Custody Procedures Custody procedures are provided in the respective QA management plans for each facility that processes or analyzes Libby samples. These plans were independently audited and found to be satisfactory by EPA’s facility audit team.
Upon receipt at the facility, each sample shipment will be inspected to assess the condition of the shipment and the individual samples. This inspection will include verifying sample integrity. The accompanying COC record will be cross-referenced with all of the samples in the shipment. The facility sample custodian will sign the COC record and maintain a copy for their project files. For laboratory work, the original COC record will be appended to the hard copy data report. Next, the sample custodian may assign a unique laboratory number to each sample on receipt. This number will identify the sample through all further handling and reporting at the facility. It is the responsibility of each facility to maintain internal documentation throughout sample preparation, analysis, data reporting, and sample archiving.
5.6 Facility QA/QC 5.6.1 General QA/QC procedures are provided in the respective QA management plans for each facility that processes or analyzes Libby samples. The Libby Asbestos Project facility QA program may consist of laboratory certifications, team training and mentoring, analyst training, facility QC samples, interlaboratory sample analysis, and facility audits. Laboratories that analyze field samples on the Libby project must maintain particular certifications and must satisfactorily complete project-specific training requirements to ensure that proper QA/QC practices are conducted during sample analysis.
Facilities handling samples collected as part of this investigation will be provided a copy of and will adhere to the requirements of this SAP. Samples collected under this SAP will be analyzed in accordance with standard EPA and/or nationally-recognized analytical procedures (i.e., Good Laboratory Practices) in order to provide analytical data of known quality and consistency.
Section 5 Processing Facility and Laboratory Operations
5-5
OU4 ABS SAP
5.6.2 Facility QC Samples For this investigation, required QC samples specific to sample processing or analysis are:
For soil sample preparation by ISSI-LIBBY-01, Revision 10 – Soil Preparation Work Plan (TechLaw 2007)
For PCM, TEM, PLM, and fluidized bed methods – see Summary of Preparation and Analytical Requirements for Asbestos (provided in Appendix E)
5.7 Facility Documentation and Reporting As previously mentioned, it is the responsibility of each facility to maintain logbooks and other internal records throughout the sample lifespan as a record of sample handling procedures.
Significant deviations (i.e., those that impact or have the potential to impact investigation objectives) from this SAP, or any procedures referenced herein governing ABS sample handling, will be discussed with the OU4 EPA Remedial Project Manager (or technical designate) and CDM FTL prior to implementation. Such deviations will be recorded on the Libby Asbestos Project Record of Modification Form specific to field, preparation facility, or laboratory activities, as applicable. As modifications are approved by EPA and implemented, the EPA LC will communicate the changes to the EPA laboratories. Approved Modification forms will be maintained by the submitting party.
Sample processing and analytical data will be delivered to EPA in accordance with the current version of the EPA Data Management Plan (EPA 2010c).
5.8 Laboratory Nonconformance Laboratories will immediately notify the EPA LC if major problems occur (e.g., catastrophic equipment failure). The EPA LC will then notify the CDM sample coordinator of potential impacts to turnaround times. Other nonconformance issues, such as those found during performance evaluations or audits, will be addressed on a case-by-case basis by EPA’s facility audit team.
6-1
OU4 ABS SAP
Section 6 Assessments and Oversight Assessments and oversight reports to management are necessary to ensure that procedures are followed as required and that deviations from procedures are documented. These reports also serve to keep management current on field activities. Assessment, oversight reports, and response actions are discussed below.
6.1 Assessments Performance assessments are quantitative checks on the quality of a measurement system and are appropriate to analytical work. Performance assessments for the laboratories may be accomplished by submitting blind reference material (i.e., performance evaluation samples). These assessment samples are samples with known concentrations that are submitted to the laboratories without identifying them as such to the laboratories. Performance assessments will be coordinated by EPA.
System assessments are qualitative reviews of different aspects of project work to check the use of appropriate QC measures and the general function of the QA system. Field and office system assessments will be performed under the direction of CDM’s QA director, with support from CDM’s project QA coordinator. Quality Procedure 6.2, as defined in CDM’s QA Manual (CDM 2007), defines requirements for conducting field and office system assessments. Due to the level of effort for sampling and the duration of the activities discussed in this SAP, a field audit will be required and scheduled for the efforts described in this SAP. Laboratory system assessments/audits will be coordinated by EPA.
6.2 Corrective Actions Corrective actions will be implemented on a case-by-case basis to address quality problems. Minor actions taken in the field to immediately correct a quality problem will be documented in the applicable field logbook and a verbal report will be provided to CDM’s project manager and/or site manager. Major corrective actions taken in the field will be approved by the OU4 EPA Remedial Project Manager and CDM’s project manager prior to implementation of the change. Major response actions are those that may affect the quality or objective of the investigation. Quality problems that cannot be corrected quickly through routine field procedures may require implementation of a corrective action request (CAR) form, as provided in CDM’s QA Manual (CDM 2007).
All CARs will be submitted to either CDM’s QA director or project QA coordinator for review and issuance. CDM’s project manager or project QA coordinator will notify their QA director when quality problems arise that may require a CAR. CAR forms will be completed according to Quality Procedure 8.1 of CDM’s QA Manual (CDM 2007).
Section 6 Assessments and Oversight
6-2
OU4 ABS SAP
In addition, when modifications to this SAP are required, either for field or laboratory activities, a Libby Asbestos Project Record of Modification Form (Appendix F) must be completed.
6.3 Reports to Management QA reports will be provided to management for routine audits and whenever quality problems are encountered. Field staff will note any quality problems on eFSDSs or in field log notes. Further, CDM’s project manager will inform the project QA coordinator upon encountering quality issues that cannot be immediately corrected. Weekly reports and change request forms are not required for work performed under this SAP.
7-1
OU$ ABS SAP
Section 7 Data Review and Validation Laboratory results will be reviewed and verified for compliance with project reporting requirements. Data review and verification, and DQO reconciliation are discussed in Sections 7.1 and 7.2, respectively.
7.1 Data Review and Verification Requirements Data review (i.e., QC review) to be performed by designated CDM staff includes cross-checking that sample IDs and sample dates have been reported correctly on the preliminary laboratory report, and that calculated analytical sensitivities or detection levels are as expected. EPA will be responsible for reviewing all analytical data deliverables prepared for samples collected as part of this SAP, and coordinating with the laboratory for corrections and re-issuances of data reports.
Data verification includes checking that results have been transferred correctly from laboratory data printouts to the finalized laboratory report and to the EDD, and that both the laboratory report and EDD are complete before they are submitted to EPA. This function is performed primarily as a function of built-in QC checks in the project database (managed by EPA) when data is uploaded. As a result, data users may be the first personnel to encounter discrepancies. If discrepancies are found, the data user will contact EPA, who will then notify the appropriate laboratory in order to correct the issue.
7.2 DQO Reconciliation The DQOs presented in Section 3 will be reconciled during the data review process. During this process, the CDM team members will compare the reported results against the project-specific action levels discussed in the DQOs. Attainment of project DQOs results in determining what areas do or do not contain LA and/or LA source materials for development of property-specific removal action work plans. Non-attainment of project DQOs may result in additional follow up visits to the property for additional sample collection or field observations in order to achieve DQOs.
8-1
OU4 ABS SAP
Section 8 References Amandus, H.E., and Wheeler, R. 1987. The Morbidity and Mortality of Vermiculite Miners and Millers Exposed to Tremolite-Actinolite: Part II. Mortality. Am. J. Ind. Med. 11:15-26.
Amandus, H.E., Wheeler, P.E., Jankovic, J., and Tucker, J. 1987. The Morbidity and Mortality of Vermiculite Miners and Millers Exposed to Tremolite-Actinolite: Part I. Exposure Estimates. Am J Ind. Med 11:1-14.
ASTM. 1995. ASTM D5755-95. Standard Test Method for Microvacuum Sampling and Indirect Analysis of Dust by Transmission Electron Microscopy for Asbestos Structure Number Concentrations. October.
CDM (CDM Federal Programs). 2003. Final Sampling and Analysis Plan Addendum, Post Cleanup Evaluation Sampling, Contaminant Screening Study, Libby Asbestos Site. Operable Unit 4. Libby, Montana. December.
_____. 2004. Final Post-cleanup Evaluation Sampling Technical Memorandum, Contaminant Screening Study, Libby Asbestos Site. Operable Unit 4. Libby, Montana. September.
_____. 2006. Comprehensive Site Health and Safety Program, Libby, Montana, Revision 5. December.
_____. 2007. CDM Quality Assurance Manual. Revision 11. March.
_____. 2008a. Libby Asbestos Project Health and Safety Plan. May.
_____. 2008b. Response Action Sampling and Analysis Plan, Revision 1. April.
____. 2010. Draft Final. Remedial Investigation Report Operable Unit 4 – Residential and Commercial Properties. April.
EPA. 1991. Role of the Baseline Risk Assessment in Superfund Remedy Selection Decisions. Washington, DC. OSWER Directive #9355.0-30. http://www.epa.gov/oswer/riskassessment/baseline.htm
_____. 2001. EPA Requirements for Quality Assurance Project Plans, QA/R-5. Final. March.
_____. 2003. Draft Final. Libby Asbestos Site Residential/Commercial Cleanup Action Level and Clearance Criteria Technical Memorandum. December 15.
_____. 2006. Guidance on Systematic Planning Using the Data Quality Objective Process, QA/G-4. February.

Section 8 References
8-2
OU4 ABS SAP
_____. 2007a. Sampling and Analysis Plan for Activity-based Indoor Air Exposures, Operable Unit 4, Libby, Montana, Superfund Site. July 6.
_____. 2007b. Sampling and Analysis Plan for Activity-based Outdoor Air Exposures, Operable Unit 4, Libby, Montana, Superfund Site. July 6.
_____. 2007c. Summary Report for Data Collected under the Supplemental Remedial Investigation Quality Assurance Project Plan. October.
_____. 2008. Framework for Investigating Asbestos-Contaminated Sites. Report prepared by the Asbestos Committee of the Technical Review Workgroup of the Office of Solid Waste and Emergency Response. OSWER Directive 9200.00-68. September.
_____. 2010a. Activity-Based Sampling Report, Operable Unit 4, Libby, Montana, Superfund Site. U.S. Environmental Protection Agency, Region 8. June 2.
_____. 2010b. OEAFIELDSOP-102: Sampling, Sample Preparation and Operation of the Fluidized Bed Asbestos Segregator, Revision 0.0. U.S. Environmental Protection Agency, Region 10, Office of Environmental Assessment. May 10.
_____. 2010c. Draft. EPA Data Management Work Plan, Section 1 of EPA’s Site Management Plan for the Libby Asbestos Site. In review.
ISO. 1995. Ambient air: Determination of Asbestos Fibres. Direct-Transfer Transmission Electron Microscopy Method. April.
MacDonald, J.C., McDonald, A.D., Armstrong, B., and Sebastien, P. 1986. Cohort Study of Mortality of Vermiculite Miners Exposed to Tremolite. Brit. J. Ind. Med 43:436-444.
Peipins L.A., Lewin M., Campolucci S., Lybarger J.A., Kapil, V., Middleton, D., Miller A., Weis, C., Spence, M., Black, B., 2003. Radiographic Abnormalities and Exposure to Asbestos-Contaminated Vermiculite in the Community of Libby, Montana, USA. Environ. Health Perspect. 111:1753-1759.
Rohs A.M., Lockey J.E., Dunning K.K., Shulka R., Fan H., Hilbert T., Borton E., Wiot J., Meyer C., Shipley R.T., LeMasters G.K., Kapol V. 2007. Low Level Fiber Induced Radiographic Changes Caused by Libby Vermiculite: A 25 year Follow-up Study. Am J Respiratory and Critical Care Medicine. Published online December 6, 2007 as doi:10.1164/rccm.200706-814OC.
_____. 2004. Qualitative Estimation of Asbestos In Coarse Soil By Visual Examination Using Stereomicroscopy and Polarized Light Microscopy, SRC-Libby-01, Revision 2. April.

Section 8 References
8-3
OU4 ABS SAP
_____. 2007. Standard Operating Procedure, Soil Sample Preparation, ISSI-Libby-01, Revision 10. December.
_____. 2008. Analysis of Asbestos Fibers in Soil by Polarized Light Microscopy, SRC-LIBBY-03, Revision 2. October.
Sullivan P.A. 2007. Vermiculite, Respiratory Disease and Asbestos Exposure in Libby, Montana: Update of a Cohort Mortality Study. Environmental Health Perspectives doi:10.1289/ehp.9481 available online at http://dx.doi.org.
TechLaw. 2007. Soil Preparation Work Plan. Libby Asbestos Site – Operable Unit 7. Revision D. March.

Libby
£¤2
!(37
0 21Miles/
LibbyMontana
IdahoWyoming
North
Dak
ota
Sout
h Dak
ota
CanadaTroy
Map Date: 5/26/2010Aerial Image: NAIP 2009
CDM
Map F
ile: R
:\260
3-Volp
e\ABS
\MXD
\Fig_
3-1_A
BSDr
ivingB
ndry_
1005
26.m
xd
Scenario 4 - Driving Boundaries
Libby Asbestos SiteLibby, Montana
Figure 3-1
1 in = 1 mile
Legend
Driving Boundaries
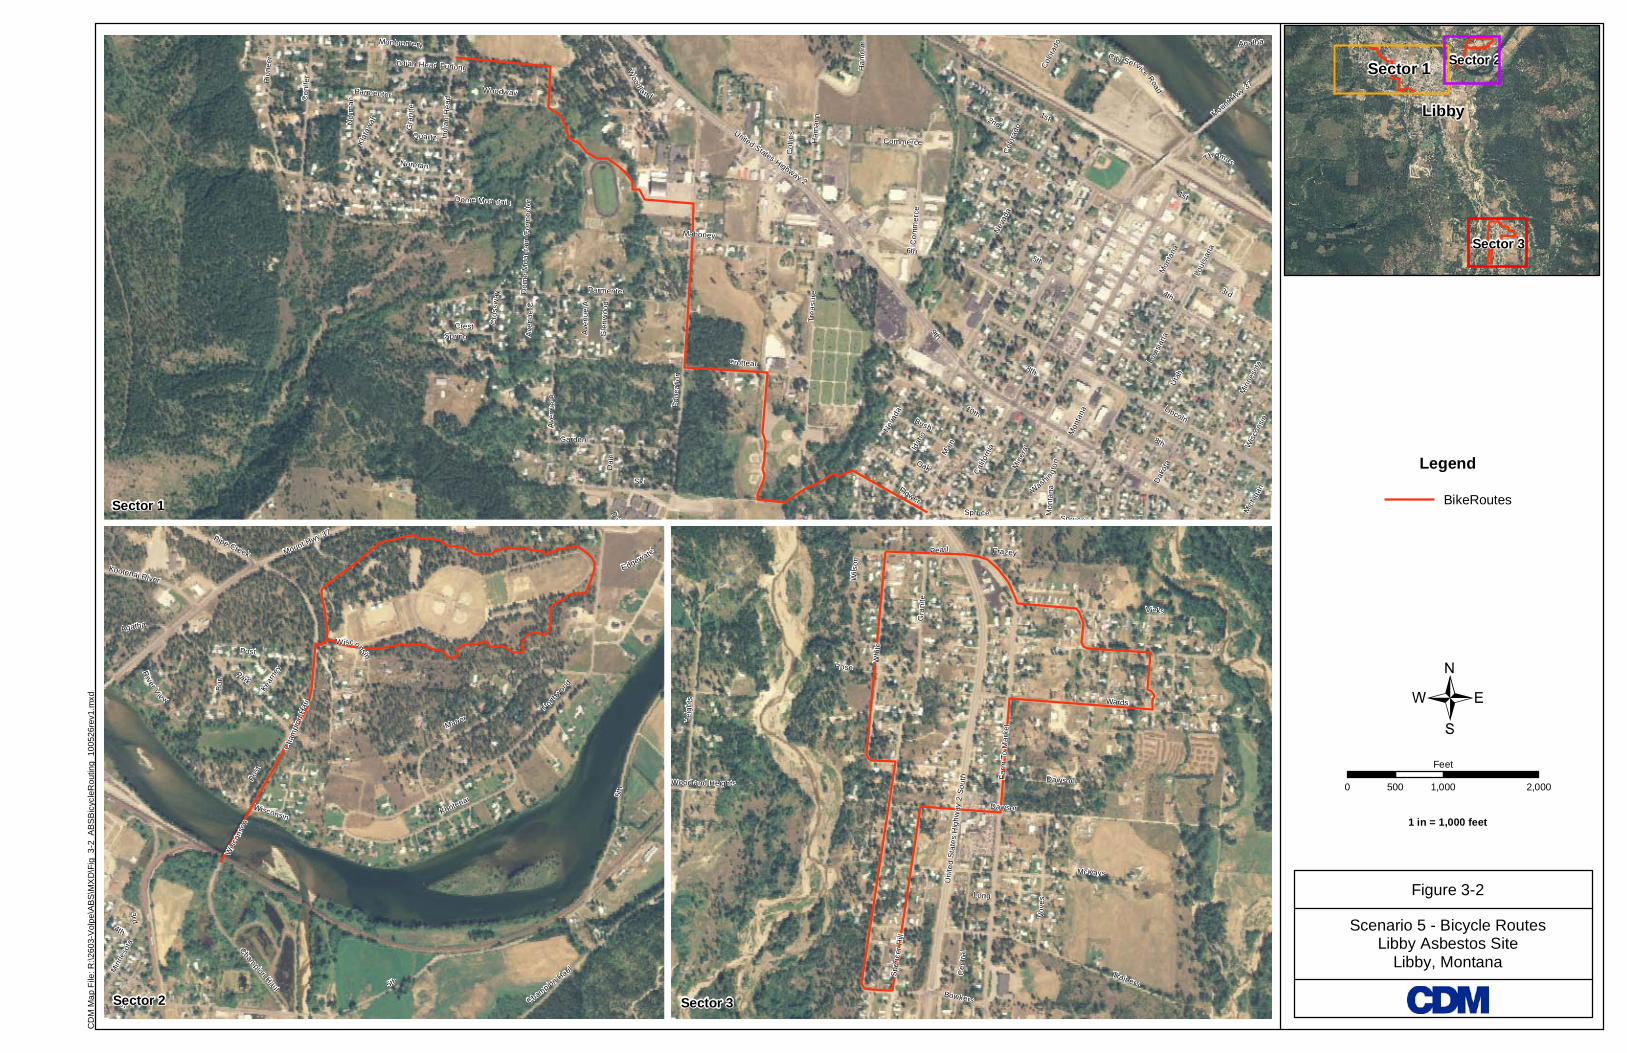
6th
9th
4th 3rd
2nd
5th
MainIdaho
10th
8th
Califo
rnia
Minera
l
Utah
Lincoln
Oak
Educ
ation
Dakot
a
Spring
Louis
iana
Conif
er
Spruce
Ski
Minne
sota
Bush
Pione
er
1st
Mahoney
Garden
United States Highway 2
Aven
ue B
Crotteau
Montgomery
Dome Mountain
Gran
ite
Treas
ure
Indian
Hea
d
Wiscon
sin
Flower
Hama
nn
Quartz
Crest
Parmenter
Klataw
ah
Woodway
Norman
Collin
s
City Service Road
Cros
sway
Dale
Woodland
Commerce
Hamo
nn
Michig
an
Aven
ue C
Nevad
a
Monta
na
Mount Hwy 37
Agatha
Aven
ue A
Glen
wood
Color
ado
Thomas
Washin gto
n
Dome
Mou
ntain
Conn
ector
Indian Head Furlong
Da le
8th
Color
adoNo
rman
Nevad
a
Spruce
Parmenter
Comm
erce
Louis
iana
1st
Monta
na
Monta
na
0 1,000 2,000500Feet
/
Libby
Sector 1 Sector 2
Sector 3
Map Date: 5/26/2010Aerial Image: NAIP 2009
CDM
Map F
ile: R
:\260
3-Volp
e\ABS
\MXD
\Fig_
3-2_A
BSBic
ycleR
outin
g_10
0526
rev1.m
xd
Scenario 5 - Bicycle Routes
Libby Asbestos SiteLibby, Montana
Figure 3-2
1 in = 1,000 feet
LegendBikeRoutes
5th
Manor
Park
Northwood
Post
Mount Hwy 37
3rd
6th Champion Haul
Kearn
ey
Burr
4th
Kootenai
Agatha
Pipe CreekEdgewat e r
River View
Kootenai River
Minne
sota
W isconsin
Wiscon
son
5th
Cham
pion H
aul
Post
Champion Haul
Wisconsin
Gran
ite
Trainers
Wards
White
McKays
Farm
To M
arket
Vove
s
Heigh
ts
Rose
Centr
al
Pearl
Vicks
Unite
d Stat
es H
ighw a
y 2 So
uth
Spen
cer H
ill
Dawson
Bowkers
Wilso
n
Long
Frazey
Woodland Heights
Dawson
Sector 1
Sector 2 Sector 3
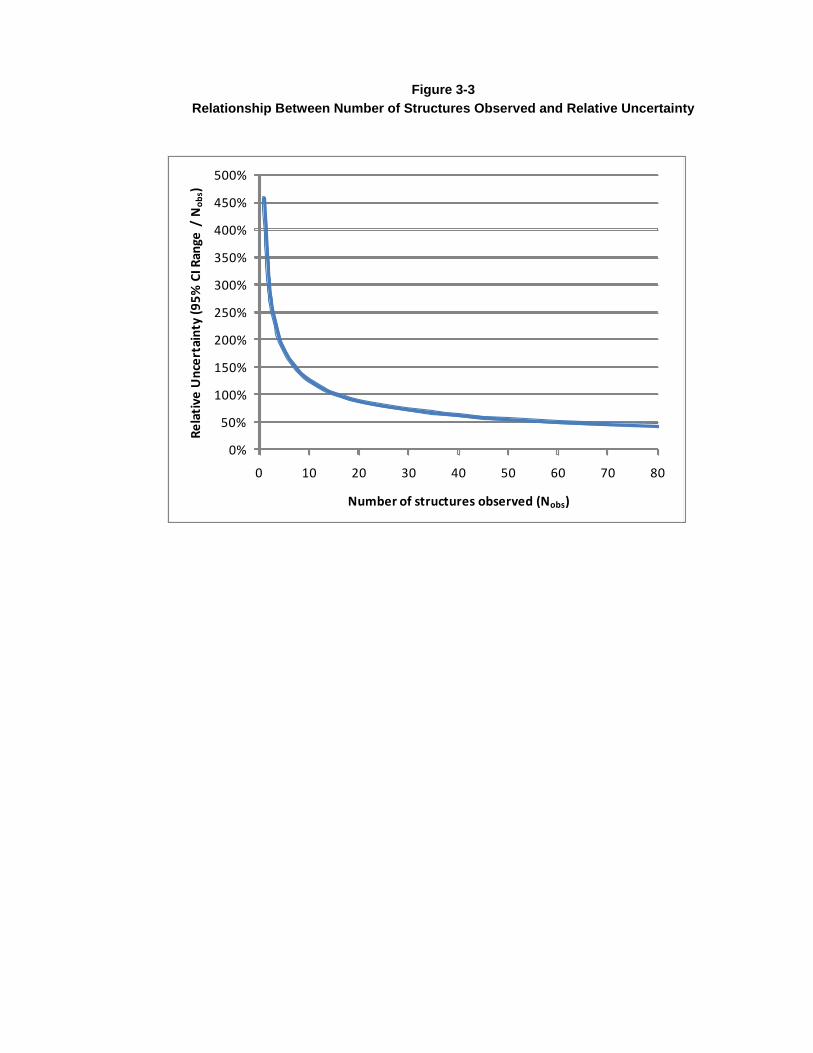
Figure 3-3 Relationship Between Number of Structures Observed and Relative Uncertainty
0%
50%
100%
150%
200%
250%
300%
350%
400%
450%
500%
0 10 20 30 40 50 60 70 80
Rela
tive
Unc
erta
inty
(95%
CI R
ange
/ N
obs)
Number of structures observed (Nobs)

APPENDIX A SCRIPT FOR ABS SCENARIOS
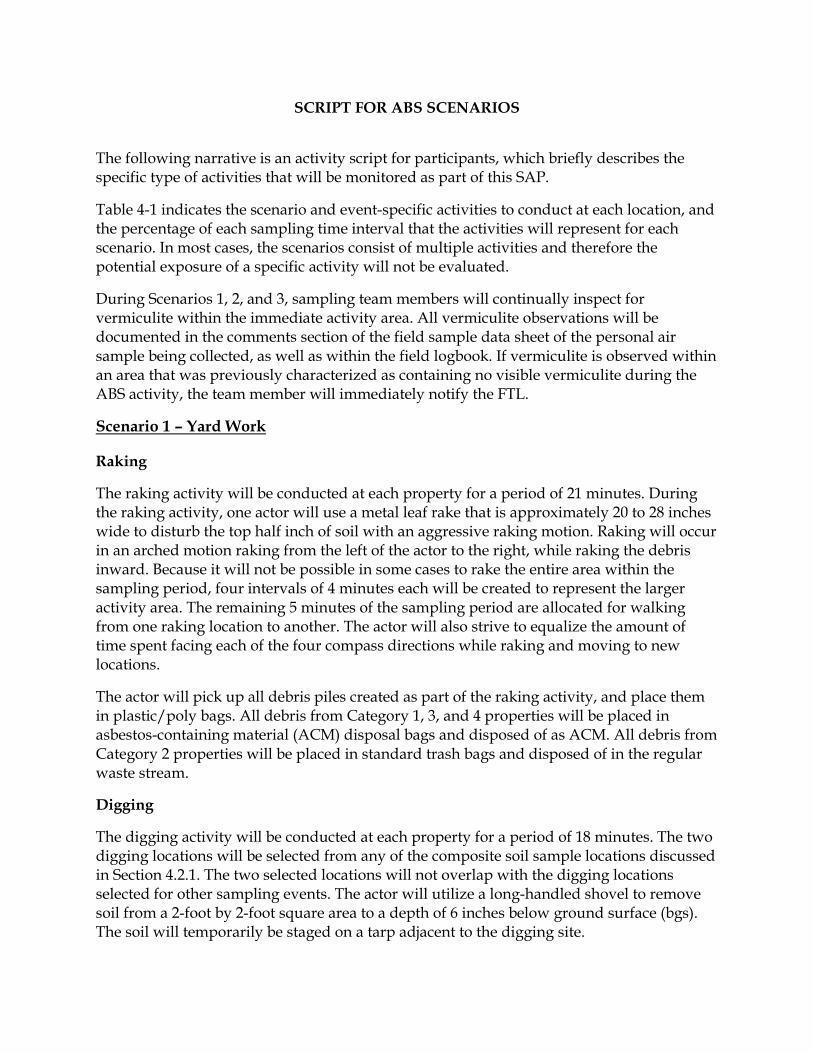
SCRIPT FOR ABS SCENARIOS
The following narrative is an activity script for participants, which briefly describes the specific type of activities that will be monitored as part of this SAP.
Table 4-1 indicates the scenario and event-specific activities to conduct at each location, and the percentage of each sampling time interval that the activities will represent for each scenario. In most cases, the scenarios consist of multiple activities and therefore the potential exposure of a specific activity will not be evaluated.
During Scenarios 1, 2, and 3, sampling team members will continually inspect for vermiculite within the immediate activity area. All vermiculite observations will be documented in the comments section of the field sample data sheet of the personal air sample being collected, as well as within the field logbook. If vermiculite is observed within an area that was previously characterized as containing no visible vermiculite during the ABS activity, the team member will immediately notify the FTL.
Scenario 1 – Yard Work
Raking
The raking activity will be conducted at each property for a period of 21 minutes. During the raking activity, one actor will use a metal leaf rake that is approximately 20 to 28 inches wide to disturb the top half inch of soil with an aggressive raking motion. Raking will occur in an arched motion raking from the left of the actor to the right, while raking the debris inward. Because it will not be possible in some cases to rake the entire area within the sampling period, four intervals of 4 minutes each will be created to represent the larger activity area. The remaining 5 minutes of the sampling period are allocated for walking from one raking location to another. The actor will also strive to equalize the amount of time spent facing each of the four compass directions while raking and moving to new locations.
The actor will pick up all debris piles created as part of the raking activity, and place them in plastic/poly bags. All debris from Category 1, 3, and 4 properties will be placed in asbestos-containing material (ACM) disposal bags and disposed of as ACM. All debris from Category 2 properties will be placed in standard trash bags and disposed of in the regular waste stream.
Digging
The digging activity will be conducted at each property for a period of 18 minutes. The two digging locations will be selected from any of the composite soil sample locations discussed in Section 4.2.1. The two selected locations will not overlap with the digging locations selected for other sampling events. The actor will utilize a long-handled shovel to remove soil from a 2-foot by 2-foot square area to a depth of 6 inches below ground surface (bgs). The soil will temporarily be staged on a tarp adjacent to the digging site.
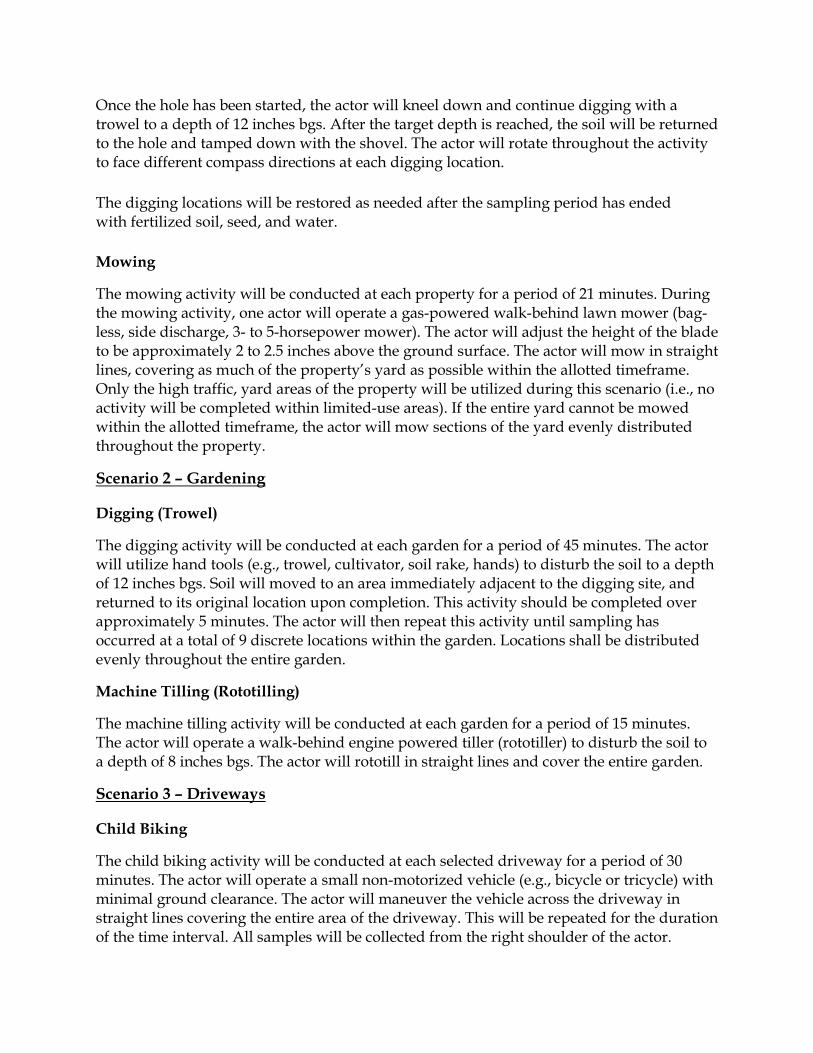
Once the hole has been started, the actor will kneel down and continue digging with a trowel to a depth of 12 inches bgs. After the target depth is reached, the soil will be returned to the hole and tamped down with the shovel. The actor will rotate throughout the activity to face different compass directions at each digging location.
The digging locations will be restored as needed after the sampling period has ended with fertilized soil, seed, and water.
Mowing
The mowing activity will be conducted at each property for a period of 21 minutes. During the mowing activity, one actor will operate a gas-powered walk-behind lawn mower (bag-less, side discharge, 3- to 5-horsepower mower). The actor will adjust the height of the blade to be approximately 2 to 2.5 inches above the ground surface. The actor will mow in straight lines, covering as much of the property’s yard as possible within the allotted timeframe. Only the high traffic, yard areas of the property will be utilized during this scenario (i.e., no activity will be completed within limited-use areas). If the entire yard cannot be mowed within the allotted timeframe, the actor will mow sections of the yard evenly distributed throughout the property.
Scenario 2 – Gardening
Digging (Trowel)
The digging activity will be conducted at each garden for a period of 45 minutes. The actor will utilize hand tools (e.g., trowel, cultivator, soil rake, hands) to disturb the soil to a depth of 12 inches bgs. Soil will moved to an area immediately adjacent to the digging site, and returned to its original location upon completion. This activity should be completed over approximately 5 minutes. The actor will then repeat this activity until sampling has occurred at a total of 9 discrete locations within the garden. Locations shall be distributed evenly throughout the entire garden.
Machine Tilling (Rototilling)
The machine tilling activity will be conducted at each garden for a period of 15 minutes. The actor will operate a walk-behind engine powered tiller (rototiller) to disturb the soil to a depth of 8 inches bgs. The actor will rototill in straight lines and cover the entire garden.
Scenario 3 – Driveways
Child Biking
The child biking activity will be conducted at each selected driveway for a period of 30 minutes. The actor will operate a small non-motorized vehicle (e.g., bicycle or tricycle) with minimal ground clearance. The actor will maneuver the vehicle across the driveway in straight lines covering the entire area of the driveway. This will be repeated for the duration of the time interval. All samples will be collected from the right shoulder of the actor.
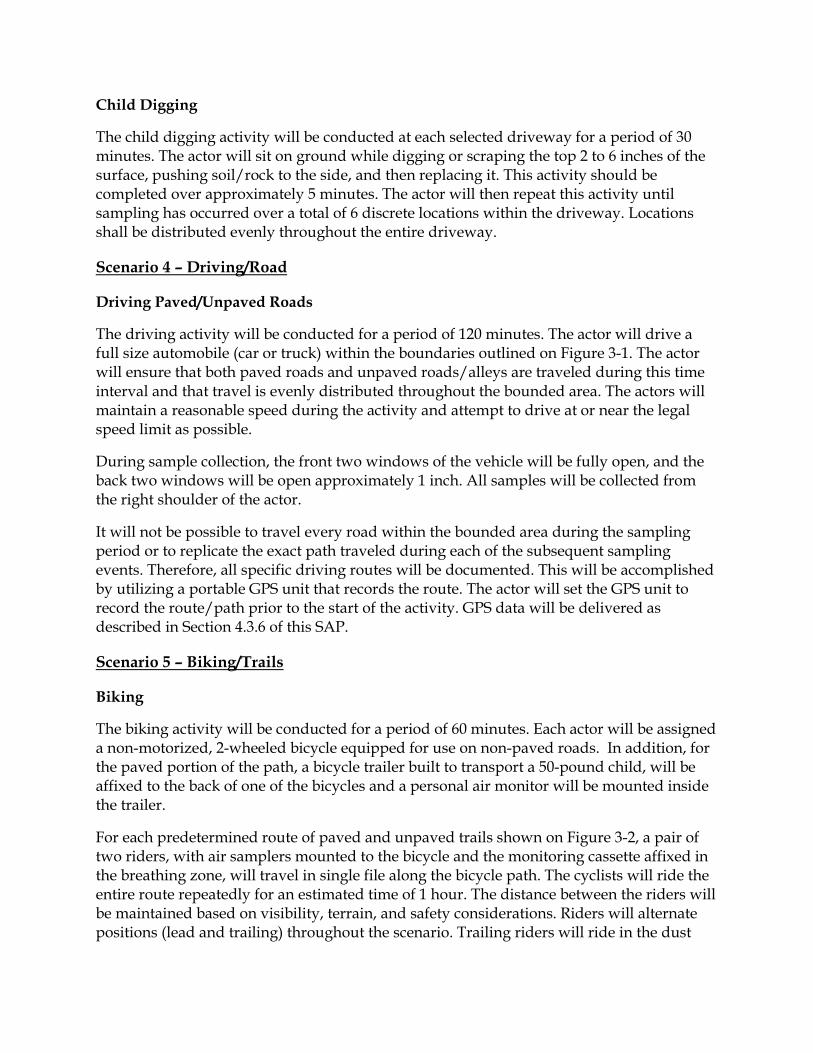
Child Digging
The child digging activity will be conducted at each selected driveway for a period of 30 minutes. The actor will sit on ground while digging or scraping the top 2 to 6 inches of the surface, pushing soil/rock to the side, and then replacing it. This activity should be completed over approximately 5 minutes. The actor will then repeat this activity until sampling has occurred over a total of 6 discrete locations within the driveway. Locations shall be distributed evenly throughout the entire driveway.
Scenario 4 – Driving/Road
Driving Paved/Unpaved Roads
The driving activity will be conducted for a period of 120 minutes. The actor will drive a full size automobile (car or truck) within the boundaries outlined on Figure 3-1. The actor will ensure that both paved roads and unpaved roads/alleys are traveled during this time interval and that travel is evenly distributed throughout the bounded area. The actors will maintain a reasonable speed during the activity and attempt to drive at or near the legal speed limit as possible.
During sample collection, the front two windows of the vehicle will be fully open, and the back two windows will be open approximately 1 inch. All samples will be collected from the right shoulder of the actor.
It will not be possible to travel every road within the bounded area during the sampling period or to replicate the exact path traveled during each of the subsequent sampling events. Therefore, all specific driving routes will be documented. This will be accomplished by utilizing a portable GPS unit that records the route. The actor will set the GPS unit to record the route/path prior to the start of the activity. GPS data will be delivered as described in Section 4.3.6 of this SAP.
Scenario 5 – Biking/Trails
Biking
The biking activity will be conducted for a period of 60 minutes. Each actor will be assigned a non-motorized, 2-wheeled bicycle equipped for use on non-paved roads. In addition, for the paved portion of the path, a bicycle trailer built to transport a 50-pound child, will be affixed to the back of one of the bicycles and a personal air monitor will be mounted inside the trailer.
For each predetermined route of paved and unpaved trails shown on Figure 3-2, a pair of two riders, with air samplers mounted to the bicycle and the monitoring cassette affixed in the breathing zone, will travel in single file along the bicycle path. The cyclists will ride the entire route repeatedly for an estimated time of 1 hour. The distance between the riders will be maintained based on visibility, terrain, and safety considerations. Riders will alternate positions (lead and trailing) throughout the scenario. Trailing riders will ride in the dust

cloud of the rider in front as much as is safe and practical. During these events, the bicycle riders will vary their speed between 3 and 15 mph. Riders will strive for an average speed of 8 mph. The average speed is a target speed only; bicycle speeds will be adjusted to meet path conditions.

APPENDIX B INTERIM APPROACH FOR
EVALUATION OF UNCERTAINTY AROUND THE MEAN OF A SET OF ASBESTOS CONCENTRATION VALUES
1.0 INTRODUCTION Human health risk assessments typically seek to estimate the risk to a person from exposure to a contaminant in an environmental medium at a particular location (often referred to as an exposure unit or exposure area). A key assumption in this approach is that exposure within the exposure unit is random (i.e., a receptor is equally likely to be exposed in all sub-locations within the exposure unit). Because of this assumption, the risk from a chemical in a medium is related to the arithmetic mean concentration of that chemical averaged over the entire exposure area. However, the true arithmetic mean concentration cannot be calculated with certainty from a limited number of measurements. Because of this, the USEPA recommends that the upper 95th percentile confidence limit (95% UCL) of the arithmetic mean at each exposure area be used when calculating exposure and risk at that location (USEPA 1992). The mathematical approach that is most appropriate for computing the 95% UCL of a data set depends on a number of factors, including the number of samples in the data set, the type of distribution from which the samples are drawn, and the degree of censoring (occurrence of values below the detection limit). To help address these technical complexities, EPA has developed a specialized computer application referred to as ProUCL (USEPA 2009). This application calculates a number of alternatives estimates of the UCL for a data set provided by the user, and, based on the attributes of the data set, identifies which UCL estimate is most appropriate for use in risk assessment calculations. An important assumption in the operation of the ProUCL software is that the concentration values provided in the data set are accurate. However, in the case of asbestos data sets, this assumption is not usually valid. This is because the concentration of asbestos in a sample is estimated by using microscopic techniques to determine the number of asbestos structures per unit medium. For example, for the analysis of an air sample: Cobs = Nobs / Vanal where: Cobs = Observed concentration in air (s/cc) Nobs = Number of asbestos structures counted during an analysis Vanal = Volume of air (cc) that passed through the area of filter analyzed However, the actual number of asbestos structures observed during an analysis is itself a random variable characterized by the Poisson distribution: Nobserved ~ Poisson(Nexpected) where:
Nexpected = Ctrue · Vanal Thus, the observed concentration is a Poisson random variable given by: Cobserevd ~ Poisson(Ctrue·Vanal) / Vanal For example, assume that the true concentration of asbestos in a sample of air was 0.026 s/cc, and that 100 L of air was passed through a filter with an area of 100 mm2. This would result in an average loading on the filter of 26.0 s/mm2. If a total area of 0.1 mm2 of filter (about 10 grid openings) were examined by the microscopist, it would be expected that the number of structures observed would be, on average across multiple analyses, about 2.6. However, in any one analysis, the number of structures observed can not be 2.6, but must be an integer (0, 1, 2, 3, 4, 5, etc.). The relative probability of observing each of these alternative counts is shown in Figure 1. This Poisson measurement error in each sample concentration estimate, superimposed on the random sampling variability between different samples, results in a “mixed distribution” with complex statistical properties. For example, if the true distribution of air concentrations were characterized by a lognormal distribution, the sample set available for analysis would be a Poisson-lognormal (PLN). Because ProUCL assumes that the only source of variation between samples is sampling error, and was never intended to deal with the case where measurement error was also occurring, use of ProUCL to estimate the 95% UCL of an asbestos data set does not yield results with the desired statistical properties (95 out of 100 UCL values exceed the true mean). Rather, the probability that the computed UCL exceeds the true mean is decreased, with the magnitude of the decrease depending on the size of the data set, the average number of counts, and the number of samples with a count of zero. At present, the EPA is working to develop a computer application that is similar in concept to ProUCL, except that it is capable of dealing with mixed distributions that contain Poisson measurement error. However, this new application is not yet available for use. Therefore, an alternative approach must be used until that application is available. The purpose of this Attachment is to describe an interim approach that has been developed for use at the Libby Superfund site. This method is a screening approach that is not statistically rigorous, but which does provide a semi-quantitative basis for estimating the magnitude of the uncertainty in the observed mean of an asbestos data set. 2.0 INTERIM APPROACH One approach for characterizing the uncertainty around the mean of an asbestos data set is to use Monte Carlo simulation. In this approach, it is first necessary to specify the “true” distribution of
concentration values in the medium being sampled, and to specify the amount of sample analyzed. Given this, a large number of alternative data sets may be generated, and the variability in the observed means may be characterized as a function of the average number of particles counted per sample, the number of samples in the data set, and the variability between samples in the data set. In general, the true underlying distribution that characterizes the variability between different samples in a medium is not known. However, in most cases, the distribution is right skewed, and is often reasonably approximated by a lognormal distribution. If the true distribution is less skewed than a lognormal, then assumption of lognormality will generally tend to overestimate uncertainty somewhat. Based on this, for this interim method, the underlying distribution of concentration values was assumed to be lognormal. The between-sample variability in a lognormal distribution is characterized by the geometric standard deviation (GSD). For the purposes of this effort, three alternative GSD values were evaluated (3, 6, and 10). A GSD of 3 is suspected to be at the low end of the range of values that might occur at Libby, while a GSD of 10 is suspected to be near the high end of the likely range. The number of samples in each data set was assumed to vary from a small number (5) up to a high number (80). Each sample was assumed to be analyzed by a procedure with random Poisson counting error, with the average number of particles counted per analysis (λ = Ctrue · Vanal) ranging from 3 to 20. The mean of each simulated data set was computed, and divided by the true mean in order to normalize the values. 3.0 RESULTS The results of the simulation (presented as the range from the 5th percentile to the 95th percentile of the ratio of the simulated mean divided by the true mean) are shown in Figure 2. As expected, the width of the sampling distribution of the mean tends to decrease as sample number increases, and to increase as a function of underlying variability (GSD). Based on this figure, the approximate uncertainty around the observed mean of an asbestos data set may be assessed as follows:
1. Compute the observed mean and GSD of the data set. 2. Based on the GSDobs, estimate the potential magnitude of the uncertainty in the mean
based on the sample size and the GSDobs. For example, for a data set of size 20 and a GSDobs = 6, it may be estimated that the true mean is probably within a factor of about 3 (either higher or lower) of the observed mean.
3. Using the high end of the uncertainty range, estimate a “high end” value for the mean. In the example above, the high end estimate would be 3-times the sample mean.
As emphasized above, this simulation approach does not constitute a rigorous method for computing the 95% UCL of a given data set. The chief limitation to the method is that it assumes the observed sample GSD is reasonably close to the truth. However, the value of

GSDobs is a random variable, and the true GSD might be either higher or lower than the value of GSDobs. Consequently, the high end estimate for a data set might be either higher or lower than a rigorously computed UCL for that data set. REFERENCES USEPA. 1992. U.S. Environmental Protection Agency, Office of Solid Waste and Emergency Response. Supplemental Guidance to RAGS: Calculating the Concentration Term. Publication 9285.7-081. USEPA. 2009. ProUCL Version 4.00.04 User Guide. U.S. Environmental Protection Agency, Office of Research and Development, National Exposure Research Laboratory. EPA/600/R-07/038. February 2009. Available online at http://www.epa.gov/esd/tsc/software.htm.
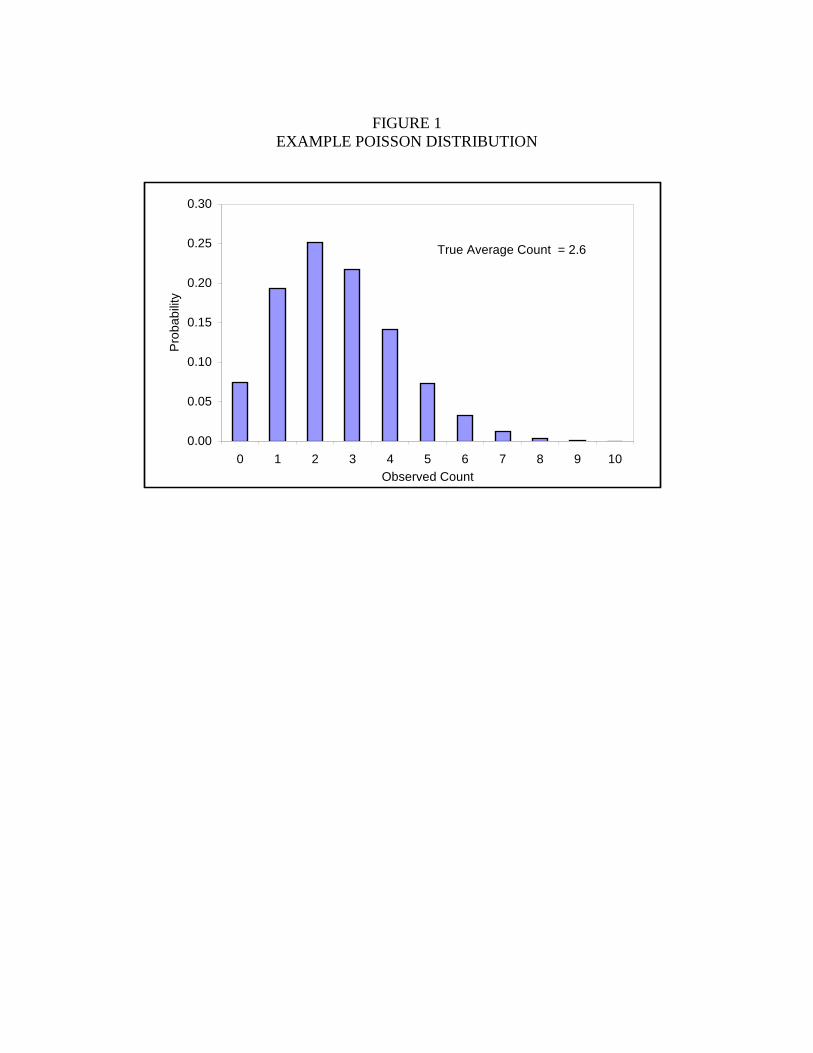
FIGURE 1
EXAMPLE POISSON DISTRIBUTION
0.00
0.05
0.10
0.15
0.20
0.25
0.30
0 1 2 3 4 5 6 7 8 9 10Observed Count
Pro
babi
lity
True Average Count = 2.6
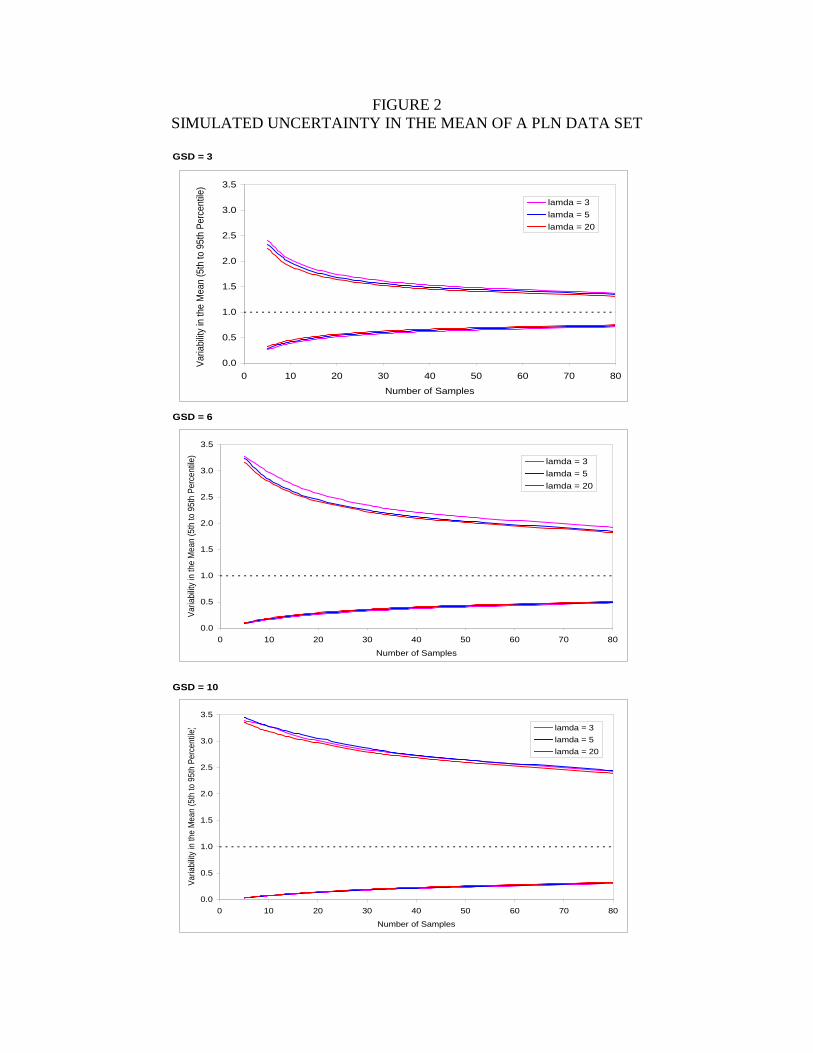
FIGURE 2 SIMULATED UNCERTAINTY IN THE MEAN OF A PLN DATA SET
GSD = 3
GSD = 6
GSD = 10
0.0
0.5
1.0
1.5
2.0
2.5
3.0
3.5
0 10 20 30 40 50 60 70 80
Number of Samples
Varia
bility
in th
e M
ean
(5th
to 9
5th
Perc
entile
)lamda = 3lamda = 5lamda = 20
0.0
0.5
1.0
1.5
2.0
2.5
3.0
3.5
0 10 20 30 40 50 60 70 80
Number of Samples
Varia
bility
in th
e M
ean
(5th
to 9
5th
Perc
entile
)
lamda = 3lamda = 5lamda = 20
0.0
0.5
1.0
1.5
2.0
2.5
3.0
3.5
0 10 20 30 40 50 60 70 80
Number of Samples
Varia
bility
in th
e M
ean
(5th
to 9
5th
Perc
entile
) lamda = 3lamda = 5lamda = 20
APPENDIX C ABS PROPERTY BACKGROUND AND SAMPLING FORM
Placeholder for ABS Property Background and Sampling Form
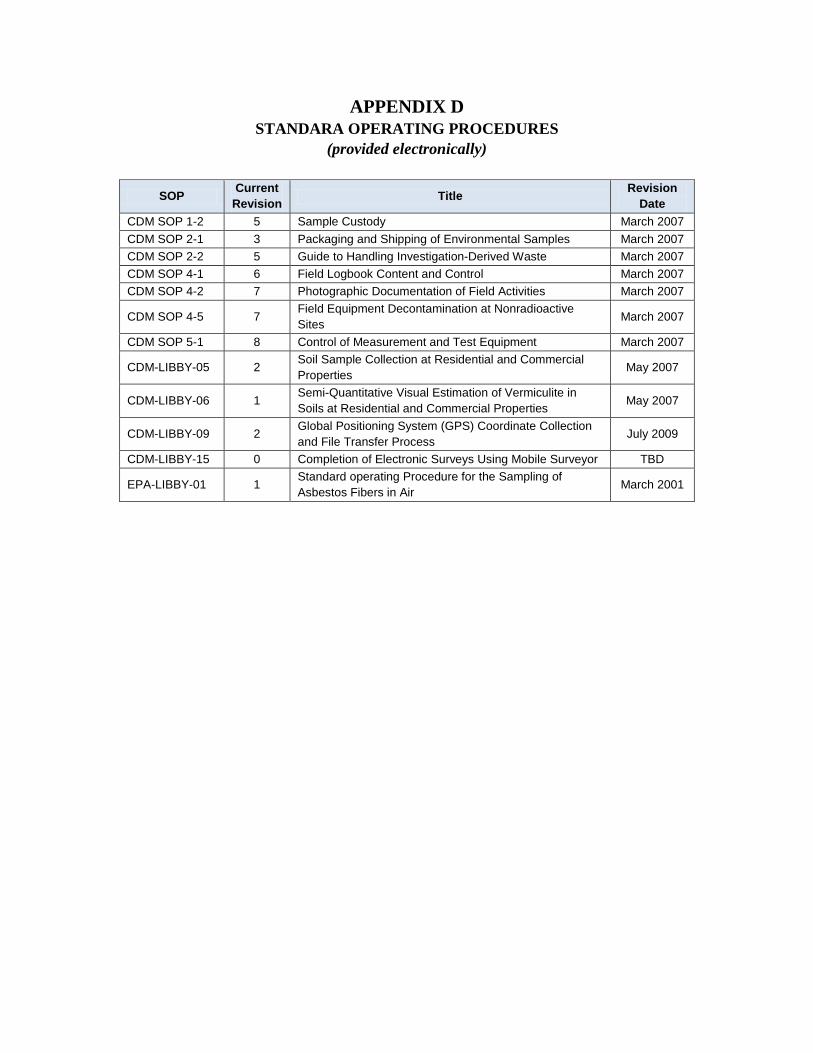
APPENDIX D STANDARA OPERATING PROCEDURES
(provided electronically)
SOP Current Revision Title Revision
Date CDM SOP 1-2 5 Sample Custody March 2007 CDM SOP 2-1 3 Packaging and Shipping of Environmental Samples March 2007 CDM SOP 2-2 5 Guide to Handling Investigation-Derived Waste March 2007 CDM SOP 4-1 6 Field Logbook Content and Control March 2007 CDM SOP 4-2 7 Photographic Documentation of Field Activities March 2007
CDM SOP 4-5 7 Field Equipment Decontamination at Nonradioactive Sites March 2007
CDM SOP 5-1 8 Control of Measurement and Test Equipment March 2007
CDM-LIBBY-05 2 Soil Sample Collection at Residential and Commercial Properties
May 2007
CDM-LIBBY-06 1 Semi-Quantitative Visual Estimation of Vermiculite in Soils at Residential and Commercial Properties May 2007
CDM-LIBBY-09 2 Global Positioning System (GPS) Coordinate Collection and File Transfer Process
July 2009
CDM-LIBBY-15 0 Completion of Electronic Surveys Using Mobile Surveyor TBD
EPA-LIBBY-01 1 Standard operating Procedure for the Sampling of Asbestos Fibers in Air March 2001

APPENDIX E SUMMARY OF PREPARATION AND ANALYTICAL REQUIREMENTS FOR
ASBESTOS
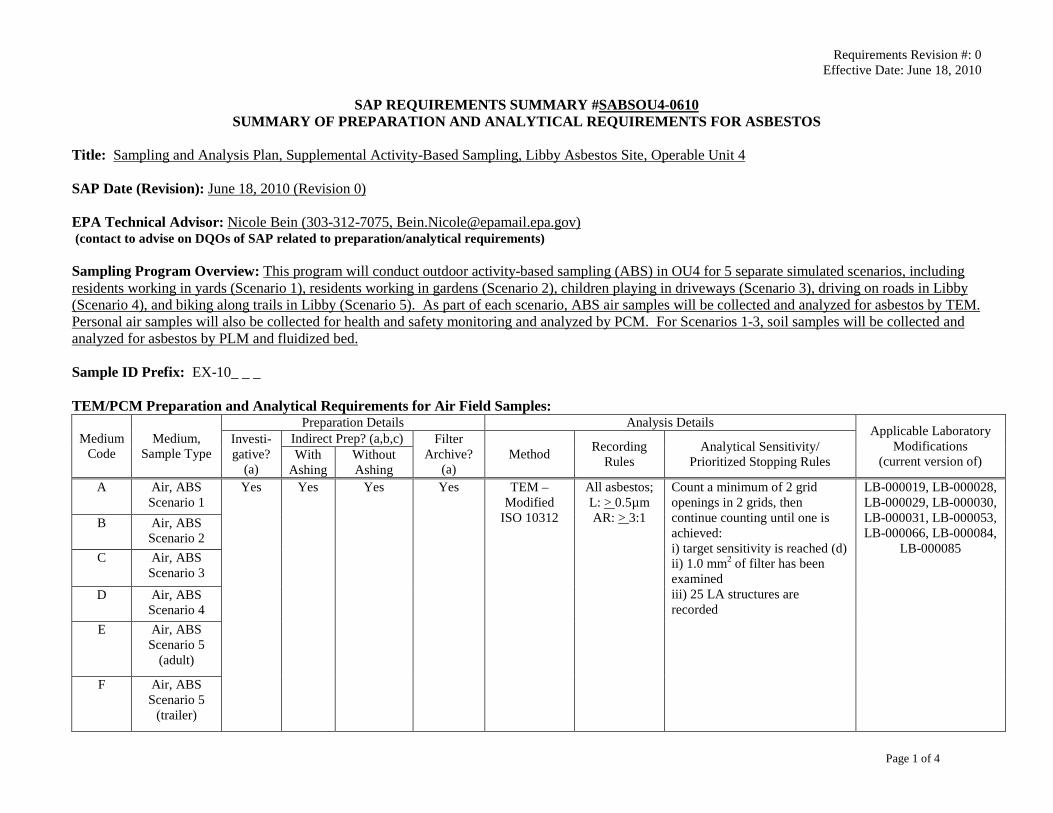
Requirements Revision #: 0 Effective Date: June 18, 2010
Page 1 of 4
SAP REQUIREMENTS SUMMARY #SABSOU4-0610 SUMMARY OF PREPARATION AND ANALYTICAL REQUIREMENTS FOR ASBESTOS
Title: Sampling and Analysis Plan, Supplemental Activity-Based Sampling, Libby Asbestos Site, Operable Unit 4 SAP Date (Revision): June 18, 2010 (Revision 0) EPA Technical Advisor: Nicole Bein (303-312-7075, [email protected]) (contact to advise on DQOs of SAP related to preparation/analytical requirements) Sampling Program Overview:
Medium Code
This program will conduct outdoor activity-based sampling (ABS) in OU4 for 5 separate simulated scenarios, including residents working in yards (Scenario 1), residents working in gardens (Scenario 2), children playing in driveways (Scenario 3), driving on roads in Libby (Scenario 4), and biking along trails in Libby (Scenario 5). As part of each scenario, ABS air samples will be collected and analyzed for asbestos by TEM. Personal air samples will also be collected for health and safety monitoring and analyzed by PCM. For Scenarios 1-3, soil samples will be collected and analyzed for asbestos by PLM and fluidized bed. Sample ID Prefix: EX-10_ _ _ TEM/PCM Preparation and Analytical Requirements for Air Field Samples:
Medium, Sample Type
Preparation Details Analysis Details Applicable Laboratory Modifications
(current version of)
Investi- gative?
(a)
Indirect Prep? (a,b,c) Filter Archive?
(a) Method Recording
Rules Analytical Sensitivity/
Prioritized Stopping Rules With Ashing
Without Ashing
A Air, ABS Scenario 1
Yes Yes Yes Yes TEM – Modified
ISO 10312
All asbestos; L: > 0.5µm AR: >
Count a minimum of 2 grid openings in 2 grids, then continue counting until one is achieved: i) target sensitivity is reached (d) ii) 1.0 mm2 of filter has been examined iii) 25 LA structures are recorded
3:1
LB-000019, LB-000028, LB-000029, LB-000030, LB-000031, LB-000053, LB-000066, LB-000084,
LB-000085
B Air, ABS Scenario 2
C Air, ABS Scenario 3
D Air, ABS Scenario 4
E Air, ABS Scenario 5
(adult)
F Air, ABS Scenario 5
(trailer)
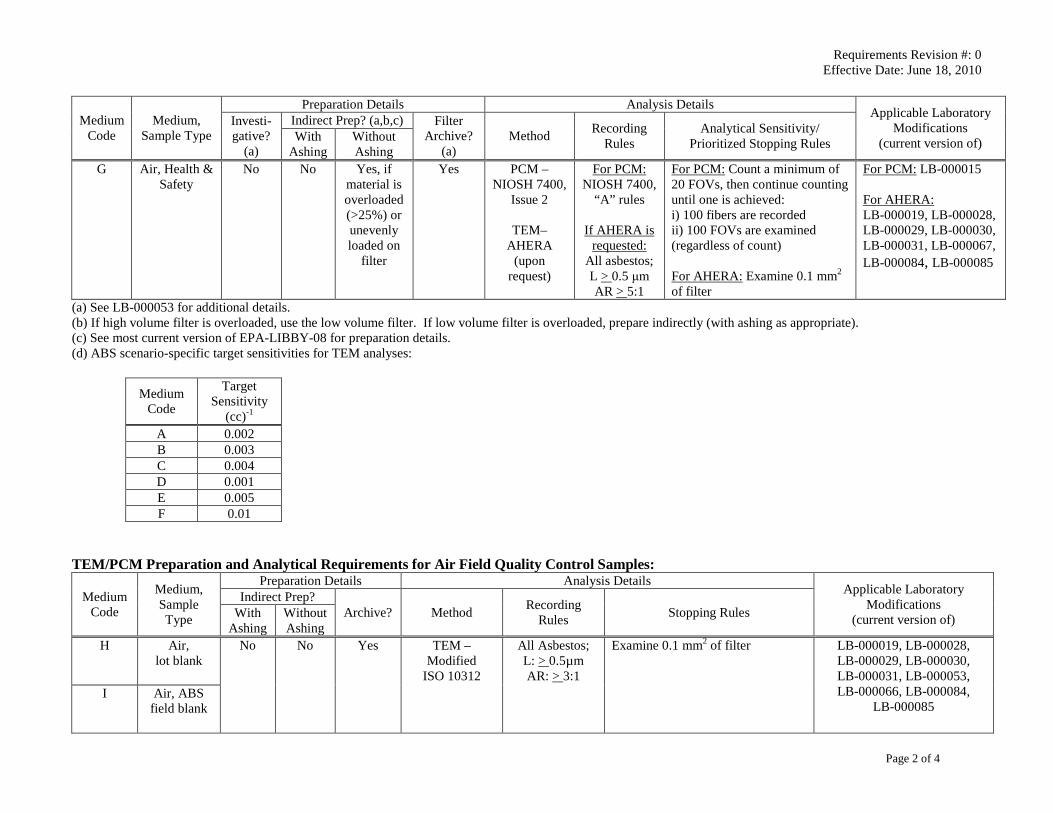
Requirements Revision #: 0 Effective Date: June 18, 2010
Page 2 of 4
Medium Code
Medium, Sample Type
Preparation Details Analysis Details Applicable Laboratory Modifications
(current version of)
Investi- gative?
(a)
Indirect Prep? (a,b,c) Filter Archive?
(a) Method Recording
Rules Analytical Sensitivity/
Prioritized Stopping Rules With Ashing
Without Ashing
G Air, Health & Safety
No No Yes, if material is overloaded (>25%) or unevenly loaded on
filter
Yes PCM – NIOSH 7400,
Issue 2
TEM– AHERA
(upon request)
For PCM: NIOSH 7400,
“A” rules
If AHERA is requested:
All asbestos; L > 0.5 μm AR > 5:1
For PCM: Count a minimum of 20 FOVs, then continue counting until one is achieved: i) 100 fibers are recorded ii) 100 FOVs are examined (regardless of count) For AHERA: Examine 0.1 mm2 of filter
For PCM: LB-000015 For AHERA: LB-000019, LB-000028, LB-000029, LB-000030, LB-000031, LB-000067, LB-000084, LB-000085
(a) See LB-000053 for additional details. (b) If high volume filter is overloaded, use the low volume filter. If low volume filter is overloaded, prepare indirectly (with ashing as appropriate). (c) See most current version of EPA-LIBBY-08 for preparation details. (d) ABS scenario-specific target sensitivities for TEM analyses:
Medium Code
Target Sensitivity
(cc)-1 A 0.002 B 0.003 C 0.004 D 0.001 E 0.005 F 0.01
TEM/PCM Preparation and Analytical Requirements for Air Field Quality Control Samples:
Medium Code
Medium, Sample Type
Preparation Details Analysis Details Applicable Laboratory Modifications
(current version of)
Indirect Prep? Archive? Method Recording
Rules Stopping Rules With Ashing
Without Ashing
H Air, lot blank
No No Yes TEM – Modified
ISO 10312
All Asbestos; L: > 0.5µm AR: >
Examine 0.1 mm2 of filter
3:1
LB-000019, LB-000028, LB-000029, LB-000030, LB-000031, LB-000053, LB-000066, LB-000084,
LB-000085 I Air, ABS
field blank
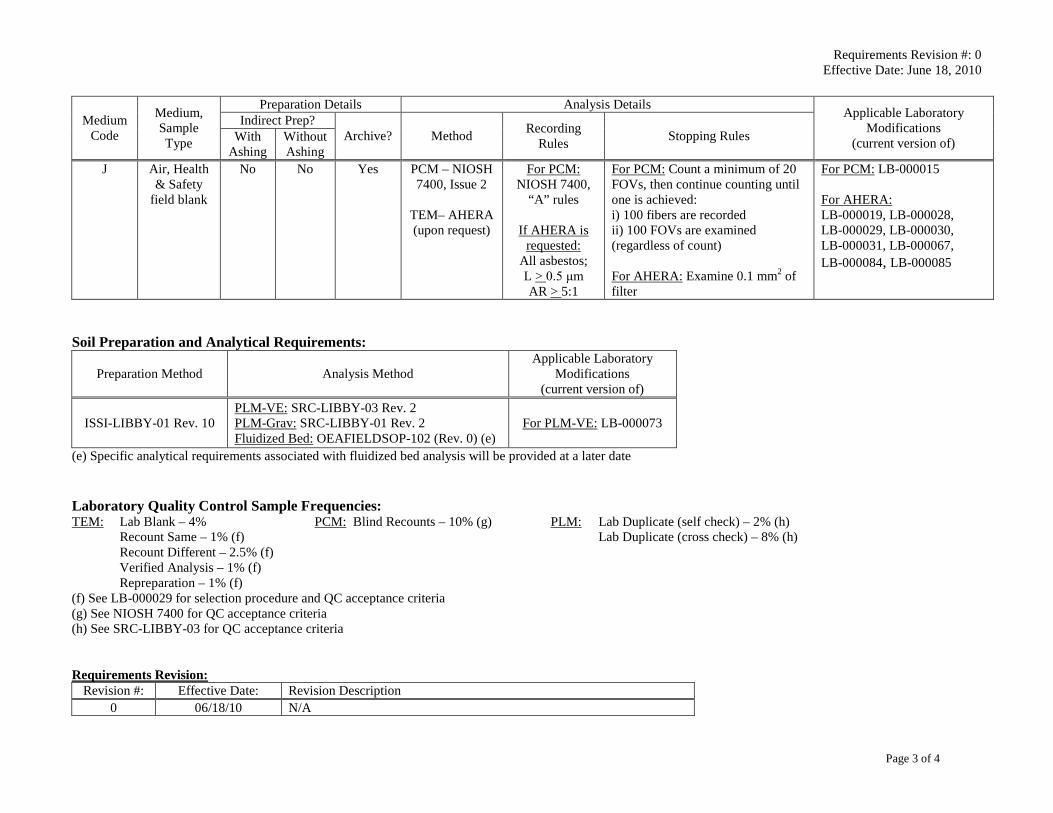
Requirements Revision #: 0 Effective Date: June 18, 2010
Page 3 of 4
Medium Code
Medium, Sample Type
Preparation Details Analysis Details Applicable Laboratory Modifications
(current version of)
Indirect Prep? Archive? Method Recording
Rules Stopping Rules With Ashing
Without Ashing
J Air, Health & Safety
field blank
No No Yes PCM – NIOSH 7400, Issue 2
TEM– AHERA (upon request)
For PCM: NIOSH 7400,
“A” rules
If AHERA is requested:
All asbestos; L > 0.5 μm AR > 5:1
For PCM: Count a minimum of 20 FOVs, then continue counting until one is achieved: i) 100 fibers are recorded ii) 100 FOVs are examined (regardless of count) For AHERA: Examine 0.1 mm2 of filter
For PCM: LB-000015 For AHERA: LB-000019, LB-000028, LB-000029, LB-000030, LB-000031, LB-000067, LB-000084, LB-000085
Soil Preparation and Analytical Requirements:
Preparation Method Analysis Method Applicable Laboratory
Modifications (current version of)
ISSI-LIBBY-01 Rev. 10 PLM-VE: SRC-LIBBY-03 Rev. 2 PLM-Grav: SRC-LIBBY-01 Rev. 2 Fluidized Bed: OEAFIELDSOP-102 (Rev. 0) (e)
For PLM-VE: LB-000073
(e) Specific analytical requirements associated with fluidized bed analysis will be provided at a later date Laboratory Quality Control Sample Frequencies: TEM: Lab Blank – 4% PCM: Blind Recounts – 10% (g) PLM: Lab Duplicate (self check) – 2% (h)
Recount Same – 1% (f) Lab Duplicate (cross check) – 8% (h) Recount Different – 2.5% (f) Verified Analysis – 1% (f) Repreparation – 1% (f) (f) See LB-000029 for selection procedure and QC acceptance criteria (g) See NIOSH 7400 for QC acceptance criteria (h) See SRC-LIBBY-03 for QC acceptance criteria
Revision #: Requirements Revision:
Effective Date: Revision Description 0 06/18/10 N/A
Requirements Revision #: 0 Effective Date: June 18, 2010
Page 4 of 4
Analytical Laboratory Review Sign-off:
EMSL – Libby [sign & date: _____________________________] EMSL – Westmont [sign & date: _____________________________] EMSL – Beltsville [sign & date: _____________________________]
ESAT [sign & date: _____________________________] Hygeia [sign & date: _____________________________] RESI [sign & date: _____________________________]
[Checking the box and initialing above indicates that the laboratory has reviewed and acknowledged the preparation and analytical requirements associated with the specified SAP.]

APPENDIX F LIBBY ASEBSTOS PROJECT RECORD OF MODIFICATION FORM

C:\Documents and Settings\rainesnl\Desktop\BLANK LFO Mod Form_v0_EPA.doc 4/21/10
Instructions to Requester: Email draft modification form to the contacts at bottom of form for review and approval. File approved copy with the CDM Quality Assurance Coordinator (QAC) at the Libby Field Office (LFO). The QAC will distribute approved copies and maintain the originals at the LFO. Requester: Title: Company: Date: Governing document (title and approved date) or SOP (title and SOP number): Field logbook and page number where modification is documented (or attach associated correspondence): Description of modification (attach additional sheets if necessary; include revised text for all document or SOP sections that are affected by the modification): Implication(s) of modification (if applicable, attach a list of affected property addresses or sample IDs):
Duration of modification (indicate one):
Temporary Date(s):
Permanent Effective Date: Data Quality Indicator (indicate one; reference the definitions below for direction on selecting data quality indicators):
Not Applicable Low Bias High Bias Reject Estimate No Bias
CDM Technical Review and Approval: _________________________________ Date: (CDM Project Manager or designate) EPA Review and Approval: _____________________________________ Date: (USEPA RPM or designate)
Record of Modification to Documents Governing Field Activities
Libby Asbestos Project
Form No. LFO-000_ _ _
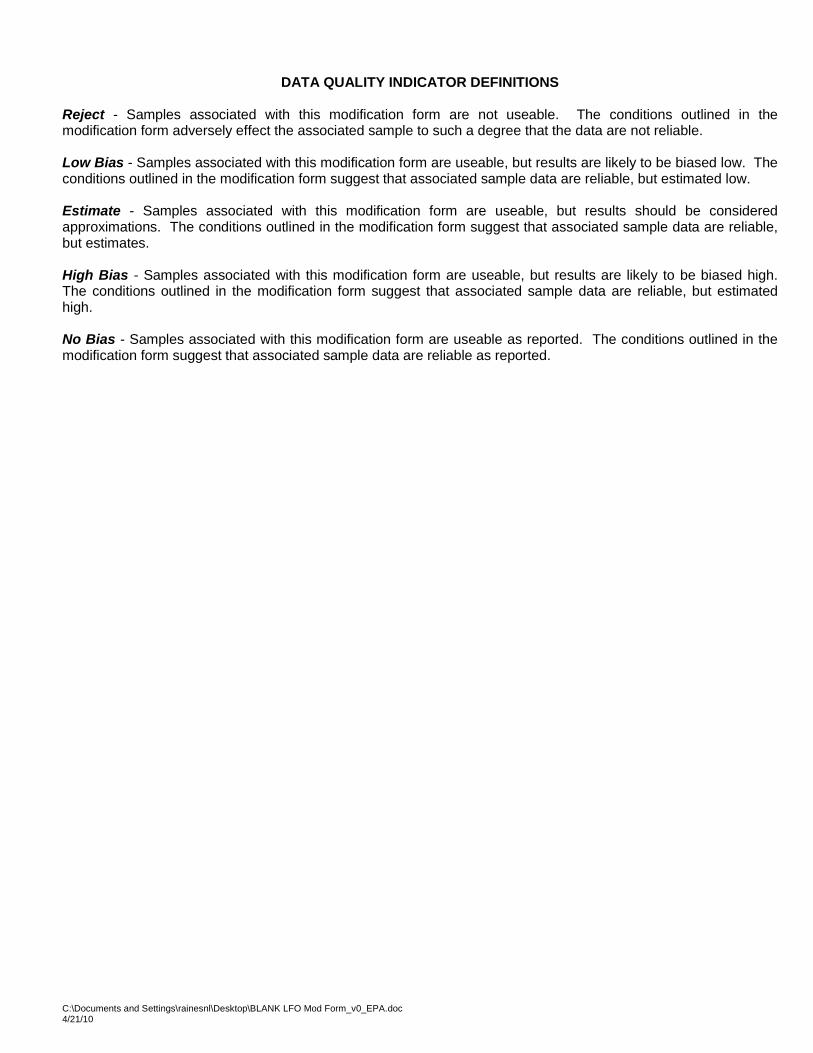
C:\Documents and Settings\rainesnl\Desktop\BLANK LFO Mod Form_v0_EPA.doc 4/21/10
DATA QUALITY INDICATOR DEFINITIONS
Reject - Samples associated with this modification form are not useable. The conditions outlined in the modification form adversely effect the associated sample to such a degree that the data are not reliable. Low Bias - Samples associated with this modification form are useable, but results are likely to be biased low. The conditions outlined in the modification form suggest that associated sample data are reliable, but estimated low. Estimate - Samples associated with this modification form are useable, but results should be considered approximations. The conditions outlined in the modification form suggest that associated sample data are reliable, but estimates. High Bias - Samples associated with this modification form are useable, but results are likely to be biased high. The conditions outlined in the modification form suggest that associated sample data are reliable, but estimated high. No Bias - Samples associated with this modification form are useable as reported. The conditions outlined in the modification form suggest that associated sample data are reliable as reported.


![Interim Draft Sampling and Analysis Plan Template€¦ · Sampling and Analysis Plan Approval [Name of Data Collection Activity] [Insert Date] Fill-out the name(s) and agencies of](https://img.dokumen.tips/doc/110x75/5f5293152e3b7e63556bf0e6/interim-draft-sampling-and-analysis-plan-template-sampling-and-analysis-plan-approval.jpg)