Embed Size (px)
Citation preview

Dicamba 939
DICAMBA (240)
First draft prepared by Dr. Yukiko Yamada, Ministry of Agriculture, Forestry and Fisheries, Tokyo, Japan
EXPLANATION
Dicamba, a systemic broad-spectrum herbicide, is used in a variety of crops. Its mode of action is similar to that of endogenous auxin (IAA) and other auxin-type herbicides and appears to involve cell wall plasticity and nucleic acid metabolism. In sensitive broad-leaved weeds, the induction of 1-aminocyclopropane-1-carboxylic acid (ACC) synthase in the biosynthesis of ethylene is a primary and rapid response to auxin herbicides. Within a few hours after treatment, increases are induced in ACC synthase activity, followed by increased ACC concentration and ethylene formation in the shoot tissue. Ethylene causes epinastic growth and tissue swelling. It also stimulates the biosynthesis of abscisic acid (ABA), which mediates stomatal closure. Within 24 hours, these effects limit photosynthetic activity and biomass production, and are accompanied by the over-production of reactive oxygen species, particularly hydrogen peroxide, in the tissue. Growth inhibition, senescence and tissue decay are the consequence of this cascading process.
Since the first approvals of dicamba in 1962, it has been registered in about 100 countries worldwide.
It was identified as a priority new compound at the Forty-second Session of the CCPR in 2009 (ALINORM 09/30/24, para. 193) for evaluation for the first time by the 2010 JMPR. The Meeting received information on physical and chemical properties, animal and plant metabolism, environmental fate, analytical methods, storage stability, use patterns, processing and farm animal feeding.
The specification of dicamba was developed by the Joint FAO/WHO Meeting on Pesticide Specification and published in 2001.
IDENTITY
ISO common name: Dicamba
Chemical name
IUPAC: 3,6-dichloro-2-methoxy-benzoic acid
CAS: 3,6-dichloro-2-methoxy-benzoic acid
CAS Registry No.: 1918-00-9
CIPAC No.: 85
Synonyms for active substance:
BAS 183 H
Reg. No. 196 095
SAN 837
R084451

940 Dicamba
Structural formula:
Molecular formula: C8H6Cl2O3
Molecular weight: 221.0
PHYSICAL AND CHEMICAL PROPERTIES
Pure active ingredient
Property Results Reference Appearance: White granular solid Widlak, 1993b,
1993/5271 Odour: Weak neutral, slightly aromatic and pungent Buck, 1993a, 1993/5269 Melting point: 114–116 C (metal block) Widlak, 1993a,
SAN837/5293 Temperature of decomposition:
Thermal decomposition starts at about 230 C before boiling. Das, 1999, 1999/5000168
Relative density: 1.488 at 25 C Pal, 1993, 1993/5254 Vapour pressure: 1.67 10-3 Pa at 25 C Chen, 1994, 1994/5202 Henry’s Law Constant at 25C (calculation):
1.0 10-4 Pam3/mol
Burkhard, 1995a, 1999/5000170
Solubility in water at 25°C: Unbuffered: In buffer soln pH 4.1: pH 6.8: pH 8.2:
6.6 g/L (pH 1.8) > 250 g/L > 250 g/L > 250 g/L
Kettner, 1999a, 1999/5000169
Solubility in organic solvents at 25 °C: Hexane: Acetone: Methanol: Ethyl acetate: Octanol: Toluene: Dichloromethane
2.8 g/L > 500 g/L > 500 g/L > 500 g/L 490 g/L 180 g/L 340 g/L
Das, 2001b, 2001/5003583
Octanol-water partition coefficient at 25 C (logPow):pH 5.0: pH 6.8: pH 8.9:
-0.55 -1.8 -1.9
Kettner, 1999b, 1999/5000167

Dicamba 941
Property Results Reference Hydrolysis: 25 C 50 C pH 4: pH 5 pH 7: pH 9:
- Stable for 1 month Stable for 1 month Stable for 1 month
Stable for 2 weeks Stable for 2 weeks Stable for 2 weeks Stable for 2 weeks
Morgenroth, 2000, 2000/5000164
Direct photo-transformation of purified active substance in water (pH 7, 25C)
Pseudo first-order photolysis DT50: 38.1 ± 0.6 days Rate constant: 0.018 day-1
Corresponding to : DT50: 50.3 days Rate constant: 0.0138 day-1 Based on noon spring sunlight data for 40N latitude No degradation products > 10%
Sen et al, 1993, 1993/5237
Quantum yield of direct photo-transformation:
0.046 For geographical latitudes 30N, 40N and 50N in spring and summer, near surface, with å=1 included: DT50: 13–21 days Rate constant: 0.0339–0.0368 day-1
Schmidt, 2002, 2002/5004807
Dissociation in water at 25C:
pKa=1.87 Bebel, 1993, 1993/5249 Burkhard, 1999b, 1999/5000159
Estimated photochemical oxidative degradation:
DT50=3.6 days for OH attack (1.5 106 OH-radicals/cm3 and a 12 hour day)
Stamm, 1998, 1998/5000050
UV absorption in methanol: Neutral: Acidic: Basic:
228 nm (10130 L/mol·cm), 737 nm 228 nm (10119 L/mol·cm), 1028 nm 228 nm (10522 L/mol·cm), 343 nm
Technical material
Property Results Reference Appearance: Light cream/tan solid composed of granules, lumps and flakes Widlak, 1993c, 1993/5252 Odour: Moderate, neutral, pungent or medicinal Buck, 1993b, 1993/5270 Flammability: Not flammable Angly, 1999b,
1999/5000162 Explosive properties: Not explosive under effect of thermal, shock or friction. Angly, 1999b,
1999/5000157 Surface tension: 63.7 nM/m at 1.0 g/L aqueous solution and 20 C Martin, 1999,
1999/5000158 Oxidizing properties: Not considered as oxidizing substance. Angly, 1999c,
1999/5000166 Formulations: Emulsifiable concentrate (EC) formulation containing 50 or 87 g ai/L in combination with other

942 Dicamba
Cl
Cl
O
COOH
Cl
Cl
O
COOH
OH
Property Results Reference
active ingredients Soluble concentrate (SL) formulation containing 30, 62.5, 70, 84, 90, 100, 110, 120, 160, 213, 240 or 480 g ai/L alone or in combination with other active ingredients Suspension concentrate (SC) formulation containing 132 g ai/L in combination with other active ingredients Water dispersible granule (WG) formulation containing 40, 42.4, 50, 60, 61, 63, 66, 70 or 80 g ai/L alone or in combination with other active ingredients
METABOLISM AND ENVIRONMENTAL FATE
The following links manufacturer code name and structure or description of the compounds appearing in the various metabolism and environmental fate studies.
Structure of compounds appearing in metabolism and environmental fate studies
Code name Chemical names Found in Other names Structure
Dicamba
(Parent compound)
3,6-dichloro-2-methoxy-benzoic acid
(CAS, IUPAC)
Cow Goat Hen
Sugar cane Soya beans Cotton Wheat
Soil
SAN 837H I8
U1
F1
K1
L1
Ft1
R084451
5-OH Dicamba 2,5-dichloro-3-hydroxy-6-methoxy-benzoic acid
(CAS, IUPAC)
Goat Hen
Sugar cane Soya beans Cotton Wheat
NOA 405873
U2-3
Glucoside of
5-OH Dicamba
Glucoside of 2,5-dichloro-3-hydroxy-6-methoxy-benzoic acid
(IUPAC)
Sugar cane Wheat
I7-conjugate (I7-glucoside)
O-Glc 5-OH Dicamba

Dicamba 943
Cl
Cl
OH
COOH
Cl
OHCl
NH2
Cl
OHCl
Cl
Cl
OH
COOH
OH
Code name Chemical names Found in Other names Structure
DCSA 3,6-dichloro-2-hydroxy-benzoic acid (CAS, IUPAC)
Cow Goat Hen
Sugar cane Soya beans Cotton Wheat
Soil
Dichlorosalicylic acid,
2-OH Dicamba
NOA414746 I6,
DCHBA
U2-1
F2
K2
L2
Ft2
DCHB
R733985
DCSA Glucuronide
Glucuronide of 3,6-dichloro-2-hydroxy-benzoic acid
(IUPAC)
Cow
Sugar cane Wheat
Glucuronide of DCHBA
Glucoside of 2-OH Dicamba
I6-conjugate (I6-glucoside)
O-Gluc-DCSA
2A36DCP 2-amino-3,6-dichloro-phenol (CAS, IUPAC)
Hen (liver)
DCP 2,5-dichlorophenol (CAS, IUPAC)
Cow (urine) Dichlorophenol
DCGA
2,5-dichloro-3,6-dihydroxy-benzoic acid
(CAS, IUPAC)
Soya beans Sugar cane Cotton Wheat
Soil
3,6-Dichloro-gentisic acid, 2,5-DiOH Dicamba I5
R740230
Glucoside of DCGA
Glucoside of 2,5-dichloro-3,6-dihydroxy-benzoic acid (IUPAC)
Wheat I5-conjugate (I5-glucoside) O-Glc-DCGA
Radiolabelled Dicamba Used in Metabolism Studies
In plant and animal metabolism studies, Dicamba which was uniformly labelled with 14C in the phenyl ring was used. No radioactive carbon was incorporated into other carbon atoms. (see Table 1)

944 Dicamba
Cl
Cl
O
COOH
*
Table 1 Specific activity and purity of radio-labelled compound used in the metabolism studies
Study on Specific activity MBq/mg
Purity* %
Lactating goat 7.07 (42.2 mCi/mmol or 191 μCi/mg)
99.9
Lactating cow 2.86 (17.1 mCi/mmol or 77.2 μCi/mg)
> 99
Laying hen (1st study)
7.07 (42.2 mCi/mmol or 191 μCi/mg)
99.9
Laying hen (2nd study)
1.93 (11.5 mCi/mmol or 52.0 μCi/mg)
> 99
Wheat 2.90 (17.3 mCi/mmol or 78.4μCi/mg)
98.7
Soya beans 1.93 (11.5 mCi/mmol or 52.0 μCi/mg)
> 98
Cotton 1.93 (11.5 mCi/mmol or 52.0 μCi/mg)
> 98
Cotton 2.39 (14.3 mCu/mmol or 67.7μCi/mg)
98
Sugar cane 2.86 (17.1 mCi/mmol or 77.2 μCi/mg)
> 98
* Checked using TLC.
Dicamba readily forms organic or inorganic salts in formulated products. However, concentrations are given for the pure acid rather than the salts throughout the current metabolism evaluation.
Animal metabolism
The Meeting received information on the results of studies on lactating goats and cows, and laying hens.
Metabolism studies on laboratory animals including rats were reviewed in the framework of toxicological evaluation by the current JMPR.
Generally, there were no differences in the disposition of dicamba between species and sexes. It was also shown that the anionic counter-ion of dicamba salts did not influence the absorption, metabolism or elimination of dicamba. In rat study, more than 95% of the administered dose is excreted in the urine with less than 5% via faeces. Dicamba was rapidly absorbed with peak levels within the first hour after administration and the peak levels were proportional to the dose. Only very minor portion of the administered dose was found in the organs. In urine, kidney and liver samples, more or less 90% of the recovered radioactivity was accounted for by the parent compound. Very low amounts of glucuronated dicamba, demethylated dicamba, 5-OH dicamba and glucuronated DCSA were found in pooled urine samples. Dicamba is poorly metabolized in laboratory animals and the metabolic pathway includes demethylation, hydroxylation and glucuronic acid conjugation. Rat metabolism is reviewed by JMPR at its present meeting.

Dicamba 945
Lactating goats
Three lactating goats were orally given gelatine capsules once a day (Guirguis A.S., Yu C.C. 1994). Goat A was dosed with 14C-dicamba at 0.4 mg/kg/day (equivalent to 10 ppm in the diet) for four consecutive days and sacrificed 24 hours after the last dose. Goat B was dosed with 14C-dicamba at 40 mg/kg/day (equivalent to 1000 ppm in the diet) for four consecutive days and sacrificed 7 hours after the last dose. This goat was used for metabolite isolation, characterisation, and identification purposes and not discussed in this evaluation. Goat C was used as a control and given the carrier only. Urine, faeces, and milk were collected twice daily (am and pm) for four days. Muscle, fat, kidney and liver samples were obtained for analysis after sacrifice. The entire gastrointestinal tract was also sampled.
Total radioactive residues (TRR) of pooled urine, cage wash and milk samples were determined directly by liquid scintillation counting (LSC). TRR of faeces was determined also by scintillation counting after drying and then combustion. Tissue samples were homogenized, dried and combusted before subjecting to scintillation counting.
A portion of pooled urine sample was freeze-dried and extracted with acetonitrile / acetone / ethanol (3:1:6). A portion of pooled faeces sample was homogenized with water, freeze-dried and extracted with acetonitrile / acetone / ethanol (3:1:6). Kidney after homogenization and freeze-drying , liver after freeze-drying, and fat were extracted with acetonitrile / acetone / ethanol (3:1:6). Sample extracts were subjected to thin layer chromatography (TLC) with various solvent systems, HPLC, and mass spectrometry (MS). Acidic or phenolic metabolites were converted to their methyl esters or ethers using diazomethane methylation procedures. The respective remaining solid was hydrolysed by refluxing in 1N HCl for one hour and extracted with ethyl acetate. Hereinafter, the organic fraction after extraction with acetonitrile / acetone / ethanol (3:1:6) is referred as “first organic fraction” and the other after extraction of acid-hydrolysate with ethyl acetate is referred as “second organic fraction”.
A total of 92.5% of the total administered dose was recovered from excreta, milk, edible tissues (Table 2) and cage wash (0.66% of the total administered dose). Of the total dose administered to Goat A, 83.2%, 8.5% and 0.019% were eliminated via urine, faeces, and milk, respectively. TRR in liver, kidney, fat, and muscle were low and accounted for 0.023%, 0.014%, 0.033%, and 0.12% of the total administered radioactivity. Residues in tissues in dicamba-equivalents were 0.014 mg/kg in liver, 0.054 mg/kg in kidney, 0.011 mg/kg in fat, and 0.0040 mg/kg in muscle, respectively.
Table2 Radioactive residues in excreta, milk and edible tissues of lactating goat following oral dose of [phenyl-U-14C]-dicamba at 0.4 mg/kg bw/day (equivalent to 10 ppm in the diet) for four days
Days After 1st Dose Urine Faeces Milk %TARa %TAR mg/kgb %TAR
0.2 5.29 0.16 0.0010 0.001 1.0 13.25 1.59 0.0012 0.003 1.3 1.40 0.34 0.0020 0.002 2.0 19.83 1.30 0.0014 0.003 2.3 8.53 0.71 0.0017 0.002 3.0 13.51 1.86 0.0007 0.002 3.3 9.42 0.32 0.0018 0.002 4.0 11.95 2.21 0.0014 0.003 Total 83.16 8.49 0.019
Days After 1st Dose
Liver Kidney Fat Muscle mg/kg % TAR mg/kg % TAR mg/kg % TAR mg/kg % TAR
4.0 0.014 0.023 0.054 0.014 0.011 0.033 0.0040 0.12
Fat was assumed to represent of 5% of body weight Muscle was assumed to represent 50% of body weight a Percent of total administered dose b Expressed in dicamba equivalents

946 Dicamba
Table 1 shows that in urine, the organic solvent fraction from freeze-dried pooled sample accounted for 99% of the total radioactive residues (TRR). Unchanged dicamba accounted for 93% of the radioactivity in this fraction. The presence of dicamba in the fraction was further confirmed by TLC and HPLC, and, after methylation, by GC/MS. A minor fraction (< 6% of the TRR) was identified as DCSA, also confirmed by TLC, HPLC and GC/MS. In addition, a very small amount (0.006%) of 5-OH dicamba was identified. Confirmation of the chemical structures was carried out using urine sample from Goat B with TLC, HPLC, and GC/MS verification of the methylated compounds.
Solvent-extractable radioactivity in the faeces consisted of 94% of the TRR. Non-extractable residues accounted for less than 8% of the TRR. Dicamba and DCSA represented 88% and 6% of the TRR, respectively. Their structures were confirmed by TLC and HPLC.
Organo-soluble radioactivity in liver (total of about 90% of TRR) consisted of 59% of TRR in the first organic fraction and 30% of TRR in the second organic fraction. The aqueous fraction after acid-hydrolysis and ethyl acetate extraction accounted for 5% and the non-extractable solid for 8%. The first organic fraction contained two compounds separable by TLC. The second organic faction produced three compounds separated by TLC. The parent compound was predominant accounting for 68% of the TRR (54% + 14%) or 0.0096 mg dicamba equivalents/kg. TLC and HPLC indicated that DCSA accounted for 12% of TRR or 0.0017 mg-dicamba equivalents/kg in liver. The third compound separated by TLC remained unknown due to its low radioactivity and accounted for 9.8% of the TRR or 0.0014 mg dicamba equivalent/kg.
Organo-soluble fractions from kidney accounted for a total of 103% of the TRR (77% in the first organic fraction and 26% in the second fraction). Aqueous and non-extractable fractions each accounted for 1% of the TRR only. The metabolite components of the first organic fraction and the second solvent fraction were qualitatively and quantitatively similar. Dicamba accounted for 93% of the TRR (72% in the first organic fraction and 21% in the second organic fraction) or 0.050 mg dicamba equivalents/kg. The structure of radioactive metabolites were confirmed by TLC, HPLC, and GC/MS. DCSA accounted for 5% of TRR or 0.003 mg dicamba equivalents/kg in both the first and second organic fractions.
The first organic fraction of fat accounted for 65% of TRR or 0.0068 mg dicamba equivalents/kg, whereas the second organic fraction accounted for 29% or 0.0031 mg dicamba equivalents/kg. Aqueous and non-extractable fractions accounted for less than 2% of TRR or 0.0002 mg dicamba equivalents/kg, and 9% of TRR or 0.0010 mg dicamba equivalents, respectively. Unchanged dicamba accounted for 63% of the first organic fraction. DCSA was characterised only in the first organic fraction at 1% of the TRR or 0.0001 mg dicamba equivalents/kg.
Radioactive residues in milk and muscle were not characterised due to their extremely low levels.
Table 3 Characterisation, identification and distribution of radioactive residues in excreta and edible tissues of lactating goat following oral dose of [14C]-dicamba at 0.4 mg/kg bw/day for four days
Compound Urine Faeces %TRR %TRR
Extracted with acetonitrile / acetone / ethanol (3:1:6) Dicamba 93.3 88.4DCSA 5.4 6.1 U2-2 0.1 - 5-OH dicamba 0.006 - Subtotal 98.8 94.5 Non-extractable 1.3 7.6 Total recovered 14C 100.1 102.1
Compound Liver Kidney Fat mg/kg a % TRR mg/kg % TRR mg/kg % TRR
Extracted with acetonitrile / acetone / ethanol (3:1:6) L1a 0.0000 0.00 - - - -

Dicamba 947
Compound Liver Kidney Fatmg/kg a % TRR mg/kg % TRR mg/kg % TRR
Dicamba 0.0076 53.9 0.0387 72.1 0.0067 63.3 DCSA 0.0008 5.3 0.0028 5.2 0.0001 1.2 Subtotal 0.0084 59.3 0.0415 77.3 0.0068 64.5 Extracted with ethyl acetate after Hydrolysis with 1N HCl L1a 0.0014 9.8 - - - - Dicamba 0.0020 14.1 0.0111 20.7 - - DCSA 0.0009 6.4 0.0029 5.4 - - Subtotal 0.0043 30.4 0.140 26.1 0.0031 29.2 Aqueous fraction 0.0008 5.5 0.0005 1.0 0.0002 1.8 Non-extractable 0.0011 7.7 0.0006 1.2 0.0010 9.2 Total recovered 14C 0.0145 102.8 0.0566 105.6 0.0110 104.2
a Expressed in dicamba equivalents
Lactating cows
A Holstein cow was catheterized and fed with Dicamba at the 5 ppm level (based on a ration of 22.7 kg) for four days (John L.E.S., Lisk D.J. 1969). The pure recrystallised compound in absolute ethyl alcohol was thoroughly mixed with the evening grain. Morning and evening subsamples of the total mixed milk were taken one day before feeding (control sample), daily throughout the feeding period, and for six days thereafter. The total daily urine and manure samples were similarly collected, weighed, mixed, and sub-sampled during the same test period. The manure samples were collected in specially constructed trays. All samples were immediately frozen before analysis. Dicamba in milk and faeces samples was determined by measuring peak heights and referring them to a standard curve developed by injection of 0 to 15 ng of dicamba. Analysis of urine samples was made by referring peak heights to a recovery curve developed by analysis of control urine samples to which 0 to 3.75 mg dicamba/kg were added.
Residues of dicamba were not detected in milk. Dicamba was excreted unchanged in the urine. Their concentrations in the urine from the second through the seventh day of the experiment were 3.4, 4.6, 4.3, 4.2, 4.1 and 0.1 mg/kg. This amounted to 73% of the total amount fed (454 mg) to the cow. Traces of dicamba were detected in faeces during the first four days of the feeding period but were too small to measure quantitatively.
In the other study, a 411-kg lactating Jersey cow was used (Oehler D.D., Ivie G.W. 1980). The cow received orally [Phenyl-U-14C]-dicamba in gelatine capsules (450 mg/capsule) twice a day over a period of five consecutive days. The dose rate was 2.2 mg [Phenyl-U-14C]-dicamba/kg bw/day which is equivalent to about 60 ppm in feed.
Urine and milk were collected at 12-hour intervals. Faeces were collected at 24-hour intervals. The cow was sacrificed 6 hours after the final dose and liver, kidney, omental fat, renal fat, muscle, ovary, spleen, tongue, brain and blood were immediately collected and frozen.
TRR in urine and milk was quantitated directly by LSC. The TRR in faeces and tissues was quantitated by combustion/LSC.
Faeces samples were extracted four times with methanol. The unextracted fraction was quantitated by combustion/LSC. Milk samples were adjusted to pH 2 with HCl and extracted with ethyl acetate. After centrifugation, the solvent was removed and the combined oily residue was taken up in hexane and partitioned with acetonitrile. The kidney was homogenized and extracted with acetonitrile. Liver samples were extracted by homogenizing with methanol. Clean up of the liver extracts was performed on a Florisil column. The methanol eluate was taken up in hexane and partitioned with acetonitrile. Urine samples were adjusted to pH 0.5 with HCl and then extracted with ethyl acetate. The organic phase was dried over anhydrous sodium sulfate and concentrated. Metabolites in urine samples suspected to be glucuronides were subjected to hydrolysis with HCl and β-glucuronidase.

948 Dicamba
TLC was used to characterise radioactive compounds in sample extracts. Identified metabolites were confirmed, where possible, by GC-MS.
Table 4 shows that 89% of the total administered dose was excreted in urine, 1.5% in faeces and less than 0.02% in milk. The radioactivity in milk reached the maximum of 0.04 mg dicamba equivalents/kg three days after the first treatment and declined slightly thereafter.
Table 4 Radioactive residues in excreta and milk of lactating cow following oral dose of [phenyl-U-14C]-dicamba at 2.2 mg/kg bw/day (equivalent to 60 ppm in the diet) for five days
Days after 1st treatment
Urine Faeces Milk mg/kg a % TAR b mg/kg % TAR mg/kg % TAR
0.5 48.9 5.52 0.01 0.0004 1.0 51.3 6.73 0.7 0.13 0.02 0.0014 1.5 54.7 7.55 0.02 0.00092.0 62.7 8.06 1.5 0.12 0.03 0.0016 2.5 65.7 10.6 0.04 0.0015 3.0 46.5 9.49 2.3 0.55 0.04 0.0029 3.5 82.0 8.58 0.03 0.0021 4.0 72.3 10.3 1.7 0.36 0.02 0.0030 4.5 114 9.06 0.02 0.0018 5.0 70.0 7.55 1.4 0.30 0.0023 At Sacrifice 81.4 5.43 1.1 0.07 Total 88.8 1.53 0.0179
a Expressed in dicamba equivalents/kg. b Percent of total administered dose.
Table 5 indicates that radioactive residues in sampled tissues were generally low, except in kidneys, in spite of the short time (six hours) after the last dose. The kidney contained the highest concentration of 2.59 mg/kg which coincide with the fact that most of the administered radioactivity was excreted in urine.
Table 5 Radioactive residues in tissues of lactating cow following oral dose of [phenyl-U-14C]-dicamba at 2.2 mg/kg bw/day (equivalent to 60 ppm in the diet) for five days
Tissue Radioactive residue (mg dicamba equivalents/kg)
Blood 0.40 Brain 0.01 Fat, omental 0.02Fat, renal 0.02 Heart 0.09 Kidney 2.59 Liver 0.30 Muscle (longissimus dorsi) 0.02 Muscle (triceps) 0.03 Ovary 0.25Spleen 0.05 Tongue 0.09
In faeces, milk, liver and kidney 88–93%, 70%, 80% and 82% of the TRR could be extracted, respectively. Distribution and characterisation of the radioactive residues in urine and faeces is shown in Table 6.
During one to five days after the initial treatment unchanged the majority of the total radioactive residues were dicamba (77–81% in urine and 75-84% in faeces) followed by DCSA (14–18% in urine and 8–13% in faeces). DCSA-glucuronide and DCP were found in small amounts in urine but was not detected in faeces.

Dicamba 949
Table 6 Distribution and characterisation of radioactive residues in urine and faeces during 1–5 days after the initial dose
Compound Urine Faeces%TRR %TRR
Dicamba 77-81 75-84 DCSA 14-18 8-13DCSA-glucuronide 2-3 0 DCP 2-4 0 Other < 1a 7-12b
a Radioactivity remaining at the origin after TLC in two solvent systems.
b Radioactivity not extractable from the faeces residue.
In milk, the only metabolite detected by TLC was DCSA. Because of the low amounts of radioactivity present its presence could not be confirmed by GC/MS.
In liver, unchanged dicamba and DCSA accounted for 51% and 21% of TRR, respectively. Three% of the TRR was unidentified and 5% of the extracted radioactivity remained at the origin of the TLC plate.
In kidney, unchanged dicamba and DCSA accounted for 70% and 11% of the TRR, respectively.
As with milk, sufficient quantities were not available in liver and kidney for GC/MS confirmation.
Laying hens
Each of five laying hens (White Leghorn) was given daily one gelatine capsule containing [Phenyl-U-14C]-dicamba and starch for four consecutive days at a nominal rate of 0.6 mg/kg bw/day, which is equivalent to approximately 10 ppm in the diet (Nietschmann D.A., Yu C.C. 1994). The hens were sacrificed 24 hours after the last dose. Three additional hens were orally administered 30 mg/kg bw/day (equivalent to 500 ppm in the diet) for four consecutive days and sacrificed 7 hours after the last dose. The purpose of the high dose was to generate larger amounts of metabolites for instrumental analysis. Control hens received capsules containing only starch.
Excreta and eggs were collected daily. Liver, breast muscle, leg muscle, and fat were collected at slaughter. Eggs were separated into whites and yolks. The gut was also sampled for material balance purposes.
Liquid samples were counted directly by LSC. Solid samples were combusted to 14CO2, trapped and counted by LSC. Liver and excreta samples were homogenized in a solvent mixture of acetonitrile, acetone and ethanol (3:1:6) and the organic fraction was removed. Remaining solids were hydrolysed with 1 N HCl and extracted with ethyl acetate. Eggs were lyophilized and extracted with hexane to remove lipids before underwent the same extraction procedure as liver or excreta. Analyses were performed using TLC, HPLC and MS.
A total of 89% of the total administered dose was recovered in excreta, eggs, tissues and gut content.
Table 7 indicates that a total of 89% of the total administered dose was excreted via excreta and 0.014% via eggs (0.009% from egg whites and 0.005% from egg yolks), respectively. An additional 0.043% of the total administered dose was found in the gut content taken at sacrifice.
Liver, breast muscle, leg muscle, and fat accounted for 0.003%, 0.004%, 0.004%, and 0.001% of the total administered radioactivity, respectively. Tissue residues were 0.0029, 0.0003 in, 0.0005 and 0.0002 mg dicamba equivalents/kg in liver, leg muscle, breast muscle and fat, respectively. The total radioactive residues in these tissues accounted for only 0.011% of the total administered dose.
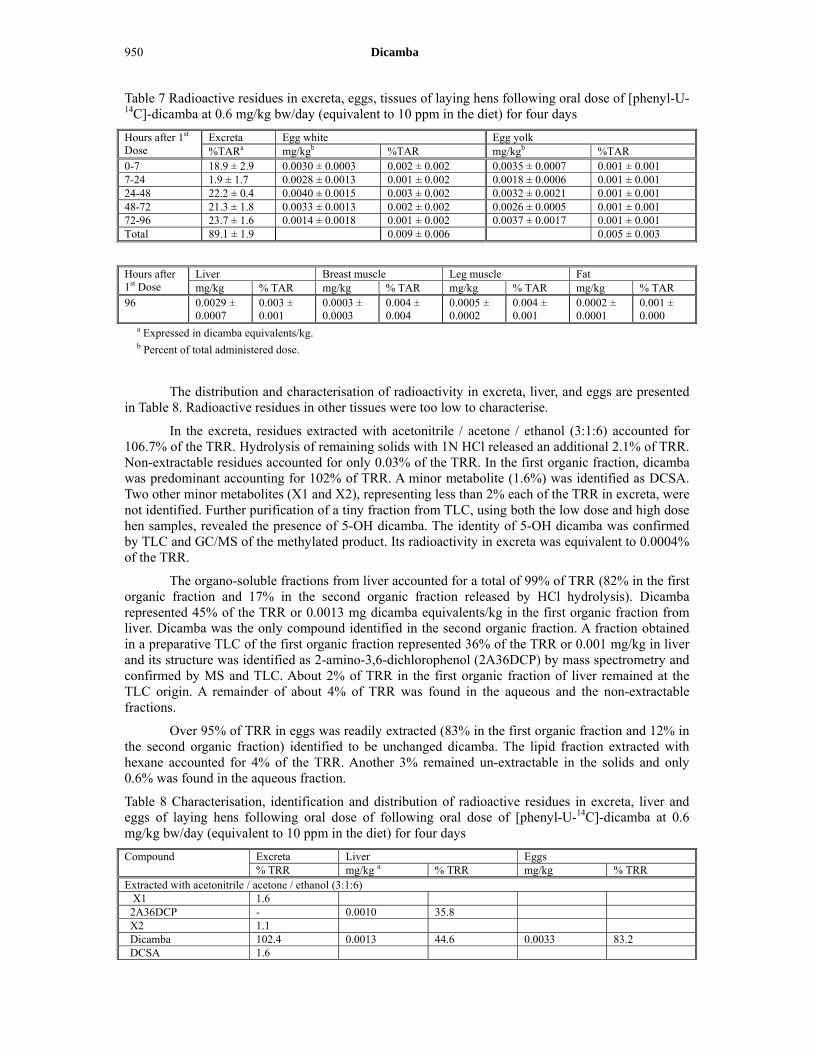
950 Dicamba
Table 7 Radioactive residues in excreta, eggs, tissues of laying hens following oral dose of [phenyl-U-14C]-dicamba at 0.6 mg/kg bw/day (equivalent to 10 ppm in the diet) for four days
Hours after 1st Dose
Excreta Egg white Egg yolk%TARa mg/kgb %TAR mg/kgb %TAR
0-7 18.9 ± 2.9 0.0030 ± 0.0003 0.002 ± 0.002 0.0035 ± 0.0007 0.001 ± 0.001 7-24 1.9 ± 1.7 0.0028 ± 0.0013 0.001 ± 0.002 0.0018 ± 0.0006 0.001 ± 0.001 24-48 22.2 ± 0.4 0.0040 ± 0.0015 0.003 ± 0.002 0.0032 ± 0.0021 0.001 ± 0.00148-72 21.3 ± 1.8 0.0033 ± 0.0013 0.002 ± 0.002 0.0026 ± 0.0005 0.001 ± 0.001 72-96 23.7 ± 1.6 0.0014 ± 0.0018 0.001 ± 0.002 0.0037 ± 0.0017 0.001 ± 0.001 Total 89.1 ± 1.9 0.009 ± 0.006 0.005 ± 0.003
Hours after 1st Dose
Liver Breast muscle Leg muscle Fat mg/kg % TAR mg/kg % TAR mg/kg % TAR mg/kg % TAR
96 0.0029 ± 0.0007
0.003 ± 0.001
0.0003 ± 0.0003
0.004 ± 0.004
0.0005 ± 0.0002
0.004 ± 0.001
0.0002 ± 0.0001
0.001 ± 0.000
a Expressed in dicamba equivalents/kg. b Percent of total administered dose.
The distribution and characterisation of radioactivity in excreta, liver, and eggs are presented in Table 8. Radioactive residues in other tissues were too low to characterise.
In the excreta, residues extracted with acetonitrile / acetone / ethanol (3:1:6) accounted for 106.7% of the TRR. Hydrolysis of remaining solids with 1N HCl released an additional 2.1% of TRR. Non-extractable residues accounted for only 0.03% of the TRR. In the first organic fraction, dicamba was predominant accounting for 102% of TRR. A minor metabolite (1.6%) was identified as DCSA. Two other minor metabolites (X1 and X2), representing less than 2% each of the TRR in excreta, were not identified. Further purification of a tiny fraction from TLC, using both the low dose and high dose hen samples, revealed the presence of 5-OH dicamba. The identity of 5-OH dicamba was confirmed by TLC and GC/MS of the methylated product. Its radioactivity in excreta was equivalent to 0.0004% of the TRR.
The organo-soluble fractions from liver accounted for a total of 99% of TRR (82% in the first organic fraction and 17% in the second organic fraction released by HCl hydrolysis). Dicamba represented 45% of the TRR or 0.0013 mg dicamba equivalents/kg in the first organic fraction from liver. Dicamba was the only compound identified in the second organic fraction. A fraction obtained in a preparative TLC of the first organic fraction represented 36% of the TRR or 0.001 mg/kg in liver and its structure was identified as 2-amino-3,6-dichlorophenol (2A36DCP) by mass spectrometry and confirmed by MS and TLC. About 2% of TRR in the first organic fraction of liver remained at the TLC origin. A remainder of about 4% of TRR was found in the aqueous and the non-extractable fractions.
Over 95% of TRR in eggs was readily extracted (83% in the first organic fraction and 12% in the second organic fraction) identified to be unchanged dicamba. The lipid fraction extracted with hexane accounted for 4% of the TRR. Another 3% remained un-extractable in the solids and only 0.6% was found in the aqueous fraction.
Table 8 Characterisation, identification and distribution of radioactive residues in excreta, liver and eggs of laying hens following oral dose of following oral dose of [phenyl-U-14C]-dicamba at 0.6 mg/kg bw/day (equivalent to 10 ppm in the diet) for four days
Compound Excreta Liver Eggs % TRR mg/kg a % TRR mg/kg % TRR
Extracted with acetonitrile / acetone / ethanol (3:1:6) X1 1.6 2A36DCP - 0.0010 35.8 X2 1.1 Dicamba 102.4 0.0013 44.6 0.0033 83.2 DCSA 1.6

Dicamba 951
Compound Excreta Liver Eggs% TRR mg/kg a % TRR mg/kg % TRR
5-OH dicamba 0.0004 L3 - < 0.0001 2.1 Subtotal 106.7 82.4 83.2 Extracted with ethyl acetate after Hydrolysis with 1N HCl Dicamba 0.0005 16.6 0.0005 12.0 Ethyl acetate fraction subtotal
2.1 - - - -
Aqueous fraction 0.06 < 0.0001 0.96 0.0000 0.55 Non-extractable 0.03 0.0001 3.0 0.0001 3.2 Hexane wash - - - 0.0002 4.3 Total recovered 14C 108.9 102.9 103.3
a Expressed in dicamba equivalents
In other metabolism study, laying hens were separated into three groups, Group A, B and C (Yu C.C., Atallah Y.H. 1983). Each group consisted of four hens and received [Phenyl-U-14C]-dicamba via different routes or at different dose levels. Group A and B received a single oral dose of 1 mg/kg bw and 100 mg/kg bw of 14C-dicamba, respectively, by gavage. Group C received a single dose of 1 mg/kg bw 14C-dicamba by intravenous injection. Four hens served as controls.
Excreta were collected at 7 hours and 1, 2, 3, and 4 days after dosing. Blood was sampled at 0.5, 1, 2, 4, 6, and 7 hours after dosing from two hens from each of the treatment groups. These hens were sacrificed 24 hours after dosing. The remaining hens were sacrificed 4 days after dosing. Tissues collected at sacrifice were lung, fat, kidney, liver, brain, heart, muscle, blood, spleen, and ovary. Any eggs laid during the study were radio-assayed.
Liquid samples were counted directly using LSC. Excreta and kidney samples were extracted with acidified diethyl ether, providing ether, aqueous, and non-extractable fractions. Samples were analysed by TLC, GC and MS.
Table 9 indicates that orally administered 14C-dicamba was rapidly absorbed. Radioactive residues in blood reached the maximum within 30 minutes after oral administration. The radioactivity in blood decreased rapidly in both orally and intravenously dosed animals. The decrease of blood radioactivity followed first-order kinetics with a half-life of 1.1 hours for the dosed hens.
Both orally and intravenously administered 14C-dicamba was rapidly eliminated in the excreta. Fifty to 80% of the total administered dose was eliminated within 7 hours. An additional 5% to 25% was excreted in the next 17 hours. The half-life of elimination in the excreta ranged from 4 to 5 hours.
Table 9 Radioactive residues in blood and excreta of laying hens following single oral administration or intravenous injection of [phenyl-U-14C]-dicamba at 1 or 100 mg/kg bw
Hours after dosing Percent of Total Administered Radioactivity recovered Oral administration Intravenous injection 1 mg/kg bw 100 mg/kg bw 1 mg/kg bw
Blood 0.5 5.18 10.67 4.77 1 3.97 6.48 2.34 2 1.62 2.81 0.77 4 1.54 0.73 0.19 6 1.50 0.37 0.10 7 1.41 0.23 0.07 24 0.22 0.21 0.02Excreta 0-7 46.79 63.10 82.02 7-24 28.53 16.25 3.5024-48 1.52 2.73 0.96 48-72 0.25 0.70 0.29 72-96 0.12 0.19 0.23

952 Dicamba
Hours after dosing Percent of Total Administered Radioactivity recoveredOral administration Intravenous injection 1 mg/kg bw 100 mg/kg bw 1 mg/kg bw
Total in excreta 78.4 83.0 87.0
Tissue residues were low as shown in Table 10. Approximately 0.06% of the intravenously administered dose was found in the eleven tissues 24 hours after dosing. The amount decreased to 0.01% after four days. In orally dosed hens, 0.6% to 0.8% of the dose was in the tissues 24-hours after dosing and decreased to 0.02% at day 4. Kidneys contained the highest level of radioactivity in all 3 treatment groups. Residue levels in tissues decreased significantly 4 days after dosing. Only kidney showed a detectable residue after 4 days.
Table 10 Radioactive residues in tissues of laying hens sacrificed 24 hours or 4 days after single oral administration or intravenous injection of [phenyl-U-14C]-dicamba at 1 or 100 mg/kg bw
Tissue Radioactive Residues (mg dicamba equivalents/kg) Oral administration Intravenous injection 1 mg/kg bw 100 mg/kg bw 1 mg/kg bw 24 hours 4 days 24 hours 4 days 24 hours 4 days
Lung 0.017 < 0.005 0.59 < 0.5 < 0.005 < 0.005 Fat < 0.005 < 0.005 < 0.5 < 0.5 < 0.005 < 0.005Kidney 0.117 0.034 8.97 2.42 0.036 0.017 Liver 0.018 < 0.005 1.00 < 0.5 < 0.005 < 0.005 Brain < 0.005 < 0.005 < 0.5 < 0.5 < 0.005 < 0.005 Heart < 0.005 < 0.005 0.34 < 0.5 < 0.005 < 0.005 Muscle < 0.005 < 0.005 < 0.5 < 0.5 < 0.005 < 0.005 Blood 0.015 < 0.005 1.59 < 0.5 < 0.005 < 0.005 Spleen < 0.005 < 0.005 < 0.5 < 0.5 < 0.005 < 0.005 Ovary < 0.005 < 0.005 < 0.5 < 0.5 < 0.005 < 0.005 Body burden a 0.798 0.025 0.650 0.016 0.061 0.010
a Total radioactivity remaining in body, including gut content, expressed as percent of dose.
Most of the radioactivity in excreta and kidney were readily extracted by acidified diethyl ether (Table 11).
Table 11 Extraction of radioactivity in the excreta and kidney of laying hens sacrificed 24 hours or 4 days after single oral administration or intravenous injection of [phenyl-U-14C]-dicamba at 1 or 100 mg/kg bw
Fraction Percent of TRR Oral administration Intravenous injection 1 mg/kg bw 100 mg/kg bw 1 mg/kg bw 0-7 h 7-24 h 0-7 h 7-24 h 0-7 h 7-24 h
Excreta Ether fraction 97.9 96.5 98.1 96.1 99.0 92.4 Aqueous fraction 0.39 0.85 0.69 0.78 0.45 2.9 Non-extractable 1.7 2.7 1.18 3.2 0.60 4.7 Kidney Ether fraction - 87.9 - 70.8 Aqueous fraction - 1.2 - 0.66 Non-extractable - 11.0 - 28.5
Kidney samples from hens with intravenous injection was not analysed due to low radioactivity.
More than 94% of the TRR in the ether extracts was the parent compound (Table 12). A significant metabolite, identified as DCSA, accounted for 1% to 5% of the TRR in excreta. It was not detected in kidney. There were several minor unidentified metabolites (UK 1, UK 2, UK 3, UK 4, UK 5), each accounting for 1% of the TRR in excreta. Among them, only UK5 was present in ether extracts of kidney accounting for 3% to 6% of the TRR.

Dicamba 953
Table 12 Characterisation and identification radioactive residues in the excreta and kidney of laying hens sacrificed 24 hours or 4 days after single oral administration or intravenous injection of [phenyl-U-14C]-dicamba at 1 or 100 mg/kg bw
Compound Percent of TRR in ether fractions Oral administration Intravenous injection 1 mg/kg bw 100 mg/kg bw 1 mg/kg bw 0-7 h 7-24 h 0-7 h 7-24 h 0-7 h 7-24 h
Excreta UK1 0.75 0.47 0.18 0.97 0.34 0.00 UK2 0.55 0.44 0.48 0.96 0.85 0.00 Dicamba 95.7 94.0 97.6 94.3 95.7 94.0 DCSA 2.35 3.64 1.37 3.40 2.36 4.92 UK3 0.35 0.86 0.19 0.11 0.33 0.00 UK4 0.17 0.50 0.14 0.05 0.27 0.00 UK5 0.12 0.09 0.08 0.19 0.22 1.08 Kidney Dicamba - 94.9 - 96.6 UK5 - 5.82 - 3.44
UK = unknown
Orally administered dicamba to goat, cow and hen was rapidly absorbed into body and efficiently eliminated mainly in urine and, to a much smaller extent, in faeces. The fate of dicamba is similar in rats. No significant accumulation of radioactivity in edible tissues, milk and eggs was observed, such as meat milk, eggs and fat was therefore observed, i.e., residue concentrations in edible tissues, milk and eggs were very low or below LOQ.
Unchanged dicamba was a major component in animal excreta and tissues and hen eggs. DCSA was a significant metabolite excreted in cow and goat urine, cow and goat faeces, chicken excreta, and cow milk. DCP was detected in cow urine, whereas 2A36DCP was found in only hen liver.
Studies of metabolism in lactating goat and cows and laying hens, as well as rats, indicate that the metabolism of dicamba was qualitatively similar for goat, cow, hen and rat and seems to proceed via the same major pathways: O-demethylation, hydroxylation at 5-position, decarboxylation, substitution of carboxyl group with an amino group, and conjugation with glucuronic acid.
Proposed metabolic pathway of dicamba in these animals is shown in Figure 1.

954 Dicamba
Figure 1 Proposed metabolic pathway of dicamba in animals
Plant Metabolism
The Meeting received information on the fate of dicamba after foliar post-emergence applications in soya bean, wheat, sugar cane and cotton.
Soya bean
Foliar absorption, translocation and metabolism of 14C-dicamba was studied in Woodstock, Illinois, USA, using field grown soya bean plants (variety Farm Service Hysoy 225) with foliar application at early podfill and late senescent stages (Butz R.G., Atallah Y.H. 1982). In order to avoid phytotoxicity to soya bean plants and their morphological changes, the no-effect level was determined in the preliminary experiment and used as the treatment concentration in the study.
In the first metabolism study using an early podfill stage application, approximately 5 µg/plant of dicamba was chosen as the no-effect level. The application solution consisted of the dimethyl amine salt of 14C-dicamba acid in an aqueous Triton X-100 solution. A total of 20 plants were treated with 300 µL/plant corresponding to 5.17 µg of 14C-dicamba/ plant (50 µL/each of six leaves, corresponding to ca. 0.86 µg/Leaf). Leaves were sampled immediately after treatment and seven days later. The remaining leaves were taken 14 days after treatment. Plants were dissected into untreated leaves and petioles, shoots, roots, pods, and seeds.
In the second metabolism study using late senescent stage application, a six-day experiment was conducted with ten plants treated as described above with the same application solution. Leaves were sampled immediately after treatment. Each day thereafter, all plants were inspected for abscised
DCSA
goat, cow, rat, hen
Cl
Cl
O
COOH
Dicamba
goat, cow, rat, hen
Cl
Cl
OH
COOH
5-OH Dicamba
goat, rat
Cl
Cl
O
COOH
OH
O-Gluc DCSA
cow, rat
Cl
OHCl
DCP
cow (only in urine)
Cl
OHCl
NH2
2A36-DCP
hen (only in liver)
O-Gluc dicamba
rat

Dicamba 955
leaves (which were taken for analysis). The remaining leaves and plants were harvested after six days. The plants were dissected in the same manner as in the first experiment.
The TRR was determined by combustion, trapping of the 14CO2, and LSC. Based on the TRR, treated leaves and seeds were selected for characterisation of the radioactivity in the first metabolism study. In the second study, samples of seed, treated leaves that had abscised, and treated leaves that remained after the six-day period were characterised. Treated leaf or seed samples were extracted with a mixture of ethyl ether, 20% Sulfuric acid and ethanol (30:1:1) and separated into ether fraction, aqueous fraction and solids. To the ether fraction, 2% aqueous NaHCO3 (pH 8.5) was added and aqueous fraction and ether fraction were separated. The resulting aqueous fraction was acidified with 6N HCl to pH 1 and to this solution ethyl ether was added. The mixture was separated into ether fraction and aqueous fraction. Seed samples were first extracted with ether to remove lipid material before acidification. Analyses of extracts and non-extractable residues were carried out using LSC or combustion followed by LSC. Extracts were analysed by TLC and LSC.
The radioactivity found in or on leaves after both treatments declined as shown in Table 13, probably due to volatilization. After the early podfill stage application, 85% of the applied dose was found immediately after the application but the TRR found 7 and 14 DAT dropped to 4.6% and 2.7% of the applied dose, respectively. After the late senescent stage application, 77% of the applied radioactivity was found immediately after application but the TRR declined to 12% and 11%, respectively, in the 1–5 DAT sample and the 6 DAT sample, respectively.
Table 13 Radioactive residues in soya bean leaves after foliar application with 14C-Dicamba
DAT Early podfill stage application a Late senescent stage application b µgc/leaf % TAR µgc/leaf % TAR
0* 0.732 85.0 0.660 76.6 1–5 - - 0.106 12.3 6 - - 0.097 11.3 7 0.040 4.6 - - 14 0.023 2.7 - -
* 0.862 µg dicamba equivalents were initially applied to each leaf a Average of five replicates b Average of three replicates c Expressed in µg dicamba equivalents
As demonstrated in Table 14 after the early podfill stage application, 42% of the applied radioactivity was recovered from the plant samples taken 0 through 14 days after treatment. About one half of the recovered radioactivity was present in the immature beans. Translocation of radioactivity from treated leaves to the beans was significant whereas translocation of radioactivity to untreated leaves, roots or stems was negligible.
Fourteen days after the early podfill stage application, the treated leaves, untreated leaves, stems, roots, pods, and immature beans contained radioactive residues of 0.07 µg, 0.03 µg, 0.05 µg, 0.03 µg, 0.08 µg, and 1.1 µg dicamba equivalents. The total recovered radioactive residues amounted to 1.4 µg, representing 27% of the applied dose.
Table 14 Total radioactivity in soya bean plants after foliar treatment with 14C-dicamba at early podfill stage
Sample DAT Radioactive residues µg*/plant % TAR
Treated leaves 0 a 0.73 14.2 7 b 0.08 1.5 14 c 0.07 1.4
Untreated leaves 14 0.03 0.6 Stems 14 0.05 1.0 Roots 14 0.03 0.6 Pods 14 0.08 1.5

956 Dicamba
Sample DAT Radioactive residuesµg*/plant % TAR
Immature beans 14 1.11 21.4 Total recovery (0-14 DAT) 2.17 - Percent recovery (0-14 DAT) - 42.1
* Expressed in µg dicamba equivalents
a one leaf per plant harvested b two leaves per plant harvested c three leaves per plant harvested
As shown in Table 15, after the late senescent stage application, an average of 63% of the applied radioactivity was found in the plant samples taken 0 through 6 days after application. Even at this late stage of growth, while the major portion of the radioactivity was found in the leaves, movement of radioactivity into untreated plant parts was evident. Translocation of radioactivity from treated leaves to the beans amounted to an average of 0.11 µg out of the total recovered radioactivity (3.3 µg) which represents 63% of the applied dose.
Six days after the late senescent stage application, the treated leaves, untreated leaves, stems, roots, pods, and immature beans contained radioactive residues of 1.0 µg, 0.07 µg, 0.08 µg, 0.003 µg, 0.07 µg, and 0.11 µg dicamba equivalents.
Table 15 Total radioactivity in soya bean plants after foliar treatment with 14C-dicamba at late senescent stage
Sample DAT Radioactive residues µg*/plant % TAR
Treated leaves 0 a 0.66 12.8 Treated leaves abscised 1-5 1.25 24.2 Treated leaves not abscised 6 1.02 19.7 Untreated leaves 6 0.07 1.4 Stems 6 0.08 1.6 Roots 6 0.003 0.1 Pods 6 0.07 1.4 Immature beans 6 0.11 2.1 Total recovery (0-6 DAT) 3.26 - Percent recovery (0-6 DAT) - 63.0
* Expressed in µg dicamba equivalents
a one leaf per plant harvested
Characterisation of the radioactivity in leaves and beans 14 days after the early podfill stage application and 1–6 days after the senescent stage application is presented in Table 16.
Fourteen days after the early podfill stage application, solvent extractable fraction of the treated leaves accounted for the majority (88%) of the TRR whereas water-soluble fraction represented only 4.8% of TRR. Analysis of the solvent-extractable fraction showed dicamba and DCSA accounting for 64% and 17%, respectively, of the TRR.
In immature beans, solvent-extractable fraction accounted for 96% of the TRR almost all of which (94% of the TRR) was unchanged dicamba. A small portion (0.6% of TRR) was identified as DCSA. Water-soluble fraction represented only 1.5% of the bean TRR.
Non-extractable residues amounted to only 0.5% and 3.1% of the TRR in leaves and immature beans, respectively.
One to five days after the senescent stage application, solvent-extractable fraction of the abscised treated leaves accounted for the majority (86%) of the TRR. Water-soluble fraction represented only 8.3% of the TRR. In the solvent-extractable fraction, dicamba, DCSA, 5-OH dicamba, and DCGA accounted for 79%, 0.3%, 0.2%, and 0.1% of the TRR, respectively.

Dicamba 957
Solvent-extractable fraction of non-abscised treated leaves (6 DAT) accounted for the majority (76%) of the TRR whereas water–soluble fraction represented only 6.4% of the TRR. Analysis of the solvent extractable fraction showed dicamba, DCSA, 5-OH dicamba, and DCGA amounting 64%, 0.7%, 0.2%, and 0.1% of the TRR, respectively.
In the immature beans, solvent-extractable fraction contained 55% of the TRR in which unchanged dicamba accounted for 44% of the TRR. Far less amounts of radioactivity (0.3%, 1.0% and 0.5%, respectively) were attributed to DCSA, 5-OH dicamba and DCGA. Aqueous fraction represented 7.7% of the TRR.
The non-extractable fraction amounted to 4.6%, 7.8%, and 37% of the TRR in abscised leaves, non-abscised leaves, and beans, respectively. Since 37% of the TRR in the non-extractable fraction of beans accounted for less than 1% of the TAR, characterisation was not attempted.
Table 16 Characterisation of radioactive residues in treated leaves and immature beans 14 days after foliar application at early podfill stage or 1–6 days after foliar application at late senescent stage with 14C-dicamba
Fraction % of TRR Dicamba DCSA 5-OH
dicamba DCGA Unidentified Total
Recovery Early podfill stage application Treated Leaves Ether fraction 64.1 17.0 7.0 a 88.1 Aqueous fraction b - - 4.8 - Non-extractable b - - 0.5 - Total 64.1 17.0 12.3 93.4 Immature Beans Ether fraction 94.3 0.6 1.5 b 96.4 Aqueous fraction b - - 1.5 - Non-extractable b - - 3.1 - Total 94.3 0.6 6.1 101.0
Late senescent stage application Treated Leaves abscised (1-5 DAT) Ether fraction 79.0 0.3 0.2 0.1 6.0 b 85.6 Aqueous fraction - - - - 8.3 - Non-extractable - - - - 4.6 - Total 79.0 0.3 0.2 0.1 18.9 c 98.6 Treated Leaves not abscised (6 DAT) Ether fraction 63.7 0.7 0.2 0.1 11.4 b 76.1 Aqueous fraction - - - - 6.4 - Non-extractable - - - - 7.8 - Total 63.7 0.7 0.2 0.1 25.6 d 90.3 Beans (6 DAT) Ether fraction 44.0 0.3 1.0 0.5 9.0 b 54.8 Aqueous fraction - - - - 7.7 - Non-extractable - - - - 37.3 - Total 44.0 0.3 1.0 0.5 54.0 e 99.5
a Includes radioactivity that “tailed” and/or material at the origin of the TLC plate b Radioactivity in the aqueous fraction and non-extractable residues was not characterised because it accounted for less than 1% of the applied radioactivity. c The total of 18.9% equals 4.6% of the applied dose. d The total of 25.6% equals 5.0% of the applied dose. e The total of 54.0% equals 1.1% of the applied dose.

958 Dicamba
Wheat
Uptake, distribution, and metabolism of 14C-dicamba was studied after foliar spray application at growth stage 29 (beginning of stem elongation) to field grown spring wheat (variety Frisal) in St. Aubin, Switzerland (Voellmin S. 1999). 14C-dicamba solution was applied at the recommended use rate of 144 g ai (acid equivalent)/ha in an application volume of 500 L/ha. Forage samples (50% maturity, GS 49) were collected 18 days after application. Mature plants were harvested 85 days after application and separated into grain and straw.
Samples were homogenized prior to analysis. The TRR was determined by combustion, trapping of the 14CO2, and LSC. Samples were extracted with methanol/water (8:2). The remaining residue was then subjected to microwave oven extraction with propanol/water (8:2). Extracts were assayed by LSC and the non-extractable residues were combusted. Samples were analysed by TLC and HPLC. Enzyme cleavage with β-glucosidase and hydrolysis with HCl and NaOH were also conducted for the analysis non-extractable residues.
The distribution of radioactivity in soil and wheat forage, grain, and straw are presented in Table 17.
Dicamba was incorporated into the leaves but the bulk of the radioactivity remained in the treated leaves. Only a small amount of radioactivity was translocated to the grain.
Radioactive residues in wheat forage, grain, and straw were 1.09, 0.056 and 1.90 mg dicamba equivalents/kg, respectively. Unchanged dicamba residues were 0.026, 0.009 and 0.042 mg/kg in forage, grain, and straw, respectively.
Very little of the applied radioactivity was found in the soil immediately after the foliar application and at harvest. Soil residues in the 0 - 10 cm layer were 0.066 mg dicamba equivalents/kg immediately after application and 0.054 mg dicamba equivalents/kg at harvest. Parent dicamba was not detected (< 0.001 mg/kg) in soil at harvest.
Table 17 Distribution of Radioactivity after foliar application of 14C-dicamba to spring wheat
Matrix Time after application
TRR (µg/kg)a
Dicamba (µg/kg)
Cold extraction (%) b
Microwave extraction (%)
Non-extractable (%)
Total (%)
Grain 85 days 56 9 32.7 12.0 59.4 104.1 Forage 18 days 1089 26 91.5 0.9 4.6 97.0Straw 85 days 1901 42 9.8 6.9 79.6 96.3 Soil 0-10 cm 1 hour 66 - 7 - - - - Soil 0-10 cm 85 days 54 < 1 3.0 5.5 86.0 94.5 Soil 10-20 cm 85 days < 1 - - - - - Soil 20-30 cm 85 days < 1 - - - - -
a in dicamba-equivalents b based on the whole radioactivity in that plant part/soil
The distribution of radioactivity in wheat samples following cold and microwave extraction was studied. The cold blending (Polytron) extraction removed 91.5%, 32.7%, and 9.8% of the TRR in the forage, grain and straw, respectively. Subsequent microwave extraction removed an additional 0.9%, 12.0%, and 6.9% of the radioactivity in the forage, grain, and straw, respectively.
The distribution of radioactivity in forage following both cold and microwave extraction is presented in Table 18.
The major metabolite in forage was the glucoside of 5-OH dicamba, which amounted to 0.70 mg dicamba equivalents/kg (65% of the TRR). Unchanged dicamba was present in an amount equal to 0.026 mg dicamba equivalents/kg (2.3% of the TRR). After hydrolysis, 0.084 mg dicamba equivalents/kg (7.7% of the TRR) was released as parent, resulting in a total of 0.11 mg dicamba equivalents/kg (10% of the TRR). DCSA was present only as a conjugate at 0.047 mg dicamba

Dicamba 959
equivalents/kg (4.3% of the TRR). All other metabolite fractions, including DCGA were present only in trace amounts (< 0.01 mg dicamba equivalents/kg).
Non-extractable residues of forage, remaining after both the cold and microwave extraction, amounted to 0.05 mg dicamba equivalents/kg or 4.6% of the TRR.
Table 18 Characterisation of radioactive residues in forage 18 days after foliar application of 14C-dicamba to spring wheat
Compound Cold extraction Microwave extraction Total % TRR µg/kg a % TRR µg/kg a % TRR µg/kg a
I1 (Start) 8.2 c 89 0.2 2 8.4 91 I2 0.5 5 < 0.1 < 1 0.5 5 I3 n.d. n.d. n.d. n.d. n.d. n.d. I4 n.d. n.d. n.d. n.d. n.d. n.d. DCGA, free n.d. n.d. n.d. n.d. n.d. n.d. DCGA, conj. b 0.2 3 n.d. n.d. 0.2 2 DCGA, total 0.2 3 n.d. n.d. 0.2 2 DCSA, free n.d. n.d. n.d. n.d. n.d. n.d. DCSA, conj. 4.3 47 n.d. n.d. 4.3 47 DCSA, total 4.3 47 n.d. n.d. 4.3 47 5-OH dicamba, free 0.1 2 < 0.1 n.d. 0.1 2 5-OH dicamba, conj. 64.6 703 n.d. n.d. 64.6 703 5-OH dicamba, total 64.7 705 < 0.1 n.d. 64.7 705 Dicamba, free 1.8 20 0.5 6 2.3 26 Dicamba, conj. 7.7 84 n.d. n.d. 7.7 84 Dicamba, total 9.5 104 0.5 6 10.0 110 I9 n.d. n.d. 0.1 < 1 n.d. < 1 Unresolved 1.7 19 < 0.1 < 1 1.7 18 Sub-total 89.1 970 0.8 9 89.9 979 Non-extractables - - 4.6 50 Total Recovery - - 94.5 1029 TRR 1089
n.d. = not detected a Dicamba-equivalents b mainly as β-glucosides c consists of several polar components
The distribution of radioactivity in grain and straw following both cold and microwave extraction is displayed in Table 2.
In grain, each metabolite fraction was < 0.01 mg dicamba equivalents/kg and < 2% of the TRR except unchanged dicamba which amounted to 0.009 mg/kg but 16% of the TRR. Metabolites I5-I7 showed residue levels below the limit of quantitation (< 0.001 mg dicamba equivalents/kg).
In straw each metabolite fraction was < 5% of the TRR. The major metabolite in the extracts was 5-OH dicamba which amounted to 0.070 mg dicamba equivalents/kg or 3.7% of the TRR. Parent compound amounted to 0.043 mg dicamba equivalents/kg or 2.3% of the TRR and metabolite DCSA 0.018 mg dicamba equivalents/kg or 0.9% of the TRR.
Non-extractable residues, remaining after both the cold and microwave extraction, represented 0.033 mg dicamba equivalents/kg (59% of the TRR) and 1.51 mg dicamba equivalents/kg (80% of the TRR), respectively, in wheat grain and straw.
Table 19 Characterisation of radioactive residues in grain and straw 85 days after foliar application of 14C-dicamba to spring wheat
Compound Cold extraction Microwave extraction Total % TRR µg/kg a % TRR µg/kg a % TRR µg/kg a
Grain I1 (Start) 5.1 c 3 8.0 5 13.1 8 I2 1.0 < 1 n.d. n.d. 1.0 < 1

960 Dicamba
Compound Cold extraction Microwave extraction Total % TRR µg/kg a % TRR µg/kg a % TRR µg/kg a
I3 1.2 < 1 n.d. n.d. 1.2 < 1 I4 n.d. n.d. n.d. n.d. n.d. n.d. DCGA, free n.d. n.d. n.d. n.d. n.d. n.d. DCGA, conj. b n.d. n.d. n.d. n.d. n.d. n.d. DCGA, total n.d. n.d. n.d. n.d. n.d. n.d. DCSA, free 0.5 < 1 n.d. n.d. 0.5 < 1 DCSA, conj. n.d. n.d. n.d. n.d. n.d. n.d. DCSA, total 0.5 < 1 n.d. n.d. 0.5 < 1 5-OH-dicamba, free 0.7 < 1 n.d. n.d. 0.7 < 1 5-OH-dicamba, conj. n.d. n.d. n.d. n.d. n.d. n.d. 5-OH-dicamba, total 0.7 < 1 n.d. n.d. 0.7 < 1 Dicamba, free 12.7 7 3.4 2 16.1 9 Dicamba, conj. n.d. n.d. n.d. n.d. n.d. n.d. Dicamba, total 12.7 7 3.4 2 16.1 9 I9 0.5 < 1 n.d. n.d. 0.5 < 1 Unresolved 0.7 < 1 0.7 < 1 1.4 < 1 Sub-total 22.4 13 12.1 7 34.5 20 Non-extractables - - - - 59.4 33 Total Recovery - - - - 93.9 53 TRR 56 Straw I1 (Start) 1.0 20 3.5 67 4.5 87 I2 0.4 7 0.4 7 0.8 14 I3 0.2 5 n.d. n.d. 0.2 5 I4 0.2 3 n.d. n.d. 0.2 3 DCGA, free n.d. n.d. n.d. n.d. n.d. n.d. DCGA, conj. n.d. < 1 n.d. n.d. n.d. < 1 DCGA, total n.d. < 1 n.d. n.d. n.d. < 1 DCSA, free 0.8 16 n.d. n.d. 0.8 16 DCSA, conj. 0.1 2 n.d. n.d. 0.1 2 DCSA, total 0.9 18 n.d. n.d. 0.9 18 5-OH-dicamba, free 1.9 36 1.1 20 3.0 56 5-OH-dicamba, conj. 0.7 14 n.d. n.d. 0.7 14 5-OH-dicamba, total 2.6 50 1.1 20 3.7 70 Dicamba, free 0.8 16 1.4 26 2.2 42 Dicamba, conj. 0.1 1 n.d. n.d. 0.1 1 Dicamba, total 0.9 17 1.4 26 2.3 43 I9 n.d. n.d. n.d. n.d. n.d. n.d. Unresolved 0.3 5 0.6 11 0.9 16 Sub-total 6.6 125 6.9 131 13.5 256 Non-extractables - - - - 79.6 1513 Total Recovery - - - - 93.1 1769 TRR 1901
n.d. = not detected a Dicamba-equivalents b mainly as β-glucosides c consists of several polar components
Characterisation of non-extractable radioactive residues in the grain and straw is presented in Table 20.
The grain non-extractable radioactivity (post-extraction solid) was hydrolysed with NaOH. Hydrolysis of both the resultant supernatant and solid with HCl followed by fractionation of the released plant-matrix constituents yielded 4.8, 15 and 4.3% of the TRR in protein-, cellulose-, and glucose-fractions, respectively. In addition, small quantities of dicamba (1.7% of the TRR) and 5-OH dicamba (0.9% of the TRR) were found after the chemical hydrolysis.
The straw non-extractable radioactivity (post-extraction solid) was refluxed in hot water and the resulting filtrate was hydrolysed with HCl and solid with NaOH. Fractionation of the straw plant-matrix constituents after the chemical hydrolysis yielded 0.2%, 2.6%, and 40% of the TRR, in the

Dicamba 961
pectin, cellulose, and lignin fractions, respectively. In addition, chemical hydrolysis released small amounts of parent (fraction I8, i.e., dicamba, 2.6% of the TRR) and the metabolites I5 (DCGA), I6 (DCSA, NOA414746), and I7 (5-OH dicamba, NOA405873) representing 0.2%, 0.3%, and 3.9% of the TRR, respectively.
Table 20 Characterisation of non-extractable radioactivity in grain and straw 85 days after foliar application of 14C-dicamba to spring wheat
Compound Grain Straw % TRR µg/kg a % TRR µg/kg a
I1 12.9 7.2 2.9 55.6 I2 n.d. n.d. 0.7 13.5 I3 n.d. n.d. 0.8 15.3 I4 n.d. n.d. 0.1 1.9 DCGA n.d. n.d. 0.2 3.8 DCSA n.d. n.d. 0.3 6.0 5-OH dicamba 0.9 0.5 3.9 74.1 Dicamba 1.7 1.0 2.6 49.3 I9 n.d. n.d. < 0.1 0.4 Unresolved 3.7 2.1 0.8 16.0 Protein fraction 4.8 2.7 n.d. n.d. Glucose fraction 4.3 2.4 n.d. n.d. Pectin n.d. n.d. 0.2 3.2 Cellulose 15.0 5.5 2.6 48.7 Lignin (raw fraction) n.d. n.d. 39.7 754 Total 43.3 21.4 61.3 1042 TRR 56 1901
n.d. = not detected a Dicamba-equivalents
I1–I9 = were released after acid and/or base treatment.
Sugar cane
Uptake, distribution and metabolism of 14C-dicamba was studied in greenhouse grown sugar cane (Butz R.G., Atallah Y.H. 1981(a) and 1981(b)). Cut seed pieces of Saccharum officinarum L., variety CP-70-1122 were obtained from Florida, USA and grown in the Velsicol Agricultural Research Center, Woodstock, Illinois, USA. Plants were six weeks old at the initiation of the study and were 122 to 183 cm tall each with 8 or 9 leaves. The two top (youngest) leaves and the stem were left untreated and the next 4 lower (mature) leaves were treated with the 14C-dicamba solution (47% w/w dicamba acid as dimethylamine salt) using a syringe. Prior to treatment, a 3 mm wide band of Vaseline petroleum jelly was applied across the upper surface of each leaf, approximately 10 cm from the stem, so as to prevent droplets of treatment solution from sliding onto the stem. A total of sixteen sugar cane plants were treated. The total dicamba acid applied per plant was 3.1 mg roughly equivalent to 1.12 kg dicamba/ha.
Two treated plants were sampled at 0, 1, 2, 5, 12, and 21 days after treatment. In addition, four treated plants were harvested at 28 days. Each plant was dissected into treated leaves (above a Vaseline barrier), treated leaves (below the Vaseline barrier), upper untreated leaves, lower untreated leaves, stem, and roots. Soil samples were also taken.
Homogenized tissue or soil samples were combusted, the 14CO2 trapped, and assayed by LSC to determine the TRR. Aqueous leachate and leaf wash rinses were also directly counted. The 0-, 12-, and 28-day leaf samples were selected for metabolite characterisation. Hydrolysis with HCl was used to release bound or conjugated metabolites. Metabolites were characterised by TLC and confirmed by gas chromatography. Aqueous conjugates were subjected to enzymatic treatment with glycosidases, β-fructosidase and β-glucosidase.
In the second report, extracts obtained using ethanol:water (8:2) and ethyl ether:20% sulfuric acid: ethanol (30:1:1) were compared.

962 Dicamba
The incorporation of the radioactivity into the sugar cane leaves, stem, roots, and soil over a 28-day period is summarised in Table 21.
14C-dicamba was rapidly incorporated by young sugar cane leave, with approximately 46% of the TAR being taken up within 28 days. The treated leaves contained 87% of the taken-up radioactivity (40% out of 46% of TRR) or 91% including radioactivity of treated leaves below the Vaseline barrier (42% of TRR in total), indicating little translocation of incorporated dicamba or its metabolites.
There was little translocation of incorporated dicamba or its metabolites to upper or lower leaves. More radioactivity was transported to upper leaves than to lower leaves, stems, or roots. The total amount of translocated radioactivity after 28 days was 5.9% of the TAR.
Table21 Distribution of radioactivity in sugar cane grown in greenhouse after foliar application of 14C-dicamba
Sample % of TAR 0 DAT 1 DAT 2 DAT 5 DAT 12 DAT 21 DAT 28 DAT
Treated leaves above the Vaseline barrier
9.23 25.83 19.44 27.09 31.20 38.08 40.40
Treated leaves below the Vaseline barrier
0.13 1.61 2.36 1.35 2.12 2.21 1.84
Stems 0.02 0.37 0.26 0.09 0.10 0.18 0.15 Upper untreated leaves 0.01 0.21 1.10 0.47 0.93 1.12 1.62 Lower untreated leaves 0.00 0.02 0.02 0.01 0.03 0.04 0.02 Roots 0.02 0.06 0.04 0.08 0.11 0.10 0.18 Soil 0.00 0.00 0.00 0.00 0.00 0.00 2.10 Total uptake by plant 9.41 28.10 23.22 29.09 34.49 41.73 46.31 Total translocation 0.18 2.27 3.78 2.00 3.29 3.65 5.91 Leaf rinsate 79.42 61.86 64.82 48.33 35.10 21.63 22.10 Total recovered 88.80 89.96 88.04 77.42 69.59 63.36 68.41
Characterisation of radioactive residues in sugar cane leaves at 0 DAT, 12 DAT and 28 DAT is compiled in Table 22. Since the 14C-dicamba was applied using a syringe, the residue concentrations may not correctly reflect the authorized use patterns.
The extractable residues were separated into ether fraction and aqueous fraction. The ether-extractable residues increased from 6.8% of the TAR at 0 DAT to 27% at 12 DAT and then decreased to 14% at 28 DAT. The parent compound remained consistently in a range of 5.2-8.3% of the TAR. One metabolite, 5-OH dicamba, increased from 0.12% to 18% of the TAR at 12 DAT and decreased to 8.6% at 28 DAT. DCGA was detected only in the 28 DAT sample at 0.16% of the TAR.
Water-soluble residues increased from 0.15% of the TAR at 0 DAT to 12% of the TAR at 12 DAT and slightly decreased to 11% at 28 DAT. Acid hydrolysis with HCl of the 12 DAT and 28 DAT aqueous fraction released most of the radioactivity. The same metabolites as in the solvent-extractable residues, i.e., dicamba, 5-OH dicamba and DCGA, were found after hydrolysis. At 28 DAT, dicamba, 5-OH dicamba and DCGA represented 3.6, 4.5 and 1.9% of the found in the water-soluble fraction.
Characterisation of non-extractable radioactive residues in leaf solids after extraction was also performed. Post-extraction solids increased from 0.34% of the TAR at 0 DAT to 7.3% at 28 DAT. More than 50% of the residues were released by acid hydrolysis. This treatment released the same metabolites as previously identified from the acid hydrolysis of the aqueous extractable residues, i.e., dicamba, 5-OH dicamba and DCGA. However, enzymatic treatment of the non-extractable residues with cellulase did not release any additional components.

Dicamba 963
Table 22 Characterisation of radioactive residues in sugar cane leaves after foliar treatment with 14C-dicamba
Fraction 0 DAT 12 DAT 28 DAT mg/kg % of TAR mg/kg % of TAR mg/kg % of TAR
Ether extractable Residues Dicamba 11.77 6.62 17.98 8.32 15.72 5.16 5-OH Dicamba 0.22 0.12 38.57 17.85 26.29 8.63 DCGA - - - - 0.50 0.16 Unknown 0.04 0.02 1.76 0.81 1.00 0.33 Total 12.04 6.77 57.82 26.76 43.21 14.18 Water Soluble Residues Before acid hydrolysis 0.26 0.15 26.78 12.40 33.51 10.99 After acid hydrolysis 0.13 0.07 1.47 0.68 2.03 0.67 Acid released 0.13 0.07 25.30 11.71 31.47 10.33 Dicamba - - 14.08 6.01 11.09 3.64 5-OH Dicamba - - 7.66 3.55 13.81 4.53 DCGA - - 3.23 1.50 5.73 1.88 Unknown - - 0.36 0.17 0.86 0.28 Residues in Post-extraction Solids Before acid hydrolysis 0.61 0.34 14.39 6.66 22.23 7.29 After acid hydrolysis 0.06 0.03 1.82 0.84 4.52 1.48 Water soluble after acid hydrolysis 0.03 0.02 1.63 0.75 2.81 0.92 Acid released 0.52 0.29 10.94 5.06 14.90 4.85 Dicamba - - 8.67 4.01 10.55 3.46 5-OH Dicamba - - 1.90 0.88 3.57 1.17 DCGA - - 0.28 0.13 0.51 0.17 Unknown - - 0.11 0.05 0.29 0.10
Total in sample 12.90 7.26 98.98 45.82 98.95 32.46
Percent recovery of radioactivity * 78.7 - 146.9 - 80.4 -
Total radioactivity (by combustion)
16.41 9.23 67.41 31.20 123.14 40.40
* Total radioactivity by combustion = 100%.
The aqueous fraction of the 28 DAT leaf sample was used determine the amount of conjugate or bound residues (Table 23). The aqueous fraction was dried and extracted with ethanol. TLC analysis revealed one major component. Treatment of the purified fraction with β-glucosidase released 5-OH dicamba and DCSA. They represented 84% and 6.6%, respectively, of the TRR in that extract. Work up of the remaining aqueous fraction with enzymes produced a similar result. Of all the enzymes used, only the β-glucosidase resulted in cleavage of the conjugates. 5-OH dicamba and DCSA represented 71 and 29% of the radioactivity in that fraction. These results indicated that the major conjugates were β-linked D-glucose conjugates. No dicamba-glucose conjugates were detected nor were any DCGA-glucose conjugates found in sugar cane.
After enzyme hydrolysis or acid hydrolysis of water-soluble residues 5-OH dicamba was the major metabolite in both cases. The finding of dicamba in the acid hydrolysate may indicate a conjugation to other than carbohydrates.
In the extraction experiment (described in the second report), dicamba residues in the ether extract were almost identical whether the sample was extracted in 80% ethanol-water or ethyl ether-sulfuric acid-ethanol. Thus, acidification of the 80% ethanol-water filtrate followed by ethyl ether partition yielded residue levels equivalent to that extracted by ethyl ether-sulfuric acid. Some conjugated residues, however, were apparently not hydrolysed by either method.
964 Dicamba
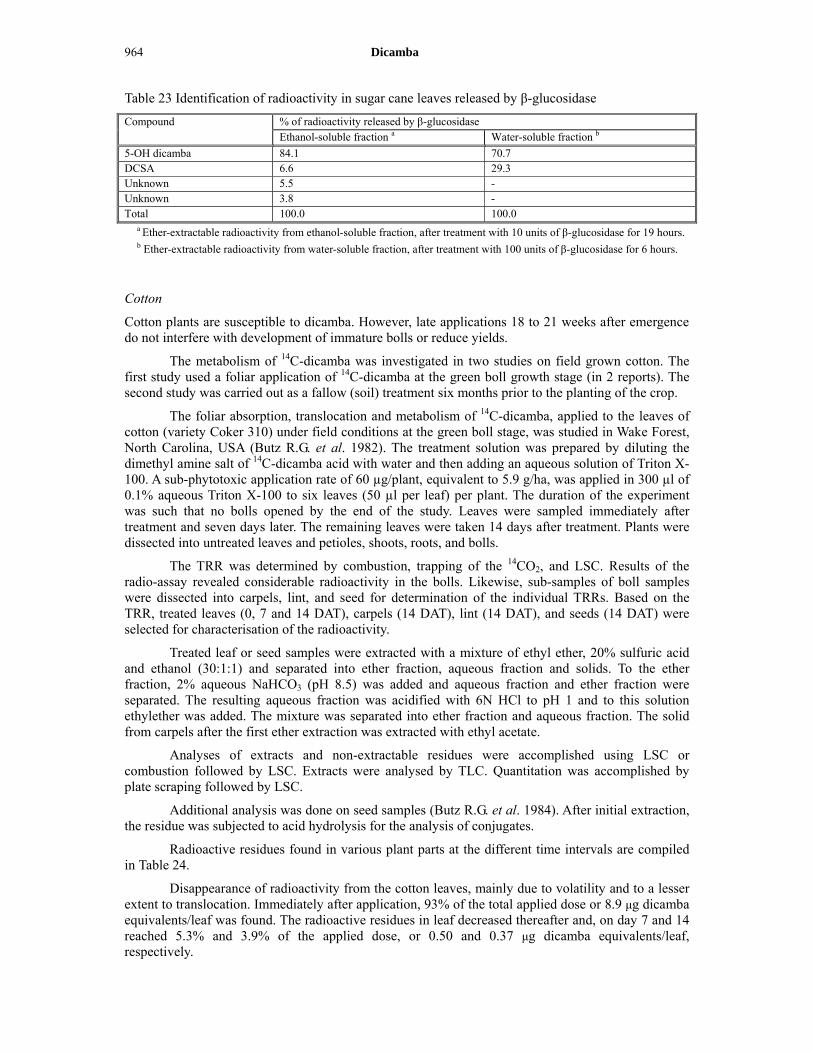
Table 23 Identification of radioactivity in sugar cane leaves released by β-glucosidase
Compound % of radioactivity released by β-glucosidase Ethanol-soluble fraction a Water-soluble fraction b
5-OH dicamba 84.1 70.7 DCSA 6.6 29.3 Unknown 5.5 - Unknown 3.8 - Total 100.0 100.0
a Ether-extractable radioactivity from ethanol-soluble fraction, after treatment with 10 units of β-glucosidase for 19 hours. b Ether-extractable radioactivity from water-soluble fraction, after treatment with 100 units of β-glucosidase for 6 hours.
Cotton
Cotton plants are susceptible to dicamba. However, late applications 18 to 21 weeks after emergence do not interfere with development of immature bolls or reduce yields.
The metabolism of 14C-dicamba was investigated in two studies on field grown cotton. The first study used a foliar application of 14C-dicamba at the green boll growth stage (in 2 reports). The second study was carried out as a fallow (soil) treatment six months prior to the planting of the crop.
The foliar absorption, translocation and metabolism of 14C-dicamba, applied to the leaves of cotton (variety Coker 310) under field conditions at the green boll stage, was studied in Wake Forest, North Carolina, USA (Butz R.G. et al. 1982). The treatment solution was prepared by diluting the dimethyl amine salt of 14C-dicamba acid with water and then adding an aqueous solution of Triton X-100. A sub-phytotoxic application rate of 60 µg/plant, equivalent to 5.9 g/ha, was applied in 300 µl of 0.1% aqueous Triton X-100 to six leaves (50 µl per leaf) per plant. The duration of the experiment was such that no bolls opened by the end of the study. Leaves were sampled immediately after treatment and seven days later. The remaining leaves were taken 14 days after treatment. Plants were dissected into untreated leaves and petioles, shoots, roots, and bolls.
The TRR was determined by combustion, trapping of the 14CO2, and LSC. Results of the radio-assay revealed considerable radioactivity in the bolls. Likewise, sub-samples of boll samples were dissected into carpels, lint, and seed for determination of the individual TRRs. Based on the TRR, treated leaves (0, 7 and 14 DAT), carpels (14 DAT), lint (14 DAT), and seeds (14 DAT) were selected for characterisation of the radioactivity.
Treated leaf or seed samples were extracted with a mixture of ethyl ether, 20% sulfuric acid and ethanol (30:1:1) and separated into ether fraction, aqueous fraction and solids. To the ether fraction, 2% aqueous NaHCO3 (pH 8.5) was added and aqueous fraction and ether fraction were separated. The resulting aqueous fraction was acidified with 6N HCl to pH 1 and to this solution ethylether was added. The mixture was separated into ether fraction and aqueous fraction. The solid from carpels after the first ether extraction was extracted with ethyl acetate.
Analyses of extracts and non-extractable residues were accomplished using LSC or combustion followed by LSC. Extracts were analysed by TLC. Quantitation was accomplished by plate scraping followed by LSC.
Additional analysis was done on seed samples (Butz R.G. et al. 1984). After initial extraction, the residue was subjected to acid hydrolysis for the analysis of conjugates.
Radioactive residues found in various plant parts at the different time intervals are compiled in Table 24.
Disappearance of radioactivity from the cotton leaves, mainly due to volatility and to a lesser extent to translocation. Immediately after application, 93% of the total applied dose or 8.9 μg dicamba equivalents/leaf was found. The radioactive residues in leaf decreased thereafter and, on day 7 and 14 reached 5.3% and 3.9% of the applied dose, or 0.50 and 0.37 μg dicamba equivalents/leaf, respectively.

Dicamba 965
Fourteen days after application, untreated leaves, treated leaves, stems, roots, pods, and immature bolls contained, on average, radioactive residues of 1.8, 1.1, 0.72, 0.12, and 12.3 µg dicamba equivalents. The total recovered radioactivity in this study amounted to an average of 25.9 µg representing 45% of the applied dose.
As shown in the Table, in spite of volatilisation, a significant portion of applied radioactivity translocated to the untreated leaves, stems, roots, and especially to the immature bolls.
An average of 45% of the applied radioactivity was accounted for in the plant samples taken 0 through 14 days after treatment. Approximately one-half of the radioactivity was found in the immature bolls (12.3 µg out of 25.9 µg). Translocation of radioactivity from treated leaves to the bolls was significant whereas translocation of radioactivity to roots was negligible.
Table 24 Radioactivity in cotton plants following treatment of leaves with 14C-dicamba at 60 µg/plant, equivalent to 5.9 g/ha, at green boll stage
Treated Leaves Untreated Leaves
Stems Roots Bolls Total Recovery
Percent Recovery
0 DAT a 7 DAT b 14 DAT c 14 DAT Average radioactive Residue (μg dicamba equivalents/plant)[/leaf] (µg) (%) 8.9 [8.9]
0.99 [0.50]
1.11 [0.37]
1.84 0.72 0.12 12.3 25.9 45.4
Percent of dose applied to leaf (%) 93.2 5.3 3.9 Percent of Total Applied Radioactivity (%) (µg) (%) 15.5 1.7 1.9 3.2 1.3 0.2 21.5 - 45.4
a one leaf per plant harvested (16% of treated leaves) b two leaves per plant harvested (33% of treated leaves) c three leaves per plant harvested (50% of treated leaves)
The distribution of radioactivity in the boll components is presented in Table 25. Lint, seed, and carpels accounted for 1.5 µg, 1.5 µg, and 9.6 µg out of a total of 12.6 µg dicamba equivalents.
Table 25 Distribution of radioactivity in cotton boll 14 days after treatment with 14C-dicamba on cotton leaves at green boll stage
Lint Seed Carpels Total
Average radioactive Residue (μg dicamba equivalents/plant) 1.48 1.45 9.62 12.6
Average percent of Applied Radioactivity (%) 2.6 2.5 16.9 -
Characterisation of radioactivity in carpels, seeds, and lint 14 days after application is presented in Table 26.
From the carpels, 17% of the TAR was recovered. Of all recovered radioactivity in the carpels, solvent-extractable residues (11% of the TAR) accounted for the majority (64%) while water-soluble residues (0.8% of the TAR) represented only 5%. Characterisation and identification of the solvent-extractable residues revealed the presence of only the parent dicamba (9.4% of the TAR) which accounted for 56% of the recovered radioactivity. Non-extractable residues accounted for 2.6% of TAR which corresponds to 15% of the recovered radioactivity.
From the seeds, 2.5% of the TAR was recovered. Of all recovered radioactivity in seeds, ether-extractable residues (2.0% of the TAR) accounted for the majority (80%), whereas water-soluble residues (0.1% of the TAR) represented only 4%. Characterisation and identification of the solvent-extractable residues showed unchanged dicamba (1.8% of TAR) and a trace of DCSA (0.02% of TAR) which accounted for 72% and 0.8%, respectively, of the recovered radioactivity. Non-extractable residues accounted for 0.3% of the TAR corresponding to 12% of the recovered radioactivity,

966 Dicamba
From the lint, 2.6% of the TAR was recovered. Of all recovered radioactivity in lint, ether-extractable residues (2.0% of the TAR) accounted for the majority (77%) and water-soluble residues (0.2% of the TAR) represented only 8%. Due to the low radioactivity, this fraction was not characterised. Non-extractable residues (0.3% of the TAR) accounted for 12% of the recovered radioactivity.
Table 26 Characterisation of radioactivity in cotton seeds, carpels and lint 14 days after foliar application of 14C-dicamba at green boll stage
Fraction Percent of Total Applied Radioactivity (%) Dicamba DCSA 5-OH
dicamba DCGA Unidentified Total
recovered Carpels Ether fraction 9.4 0 0 0 0 Ethyl Acetate fraction - - - - 1.5 Subtotal 9.4 1.5 10.9 Aqueous fraction - - - - 0.8 Remaining in ether cleanup layer
- - - - 2.6
Non-extractable - - - - 2.6 Total 9.4 0 0 0 7.5 16.9
Seeds Ether fractions 1.8 0.02 0 0 0.2 2.0 Aqueous fraction - - - - 0.1 Remaining in ether cleanup layer
- - - - -
Non-extractable - - - - 0.3 Total 1.8 0.02 0 0 0.7 2.5
Lint* Ether fraction - - - - 2.0 Aqueous fraction - - - - 0.2 - Remaining in ether cleanup layer
- - - - 0.1
Non-extractable - - - - 0.3 - Total - - - - 2.6 2.6
*No attempt was made to characterise this fraction
Results of characterisation of the radioactivity in treated leaves sampled 0, 7, and 14 DAT is presented in Table 27.
Of all recovered radioactivity in treated leaves on 0 DAT (16% of the TAR), solvent-extractable residues (14% of the TAR) accounted for 91%, whereas water-soluble residues (0.2% of the TAR) represented only 1%. In the solvent-extractable fraction, dicamba and a small amount of 5-OH dicamba were detected, which accounted for 98% (14% of the TAR) and 0.4% (0.05% of the TAR), respectively, of the recovered radioactivity. Non-extractable residues (1.2% of the TAR) accounted for 8% of recovered radioactivity.
Recovered radioactivity in treated leaves decreased significantly during the first 7 days after application. Of all recovered radioactivity in treated leaves 7 days after application (1.7% of the TAR), solvent-extractable residues (0.39% of the TAR) accounted for the largest proportion at 23%. Only 0.07% of the TAR was found in the water-soluble fraction. Analysis of the solvent-extractable residues revealed the presence of dicamba and of DCSA at 0.3% and 0.03% of the recovered radioactivity, respectively. Non-extractable residues (1.2% of the TAR) accounted for 71% of the recovered radioactivity.
In leaves 14 days after application, solvent-extractable residues (0.35% of the TAR) accounted for 18% of the recovered radioactivity (1.9% of the TAR). Dicamba amounted for 11% (0.2% of the TAR) of all recovered radioactivity. Small amounts of radioactivity (0.04%, 0.01%, and
Dicamba 967
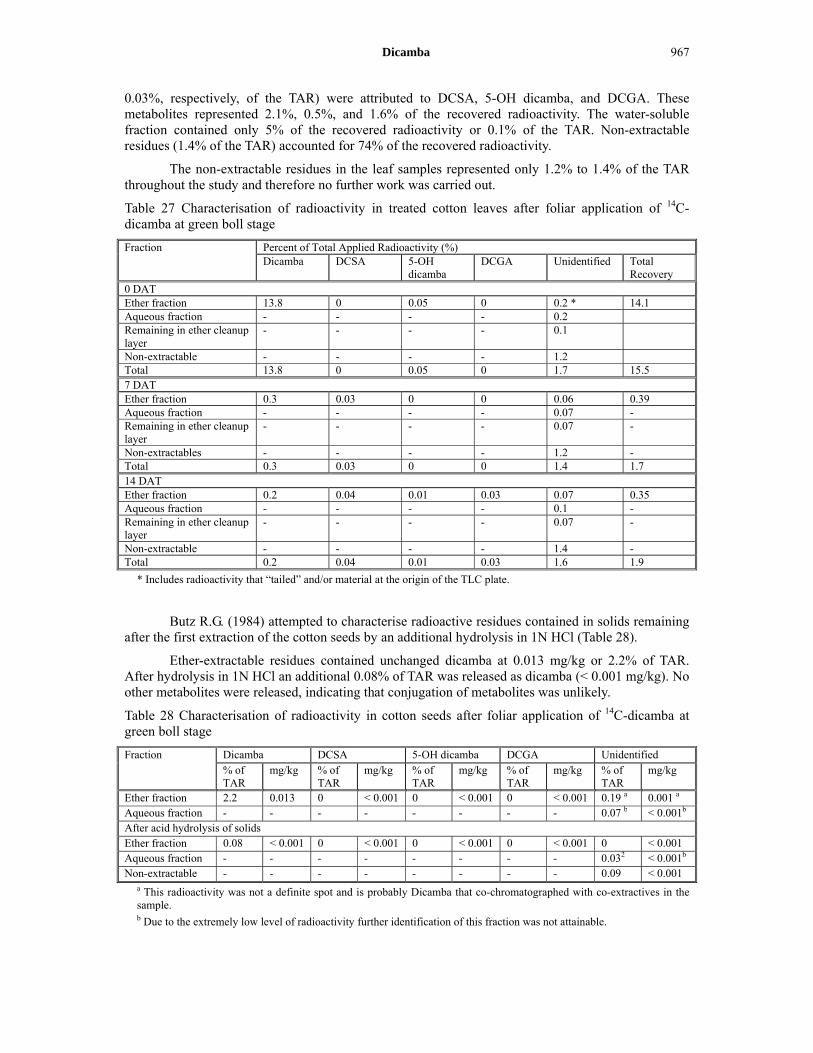
0.03%, respectively, of the TAR) were attributed to DCSA, 5-OH dicamba, and DCGA. These metabolites represented 2.1%, 0.5%, and 1.6% of the recovered radioactivity. The water-soluble fraction contained only 5% of the recovered radioactivity or 0.1% of the TAR. Non-extractable residues (1.4% of the TAR) accounted for 74% of the recovered radioactivity.
The non-extractable residues in the leaf samples represented only 1.2% to 1.4% of the TAR throughout the study and therefore no further work was carried out.
Table 27 Characterisation of radioactivity in treated cotton leaves after foliar application of 14C-dicamba at green boll stage
Fraction Percent of Total Applied Radioactivity (%) Dicamba DCSA 5-OH
dicamba DCGA Unidentified Total
Recovery 0 DAT Ether fraction 13.8 0 0.05 0 0.2 * 14.1 Aqueous fraction - - - - 0.2 Remaining in ether cleanup layer
- - - - 0.1
Non-extractable - - - - 1.2 Total 13.8 0 0.05 0 1.7 15.5 7 DAT Ether fraction 0.3 0.03 0 0 0.06 0.39 Aqueous fraction - - - - 0.07 - Remaining in ether cleanup layer
- - - - 0.07 -
Non-extractables - - - - 1.2 - Total 0.3 0.03 0 0 1.4 1.7 14 DAT Ether fraction 0.2 0.04 0.01 0.03 0.07 0.35 Aqueous fraction - - - - 0.1 - Remaining in ether cleanup layer
- - - - 0.07 -
Non-extractable - - - - 1.4 - Total 0.2 0.04 0.01 0.03 1.6 1.9
* Includes radioactivity that “tailed” and/or material at the origin of the TLC plate.
Butz R.G. (1984) attempted to characterise radioactive residues contained in solids remaining after the first extraction of the cotton seeds by an additional hydrolysis in 1N HCl (Table 28).
Ether-extractable residues contained unchanged dicamba at 0.013 mg/kg or 2.2% of TAR. After hydrolysis in 1N HCl an additional 0.08% of TAR was released as dicamba (< 0.001 mg/kg). No other metabolites were released, indicating that conjugation of metabolites was unlikely.
Table 28 Characterisation of radioactivity in cotton seeds after foliar application of 14C-dicamba at green boll stage
Fraction Dicamba DCSA 5-OH dicamba DCGA Unidentified % of TAR
mg/kg % of TAR
mg/kg % of TAR
mg/kg % of TAR
mg/kg % of TAR
mg/kg
Ether fraction 2.2 0.013 0 < 0.001 0 < 0.001 0 < 0.001 0.19 a 0.001 a Aqueous fraction - - - - - - - - 0.07 b < 0.001b After acid hydrolysis of solids Ether fraction 0.08 < 0.001 0 < 0.001 0 < 0.001 0 < 0.001 0 < 0.001 Aqueous fraction - - - - - - - - 0.032 < 0.001b Non-extractable - - - - - - - - 0.09 < 0.001
a This radioactivity was not a definite spot and is probably Dicamba that co-chromatographed with co-extractives in the sample. b Due to the extremely low level of radioactivity further identification of this fraction was not attainable.

968 Dicamba
The absorption, translocation and metabolism of 14C-dicamba applied to the soil (sand loam) as a fallow application followed by the planting of cotton six months later under normal field and planting conditions was studied in Clayton, North Carolina, United States (Butz R.G. et al. 1988). The application solution was prepared from 14C-dicamba acid. The dimethyl amine salt of 14C-dicamba acid was diluted with water and applied to the soil at 2.24 kg ai/ha and also at an exaggerated treatment of 4.48 mg ai/ha.
Soil samples were collected periodically to determine the dicamba concentrations. Cotton was harvested at the late green boll stage so as to prevent any loss of plant material occurring as the plants neared maturity. Plants were separated into roots, stems, leaves and bolls. Bolls were dissected into carpels, lint and seed. The total radioactive residue (TRR) was determined by combustion, trapping of the 14CO2, and LSC.
The decline and distribution of radioactivity (measured as dicamba and the metabolite DCSA) in soil with time is shown in Table 3. The concentrations of both compounds declined below 0.1 mg/kg by 175 days, the cotton planting date.
Table 29 Radioactive residues in soil taken after fallow treatment with 14C-Dicamba six months before planting cotton
DAT Application rate (kg/ha) Soil depth (cm)
Residue in soil (mg/kg) Dicamba DCSA
0 0 0-10 < 0.01 0.038 2 0-10 1.92 0.24 4 0-10 3.12 0.33
0-10 2.74 < 0.01 0-10 2.64 < 0.01
175 0 0-5 0.036 < 0.01 0.012 < 0.01
2 0-5 0.029 0.012 5-10 0.017 0.014 10-15 0.020 0.016 15-20 0.020 < 0.01 20-25 - a 0.031 25-30 0.029 0.019
4 0-5 0.012 0.028 5-10 0.057 0.026 10-15 0.017 0.025 15-20 0.053 0.16 20-25 0.014 0.15 25-30 0.016 0.076
351 0 23-30 < 0.01 < 0.01 4 0-7.6 < 0.01 < 0.01
7.6-15 < 0.01 < 0.01 15-23 < 0.01 < 0.01 23-30 < 0.01 < 0.01 30-38 < 0.01 < 0.01 38-46 < 0.01 < 0.01 46-53 < 0.01 < 0.01 53-61 < 0.01 < 0.01 61-69 < 0.01 < 0.01
a Dicamba concentration could not be determined due to interference during analysis.
Residues (expressed as microgram of dicamba-equivalents per kg) found in various plant parts at harvest is presented in Table 4. Based on the total amount of radioactivity in the plant, the boll, leaves, stem, and roots accounted for 37%, 9.6%, 46% and 7.0% of the radioactivity after the treatment at 2.24 kg ai/ha. Analysis of the boll components showed that 8.6%, 9.8% and 19% of the

Dicamba 969
radioactivity was associated with the carpel, lint and seed, respectively. The boll, leaves, stem, and roots accounted for 21%, 9.3%, 63% and 6.9% of the radioactivity after the treatment at 4.48 kg ai/ha. Analysis of the boll components showed that 0%, 6.1% and 15%, of the radioactivity was associated with the carpel, lint and seed, respectively.
The leaves, stem, and roots of the 2.24 kg ai/ha treatment group contained residues of 16.2, 48 and 29 μg dicamba equivalents/kg, respectively. Analysis of the boll components showed 8.9, 20 and 27 μg dicamba equivalents/kg in the carpels, lint and seed, respectively. The leaves, stem, and roots of the 4.48 kg ai/ha treatment group contained 18, 55 and 35μg dicamba equivalents/kg. Analysis of the boll components showed no residues in carpels and 20μg dicamba equivalents/kg in both lint and seed.
Table 30 Radioactive residues in cotton following fallow treatment with 14C-dicamba six months before planting cotton
Plant part Radioactive residues % TRR μg dicamba equivalents/kg
Application at 2.24 kg ai/ha Boll Carpel 8.6 8.9 Lint 9.8 19.6 Seed 18.6 27.3Total (Boll) 37.0 - Leaf 9.6 16.2 Stem 46.4 47.9Root 7.0 28.6 Total (Boll, leaf, stem, root) 100.0 - Application at 4.48 kg ai/ha Boll Carpel 0.0 0.00 Lint 6.1 19.8 Seed 14.6 20.4 Total (Boll) 20.7 - Leaf 9.3 17.9 Stem 63.1 55.2Root 6.9 35.1 Total (Boll, leaf, stem, root) 100.0 -
Cotton plants generally contained too little radioactive residues to characterise them. However, an attempt was made to characterise the radioactivity in the stems which contained the highest amount of radioactivity. The stems from the 4.48 kg ai/ha treatment contained radioactive residues at approximately 0.05 μg dicamba equivalents/kg. The stems were subjected to hydrolysis with 1N HCl, 1N KOH or seven different enzymes including β-glucosidase and β-glucuronidase.
Table 31 indicates that acid hydrolysis released only 27% of the radioactivity into the aqueous fraction but none of the radioactivity was ether extractable. Similarly, alkaline hydrolysis released 32% of the radioactivity into the aqueous fraction but no residues were found in the ether fraction. None of the seven different enzymes released any of the radioactivity in the stem.
Table 31 Characterisation of radioactivity from cotton stem following acid or alkaline hydrolysis
Fraction Acid hydrolysis Alkaline hydrolysis % TRR μg/kg % TRR μg/kg
Total radioactivity 100 47.1 100 33.7 Aqueous fraction 27.2 12.8 31.8 10.7 Ether fraction 0.0 0.0 0.0 0.0 Non-extractable after hydrolysis 72.8 34.3 68.2 23.0
Limit of detection: 0.0075 µg 14C-Dicamba equivalents/g fresh weight.

970 Dicamba
The plant metabolism studies on soya beans, wheat, sugar cane and cotton plants using radio-labelled dicamba indicate that after foliar application, dicamba is metabolized at different rates by these plants but seems to go through the same metabolic pathway. Besides dicamba, 5-OH dicamba is the only metabolite found in significant quantities in the species resistant to dicamba. It is further metabolized with time. Minor metabolites identified include DCSA and DCGA. The results of enzymatic hydrolysis demonstrate that these compounds were present in both free and conjugated forms. Incorporation of radioactive metabolites into plant-matrix constituents was also observed in wheat.
The studies mentioned above indicate that the metabolism of dicamba appears to proceed via: hydroxylation at the 5-position followed by O-demethylation; O-demethylation followed by hydroxylation; and conjugation of 5-OH dicamba or DCSA with glucose to form β-glucoside.
Proposed metabolic pathway of dicamba in these plants is shown in Figure 2.
Figure 2 Proposed metabolic pathway of dicamba in plants
Cl
Cl
O
COOH
Dicamba
soya beans, wheat, sugar cane, cotton
Cl
Cl
OH
COOH
5-OH Dicamba
soya beans, wheat, sugar cane, cotton
Cl
Cl
O
COOH
OHDCSA
soya beans, wheat, sugar cane, cotton
O-Glc DCSA
wheat, sugar cane
O-Glc DCGA
wheat
Cl
Cl
OH
COOH
OH
DCGA
soya beans, sugar cane, cotton
O-Glc 5-OH Dicamba
wheat, sugar cane
Incorporation into plant matrices
soya beans, wheat, sugar cane

Dicamba 971
Environmental fate in soil
The Meeting received information on the aerobic soil metabolism, photodegradation in soil and residues in succeeding crops as well as, absorption and desorption, leaching and hydrolysis, some of which are summarised in the Physical and Chemical Properties Section. Since dicamba is herbicide with foliar application or to a smaller extent soil application, studies on aerobic soil metabolism, photodegradation and succeeding crops are relevant for the current review.
Throughout this section, DT50 and DT90 were calculated assuming the first order kinetics, except otherwise stated.
Aerobic soil metabolism
Laboratory studies.
Chirchirillo and Kim (1968) investigated the influence of temperature and soil humidity on the degradation rate of dicamba. A silt loam soil (Brenton silt loam) was taken in McHenry County, IL, USA, and dried at room temperature overnight and sifted through a #16 sieve. Aliquots (25 g) were transferred into glass bottles and spiked with 1 g of untreated ground pesticide free maize stalks to supply organic matter. Dicamba was applied to the soil to yield a concentration of about 5 g/g soil (equivalent to about 5.6 kg/ha). Parallel incubation was performed in the dark at four different temperatures, 35 C, 28 C, 16 C and 3 C, and at three different moisture levels, 100%, 50% and 25% of dry weight of soil. For dilution, distilled water was used. Control samples were autoclaved at 121 C for 45 minutes and handled in the same way as the treated ones. At pre-determined time intervals (i.e., at days 0, 6, 12, 24 and 48) the soil was sampled and analysed for dicamba by gas chromatography.
By plotting the remaining percentage of dicamba versus time, the half-lives were estimated assuming a first order kinetic. The results of these tests are summarised in Table 32.
At 35 C and 28 C, the degradation of dicamba was very rapid. At 16 C, the dissipation was slower but nearly completed by 48 DAT whereas the degradation at 3 C was significantly slower. The optimum temperature for degradation was found to be between 28 C and 35 C.
At all temperatures tested, dicamba was degraded most rapidly at 50% moisture, less rapidly at 25% and least rapidly at 100% moisture.
Table 32 DT50- and DT90-values for the soil degradation of dicamba (ca 5 g/g in soil) under aerobic conditions in laboratory studies
Soil type Origin
Temperature (°C)
Max. water capacity (g/100g dry soil)
Dicamba degradation (days) DT50 DT90
Brenton silt loam McHenry County, IL, USA
35 25 14 47 50 4 12 100 37 123
28 25 7 24 50 2 7 100 42 139
16 25 19 64 50 10 34 100 166 552
3 25 199 660 50 164 546 100 333 1107
In order to evaluate the metabolism of dicamba and DCSA in soil, Figge (1993) treated freshly collected loamy sand (BBA standard soil 2.2, collected by LUFA Speyer, Germany), equilibrated at 20 2 °C and 35% of the maximum water capacity for 2 weeks, with 0.62 g/g [phenyl-U- 14C]-dicamba corresponding to a field rate of 465 g/ha (assuming an even distribution in

972 Dicamba
the top 5 cm layer and a bulk density of 1.5 g/cm3). The soil samples were transferred into test vessels and incubated at 20 2°C and 40% of the maximum water capacity in the dark for up to 100 days. Released carbon dioxide was trapped by soda lime, volatile organic compounds by paraffin-soaked quartz wool placed in an absorption tube on top of the vessel.
Soil samples were taken 0, 0.04, 2, 4, 8, 16, 32, 64 and 100 days after treatment and analysed after extraction by 5N potassium hydroxide in 10% aqueous potassium chloride at 65 C for 30 min. The extracts were acidified with sulfuric acid to pH 1 and freeze dried. The lyophilisates were extracted with methanol, concentrated in a stream of nitrogen and analysed. The soda lime layers were transferred into a reaction flask. Carbon dioxide was quantitatively released by adding an excess of conc. hydrochloric acid at 70C and transferred by nitrogen into traps containing liquid absorber.
The parent substance and degradation products were determined by HPLC equipped with an UV- and 14C-detector and by various TLC-systems. Bound-soil residues in the fulvic acid, humic acid and humin were determined according standard methods.
Table 33 shows that the total recovery including the sum of volatiles, extractable radioactivity and non-extractable residues ranged from 97% to 103% of the TAR.
Repeating the extraction with aqueous KOH/KCl five times released 103% of the TAR at 0 DAT but only 48% at the end of the incubation. During the same time period, the non-extractable residues increased to 5.5% of the TAR. The radioactivity retained in the soil can be attributed to components linked/bound to the humin fraction and up to 13% of the radioactivity was associated with this fraction at 100 DAT. An extensive mineralisation rate was observed. At the end of the incubation, 44% and 45% of 14C-carbon dioxide were evolved 100 days after application of dicamba at rates of 0.62 g/g and 1.06 g/g respectively. Other volatile radioactivity never exceeded 0.3% of the TAR.
The total amount of dicamba declined from 98.3% at day 0 to 0% at day 100, indicating that all of the dicamba was transformed to metabolites and carbon dioxide during the incubation. DCSA was the predominant metabolite and rapidly increased to a maximum value of 59% after 8 days and decreased steadily thereafter to 4.5% at the end of study.
Table 33 Results of aerobic soil metabolism study on loamy sand in Germany.
Ref: Figge, 1993; Ellgehausen, 2000 Soil: Loamy sand (BBA standard soil 2.2, Germany) Dose rate: 0.62 mg ai/kg soil (equivalent to 465 g/ha) Duration: 100 days Temperature: 20 2 °C pH: 5.5 Maximum water capacity: 40% (dry soil) Organic carbon: 2.3% Organic matter: 4.0%
14C accountability: 97-103% of TAR (mean, 99%) Dicamba remaining at the end: 0.0% of TAR DCSA at the end: 4.5% of TAR Mineralization at the end: 44% of TAR Unextractable at the end: 5.5% of TAR Average DT50 of dicamba: 2.1 days Average DT90 of dicamba: 7.0 days Average DT50 of DCSA: 6.6 days Average DT90 of DCSA: 22 days
Component Max % of TAR Day Dicamba 98 0 DCSA 59 8 Polar components 15 16 Humic acid fraction 16 32
Krueger and Butz (1988) mixed an aqueous solution of 14C-dicamba with Kenyon loam soil (collected from Cedar Falls, Iowa, USA) at a concentration of 2.76 g dicamba per g of wet soil corresponding to an application rate of 2.6 kg/ha and incubated under aerobic conditions in open flasks at 25C and 75% of the 0.33 bar level in the dark. Further samples were placed in a metabolism flask and connected to a flow-through apparatus which collected volatile compounds (potassium hydroxide and ethylene glycol).
Soil samples were taken 0, 30, 60, 90, 120, 180, 270 and 365 days after treatment. Duplicate 0.5 g samples were mixed with cellulose powder and combusted. Ten grams of soil was extracted with 0.5N potassium hydroxide in aqueous 10% potassium chloride solution at 65C for 15 min. The

Dicamba 973
supernatant was removed and the remaining soil was re-extracted. The combined extracts were acidified with concentrated sulfuric acid to pH 1at 0C, saturated with sodium chloride and extracted with ethyl ether. The remaining aqueous phase was neutralized, freeze dried, acidified to pH 1 and extracted with methanol. All extracts were analysed using tracer methods and several TLC methods. GC/MS of the butylated metabolites was used for structure confirmation.
Further soil samples were treated with mercury chloride in order to examine the degradation under sterile conditions.
Table 34 indicates that the total recovery for all experiments was between 72% and 100% of the TAR. Microbial counts showed a high number of bacteria, fungi and actinomyces indicating a viable soil at study initiation.
Base and ethyl ether extractable radioactivity decreased with time and was 38% and 30%, respectively, after 365 days of aerobic incubation. During this time, the non-extractable residues increased to 18–25% at 270–365 DAT. Radioactivity remaining in the aqueous phase amounted to 3.8%. 14C-carbon dioxide trapped was 27% of the TAR, other volatiles were 1% after 365 days of aerobic incubation.
Dicamba was rapidly and quantitatively metabolized in the soil tested. After only 90 days, its quantities declined to 4.8% and disappeared completely after 180 days. DCSA was detected as the major metabolite. It reached its maximum concentration of 43% at 120 DAT and fell gradually to 15% at 365 DAT.
Dicamba was rapidly mineralised as 14CO2 representing a major fraction of the applied radiocarbon. The lack of degradation in the sterilized control soil indicated that dissipation and mineralization are biologically mediated.
Table 34 Results of aerobic soil metabolism study on Kenyon loam
Ref: Krueger and Butz, 1988; ; Ellgehausen, 2000 Soil: Kenyon loam (IO, USA) Dose rate: 2.76 mg ai/kg soil (equivalent to 2.6 kg/ha) Duration: 365 days Temperature: 25 °C pH: 6.2 Maximum water capacity: 75% of 1/3 bar moisture Organic carbon: 2.2% Organic matter: 3.8%
14C accountability: 72-100% of TAR Dicamba remaining at the end: 0.0% of TAR DCSA at the end: 15% of TAR DCGA dicamba at the end: 0.7% of TAR Mineralization at the end: 27% of TAR Unextractable at the end: 18% of TAR Average DT50 of dicamba: 26 days Average DT90 of dicamba: 86 days Average DT50 of DCSA: 45 days Average DT90 of DCSA: 151 days Average DT50 of dicamba at 20°C: 39 days Average DT90 of dicamba at 20°C: 128 days Average DT50 of DCSA at 20°C: 67 days Average DT90 of DCSA at 20°C: 225 days
Component Max % of TAR Day Dicamba 90 0 DCSA 43 120 DCGA 3.5 60
A further experiment was performed by Wendt (1994) using a silt loam soil (Elliot silt loam collected from Champaign County, Illinois, USA) according to the US EPA guidelines. The soil was fortified with 14C-dicamba at a concentration of 3.2 g dicamba per g dry soil corresponding to a field rate of 2.4 kg/ha. The flasks were connected to a flow-through apparatus which maintained aerobic conditions and collected volatile compounds (2.5N sodium hydroxide, ethylene glycol and polyurethane foam plugs). The soil samples were incubated at 23 1 C and 75% of field capacity in the dark for one year.
Sample was collected 0, 1, 3, 5, 7, 14 and 30 days after treatment, as well as 2, 3, 6, 9, and 12 months after treatment. Triplicate soil samples were extracted three times by shaking with acetonitrile - water (1:1, v/v) for one hour. The slurries were centrifuged at > 4000 g for 10 minutes and the supernatants were decanted. The combined extracts were filtered, concentrated under nitrogen in a flash evaporator and acidified to pH 1 with concentrated hydrochloric acid. The resultant aqueous phase was partitioned into ethyl acetate and analysed. After extraction with aqueous acetonitrile, the

974 Dicamba
soil was re-suspended in 0.5N sodium hydroxide and treated according to standard methods for the determination of the radioactivity associated with the fulvic acid, humic acid and humin.
All extracts were analysed using tracer methods. The distribution of dicamba and its metabolites was analysed by HPLC and TLC, and by GC-MS for structure confirmation.
Table 35 shows that the total recoveries for all experiments showed an average of 87–103% of the TAR. Microbial counts of bacteria, fungi and actinomyces indicated a typical and viable microbial community in the soil at study initiation.
The total radioactivity extracted with acetonitrile decreased from 99% at 0 DAT to 9.2% at 30 DAT and to 2.0% after 9 months of incubation under aerobic conditions. The organic fraction (after partitioning into ethyl acetate) declined to 5.3% at 30 DAT and to 1.2% after 9 months. During the same time, non-extractable residues increased to the maximum of 12% of the TAR (30 DAT), the radiocarbon associated with fulvic acid fractions increased to 11% (14 DAT) and that associated with humic acid fractions to 26% (21 DAT). These quantities declined steadily with time and at the end of study at 5.9%, 2.7% and 16.6% of the TAR, respectively.
The volatile radioactivity consisted solely of 14C-carbon dioxide and finally amounted to 67% of the TAR after 365 days of aerobic incubation.
Dicamba was rapidly and extensively metabolized in the loam soil tested. The initial quantities of 95% decreased steadily to 52% after 7 days and finally to 1.0% after 30 days. The primary and predominant metabolite was DCSA. It peaked at 15% at 7 DAT and fell gradually to 3.4% at 30 DAT, and < 1% by 90 DAT. Other polar compound fraction represented less than 6.0% of the TAR during the incubation time.
The period of rapid metabolic degradation of dicamba and DCSA corresponded to the increase in 14C-carbon dioxide production. This indicates that dicamba is completely mineralized (67% of the TAR after one year). Additional portions of radiocarbon were assimilated into the humic acid fractions which also increased the 14CO2 formation during the prolonged aerobic incubation.
Table 35 Results of aerobic soil metabolism study on Elliot silt loam
Ref: Wendt, 1994; Ellgehausen, 2000 Soil: Elliot silt loam (IL, USA) Dose rate: 2.6 mg ai/kg soil (equivalent to 2.4 kg/ha) Duration: 365 days Temperature: 23 1°C pH: 5.1 Maximum water capacity: 75% of field capacity (39% dry soil at 1/3 bar) Organic carbon: 2.4% Organic matter: 4.2%
14C accountability: 87-103% of TAR Dicamba remaining at the end: 0.2% of TAR DCSA at the end: 0.1% of TAR Mineralization at the end: 67% of TAR Unextractable at the end: 5.9% TAR Average DT50 of dicamba: 6.3 days Average DT90 of dicamba: 21 days Average DT50 of DCSA: 5.6 days Average DT90 of DCSA: 19 days Average DT50 of dicamba at 20°C: 8.0 days Average DT90 of dicamba at 20°C: 27 days Average DT50 of DCSA at 20°C: 7.1 days Average DT90 of DCSA at 20°C: 24 days
Component Max % of TAR Day Dicamba 95 0 DCSA 15 7 Fulvic acid 11 14 Humic acid 26 21
In order to provide information on the route and rate of degradation of dicamba in three soils and the rate of formation and decline of its degradation products at 20 ± 2°C in the dark, Glaenzel (2000) selected a loam (Gartenacker) and a sandy loam (Pappelacker, both soil collected from the Research Station, Les Barges, canton Valais, Switzerland), and a loamy sand (Borstel, standard lysimeter soil, collected in Lower Saxony, Germany) and treat them with 0.28 g/g 14C-dicamba corresponding to a field rate of 360 g/ha. The soil samples were transferred into Erlenmeyer flasks which were equipped with a trapping system (flasks containing ethylene glycol and 2N sodium hydroxide). Incubation was carried out in a climate chamber at 20 2C and 40% of the maximum water holding capacity for up to 120 days. Aerobic conditions were maintained by flushing the soil

Dicamba 975
with air at a flow rate of about 10 - 20 ml/minute. Prior to treatment and at the end of the incubation period (day 119 - 121), the soil microbial biomass was determined.
Immediately after application and at subsequent intervals of 2, 4, 8, 16, 32, 64 and 120 days, the soil samples were extracted two to three times with a solvent mixture of acetonitrile - water (8:2, v/v) at 200 r.p.m. for 30 minutes. The extracts were separated from the soil by centrifugation and the supernatants were decanted. Thereafter, the samples were extracted with 0.1N sodium hydroxide at room temperature for 24 hours. After centrifugation, the extraction was repeated for one hour. The combined extracts were acidified to pH 1 with concentrated hydrochloric acid and centrifuged. The radioactivity in the supernatants was partitioned three times with 150 ml ethyl acetate.
The radiocarbon in the remaining aqueous phase and in the extracted soil was determined according to standard methods for the content of radiocarbon in the fulvic acid, humic acid and humin.
The distribution of the parent active substance and the degradation products was analysed by HPLC or 2D-TLC.
Table 5 indicates that the overall recovery extracted from the soil and including non-extractable residues and volatile products was between 95% and 104% of total applied radioactivity.
At the beginning of the study, the majority of radioactivity could be extracted using acetonitrile - water and ethyl acetate after partitioning of the acidified sodium hydroxide soil extract. Thereafter, these amounts declined continuously to 3 - 5% of the TAR until study termination at 120 DAT. During this time, the radioactivity in humin fraction increased to about 24% of the TAR in the loam and sandy loam soils, and to 9% in the loamy sand. Between 16 DAT and 32 DAT, the radioactivity associated with the fulvic and humic acid fractions increased to about 6% of the TAR and to about 21 - 34%, respectively. Afterwards, these quantities declined slowly until study termination at 120 DAT. The non-extractable residues including the humin fractions attained levels of 8–22% of the TAR, the humic acid fractions reached 15 - 29% and those of fulvic acids about 4%.
Carbon dioxide steadily increased and reached a maximum of 57%, 48% and 58% of the TAR in the loam, sandy loam and loamy sand at 120 DAT. Organic volatiles were always below 0.3% of the TAR.
Dicamba declined very rapidly during aerobic incubation from 100–101% to only < 1% of the TAR 32 DAT. DCSA was detected as the only major metabolite. In the loam and sandy loam soil, DCSA reached its maximum of 15% of the TAR between 4 and 8 DAT and declined afterwards to 0.4% at 120 DAT. In the loamy sand, the highest quantity of DCSA was 39% of the TAR after 16 days of incubation and decreased to 2.3% at 120 DAT. Several minor metabolites were formed in the course of the study each with total amounts of 4.2% of the TAR.
Table 36 Results of aerobic soil metabolism studies on loam, sandy loam and loamy sand in Switzerland and Germany.
Glaenzel, 2000Soil: Loam (Gartenacker, Switzerland) Dose rate: 0.28 mg ai/kg soil (equivalent to 360 g/ha) Duration: 120 days Temperature: 20 2 °C pH: 7.3 Maximum water capacity: 40% Organic carbon: 1.9% Organic matter: 3.2%
14C accountability: 95–104% of TAR Dicamba remaining at the end: < 0.3% of TAR DCSA at the end: 0.3% of TAR Mineralization at the end: 57% of TAR Unextractable at the end: 22% TAR Average DT50 of dicamba: 3.6 days Average DT90 of dicamba: 12 days Average DT50 of DCSA: 1.7 days Average DT90 of DCSA: 5.6 days
Component Max % of TAR Day Dicamba 100 0 DCSA 15 4, 8 Fulvic acid 5.9 8 Humic acid 21 16

976 Dicamba
Ref: Y Glaenzel, 2000Soil: Sandy loam (Pappelacker, Switzerland) Dose rate: 0.28 mg ai/kg soil (equivalent to 360 g/ha)) Duration: 120 days Temperature: 20 2 °C pH: 7.4 Maximum water capacity: 40% Organic carbon: 1.1% Organic matter: 2.0%
14C accountability: 98–102% of TAR Dicamba remaining at the end: < 0.3 of TAR DCSA at the end: 0.4% of TAR Mineralization at the end: 48% of TAR Unextractable at the end: 21% TAR Average DT50 of dicamba: 4.5 days Average DT90 of dicamba: 15 days Average DT50 of DCSA: 1.8 days Average DT90 of DCSA: 6.1 days
Component Max % of TAR Day Dicamba 100 0 DCSA 14 8Fulvic acid 6.6 32 Humic acid 31 16
Ref: Glaenzel, 2000Soil: Loamy sand (Borstel, Germany) Dose rate: 0.28 mg ai/kg soil (equivalent to 360 g/ha) Duration: 120 days Temperature: 20 2 °C pH: 5.8 Maximum water capacity: 40% Organic carbon: 1.5% Organic matter: 2.7%
14C accountability: 98–104% of TAR Dicamba remaining at the end: 0.3% of TAR DCSA at the end: 2.3% of TAR Mineralization at the end: 58% of TAR Unextractable at the end: 8.2% TAR Average DT50 of dicamba: 6.0 days Average DT90 of dicamba: 20 days Average DT50 of DCSA: 10 days Average DT90 of DCSA: 34 days
Component Max % of TAR Day Dicamba 101 0 DCSA 39 16 Fulvic acid 1.4 32 Humic acid 34 32
Figge, Krueger and Butz, and Wendt calculated DT50 and DT90 of dicamba assuming the first order kinetics. Ellgehausen calculated DT50 and DT90 of DCSA using their data. Glaenzel also calculated DT50 and DT90 of dicamba and DCSA. These values are included in the above tables.
Calculated DT50 of dicamba at 20–25 °C ranged between 2.1 and 6.3 days in all soils tested except Kenyon loam, reflecting rapid disappearance of dicamba from soil, and 26 days in Kenyon loam. Calculated DT50 of DCSA at 20–25°C ranged between 1.7 and 10 days in all soils tested except Kenyon loam, indicating that DCSA is also rapidly degrading in soil, and 45 days in Kenyon loam.
Field studies
The prime aim of these studies was to provide data on levels of dicamba and DCSA residues remaining in the soil at crop harvest. Four trials were conducted at various locations in Germany covering a range of soil types. These trials also provided data supporting the rapid dissipation of dicamba measured in laboratory studies.
A field soil trial was conducted by Hertl (1991c) in a sandy loam soil containing 58.9% sand (Rosenberg, Bayern, Germany; pH 5.9, organic C 1.08%, organic matter 1.86%, maximum water capacity 27.4% dry soil). On 12 June, a single application using 360 g/ha dicamba in 400 L/ha water was made to maize plants at the 8 leaves stage. After various time periods (3–364 days after application), soil core samples were collected to a depth of 60 cm. The cores were dissected into 10 cm layers and analysed for dicamba and DCSA. Residues were determined with GC/ECD.
The climatic conditions during the study compared well to the normal situation in Germany.
In the top 10 cm soil layer, dicamba residues above the limit of detection (0.006 mg/kg) were measured only at three sampling intervals amounting to 0.29 mg/kg at 3 DAT, 0.04 mg/kg at 7 DAT and 0.05 mg/kg at 16 DAT. Thereafter, no residues at or above the limit of quantification (0.01 mg/kg) were measured. In the 10–30 cm soil segments, no residues were detectable, but traces of dicamba at

Dicamba 977
or around the limit of quantification were found in the 30–60 cm layers from soil samples collected at 7 DAT and 16 DAT.
In general, the residue levels of DCSA were low. Low residues between 0.02 mg/kg and 0.04 mg/kg were measured in the top 10 cm horizons. Traces of DCSA at the limit of quantification of the analytical method (0.01 mg/kg) were measured sporadically in lower depth horizons.
The cumulative residue concentration (0–60 cm soil layers) of dicamba decreased rapidly to less than 90% of the 3 DAT concentration within four weeks after application (i.e., 0.29 mg/kg at 3 DAT decreased to 0.005 mg/kg at 31 DAT). The cumulative residue concentration of DCSA reached a maximum at 7 DAT and decreased thereafter.
The attempt to calculate the degradation rate was not successful due to extremely low levels of DCSA formed and the formation of DCSA was likely to be most rapid within a few days after application.
A residue trial was conducted in a field soil containing a clay loam (Ditzingen, Baden-Württemberg, Germany; pH 6.9, organic C 1.62%, organic matter 2.79%, maximum water capacity 40% dry soil)(Hertl, 1991d). On 20 June, one application of 360 g/ha dicamba in 400 L/ha water was made to maize plants at the 6–8 leaves stage.
Soil cores down to 60 cm were collected at pre determined intervals. The cores were cut into 10 cm layers and analysed for dicamba and DCSA. Residues were determined using GC/ECD with the limit of quantification at 0.01 mg/kg.
The climatic conditions during the study compared well with the normal weather situation in SW Germany. No detectable residues of dicamba remained in the soil at crop harvest (120 days) and only extremely low residues of DCSA remained (0.03 mg/kg in top 10 cm profile).
Dicamba residues were found only at three sampling dates, at day 0, 7 and 15. Immediately after sampling, the majority of the residue was detected in the top 20 cm soil horizon amounting to 0.29 mg/kg and 0.20 mg/kg in the 0–10 and 10–20 cm horizons, respectively. After 7 days, they decreased to 0.08 mg/kg and 0.02 mg/kg in the corresponding soil layers, and finally to 0.01 mg/kg in the top 10 cm after 15 days. Only the day 0 sample contained dicamba residues (0.04 to 0.06 mg/kg) in the 20–30 cm and 30–40 cm layers. It is probable that these residues resulted from contamination during sampling. No residues of dicamba were detected after 15 days in any soil horizon.
The concentrations of DCSA were low at day 0 ( 0.02 mg/kg in the 0–10 cm and 10–20 cm layer). Maximum residues were measured at day 15, with the majority (0.08 mg/kg) being found in the top 10 cm horizon. Thereafter, the DCSA concentrations decreased to 0.03 mg/kg in the top 10 cm horizon after 120 days. No residues were detectable below 30 cm, except one sample at 30–40 cm level containing 0.02 mg/kg (day 15).
To determine the degradation rates of dicamba and DCSA, the sum of residues of each compound in the soil layers of 0–40 cm were calculated and evaluated versus time. The optimum fit to the experimental data of dicamba was achieved using a Rt = 1/(a+b*t) (Timme, G. and Frehse, H., Pflanzenschutz Nachr. Bayer, 33, 47-60, 1980) yielding the half-life (DT50) and DT90 listed in Table 37. A similar result was obtained when the first order kinetic model Rt = a*exp(-b*t) was used.
The kinetics of degradation of DCSA was calculated by assuming consecutive irreversible first order reactions and generated the rates shown below.
This study confirmed the findings of the previous study and showed that neither dicamba nor its main metabolite DCSA are persistent in the field after application at a rate of 360 g/ha. The study indicated that no leaching of dicamba and DCSA deeper than 20 cm will occur in the Ditzingen soil.
Table 37 DT50 and DT90 calculated for dicamba and DCSA in Ditzengen clay loam
Compound Half-life DT90 Kinetics r Dicamba 1.4 days 10 days 2nd order function 0.997 2.9 days 10 days 1st order function 0.995 DCSA 10 days 31 days consecutive 1st order 0.92

978 Dicamba
The dissipation of dicamba and its main metabolite DCSA in a loamy sand was studied under field conditions (Tribolet, 2003). Dicamba was applied to a bare soil plot (test site Les Barges, Vouvry, Switzerland; pH 7.6, organic C 1.1%, organic matter 1.8%) at a dose of 480 g/ha in 400 L/ha. Over the period of the study (90 days), the daily maximum/minimum temperature, and the total rainfall were recorded.
Soil samples were collected to a depth of 60 cm at various intervals, dissected into 10 cm segments and frozen immediately. The corresponding segments for each plot and horizon were combined according to their respective sampling dates and analysed (limit of quantification 0.01 mg/kg). The homogenized specimen were extracted with 0.5N potassium hydroxide at 95 C for 45 minutes. After centrifugation, aliquots were taken and adjusted to pH 7 with phosphoric acid. Clean-up was performed by solid phase extraction on a pre-packed reversed phase C-18 column with 25 mL methanol. After evaporation of the solvent, dicamba and DCSA were converted to their butyl derivatives using iodobutane. Further clean-up was carried out by partition on a Chem-Elut column using n-hexane / tert-butyl methyl ether as eluting solvent. Finally, the dicamba and DCSA butyl derivatives were quantified by GC/mass selective detection using the selected ion monitoring mode.
The minimum and maximum daily temperature during the field part of the study were 11.7–28.6 C in June 2001, 8.6–29.7C in July, 9.1–30.2C in August and 3.8–21.8C in September. The rainfall between 26 June (date of application) and 24 September 2001 (last sampling of treated specimens) was 305.3 mm.
Dicamba and DCSA residues in various depth of tested soil are shown in Table 6.
Table 38 Dicamba and DCSA residues in various depth of loamy sand soil in Switzerland
Depth Dicamba residue DCSA residue
0–10 cm horizon
Initial concentration of 0.38 mg/kg < 0.01 mg/kg after 21 days.
Maximum value of about 0.03 mg/kg (between 6 DAT and 14 DAT) Dissipated completely by 42 DAT.
10–20 cm horizon
0.01 - 0.03 mg/kg between 0 - 21 DAT. Thereafter, no residues were detected.
No residues were detected at any interval.
20–60 cm horizon
No residues were detected, except day 0. Day 0, 0.03 mg/kg was measured. 0.05 mg/kg was noted 21 DAT. Analyses of soil layers below 30 cm sampled at day 21 and day 28 did not show any residues.
No residues were detected.
In the total depth soil cores (sum over all three horizons), the initial residues of dicamba and DCSA expressed as amount of analyte per cross-section surface area of the corresponding soil core, are shown in Table 39. The residues of dicamba and DCSA at day 0 were 0.45 mg/100 cm2 and 0.02 mg/100 cm2, respectively. The corresponding value for the stoichiometric sum of the parent and metabolite was 0.47 mg/100 cm2. This demonstrated that a good mass balance was obtained since the quantity of 480 g/ha applied to the soil surface would result in a theoretical soil concentration of 0.48 mg/100 cm2.
Based on the data as presented in the Table below, the half-life and DT90-values for dicamba were calculated to be 9 days and 30 days, respectively, using a least squares fitting procedure and assuming a first order exponential decay.
An additional attempt was made to estimate the dissipation rate of DCSA using the kinetic model of irreversible consecutive reactions of first order. The original data were re-assessed and re-calculated using the ModelMaker model. The best fit was obtained by a model as described for Ditzengen soil. The half-life and DT90 for dicamba were calculated to be 8.9 days and 29.7 days, respectively. The corresponding values for DCSA were 7.7 days and 25.5 days, respectively.

Dicamba 979
Table 39 Residues of dicamba and DCSA expressed in amount of analyte per cross-section surface area of the corresponding soil core
Time after Application Residue Concentration in mg/100 cm2
Dicamba DCSA Dicamba + DCSA 0 days 0.45 0.02 0.47 1 day 0.39 0.01 0.403 days 0.37 0.01 0.38 6 days 0.28 0.03 0.31 8 days 0.21 0.02 0.23 10 days 0.23 0.02 0.26 14 days 0.17 0.03 0.19 21 days 0.10 0.03 0.13 28 days 0.01 0.01 0.02 42 days 0.01 < 0.01 0.01 59 days < 0.01 0.01 0.01 90 days < 0.01 < 0.01 < 0.01Half-life 9 7.7 - DT90 30 25.5 - Correlation coefficient 0.9787 0.9818
A further field trial was conducted by Hertl (1991a) in silt loam soil (located in Loshausen, Hessen, Germany; pH 6.7, organic C 1.20, organic matter 2.06, max water capacity 32.8% dry soil). On 12 June, maize plants at the 7 - 8 leaves stage were treated once with 360 g/ha dicamba in 400 L/ha water.
After various time intervals (2-360 days after application), soil cores were collected to a depth of 60 cm. The soil cores were cut into 10 cm layers and analysed for dicamba and DCSA using residue method BS2318 (which was included as an appendix to the study report). Residue determination was by gas chromatograph fitted with an electron capture detector. The limit of quantification was set at 0.01 mg/kg. Although at the time there was no requirement to formally validate the method, procedural recoveries taken through the analytical method with the samples were satisfactory (77-139% for dicamba and 80-137% for DCSA). Samples were analysed to 120 days at which time no dicamba residues remained in the soil.
The climatic conditions throughout the study were within the normal conditions in Germany. No detectable residues of dicamba remained in the soil at crop harvest (between 120-151 days) and only extremely low residues of DCSA remained (0.02 mg/kg in top 10 cm profile).
Dicamba residues at or above the limit of determination (0.01 mg/kg) were detected exclusively in the top 10 cm soil horizon at four sampling times amounting to 0.17 mg/kg at day 2, 0.03 mg/kg to 0.01 mg/kg between day 7 and day 27. Thereafter, no residues were detected.
The residues of DCSA were generally low. The highest concentration of 0.04 mg/kg measured in the top 10 cm soil sampled 2 DAT decreased to 0.02 mg/kg at 120 DAT.
The degradation rate of dicamba was determined using the first order kinetic model: half-life value was calculated to be 1.8 days and DT90 6 days. No estimation could be made for DCSA since the residues were always very low.
This study confirmed the findings of the two previous studies by Hertl and showed that neither dicamba nor its main metabolite DCSA are persistent in the field after application at a rate of 360 g/ha. The study indicated that no leaching of dicamba and DCSA deeper than 10 cm will occur in the Loshausen soil.
A residue trial was conducted by Hertl (1991b) in silt loam soil (Haueneberstein, Baden-Württemberg, Germany; pH 4.8, organic C 1.92%, organic matter 3.30%, max water capacity 50.4% dry soil). On 20 June, a treatment with 360 g/ha dicamba in 400 L/ha water was carried out to maize plants at the 8 leaves stage.

980 Dicamba
Soil cores down to 60 cm were collected at various pre-determined intervals between 0–360 days after application. The cores were cut into 10 cm layers and analysed for dicamba and DCSA. Residue determination was by GC/ECD with the limit of quantification at 0.01 mg/kg. Samples were analysed to 120 days at which time no dicamba residues remained in the soil.
The average temperature during the study was similar to the normal conditions in Germany, whereas the precipitation exceeded the normal situation by almost 20%.
No detectable residues of dicamba remained in the soil at crop harvest (between 120–150 days) and only extremely low residues of DCSA remained (0.05 mg/kg in top 10 cm profile).
As in other studies, the majority of the residues was measured in the top 10 cm soil profile. The initial residue (0.32 mg/kg) dissipated rapidly to 0.11 mg/kg after 15 days continuing to dissipate until no residues were detected at 60 days. Extremely low residues of dicamba (0.02 mg/kg and 0.04 mg/kg) were also measured in the 10 – 20 cm horizon at 0 days and 7 days.
The DCSA residues were always low, with the majority of the residue being measured in the top 10 cm soil horizon and extremely low to non-detectable residues (< 0.01–0.02 mg/kg) in the 10–20 cm horizon. DCSA residues in the top 0–10 cm horizon reached 0.09 mg/kg at days 7–15 before decreasing thereafter to 0.05 mg/kg at 120 days.
No residues of either dicamba or DCSA were detected below 20 cm at any of the sampling dates.
The degradation rates of dicamba and DCSA were calculated using the first order kinetic model Rt = a*exp(-b*t) and the consecutive irreversible first order reactions model, respectively. The results of the calculation are shown in Table 7.
Table 40 DT50 and DT90 calculated for dicamba and DCSA in Loshausen silt loam
Compound Half-life DT90 Kinetics r Dicamba 11 days 37 days 1st order function 0.974 DCSA 10 days 29 days consecutive 1st order 0.86
Photodegradation
The photolytic behaviour of 14C-dicamba was investigated on the surface of silt loam soil (Elliot silt loam collected from Champaign County, Illinois, USA)(Sen et al., 1993b). Dicamba dissolved in acetonitrile was admixed to air-dried and sieved soil (2 mm average size) to obtain a concentration of 49.5 mg per 100 g of dry soil. Thereafter, the solvent was allowed to evaporate.
The treated soil sample was transferred to the photo reactor which was equipped with two air hose connectors and a cooling water jacket to maintain the soil sample at 25 1 C. The reactor was covered with a quartz plate. Air was drawn through the reactor and any volatiles were collected in silica gel, ethylene glycol and 10% sodium hydroxide.
The artificial light source used was a Xenon arc which was equipped with borosilicate glass filters absorbing light of wavelengths below 290 nm. The resulting radiation had a spectral distribution comparable to natural sunlight in intensity and wavelengths. The average light intensity reaching the soil surface was measured to be 7.825 102 W/m2. A further soil sample was placed in foil-wrapped flasks and used as non-irradiated control.
The samples were irradiated at 25 1C for up to 30 days. Aliquots of the soil were homogenized with 0.5N potassium hydroxide in aqueous 10% potassium chloride solution. The slurries were centrifuged and the supernatants were decanted off. The remaining soil was re-extracted in the same way. The combined extracts were acidified with concentrated hydrochloric acid to pH 1 and extracted twice with ethyl acetate. All extracts were analysed by tracer methods and several TLC and HPLC methods.

Dicamba 981
The detailed experimental results are given in Table 41. The overall recovery comprising the soil extracts, non-extractable residues and volatile products was between 94% and 104% of the TAR in the irradiated samples, 99% in the dark experiment.
Dicamba was slowly but steadily decomposed by the light of the Xenon arc. After 30 days, it amounted to approximately 81% of the TAR. Assuming a first order kinetic, the degradation rate of dicamba was calculated to be 0.0035% of TAR per day, the half-life being 201 60 days. This corresponds to a half-life of 269 80days based on natural sunlight at 40N latitude in spring at noon time.
Beside the parent compound, nine photoproducts were detected in the ethyl acetate extracts none of which exceeded 1.9% of the TAR. However, none of these matched with DCSA or any of the other reference products. Small quantities amounting to 3.7% were found in the aqueous phase as well as 3.0% as non-extractable residues. 14C-carbon dioxide was released from the test substance at up to 3.1% of the TAR within 30 days of irradiation.
The degradation rate of dicamba was negligible in the non-irradiated control experiments.
Table 41 Photolysis of dicamba in the soil 25 C
Day Percentage of Radioactivity Applied KOH/KCl Extracted Dicamba DCSA Polar
Compounds Other Compounds *)
Non- extractable
Carbon dioxide
Volatile Recovery Organic phase (ethylacetate)
Aqueous phase
Irradiated in Dry Soil 0 99.12 0.91 95.76 nd 1.09 2.28 3.04 np np 103.7 1 93.71 1.49 89.58 nd 1.03 3.09 1.67 np np 96.87 3 92.21 0.24 89.44 nd 0.81 1.97 2.53 0.20 0.00 95.18 7 91.72 2.46 90.62 nd 0.28 0.82 1.68 0.39 0.01 96.26 10 92.68 1.91 89.25 nd 0.74 2.69 14.26 0.50 0.02 96.37 15 91.54 2.28 88.70 nd 1.01 1.83 1.68 0.77 0.04 96.31 22 91.60 2.51 89.22 nd 0.55 1.82 1.49 1.80 0.05 97.45 30 84.69 3.71 80.99 nd 1.69 2.01 1.37 3.07 0.08 93.50 Without irradiation in Dry Soil 30 96.26 1.50 94.35 nd 0.39 1.44 0.92 np np 98.82
nd not detectable (LOD < 0.1% of AR)
np not performed
*) At least 9 components, each less than 1.9%
Under aerobic conditions, dicamba is degraded rapidly by O-demethylation. DCSA, the product of O-demethylation, was the predominant metabolite forming in high amount of 14–59% of the TAR in loamy sand after 8–16 days, 15% in Gartenacker soil after 4–8 days of incubation. It degraded and was likely to form DCGA through hydroxylation leading to rapid and significant mineralization and to a much less extent incorporation into fluvic acid and humic acid fractions.
Under the light of a Xenon arc, dicamba was slowly degraded with the half-life of about 201 days. This indicates that photodegradation on soil surface is not an important degradation pathway for dicamba. Although some minor photodegradates were detected, DCSA was not detected.
A proposed degradation pathway of dicamba in soil under aerobic conditions is presented in Figure 3.
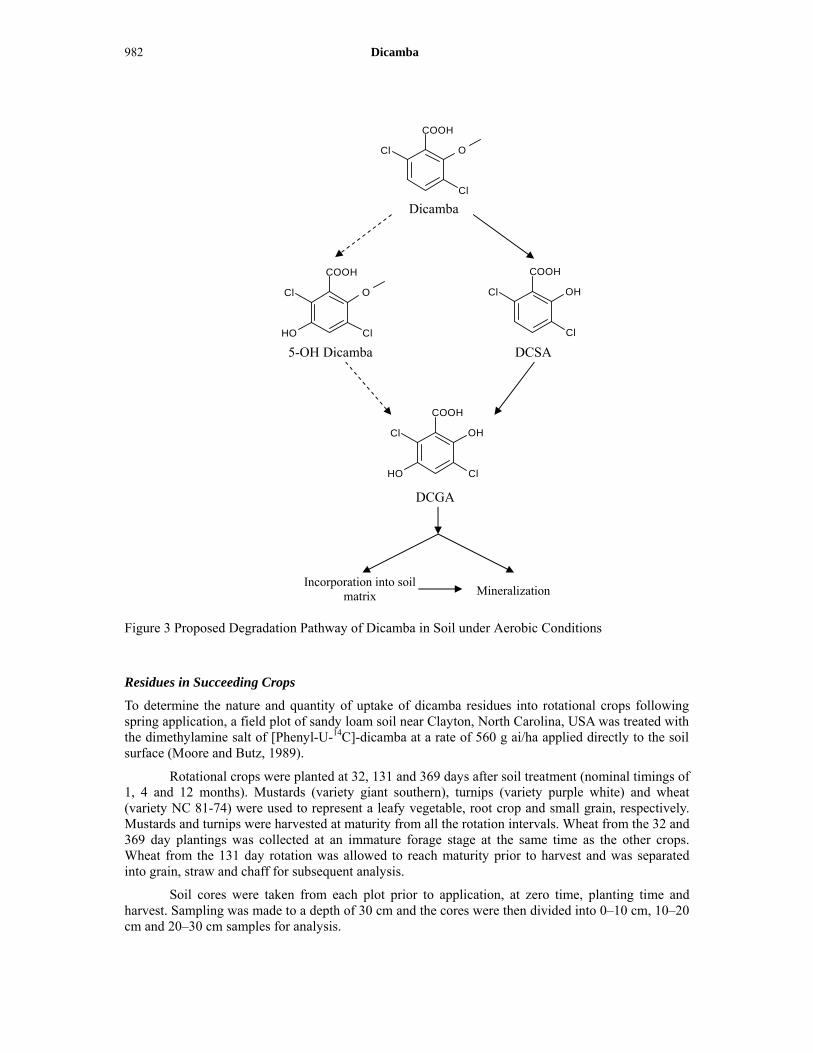
982 Dicamba
Figure 3 Proposed Degradation Pathway of Dicamba in Soil under Aerobic Conditions
Residues in Succeeding Crops
To determine the nature and quantity of uptake of dicamba residues into rotational crops following spring application, a field plot of sandy loam soil near Clayton, North Carolina, USA was treated with the dimethylamine salt of [Phenyl-U-14C]-dicamba at a rate of 560 g ai/ha applied directly to the soil surface (Moore and Butz, 1989).
Rotational crops were planted at 32, 131 and 369 days after soil treatment (nominal timings of 1, 4 and 12 months). Mustards (variety giant southern), turnips (variety purple white) and wheat (variety NC 81-74) were used to represent a leafy vegetable, root crop and small grain, respectively. Mustards and turnips were harvested at maturity from all the rotation intervals. Wheat from the 32 and 369 day plantings was collected at an immature forage stage at the same time as the other crops. Wheat from the 131 day rotation was allowed to reach maturity prior to harvest and was separated into grain, straw and chaff for subsequent analysis.
Soil cores were taken from each plot prior to application, at zero time, planting time and harvest. Sampling was made to a depth of 30 cm and the cores were then divided into 0–10 cm, 10–20 cm and 20–30 cm samples for analysis.
Cl
Cl
O
COOH
Dicamba
Cl
Cl
OH
COOH
5-OH Dicamba
Cl
Cl
O
COOH
OH
DCSA
Cl
Cl
OH
COOH
OH
DCGA
MineralizationIncorporation into soil
matrix

Dicamba 983
Frozen crop samples were homogenized in a blender or food chopper. The TRR for each commodity and for each soil sample was determined by combustion and LSC. Crop samples were hydrolysed with 1N HCl for 1.5 hours at 95 °C. After appropriate work-up, the acidic solution was partitioned with ethyl ether to extract dicamba, DCSA and 5-OH dicamba. Soil samples were heated at 65 °C in a solution of 0.5N KOH in 10% KCl. The extract was then acidified and partitioned with ethyl ether to extract dicamba and DCSA. Acidic components present in the concentrated organic extracts from both crops and soil were derivatised to the butyl ester and then analysed by GC/ECD to determine concentrations of dicamba and the metabolites of interest. The limit of detection for the analytes was 0.01 mg/kg.
The total radioactive residues found in the rotational crop samples are presented in Table 42. Residues above the limit of detection were observed only in crops from the 32 DAT planting. The highest residue of 0.213 mg dicamba equivalents/kg was observed in mustard tops. Turnips and wheat forage contained much lower levels of 0.0153 and 0.0325 mg dicamba equivalents/kg, respectively.
Table 42 Total Radioactive residues in rotational crops at harvest
Crop TRR (mg dicamba equivalents/kg fresh weight) 32 DAT 131 DAT 369 DAT
Mustard tops 0.213 < 0.01 < 0.01 Turnip tops and roots 0.0153 < 0.01 < 0.01 Wheat forage (immature) 0.0325 N/A < 0.01 Wheat straw (mature) N/A < 0.01 N/A Wheat grain (mature) N/A < 0.01 N/A Wheat chaff (mature) N/A < 0.01 N/A
N/A - not analysed since no sample was taken
All of mustard tops, turnips (tops and root) and immature wheat from the 32 DAT planting were subjected to the analysis of dicamba, DCSA and 5-OH dicamba. The results of GC analysis demonstrated that dicamba concentrations of all the crop samples were less than the limit of detection. In addition, the concentrations of DCSA and 5-OH dicamba in the 32 DAT rotational crops were also below the LOD. The acid hydrolysis procedure employed in the analysis cleaves acid labile conjugates, e.g., glycosides, to allow quantification of these components as free dicamba or the appropriate primary metabolite. These results therefore indicated negligible contribution of acid labile conjugates to the total radioactive residues.
The total radioactive residues found in soil samples are presented in Table 43. Radioactivity was detectable in soil taken at each of the sampling intervals but the majority of the residue remained in the top 10 cm and accounted for at least two thirds of the total found in all samples except for the 74 DAT. There was a general trend indicating a decrease of radioactivity with time.
Table 43 Total radioactive residues in soil
Soil Depth (cm)
TRR (mg dicamba equivalents/kg) 0 DAT 32 DAT
1st planting 74 DAT 1st harvest
131DAT 2nd planting
189 DAT 2nd harvest (not wheat)
369 DAT 3rd planting
406 DAT mature wheat harvest
423 DAT 3rd harvest
0–10 0.249 0.177 0.122 0.131 0.0628 0.108 0.0600 0.0720 10–20 < 0.01 0.0153 0.0722 0.0196 0.0178 0.0147 0.0177 < 0.01 20–30 < 0.01 < 0.01 0.0883 < 0.01 < 0.01 < 0.01 0.0102 < 0.01 Total* 0.249 0.192 0.282 0.151 0.0806 0.123 0.0879 0.0720
* LOQ values are not included in totals.
Eight soil samples, primarily from the earlier time points, containing detectable radioactive residues were analysed for dicamba and DCSA. The results are shown in Table 44.
Dicamba underwent rapid degradation in the soil and was not detected at any time point beyond the 0 DAT. The parent compound was therefore not present even at the first planting time

984 Dicamba
point of 32 DAT so it was not available for uptake into crops. The concentration of the major soil degradate of dicamba, DCSA, was the highest at 32 DAT at 0.063 mg/kg. It was still detectable at 74 and 131 DAT but decreased to < 0.01 mg/kg at 189 DAT (top 10 cm). These results show rapid degradation and dissipation of dicamba in soil.
Table 44 Residues of dicamba and DCSA in soil
Soil Depth (cm)
Residues (mg/kg) 0 DAT 32 DAT
1st planting 74 DAT 1st harvest
131 DAT 2nd planting
189 DAT 2nd harvest (not wheat)
Dicamba DCSA Dicamba DCSA Dicamba DCSA Dicamba DCSA Dicamba DCSA 0–10 0.29 0.011 < 0.01 0.063 < 0.01 0.018 < 0.01 0.016 < 0.01 < 0.01 10–20 N/A N/A < 0.01 < 0.01 < 0.01 < 0.01 N/A N/A N/A N/A 20–30 N/A N/A N/A N/A < 0.01 0.012 N/A N/A N/A N/A
N/A - not analysed
Moore (1991) conducted a study to determine the nature and quantity of uptake of dicamba residues into rotational crops following fall application. A field plot of sandy loam soil near Clayton, North Carolina, USA was treated with the dimethylamine salt of [Phenyl-U-14C]-dicamba at a rate of 2240 g ai/ha applied directly to the soil surface.
Rotational crops were planted in the following summer, fall, or next spring, i.e., 214, 301 and 542 days after soil treatment (nominal timings of 1, 4 and 13 months after cotton crop harvest). Mustards and turnips were harvested at maturity from all the rotation intervals. Wheat from the 214 day planting was collected at an immature forage stage at the same time as the other crops. Wheat from the 301 day rotation was allowed to reach maturity prior to harvest and was separated into grain, straw and chaff for subsequent analysis.
Soil cores were taken from each plot prior to application, at zero time, planting time (214 and 301 days after treatment) and harvest. Sampling was made to a depth of 30 cm and the cores were then divided into 0–10 cm, 10–20 cm and 20–30 cm samples for analysis.
Homogenized crop samples were hydrolysed with 1N HCl for 1.5 hours at 95 ºC, followed by mechanical shaking of the hydrolysate with 4N KOH and re-acidification with 6N HCl. After appropriate work-up the acidic solution was partitioned with ethyl ether to extract dicamba, DCSA and 5-OH dicamba . Soil samples were treated in the same manner as in the previous study. Acidic components present in the concentrated organic extracts from both crops and soil were also treated in the same manner as in the previous study. The limit of detection for the analytes was 0.01 mg/kg.
The total radioactive residues found in the rotational crop samples are presented in Table 45.
Residues above the limit of detection of 0.01 mg/kg were observed only in crops from the 214 DAT planting. The highest residue of 0.0724 mg dicamba equivalents/kg was observed in immature wheat forage. Mustard tops and turnips (tops and roots) contained lower levels of 0.0255, 0.0430 and 0.0341 mg dicamba equivalents/kg, respectively.
Table 45 Total radioactive residues in rotational crops at harvest
Crop TRR (mg dicamba equivalents/kg fresh weight) 214 DAT* 301 DAT 542 DAT
Mustard tops 0.0255 < 0.01 < 0.01 Turnip tops 0.0430 N/A N/A Turnip roots 0.0341 < 0.01 < 0.01 Wheat forage (immature) 0.0724 N/A N/A Wheat straw (mature) N/A N/A < 0.01 Wheat grain (mature) N/A N/A < 0.01 Wheat chaff (mature) N/A N/A < 0.01
* 34 days after crop failure
N/A - not analysed since no sample was taken

Dicamba 985
No dicamba or 5-OH dicamba was detected in any crop samples (< 0.01 mg/kg).
The extractable radioactivity of Dicamba and DCSA from soils is shown in Table 46.
GC analysis demonstrated that dicamba underwent rapid dissipation in soil from 0.56 mg/kg 0 DAT to 0.01 mg/kg 214 DAT. DCSA was not observed at levels > 0.01 mg/kg after 0 DAT when the concentration was 0.10 mg/kg. Soil samples from 301, 384 and 593 DAT were not analysed because identifiable residues were not detected in the 265 DAT sample.
Table 46 Residues of dicamba and DCSA in soil
Soil Depth (cm)
Residues (mg/kg) 0 DAT 214 DAT
1st planting 265 DAT 1st harvest
301 DAT 2nd planting
384 DAT 2nd harvest(not wheat)
593 DAT (ppm) 3rd harvest
Dicamba DCSA Dicamba DCSA Dicamba DCSA Dicamba DCSA Dicamba DCSA Dicamba DCSA 0-10 0.56 0.10 0.01 N/D N/D N/D N/A N/A N/A N/A N/A N/A 10-20 N/A N/A N/D N/D N/D N/D N/A N/A N/A N/A N/A N/A 20-30 N/A N/A N/D N/D N/D N/D N/A N/A N/A N/A N/A N/A
N/A - not analysed
N/D not detectable, limit of detection was 0.01 mg/kg
Pierotti (1995) conducted a field study to determine the accumulation and metabolic fate of dicamba in confined rotational crops. The study was conducted at Madera, California, USA in outdoor plots of sandy loam soil. [Phenyl-U-14C]-dicamba was applied at a rate of 840 g ai/ha to a cover crop of corn at the 2–3 leaf stage using a carbon dioxide pressurized hand-held spraying apparatus.
At 30 and 120 days after treatment, the corn cover crop, which was not yet mature, was removed from the appropriate plots. The soil surface was then rototilled to a depth of < 10 cm prior to planting seeds of collards (variety Vates), carrots (variety Imperator 58) and barley (variety UC476), which respectively represent a leafy vegetable, root crop and small grain.
The corn cover crop in the plots intended for the 365 DAT rotation was allowed to reach maturity prior to removal at 160 DAT. These plots were planted with seeds of collards, carrots and barley as for the other rotation intervals. In addition, soya bean seeds (variety 9592) were planted in the empty 120 DAT plots at the 365 DAT time point.
Carrots and collards were harvested at maturity and barley was collected at an intermediate stage (6–8 weeks) and at maturity. Mature barley was separated into grain and straw for subsequent analysis. Three different soya bean plant samples were taken: forage, hay and maturity. Seeds from the mature samples were included in the analysis. Soil samples were taken at various time points but were not analysed for radioactive content.
Samples were extracted with acetonitrile/water (1:3) and radioassayed by LSC. Where significant levels of radioactivity remained unextracted, the residual solids were subjected to various acid hydrolysis (1N HCl, RT, 24h or 1N HCl 90 °C, 1 hour) and base hydrolysis (1N NaOH, RT, 24 hours or 10% NaOH, 140 °C, 3 hours) conditions to characterise the residue.
The total radioactive residues found in the rotational crop samples are presented in Table 47.
The data demonstrate a very substantial decline in TRR between the 30 DAT and 120 DAT samples. This decline is particularly notable for the carrot roots, barley forage and straw. The highest residue in the 120 DAT samples was 0.036 mg dicamba equivalents/kg in barley forage. Residues in collard greens and carrot roots were < 0.01 mg dicamba equivalents/kg. Residue levels had declined further in the 365 DAT samples and for all samples, including the soya bean samples, radioactive residues were < 0.01 mg dicamba equivalents/kg.

986 Dicamba
Table 47 Total radioactive residues in rotational crops
Crop part TRR (mg dicamba equivalents/kg fresh weight) 30 DAT 120 DAT 365 DAT
Collard greens 0.026 < 0.01 < 0.01 Carrot roots 1.022 < 0.01 < 0.01 Barley forage 4.741 0.036 < 0.01 Barley straw 9.487 0.027 < 0.01 Barley grain 0.272 0.022 < 0.01 Soya bean forage N/A N/A < 0.01 Soya bean hay N/A N/A < 0.01 Soya bean seed N/A N/A < 0.01
N/A - not analysed because no sample was taken.
Extraction of 120 DAT forage, barley and straw with acetonitrile/water (1:3), solubilized part of the radioactivity from each sample. In barley forage 24% TRR (0.009 mg dicamba equivalents/kg) was extractable. Between 14 and 38% (0.004 and 0.01 mg dicamba equivalents/kg) of the radioactivity was extractable from barley straw. A comparison of the barley grain TRR with the post-extraction debris enabled the extractable residue to be calculated as 9.3% TRR (0.002 mg dicamba equivalents/kg). Since none of the extracts from the three barley samples contained > 0.01 mg dicamba equivalents/kg, no further analysis was required.
The non-extractable residues from all three 120 DAT barley samples were hydrolysed to further characterise the nature of the residue. Although non-extractable radioactivity accounted for a high percentage of the TRR, actual concentrations were low (e.g., ≤ 0.027 mg dicamba equivalents/kg calculated for barley forage). All three barley samples were subjected to acid hydrolysis followed by base hydrolysis at elevated temperature. Radioactive residues in fractions from the base hydrolysis were characterised as associated with lignin or cellulose. The barley straw was also hydrolysed under milder acid and base conditions at room temperature. Overall, the results demonstrated that no individual fraction from any of the barley samples exceeded 0.01 mg dicamba equivalents/kg.
METHODS OF RESIDUE ANALYSIS
Analytical Methods
Analytical methods were developed for the determination of dicamba, DCSA and 5-OH dicamba in target crops and animal products (meat, fat, liver, kidney and milk) for registration purposes. An overview of analytical methods considered is presented in Table 48.
Table 48 Summary of analytical methods for the determination of residues
Matrix tested Analyte Method Limit of Quantitation
Method No. Reference
Residue trials Asparagus, soya beans (originally for soil)
Dicamba DCSA
GC-ECD
0.01 mg/kg for each analyte
AM-0766A Anonymous (1985) 1985/5108
Barley, corn, cotton, cotton processed fractions, pasture grass, peanuts, sorghum, soya bean, sugar cane, tomato, tomato processed fractions, wheat and wheat processed fractions
Dicamba 5-OH Dicamba
GC-ECD 0.01 mg/kg for each analyte (LOD)
AM-0691B Anonymous (1986) 1986/5181

Dicamba 987
Matrix tested Analyte Method Limit of Quantitation
Method No. Reference
Barley, corn, cotton, cotton processed fractions, pasture grass, peanuts, sorghum, soya bean, sugar cane, tomato, tomato processed fractions, wheat and wheat processed fractions
Dicamba 5-OH Dicamba
GC-ECD; GC-MSD Confirmatory
0.01 mg/kg Dicamba 0.007 mg/kg 5-OH dicamba
AM-0691B-0297-4 (superseding AM-0691B-0593-3) Graben, M (1997) 1997/5441
Barley, corn, cotton, cotton processed fractions, pasture grass, peanuts, sorghum, soya bean, sugar cane, tomato, tomato processed fractions, wheat and wheat processed fractions
Dicamba 5-OH Dicamba
GC-ECD; GC-MSD Confirmatory
0.01 mg/kg for each analyte
AM-0691B-0593-3 (supersedes AM-0691B) Jimenez, N (1993) 1993/5261
Asparagus, soya beans Dicamba DCSA, 5-OH Dicamba
GC-ECD; GC-MSD Confirmatory
0.01 mg/kg for all commodities, except for 0.02 mg/kg for DSCA in asparagus spears and soya bean grain, and for 5-OH dicamba in soya bean grain
AM-0941-1094-0 Smith, M (1995) 1995/5278
Asparagus (originally for soil)
Dicamba DCSA
GC-ECD
0.01 mg/kg for each analyte
AM-0766A-1093-2 Murray, W.A. (1996) 1996/5296
Enforcement Maize (grain and whole plant), rape seed, pasture and oranges
Dicamba, 5-OH Dicamba
GC-MSD using selective ion monitoring (SIM)
0.01 mg/kg for all commodities
REM 193.01 Gasser, A (1998) Validation: Gasser, A (1997) Validation: Maffezoni, M (2004) ILV: Steinhauer, S (2004) 1998/5000051 1997/5000071 SAN 837/6146 SAN 837/6260
Fatty and non-fatty foods (represented by soya bean seed and forage)
DCSA 5-OH Dicamba
(Multi-residue method) EPA Pesticide Analytical Method Volume 1. Protocol B. Section 402 E2 (forage) Section 402 E3 (seed)
Not applicable MRM 1 Perez, R., Tarkalanov, N., Perez, S (2010) 2010/7002976
Beef tissues (liver, kidney, muscle, fat, milk)
Dicamba DCSA
GC-EC; GC-MSD Confirmatory
0.01 mg/kg for each analyte (dicamba, DCSA as butyl esters)
AM-0938-0994-0 Formanski, L.J. (1994) (includes validation) ILV: Baldi, (1994) SAN 837/5887 1994/5334
Animal products GRM 022.03A Richardson, M (2008) Validation: Heillaut, C (2008) ILV: Morriss, A (2009) 2008/1096011 2008/1096010 2009/1122884

988 Dicamba
Methods recommended for enforcement are REM 193.01 for crops and AM-0938-0994-0 or GRM022.03A for animal substrates. Since the methods include a derivatisation step for the analytical separation of the parent and its metabolites by gas chromatography, no multi-residue method is presented here.
Plant commodities
Method AM-0766A was originally developed for the determination and quantitation of dicamba and DCSA in soil. The basic derivatisation and clean up steps of this method were adapted for the determination of DCSA in asparagus spears for the supervised residue trial study DocID 1994/5217 (Anonymous, 1985).
Asparagus spears were homogenized by Hobart chopper and placed into pre-labelled plastic bags. The samples were then returned to the freezer until analysis. Asparagus samples were hydrolysed and extracted according to method AM-0691B-0593-3. A 10 g sample was treated with 150 mL 1N HCl and hydrolysed 1.5 hours in a 95 °C water bath. The sample was made basic with 4N KOH and two 50 mL aliquots were taken. The aliquots were acidified with 6N HCl and 15 g NaCl. Each acidic sample was extracted twice with 50 mL ethyl ether. Te ether extracts were reduced to approximately 0.5 mL in a 65 °C water bath.
One aliquot of each sample was methylated and cleaned up according to the above method. These samples were quantitated by GC/ECD for 5-OH dicamba metabolite.
The other aliquot was then butylated and cleaned up by method AM-0766A, because DCSA is the major metabolite of dicamba in asparagus. The residues were quantitated by GC/ECD for dicamba and DCSA. Confirmatory tests were performed by mass selective detection for DCSA interferences.
The limit of quantitation of this method is 0.01 mg/kg for both dicamba and DCSA in asparagus spears.
Validation this method AM-0766A was conducted concurrently with the routine residue analyses using fortification levels ranging from 0.01 mg/kg to 0.50 mg/kg. The results are shown in Table 49.
Table 49 Validation of the method AM-0766A for the determination of dicamba and DCSA in asparagus spears
Matrix Fortification Level (mg/kg)
Recovery Range (%)
No. analysis Mean (%) RSD (%)
Dicamba Asparagus spear 0.01 70 1 - - 0.05 80 1 - - 0.10 79 1 - - 0.50 79–96 2 87.5 12 Overall 70–96 5 80.8 9.4 DCSA Asparagus spear 0.01 90 1 - - 0.05 78 1 - - 0.10 80 1 - - 0.50 81–102 2 91.5 14.8 Overall 78–102 5 86.2 10
Method AM-0691B was developed for the determination and quantitation of dicamba and its metabolite 5-OH dicamba in plant material as the methyl esters/methylated products of dicamba and of 5-OH dicamba by GC/ECD. (Anonymous, 1986)
In method AM-0691B, homogenized (Hobart food cutter or Waring blender) plant samples are hydrolysed and extracted with 1N HCl. The plant material is mixed with the acid and placed in a 95 °C water bath for 1.5 hours. The mixture is occasionally swirled during the hydrolysis. After cooling, the mixture is neutralized with 4N KOH. After cooling, the mixture is shaken and the pH checked (pH must be ≥ 8). The mixture is then centrifuged and an aliquot of the basic solution is
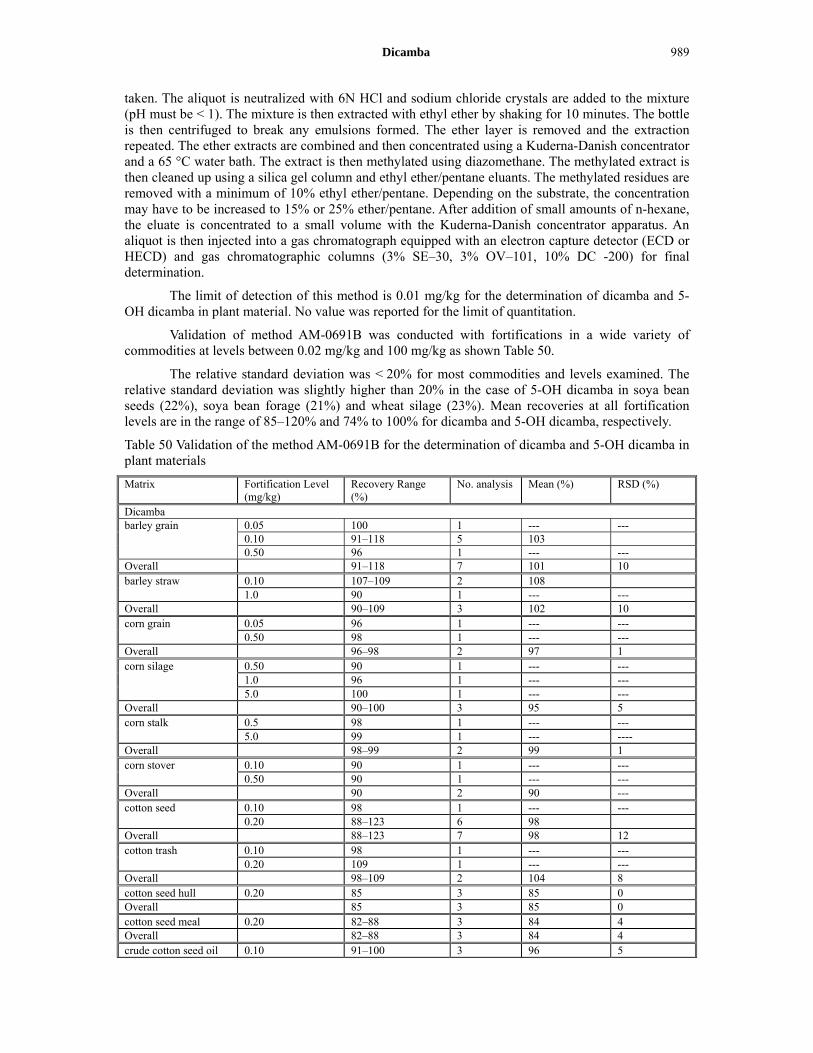
Dicamba 989
taken. The aliquot is neutralized with 6N HCl and sodium chloride crystals are added to the mixture (pH must be < 1). The mixture is then extracted with ethyl ether by shaking for 10 minutes. The bottle is then centrifuged to break any emulsions formed. The ether layer is removed and the extraction repeated. The ether extracts are combined and then concentrated using a Kuderna-Danish concentrator and a 65 °C water bath. The extract is then methylated using diazomethane. The methylated extract is then cleaned up using a silica gel column and ethyl ether/pentane eluants. The methylated residues are removed with a minimum of 10% ethyl ether/pentane. Depending on the substrate, the concentration may have to be increased to 15% or 25% ether/pentane. After addition of small amounts of n-hexane, the eluate is concentrated to a small volume with the Kuderna-Danish concentrator apparatus. An aliquot is then injected into a gas chromatograph equipped with an electron capture detector (ECD or HECD) and gas chromatographic columns (3% SE–30, 3% OV–101, 10% DC -200) for final determination.
The limit of detection of this method is 0.01 mg/kg for the determination of dicamba and 5-OH dicamba in plant material. No value was reported for the limit of quantitation.
Validation of method AM-0691B was conducted with fortifications in a wide variety of commodities at levels between 0.02 mg/kg and 100 mg/kg as shown Table 50.
The relative standard deviation was < 20% for most commodities and levels examined. The relative standard deviation was slightly higher than 20% in the case of 5-OH dicamba in soya bean seeds (22%), soya bean forage (21%) and wheat silage (23%). Mean recoveries at all fortification levels are in the range of 85–120% and 74% to 100% for dicamba and 5-OH dicamba, respectively.
Table 50 Validation of the method AM-0691B for the determination of dicamba and 5-OH dicamba in plant materials
Matrix Fortification Level (mg/kg)
Recovery Range (%)
No. analysis Mean (%) RSD (%)
Dicamba barley grain 0.05 100 1 --- --- 0.10 91–118 5 103 0.50 96 1 --- --- Overall 91–118 7 101 10 barley straw 0.10 107–109 2 108 1.0 90 1 --- --- Overall 90–109 3 102 10 corn grain 0.05 96 1 --- --- 0.50 98 1 --- --- Overall 96–98 2 97 1 corn silage 0.50 90 1 --- --- 1.0 96 1 --- --- 5.0 100 1 --- --- Overall 90–100 3 95 5 corn stalk 0.5 98 1 --- --- 5.0 99 1 --- ---- Overall 98–99 2 99 1 corn stover 0.10 90 1 --- --- 0.50 90 1 --- --- Overall 90 2 90 --- cotton seed 0.10 98 1 --- --- 0.20 88–123 6 98 Overall 88–123 7 98 12 cotton trash 0.10 98 1 --- --- 0.20 109 1 --- --- Overall 98–109 2 104 8 cotton seed hull 0.20 85 3 85 0 Overall 85 3 85 0 cotton seed meal 0.20 82–88 3 84 4 Overall 82–88 3 84 4 crude cotton seed oil 0.10 91–100 3 96 5
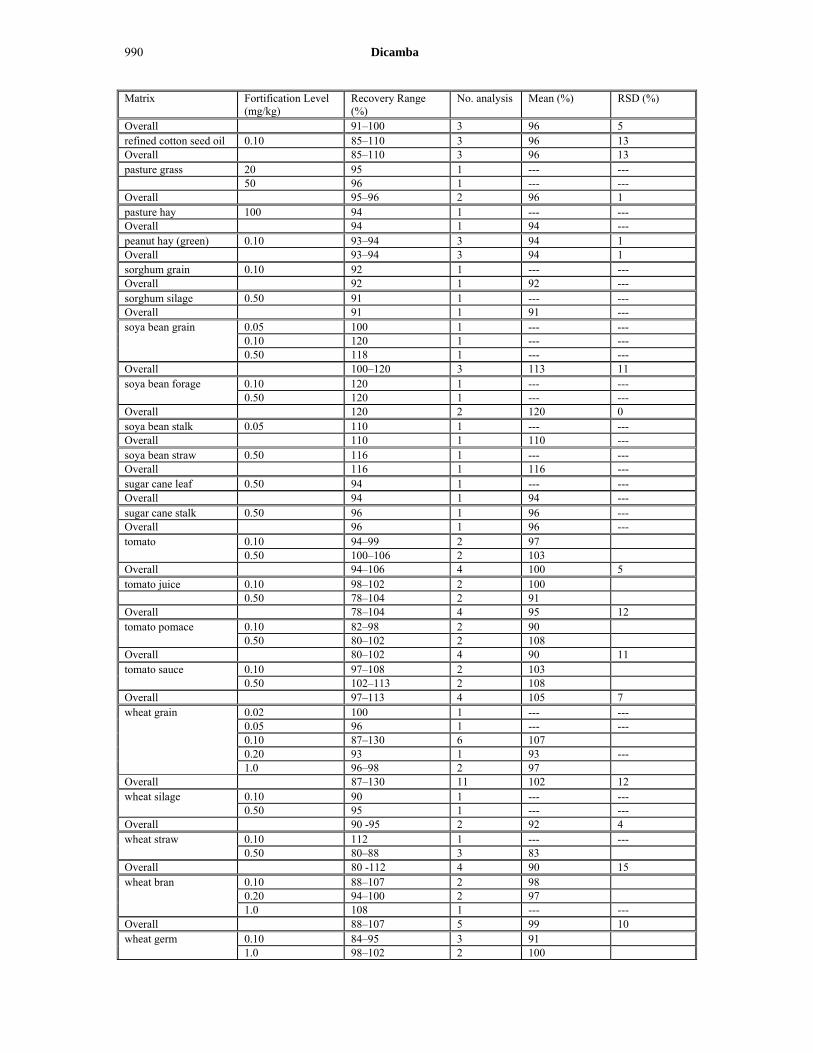
990 Dicamba
Matrix Fortification Level (mg/kg)
Recovery Range (%)
No. analysis Mean (%) RSD (%)
Overall 91–100 3 96 5 refined cotton seed oil 0.10 85–110 3 96 13 Overall 85–110 3 96 13 pasture grass 20 95 1 --- --- 50 96 1 --- --- Overall 95–96 2 96 1 pasture hay 100 94 1 --- --- Overall 94 1 94 --- peanut hay (green) 0.10 93–94 3 94 1 Overall 93–94 3 94 1 sorghum grain 0.10 92 1 --- --- Overall 92 1 92 --- sorghum silage 0.50 91 1 --- --- Overall 91 1 91 --- soya bean grain 0.05 100 1 --- --- 0.10 120 1 --- --- 0.50 118 1 --- --- Overall 100–120 3 113 11 soya bean forage 0.10 120 1 --- --- 0.50 120 1 --- --- Overall 120 2 120 0 soya bean stalk 0.05 110 1 --- --- Overall 110 1 110 --- soya bean straw 0.50 116 1 --- --- Overall 116 1 116 --- sugar cane leaf 0.50 94 1 --- --- Overall 94 1 94 --- sugar cane stalk 0.50 96 1 96 --- Overall 96 1 96 --- tomato 0.10 94–99 2 97 0.50 100–106 2 103 Overall 94–106 4 100 5 tomato juice 0.10 98–102 2 100 0.50 78–104 2 91 Overall 78–104 4 95 12 tomato pomace 0.10 82–98 2 90 0.50 80–102 2 108 Overall 80–102 4 90 11 tomato sauce 0.10 97–108 2 103 0.50 102–113 2 108 Overall 97–113 4 105 7 wheat grain 0.02 100 1 --- --- 0.05 96 1 --- --- 0.10 87–130 6 107 0.20 93 1 93 --- 1.0 96–98 2 97 Overall 87–130 11 102 12 wheat silage 0.10 90 1 --- --- 0.50 95 1 --- --- Overall 90 -95 2 92 4 wheat straw 0.10 112 1 --- --- 0.50 80–88 3 83 Overall 80 -112 4 90 15 wheat bran 0.10 88–107 2 98 0.20 94–100 2 97 1.0 108 1 --- --- Overall 88–107 5 99 10 wheat germ 0.10 84–95 3 91 1.0 98–102 2 100

Dicamba 991
Matrix Fortification Level (mg/kg)
Recovery Range (%)
No. analysis Mean (%) RSD (%)
Overall 84–102 5 95 7 wheat flour 0.10 76–102 3 90 1.0 112–118 2 115 Overall 76–118 5 100 17 5-OH Dicamba barley grain 0.05 84 1 --- --- 0.10 60–115 5 84 0.50 84 1 --- --- Overall 60–115 7 84 18 barley straw 0.10 85–102 2 94 1.0 86 1 --- --- Overall 85–102 3 91 10 corn grain 0.05 96 1 --- --- 0.50 90 1 --- --- Overall 90–96 2 93 4 corn silage 0.50 86 1 --- --- 1.0 94 1 --- --- 5.0 90 1 --- --- Overall 86–94 3 90 4 corn stalk 0.5 94 1 --- --- 5.0 98 1 --- --- Overall 94–98 2 96 3 corn stover 0.10 86 1 --- --- 0.50 83 1 --- --- Overall 83–86 2 85 2 cotton seed 0.10 86 1 --- --- 0.20 100–125 6 111 Overall 86–125 7 107 13 cotton trash 0.10 100 1 --- --- 0.20 121 1 --- --- Overall 100–121 2 110 15 cotton seed hull 0.20 77–82 3 79 3 Overall 77–82 3 79 3 cotton seed meal 0.20 73–78 3 75 3 Overall 73–78 3 75 3 crude cotton seed oil 0.10 83–91 3 88 5 Overall 83–91 3 88 5 refined cotton seed oil 0.10 76–96 3 86 10 Overall 76–96 3 86 10 pasture grass 10 105 1 --- --- 20 95 1 --- --- Overall 95–105 2 100 7 pasture hay 50 97 1 --- --- Overall 97 1 97 --- peanut hay (green) 0.10 82–88 3 85 3 Overall 82–88 3 85 3 sorghum grain 0.10 92 1 --- --- Overall 92 1 92 --- sorghum silage 0.50 82 1 --- --- Overall 82 1 82 --- soya bean grain 0.05 88 1 --- --- 0.10 80 1 --- --- 0.50 122 1 --- --- Overall 80–122 3 97 22 soya bean forage 0.10 90 1 --- --- 0.50 120 1 --- --- Overall 90–120 2 105 21 soya bean stalk 0.05 110 1 --- --- Overall 110 1 110 ---

992 Dicamba
Matrix Fortification Level (mg/kg)
Recovery Range (%)
No. analysis Mean (%) RSD (%)
soya bean straw 0.50 102 1 --- --- Overall 102 1 102 --- sugar cane leaf 0.50 88 1 --- --- Overall 88 1 88 --- sugar cane stalk 0.50 88 1 --- --- Overall 88 1 88 --- tomato 0.10 83–98 2 91 0.50 91–96 2 94 Overall 83–98 4 92 7 tomato juice 0.10 101–102 2 102 0.50 71–89 2 80 Overall 71–102 4 91 14 tomato pomace 0.10 69–110 2 100 0.50 84–88 2 92 Overall 69–110 4 88 17 tomato sauce 0.10 90–110 2 100 0.50 89–96 2 92 Overall 89–110 4 96 10 wheat grain 0.02 90 1 --- --- 0.05 84 1 --- --- 0.10 72–131 6 95 0.20 93 1 --- --- 1.0 80–88 2 84 Overall 72–131 11 91 16 wheat silage 0.10 58 1 --- --- 0.50 90 1 --- --- Overall 58–90 2 74 23 wheat straw 0.10 105 1 --- --- 0.50 84–88 3 87 Overall 84–105 4 91 9 wheat bran 0.10 105 2 105 0.20 89–90 2 90 1.0 78 1 --- --- Overall 78–105 5 94 13 wheat germ 0.10 84 -101 3 92 1.0 74–92 2 83 Overall 74–101 5 89 10 wheat flour 0.10 65–108 3 93 1.0 100–101 2 101 Overall 65–108 5 96 18
Method AM-0691B-0297-4, superseding method AM-0691B-0593-3, represents a revision of the original analytical method AM-0691B (Graben, 1997). This revision offers a more detailed description of the analytical procedures, provides GC/MS confirmatory techniques, and provides additional recovery data. The analytical procedure has not been changed from what was presented in AM-0691B.
Method AM-0691B-0297-4 (method AM-0691B) was developed for the quantitation of dicamba and 5-OH dicamba in plant material as the methyl esters/methylated products of dicamba and of 5-OH dicamba by GC/ECD. In method AM-0691B-0297-4, homogenized (Hobart food cutter or Waring blender) plant samples are hydrolysed and extracted with 1N HCl. The plant material is mixed with the acid and placed in a 95 °C water bath for 1.5 hours. The mixture is occasionally swirled during the hydrolysis. After cooling, the mixture is neutralized with 4N KOH. After cooling, the mixture is shaken and the pH checked (pH must be ≥ 8). The mixture is then centrifuged and an aliquot of the basic solution is taken. The aliquot is neutralized with 6N HCl and sodium chloride crystals are added to the mixture (pH must be < 1). The mixture is then extracted with ethyl ether by shaking for 10 minutes. The bottle is then centrifuged to break any emulsions formed. The ether layer

Dicamba 993
is removed and the extraction repeated. The ether extracts are combined and then concentrated using a Kuderna-Danish concentrator and a 65 °C water bath. The extract is then methylated using diazomethane. The methylated extract is then cleaned up using a silica gel column and ethyl ether/pentane eluants. The methylated residues are removed with a minimum of 10% ethyl ether/pentane. Depending on the substrate, the concentration may have to be increased to 15% or 25% ether/pentane.
After addition of small amounts of n - hexane the eluate is concentrated to a small volume with the Kuderna-Danish concentrator. An aliquot is then injected into a gas chromatograph equipped with an electron capture detector and a DB-210 gas chromatographic column for final determination. External standards were methylated by the same procedure, so there is no need for a conversion factor.
Residues can be confirmed with a mass selective detector (GC/MSD) operating in the selected ion monitoring mode (SIM).
A slightly modified extraction procedure is used for crude or refined oil. An additional C-18 Bond Elut cartridge clean up can be employed. GC columns can be changed from DB-210 to HP-1 or RTX-5 to resolve any gas chromatographic interferences.
The limits of detection are 0.005 mg/kg and 0.0037 mg/kg for dicamba and 5-OH dicamba, respectively. The limits of quantitation are 0.01 mg/kg and 0.007 mg/kg for dicamba and 5-OH dicamba, respectively.
Validation of method AM-0691B-0297-4 was conducted with fortifications in several commodities at levels between 0.01mg/kg and 100 mg/kg.
The repeatability of the method was < 20% for most of commodities and levels examined. The relative standard deviation exceeds 20% slightly in the cases of 5-OH dicamba in soya bean seed (22%), soya bean forage (21%) and wheat silage (23%). Mean recovery at all fortification levels is in the range of 83–120% and 74–110% for dicamba and 5-OH dicamba, respectively, as shown in Table 51.
Table 51 Validation of the method AM-0691B-0297-4 for the determination of dicamba and 5-OH dicamba in plant materials
Matrix Fortification Level (mg/kg)
Recovery Range (%)
No. analysis Mean (%) RSD (%)
Dicamba barley grain 0.05 100 1 --- --- 0.10 91–118 5 103 0.50 96 1 --- --- Overall 91–118 7 101 10 barley straw 0.10 107–109 2 108 1.0 90 1 --- --- Overall 90–109 3 102 10 corn grain 0.01 110 1 --- --- 0.05 96 1 --- --- 0.10 120 1 --- --- 0.50 98 1 --- --- Overall 96–120 4 106 11 corn forage 0.01 100–110 2 105 0.10 92 1 --- Overall 92–110 3 100 9 corn silage 0.01 100 1 --- --- 0.10 94 1 --- --- 0.50 90 1 --- --- 1.0 96 1 --- --- 5.0 100 1 --- --- Overall 90–100 5 96 4 corn fodder 0.01 110 1 --- --- 0.10 75–90 2 83 0.50 90 1 --- ---

994 Dicamba
Matrix Fortification Level (mg/kg)
Recovery Range (%)
No. analysis Mean (%) RSD (%)
Overall 75–110 4 91 14 corn stalk 0.5 98 1 --- --- 5.0 99 1 --- ---- Overall 98–99 2 99 1 corn stover 0.10 90 1 --- --- 0.50 90 1 --- --- Overall 90 2 90 --- cotton seed 0.10 98 1 --- --- 0.20 88–123 6 98 Overall 88–123 7 98 12 cotton trash 0.10 98 1 --- --- 0.20 109 1 --- --- Overall 98–109 2 104 8 cotton seed hull 0.20 85 3 85 0 Overall 85 3 85 0 cotton seed meal 0.20 82–88 3 84 4 Overall 82–88 3 84 4 crude cotton seed oil 0.10 91–100 3 96 5 Overall 91–100 3 96 5 refined cotton seed oil 0.01 120 1 --- --- 0.10 70–110 4 90 Overall 70–110 5 96 20 pasture grass 20 95 1 --- --- 50 96 1 --- --- Overall 95–96 2 96 1 pasture hay 0.01 80 1 --- --- 0.1 74 1 100 94 1 --- --- Overall 74–94 3 83 10 peanut hay (green) 0.10 93–94 3 94 1 Overall 93–94 3 94 1 sorghum grain 0.01 110 1 --- --- 0.10 80–92 2 86 --- Overall 80–110 3 94 15 sorghum silage 0.01 110 1 --- --- 0.10 85 1 --- --- 0.50 91 1 --- --- Overall 85–110 3 95 13 soya bean grain 0.05 100 1 --- --- 0.10 120 1 --- --- 0.50 118 1 --- --- Overall 100–120 3 113 11 soya bean forage 0.10 120 1 --- --- 0.50 120 1 --- --- Overall 120 2 120 0 soya bean stalk 0.05 110 1 --- --- Overall 110 1 110 --- soya bean straw 0.50 116 1 --- --- Overall 116 1 116 --- sugar cane leaf 0.50 94 1 --- --- Overall 94 1 94 --- sugar cane stalk 0.01 100 1 --- --- 0.10 88 1 --- --- 0.50 96 1 --- --- Overall 88–100 3 95 6 tomato 0.01 70 1 --- --- 0.10 73–99 3 89 0.50 100–106 2 103 Overall 94–106 6 90 15

Dicamba 995
Matrix Fortification Level (mg/kg)
Recovery Range (%)
No. analysis Mean (%) RSD (%)
tomato juice 0.10 98–102 2 100 0.50 78–104 2 91 Overall 78–104 4 95 12 tomato pomace 0.10 82–98 2 90 0.50 80–102 2 108 Overall 80–102 4 90 11 tomato sauce 0.10 97–108 2 103 0.50 102–113 2 108 Overall 97–113 4 105 7 wheat grain 0.02 100 1 --- --- 0.05 96 1 --- --- 0.10 87–130 6 107 0.20 92 1 93 --- 1.0 96–98 2 97 Overall 87–130 11 102 12 wheat silage 0.10 90 1 --- --- 0.50 95 1 --- --- Overall 90 -95 2 92 4 wheat straw 0.10 112 1 --- --- 0.50 80–88 3 83 Overall 80–112 4 90 15 wheat bran 0.10 88–107 2 98 0.20 94–100 2 97 1.0 108 1 --- --- Overall 88–107 5 99 10 wheat germ 0.10 84–95 3 91 1.0 98–102 2 100 Overall 84–102 5 95 7 wheat flour 0.10 76–102 3 90 1.0 112–118 2 115 Overall 76–118 5 100 17 5-OH dicamba barley grain 0.05 84 1 --- --- 0.10 60–115 5 84 0.50 84 1 --- --- Overall 60–115 7 84 18 barley straw 0.10 85–102 2 94 1.0 86 1 --- --- Overall 85–102 3 91 10 corn grain 0.01 70 1 --- --- 0.05 96 1 --- --- 0.10 93 1 --- --- 0.50 90 1 --- --- Overall 90–96 4 90 14 corn forage 0.01 70–80 2 75 0.10 91 1 --- --- Overall 70–91 3 80 10 corn fodder 0.01 70 1 0.10 73–86 2 0.50 83 1 Overall 70–86 4 78 8 corn silage 0.01 100 1 --- --- 0.10 102 1 --- --- 0.50 86 1 --- --- 1.0 94 1 --- --- 5.0 90 1 --- --- Overall 86–102 5 94 7 corn stalk 0.5 94 1 --- --- 5.0 98 1 --- ---

996 Dicamba
Matrix Fortification Level (mg/kg)
Recovery Range (%)
No. analysis Mean (%) RSD (%)
Overall 94–98 2 96 3 corn stover 0.10 86 1 --- --- 0.50 83 1 --- --- Overall 83–86 2 85 2 cotton seed 0.10 86 1 --- --- 0.20 100–125 6 111 Overall 86–125 7 107 13 cotton trash 0.10 100 1 --- --- 0.20 121 1 --- --- Overall 100–121 2 110 15 cotton seed hull 0.20 77–82 3 79 3 Overall 77–82 3 79 3 cotton seed meal 0.20 73–78 3 75 3 Overall 73–78 3 75 3 crude cotton seed oil 0.10 83–91 3 88 5 Overall 83–91 3 88 5 refined cotton seed oil 0.01 80 1 --- --- 0.10 70–96 4 82 Overall 70–96 5 82 10 pasture grass 10 105 1 --- --- 20 95 1 --- --- Overall 95–105 2 100 7 pasture hay 0.01 70 1 --- --- 0.10 75 1 50 97 1 --- --- Overall 70–97 3 81 14 peanut hay (green) 0.10 82–88 3 85 3 Overall 82–88 3 85 3 sorghum grain 0.01 80 1 --- --- 0.10 75–92 2 84 Overall 75–92 3 82 9 sorghum silage 0.01 90 1 --- --- 0.10 79 1 --- --- 0.50 82 1 --- --- Overall 79–90 3 84 6 soya bean grain 0.05 88 1 --- --- 0.10 80 1 --- --- 0.50 122 1 --- --- Overall 80–122 3 97 22 soya bean forage 0.10 90 1 --- --- 0.50 120 1 --- --- Overall 90–120 2 105 21 soya bean stalk 0.05 110 1 --- --- Overall 110 1 110 --- soya bean straw 0.50 102 1 --- --- Overall 102 1 102 --- sugar cane leaf 0.50 88 1 --- --- Overall 88 1 88 --- sugar cane stalk 0.01 70 1 --- --- 0.10 90 1 --- --- 0.50 88 1 --- --- Overall 88 3 83 11 tomato 0.01 90 1 --- --- 0.10 82–98 3 88 0.50 91–96 2 94 Overall 83–98 6 90 6 tomato juice 0.10 101–102 2 102 0.50 71–89 2 80

Dicamba 997
Matrix Fortification Level (mg/kg)
Recovery Range (%)
No. analysis Mean (%) RSD (%)
Overall 71–102 4 91 14 tomato pomace 0.10 69–110 2 100 0.50 84–88 2 92 Overall 69–110 4 88 17 tomato sauce 0.10 90–110 2 100 0.50 89–96 2 92 Overall 89–110 4 96 10 wheat grain 0.02 90 1 --- --- 0.05 84 1 --- --- 0.10 72–131 6 95 0.20 92 1 --- --- 1.0 80–88 2 84 Overall 72–131 11 91 16 wheat silage 0.10 58 1 --- --- 0.50 90 1 --- --- Overall 58–90 2 74 23 wheat straw 0.10 105 1 --- --- 0.50 84–88 3 87 Overall 84–105 4 91 9 wheat bran 0.10 105 2 105 0.20 89–90 2 90 1.0 78 1 --- --- Overall 78–105 5 94 13 wheat germ 0.10 84–101 3 92 1.0 74–92 2 83 Overall 74–101 5 89 10 wheat flour 0.10 65–108 3 93 1.0 100–101 2 101 Overall 65–108 5 96 18
Method AM-0691B-0593-3 was developed for the determination and quantitation of dicamba and its metabolite 5-OH dicamba in plant material as the methyl esters/methylated products of dicamba and of 5-OH dicamba by GC/ECD (Jimenez, 1993).
In method AM-0691B-0593-3, homogenized (Hobart food cutter or Waring Blender) plant samples are hydrolysed and extracted with 1N HCl. The plant material is mixed with the acid and placed in a 95 °C water bath for 1.5 hours. The mixture is occasionally swirled during the hydrolysis. After cooling, the mixture is neutralized with 4N KOH. After cooling, the mixture is shaken and the pH checked (pH must be ≥ 8). The mixture is then centrifuged and an aliquot of the basic solution is taken. The aliquot is neutralized with 6N HCl and sodium chloride crystals are added to the mixture (pH < 1). The mixture is then extracted with ethyl ether by shaking for 10 minutes. The bottle is then centrifuged to break any emulsions formed. The ether layer is removed and the extraction repeated. The ether extracts are combined and then concentrated using a Kuderna-Danish concentrator and a 65 °C water bath. The extract is then methylated using diazomethane. The methylated extract is then cleaned up using a silica gel column and ethyl ether/pentane eluants. The methylated residues are removed with a minimum of 10% ethyl ether/pentane. Depending on the substrate, the concentration may have to be increased to 15% or 25% ether/pentane. After addition of small amounts of n-hexane, the eluate is concentrated to a small volume with the Kuderna-Danish concentrator. An aliquot is then injected into a gas chromatograph equipped with an electron capture detector (ECD or HECD) and gas chromatographic columns (3% SE–30, 3% OV–101, 10% DC -200) for final determination.
A slightly modified extraction procedure is used for crude or refined oil. An additional C-18 Bond Elut cartridge clean up can be employed. GC columns can be changed from DB-210 to HP-1 or RTX-5 to resolve any gas chromatographic interferences.
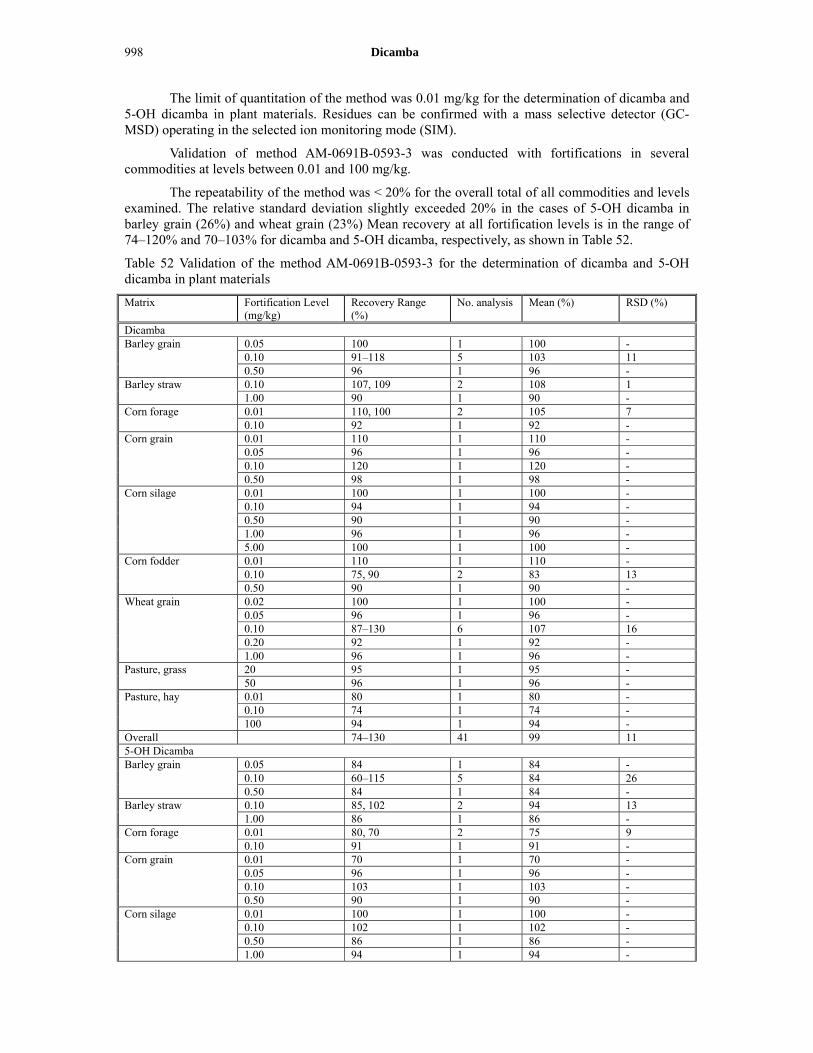
998 Dicamba
The limit of quantitation of the method was 0.01 mg/kg for the determination of dicamba and 5-OH dicamba in plant materials. Residues can be confirmed with a mass selective detector (GC-MSD) operating in the selected ion monitoring mode (SIM).
Validation of method AM-0691B-0593-3 was conducted with fortifications in several commodities at levels between 0.01 and 100 mg/kg.
The repeatability of the method was < 20% for the overall total of all commodities and levels examined. The relative standard deviation slightly exceeded 20% in the cases of 5-OH dicamba in barley grain (26%) and wheat grain (23%) Mean recovery at all fortification levels is in the range of 74–120% and 70–103% for dicamba and 5-OH dicamba, respectively, as shown in Table 52.
Table 52 Validation of the method AM-0691B-0593-3 for the determination of dicamba and 5-OH dicamba in plant materials
Matrix Fortification Level (mg/kg)
Recovery Range (%)
No. analysis Mean (%) RSD (%)
Dicamba Barley grain 0.05 100 1 100 - 0.10 91–118 5 103 11 0.50 96 1 96 - Barley straw 0.10 107, 109 2 108 1 1.00 90 1 90 - Corn forage 0.01 110, 100 2 105 7 0.10 92 1 92 - Corn grain 0.01 110 1 110 - 0.05 96 1 96 - 0.10 120 1 120 - 0.50 98 1 98 - Corn silage 0.01 100 1 100 - 0.10 94 1 94 - 0.50 90 1 90 - 1.00 96 1 96 - 5.00 100 1 100 - Corn fodder 0.01 110 1 110 - 0.10 75, 90 2 83 13 0.50 90 1 90 - Wheat grain 0.02 100 1 100 - 0.05 96 1 96 - 0.10 87–130 6 107 16 0.20 92 1 92 - 1.00 96 1 96 - Pasture, grass 20 95 1 95 - 50 96 1 96 - Pasture, hay 0.01 80 1 80 - 0.10 74 1 74 - 100 94 1 94 - Overall 74–130 41 99 11 5-OH Dicamba Barley grain 0.05 84 1 84 - 0.10 60–115 5 84 26 0.50 84 1 84 - Barley straw 0.10 85, 102 2 94 13 1.00 86 1 86 - Corn forage 0.01 80, 70 2 75 9 0.10 91 1 91 - Corn grain 0.01 70 1 70 - 0.05 96 1 96 - 0.10 103 1 103 - 0.50 90 1 90 - Corn silage 0.01 100 1 100 - 0.10 102 1 102 - 0.50 86 1 86 - 1.00 94 1 94 -

Dicamba 999
Matrix Fortification Level (mg/kg)
Recovery Range (%)
No. analysis Mean (%) RSD (%)
5.00 90 1 90 - Corn fodder 0.01 70 1 70 - 0.10 73, 86 2 80 12 0.50 83 1 83 - Wheat grain 0.02 90 1 90 - 0.05 84 1 84 - 0.10 72–131 6 95 23 0.20 92 1 92 - 1.00 80 1 80 - Pasture, grass 10 105 1 105 - 20 95 1 95 - Pasture, hay 0.01 70 1 70 - 0.10 75 1 75 - 50 97 1 97 - Overall 60–131 41 88 16
Method AM-0766A-1093-2 was originally developed for the quantitation of dicamba and DCSA in soil (Murray, 1996). The basic derivatisation and clean up steps of this method were adapted for the determination of DCSA in asparagus spears for the supervised residue trial study DocID 1994/5314.
Asparagus spears were homogenized by Hobart chopper and placed into pre-labelled plastic bags. The samples were then returned to the freezer until analysis. Asparagus samples were hydrolysed and extracted according to method AM-0691B-0593-3. A 10 g sample was treated with 150 mL 1N HCl and hydrolysed 1.5 hours in a 95 °C water bath. The sample was made basic with 4N KOH and two 50 mL aliquots were taken. The aliquots were acidified with 6N HCl and 15 g NaCl. Each acidic sample was extracted twice with 50 mL ethyl ether. Te ether extracts were reduced to approximately 0.5 mL in a 65 °C water bath.
One aliquot of each sample was methylated and cleaned up according to method AM-0691B-0593-3. These samples were quantitated by GC/ECD for 5-OH dicamba.
The other aliquot was then butylated and cleaned up by method AM-0766A-1093-2, because DCSA is the major metabolite of dicamba in asparagus. The residues were quantitated by GC/ECD for dicamba and DCSA. Confirmatory tests were performed by mass selective detection for DCSA interferences.
The limit of quantitation of this method was 0.01 mg/kg for the determination of dicamba and DCSA in plant materials.
Validation of method AM-0766A-1093-2 for the determination of dicamba and DCSA in asparagus spears was conducted concurrently with the routine residue analyses using fortification levels ranging from 0.01 mg/kg to 3.0 mg/kg as shown in Table 53.
The individual recovery at all fortification levels of dicamba is in the range of 82–123% and 96–138% for ECD and MSD respectively. For DCSA, 73–96% at and above 0.02 mg/kg for ECD and 70–140% for MSD.
Table 53 Validation of the method AM-0766A-1093-2 for the determination of dicamba and 5-OH dicamba in asparagus spears
Matrix Fortification Level (mg/kg) ECD % Recovery
MSD % Recovery
Dicamba Asparagus spears 0.01 100-123 100 0.02 101 135 0.10 103 87 0.20 87-94 96

1000 Dicamba
Matrix Fortification Level (mg/kg) ECD % Recovery
MSD % Recovery
0.50 87-106 138 1.0 82-97 99 3.0 107-112 Overall 97 ± 10 (N=12) 109 ± 22 (N=6) DCSA Asparagus spears 0.01 40-77 70.0-140.0 0.02 73-90 107.0-135.0 0.05 84-96 113.0-122.0 0.10 87-95 95.0 Overall 85 ± 9 (N=8) 113 ± 20 (N=10)
Method AM-0941-1094-0 was developed for the quantitation of dicamba, DCSA and 5-OH dicamba in asparagus and soya beans (Smith, 1995). Dicamba and DCSA residues are quantitated together by gas chromatography using a 63Ni electron capture detector (GC-ECD), residue of 5-OH dicamba is quantitated separately by GC-ECD.
In method AM-0941-1094-0 homogenized (Hobart food cutter or Waring Blender) plant samples of known weight are treated with 1N hydrochloric acid solution and hydrolysed for 90 minutes. at 95 °C in a water bath. The mixture is occasionally swirled during the hydrolysis. After cooling, the mixture is neutralized with 4N KOH to adjust the pH to be > 8, and then centrifuged. Two aliquots of the supernatant are taken and treated with 6N HCl and sodium chloride crystals to adjust the pH (pH must be < 1). Each aliquot is then extracted twice with ethyl ether by shaking for 10 minutes. The combined ether extracts are concentrated in a 65°C water bath using a Kuderna-Danish concentrator. Dicamba and DSCA residues in one aliquot are butylated using diazobutane. The residue of 5-OH dicamba in the second aliquot is methylated using diazomethane.
Clean-up of the derivatised extracts is achieved by using silica gel chromatography. Depending on the substrate, the butylated and methylated residues are removed 5–10% ethyl ether in pentane. After addition of small amounts of n-hexane, all samples are then concentrated to a small volume with the Kuderna-Danish concentrator and a nitrogen evaporator and are, afterwards, redissolved in hexane to an appropriate final volume.
Dicamba and DCSA residues are quantitated together by gas chromatography using a 63Ni electron capture detector (GC-ECD), residue of 5-OH dicamba is quantitated separately by GC-ECD.
External standards are butylated or methylated by the same procedure, so there is no need for a conversion factor.
The limit of quantitation of the method was 0.01 mg/kg for the determination of dicamba and 5-OH dicamba in all matrices except 0.02 mg/kg each for dicamba in soya bean forage, DCSA in asparagus and soya bean grain, and 5-OH dicamba in soya bean grain.
Residues can be confirmed with a mass selective detector (GC/MSD) operating in the selected ion monitoring mode (SIM).
Mean recovery values for dicamba at all fortification levels were in the range of 70–8%, as shown in Table 54. Those for DCSA ranged 63–102%, and for 5-OH dicamba 68–93%. The overall relative standard deviation for soya bean recovery tests tended to be higher than for other matrices and in this study about 25–28%.
Table 54 Validation of the method AM-0941-1094-0 for the determination of dicamba, DCSA and 5-OH dicamba in asparagus and soya bean
Matrix Fortification Level (mg/kg)
Recovery Range (%)
No. analysis Mean (%) RSD (%)
Dicamba Asparagus 0.05 - 1 80 - 0.20 - 1 70 -
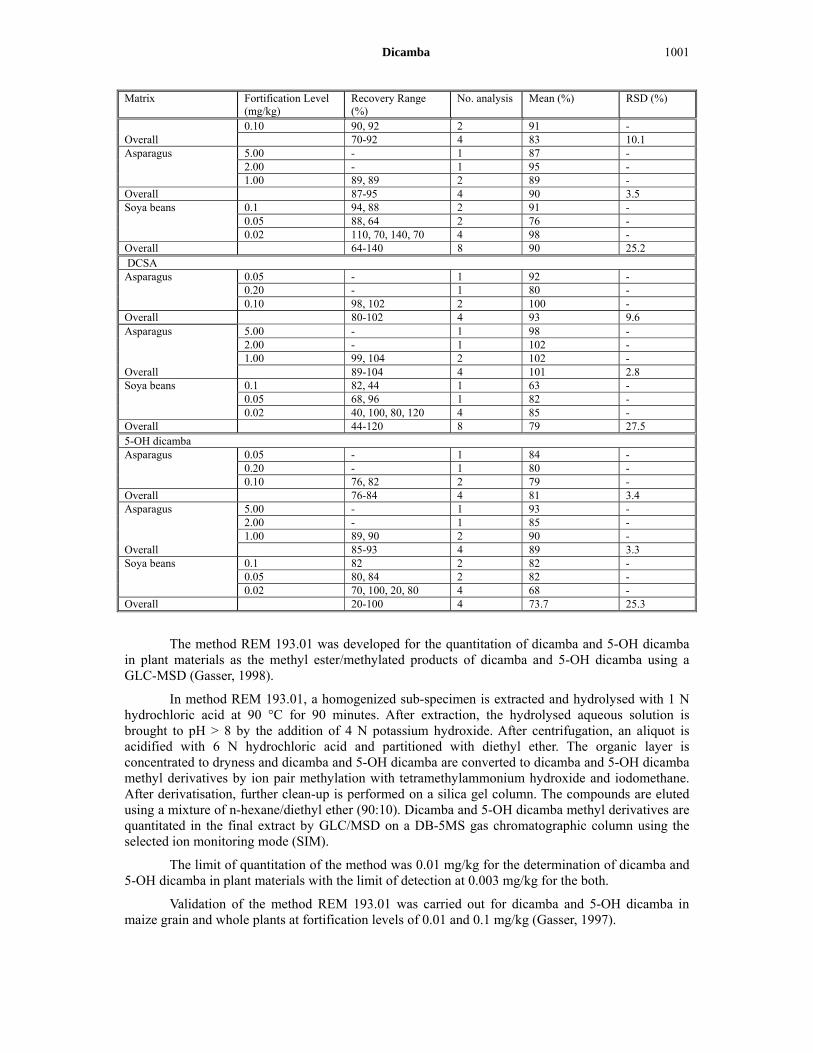
Dicamba 1001
Matrix Fortification Level (mg/kg)
Recovery Range (%)
No. analysis Mean (%) RSD (%)
0.10 90, 92 2 91 - Overall 70-92 4 83 10.1 Asparagus 5.00 - 1 87 - 2.00 - 1 95 - 1.00 89, 89 2 89 - Overall 87-95 4 90 3.5 Soya beans 0.1 94, 88 2 91 - 0.05 88, 64 2 76 - 0.02 110, 70, 140, 70 4 98 - Overall 64-140 8 90 25.2 DCSA Asparagus 0.05 - 1 92 - 0.20 - 1 80 - 0.10 98, 102 2 100 - Overall 80-102 4 93 9.6 Asparagus 5.00 - 1 98 - 2.00 - 1 102 - 1.00 99, 104 2 102 - Overall 89-104 4 101 2.8 Soya beans 0.1 82, 44 1 63 - 0.05 68, 96 1 82 - 0.02 40, 100, 80, 120 4 85 - Overall 44-120 8 79 27.5 5-OH dicamba Asparagus 0.05 - 1 84 - 0.20 - 1 80 - 0.10 76, 82 2 79 - Overall 76-84 4 81 3.4 Asparagus 5.00 - 1 93 - 2.00 - 1 85 - 1.00 89, 90 2 90 - Overall 85-93 4 89 3.3 Soya beans 0.1 82 2 82 - 0.05 80, 84 2 82 - 0.02 70, 100, 20, 80 4 68 - Overall 20-100 4 73.7 25.3
The method REM 193.01 was developed for the quantitation of dicamba and 5-OH dicamba in plant materials as the methyl ester/methylated products of dicamba and 5-OH dicamba using a GLC-MSD (Gasser, 1998).
In method REM 193.01, a homogenized sub-specimen is extracted and hydrolysed with 1 N hydrochloric acid at 90 °C for 90 minutes. After extraction, the hydrolysed aqueous solution is brought to pH > 8 by the addition of 4 N potassium hydroxide. After centrifugation, an aliquot is acidified with 6 N hydrochloric acid and partitioned with diethyl ether. The organic layer is concentrated to dryness and dicamba and 5-OH dicamba are converted to dicamba and 5-OH dicamba methyl derivatives by ion pair methylation with tetramethylammonium hydroxide and iodomethane. After derivatisation, further clean-up is performed on a silica gel column. The compounds are eluted using a mixture of n-hexane/diethyl ether (90:10). Dicamba and 5-OH dicamba methyl derivatives are quantitated in the final extract by GLC/MSD on a DB-5MS gas chromatographic column using the selected ion monitoring mode (SIM).
The limit of quantitation of the method was 0.01 mg/kg for the determination of dicamba and 5-OH dicamba in plant materials with the limit of detection at 0.003 mg/kg for the both.
Validation of the method REM 193.01 was carried out for dicamba and 5-OH dicamba in maize grain and whole plants at fortification levels of 0.01 and 0.1 mg/kg (Gasser, 1997).

1002 Dicamba
The repeatability of the method was < 20% for all commodities and levels examined. Mean recoveries at all fortification levels are in the range of 76–110% and 74–99% for dicamba and 5-OH dicamba, respectively, as shown in Table 55.
Table 55 Validation of the method REM 193.0 for the determination of dicamba and 5-OH dicamba in maize grain and whole plants
Matrix Fortification Level (mg/kg)
Recovery Range (%)
No. analysis Mean (%) RSD (%)
Dicamba Maize, whole plant 0.01 100-119 5 110 7 0.10 71-82 5 76 7 Maize grain 0.01 79-120 5 97 19 0.10 82-92 5 87 5 Overall 0.01-0.10 71-120 20 92 17 5-OH Dicamba Maize, whole plant 0.01 81-88 5 84 4 0.10 71-76 5 74 3 Maize grain 0.01 87-107 5 99 8 0.10 74-88 5 81 7 Overall 0.01-0.10 71-107 20 85 12
Validation of method REM 193.01 was also carried out for dicamba and 5-OH dicamba in corn (grain and straw), rape seed, pasture and oranges at fortification levels of 0.01 and 0.10 mg/kg (Maffezzoni, 2004).
The repeatability of the method was < 20% for all commodities and levels examined. Mean recoveries at all fortification levels are in the range of 73–100% and 71–106% for dicamba and 5-OH dicamba as shown in Table 56.
Table 56 Validation of the method REM 193.0 for the determination of dicamba and 5-OH dicamba in maize grain and straw, rape seed, pasture and orange
Matrix Fortification Level (mg/kg)
Recovery Range (%)
No. analysis Mean (%) RSD (%)
Dicamba Corn, grain 0.01 68-83 5 74 7.9 0.10 78-89 5 85 4.9 Corn, straw 0.01 93-101 5 97 3.5 0.10 68-77 5 73 4.8 Rape seed 0.01 71-89 5 82 8.2 0.10 71-86 5 81 7.2 Pasture 0.01 73-98 5 87 13.7 0.10 93-108 5 100 5.9 Oranges 0.01 66-73 5 70 4.1 0.10 83-95 5 87 5.3 Overall 66-108 50 87 13.0 5-OH dicamba Corn, grain 0.01 70-71 5 71 0.6 0.10 77-89 5 83 5.4 Corn, straw 0.01 104-108 5 106 1.7 0.10 69-78 5 76 4.9 Rape seed 0.01 70-82 5 75 6.0 0.10 74-87 5 82 6.6 Pasture 0.01 79-93 5 85 7.8 0.10 94-107 5 100 5.1 Oranges 0.01 69-76 5 72 4.1 0.10 86-98 5 91 5.5 Overall 69-108 50 84 14.1

Dicamba 1003
An independent laboratory validation was performed to validate enforcement method REM 193.01 for the determination of dicamba residues (Steinhauer S. 2004). The validation was conducted using maize grain and pasture. Control specimens were analysed in duplicate and fortified specimens were analysed in quintuple for both fortification levels. Fortification levels were set at the LOQ and ten times that level.
The repeatability of the method was < 20% for all commodities and levels examined. Mean recoveries at all fortification levels are in the range of 71–88% and 70–86% for dicamba and 5-OH dicamba as shown in Table 56.
Method REM 193.01 was independently validated and found suitable for routine analysis and enforcement.
Table 57 Independent laboratory validation of the method REM 193.0 for the determination of dicamba and 5-OH dicamba in maize grain and pasture
Matrix Fortification Level (mg/kg)
Recovery Range (%)
No. analysis Mean (%) RSD (%)
Dicamba Maize, grain 0.01 87-91 5 88 1.8 0.10 78-81 5 80 1.6 Pasture 0.01 68-76 5 71 4.5 0.10 63-80 5 72 8.8 Overall 68-91 20 78 10.0 5-OH dicamba Maize, grain 0.01 82-88 5 86 2.9 0.10 81-83 5 82 1.0 Pasture 0.01 78-84 5 81 2.7 0.10 68-73 5 70 2.7 Overall 68-88 20 80 7.8
The multiresidue methods described in the “FDA Pesticide Analytical Manual (PAM) – Volume 1, third Edition: Multiresidue Methods, Protocols A, B, C, D, E and F” was evaluated for analysis of 5-OH dicamba and DCSA (Perez et al., 2010). The evaluation of 5-OH dicamba and DCSA were conducted in accordance with the FDA Decision Tree for multi-residue testing and used Protocols C, A and B.
Protocol C, Section 301, was followed first by the use of a GC - under the conditions of Modules DG1 and DG13. Under module DG1, for both 5-OH dicamba and DCSA, the instrument produced multiple inconsistent peaks, indicating thermal degradation. Such behaviour makes the analysis of 5-OH dicamba and DCSA residues impossible under module DG1. When tested under module DG13, DCSA produced signals that are consistent with thermal degradation as well. However, when 5-OH dicamba was tested under DG13, it produced a single sharp peak. The peak area was in direct dependence with the concentration and a calibration curve was built. The calibration curve shows nonlinear behaviour and was approximated with a quadratic equation. The quadratic term is large and has a positive sign. This is a rather unusual phenomenon. In addition to carbon, oxygen and hydrogen, 5-OH dicamba and DCSA contain only chlorine atoms and the ECD is the only element-specific detector available.
Protocol C applies to molecules that can be vaporized without degradation at a temperature not exceeding 250 °C. The results of Protocol C demonstrated that 5-OH dicamba and DCSA prompted fluorescence experiments. During the test, 5-OH dicamba and DCSA responded well on the UV detector, but exhibited no fluorescence response.
Protocol B is applicable to molecules with acidic structures. These are subjected to derivatisation with methyl iodide. The resulting methyl derivatives possess higher volatility and stand a better chance for GC analysis. The methylated analogs of 5-OH dicamba and DCSA produced good detector signals on the GC-ECD under DG1. The analysis of the data from the analyte recovery tests showed excellent recovery under the GPC and Florisil cleanup procedures. The final tests involved extractions of a fatty and a non-fatty matrix, fortified with the analytes of interest. The extraction

1004 Dicamba
procedures were selected based on the nature of the matrix. Section 402, E2 is the best choice for soya bean forage, while E3 is the closest match for the soya bean seeds. The cleanup procedures, following the extraction, were Section 402 C1a GPC, followed by C1b methylation and C1c Florisil column chromatography.
During the GPC test, 5-OH dicamba was recovered with a combined yield of 82.0%, while DCSA was recovered with a yield of 114%.
During the recovery through complete method of Protocol B, DCSA was recovered with yields of 61.1% and 53.2% (low fortification level) and 45.7% and 38.5% (high fortification level) from the soya bean forage matrix. The recoveries from the soya bean seeds were lower at 0% (low fortification level) and 3.4% and 3.0% (high fortification level).
At the same time, 5-OH dicamba was recovered much lower percentage. The soya bean forage recoveries were 5.52% and 3.17% (low fortification level) and 1.4% and 6.0% (high fortification level). From the soya bean seed matrix, 5-OH dicamba showed 0% recovery in all fortified samples.
Animal Commodities
Method AM-0938-0994-0 was developed for the quantitation of dicamba and DCSA in animal materials as the butyl esters of dicamba and DCSA by GC/ECD (Formanski, 1994a).
In method AM-0938-0994-0 finely cut up animal tissue samples are extracted with 1N HCl. The animal tissue material is mixed with the acid and placed in a 95 °C water bath for 1.5 hours. The mixture is occasionally swirled during the hydrolysis. After cooling, the mixture is neutralized with 4N KOH. After cooling, the mixture is shaken and the pH checked (pH must be ≥ 8). The mixture is then centrifuged and an aliquot of the basic solution is taken. The aliquot is neutralized with 6N HCl and sodium chloride crystals are added to the mixture (pH must be < 1). The mixture is then extracted with ethyl ether by shaking for 10 minutes. The bottle is then centrifuged to break any emulsions formed. The ether layer is removed and the extraction repeated. The ether extracts are combined and then concentrated using a Kuderna-Danish concentrator and a 65 °C water bath. The extract is then butylated using diazobutane. The derivatised extract is then cleaned-up using a silica gel column and 5% ethyl ether/pentane eluant. The eluate containing the butylated dicamba and 3,6-DCSA esters is concentrated to a small volume with the Kuderna-Danish concentrator. An aliquot is then injected into a gas chromatograph equipped with an electron capture detector and a DB-210 gas chromatographic column for final determination of milk and beef fat residues. An HP-1 column is used for determination of residues in beef liver, kidney, muscle, and fat.
The limit of quantitation of this method was 0.01 mg/kg for the determination of dicamba and DCSA in animal tissues.
Residues can be confirmed with a mass selective detector (GC/MSD) operating in the selected ion monitoring mode (SIM). An RTX-1 column is used for the confirmation.
Method AM-0938-0994-0 was validated in dairy cattle tissues (fat, kidney, liver and muscle) and milk with fortification levels between 0.01 and 5.0 mg/kg with dicamba and DCSA. Results are summarised in Table 8.
In the analysis of dicamba, mean recoveries at all fortification levels are in the range of 70-117% with the exception of liver fortified at 0.01 mg/kg (mean = 65%). Repeatability of the method was < 20% for all animal commodities and levels examined.
In the analysis of DCSA, mean recoveries at different fortification levels are generally in the range of 70–120% with the exception of beef fat fortified at 0.05 mg/kg (64%), beef kidney fortified at 0.01 mg/kg (140%) and liver fortified at 0.01 and 0.10 mg/kg (68 and 66%). The relative standard deviation for beef fat fortified at 0.01 and 0.10 mg/kg (47 and 35%), beef liver fortified at 0.01 mg/kg (37%) and milk fortified at 0.01 mg/kg (26%). For other commodities and levels examined it was < 20%.

Dicamba 1005
Table 58 Validation of the method AM-0938-0994-0 for the determination of dicamba and DCSA in beef tissues and milk
Matrix Fortification Level (mg/kg)
Recovery Range (%)
No. analysis Mean (%) RSD (%)
Dicamba Beef fat Beef kidney Beef liver Dairy milk Beef muscle Overall
0.01 0.05 0.10 0.50 0.01 0.10 0.50 0.01 0.10 0.50 0.01 0.10 0.50 0.01 0.10 0.50 0.01-0.50
90–120 - 88–120 - 90–110 80–93 80–107 50–80 69–74 80–102 60–90 101–122 108–126 - - - 50–126
4 1 3 1 4 4 4 4 4 4 4 4 3 1 1 1 47
100 92 100 110 98 88 94 65 72 93 75 108 117 70 88 95 91
14.1 - 17.7 - 9.8 6.6 11.8 19.9 3.3 10.0 17.2 9.0 7.7 - - - 19.0
DCSA Beef fat Beef kidney Beef liver Dairy milk Beef muscle Overall
0.01 0.05 0.10 0.50 0.01 0.10 0.50 0.01 0.10 0.50 0.01 0.10 0.50 0.01 0.10 0.50 0.01-0.50
40–120 - 57–105 - 130–150 80–84 72–97 40–100 61–76 77–97 50–90 96–121 109–122 - - - 40–150
4 1 3 1 4 4 4 4 4 4 4 4 3 1 1 1 47
73 64 75 93 140 82 85 68 66 87 75 104 116 90 85 87 87
46.9 - 35.3 - 8.2 2.1 12.8 37.0 10.3 9.4 25.5 11.2 5.7 - - - 29.3
A confirmatory method trial of the method AM-0938-0994-0 was conducted to analyse fortified animal tissue specimens (Baldi, 1994). Fortifications of both dicamba and DCSA were made at the proposed US tolerance level and 2–5 times that level. The validation was conducted using beef fat and beef liver. Beef liver was fortified at 0.75, 1.50 and 3.00 mg/kg with both analytes. Similarly, beef fat was fortified at 0.10, 0.2 and at 0.50 mg/kg, also with both analytes.
The first trial was unsuccessful for both fat and liver. The second trial was successful for both analytes in fat but the recoveries for DCSA were low in liver. A third trial was conducted with successful dicamba recoveries. The DCSA recoveries were again low, but the standard deviation for the analyte in both the second and third trials for liver was 3.5% for seven recoveries and the method was judged consistent for this analyte.
In the analysis of dicamba, mean recoveries at all fortification levels are in the range of 72–109%. Repeatability of the method was < 20% for all animal commodities and levels examined as shown in Table 59.
In the analysis of DCSA, mean recoveries are relatively low, 62–89% for beef fat, 50–56% for beef liver with relative standard deviation < 20%. The result indicates that the method may not be suitable for analysing DCSA in liver.

1006 Dicamba
Table 59 Confirmatory trial of the method AM-0938-0994-0 for the determination of dicamba and DCSA in beef tissues
Matrix Fortification Level (mg/kg)
Recovery Range (%)
No. analysis Mean (%) RSD (%)
Dicamba Beef fat (trial 2) Beef Liver (trial 2) Beef Liver (trial 3) Overall
0.10 0.20 0.50 0.75 1.5 3.0 0.75 1.5 0.1-3.0
95-96 - - 69-75 - - 76–83 - 69–109
2 1 1 2 1 1 2 1 11
96 88 109 72 83 72 80 83 84
0.7 - - 5.9 - - 6.2 - 14.1
DCSA Beef fat (trial 2) Beef Liver (trial 2) Beef Liver (trial 3) Overall
0.10 0.20 0.50 0.75 1.5 3.0 0.75 1.5 0.1-3.0
72-78 - - 47–52 - - 53–58 - 47–89
2 1 1 2 1 1 2 1 11
75 62 89 50 56 52 56 51 61
5.7 - - 7.1 - - 6.4 - 21.7
A method (GRM022.03A) was developed for the quantitation of dicamba and DCSA in animal tissues (Richardson, 2008).
Milk and eggs
Samples are extracted with acetonitrile and centrifuged. The supernatant is added to 1M HCl in high purity water. Samples are heated at 95 ºC for 1.5 hours. Aliquots are extracted with DCM after the addition of sodium chloride. The extracts are combined and evaporated to dryness and then reconstituted in 1M HCl solution. Samples are subjected to SPE and the analytes eluted with 0.1% v/v acetic acid in acetonitrile. Samples are evaporated to dryness and residues reconstituted in acetone. Dicamba and DCSA are derivativised with N-(tert-butyldimethylsilyl)-N-methyl-trifluoroacetamide to form the tertiary butyl dimethyl silyl esters. Final determination is by negative ion chemical ionisation (NICI) gas chromatography with mass selective detection (GC/MSD).
Liver, muscle, fat and kidney
Samples are extracted with 1M HCl in high purity water by heating at 95 ºC for 1.5 hours. Aliquots are extracted with DCM after the addition of sodium chloride. The DCM extracts are combined and evaporated to dryness and are then reconstituted in 1M HCl solution. Samples are subjected to a solid phase extraction procedure and the analytes are eluted in 0.1% v/v acetic acid in acetonitrile. Samples are evaporated to dryness and residues reconstituted in acetone. Dicamba and DCSA are derivativised with N-(tert-butyldimethylsilyl)-N-methyl-trifluoroacetamide to form the tertiary butyl dimethyl silyl esters. Final determination is by GC-MSD.
The method was found to be suitable for the determination of dicamba and DCSA in the target animal matrices. NICI GC-MSD monitoring three fragment ions is a highly specific detection technique and a confirmatory method is not required. Interference arising from the matrices tested was not observed. Using high purity solvents and reagents, interference has not been observed. The method uses mainly disposable laboratory ware and provided all re-usable glassware is detergent washed and rinsed with HPLC-grade methanol, acetone or acetonitrile before use, interference from laboratory ware should not be observed.

Dicamba 1007
During method development, no significant suppression or enhancement of instrument response was observed, indicating that non-matrix calibration standards can be used for quantification. During method validation some matrix effects (suppression and enhancement) greater than 10% were observed for DCSA for each matrix. As the two analytes were quantified within the same run, it was therefore appropriate to use matrix matched standards for calibration and quantification. For dicamba, a matrix effect was observed for egg, muscle, fat and liver (results for the last two matrices were corrected due to a low signal level for solvent-prepared standards).
The linearity of the GC/MSD detector responses for dicamba and DCSA were tested over the range from 5 to 200 pg injected on column (equivalent to 0.005 to 0.2 μg/mL standards when using a 1 μL injection volume). If a residue beyond the tested concentration range is expected, the extract can be diluted to bring it within the linear range prior to quantification. The response to the GC/MSD was shown to be linear for dicamba target ion 184 m/z, qualifier ion 1 (185 m/z) and qualifier ion 2 (186 m/z) and for DCSA target ion 227 m/z, qualifier ion 1 (284 m/z) and qualifier ion 2 (285 m/z) on all matrices tested.
The overall mean recovery values for all animal matrices in the validation study were between 70% and 110% for both dicamba and DCSA and therefore meet the current requirements demonstrating the method has satisfactory accuracy.
The limit of quantitation of the method was 0.01 mg/kg for the determination of dicamba and DCSA in animal matrices.
Analytical method GRM022.03A was validated for the determination of dicamba and DCSA in animal matrices (milk, eggs, muscle, fat, liver and kidney).( Heillaut, 2008) A reagent blank sample was analysed, control samples were analysed in duplicate and fortified samples analysed in quintuplet at the limit of quantification and in quintuplet at ten times the LOQ (0.10 mg/kg) for each analyte and each matrix.
Results are summarised in Tables 60 and 61.
In the analysis of dicamba, mean recoveries at all fortification levels are in the range of 73–100%. Repeatability of the method was < 20% for all animal commodities and levels examined.
In the analysis of DCSA, mean recoveries at all fortification levels are in the range of 73–104%. Repeatability of the method was < 20% for all animal commodities and levels examined. .
The repeatability and specificity of the method were demonstrated and GRM022.03A was successfully validated for the determination of residues of dicamba and DCSA in animal matrices at the LOQ of 0.01 mg/kg.
Table 60 Validation of the method GRM022.03A for the determination of dicamba in milk, eggs and beef tissues
Matrix Fortification Level (mg/kg)
Recovery (%) Mean (%) RSD (%)
Dicamba – m/z 184 Milk 0.01 75, 84, 86, 87, 86 84 6
0.10 83, 86, 86, 94, 86 87 5 Overall 85 5
Eggs 0.01 94, 97, 100, 96, 94 96 3 0.10 89, 83, 86, 88, 79 85 5 Overall 91 8
Muscle 0.01 80, 85, 89, 88, 92 87 5 0.10 92, 93, 95, 95, 91 93 2 Overall 90 5
Fat 0.01 99, 96, 96, 94, 96 96 2 0.10 80, 79, 83, 81, 87 82 4 Overall 89 9
Liver 0.01 86, 91, 84, 86,84 86 3 0.10 104, 97, 99, 95, 93 98 4 Overall 92 7

1008 Dicamba
Matrix Fortification Level (mg/kg)
Recovery (%) Mean (%) RSD (%)
Kidney 0.01 89, 93, 96, 99, 96 95 4 0.10 89, 96, 98, 98, 95 95 4 Overall 95 4
Dicamba m/z 185 Milk 0.01 64, 72, 76, 76, 75 73 7
0.10 84, 86, 88, 94, 86 88 4 Overall 80 11
Eggs 0.01 91, 94, 97, 92, 91 93 3 0.10 90, 83, 86, 89, 79 85 5 Overall 89 6
Muscle 0.01 78, 82, 88, 87, 88 85 5 0.10 92, 92, 95, 95, 90 93 2 Overall 89 6
Fat 0.01 97, 95, 96, 94, 95 95 1 0.10 91, 79, 82, 81, 87 82 4 Overall 89 8
Liver 0.01 86, 93, 85, 87, 82 87 4 0.10 102, 96, 99, 94, 94 97 4 Overall 92 7
Kidney 0.01 90, 92, 96, 97, 94 94 3 0.10 88, 94, 97, 98, 93 94 4 Overall 94 3
Dicamba m/z 186 Milk 0.01 73, 81, 85, 85, 85 82 6
0.10 84, 86, 88, 94, 87 88 4 Overall 85 6
Eggs 0.01 92, 95, 100, 93, 94 95 3 0.10 91, 84, 87, 89, 80 86 5 Overall 91 6
Muscle 0.01 78, 81, 87, 87, 87 84 5 0.10 92, 92, 96, 95, 91 93 3 Overall 89 7
Fat 0.01 96, 93, 96, 93, 95 95 1 0.10 80, 80, 83, 82, 88 83 4 Overall 89 8
Liver 0.01 85, 90, 84, 87, 83 86 3 0.10 106, 99, 101, 97, 96 100 4 Overall 93 9
Kidney 0.01 91, 93, 97, 98, 96 95 3 0.10 91, 94, 97, 98, 94 95 3 Overall 95 3
Table 61 Validation of the method GRM022.03A for the determination of DCSA in milk, eggs and beef tissues
Matrix Fortification Level (mg/kg)
Recovery (%) Mean (%) RSD (%)
DCSA m/z 227 Milk 0.01 71, 76, 81, 83, 86 79 8
0.10 89, 88, 87, 94, 88 89 3 Overall 84 8
Eggs 0.01 92, 95, 101, 95, 93 95 4 0.10 93, 85, 88, 91, 84 88 5 Overall 92 6
Muscle 0.01 79, 88, 94, 93, 92 89 7 0.10 86, 94, 92, 90, 86 90 4 Overall 89 5
Fat 0.01 83, 76, 68, 79, 75 76 8 0.10 85, 82, 85, 84, 90 85 4 Overall 81 8

Dicamba 1009
Matrix Fortification Level (mg/kg)
Recovery (%) Mean (%) RSD (%)
Liver 0.01 85, 90, 68, 78, 66 77 13
0.10 72, 76, 78, 77, 75 75 3 Overall 76 9
Kidney 0.01 81, 91, 91, 92, 90 89 5 0.10 86, 96, 96, 93, 87 92 5 Overall 90 5
DCSA m/z 284 Milk 0.01 72, 77, 83, 85, 96 83 11
0.10 88, 87, 87, 95, 87 89 4 Overall 86 8
Eggs 0.01 66, 86, 95, 83, 87 84 13 0.10 90, 84, 87, 89, 84 87 3 Overall 85 9
Muscle 0.01 77, 105, 96, 95, 104 95 12 0.10 86, 93, 93, 89, 88 90 4 Overall 93 9
Fat 0.01 83, 66, 70, 71, 74 73 9 0.10 84, 81, 85, 82, 87 84 3 Overall 78 10
Liver 0.01 92, 90, 64, 71, 64 76 18 0.10 75, 79, 80, 80, 78 78 3 Overall 77 12
Kidney 0.01 86, 104, 105, 111, 115 104 11 0.10 86, 98, 97, 92, 89 92 5 Overall 98 11
DCSA m/z 285 Milk 0.01 74, 75, 82, 83, 86 80 7
0.10 91, 90, 88, 95, 90 91 3 Overall 85 8
Eggs 0.01 95, 99, 105, 97, 97 99 4 0.10 92, 84, 86, 89, 83 87 4 Overall 93 8
Muscle 0.01 78, 86, 90, 90, 86 86 6 0.10 86, 94, 91, 89, 87 89 3 Overall 88 5
Fat 0.01 82, 75, 99, 78, 74 82 12 0.10 84, 83, 85, 84, 91 85 4 Overall 83 9
Liver 0.01 89, 92, 70, 78, 67 79 14 0.10 73, 75, 78, 77, 74 75 3 Overall 77 10
Kidney 0.01 81, 93, 93, 94, 92 90 6 0.10 86, 95, 94, 92, 86 91 5 Overall 91 5
Another independent laboratory validation was performed to validate enforcement method GRM022.03A for the determination of dicamba residues in fortified animal tissue specimens (Morriss, 2009). Control specimens were analysed in duplicate and fortified specimens were analysed in quintuple for both fortification levels. The validation was conducted milk, eggs, and dairy cattle tissues (muscle, fat, liver and kidney). Fortification levels were set at the LOQ and ten times that level. Samples were analysed using matrix-matched (MMS) and non matrix-matched bracketing standards NMMS).
All samples were analysed using matrix-matched and non-matrix matched bracketing standards. An assessment of the matrix effects was conducted for both analytes using liver, fat and egg matrices. The results showed that significant matrix effects were likely to be observed for both analytes.

1010 Dicamba
Results are presented in Table 62.
The mean recovery values for dicamba in liver, muscle, milk and eggs were between 67–110% using both non-matrix and matrix matched bracketing standards, and 70–83% for kidney with non-matrix matched bracketing standards.
Poor recovery values were seen for both bracketing standards for dicamba in fat and in the matrix-matched bracketing standard for kidney. Due to the occurrence of poor recovery values, to improve the observed results investigation of the SPE and derivatisation phases was carried out.
The overall mean recovery values for DCSA for the non matrix-matched bracketing standard for muscle and liver were between 69–85%.
Overall relative standard deviations for most animal matrices for dicamba in the second validation study were below 20%. The exceptions were muscle (both standards) and fat (using non matrix-matched standard).
Linearity of the method for dicamba and DCSA was in the range 0.005–0.20 µg/mL with correlation coefficients > 0.9965.
The method is suitable to determine dicamba in liver, kidney, milk and eggs.
Table 62 Validation of the method GRM022.03A for the determination of dicamba and DCSA in milk, egg and beef tissues
Matrix Fortification Level (mg/kg)
Recovery Range (%)
No. analysis Mean (%) RSD (%)
Dicamba Muscle 0.01 49–93 5 75 25.9
0.10 60–89 5 72 18 Overall 49–93 10 73 21.3
Muscle 0.01 51–104 5 78 27.1 0.10 55–81 5 67 18.3 Overall 51–104 10 72 24.1
Fat 0.01 21–29 5 24 13.6 0.10 17–30 5 24 20.5 Overall 17–30 10 24 16.6
Fat 0.01 24–44 5 33 21.7 0.10 19–34 5 27 21.3 Overall 19–44 10 30 23.3
Liver 0.01 68–77 5 73 5.3 0.10 67–87 5 78 10.2 Overall 67–87 10 75 8.7
Liver 0.01 78–95 5 89 7.5 0.10 76–99 5 89 10.1 Overall 76–99 10 89 8.4
Kidney 0.01 54–68 5 61 10.4 0.10 64–72 5 69 5.8 Overall 54–72 10 65 9.9
Kidney 0.01 62–78 5 70 9.3 0.10 78–86 5 83 4.8 Overall 62–86 10 77 10.8
Milk 0.01 64–84 5 74 10.8 0.10 68–109 5 89 16.4 Overall 64–109 10 81 16.9
Milk 0.01 80–109 5 94 12.2 0.10 88–142 5 115 16.8 Overall 80–142 10 105 18.1
Eggs 0.01 73–87 5 79 7.7 0.10 57–101 5 87 21.6 Overall 57–101 10 83 16.9
Eggs 0.01 88–106 5 95 7.9 0.10 66–118 5 102 21.2 Overall 66–118 10 99 16.0

Dicamba 1011
Matrix Fortification Level (mg/kg)
Recovery Range (%)
No. analysis Mean (%) RSD (%)
DCSA Muscle 0.01 44–85 5 63 26.3 0.10 46–65 5 54 14.8 Overall 44–85 10 58 22.4 Muscle 0.01 59–108 5 85 25.3 0.10 59–82 5 69 14.8 Overall 59–102 10 77 23.4 Fat 0.01 7–17 5 12 31.4 0.10 9–16 5 13 21.5 Overall 7–17 10 13 25.7 Fat 0.01 13–29 5 19 31.3 0.10 13–22 5 18 20.0 Overall 13–29 10 19 25.2 Liver 0.01 36–49 5 41 11.6 0.10 36–53 5 45 15.4 Overall 36–53 10 43 13.9 Liver 0.01 70–82 5 75 6 0.10 61–89 5 76 15.1 Overall 61–89 10 75 11.0 Kidney 0.01 45–55 5 50 8.6 0.10 43–53 5 47 7.7 Overall 43–55 10 49 8.2 Kidney 0.01 59–71 5 66 6.7 0.10 60–76 5 67 8.9 Overall 59–76 10 67 7.5 Milk 0.01 48–58 5 54 7.0 0.10 41–63 5 55 15.8 Overall 41–63 10 55 11.6 Milk 0.01 55–66 5 62 6.8 0.10 48–74 5 64 15.9 Overall 48–74 10 63 11.7 Eggs 0.01 40–54 5 48 10.7 0.10 49–64 4 58 11 Overall 40–64 9 52 14.1 Eggs 0.01 34–45 5 42 10.9 0.10 43–56 4 51 11 Overall 34–56 9 46 14.4
For each matrix, the first row presents the results of analysis using matrix-matched bracketing standards. The second row presents the results of analysis using non matrix-matched bracketing standards.
Stability of Pesticide Residues in Stored Analytical Samples
The Meeting received frozen storage stability of residues of dicamba and its metabolites in asparagus, sugar cane, maize, soya bean, sorghum and tomato samples.
Plant commodities
Asparagus
The stability of dicamba, DCSA, and 5-OH dicamba in stored frozen asparagus samples was investigated by Clouser et al. (1994a).
In this study, samples of control/homogenized asparagus spears were fortified with 0.2 mg/kg each of for dicamba, DCSA and 5-OH dicamba, and stored frozen in deep freezer at -25 °C. Triplicate samples were analysed 0 days after frozen storage and 104 days (approximately 3.5 months) after frozen storage. Duplicate concurrent recoveries were analysed with the stored samples. The stability of dicamba, DCSA and 5-OH dicamba under conditions of frozen storage was calculated accordingly. Results are shown in Table 9.

1012 Dicamba
Table 63 Storage stability of dicamba, DCSA and 5-OH dicamba in asparagus at -25 °C
Storage interval (days)
Fortification (mg/kg)
% Remaining a Concurrent recovery (%)
Dicamba 0 0.2 86 89 104 75 70DCSA 0 0.2 87 92 104 81 71 5-OH dicamba 0 0.2 71 74 104 71 59 119 87 86
a Mean of three subsamples for % remaining and two for concurrent recovery.
Dicamba and 5-OH dicamba were relatively stable for about 3–4 months of frozen storage.
Sugar cane A two month storage stability study was conducted for sugar cane and its processed commodities of white sugar, bagasse and final molasses as these commodities were analysed after approximately two months of storage in freezer at -15 °C (Formanski, 1994b). For sugar cane, the stability was determined by analysing in triplicate, the sample which was sent with the processed fractions, then comparing the average residue value with that found in the corresponding prequalifier sample analysed approximately two and a half months earlier.
For bagasse, final molasses and white sugar processed fractions, the samples were stored in the freezer for approximately two months from the time of processing to the time of extraction. Therefore, triplicate treatment subsamples of bagasse and final molasses were reanalysed after two additional months of freezer storage to determine the stability. The average residue values of dicamba and 5-OH dicamba from this analysis were determined then compared with those obtained from the treatment samples analysed two months earlier. The stability was calculated by dividing the average residue values obtained from the reanalysis by those obtained from the initial analysis two months earlier.
For the white sugar, there were no detectable residues of dicamba or 5-OH dicamba in the treatment sample. As a result, the storage stability was conducted using laboratory fortified control samples. On day 0, three subsamples, each fortified at 0.1 mg/kg dicamba and 5-OH dicamba, were analysed and the average % recovery of each compound was determined. Also, six subsamples were fortified with dicamba and 5-OH dicamba at 0.1 mg/kg for each compound. These fortified control subsamples and eight additional control subsamples were stored in the freezer for two months. After the two month period, three of the stored control subsamples were freshly fortified with the two compounds at the level indicated above. A stored control, the three freshly fortified stored control, and three stored stability samples were analysed and the stability of dicamba and 5-OH dicamba was calculated by dividing the corrected average % recovery of the stored fortified stability samples by the average % recovery of the controls fortified on day 0 for each compound. The corrected average % recovery was calculated by dividing the average % recovery obtained from the stored fortified controls by the average % recovery obtained from the freshly fortified controls and multiplying by 100. The storage stability results of dicamba and 5-OH dicamba in sugar cane processed fractions are presented in Table 64.
Table 64 Storage stability of dicamba, DCSA and 5-OH dicamba in sugar cane and its processed products at -15 °C
Commodity Storage interval (days)
Remaining residue (mg/kg) a
Dicamba 5-OH dicamba
Sugar cane 0 < 0.01 0.042 81 0.013 0040

Dicamba 1013
Bagasse 0 0.224 0.134 60 0.235 0.135 Final Molasses 0 0.553 0.743 60 0.524 0.575 Remaining residue (%) 1 Dicamba DCSA Refined white sugar – stored fortified
0 102 110
Refined white sugar – stored fortified 60 97 118 Refined white sugar – freshly fortified 60 98 117
a Mean of three subsamples.
There was no significant loss of dicamba or 5-OH dicamba from the sugar cane, bagasse, and refined white sugar when these samples were stored for two months in the freezer. There was no significant loss of dicamba in the final molasses. However, there was about 20% loss of 5-OH dicamba in this fraction.
Residues of dicamba and 5-OH dicamba are stable in sugar cane, bagasse and refined white sugar and residues of dicamba are stable in final molasses for a period of two months under freezer storage conditions.
Soya bean Soya bean seeds and refined oil control samples were fortified with dicamba, 5-OH dicamba and DCSA at 0.1 mg/kg (refined oil) or 0.5 mg/kg (grain) for each compound. The samples were stored in a freezer at a mean temperature of 16 °C for three months. Samples were taken for analysis at 0 days and three months and analysed by analytical method AM-0941-1094-0. Results are shown in Table 65.
Table 65 Storage stability of dicamba, DCSA and 5-OH dicamba in soya bean and refined oil stored at -16 °C
Commodity Storage interval (months)
Fortification (mg/kg)
% Remaining Concurrent recovery (%)
Dicamba
Soya bean grain 0 3
0.5 74, 81 77, 80, 83
78, 86 80, 82
Soya bean Refined Oil
0 3
0.1 83, 75, 80 82, 75
82, 74 85, 75
DCSA
Soya bean grain 0 3
0.5 63, 70 59, 61, 63
63, 73 67, 69
Soya bean Refined Oil
0 3
0.1 69, 72, 67 61, 57
82, 71 68, 62
5-OH dicamba
Soya bean grain 0 3
0.5 93, 80 95, 91, 96
82, 76 85, 86
Soya bean Refined Oil
0 3
0.1 83, 88, 79 79, 99
80, 82 96, 100
Recoveries of dicamba and 5-OH dicamba in soya bean grain and refined oil were acceptable after three months of frozen storage. However, recoveries of DCSA in soya bean grain and refined oil were below 70% both for 0 day and after three months of frozen storage probably due to low concurrent recoveries.
Maize. field corn forage, silage, grain and fodder samples were fortified with 0.10 mg/kg each of dicamba and 5-OH dicamba (Jimenez, 1995b). The samples were stored in a freezer at a mean temperature of -17 °C for up to three years. Samples were taken for analysis before storage and after 3, 6, 9, 12, 18, 24 and 36 months and analysed by analytical method AM-0691B. Results are shown in Table 66.

1014 Dicamba
Table 66 Storage stability of dicamba and 5-OH dicamba in maize and related feeding stuffs at -17 °C
Commodity Storage interval (months)
Fortification (mg/kg)
% Remaininga Concurrent recovery (%)
Dicamba Field corn, forage 0
3 6 9 12 18 24 36
0.1 109 78 92 83 79 82 80 82
110 82 88 78 82 85 81 84
Field corn, silage 0 3 3 6 6 9 12 18 24 36
0.1 115 100 123c 87 101 80 87 79 71 75
117 98 102b
83 632
80 81 82 73 61
Field corn, grain 0 3 6 9 12 18 24 36
0.1 115 72 86 80 83 82 70 89
115 73 102 76 86 88 75 912
Field corn, fodder 0 3 6 9 12 18 24 36 36
0.1 86 112 83 78 83 56 92 72 85
91 123 84 81 77 73 83 67 73
5-OH Dicamba Field corn, forage 0
3 6 9 12 18 24 36
0.1 82 90 104 95 93 103 97 78
96 92 100 91 95 104 89 77
Field corn, silage 0 3 3 6 6 9 12 18 24 36
0.1 87 83 273
31 45 27 28 25 16 25
90 101 782
862
652
80 43 94 71 60
Field corn, grain 0 3 6 9 12 18
0.1 90 88 95 85 98 105
92 77 109 86 98 105

Dicamba 1015
Commodity Storage interval (months)
Fortification (mg/kg)
% Remaininga Concurrent recovery (%)
24 36
101 85
93 842
Field corn, fodder 0 3 6 9 12 18 24 36 36
0.1 84 95 60 60 68 41 58 19 59
88 1152
85 83 81 60 66 35 70
a Mean of three subsamples for % remaining and two subsamples for concurrent recovery. b Only one value available c Mean recovery determined following analysis of two samples.
Uncorrected recoveries of 5-OH dicamba in corn fodder were found to be below 70% for all samples after three months of storage. However, the concurrent recoveries were also very low for the analysis of samples stored 18 months or longer.
Recoveries of 5-OH dicamba were very low in silage. For this reason, two additional sets of stability samples were analysed. In Set 1 silage was fortified at 0.10 mg/kg with dicamba and 5-OH dicamba and stored in a freezer at a mean temperature of -17 °C. Samples were analysed before storage and after one, two and three months. A second set of samples, Set 2, was fortified at 0.10 mg/kg with 5-OH dicamba and stored in a freezer at a mean temperature of -17 °C. Samples were analysed before storage and after 1, 3, 12 and 24 months. Results are shown in Table 67.
Table 67 Storage stability of dicamba and 5-OH dicamba in maize silage at -17 °C
Storage interval (months)
Fortification (mg/kg)
% Remaininga Concurrent recovery b (%)
Dicamba in Set 1 0 1 2 3
0.1 88c
100 93 88
- 130
87
74 5-OH dicamba in Set 1 0 1 2 3
0.1 86c
89c
84 74
- - 89 75
5-OH dicamba in set 2 0 1 2 3 6 12 24
0.1
86e
73 - - 90 62 64
86e
73 - - 90 62 64
a Mean of three subsamples. b Only one recovery value per interval, no recovery for day 0 (and one month for Set 1). c Corrections made by dividing storage stability sample recoveries values by the average storage stability recoveries. d Only one recovery value. e Mean recovery determined following analysis of two samples. Third sample identified as an outlier and not included in calculations.

1016 Dicamba
The results from the additional sets of silage samples indicate the low recoveries observed in the previous study were not due to instability of 5-OH dicamba. Uncorrected recoveries were low, < 70%, for 5-OH dicamba at several intervals in fodder and silage (Set 2) with corresponding concurrent recoveries also low.
Sorghum For the period of the study, samples of sorghum grain and grain dust were stored frozen at -15 °C (Rosas, 1994). The stability of dicamba and 5-OH dicamba was determined by selecting the prequalifier treated sorghum grain sample and two sorghum grain dust samples previously analysed. After initial analysis, the sorghum grain and sorghum grain dust samples were stored frozen (five months for sorghum grain and two months for sorghum grain dust samples). Reanalysis of these samples demonstrated that the residues initially determined were not significantly different from those determined after the period of frozen storage. Table 68 presents a summary of the residue levels as initially determined as well as the residue levels found at the end of the storage period.
Table 68 Storage stability of dicamba and 5-OH dicamba in sorghum grain and grain dust at -15 °C
commodity Storage Interval (months) Dicamba (mg/kg)
5-OH Dicamba (mg/kg)
Whole grain (prequalifier) 0 5.7 2.6 5 5.8 3.0 Grain dust (> 2030 μm) 0 17.6 9.5 2 17.4 9.8 Grain dust (> 425 μm) 0 11.6 3.2 2 12.2 3.3
The results indicate that dicamba and 5-OH dicamba were stable in sorghum grain and grain dust for five months and two months, respectively.
Animal commodities
Beef tissues (kidney, liver, muscle and fat) and milk samples were fortified with 0.10 mg/kg each of dicamba and DCSA (Formanski, 1996b). The samples were stored in a freezer, for up to 18 months, at a temperature of <-12.2 °C. Samples were taken for analysis before storage and after 3, 6, 12, and 18 months. Analysis was conducted by method AM-0938-0994-0 using both gas chromatography/electron capture detection (GC/ECD) and gas chromatography/mass selective detection (GC/MSD). Results from the GC/ECD and GC/MSD methods are shown in Table 69.
Table 69 Storage stability of dicamba and 5-OH dicamba in beef kidney, liver, muscle, fat and milk at -12 °C as determined with GC/ECD or GC/MSD
Commodity Storage interval (months)
Fortification (mg/kg)
GC/ECD GC/MSD
% Remaininga Concurrent recovery (%)
% Remaininga
Concurrent recovery (%)
Dicamba Kidney 0
3 6 12 18
0.1 95 742
77 54 76
102 66 74 57 79
103 82b
81 98 116
102 78 82 100 110
Liver
0 3 6 12 18
0.1 96 69 71 72 69
96 62 72 66 71
94 80 76 109 104
85 74 74 114 99
Muscle 0 3 6 12 18
0.1 116 82 80 82 67
114 75 75 77 75
115 94 92 105 99
106 86 90 93 101

Dicamba 1017
Commodity Storage interval (months)
Fortification (mg/kg)
GC/ECD GC/MSD
% Remaininga Concurrent recovery (%)
% Remaininga
Concurrent recovery (%)
Fat 0 3 6 12 18
0.1 94 89 82 86 87
95 87 83 90 85
121 93 94 121 115
116 88 110 106 114
Milk 0 3 6 12 18
0.1 107 90 71 77 69
102 90 71 86 80
104 89 83 103 101
110 85 79 99 92
DCSA Kidney 0
3 6 12 18
0.1 110 68b
65 54 74
108 66 66 54 64
84 69b
78 102 104
80 67 80 103 100
Liver
0 3 6 12 18
0.1 109 64 63 67 73
109 65 66 74 72
75 62 68 117 92
66 62 66 114 94
Muscle 0 3 6 12 18
0.1 92 59 59 57 65
103 59 66 54 72
95 74 78 92 85
86 76 92 87 101
Fat 0 3 6 12 18
0.1 94 60 75 93 93
90 56 76 72 95
100 81 82 113 115
100 76 100 110 125
Milk 0 3 6 12 18
0.1 96 71 64 81 75
90 75 70 78 80
83 72 73 96 83
86 76 77 95 81
a Mean of three subsamples for % remaining and two subsamples for concurrent recovery. b Mean recovery determined following analysis of two samples.
Recoveries of DCSA in beef muscle as determined by GC/ECD after storage for three months or longer were below acceptable levels of 70%. However, analysis of the same samples by the more selective GC/MSD method indicates that DCSA is stable in beef muscle over the 18-month study period. Recoveries of dicamba and DCSA in other beef tissues (kidney, liver and fat) and milk, with the exception of some high (> 110%) or low (< 70%) recoveries, were consistent with the residues being stable in the individual matrices stored under freezer conditions over 18 months.
The stability of dicamba and DCSA in final extracts stored at 4 ºC (between 0 and 9 ºC) was assessed in eggs during the validation of the method GRM022.03A. Samples were re-analysed after a 12 day interval. Results determined from this matrix at the 12 day interval were similar to those from the original analysis (the mean recovery rate was in the range 70–110%). The results (Table 70) indicate the sufficient stability of dicamba and DCSA in final extracts when stored at 4 ºC for 12 days.
Table 70 Storage stability of dicamba and DCSA in eggs final extract at 4 °C
Storage interval (days) Fortification level (mg/kg)
% Remaining Mean recovery (%)
RSD (%)
Dicamba (Target ion 184 m/z) 1 0.01 94, 97, 100, 96, 94 96 3 12 0.01 77, 82, 81, 76, 77 79 4

1018 Dicamba
Storage interval (days) Fortification level (mg/kg)
% Remaining Mean recovery (%)
RSD (%)
DCSA (Target ion 227 m/z) 1 0.01 92, 95, 101, 95, 93 95 4 12 0.01 82, 86, 90, 84, 84 85 4
USE PATTERNS
The Meeting received approved labels in Canada, Central and South American countries, European countries, Middle Eastern countries and the USA. However, in this evaluation, only labels of the countries relevant to supervised trials submitted are shown.
Formulations containing dicamba, alone or in combination with other compounds are registered for use on a wide variety of crops in over 101 countries.
Pests controlled by dicamba for those crops for which authorized uses exist are shown in Table 71.
Table 71 Pests controlled by dicamba in crops for which authorized uses exist and are relevant to the present evaluation
Crop Pests or group of pests controlled
Applications max. no.
Growth stage (BBCH) of crop when treated
Interval between applications [days]
VO Fruiting vegetables, other than cucurbit
Sweet corn Annual and perennial broadleaf weeds
1 Early post-emergence (4-24” tall), BBCH 16-18
NA
VD Pulses
Soya bean (dry)
Annual and perennial broadleaf weeds
2 14 days pre-plant BBCH 00 / 14 days pre-harvest BBCH 89.
NA
VS Stem and stalk vegetables
Asparagus Annual and perennial broadleaf weeds.
1 Immediately after cutting, 24 hours before sampling, BBCH 09.
NA
GC Cereal grains
Barley Annual and perennial broadleaf weeds 2
Prior to joint stage BBCH 30 (fall seeded) or before 4 leaf stage BBCH 14 (spring seeded) + pre-harvest BBCH 87/89.
NA
Maize/ Corn
Annual and perennial broadleaf weeds
1
Pre-plant BBCH 00, pre-emergence, early post-emergence (between emergence and 5 leaf stage BBCH 00-15) or post-emergence (8-36” tall or 15 days before tassel emergence BBCH 15-35/39)
NA
Sorghum
Annual and perennial broadleaf weeds
2
Pre-plant BBCH 00 (15 day), post-emergence before 15” (spike stage or 3-5 leaf stage, BBCH 09 or 13/15) + 30 days pre-harvest (soft dough stage BBCH 85).
NA
Wheat Annual and perennial broadleaf weeds 2
Prior to joint stage (fall seeded) or 6 leaf stage (spring seeded BBCH 16) + pre-harvest BBCH 87/89.
NA
Millet Annual and perennial broadleaf weeds
1 2-5 leaf stage BBCH 12-15. NA
Oat Annual and perennial broadleaf weeds 1
Prior to jointing stage BBCH 30 (fall seeded) or 5 leaf stage BBCH 15 (spring seeded).
NA
Rye Annual and perennial broadleaf weeds
1 2-3 leaf stage BBCH 12-13. NA

Dicamba 1019
Crop Pests or group of pests controlled
Applications max. no.
Growth stage (BBCH) of crop when treated
Interval between applications [days]
Triticale Annual and perennial broadleaf weeds 1
Prior to jointing stage BBCH 30 (fall seeded) or 6 leaf stage BBCH 16 (spring seeded).
NA
Popcorn
Annual and perennial broadleaf weeds
1
Pre-plant BBCH 00, pre-emergence, early post-emergence BBCH 09-15 (between emergence and 5 leaf stage) or late post-emergence (8-36” tall or 15 days before tassel emergence BBCH 15-35/39).
NA
GS Grasses for sugar or syrup production
Sugar cane Annual and perennial broadleaf weeds.
1 After emergence but before close-in stage, BBCH 09-49.
NA
SO Oilseeds
Cotton Annual and perennial broadleaf weeds
1 21 days pre-plant, BBCH 00. NA
Authorized uses for crops in countries relevant to the present evaluation are summarised in Table 72.
Table 72 Registered uses of dicamba
Crop Country Formulation (g/kg or g/L and type)
F/G/P a
ApplicationPHI (days) Method
No. per crop season
kg ai/hL b max.
Water L/ha per appl. min - max.
kg ai/ha per applic. b min. - max.
VO Fruiting vegetables, other than cucurbit
Sweet Corn USA 500 WG* 400 WG*
F Spray 1 0.5 28-437 0.14 72
Sweet Corn Canada 110 SL* F Spray 1 0.11 200-350 0.09-1.21 NA
VD Pulses
Soya bean (dry)
USA 480 SL 700 WG 500 WG*
F Spray
1 (pre-plant)
0.14-0.56 NA
1 (pre-harvest)
0.28-2.24 14
(2.24/season)
VS Stem and stalk vegetables
Asparagus USA 480 SL 700 WG
F Spray 1 2.1 28–467 0.14–0.59 1
GC Cereal grains
Barley USA 480 SL 240 SL 700 WG
F Spray 2 1 28-467 0.07-0.28 (0.43/season)
7
Barley Canada
84 SL* 480 SL 700 WG 110 SL*
F Spray 1 0.15 110 0.10-0.16 60
Corn/Maize USA
480 SL 240 SL 700 WG 132 SC* 500 WG* 424 WG* 400 WG*
F Spray 2 2 28-467 0.56 (0.84/season)
60

1020 Dicamba
Crop Country Formulation (g/kg or g/L and type)
F/G/P a
Application PHI (days) Method
No. per crop season
kg ai/hL b max.
Water L/ha per appl. min - max.
kg ai/ha per applic. b min. - max.
Corn/Maize Canada
480 SL 700 WG 132 SC* 500 WG* 110 SL*
F Spray 1 0.54 110-350 0.09-0.594 30
Sorghum USA
480 SL 700 WG 120 SL* 132 SC*
F Spray 2 1.1 28-467 0.30 (0.59/season)
30
Wheat USA
480 SL 240 SL 700 WG 120 SL* 500 WG*
F Spray 2 1 28-467 0.07-0.28 (0.56/season)
7
Wheat Canada
480 SL 700 WG 84 SL* 110 SL* 62.5 SL*
F Spray 1 0.14 100-110 0.053-0.14 60
Millet USA 480 SL 700 WG
F Spray 1 0.5 28-467 0.14 NA
Oat USA 480 SL 700 WG
F Spray 1 0.5 28-467 0.07-0.14 NA
Oat Canada
480 SL 700 WG 84 SL* 625 WG*
F Spray 1 0.14 100-110 0.079-0.14 60
Rye Canada 480 SL 700 WG
F Spray 1 0.13 110 0.11-0.14 NA
Triticale USA 480 SL 700 WG
F Spray 1 0.5 28-467 0.07-0.14 NA
Popcorn USA
480 SL 240 SL 700 WG 424 WG*
F Spray 2 3 28-467 0.56-0.84 60
GS Grasses for sugar or syrup production
Sugar cane USA
480 SL 240 SL 700 WG 120 SL*
F Spray 1 8 28-467 2.24 NA
SO Oilseeds
Cotton USA
480 SL 240 SL 700 WG 500 WG*
F Spray 1 1 28-467 0.28 NA
AS Straws and fodders, dry
Grasses (hay)
USA 480 SL 240 SL 70 WG
F Spray 1 0.56 37
Grasses (forage)
USA 480 SL 240 SL 70 WG
F Spray 1 0.56 7
a F = outdoor or field use, G = glasshouse, P = protected, I = indoor application b Information given on active substance (as) refers to dicamba only
NA = not applicable

Dicamba 1021
RESIDUES RESULTING FROM SUPERVISED TRIALS ON CROPS
The Meeting received information on supervised field trials of dicamba on the following crops conducted in the USA:
Crop group Commodity Table No.
Fruiting vegetables Sweet corn, USA Table 73
Pulses Soya bean, USA Table 74
Stalk and stem vegetable Asparagus, USA Table 75
Cereal grains Barley, USA Table 76
Maize (field corn), USA Table 77
Sorghum, USA Table 78
Wheat, USA Table 79
Grasses for sugar and syrup production
Sugarcane, USA Table 80
Oilseeds Cotton seed, USA Table 81
Animal feed stuffs Soya bean hay Table 82
Straw of barley Table 83
Straw of wheat Table 84
Forage and fodder of maize including forage and fodder from sweet corn
Table 85
Fodder of sorghum Table 86
Cotton gin trash Table 87
Grasses Table 88
Trials were generally well documented with full laboratory and field reports. Laboratory reports included the dates of spray applications, methods used and sampling dates, method validation, with procedural recovery data. Dates of analyses or duration of residue sample storage were also provided. In general, data on procedural recoveries were within the acceptable range 70–120%, with % relative standard deviation of < 20%.
All trials were conducted outdoor. Application rates were reported as dicamba acid equivalents. Residue concentrations were reported for dicamba and 5-OH dicamba and, if relevant, for DCSA. Residue concentrations are recorded unadjusted for recoveries or for residue values in control samples. Where trials were conducted in the same location, with the same varieties, similar formulations or different salt types, and at the same or similar timing, they are not regarded as independent and the highest residues from these trials was recorded. Although trials included control plots, no control data are recorded in the tables below unless residues in control samples significantly exceeded the LOQ.
Total residues were calculated by summing up the concentrations of dicamba and 5-OH dicamba, and, where relevant, DCSA. In the trials, residues found to be below the limit of quantitation (LOQ) were reported as < LOQ.
Residues from the trials conducted according to maximum GAP have been used for the estimation of maximum residue levels and they are underlined.

1022 Dicamba
Abbreviations contained in the tables are indicated in the legend below in order to avoid repetitions in each table.
Fruiting Vegetables, Other Than Cucurbits
Sweet corn
The registered use of dicamba in sweet corn is as an early post-emergence application of 0.14 kg ai/ha when the corn is 10–60 cm tall with a PHI of 72 days. The parent, dicamba, and one metabolite, 5-OH dicamba, are deemed relevant to sweet corn and therefore analysed.
A total of nine supervised field residue trials were conducted during the 1996 growing season to determine residue levels of dicamba and 5-OH dicamba in the raw agricultural commodity. Two treatments were applied side-by-side consisting of two applications of 0.14 kg ai/ha (total 0.28 kg ai/ha; 50% WG) and two applications of 0.28 kg ai/ha (total 0.56 kg ai/ha; 480 g/L SL). The timings for the sequential applications were early post-emergence (30 cm tall corn plant) and mid post-emergence (60 cm tall corn plant). These applications were the originally proposed GAPs for sweet corn, which were later reduced to 0.14 kg ai/ha.
Each formulation was applied at the indicated rates according to the methods and conditions representing U.S. sweet corn production. The states selected (Wisconsin, Minnesota, Indiana, Oregon, California, Washington, Georgia, Florida and New York) for these trials represent the major sweet corn production areas in the United States
In all trials, samples of sweet corn ears were collected at normal harvest. The samples were quickly frozen and shipped frozen to the laboratory for analysis. Samples were kept frozen until homogenization and analysis.
Control and treated samples of sweet corn ears from each site were analysed for dicamba and
5-OH dicamba according to analytical method AM-0691B-0593-3. This method measures the parent compound and 5-OH dicamba using GC/ECD. Residues of dicamba + 5-OH dicamba are reported as total dicamba residues. Generally, recoveries between 70% and 120% were obtained for dicamba and 5-OH dicamba from laboratory fortified control samples.
Table 73 Residues of dicamba and 5-OH dicamba from supervised trials on sweet corn in the USA
Crop Country, Year Location (variety) Trial No.
Application
PHI(d)
Portion analysed
Residues (mg/kg) Author Report Year Study No. DocID.
Formulation Method Rate (kg ai/ha)
Growth stage (BBCH)
No. Dicamba5-OH dicamba
Total*
GAP in USA 500 WG Spray 0.14 1 72 Sweet corn 500 WG Foliar 0.14 12“ + 24“ 2 50 Ear < 0.02 < 0.02 < 0.04 Abdel-Baky, S.USA, 1996 240 SL 0.28 12“ + 24“ 2 < 0.02 < 0.02 < 0.04 1998 Wisconsin 97152 (Northrup King, NK199)
1998/5077
608-01 Sweet corn 500 WG Foliar 0.14 12“ + 24“ 2 49 Ear < 0.02 < 0.02 < 0.04 Abdel-Baky, S.USA, 1996 240 SL 0.28 12“ + 24“ 2 < 0.02 < 0.02 < 0.04 1998 Minnesota 97152 (Temptation, VNT583LF)
1998/5077
613-03 Sweet corn 500 WG Foliar 0.14 12“ + 24“ 2 52 Ear < 0.02 < 0.02 < 0.04 Abdel-Baky, S.USA, 1996 240 SL 0.28 12“ + 24“ 2 < 0.02 < 0.02 < 0.04 1998 Indiana 97152 (Hybrid Bi Queen, NC4202MR)
ko
1998/5077
615-01 Sweet corn 500 WG Foliar 0.14 12“ + 24“ 2 61 Ear < 0.02 < 0.02 < 0.04 Abdel-Baky, S.
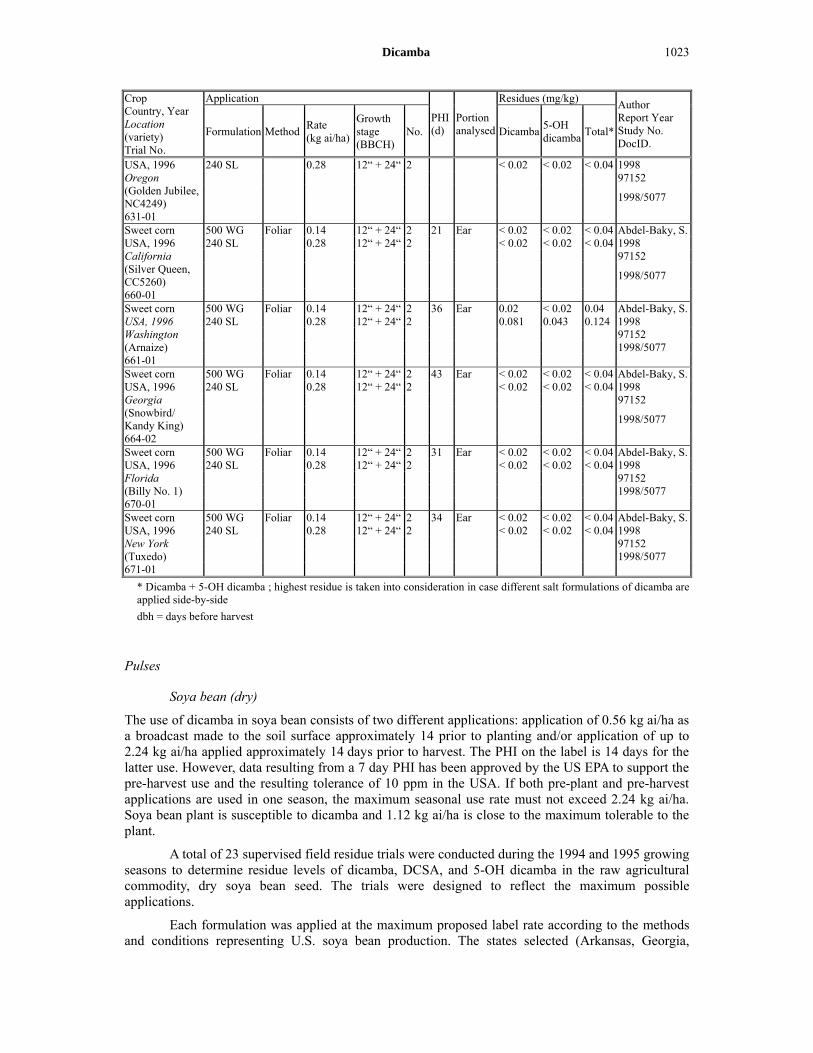
Dicamba 1023
Crop Country, Year Location (variety) Trial No.
Application
PHI(d)
Portion analysed
Residues (mg/kg) Author Report Year Study No. DocID.
Formulation Method Rate (kg ai/ha)
Growth stage (BBCH)
No. Dicamba5-OH dicamba
Total*
USA, 1996 240 SL 0.28 12“ + 24“ 2 < 0.02 < 0.02 < 0.04 1998 Oregon 97152 (Golden Jubilee, NC4249)
1998/5077
631-01 Sweet corn 500 WG Foliar 0.14 12“ + 24“ 2 21 Ear < 0.02 < 0.02 < 0.04 Abdel-Baky, S.USA, 1996 240 SL 0.28 12“ + 24“ 2 < 0.02 < 0.02 < 0.04 1998 California 97152 (Silver Queen, CC5260)
1998/5077
660-01 Sweet corn 500 WG Foliar 0.14 12“ + 24“ 2 36 Ear 0.02 < 0.02 0.04 Abdel-Baky, S.USA, 1996 240 SL 0.28 12“ + 24“ 2 0.081 0.043 0.124 1998 Washington 97152 (Arnaize) 1998/5077 661-01 Sweet corn 500 WG Foliar 0.14 12“ + 24“ 2 43 Ear < 0.02 < 0.02 < 0.04 Abdel-Baky, S.USA, 1996 240 SL 0.28 12“ + 24“ 2 < 0.02 < 0.02 < 0.04 1998 Georgia 97152 (Snowbird/ Kandy King)
1998/5077
664-02 Sweet corn 500 WG Foliar 0.14 12“ + 24“ 2 31 Ear < 0.02 < 0.02 < 0.04 Abdel-Baky, S.USA, 1996 240 SL 0.28 12“ + 24“ 2 < 0.02 < 0.02 < 0.04 1998 Florida 97152 (Billy No. 1) 1998/5077 670-01 Sweet corn 500 WG Foliar 0.14 12“ + 24“ 2 34 Ear < 0.02 < 0.02 < 0.04 Abdel-Baky, S.USA, 1996 240 SL 0.28 12“ + 24“ 2 < 0.02 < 0.02 < 0.04 1998 New York 97152 (Tuxedo) 1998/5077 671-01
* Dicamba + 5-OH dicamba ; highest residue is taken into consideration in case different salt formulations of dicamba are applied side-by-side
dbh = days before harvest
Pulses
Soya bean (dry)
The use of dicamba in soya bean consists of two different applications: application of 0.56 kg ai/ha as a broadcast made to the soil surface approximately 14 prior to planting and/or application of up to 2.24 kg ai/ha applied approximately 14 days prior to harvest. The PHI on the label is 14 days for the latter use. However, data resulting from a 7 day PHI has been approved by the US EPA to support the pre-harvest use and the resulting tolerance of 10 ppm in the USA. If both pre-plant and pre-harvest applications are used in one season, the maximum seasonal use rate must not exceed 2.24 kg ai/ha. Soya bean plant is susceptible to dicamba and 1.12 kg ai/ha is close to the maximum tolerable to the plant.
A total of 23 supervised field residue trials were conducted during the 1994 and 1995 growing seasons to determine residue levels of dicamba, DCSA, and 5-OH dicamba in the raw agricultural commodity, dry soya bean seed. The trials were designed to reflect the maximum possible applications.
Each formulation was applied at the maximum proposed label rate according to the methods and conditions representing U.S. soya bean production. The states selected (Arkansas, Georgia,

1024 Dicamba
Illinois, Indiana, Iowa, Louisiana, Minnesota, Mississippi, Missouri, Nebraska, North Carolina, Ohio, and Tennessee) for these trials represent the major soya bean production areas in the United States.
In all trials, soya bean seed samples were collected at mature harvest stage. The samples were quickly frozen and shipped frozen to laboratory. Samples were kept frozen until homogenization and analysis.
Soya bean seed samples were analysed for dicamba, DCSA, and 5-OH dicamba according to analytical method AM-0941-1094-0. This method quantifies residues of dicamba, DCSA, and 5-OH dicamba using GC/ECD. Residues of dicamba + 5-OH dicamba are reported as total dicamba residues.
For trials conducted in 1994, the mean dicamba recovery in dry soya bean seed was 90% ± 13% (n = 22) for all fortification levels (0.01 mg/kg and 0.1 mg/kg). The mean DCSA recovery in dry soya bean seed was 86% ± 12% (n = 22) for all fortification levels (0.02 mg/kg and 0.1 mg/kg). The mean 5-OH dicamba recovery in dry soya bean seed was 79% ± 13% (n = 22) for all fortification levels (0.02 mg/kg and 0.1 mg/kg).
For trials conducted in 1995, the mean dicamba recovery was 103 ± 12% (N = 10), the mean DCSA recovery was 96 ± 14% (n = 9), and the mean 5-OH dicamba recovery was 94 ± 12% (n = 9).
Initially, 17 supervised field residue trials were conducted during the 1994 growing season. Twelve trials (one trial in each of the following states: Arkansas, Georgia, Illinois, Indiana, Iowa, Louisiana, Minnesota, Mississippi, Missouri, Nebraska, Ohio, and Tennessee) were conducted using the DMA+ salt of dicamba formulation. In four of the 17 trials (Iowa, Illinois, Indiana, and Minnesota), three dicamba salt formulations (the dimethylamine salt (DMA+), the diglycolamine salt (DGA+), and the sodium salt (Na+) salt of dicamba) were applied side by side to separate plots.
Statistical analysis of the data from the four trial location (Illinois, Indiana, Iowa, and Minnesota) where the side by side trials with DMA+, DGA+, and Na+ salt formulations were conducted showed that the magnitude of the total residue was not influenced by the differences in formulation and therefore only the highest residues were included in the Table.
Six additional supervised field residue trials (using the DMA+ salt of dicamba formulation) were conducted during the 1995 growing season to provide dicamba, DSCA, and 5-OH dicamba residue data in dry soya bean seed samples when dicamba was applied at the maximum proposed label rate use rate before planting and before harvesting dry soya bean seed. At the same time two decline studies were also conducted.
Of the six trials, one trial was conducted in Iowa, one in Illinois, one in Missouri, and one in North Carolina. The two decline studies were conducted in Illinois and Indiana.
Table 74 Residues of dicamba, 5-OH dicamba and DCSA from supervised trials on soya bean in the USA
CROP Country, Year Location (variety) Trial No.
Application
PHI(d)
Portion analysed
Residues (mg/kg) Author Report Year Study No. DocID.
Formulation Method Rate (kg ai/ha)
Growthstage (BBCH)
No. Dicamba5-OH dicamba
DCSA Total*
US GAP 480 SL 700 WG 500 WG*
Spray
0.56 +/or 2.24 (max 2.24/ season)
Pre-plant 1 Na
14 dbh 1 14
Soya bean 480SL
foliar 0.560 pre-plant 2 7 seed 1.00 < 0.01 0.01 1.01 Jimenez, N.C.
USA, 1994 14 dbp 1995 Nebraska + #133 (Jacques 333) 2.240 7dbh 1995/5298 608-01

Dicamba 1025
CROP Country, Year Location (variety) Trial No.
Application
PHI(d)
Portion analysed
Residues (mg/kg)Author Report Year Study No. DocID.
Formulation Method Rate (kg ai/ha)
Growthstage (BBCH)
No. Dicamba5-OH dicamba
DCSA Total*
Soya bean 480SL
foliar 0.560 pre-plant 2 7 seed 1.43 < 0.01 < 0.01 1.44 Jimenez, N.C.
USA, 1994 14 dbp 1995 Iowa + #133 (Payco 8818) 2.240 7dbh 1995/5298 611-01
Soya bean 480SL
foliar 0.560 pre-plant 2 7 seed 0.48 < 0.01 0.04 0.49 Jimenez, N.C.
USA, 1994 480SL 14 dbp 1995 Minnesota 240SL + #133 (Pioneer 9006) 2.240 7dbh 1995/5298 613-01
Soya bean 480SL
foliar 0.560 pre-plant 2 7 seed 0.27 < 0.01 < 0.01 0.28 Jimenez, N.C.
USA, 1994 14 dbp 1995 Minnesota + #133 (Pioneer 9006) 2.240 7dbh 1995/5298 613-02
Soya bean 480SL
foliar 0.560 pre-plant 2 7 seed 0.81 < 0.01 < 0.01 0.81 Jimenez, N.C.
USA, 1994 480SL 14 dbp 1995 Indiana 240SL + #133 (Pioneer 9392) 2.240 7dbh 1995/5298 615-01
Soya bean 480SL
foliar 0.560 pre-plant 2 7 seed 1.90 0.05 0.01 1.95 Jimenez, N.C.
USA, 1994 14 dbp 1995 Indiana + #133 (Pioneer 9392) 2.240 7dbh 1995/5298 615-02
Soya bean 480SL
foliar 0.560 pre-plant 2 7 seed 0.70 < 0.01 < 0.01 0.71 Jimenez, N.C.
USA, 1994 14 dbp 1995 Mississippi + #133 (Northrup King 5960)
2.240 7dbh
1995/5298
618-01
Soya bean 480SL
foliar 0.560 pre-plant 2 7 seed 0.10 < 0.01 < 0.01 0.11 Jimenez, N.C.
USA, 1994 14 dbp 1995 Tennessee + #133 (Holiday) 2.240 7dbh 1995/5298 621-01
Soya bean 480SL
foliar 0.560 pre-plant 2 7 seed 0.46 0.05 0.05 0.51 Jimenez, N.C.
USA, 1994 480SL 14 dbp 1995 Illinois 240SL + #133 (Callahan 3377N)
2.240 7dbh
1995/5298
624-01
Soya bean 480SL
foliar 0.560 pre-plant 2 7 seed 3.30 0.32 0.12 3.62 Jimenez, N.C.
USA, 1994 14 dbp 1995 Illinois + #133 (Asgrow) 2.240 7dbh 1995/5298 624-02
Soya bean 480SL
foliar 0.560 pre-plant 2 7 seed 0.68 < 0.01 < 0.01 0.69 Jimenez, N.C.
USA, 1994 14 dbp 1995 Georgia + #133 (Bryan) 2.240 7dbh 1995/5298

1026 Dicamba
CROP Country, Year Location (variety) Trial No.
Application
PHI(d)
Portion analysed
Residues (mg/kg)Author Report Year Study No. DocID.
Formulation Method Rate (kg ai/ha)
Growthstage (BBCH)
No. Dicamba5-OH dicamba
DCSA Total*
664-01
Soya bean 480SL
foliar 0.560 pre-plant 2 7 seed 0.55 < 0.01 0.01 0.56 Jimenez, N.C.
USA, 1994 14 dbp 1995 Arkansas + #133 (Hartz 517) 2.240 7dbh 1995/5298 665-01
Soya bean 480SL
foliar 0.560 pre-plant 2 7 seed 0.65 0.02 0.01 0.67 Jimenez, N.C.
USA, 1994 14 dbp 1995 Ohio + #133 (Madison GL3630)
2.240 7dbh
1995/5298
667-01
Soya bean 480SL
foliar 0.560 pre-plant 2 7 seed 1.30 < 0.01 0.02 1.31 Jimenez, N.C.
USA, 1994 14 dbp 1995 Missouri + #133 (Williams 82) 2.240 7dbh 1995/5298 668-01
Soya bean 480SL
foliar 0.560 pre-plant 2 7 seed 0.28 < 0.01 < 0.01 0.29 Jimenez, N.C.
USA, 1994 14 dbp 1995 Missouri + #133 (Pioneer 9381-) 2.240 7dbh 1995/5298 668-02
Soya bean 480SL
foliar 0.560 pre-plant 2 7 seed 1.40 0.27 0.07 1.67 Jimenez, N.C.
USA, 1994 480SL 14 dbp 1995 Iowa 240SL + #133 (L2771) 2.240 7dbh 1995/5298 669-01
Soya bean 480SL
foliar 0.560 pre-plant 2 7 seed 0.17 < 0.01 < 0.01 0.18 Jimenez, N.C.
USA, 1994 14 dbp 1995 Louisiana + #133 (Hartz 5164) 2.240 7dbh 1995/5298672-01
Soya bean 480SL
foliar 0.560 pre-plant 2 7 seed 2.10 < 0.01 0.02 2.11 Guirguis, M.J.
USA, 1995 14 dbp 1996 North Carolina + #147 (Hutcheson) 2.240 7dbh 1996/5312 01-612-01
Soya bean 480SL
foliar 0.560 pre-plant 2 7 seed 0.07 < 0.01 < 0.01 0.08 Guirguis, M.J.
USA, 1995 14 dbp 1996 Illinois + #147 (Asgrow 3237) 2.240 7dbh 1996/5312 01-624-01
Soya bean 480SL
foliar 0.560 pre-plant 2 7 seed 0.08 < 0.01 < 0.01 0.09 Guirguis, M.J.
USA, 1995 14 dbp 1996 Missouri + #147 (Pioneer 9362) 2.240 7dbh 1996/5312 01-668-01
Soya bean 480SL
foliar 0.560 pre-plant 2 7 seed 0.14 < 0.01 < 0.01 0.15 Guirguis, M.J.
USA, 1995 14 dbp 1996 Iowa + #147 (Kennedy IV) 2.240 7dbh 1996/5312

Dicamba 1027
CROP Country, Year Location (variety) Trial No.
Application
PHI(d)
Portion analysed
Residues (mg/kg)Author Report Year Study No. DocID.
Formulation Method Rate (kg ai/ha)
Growthstage (BBCH)
No. Dicamba5-OH dicamba
DCSA Total*
01-669-01
Soya bean 480SL
foliar 0.560 pre-plant 2 3 seed 0.43 < 0.01 0.01 0.45 Guirguis, M.J.
USA, 1995 14 dbp 5 0.06 < 0.01 < 0.01 0.08 1996 Indiana + 7 0.05 < 0.01 < 0.01 0.07 #147 (Pioneer 9301) 2.240 7dbh 9 0.07 < 0.01 < 0.01 0.09 1996/5312 02-615-01 11 0.02 < 0.01 < 0.01 0.04
Soya bean 480SL
foliar 0.560 pre-plant 2 3 seed 7.6 < 0.01 0.027 7.61 Guirguis, M.J.
USA, 1995 14 dbp 5 5.1 < 0.01 0.020 5.11 1996 Illinois + 7 8.1 < 0.01 0.028 8.11 #147 (Pioneer 9362) 2.240 7dbh 9 1.1 < 0.01 < 0.01 1.12 1996/5312 02-624-01 11 0.39 < 0.01 < 0.01 0.40
Dicamba + 5-OH dicamba; highest residue is taken into consideration in case different salt formulations of dicamba are applied side-by-side
dbp = days before planting
dbh = days before harvest
Stalk and stem vegetables
Asparagus
The use of dicamba in asparagus consists of one application of 0.56 kg ai/ha (0.56 kg ai/ha total maximum seasonal application) applied one day prior to harvest. The PHI is one day. Residues measured in asparagus spears (whole, green, above ground portion) include parent dicamba, 5-OH dicamba and DCSA.
A total of eight supervised field residue trials were conducted during the 1993 and 1994 growing seasons to determine residue levels of dicamba and its two metabolites, DCSA and 5-OH dicamba in the raw agricultural commodity, asparagus. The formulations used at each site were the dimethylamine salt (DMA+), the diglycolamine salt (DGA+), and the sodium salt (Na+) of dicamba. Each formulation was applied at the maximum proposed label rate according to the methods and conditions representing U.S. asparagus production. The states selected (California, Michigan, and Washington) for these trials represent the major asparagus production areas in the United States.
In all trials, samples of fresh asparagus spears were collected 24 hours (1 day) after application. The samples were quickly frozen and shipped frozen to the laboratory. Samples were kept frozen until homogenization and analysis.
Control and treated samples of asparagus spears from each site were analysed for dicamba and its two metabolites according to current validated analytical methods (methods AM-0691B-0893 and AM-766A (for the 1993 samples) and AM-0691B-0593-3 and AM-0766A-1093-2 (for the 1994 samples)). These methods measure the parent compound and its metabolites using GC/ECD. Confirmation of low level dicamba and its metabolite residues was performed by GC/MSA for selected samples from the 1994 field residue trials.
For trials conducted in 1993 season, the mean dicamba recovery was 81% (n = 5) for all fortification levels (0.01 mg/kg to 0.5 mg/kg. The same DCSA fortifications yielded a mean recovery of 86% (n = 5). Fortifications of 0.01 mg/kg and 0.10 mg/kg resulted in an 80% average 5-OH dicamba recovery (n = 2).
For trials conducted in 1994 season, the mean dicamba recovery was 97% (n = 10) for all fortification levels (0.01 mg/kg to 3 mg/kg). The mean DCSA recovery was 85% (n = 8) for all fortification levels (0.02 mg/kg to 0.1 mg/kg) for GC/ECD method and 113% (N = 10) for GC/MSD

1028 Dicamba
method for all fortification levels (0.01 mg/kg to 0.1 mg/kg). The mean 5-OH dicamba recovery was 91% (n = 12) for all fortification levels (0.01 mg/kg to 0.1 mg/kg).
Initially, two field residue trials were conducted during the 1993 growing season: one in California and the other in Washington. No significant differences in the concentration of dicamba residues were noted between the two field sites or between the three dicamba salt formulations.
Six additional field residue trials were conducted during the 1994 growing season: two in California, two in Michigan, and two in Washington. In these six trials, as with 1993 trials, levels of residue were not dependent on the dicamba formulation (Na+, DMA+, or DGA+).
Table 75 Residues of dicamba and 5-OH dicamba from supervised trials on Asparagus in the USA
CROP Country, Year Location (variety) Trial No.
Application
PHI(d)
Portion analysed
Residues (mg/kg) Author Report Year Study No. DocID.
Formulation Method Rate (kg ai/ha)
Growthstage (BBCH)
No. Dicamba5-OH dicamba
DCSA Total*
US GAP 480 SL 240 SL
Spray 0.14-0.59
1 1
Asparagus 480 SL a foliar 0.56 early 1 1 spears 0.45 0.01 0.01 0.46 Clouser, A.R.USA, 1994 480 SL a emerg. 1994 California 240 SL after #124 (UC157) cutting 1994/5217 CA 660-01 Asparagus 480 SL foliar 0.56 early 1 1 spears 0.78 0.01 0.07 0.79 Clouser, A.R.USA, 1994 480 SL emerg. 1994 Washington 240 SL after #124 (Mary Washington)
cutting
1994/5217
WA 661-01 Asparagus 480 SL foliar 0.56 early 1 1 spears 0.58 < 0.01 < 0.01 0.59 Clouser, A.R.USA, 1994 480 SL emerg. 1994 California 240 SL after #131 (UC 157-F1) cutting 1994/5314 CA 660-01 Asparagus 480 SL foliar 0.56 early 1 1 spears 0.49 < 0.01 < 0.01 0.50 Clouser, A.R.USA, 1994 480 SL emerg. 1994 California 240 SL after #131 (UC 157-F1) cutting 1994/5314 CA 660-02 Asparagus 480 SL foliar 0.56 early 1 1 spears 1.09 < 0.01 0.01 1.11 Clouser, A.R.USA, 1994 480 SL emerg. 1994 Washington 240 SL after #131 (Mary Washington)
cutting
1994/5314
WA 661-01 Asparagus 480 SL foliar 0.56 early 1 1 spears 0.96 < 0.01 < 0.01 0.97 Clouser, A.R.USA, 1994 480 SL emerg. 1994 Washington 240 SL after #131 (Mary Washington)
cutting
1994/5314
WA 661-02 Asparagus 480 SL foliar 0.56 early 1 1 spears 2.33 0.01 0.03 2.34 Clouser, A.R.USA, 1994 480 SL emerg. 1994 Michigan 240 SL after #131 (KB3) cutting 1994/5314 MI 662-01 Asparagus 480 SL foliar 0.56 early 1 1 spears 3.27 0.01 0.02 3.28 Clouser, A.R.USA, 1994 480 SL emerg. 1994 Michigan 240 SL after #131 (Jersey Giant) cutting 1994/5314 MI 662-02
* Dicamba + 5-OH dicamba; highest residue is taken into consideration a Different formulations.

Dicamba 1029
Cereal grains
Barley
The use of dicamba in barley consists of two applications: one application of 0.14 kg ai/ha immediately prior to the first joint stage and one application of 0.28 kg ai/ha applied approximately 7 days prior to harvest. The PHI is 7 days.
A total of 11 supervised field residue trials were conducted during the 1995 growing seasons to determine residue levels of dicamba and 5-OH dicamba in the raw agricultural commodity, barley grain. The dimethylamine salt (DMA+) of dicamba was applied in five (5) trial locations. Side by side trials with three formulations (the dimethylamine salt (DMA+), the diglycolamine salt (DGA+), and the sodium salt (Na+) of dicamba) were conducted at four locations to determine the similarity of residues from the different salts. In addition, two trials with decline sampling intervals using the DMA+ salt formulation were also conducted.
Each formulation was applied at the maximum proposed label rate according to the methods and conditions representing U.S. barley production. The states selected (California, Idaho, Oregon, Minnesota, Montana, North Dakota, Pennsylvania, South Dakota, and Utah) for these trials represent the major barley production areas in the United States
In all trials, samples of barley grain were collected at normal harvest, approximately 7 days after the last application. The samples were quickly frozen and shipped frozen to laboratory for analysis. Samples were kept frozen until homogenization and analysis.
Control and treated samples of barley grain from each site were analysed for dicamba and
5-OH dicamba according to analytical method AM-0691B-0593-3. This method measures the parent compound and 5-OH dicamba using GC/ECD. Residues of dicamba + 5-OH dicamba are reported as total dicamba residues. The mean dicamba recovery was 91% ± 19% (n = 20) for all fortification levels. The mean 5-OH dicamba recovery was 94% ± 17% (n = 20) for all fortification levels.
The statistical analysis was performed on the four 4 trial locations (Idaho, Minnesota, Montana, and North Dakota) where the side by side comparisons were conducted. The result showed that the magnitude of the residues found was not influenced by the difference in the dicamba salt formulations applied and therefore the result with the highest residue was included in the Table.
The results of the two residue decline studies indicate that maximum total residues occur at 7 days after pre-harvest treatment (1.112 mg/kg in ND and 7.503 mg/kg in SD), declining quickly by 11 days after treatment (0.504 mg/kg in ND and 0.297 mg/kg in SD).
Table 76 Residues of dicamba and 5-OH dicamba from supervised trials on barley in the USA
CROP Country, Year Location (variety) Trial No.
Application
PHI(d)
Portion analysed
Residues (mg/kg) Author Report Year Study No. DocID.
Formulation Method Rate (kg ai/ha]
Growth stage (BBCH)
No. Dicamba5-OH dicamba
Total*
US GAP 480 SL 240 SL 700 WG
spray 0.07-0.28 (0.43/season)
2 7
barley 240SL foliar 0.14 + first 2 7 grain 1.49 0.15 1.65 Jiminez, N. CUSA, 1995 0.28 jointing 1996 California and 146 (Fiesta) 7 dbh 1996/5314 106/95/01-660-01
barley 240SL foliar 0.14 + first 2 7 grain 1.05 0.06 1.11 Jiminez, N. CUSA, 1995 0.28 jointing 1996 Oregon and 146

1030 Dicamba
CROP Country, Year Location (variety) Trial No.
Application
PHI(d)
Portion analysed
Residues (mg/kg) Author Report Year Study No. DocID.
Formulation Method Rate (kg ai/ha]
Growth stage (BBCH)
No. Dicamba5-OH dicamba
Total*
(Steptoe) 7 dbh 1996/5314 106/95/01-631-02
barley 240SL foliar 0.14 + first 2 5 grain 0.78 0.05 0.83 Jiminez, N. CUSA, 1995 0.28 jointing 1996 Pennsylvania and 146 (Ontario) 7 dbh 1996/5314 106/95/01-671-01
barley 240SL foliar 0.14 + first 2 14 grain 0.92 0.01 0.93 Jiminez, N. CUSA, 1995 0.28 jointing 1996 South Dakota and 146 (Stander) 7 dbh 1996/5314106/95/01-611-01
barley 240SL foliar 0.14 + first 2 7 grain 1.63 0.03 1.67 Jiminez, N. CUSA, 1995 0.28 jointing 1996 South Dakota and 146 (Stander) 7 dbh 1996/5314 106/95/01-611-02
barley 240SL foliar 0.14 + first 2 7 grain 1.82 0.05 1.87 Jiminez, N. CUSA, 1995 0.28 jointing 1996 Utah and 146 (Russell) 7 dbh 1996/5314 106/95/01-631-01
barley 240SL foliar 0.14 + first 2 7 grain 2.70 0.11 2.81 Jiminez, N. CUSA, 1995 480SL 0.28 jointing 1996 Idaho 240SL and 146 (Colter) 7 dbh 1996/5314 106/95/01-631-03
barley 240SL foliar 0.14 + first 2 7 grain 1.63 0.03 1.67 Jiminez, N. CUSA, 1995 480SL 0.28 jointing 1996 Minnesota 240SL and 146 (Stander) 7 dbh 1996/5314 106/95/01-611-02
barley 240SL foliar 0.14 + first 2 9 grain 5.04 0.02 5.06 Jiminez, N. CUSA, 1995 480SL 0.28 jointing 1996 Montana 240SL and 146 (Piroline) 7 dbh 1996/5314 106/95/01-661-01
barley 240SL foliar 0.14 + first 2 7 grain 2.80 0.06 2.86 Jiminez, N. CUSA, 1995 480SL 0.28 jointing 1996 North Dakota 240SL and 146 (Robust) 7 dbh 1996/5314 106/95/01-611-03
barley 240SL foliar 0.14 + first 2 7 grain 1.05 0.08 1.12 Jiminez, N. CUSA, 1995 0.28 jointing 1996 North Dakota and 146 (Stander) 7 dbh 1996/5314 106/95/01-611-01
* Dicamba + 5-OH dicamba + DCSA; highest residue is taken into consideration in case different salt formulations of dicamba are applied side-by-side

Dicamba 1031
dbh = days before harvest
Maize (field corn)
The use of dicamba in maize (field corn) consists of one to two applications per season, for a maximum seasonal application of 0.84 kg ai/ha. The normal use pattern consists of one application of 0.56 kg ai/ha applied pre-plant, pre-emergence or early post-emergence (up to the 5 leaf stage) and, if required, one application of 0.28 kg ai/ha applied late post-emergence (20–90 cm tall or 15 days before tassel emergence).
A total of 19 supervised field residue trials were conducted during the 1995 growing season to determine residue levels of dicamba and 5-OH dicamba in the raw agricultural commodity, field corn grain. The dimethylamine salt (DMA+) of dicamba was applied in eleven (11) trial locations. Side by side trials with three 3 formulations (the dimethylamine salt (DMA+), the diglycolamine salt (DGA+), and the sodium salt (Na+) of dicamba) were conducted at eight 8 locations to determine the similarity of residues from the different salts.
The supervised residue field trials represent the spring application specifically registered for corn, but also the potential use on fallow agricultural soils the previous fall at 2.24 kg ai/ha, resulting in a total application of 3.08 kg ai/ha. Each formulation was applied at the maximum proposed label rate according to the methods and conditions representing U.S. field corn production. The states selected (Illinois, Indiana, Iowa, Kansas, Kentucky, Michigan, Minnesota, Missouri, Nebraska, North Carolina, Ohio, Oklahoma, Pennsylvania, South Dakota, and Wisconsin) for these trials represent the major field corn production areas in the United States.
In all trials, samples of field corn grain were collected at normal harvest. The samples were quickly frozen and shipped frozen to laboratory for analysis. Samples were kept frozen until homogenization and analysis.
Control and treated samples of field grain from each site were analysed for dicamba and 5-OH dicamba according to analytical method AM-0691B-0593-3. This method measures the parent compound and the 5-OH dicamba using GC/ECD. Residues of dicamba + 5-OH dicamba are reported as total dicamba residues.
The mean dicamba recovery was 102% ± 20% (n = 15) for all fortification levels (from 0.01 mg /kg to 1.0 mg/kg]. The mean 5-OH dicamba recovery was 102% ± 17% (n = 15) for all fortification levels (from 0.01 mg/kg to 1.0 mg/kg).
The statistical analysis was performed on the eight 8 trial locations (Illinois, Indiana, Iowa, Minnesota, Missouri, Nebraska, North Carolina, and Oklahoma) where the side by side comparisons were conducted. The results showed that the magnitude of the residues found was not influenced by the difference in the dicamba salt formulations applied and therefore only the highest residues were included in the Table.
Table 77 Residues of dicamba and 5-OH dicamba from supervised trials on maize (field corn) in the USA
CROP Country, Year Location (variety) Trial No.
Application
PHI(d)
Portion analysed
Residues (mg/kg) Author Report Year Study No. DocID.
Formulation Method Rate (kg ai/ha]
Growth stage (BBCH)
No. Dicamba5-OH dicamba
Total*
US GAP
480 SL 240 SL 132 SC 700 WG 500 WG 424 WG 400 WG
spray 0.56 (0.84/ season)
2 na
field corn 240SL foliar 2.24 + Previous 1 117 grain < 0.01 < 0.01 < 0.02 Jimenez, N. C USA, 1995 0.56 + fall + 1996

1032 Dicamba
CROP Country, Year Location (variety) Trial No.
Application
PHI(d)
Portion analysed
Residues (mg/kg) Author Report Year Study No. DocID.
Formulation Method Rate (kg ai/ha]
Growth stage (BBCH)
No. Dicamba5-OH dicamba
Total*
Illinois 0.28 (fallow) + 2 149 (Golden Harvest 2458)
8“ tall +
1996/5331
104/95/01-624-01
36“ tall
field corn 240SL foliar 2.24 + Previous 1 99 grain < 0.01 < 0.01 < 0.02 Jimenez, N. C USA, 1995 0.56 + fall + 1996 Iowa 0.28 (fallow) + 2 149 (Querna 7670) 8“ tall + 1996/5331 104/95/01-669-01
36“ tall
field corn 240SL foliar 2.24 + Previous 1 66 grain < 0.01 < 0.01 < 0.02 Jimenez, N. C USA, 1995 0.56 + fall + 1996 Kansas 0.28 (fallow) + 2 149 (Asgrow RX623)
8“ tall +
1996/5331
104/95/01-606-01
36“ tall
field corn 240SL foliar 2.24 + Previous 1 110 grain < 0.01 < 0.01 < 0.02 Jimenez, N. C USA, 1995 0.56 + fall + 1996 Kentucky 0.28 (fallow) + 2 149 (Pioneer 3140) 8“ tall + 1996/5331 104/95/01-621-01
36“ tall
field corn 240SL foliar 2.24 + Previous 1 123 grain < 0.01 < 0.01 < 0.02 Jimenez, N. C USA, 1995 0.56 + fall + 1996 Michigan 0.28 (fallow) + 2 149 (Great Lakes 450)
8“ tall +
1996/5331
104/95/01-662-01
36“ tall
field corn 240SL foliar 2.24 + Previous 1 95 grain < 0.01 < 0.01 < 0.02 Jimenez, N. C USA, 1995 0.56 + fall + 1996 Minnesota 0.28 (fallow) + 2 149 (Pioneer 3751) 8“ tall + 1996/5331104/95/01-613-01
36“ tall
field corn 240SL foliar 2.24 + Previous 1 98 grain < 0.01 < 0.01 < 0.02 Jimenez, N. C USA, 1995 0.56 + fall + 1996 Nebraska 0.28 (fallow) + 2 149 (Pioneer 3357) 8“ tall + 1996/5331 104/95/01-608-01
36“ tall
field corn 240SL foliar 2.24 + Previous 1 108 grain < 0.01 < 0.01 < 0.02 Jimenez, N. C USA, 1995 0.56 + fall + 1996 Ohio 0.28 (fallow) + 2 149 (Pioneer 3394) 8“ tall + 1996/5331 104/95/01-667-01
36“ tall
field corn 240SL foliar 2.24 + Previous 1 99 grain < 0.01 < 0.01 < 0.02 Jimenez, N. C USA, 1995 0.56 + fall + 1996 Pennsylvania 0.28 (fallow) + 2 149 (Mycogen 728) 8“ tall + 1996/5331 104/95/01-671-01
36“ tall
field corn 240SL foliar 2.24 + Previous 1 76 grain < 0.01 0.01 0.02 Jimenez, N. C USA, 1995 0.56 + fall + 1996 South Dakota 0.28 (fallow) + 2 149 (Golden Harvest 2404)
8“ tall +
1996/5331

Dicamba 1033
CROP Country, Year Location (variety) Trial No.
Application
PHI(d)
Portion analysed
Residues (mg/kg) Author Report Year Study No. DocID.
Formulation Method Rate (kg ai/ha]
Growth stage (BBCH)
No. Dicamba5-OH dicamba
Total*
104/95/01-611-01
36“ tall
field corn 240SL foliar 2.24 + Previous 1 101 grain < 0.01 < 0.01 < 0.02 Jimenez, N. C USA, 1995 0.56 + fall + 1996 Wisconsin 0.28 (fallow) + 2 149 (Renk RK 534) 8“ tall + 1996/5331 104/95/01-610-01
36“ tall
field corn 240SL foliar 2.24 + Previous 1 85 grain < 0.01 < 0.01 < 0.02 Jimenez, N. C USA, 1995 480SL 0.56 + fall + 1996 Illinois 240SL 0.28 (fallow) + 2 149 (not reported) 8“ tall + 1996/5331 104/95/01-624-02
36“ tall
field corn 240SL foliar 2.24 + Previous 1 94 grain < 0.01 < 0.01 < 0.02 Jimenez, N. CUSA, 1995 480SL 0.56 + fall + 1996 Indiana 240SL 0.28 (fallow) + 2 149 (Pioneer 3394) 8“ tall + 1996/5331 104/95/01-615-01
36“ tall
field corn 240SL foliar 2.24 + Previous 1 99 grain < 0.01 < 0.01 < 0.02 Jimenez, N. C USA, 1995 480SL 0.56 + fall + 1996 Iowa 240SL 0.28 (fallow) + 2 149 (Querna 7670) 8“ tall + 1996/5331 104/95/01-669-02
36“ tall
field corn 240SL foliar 2.24 + Previous 1 95 grain < 0.01 < 0.01 < 0.02 Jimenez, N. C USA, 1995 480SL 0.56 + fall + 1996 Minnesota 240SL 0.28 (fallow) + 2 149 (Pioneer 3751) 8“ tall + 1996/5331104/95/01-613-02
36“ tall
field corn 240SL foliar 2.24 + Previous 1 100 grain < 0.01 0.02 0.03 Jimenez, N. C USA, 1995 480SL 0.56 + fall + 1996 Missouri 240SL 0.28 (fallow) + 2 149 (Pioneer 3394) 8“ tall + 1996/5331 104/95/02-668-01
36“ tall
field corn 240SL foliar 2.24 + Previous 1 100 grain < 0.01 0.01 0.02 Jimenez, N. C USA, 1995 480SL 0.56 + fall + 1996 Nebraska 240SL 0.28 (fallow) + 2 149 (Pioneer 3162) 8“ tall + 1996/5331 104/95/01-608-02
36“ tall
field corn 240SL foliar 2.24 + Previous 1 76 grain < 0.01 < 0.01 < 0.02 Jimenez, N. C USA, 1995 480SL 0.56 + fall + 1996 North Carolina 240SL 0.28 (fallow) + 2 149 (Pioneer 3163) 8“ tall + 1996/5331 104/95/01-612-01
36“ tall
field corn 240SL foliar 2.24 + Previous 1 73 grain < 0.01 < 0.01 < 0.02 Jimenez, N. C USA, 1995 480SL 0.56 + fall + 1996 Oklahoma 240SL 0.28 (fallow) + 2 149 (Pioneer 3165) 8“ tall + 1996/5331 104/95/01-616-01
36“ tall
* Dicamba + 5-OH dicamba + DCSA; highest residue is taken into consideration in case different salt formulations of dicamba are applied side-by-side
dbh = days before harvest

1034 Dicamba
Sorghum
The use of dicamba in sorghum consists of two applications: one application of 0.28 kg ai/ha immediately prior to the first joint stage and one application of 0.28 kg ai/ha applied at the soft dough stage (approximately 30 days prior to harvest). The PHI is 30 days.
A total of 11 supervised field residue trials were conducted during the 1992 and 1995 growing seasons to determine residue levels of dicamba and 5-OH dicamba in the raw agricultural commodity, sorghum grain.
Each formulation was applied at the maximum proposed label rate according to the methods and conditions representing U.S. sorghum production. The states selected (Kansas, Missouri, Louisiana, Nebraska. North Carolina, Oklahoma, and Texas) for these trials represent the major sorghum production areas in the United States.
In all trials, samples of sorghum grain were collected at normal harvest, approximately 30 days after the last application. The samples were quickly frozen and shipped frozen to laboratory for analysis. Samples were kept frozen until homogenization and analysis.
Control and treated samples of sorghum grain from each site were analysed for dicamba and 5-OH dicamba according to either analytical method AM-0691B or AM-0691-0593-3. These methods measure the parent compound and 5-OH dicamba using GC/ECD. Residues of dicamba + 5-OH dicamba are reported as total dicamba residues.
For trials in 1992 season, the mean dicamba recovery was 85% ± 7% (n = 5) for all fortification levels (0.01 mg/kg to 0.1 mg/kg. The mean 5-OH dicamba recovery was 84% ± 8% (n = 5) for all fortification levels (0.01 mg/kg to 0.1 mg/kg.
For trials in 1995, the mean dicamba recovery was 88% ± 13% (n = 6) for all fortification levels (0.02 mg/kg to 1 mg/kg). The mean 5-OH dicamba recovery was 97% ± 15% (n = 6) for all fortification levels (0.02 mg/kg to 1 mg/kg.
Five field residue trials were conducted in 1992 on grain sorghum using four formulations of dicamba (the potassium (K+) salt, the sodium (Na+) salt, the dimethylamine (DMA+) salt, and the diglycolamine (DGA+) salt. Kansas, Missouri, Nebraska, Oklahoma, and Texas were selected as representing the key sorghum production areas.
Furthermore, the statistical analysis was performed on these five trial locations where the side by side comparisons were conducted. The result showed that the magnitude of the residues found was not influenced by the difference in the dicamba salt formulations applied.
Six field residue trials were conducted in 1995 on grain sorghum using the DMA+ salt formulation of dicamba. Illinois, Kansas, Louisiana, Nebraska, North Carolina, and Oklahoma were selected as representing the key sorghum production areas.
Table 78 Residues of dicamba and 5-OH dicamba from supervised trials on sorghum in the USA
CROP Country, Year Location (variety) Trial No.
Application
PHI(d)
Portion analysed
Residues (mg/kg) Author Report Year Study No. DocID.
Formulation Method Rate (kg ai/ha]
Growth stage (BBCH)
No. Dicamba5-OH dicamba
Total*
US GAP
480 SL 120 SL 700 WG 132 SC
Spray 0.30 (0.59/ season)
2 30
sorghum Dicamba (Na+) WG
foliar 0.28 + 3 to 5 leaf 2 30 grain 0.82 0.43 1.25 Laban, S. L.
USA, 1992 Dicamba (DGA+) SL
0.28 stage 0.69 0.35 1.04 1994
Kansas Dicamba (K+) SL
+ 0.72 0.41 1.13 119
(not reported) Dicamba (DMA+) SL
soft dough
1.18 0.52 1.70 1994/5220

Dicamba 1035
CROP Country, Year Location (variety) Trial No.
Application
PHI(d)
Portion analysed
Residues (mg/kg) Author Report Year Study No. DocID.
Formulation Method Rate (kg ai/ha]
Growth stage (BBCH)
No. Dicamba5-OH dicamba
Total*
1102106A stage
sorghum Dicamba (Na+) WG
foliar 0.28 + 3 to 5 leaf 2 42 grain 1.28 0.22 1.50 Laban, S. L.
USA, 1992 Dicamba (DGA+) SL
0.28 stage 0.81 0.30 1.11 1994
Missouri Dicamba (K+) SL
+ 0.81 0.33 1.14 119
(not reported) Dicamba (DMA+) SL
soft dough
0.81 0.27 1.08 1994/5220
1102108A stage
sorghum Dicamba (Na+) WG
foliar 0.28 + 3 to 5 leaf 2 42 grain 0.03 0.02 0.05 Laban, S. L.
USA, 1992 Dicamba (DGA+) SL
0.28 stage 0.04 0.02 0.06 1994
Nebraska Dicamba (K+) SL
+ 0.10 0.05 0.15 119
(not reported) Dicamba (DMA+) SL
soft dough
0.10 0.05 0.14 1994/5220
1102108B stage
sorghum Dicamba (Na+) WG
foliar 0.28 + 3 to 5 leaf 2 30 grain 0.39 0.15 0.54 Laban, S. L.
USA, 1992 Dicamba (DGA+) SL
0.28 stage 0.34 0.17 0.51 1994
Oklahoma Dicamba (K+) SL
+ 0.36 0.17 0.53 119
(not reported) Dicamba (DMA+) SL
soft dough
0.30 0.19 0.49 1994/5220
1102116A stage
sorghum Dicamba (Na+) WG
foliar 0.28 + 3 to 5 leaf 2 30 grain 0.92 1.77 2.69 Laban, S. L.
USA, 1992 Dicamba (DGA+) SL
0.28 stage 0.97 1.76 2.73 1994
Texas Dicamba (K+) SL
+ 0.76 1.24 2.00 119
(not reported) Dicamba (DMA+) SL
soft dough
0.89 1.57 2.46 1994/5220
1102117A stage sorghum 240SL foliar 0.28 + 3 to 5 leaf 2 32 grain 1.98 1.19 3.16 Guirguis, M. J USA, 1995 0.28 stage 1996 North Carolina + 148
(FFR 321) soft dough
1996/5329
110/95/01-612-01
stage
sorghum 240SL foliar 0.28 + 3 to 5 leaf 2 29 grain 0.78 0.51 1.29 Guirguis, M. J.USA, 1995 0.28 stage 1996 Oklahoma + 148
(G522DR) soft dough
1996/5329
110/95/01-616-01
stage
sorghum 240SL foliar 0.28 + 3 to 5 leaf 2 30 grain 1.02 1.18 2.20 Guirguis, M. J.USA, 1995 0.28 stage 1996 Texas + 148
(NC+7C49) soft dough
1996/5329
110/95/01-616-02
stage

1036 Dicamba
CROP Country, Year Location (variety) Trial No.
Application
PHI(d)
Portion analysed
Residues (mg/kg) Author Report Year Study No. DocID.
Formulation Method Rate (kg ai/ha]
Growth stage (BBCH)
No. Dicamba5-OH dicamba
Total*
sorghum 240SL foliar 0.28 + 3 to 5 leaf 2 30 grain 0.41 0.44 0.85 Guirguis, M. J.USA, 1995 0.28 stage 1996 Kansas + 148 (Hogemeyer 688)
soft dough
1996/5329
110/95/01-606-01
stage
sorghum 240SL foliar 0.28 + 3 to 5 leaf 2 30 grain 1.20 1.22 2.42 Guirguis, M. J.USA, 1995 0.28 stage 1996 Louisiana + 148
(Pioneer 8305) soft dough
1996/5329
110/95/01-672-01
stage
sorghum 240SL foliar 0.28 + 3 to 5 leaf 2 34 grain 1.32 0.71 2.03 Guirguis, M. J.USA, 1995 0.28 stage 1996 Nebraska + 148
(Dekalb DK 18) soft dough
1996/5329
110/95/01-608-01
stage
* Dicamba + 5-OH dicamba; highest residue is taken into consideration in case different salt formulations of dicamba are applied side-by-side
dbh = days before harvest
Wheat
The use of dicamba in wheat consists of two applications: one spring application of 0.28 kg ai/ha immediately prior to the first joint stage and one broadcast application of 0.28 kg ai/ha approximately 7 days prior to harvest. The PHI is 7 days.
A total of 20 supervised field residue trials were conducted during the 1995 growing seasons to determine residue levels of dicamba and 5-OH dicamba in the raw agricultural commodity, wheat grain. The trials were located in Colorado, Idaho, Illinois, Kansas, Minnesota, Missouri,, Mississippi, Montana, Nebraska, New Mexico, North Carolina, North Dakota, Ohio, Oklahoma, Texas, and Wyoming which represent the U. S. wheat production areas. The dimethylamine salt (DMA+) of dicamba was applied in ten (10) trial locations.
Side by side trials with three formulations (the dimethylamine salt (DMA+), the diglycolamine salt (DGA+), and the sodium salt (Na+) of dicamba] were conducted at four locations (Kansas, North Carolina, North Dakota, and Texas) to determine the similarity of residues from the different salts.
Likewise, side by side trials with the dimethylamine salt (DMA+) of dicamba using ground application for the first treatment plus ground or air application of the pre harvest treatment were conducted at four locations (Kansas, Montana (2), and Oklahoma) to determine the similarity of residues from the two application types.
In addition, two trials (Colorado and Oklahoma) applied the DMA+ salt formulation with decline sampling intervals.
Each formulation was applied at the maximum proposed label rate according to the methods and conditions representing U.S. wheat production.
In all trials, samples of wheat were collected, quickly frozen, and shipped frozen to laboratory for analysis. Samples were kept frozen until homogenization and analysis.

Dicamba 1037
Control and treated wheat samples from each site were analysed for dicamba and 5-OH dicamba according to current validated analytical method AM-0691B-0593-3. This method measures the parent compound and 5-OH dicamba using GC/ECD. Residues of dicamba + 5-OH dicamba are reported as total dicamba residues.
Results of the statistical analysis performed on the data from the four locations where side by side trials with the ground versus aerial pre harvest applications were conducted showed that the difference in the magnitude of residue in wheat grain was influenced by the difference in the trial locations and not by the difference in the application technique.
Also results of the statistical analysis performed on the data from the four locations where side by side trials with the three dicamba salt formulations were conducted showed that the difference in the magnitude of residue in wheat grain was influenced by the difference in the trial locations and not by the difference in the dicamba formulation.
Therefore only the highest residues were included in the Table where side by side trials were conducted using different salts or different application techniques.
Table 79 Residues of dicamba and 5-OH dicamba from supervised trials on wheat in the USA
CROP Country, Year Location (variety) Trial No.
Application
PHI(d)
Portion analysed
Residues (mg/kg) Author Report Year Study No. DocID.
Formulation Method Rate (kg ai/ha]
Growth stage (BBCH)
No. Dicamba5-OH dicamba
Total*
US GAP 480 SL 240 SL 700 WG 120 SL 500 WG
Spray 0.07-0.28 (0.56/ season)
2 7
wheat 240SL foliar 0.14 + first 2 7 grain 0.47 0.03 0.50 Jimenez, N. C USA, 1995 0.28 jointing 1996 Colorado + 145 (Yuma) 7 dbh 1996/5305 103/95/01-602-04
wheat 240SL foliar 0.14 + first 2 7 grain 0.11 0.01 0.12 Jimenez, N. C USA, 1995 0.28 jointing 1996 Idaho + 145 (Serra hard red) 7 dbh 1996/5305 103/95/01-631-01
wheat 240SL foliar 0.14 + first 2 6 grain 0.53 0.10 0.63 Jimenez, N. C USA, 1995 0.28 jointing 1996 Illinois + 145 (Pioneer 2552) 7 dbh 1996/5305 103/95/01-624-01
wheat 240SL foliar 0.14 + first 2 7 grain 0.81 0.40 1.21 Jimenez, N. CUSA, 1995 0.28 jointing 1996 Minnesota + 145 (2375 hard red) 7 dbh 1996/5305 103/95/01-611-01
wheat 240SL foliar 0.14 + first 2 7 grain 0.11 0.01 0.12 Jimenez, N. C USA, 1995 0.28 jointing 1996 Mississippi + 145 (Caldwell) 7 dbh 1996/5305 103/95/01-620-01

1038 Dicamba
CROP Country, Year Location (variety) Trial No.
Application
PHI(d)
Portion analysed
Residues (mg/kg) Author Report Year Study No. DocID.
Formulation Method Rate (kg ai/ha]
Growth stage (BBCH)
No. Dicamba5-OH dicamba
Total*
wheat 240SL foliar 0.14 + first 2 9 grain 0.11 0.05 0.16 Jimenez, N. C USA, 1995 0.28 jointing 1996 Missouri + 145 (Pioneer 2571) 7 dbh 1996/5305 103/95/01-668-01
wheat 240SL foliar 0.14 + first 2 10 grain 0.28 0.03 0.31 Jimenez, N. C USA, 1995 0.28 jointing 1996 Nebraska + 145 (Arapahoe) 7 dbh 1996/5305 103/95/01-602-01
wheat 240SL foliar 0.14 + first 2 7 grain 0.35 0.04 0.39 Jimenez, N. CUSA, 1995 0.28 jointing 1996 New Mexico + 145 (TAM205) 7 dbh 1996/5305 103/95/01-602-03
wheat 240SL foliar 0.14 + first 2 8 grain 0.84 0.29 1.13 Jimenez, N. C USA, 1995 0.28 jointing 1996 Ohio + 145 (Madison GL 9420)
7 dbh
1996/5305
103/95/01-667-01
wheat 240SL foliar 0.14 + first 2 7 grain 0.25 0.05 0.30 Jimenez, N. C USA, 1995 0.28 jointing 1996 Wyoming + 145 (Serra hard red) 7 dbh 1996/5305 103/95/01-602-02
wheat 240SL foliar 0.14 + first 2 9 grain 0.07 0.02 0.09 Jimenez, N. C USA, 1995 0.28 jointing 1996 Kansas + 145 (Karl) 7 dbh 1996/5305 103/95/01-606-01
wheat 240SL foliar 0.14 + first 2 7 grain 0.05 0.01 0.06 Jimenez, N. C USA, 1995 0.28 jointing 1996 Montana + 145 (Judith) 7 dbh 1996/5305 103/95/01-611-02
wheat 240SL foliar 0.14 + first 2 9 grain 0.19 0.03 0.22 Jimenez, N. C USA, 1995 0.28 jointing 1996 Montana + 145 (Grandin) 7 dbh 1996/5305 103/95/01-661-01
wheat 240SL foliar 0.14 + first 2 7 grain 0.16 0.01 0.17 Jimenez, N. C USA, 1995 0.28 jointing 1996 Oklahoma + 145 (Pioneer 2158) 7 dbh 1996/5305 103/95/01-616-01
wheat 240SL foliar 0.14 + first 2 7 grain 0.29 0.06 0.35 Jimenez, N. C USA, 1995 480SL 0.28 jointing 1996 Kansas 240SL + 145 (Karl) 7 dbh 1996/5305 103/95/01-606-02
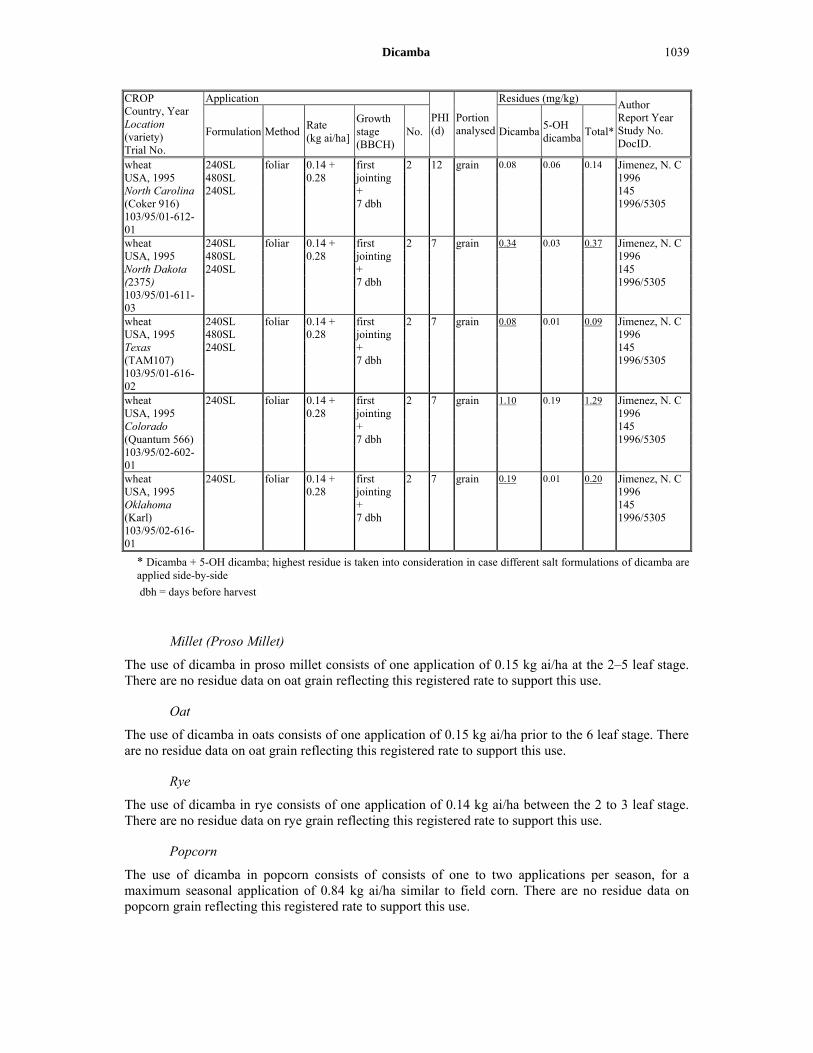
Dicamba 1039
CROP Country, Year Location (variety) Trial No.
Application
PHI(d)
Portion analysed
Residues (mg/kg) Author Report Year Study No. DocID.
Formulation Method Rate (kg ai/ha]
Growth stage (BBCH)
No. Dicamba5-OH dicamba
Total*
wheat 240SL foliar 0.14 + first 2 12 grain 0.08 0.06 0.14 Jimenez, N. C USA, 1995 480SL 0.28 jointing 1996 North Carolina 240SL + 145 (Coker 916) 7 dbh 1996/5305 103/95/01-612-01
wheat 240SL foliar 0.14 + first 2 7 grain 0.34 0.03 0.37 Jimenez, N. C USA, 1995 480SL 0.28 jointing 1996 North Dakota 240SL + 145 (2375) 7 dbh 1996/5305 103/95/01-611-03
wheat 240SL foliar 0.14 + first 2 7 grain 0.08 0.01 0.09 Jimenez, N. CUSA, 1995 480SL 0.28 jointing 1996 Texas 240SL + 145 (TAM107) 7 dbh 1996/5305 103/95/01-616-02
wheat 240SL foliar 0.14 + first 2 7 grain 1.10 0.19 1.29 Jimenez, N. C USA, 1995 0.28 jointing 1996 Colorado + 145 (Quantum 566) 7 dbh 1996/5305 103/95/02-602-01
wheat 240SL foliar 0.14 + first 2 7 grain 0.19 0.01 0.20 Jimenez, N. CUSA, 1995 0.28 jointing 1996 Oklahoma + 145 (Karl) 7 dbh 1996/5305 103/95/02-616-01
* Dicamba + 5-OH dicamba; highest residue is taken into consideration in case different salt formulations of dicamba are applied side-by-side
dbh = days before harvest
Millet (Proso Millet)
The use of dicamba in proso millet consists of one application of 0.15 kg ai/ha at the 2–5 leaf stage. There are no residue data on oat grain reflecting this registered rate to support this use.
Oat
The use of dicamba in oats consists of one application of 0.15 kg ai/ha prior to the 6 leaf stage. There are no residue data on oat grain reflecting this registered rate to support this use.
Rye
The use of dicamba in rye consists of one application of 0.14 kg ai/ha between the 2 to 3 leaf stage. There are no residue data on rye grain reflecting this registered rate to support this use.
Popcorn
The use of dicamba in popcorn consists of consists of one to two applications per season, for a maximum seasonal application of 0.84 kg ai/ha similar to field corn. There are no residue data on popcorn grain reflecting this registered rate to support this use.
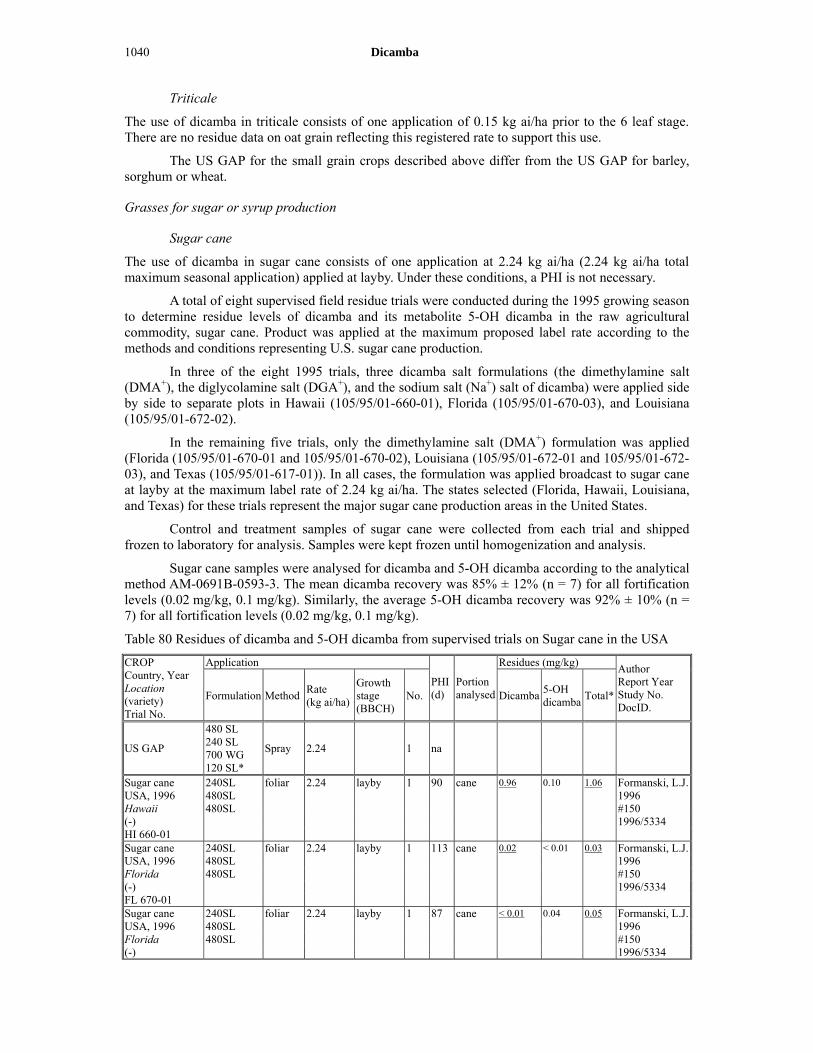
1040 Dicamba
Triticale
The use of dicamba in triticale consists of one application of 0.15 kg ai/ha prior to the 6 leaf stage. There are no residue data on oat grain reflecting this registered rate to support this use.
The US GAP for the small grain crops described above differ from the US GAP for barley, sorghum or wheat.
Grasses for sugar or syrup production
Sugar cane
The use of dicamba in sugar cane consists of one application at 2.24 kg ai/ha (2.24 kg ai/ha total maximum seasonal application) applied at layby. Under these conditions, a PHI is not necessary.
A total of eight supervised field residue trials were conducted during the 1995 growing season to determine residue levels of dicamba and its metabolite 5-OH dicamba in the raw agricultural commodity, sugar cane. Product was applied at the maximum proposed label rate according to the methods and conditions representing U.S. sugar cane production.
In three of the eight 1995 trials, three dicamba salt formulations (the dimethylamine salt (DMA+), the diglycolamine salt (DGA+), and the sodium salt (Na+) salt of dicamba) were applied side by side to separate plots in Hawaii (105/95/01-660-01), Florida (105/95/01-670-03), and Louisiana (105/95/01-672-02).
In the remaining five trials, only the dimethylamine salt (DMA+) formulation was applied (Florida (105/95/01-670-01 and 105/95/01-670-02), Louisiana (105/95/01-672-01 and 105/95/01-672-03), and Texas (105/95/01-617-01)). In all cases, the formulation was applied broadcast to sugar cane at layby at the maximum label rate of 2.24 kg ai/ha. The states selected (Florida, Hawaii, Louisiana, and Texas) for these trials represent the major sugar cane production areas in the United States.
Control and treatment samples of sugar cane were collected from each trial and shipped frozen to laboratory for analysis. Samples were kept frozen until homogenization and analysis.
Sugar cane samples were analysed for dicamba and 5-OH dicamba according to the analytical method AM-0691B-0593-3. The mean dicamba recovery was 85% ± 12% (n = 7) for all fortification levels (0.02 mg/kg, 0.1 mg/kg). Similarly, the average 5-OH dicamba recovery was 92% ± 10% (n = 7) for all fortification levels (0.02 mg/kg, 0.1 mg/kg).
Table 80 Residues of dicamba and 5-OH dicamba from supervised trials on Sugar cane in the USA
CROP Country, Year Location (variety) Trial No.
Application
PHI(d)
Portion analysed
Residues (mg/kg) Author Report Year Study No. DocID.
Formulation Method Rate (kg ai/ha)
Growth stage (BBCH)
No. Dicamba5-OH dicamba
Total*
US GAP
480 SL 240 SL 700 WG 120 SL*
Spray 2.24 1 na
Sugar cane 240SL foliar 2.24 layby 1 90 cane 0.96 0.10 1.06 Formanski, L.J.USA, 1996 480SL 1996 Hawaii 480SL #150 (-) 1996/5334 HI 660-01 Sugar cane 240SL foliar 2.24 layby 1 113 cane 0.02 < 0.01 0.03 Formanski, L.J.USA, 1996 480SL 1996 Florida 480SL #150 (-) 1996/5334 FL 670-01 Sugar cane 240SL foliar 2.24 layby 1 87 cane < 0.01 0.04 0.05 Formanski, L.J.USA, 1996 480SL 1996 Florida 480SL #150 (-) 1996/5334

Dicamba 1041
CROP Country, Year Location (variety) Trial No.
Application
PHI(d)
Portion analysed
Residues (mg/kg) Author Report Year Study No. DocID.
Formulation Method Rate (kg ai/ha)
Growth stage (BBCH)
No. Dicamba5-OH dicamba
Total*
FL 670-02 Sugar cane 240SL foliar 2.24 layby 1 87 cane 0.03 0.05 0.08 Formanski, L.J.USA, 1996 480SL 1996 Florida 480SL #150 (-) 1996/5334 FL 670-03 Sugar cane 240SL foliar 2.24 layby 1 90 cane 0.05 0.15 0.20 Formanski, L.J.USA, 1996 480SL 1996 Louisiana 480SL #150 (-) 1996/5334 LA 672-01 Sugar cane 240SL foliar 2.24 layby 1 91 cane 0.05 0.06 0.11 Formanski, L.J.USA, 1996 480SL 1996 Louisiana 480SL #150 (-) 1996/5334 LA 672-02 Sugar cane 240SL foliar 2.24 layby 1 92 cane 0.03 0.10 0.13 Formanski, L.J.USA, 1996 480SL 1996 Louisiana 480SL #150 (-) 1996/5334 LA 672-03 Sugar cane 240SL foliar 2.24 layby 1 173 cane 0.01 0.01 0.02 Formanski, L.J.USA, 1996 480SL 1996 Texas 480SL #150 (-) 1996/5334TX 617-01
* Dicamba + 5-OH dicamba; highest residue is taken into consideration in case different salt formulations of dicamba are applied side-by-side
Oilseeds
Cotton
The current registered use of dicamba in cotton consists of a single pre-plant application at 0.28 kg ai/ha. Residue trials were conducted at 0.56 kg ai/ha, which was the originally proposed application rate. Under this use condition, a PHI is not necessary.
A total of 12 supervised field residue trials were conducted during the 1994 and 1998 growing seasons to determine residue levels of dicamba and 5-OH dicamba in the raw agricultural commodities, cotton seed and cotton gin trash (for gin trash, see Table 88). The states selected (Alabama, Arkansas, California, Louisiana, Mississippi, Oklahoma, Tennessee, and Texas) for these trials represent the major cotton production areas in the United States.
Two plots were established at each site, one treatment plot and one control plot. The treatment plot received a single broadcast application of dicamba sodium salt formulation (240SL) at 0.56 kg ai/ha 14 days prior to planting.
In all trials, cotton samples were collected at mature harvest stage. Replicate cotton seed and gin trash were hand-picked one day after application and cotton seed was delinted. The samples were quickly frozen and shipped frozen to laboratory for analysis. Samples were kept frozen until homogenization and analysis.
Cotton seed samples were analysed for dicamba and 5-OH dicamba according to analytical method AM-0691B-0593- 3

1042 Dicamba
For trials conducted in 1994, the mean dicamba recovery in cotton seed was 95% ± 16% (n = 12) for all fortification levels (0.05 mg/kg and 0.1 mg/kg). The mean 5-OH dicamba recovery in cotton seed was 94% ± 14% (n = 12) for all fortification levels (0.05 mg/kg and 0.1 mg/kg).
Initially, 12 supervised field residue trials were conducted during the 1994 growing season; three trials in Texas, two in Mississippi, three in Louisiana, two in Arkansas, one in Alabama, and one in Tennessee.
Two plots were established at each site, one treatment plot and one control plot. The treatment plot received a single broadcast application of dicamba sodium salt formulation (240SL) at 0.56 kg ai/ha 14 days prior to planting.
In residue analysis, presence of unusually high background interferences from co-extracted plant substances did not allow quantitation at the requisite dicamba and the 5-OH dicamba limits of quantitation (LOQ: 0.02 mg/kg). Therefore, the limits of quantitation were increased to 0.04 mg/kg for both dicamba and 5-OH dicamba for these 12 trials.
Because of this higher LOQ than those in the trials on other crops, and taking into consideration nil residue situation after pre-plant application, where both dicamba and 5-OH dicamba were < 0.04 mg/kg, the total residues were calculated to be < 0.04 mg/kg. When either dicamba or 5-OH dicamba was < 0.04 mg/kg while the other was higher than 0.04 mg/kg, residues at < 0.04 mg/kg were assumed to be zero in calculating the total residues.
Table 81 Residues of dicamba and 5-OH dicamba from supervised trials on cotton in the USA
CROP Country, Year Location (variety) Trial No.
Application
PHI(d)
Portion analysed
Residues (mg/kg) Author Report Year Study No. DocID.
Formulation Method Rate (kg ai/ha)
Growth stage (BBCH)
No. Dicamba5-OH dicamba
Total*
US GAP
480 SL 240 SL 700 WG 500 WG*
Spray 0.28 1 na
cotton 240SL
pre plant
0.56 14 days 1 143 seed < 0.04 0.05 0.05 Guirguis, M. J.
USA, 1994 pre plant 1995 Texas 137 DPL 20 1995/5297 108/94/01-617-01
cotton 240SL
pre plant
0.56 13 days 1 156 seed < 0.04 < 0.04 < 0.04 Guirguis, M. J.
USA, 1994 pre plant 1995 Texas 137 DPL 50 1995/5297 108/94/01-617-02
cotton 240SL
pre plant
0.56 14 days 1 187 seed < 0.04 < 0.04 < 0.04 Guirguis, M. J.
USA, 1994 pre plant 1995 Texas 137 Paymaster HS 200
1995/5297
108/94/01-616-01
cotton 240SL
pre plant
0.56 15 days 1 146 seed < 0.04 < 0.04 < 0.04 Guirguis, M. J.
USA, 1994 pre plant 1995 Mississippi 137 DPL 50 1995/5297 108/94/01-618-01

Dicamba 1043
CROP Country, Year Location (variety) Trial No.
Application
PHI(d)
Portion analysed
Residues (mg/kg) Author Report Year Study No. DocID.
Formulation Method Rate (kg ai/ha)
Growth stage (BBCH)
No. Dicamba5-OH dicamba
Total*
cotton 240SL
pre plant
0.56 16 days 1 189 seed < 0.04 < 0.04 < 0.04 Guirguis, M. J.
USA, 1994 pre plant 1995 Mississippi 137 LA 877 1995/5297 108/94/01-618-02
cotton 240SL
pre plant
0.56 NA days 1 183 seed < 0.04 < 0.04 < 0.04 Guirguis, M. J.
USA, 1994 pre plant 1995 Louisiana 137 (not reported) 1995/5297 108/94/01-672-01
cotton 240SL
pre plant
0.56 14 days 1 161 seed < 0.04 < 0.04 < 0.04 Guirguis, M. J.
USA, 1994 pre plant 1995 Louisiana 137 DPL 20 1995/5297 108/94/01-672-02
cotton 240SL
pre plant
0.56 14 days 1 159 seed < 0.04 < 0.04 < 0.04 Guirguis, M. J.
USA, 1994 pre plant 1995 Louisiana 137 DPL 51 1995/5297 108/94/01-672-03
cotton 240SL
pre plant
0.56 14 days 1 166 seed < 0.04 < 0.04 < 0.04. Guirguis, M. J.
USA, 1994 pre plant (control) < 0.04 0.05 0.05 1995 Arkansas 137 DPL 20 1995/5297 108/94/01-665-01
cotton 240SL
pre plant
0.56 16 days 1 162 seed < 0.04 < 0.04 < 0.04 Guirguis, M. J.
USA, 1994 pre plant 1995 Arkansas 137 (not reported) 1995/5297 108/94/01-665-02
cotton 240SL
pre plant
0.56 14 days 1 158 seed < 0.04 < 0.04 < 0.04 Guirguis, M. J.
USA, 1994 pre plant 1995 Tennessee 137 DPL 50 1995/5297108/94/01-621-01
cotton 240SL
pre plant
0.56 14 days 1 172 seed < 0.04 < 0.04 < 0.04 Guirguis, M. J.
USA, 1994 pre plant 1995 Alabama 137 DPL 50 1995/5297 108/94/01-664-01
* Dicamba + 5-OH dicamba
LATH: last application to harvest expressed in days
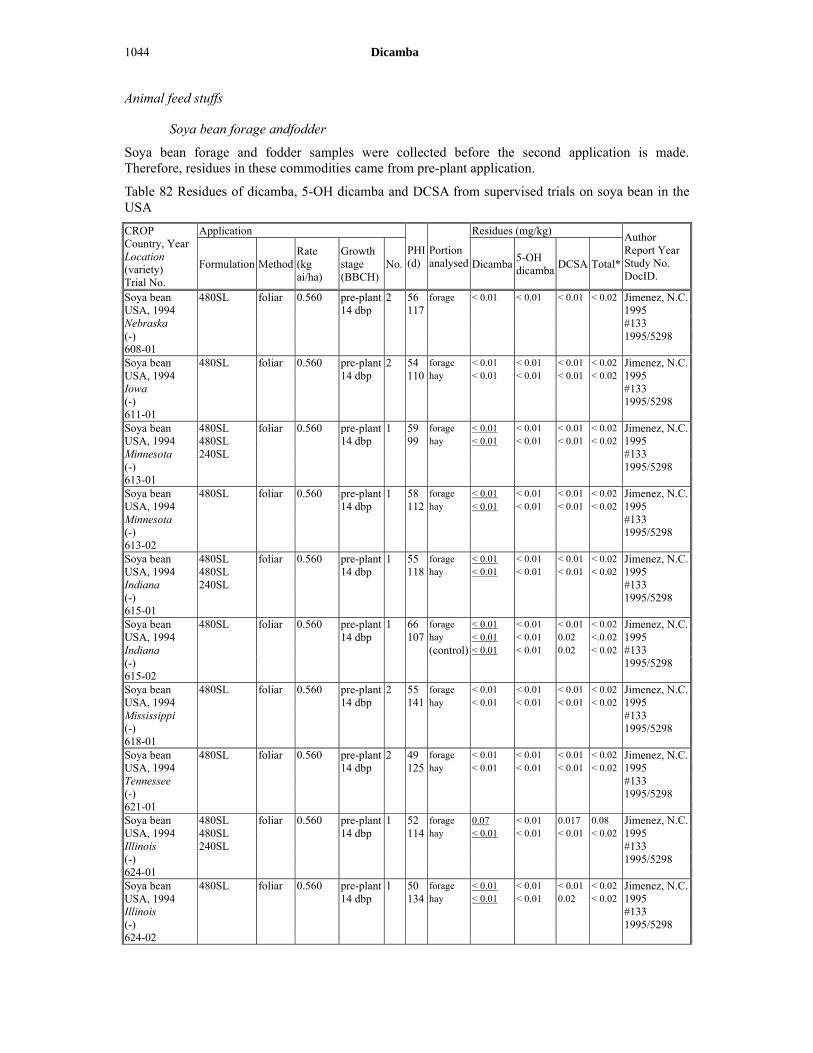
1044 Dicamba
Animal feed stuffs
Soya bean forage andfodder
Soya bean forage and fodder samples were collected before the second application is made. Therefore, residues in these commodities came from pre-plant application.
Table 82 Residues of dicamba, 5-OH dicamba and DCSA from supervised trials on soya bean in the USA
CROP Country, Year Location (variety) Trial No.
Application
PHI(d)
Portion analysed
Residues (mg/kg) Author Report Year Study No. DocID.
Formulation Method Rate (kg ai/ha)
Growthstage (BBCH)
No. Dicamba5-OH dicamba
DCSA Total*
Soya bean 480SL foliar 0.560 pre-plant 2 56 forage < 0.01 < 0.01 < 0.01 < 0.02 Jimenez, N.C.USA, 1994 14 dbp 117 1995 Nebraska #133 (-) 1995/5298 608-01 Soya bean 480SL foliar 0.560 pre-plant 2 54 forage < 0.01 < 0.01 < 0.01 < 0.02 Jimenez, N.C.USA, 1994 14 dbp 110 hay < 0.01 < 0.01 < 0.01 < 0.02 1995 Iowa #133 (-) 1995/5298 611-01 Soya bean 480SL foliar 0.560 pre-plant 1 59 forage < 0.01 < 0.01 < 0.01 < 0.02 Jimenez, N.C.USA, 1994 480SL 14 dbp 99 hay < 0.01 < 0.01 < 0.01 < 0.02 1995 Minnesota 240SL #133 (-) 1995/5298 613-01 Soya bean 480SL foliar 0.560 pre-plant 1 58 forage < 0.01 < 0.01 < 0.01 < 0.02 Jimenez, N.C.USA, 1994 14 dbp 112 hay < 0.01 < 0.01 < 0.01 < 0.02 1995 Minnesota #133 (-) 1995/5298 613-02 Soya bean 480SL foliar 0.560 pre-plant 1 55 forage < 0.01 < 0.01 < 0.01 < 0.02 Jimenez, N.C.USA, 1994 480SL 14 dbp 118 hay < 0.01 < 0.01 < 0.01 < 0.02 1995 Indiana 240SL #133 (-) 1995/5298 615-01 Soya bean 480SL foliar 0.560 pre-plant 1 66 forage < 0.01 < 0.01 < 0.01 < 0.02 Jimenez, N.C.USA, 1994 14 dbp 107 hay < 0.01 < 0.01 0.02 <.0.02 1995 Indiana (control) < 0.01 < 0.01 0.02 < 0.02 #133 (-) 1995/5298 615-02 Soya bean 480SL foliar 0.560 pre-plant 2 55 forage < 0.01 < 0.01 < 0.01 < 0.02 Jimenez, N.C.USA, 1994 14 dbp 141 hay < 0.01 < 0.01 < 0.01 < 0.02 1995 Mississippi #133 (-) 1995/5298 618-01 Soya bean 480SL foliar 0.560 pre-plant 2 49 forage < 0.01 < 0.01 < 0.01 < 0.02 Jimenez, N.C.USA, 1994 14 dbp 125 hay < 0.01 < 0.01 < 0.01 < 0.02 1995 Tennessee #133 (-) 1995/5298 621-01 Soya bean 480SL foliar 0.560 pre-plant 1 52 forage 0.07 < 0.01 0.017 0.08 Jimenez, N.C.USA, 1994 480SL 14 dbp 114 hay < 0.01 < 0.01 < 0.01 < 0.02 1995 Illinois 240SL #133 (-) 1995/5298 624-01 Soya bean 480SL foliar 0.560 pre-plant 1 50 forage < 0.01 < 0.01 < 0.01 < 0.02 Jimenez, N.C.USA, 1994 14 dbp 134 hay < 0.01 < 0.01 0.02 < 0.02 1995 Illinois #133 (-) 1995/5298 624-02

Dicamba 1045
CROP Country, Year Location (variety) Trial No.
Application
PHI(d)
Portion analysed
Residues (mg/kg)Author Report Year Study No. DocID.
Formulation Method Rate (kg ai/ha)
Growthstage (BBCH)
No. Dicamba5-OH dicamba
DCSA Total*
Soya bean 480SL foliar 0.560 pre-plant 1 58 forage < 0.01 < 0.01 < 0.01 < 0.02 Jimenez, N.C.USA, 1994 14 dbp 126 hay < 0.01 < 0.01 < 0.01 < 0.02 1995 Georgia #133 (-) 1995/5298 664-01 Soya bean 480SL foliar 0.560 pre-plant 1 50 forage < 0.01 < 0.01 < 0.01 < 0.02 Jimenez, N.C.USA, 1994 14 dbp 1995 Arkansas #133 (-) 1995/5298 665-01 Soya bean 480SL foliar 0.560 pre-plant 1 57 forage < 0.01 < 0.01 < 0.01 < 0.02 Jimenez, N.C.USA, 1994 14 dbp 114 hay < 0.01 < 0.01 < 0.01 < 0.02 1995 Ohio #133 (-) 1995/5298 667-01 Soya bean 480SL foliar 0.560 pre-plant 1 60 forage < 0.01 < 0.01 < 0.01 < 0.02 Jimenez, N.C.USA, 1994 14 dbp 121 hay < 0.01 < 0.01 < 0.01 < 0.02 1995 Missouri #133 (-) 1995/5298 668-01 Soya bean 480SL foliar 0.560 pre-plant 1 62 forage < 0.01 < 0.01 < 0.01 < 0.02 Jimenez, N.C.USA, 1994 14 dbp 117 hay < 0.01 < 0.01 < 0.01 < 0.02 1995 Missouri #133 (-) 1995/5298 668-02 Soya bean 480SL foliar 0.560 pre-plant 1 64 forage < 0.01 < 0.01 < 0.01 < 0.02 Jimenez, N.C.USA, 1994 480SL 14 dbp 133 hay < 0.01 0.01 0.01 0.02 1995 Iowa 240SL (control) < 0.01 < 0.01 0.05 < 0.02 #133 (-) 1995/5298 669-01 Soya bean 480SL foliar 0.560 pre-plant 1 49 forage < 0.01 < 0.01 < 0.01 < 0.02 Jimenez, N.C.USA, 1994 14 dbp 112 hay < 0.01 < 0.01 < 0.01 < 0.02 1995 Louisiana #133 (-) 1995/5298 672-01
Soya bean 480SL
foliar 0.560 pre-plant 1 53 forage < 0.01 < 0.01 < 0.01 < 0.02 Guirguis, M.J.
USA, 1995 14 dbp 114 hay < 0.01 < 0.01 < 0.01 < 0.02 1996 North Carolina #147 (-) 1996/531201-612-01
Soya bean 480SL
foliar 0.560 pre-plant 1 52 forage 0.05 < 0.01 < 0.01 0.06 Guirguis, M.J.
USA, 1995 14 dbp 88 hay < 0.01 < 0.01 < 0.01 < 0.02 1996 Illinois #147 (-) 1996/5312 01-624-01
Soya bean 480SL
foliar 0.560 pre-plant 1 63 forage < 0.01 < 0.01 0.02 < 0.02 Guirguis, M.J.
USA, 1995 14 dbp 108 hay < 0.01 < 0.01 < 0.01 < 0.02 1996 Missouri #147 (-) 1996/5312 01-668-01
Soya bean 480SL
foliar 0.560 pre-plant 1 61 forage < 0.01 < 0.01 0.02 < 0.02 Guirguis, M.J.
USA, 1995 14 dbp 92 hay < 0.01 < 0.01 < 0.01 < 0.02 1996 Iowa #147 (-) 1996/5312 01-669-01

1046 Dicamba
CROP Country, Year Location (variety) Trial No.
Application
PHI(d)
Portion analysed
Residues (mg/kg)Author Report Year Study No. DocID.
Formulation Method Rate (kg ai/ha)
Growthstage (BBCH)
No. Dicamba5-OH dicamba
DCSA Total*
Soya bean 480SL
foliar 0.560 pre-plant 1 59 forage < 0.01 < 0.01 0.02 < 0.02 Guirguis, M.J.
USA, 1995 14 dbp 110 hay < 0.01 < 0.01 < 0.01 < 0.02 1996 Indiana #147 (-) 1996/5312 02-615-01
Soya bean 480SL
foliar 0.560 pre-plant 1 65 forage < 0.01 < 0.01 0.01 < 0.02 Guirguis, M.J.
USA, 1995 14 dbp 112 hay < 0.01 < 0.01 < 0.01 < 0.02 1996 Illinois #147 (-) 1996/5312 02-624-01
* Dicamba + 5-OH dicamba; highest residue is taken into consideration in case different salt formulations of dicamba are applied side-by-side
Barley and wheat straw
Table 83 Residues of dicamba and 5-OH dicamba from supervised trials on barley in the USA
CROP Country, Year Location (variety) Trial No.
Application
PHI(d)
Portion analysed
Residues (mg/kg) Author Report Year Study No. DocID.
Formulation Method Rate (kg ai/ha]
Growth stage (BBCH)
No. Dicamba5-OH dicamba
Total*
barley 240SL foliar 0.14 + first 2 7 straw 6.60 0.55 7.15 Jiminez, N. C USA, 1995 0.28 jointing 1996 California and 146 (Fiesta) 7 dbh 1996/5314 106/95/01-660-01
barley 240SL foliar 0.14 + first 2 7 straw 3.64 0.29 3.93 Jiminez, N. C USA, 1995 0.28 jointing 1996 Oregon and 146 (Steptoe) 7 dbh 1996/5314 106/95/01-631-02
barley 240SL foliar 0.14 + first 2 5 straw 1.02 0.06 1.08 Jiminez, N. C USA, 1995 0.28 jointing 1996 Pennsylvania and 146 (Ontario) 7 dbh 1996/5314 106/95/01-671-01
barley 240SL foliar 0.14 + first 2 14 straw 2.98 0.19 3.17 Jiminez, N. C USA, 1995 0.28 jointing 1996 South Dakota and 146 (Stander) 7 dbh 1996/5314 106/95/01-611-01
barley 240SL foliar 0.14 + first 2 7 straw 30.02 0.06 30.08 Jiminez, N. C USA, 1995 0.28 jointing 1996 South Dakota and 146 (Stander) 7 dbh 1996/5314106/95/01-611-02
barley 240SL foliar 0.14 + first 2 7 straw 5.52 0.01 5.53 Jiminez, N. C USA, 1995 0.28 jointing 1996 Utah and 146 (Russell) 7 dbh 1996/5314

Dicamba 1047
CROP Country, Year Location (variety) Trial No.
Application
PHI(d)
Portion analysed
Residues (mg/kg) Author Report Year Study No. DocID.
Formulation Method Rate (kg ai/ha]
Growth stage (BBCH)
No. Dicamba5-OH dicamba
Total*
106/95/01-631-01
barley 240SL foliar 0.14 + first 2 7 straw 3.11 0.37 3.48 Jiminez, N. C USA, 1995 480SL 0.28 jointing 1996 Idaho 240SL and 146 (Colter) 7 dbh 1996/5314 106/95/01-631-03
barley 240SL foliar 0.14 + first 2 7 straw 3.67 2.06 5.72 Jiminez, N. C USA, 1995 480SL 0.28 jointing 1996 Minnesota 240SL and 146 (Stander) 7 dbh 1996/5314 106/95/01-611-02
barley 240SL foliar 0.14 + first 2 9 straw 10.47 0.05 10.52 Jiminez, N. C USA, 1995 480SL 0.28 jointing 1996 Montana 240SL and 146 (Piroline) 7 dbh 1996/5314106/95/01-661-01
barley 240SL foliar 0.14 + first 2 7 straw 3.55 0.89 4.45 Jiminez, N. C USA, 1995 480SL 0.28 jointing 1996 North Dakota 240SL and 146 (Robust) 7 dbh 1996/5314 106/95/01-611-03
barley 240SL foliar 0.14 + first 2 7 straw 2.46 0.39 2.85 Jiminez, N. C USA, 1995 0.28 jointing 1996 North Dakota and 146 (Stander) 7 dbh 1996/5314 106/95/01-611-01
* Dicamba + 5-OH dicamba; highest residue is taken into consideration in case different salt formulations of dicamba are applied side-by-side
dbh = days before harvest
Table 84 Residues of dicamba and 5-OH dicamba from supervised trials on wheat in the USA
CROP Country, Year Location (variety) Trial No.
Application
PHI(d)
Portion analysed
Residues (mg/kg) Author Report Year Study No. DocID.
Formulation Method Rate (kg ai/ha]
Growth stage (BBCH)
No. Dicamba5-OH dicamba
Total*
wheat 240SL foliar 0.14 + first 2 7 straw 7.30 0.63 7.93 Jimenez, N. C USA, 1995 0.28 jointing 1996 Colorado + 145 (Yuma) 7 dbh 1996/5305 103/95/01-602-04
wheat 240SL foliar 0.14 + first 2 7 straw 5.00 0.67 5.67 Jimenez, N. C USA, 1995 0.28 jointing 1996 Idaho + 145 (Serra hard red) 7 dbh 1996/5305 103/95/01-631-01

1048 Dicamba
CROP Country, Year Location (variety) Trial No.
Application
PHI(d)
Portion analysed
Residues (mg/kg) Author Report Year Study No. DocID.
Formulation Method Rate (kg ai/ha]
Growth stage (BBCH)
No. Dicamba5-OH dicamba
Total*
wheat 240SL foliar 0.14 + first 2 6 straw 0.60 0.20 0.80 Jimenez, N. C USA, 1995 0.28 jointing 1996 Illinois + 145 (Pioneer 2552) 7 dbh 1996/5305 103/95/01-624-01
wheat 240SL foliar 0.14 + first 2 7 straw 2.40 1.70 4.10 Jimenez, N. C USA, 1995 0.28 jointing 1996 Minnesota + 145 (2375 hard red) 7 dbh 1996/5305 103/95/01-611-01
wheat 240SL foliar 0.14 + first 2 7 straw 2.40 0.17 2.57 Jimenez, N. CUSA, 1995 0.28 jointing 1996 Mississippi + 145 (Caldwell) 7 dbh 1996/5305 103/95/01-620-01
wheat 240SL foliar 0.14 + first 2 9 straw 0.40 0.48 0.88 Jimenez, N. C USA, 1995 0.28 jointing 1996 Missouri + 145 (Pioneer 2571) 7 dbh 1996/5305 103/95/01-668-01
wheat 240SL foliar 0.14 + first 2 10 straw 7.30 0.38 7.68 Jimenez, N. C USA, 1995 0.28 jointing 1996 Nebraska + 145 (Arapahoe) 7 dbh 1996/5305 103/95/01-602-01
wheat 240SL foliar 0.14 + first 2 7 straw 21.00 0.74 21.74 Jimenez, N. C USA, 1995 0.28 jointing 1996 New Mexico + 145 (TAM205) 7 dbh 1996/5305 103/95/01-602-03
wheat 240SL foliar 0.14 + first 2 8 straw 2.20 0.68 2.88 Jimenez, N. CUSA, 1995 0.28 jointing 1996 Ohio + 145 (Madison GL 9420)
7 dbh
1996/5305
103/95/01-667-01
wheat 240SL foliar 0.14 + first 2 7 straw 3.20 0.66 3.86 Jimenez, N. C USA, 1995 0.28 jointing 1996 Wyoming + 145 (Serra hard red) 7 dbh 1996/5305 103/95/01-602-02
wheat 240SL foliar 0.14 + first 2 9 straw 1.40 0.10 1.50 Jimenez, N. C USA, 1995 0.28 jointing 1996 Kansas + 145 (Karl) 7 dbh 1996/5305 103/95/01-606-01
wheat 240SL foliar 0.14 + first 2 7 straw 4.00 0.25 4.25 Jimenez, N. C USA, 1995 0.28 jointing 1996 Montana + 145 (Judith) 7 dbh 1996/5305 103/95/01-611-02

Dicamba 1049
CROP Country, Year Location (variety) Trial No.
Application
PHI(d)
Portion analysed
Residues (mg/kg) Author Report Year Study No. DocID.
Formulation Method Rate (kg ai/ha]
Growth stage (BBCH)
No. Dicamba5-OH dicamba
Total*
wheat 240SL foliar 0.14 + first 2 9 straw 5.20 0.25 5.45 Jimenez, N. C USA, 1995 0.28 jointing 1996 Montana + 145 (Grandin) 7 dbh 1996/5305 103/95/01-661-01
wheat 240SL foliar 0.14 + first 2 7 straw 23.00 0.19 23.19 Jimenez, N. C USA, 1995 0.28 jointing 1996 Oklahoma + 145 (Pioneer 2158) 7 dbh 1996/5305 103/95/01-616-01
wheat 240SL foliar 0.14 + first 2 7 straw 5.30 0.35 5.65 Jimenez, N. CUSA, 1995 480SL 0.28 jointing 1996 Kansas 240SL + 145 (Karl) 7 dbh 1996/5305 103/95/01-606-02
wheat 240SL foliar 0.14 + first 2 12 straw 0.29 0.02 0.31 Jimenez, N. C USA, 1995 480SL 0.28 jointing 1996 North Carolina 240SL + 145 (Coker 916) 7 dbh 1996/5305 103/95/01-612-01
wheat 240SL foliar 0.14 + first 2 7 straw 7.10 0.73 7.83 Jimenez, N. C USA, 1995 480SL 0.28 jointing 1996 North Dakota 240SL + 145 (2375) 7 dbh 1996/5305 103/95/01-611-03
wheat 240SL foliar 0.14 + first 2 7 straw 1.10 0.01 1.11 Jimenez, N. C USA, 1995 480SL 0.28 jointing 1996 Texas 240SL + 145 (TAM107) 7 dbh 1996/5305 103/95/01-616-02
wheat 240SL foliar 0.14 + first 2 7 straw 4.40 0.67 5.07 Jimenez, N. C USA, 1995 0.28 jointing 1996 Colorado + 145 (Quantum 566) 7 dbh 1996/5305103/95/02-602-01
wheat 240SL foliar 0.14 + first 2 7 straw 3.60 0.24 3.84 Jimenez, N. C USA, 1995 0.28 jointing 1996 Oklahoma + 145 (Karl) 7 dbh 1996/5305 103/95/02-616-01
* Dicamba + 5-OH dicamba + DCSA; highest residue is taken into consideration in case different salt formulations of dicamba are applied side-by-side
dbh = days before harvest
Hay or fodder (dry) of grasses
Grass forage and hay samples were collected at 0, 7, 14, 21 and 56 days after treatment to actively growing grass. Hay samples were allowed to dry in the field for 2–3 days before sampling. Therefore, residues in these commodities came from post-emergent application.
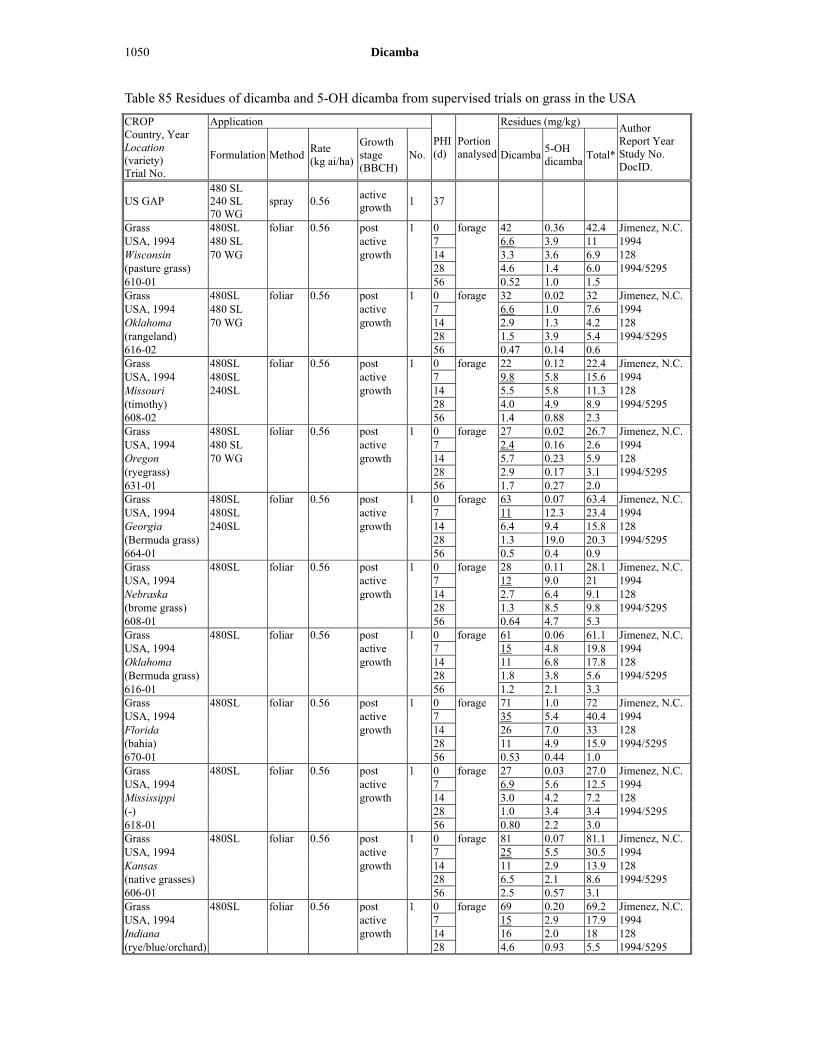
1050 Dicamba
Table 85 Residues of dicamba and 5-OH dicamba from supervised trials on grass in the USA
CROP Country, Year Location (variety) Trial No.
Application
PHI(d)
Portion analysed
Residues (mg/kg) Author Report Year Study No. DocID.
Formulation Method Rate (kg ai/ha)
Growth stage (BBCH)
No. Dicamba5-OH dicamba
Total*
US GAP 480 SL 240 SL 70 WG
spray 0.56
active growth
1 37
Grass 480SL foliar 0.56 post 1 0 forage 42 0.36 42.4 Jimenez, N.C. USA, 1994 480 SL active 7 6.6 3.9 11 1994 Wisconsin 70 WG growth 14 3.3 3.6 6.9 128 (pasture grass) 28 4.6 1.4 6.0 1994/5295 610-01 56 0.52 1.0 1.5 Grass 480SL foliar 0.56 post 1 0 forage 32 0.02 32 Jimenez, N.C. USA, 1994 480 SL active 7 6.6 1.0 7.6 1994 Oklahoma 70 WG growth 14 2.9 1.3 4.2 128 (rangeland) 28 1.5 3.9 5.4 1994/5295 616-02 56 0.47 0.14 0.6 Grass 480SL foliar 0.56 post 1 0 forage 22 0.12 22.4 Jimenez, N.C. USA, 1994 480SL active 7 9.8 5.8 15.6 1994 Missouri 240SL growth 14 5.5 5.8 11.3 128 (timothy) 28 4.0 4.9 8.9 1994/5295 608-02 56 1.4 0.88 2.3 Grass 480SL foliar 0.56 post 1 0 forage 27 0.02 26.7 Jimenez, N.C. USA, 1994 480 SL active 7 2.4 0.16 2.6 1994 Oregon 70 WG growth 14 5.7 0.23 5.9 128 (ryegrass) 28 2.9 0.17 3.1 1994/5295 631-01 56 1.7 0.27 2.0 Grass 480SL foliar 0.56 post 1 0 forage 63 0.07 63.4 Jimenez, N.C. USA, 1994 480SL active 7 11 12.3 23.4 1994 Georgia 240SL growth 14 6.4 9.4 15.8 128 (Bermuda grass) 28 1.3 19.0 20.3 1994/5295 664-01 56 0.5 0.4 0.9 Grass 480SL foliar 0.56 post 1 0 forage 28 0.11 28.1 Jimenez, N.C. USA, 1994 active 7 12 9.0 21 1994 Nebraska growth 14 2.7 6.4 9.1 128 (brome grass) 28 1.3 8.5 9.8 1994/5295 608-01 56 0.64 4.7 5.3 Grass 480SL foliar 0.56 post 1 0 forage 61 0.06 61.1 Jimenez, N.C.USA, 1994 active 7 15 4.8 19.8 1994 Oklahoma growth 14 11 6.8 17.8 128 (Bermuda grass) 28 1.8 3.8 5.6 1994/5295 616-01 56 1.2 2.1 3.3 Grass 480SL foliar 0.56 post 1 0 forage 71 1.0 72 Jimenez, N.C. USA, 1994 active 7 35 5.4 40.4 1994 Florida growth 14 26 7.0 33 128 (bahia) 28 11 4.9 15.9 1994/5295 670-01 56 0.53 0.44 1.0 Grass 480SL foliar 0.56 post 1 0 forage 27 0.03 27.0 Jimenez, N.C.USA, 1994 active 7 6.9 5.6 12.5 1994 Mississippi growth 14 3.0 4.2 7.2 128 (-) 28 1.0 3.4 3.4 1994/5295 618-01 56 0.80 2.2 3.0 Grass 480SL foliar 0.56 post 1 0 forage 81 0.07 81.1 Jimenez, N.C. USA, 1994 active 7 25 5.5 30.5 1994 Kansas growth 14 11 2.9 13.9 128 (native grasses) 28 6.5 2.1 8.6 1994/5295 606-01 56 2.5 0.57 3.1 Grass 480SL foliar 0.56 post 1 0 forage 69 0.20 69.2 Jimenez, N.C.USA, 1994 active 7 15 2.9 17.9 1994 Indiana growth 14 16 2.0 18 128 (rye/blue/orchard) 28 4.6 0.93 5.5 1994/5295

Dicamba 1051
CROP Country, Year Location (variety) Trial No.
Application
PHI(d)
Portion analysed
Residues (mg/kg) Author Report Year Study No. DocID.
Formulation Method Rate (kg ai/ha)
Growth stage (BBCH)
No. Dicamba5-OH dicamba
Total*
615-01 56 3.0 0.30 3.3 Grass 480SL foliar 0.56 post 1 0 forage 20 0.89 21 Jimenez, N.C. USA, 1994 active 7 2.2 2.8 5.0 1994 Tennessee growth 14 2.5 3.4 5.9 128 (Bermuda grass) 28 0.71 1.0 1.7 1994/5295 621-01 56 0.74 0.81 1.6 Grass 480SL foliar 0.56 post 1 0 forage 35 2.9 37.9 Jimenez, N.C. USA, 1994 active 7 11 11 22 1994 Texas growth 14 4.5 6.2 10.7 128 (Bermuda grass) 28 1.9 2.4 4.3 1994/5295 617-01 56 3.2 4.1 7.3 Grass 480SL foliar 0.56 post 1 0 hay 260 14.7 274.7 Jimenez, N.C. USA, 1994 480 SL active 7 20 12.7 32.7 1994 Wisconsin 70 WG growth 14 2.6 3.1 5.7 128 (pasture grass) 28 3.4 5.8 9.2 1994/5295610-01 56 0.68 1.4 2.1 Grass 480SL foliar 0.56 post 1 0 hay 48.3 1.0 49.3 Jimenez, N.C. USA, 1994 480 SL active 7 21 2.8 23.8 1994 Oklahoma 70 WG growth 14 5.9 3.4 9.3 128 (rangeland) 28 8.3 2.0 10.3 1994/5295 616-02 56 0.46 0.12 0.6 Grass 480SL foliar 0.56 post 1 0 hay 40.7 0.25 41 Jimenez, N.C. USA, 1994 480SL active 7 7.5 5.6 13.1 1994 Missouri 240SL growth 14 8.2 9.7 17.9 128 (timothy) 28 4.0 2.6 6.6 1994/5295608-02 56 2.8 1.3 4.1 Grass 480SL foliar 0.56 post 1 0 hay 11.4 0.17 11.6 Jimenez, N.C. USA, 1994 480 SL active 7 6.0 0.22 6.2 1994 Oregon 70 WG growth 14 3.8 0.09 3.9 128 (ryegrass) 28 6.3 0.3 6.6 1994/5295 631-01 56 2.4 0.08 2.5 Grass 480SL foliar 0.56 post 1 0 hay 70.7 1.4 72.1 Jimenez, N.C. USA, 1994 480SL active 7 16.7 10.9 27.6 1994 Georgia 240SL growth 14 7.9 6.6 14.5 128 (Bermuda grass) 28 2.9 3.7 6.6 1994/5295 664-01 56 0.24 0.29 0.5 Grass 480SL foliar 0.56 post 1 0 hay 54 3.4 57.4 Jimenez, N.C. USA, 1994 active 7 12 19 31 1994 Nebraska growth 14 4.5 15 19.5 128 (brome grass) 28 1.4 13 14.4 1994/5295 608-01 56 0.74 4.9 5.6 Grass 480SL foliar 0.56 post 1 0 hay 101 0.20 101.2 Jimenez, N.C. USA, 1994 active 7 30 13 43 1994 Oklahoma growth 14 15 9.8 24.8 128 (Bermuda grass) 28 6.8 13 19.8 1994/5295 616-01 56 0.88 1.4 2.5 Grass 480SL foliar 0.56 post 1 0 hay 76 1.3 77.3 Jimenez, N.C. USA, 1994 active 7 36 8.0 44 1994 Florida growth 14 38 9.8 47.8 128 (bahia) 28 19 7.8 26.8 1994/5295 670-01 56 1.6 1.4 3.0 Grass 480SL foliar 0.56 post 1 0 hay 44 1.4 45.4 Jimenez, N.C. USA, 1994 active 7 11 6.3 17.3 1994 Mississippi growth 14 3.7 4.1 7.9 128 (-) 28 3.1 8.4 11.5 1994/5295 618-01 56 1.2 1.0 2.2 Grass 480SL foliar 0.56 post 1 0 hay 49 5.1 54.1 Jimenez, N.C. USA, 1994 active 7 28 5.8 33.8 1994 Kansas growth 14 18 4.9 22.9 128

1052 Dicamba
CROP Country, Year Location (variety) Trial No.
Application
PHI(d)
Portion analysed
Residues (mg/kg) Author Report Year Study No. DocID.
Formulation Method Rate (kg ai/ha)
Growth stage (BBCH)
No. Dicamba5-OH dicamba
Total*
(native grasses) 28 8.6 2.6 11.2 1994/5295 606-01 56 2.4 0.44 2.8 Grass 480SL foliar 0.56 post 1 0 hay 102 2.5 104.5 Jimenez, N.C. USA, 1994 active 7 310 23 333 1994 Indiana growth 14 48 6.4 54.4 128 (rye/blue/orchard) 28 16 1.6 17.6 1994/5295 615-01 56 2.6 0.6 3.2 Grass 480SL foliar 0.56 post 1 0 hay 5.0 0.67 5.7 Jimenez, N.C. USA, 1994 active 7 5.9 4.8 10.7 1994 Tennessee growth 14 3.5 4.1 7.6 128 (Bermuda grass) 28 3.2 2.8 6.0 1994/5295621-01 56 0.96 0.87 2.7 Grass 480SL foliar 0.56 post 1 0 hay 77 4.2 81.2 Jimenez, N.C. USA, 1994 post 7 21 17 38 1994 Texas active 14 11 13 24 128 (Bermuda grass) growth 28 6.9 11 17.9 1994/5295 617-01 56 2.9 3.6 6.5
Forage and fodder of maize (field corn) and sweet corn
Table 86 Residues of dicamba and 5-OH dicamba from supervised trials on maize (field corn) and sweet corn in the USA
CROP Country, Year Location (variety) Trial No.
Application
PHI(d)
Portion analysed
Residues (mg/kg) Author Report Year Study No. DocID.
Formulation Method Rate (kg ai/ha]
Growth stage (BBCH)
No. Dicamba5-OH dicamba
Total*
field corn 240SL foliar 2.24 + Previous 1 117 forage 0.07 0.48 0.55 Jimenez, N. C USA, 1995 0.56 + fall + fodder 0.08 0.02 0.10 1996 Illinois 0.28 (fallow) + 2 149 (Golden Harvest 2458)
8“ tall +
1996/5331
104/95/01-624-01
36“ tall
field corn 240SL foliar 2.24 + Previous 1 99 forage 0.09 0.62 0.72 Jimenez, N. C USA, 1995 0.56 + fall + fodder 0.03 0.13 0.16 1996 Iowa 0.28 (fallow) + 2 149 (Querna 7670) 8“ tall + 1996/5331104/95/01-669-01
36“ tall
field corn 240SL foliar 2.24 + Previous 1 66 forage 0.16 0.87 1.03 Jimenez, N. C USA, 1995 0.56 + fall + fodder 0.24 0.35 0.59 1996 Kansas 0.28 (fallow) + 2 149 (Asgrow RX623)
8“ tall +
1996/5331
104/95/01-606-01
36“ tall
field corn 240SL foliar 2.24 + Previous 1 110 forage 0.07 0.54 0.61 Jimenez, N. C USA, 1995 0.56 + fall + fodder 0.01 0.01 0.02 1996 Kentucky 0.28 (fallow) + 2 149 (Pioneer 3140) 8“ tall + 1996/5331 104/95/01-621-01
36“ tall
field corn 240SL foliar 2.24 + Previous 1 123 forage 0.10 0.44 0.54 Jimenez, N. C USA, 1995 0.56 + fall + fodder 0.04 0.15 0.19 1996 Michigan 0.28 (fallow) + 2 149 (Great Lakes 450)
8“ tall +
1996/5331
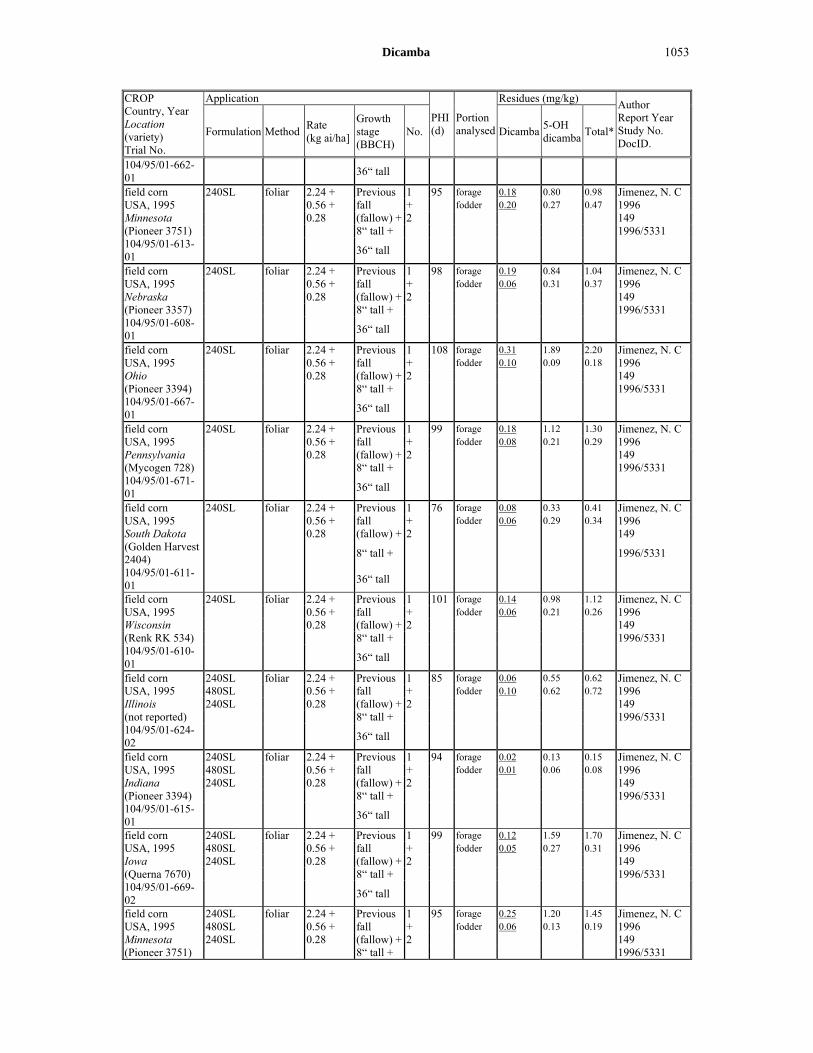
Dicamba 1053
CROP Country, Year Location (variety) Trial No.
Application
PHI(d)
Portion analysed
Residues (mg/kg) Author Report Year Study No. DocID.
Formulation Method Rate (kg ai/ha]
Growth stage (BBCH)
No. Dicamba5-OH dicamba
Total*
104/95/01-662-01
36“ tall
field corn 240SL foliar 2.24 + Previous 1 95 forage 0.18 0.80 0.98 Jimenez, N. C USA, 1995 0.56 + fall + fodder 0.20 0.27 0.47 1996 Minnesota 0.28 (fallow) + 2 149 (Pioneer 3751) 8“ tall + 1996/5331 104/95/01-613-01
36“ tall
field corn 240SL foliar 2.24 + Previous 1 98 forage 0.19 0.84 1.04 Jimenez, N. C USA, 1995 0.56 + fall + fodder 0.06 0.31 0.37 1996 Nebraska 0.28 (fallow) + 2 149 (Pioneer 3357) 8“ tall + 1996/5331 104/95/01-608-01
36“ tall
field corn 240SL foliar 2.24 + Previous 1 108 forage 0.31 1.89 2.20 Jimenez, N. C USA, 1995 0.56 + fall + fodder 0.10 0.09 0.18 1996 Ohio 0.28 (fallow) + 2 149 (Pioneer 3394) 8“ tall + 1996/5331104/95/01-667-01
36“ tall
field corn 240SL foliar 2.24 + Previous 1 99 forage 0.18 1.12 1.30 Jimenez, N. C USA, 1995 0.56 + fall + fodder 0.08 0.21 0.29 1996 Pennsylvania 0.28 (fallow) + 2 149 (Mycogen 728) 8“ tall + 1996/5331 104/95/01-671-01
36“ tall
field corn 240SL foliar 2.24 + Previous 1 76 forage 0.08 0.33 0.41 Jimenez, N. C USA, 1995 0.56 + fall + fodder 0.06 0.29 0.34 1996 South Dakota 0.28 (fallow) + 2 149 (Golden Harvest 2404)
8“ tall +
1996/5331
104/95/01-611-01
36“ tall
field corn 240SL foliar 2.24 + Previous 1 101 forage 0.14 0.98 1.12 Jimenez, N. C USA, 1995 0.56 + fall + fodder 0.06 0.21 0.26 1996 Wisconsin 0.28 (fallow) + 2 149 (Renk RK 534) 8“ tall + 1996/5331 104/95/01-610-01
36“ tall
field corn 240SL foliar 2.24 + Previous 1 85 forage 0.06 0.55 0.62 Jimenez, N. CUSA, 1995 480SL 0.56 + fall + fodder 0.10 0.62 0.72 1996 Illinois 240SL 0.28 (fallow) + 2 149 (not reported) 8“ tall + 1996/5331 104/95/01-624-02
36“ tall
field corn 240SL foliar 2.24 + Previous 1 94 forage 0.02 0.13 0.15 Jimenez, N. C USA, 1995 480SL 0.56 + fall + fodder 0.01 0.06 0.08 1996 Indiana 240SL 0.28 (fallow) + 2 149 (Pioneer 3394) 8“ tall + 1996/5331 104/95/01-615-01
36“ tall
field corn 240SL foliar 2.24 + Previous 1 99 forage 0.12 1.59 1.70 Jimenez, N. CUSA, 1995 480SL 0.56 + fall + fodder 0.05 0.27 0.31 1996 Iowa 240SL 0.28 (fallow) + 2 149 (Querna 7670) 8“ tall + 1996/5331 104/95/01-669-02
36“ tall
field corn 240SL foliar 2.24 + Previous 1 95 forage 0.25 1.20 1.45 Jimenez, N. C USA, 1995 480SL 0.56 + fall + fodder 0.06 0.13 0.19 1996 Minnesota 240SL 0.28 (fallow) + 2 149 (Pioneer 3751) 8“ tall + 1996/5331

1054 Dicamba
CROP Country, Year Location (variety) Trial No.
Application
PHI(d)
Portion analysed
Residues (mg/kg) Author Report Year Study No. DocID.
Formulation Method Rate (kg ai/ha]
Growth stage (BBCH)
No. Dicamba5-OH dicamba
Total*
104/95/01-613-02
36“ tall
field corn 240SL foliar 2.24 + Previous 1 100 forage 0.30 1.97 2.27 Jimenez, N. C USA, 1995 480SL 0.56 + fall + fodder 0.33 2.03 2.35 1996 Missouri 240SL 0.28 (fallow) + 2 149 (Pioneer 3394) 8“ tall + 1996/5331 104/95/02-668-01
36“ tall
field corn 240SL foliar 2.24 + Previous 1 100 forage 0.30 1.80 2.10 Jimenez, N. C USA, 1995 480SL 0.56 + fall + fodder 0.06 0.58 0.64 1996 Nebraska 240SL 0.28 (fallow) + 2 149 (Pioneer 3162) 8“ tall + 1996/5331 104/95/01-608-02
36“ tall
field corn 240SL foliar 2.24 + Previous 1 76 forage 0.16 0.92 1.07 Jimenez, N. C USA, 1995 480SL 0.56 + fall + fodder 0.18 1.07 1.25 1996 North Carolina 240SL 0.28 (fallow) + 2 149 (Pioneer 3163) 8“ tall + 1996/5331 104/95/01-612-01
36“ tall
field corn 240SL foliar 2.24 + Previous 1 73 forage 0.20 1.53 1.72 Jimenez, N. C USA, 1995 480SL 0.56 + fall + fodder 0.13 0.99 1.11 1996 Oklahoma 240SL 0.28 (fallow) + 2 149 (Pioneer 3165) 8“ tall + 1996/5331 104/95/01-616-01
36“ tall
Sweet corn 500 WG Foliar 0.14 12“ + 24“ 2 50 forage < 0.02 0.02 0.04 Abdel-Baky, S.USA, 1996 240 SL fodder < 0.02 0.02 0.04 1998 Wisconsin 0.28 12“ + 24“ 2 forage 0.05 0.15 0.20 97152 (Northrup King, NK199)
fodder 0.07 0.17 0.23 1998/5077
608-01 Sweet corn 500 WG Foliar 0.14 12“ + 24“ 2 49 forage < 0.02 0.05 0.07 Abdel-Baky, S.USA, 1996 240 SL fodder < 0.02 0.02 0.04 1998 Minnesota 0.28 12“ + 24“ 2 forage < 0.02 0.06 0.08 97152 (Temptation, VNT583LF)
fodder < 0.02 0.02 0.04 1998/5077
613-03 Sweet corn 500 WG Foliar 0.14 12“ + 24“ 2 52 forage < 0.02 0.06 0.08 Abdel-Baky, S.USA, 1996 240 SL fodder < 0.02 < 0.02 < 0.04 1998 Indiana 0.28 12“ + 24“ 2 forage 0.02 0.16 0.19 97152 (Hybrid Bi Queen, NC4202MR)
fodder < 0.02 0.07 0.09 1998/5077
615-01 Sweet corn 500 WG Foliar 0.14 12“ + 24“ 2 61 forage < 0.02 0.04 0.06 Abdel-Baky, S.USA, 1996 240 SL fodder < 0.02 < 0.02 < 0.04 1998 Oregon 0.28 12“ + 24“ 2 forage 0.10 0.30 0.39 97152 (Golden Jubilee, NC4249)
fodder < 0.02 0.02 0.04 1998/5077
631-01 Sweet corn 500 WG Foliar 0.14 12“ + 24“ 2 21 forage 0.097 0.11 0.20 Abdel-Baky, S.USA, 1996 240 SL fodder < 0.02 0.02 0.04 1998 California 0.28 12“ + 24“ 2 forage 0.09 0.17 0.25 97152 (Silver Queen, CC5260)
forage 0.04 0.26 0.30 1998/5077
660-01 fodder 0.03 0.09 0.12 fodder 0.03 0.07 0.10 Sweet corn 500 WG Foliar 0.14 12“ + 24“ 2 36 forage 0.05 0.31 0.36 Abdel-Baky, S.USA, 1996 240 SL fodder 0.05 0.34 0.39 1998 Washington 0.28 12“ + 24“ 2 forage 0.14 0.92 1.06 97152

Dicamba 1055
CROP Country, Year Location (variety) Trial No.
Application
PHI(d)
Portion analysed
Residues (mg/kg) Author Report Year Study No. DocID.
Formulation Method Rate (kg ai/ha]
Growth stage (BBCH)
No. Dicamba5-OH dicamba
Total*
(Arnaize) fodder 0.08 0.59 0.67 1998/5077 661-01 Sweet corn 500 WG Foliar 0.14 12“ + 24“ 2 43 forage 0.02 0.07 0.09 Abdel-Baky, S.USA, 1996 240 SL 1998 Georgia 0.28 12“ + 24“ 2 forage 0.06 0.24 0.30 97152 (Snowbird/ Kandy King)
1998/5077
664-02 Sweet corn 500 WG Foliar 0.14 12“ + 24“ 2 31 forage 0.03 0.22 0.25 Abdel-Baky, S.USA, 1996 240 SL fodder 0.05 0.28 0.32 1998 Florida 0.28 12“ + 24“ 2 forage 0.22 1.47 1.70 97152 (Billy No. 1) fodder 0.27 1.50 1.77 1998/5077 670-01 Sweet corn 500 WG Foliar 0.14 12“ + 24“ 2 34 forage 0.04 0.18 0.21 Abdel-Baky, S.USA, 1996 240 SL fodder < 0.02 0.03 0.05 1998 New York 0.28 12“ + 24“ 2 forage 0.10 0.82 0.92 97152 (Tuxedo) fodder 0.03 0.09 0.13 1998/5077 671-01
* Dicamba + 5-OH dicamba; highest residue is taken into consideration in case different salt formulations of dicamba are applied side-by-side
dbh = days before harvest
Fodder of sorghum
Table 87 Residues of dicamba and 5-OH dicamba from supervised trials on sorghum in the USA
CROP Country, Year Location (variety) Trial No.
Application
PHI(d)
Portion analysed
Residues (mg/kg) Author Report Year Study No. DocID.
Formulation Method Rate (kg ai/ha)
Growth stage (BBCH)
No. Dicamba5-OH dicamba
Total*
sorghum Dicamba (Na+) WG
foliar 0.28 + 3 to 5 leaf 2 30 Fodder 0.81 1.45 2.26 Laban, S. L.
USA, 1992 Dicamba (DGA+) SL
0.28 stage Fodder 0.11 0.24 0.35 1994
Kansas Dicamba (K+) SL
+ Fodder 0.59 1.11 1.70 119
(not reported) Dicamba (DMA+) SL
soft dough
Fodder 0.42 0.70 1.12 1994/5220
1102106A stage
sorghum Dicamba (Na+) WG
foliar 0.28 + 3 to 5 leaf 2 42 Fodder 0.10 0.05 0.15 Laban, S. L.
USA, 1992 Dicamba (DGA+) SL
0.28 stage Fodder 0.17 0.10 0.27 1994
Missouri Dicamba (K+) SL
+ Fodder 0.31 0.13 0.44 119
(not reported) Dicamba (DMA+) SL
soft dough
Fodder 0.26 0.11 0.37 1994/5220
1102108A stage
sorghum Dicamba (Na+) WG
foliar 0.28 + 3 to 5 leaf 2 42 Fodder 0.12 0.04 0.16 Laban, S. L.
USA, 1992 Dicamba (DGA+) SL
0.28 stage Fodder 0.24 0.05 0.29 1994
Nebraska Dicamba (K+) SL
+ Fodder 0.098 0.03 0.13 119
(not reported) Dicamba (DMA+) SL
soft dough
Fodder 0.12 0.04 0.16 1994/5220
1102108B stage
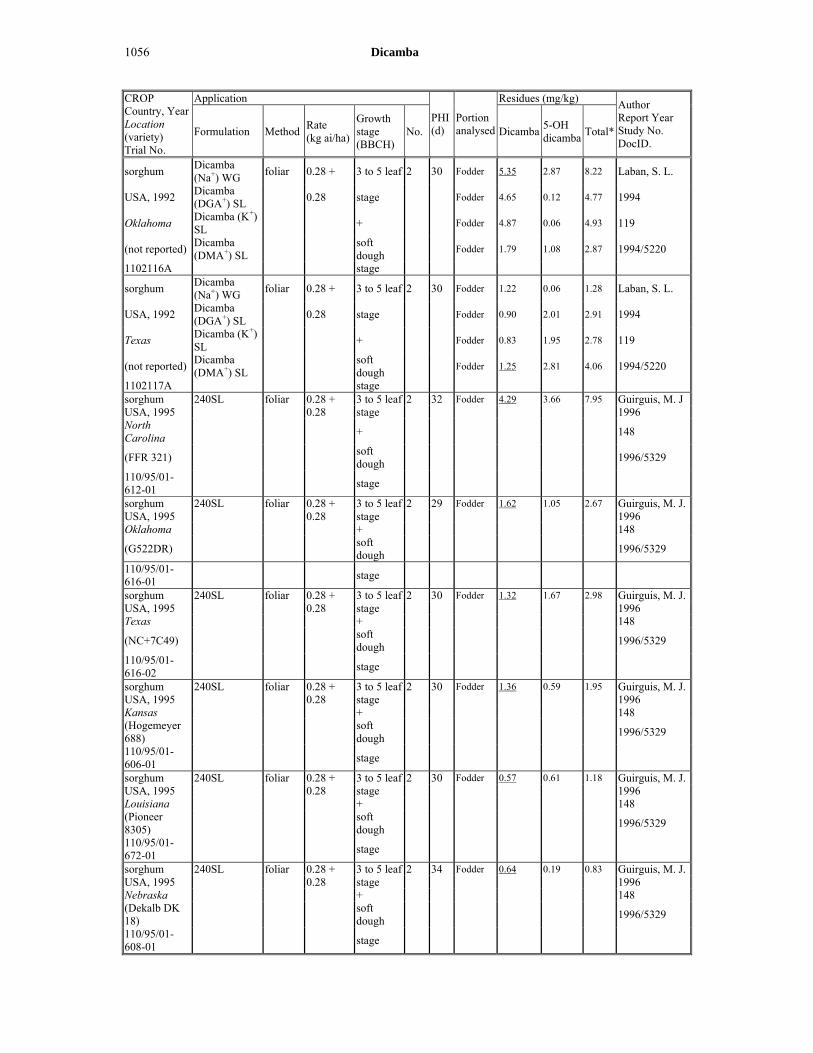
1056 Dicamba
CROP Country, Year Location (variety) Trial No.
Application
PHI(d)
Portion analysed
Residues (mg/kg) Author Report Year Study No. DocID.
Formulation Method Rate (kg ai/ha)
Growth stage (BBCH)
No. Dicamba5-OH dicamba
Total*
sorghum Dicamba (Na+) WG
foliar 0.28 + 3 to 5 leaf 2 30 Fodder 5.35 2.87 8.22 Laban, S. L.
USA, 1992 Dicamba (DGA+) SL
0.28 stage Fodder 4.65 0.12 4.77 1994
Oklahoma Dicamba (K+) SL
+ Fodder 4.87 0.06 4.93 119
(not reported) Dicamba (DMA+) SL
soft dough
Fodder 1.79 1.08 2.87 1994/5220
1102116A stage
sorghum Dicamba (Na+) WG
foliar 0.28 + 3 to 5 leaf 2 30 Fodder 1.22 0.06 1.28 Laban, S. L.
USA, 1992 Dicamba (DGA+) SL
0.28 stage Fodder 0.90 2.01 2.91 1994
Texas Dicamba (K+) SL
+ Fodder 0.83 1.95 2.78 119
(not reported) Dicamba (DMA+) SL
soft dough
Fodder 1.25 2.81 4.06 1994/5220
1102117A stage sorghum 240SL foliar 0.28 + 3 to 5 leaf 2 32 Fodder 4.29 3.66 7.95 Guirguis, M. J USA, 1995 0.28 stage 1996 North Carolina
+
148
(FFR 321) soft dough
1996/5329
110/95/01-612-01
stage
sorghum 240SL foliar 0.28 + 3 to 5 leaf 2 29 Fodder 1.62 1.05 2.67 Guirguis, M. J.USA, 1995 0.28 stage 1996 Oklahoma + 148
(G522DR) soft dough
1996/5329
110/95/01-616-01
stage
sorghum 240SL foliar 0.28 + 3 to 5 leaf 2 30 Fodder 1.32 1.67 2.98 Guirguis, M. J.USA, 1995 0.28 stage 1996 Texas + 148
(NC+7C49) soft dough
1996/5329
110/95/01-616-02
stage
sorghum 240SL foliar 0.28 + 3 to 5 leaf 2 30 Fodder 1.36 0.59 1.95 Guirguis, M. J.USA, 1995 0.28 stage 1996 Kansas + 148 (Hogemeyer 688)
soft dough
1996/5329
110/95/01-606-01
stage
sorghum 240SL foliar 0.28 + 3 to 5 leaf 2 30 Fodder 0.57 0.61 1.18 Guirguis, M. J.USA, 1995 0.28 stage 1996 Louisiana + 148 (Pioneer 8305)
soft dough
1996/5329
110/95/01-672-01
stage
sorghum 240SL foliar 0.28 + 3 to 5 leaf 2 34 Fodder 0.64 0.19 0.83 Guirguis, M. J.USA, 1995 0.28 stage 1996 Nebraska + 148 (Dekalb DK 18)
soft dough
1996/5329
110/95/01-608-01
stage

Dicamba 1057
* Dicamba + 5-OH dicamba; highest residue is taken into consideration in case different salt formulations of dicamba are applied side-by-side
dbh = days before harvest
Cotton gin trash
A total of 18 supervised field residue trials were conducted during the 1994 and 1998 growing seasons to determine residue levels of dicamba and 5-OH dicamba in the raw agricultural commodities, cotton seed and cotton gin trash (for seed, see Table 81).
Initially, 12 supervised field residue trials were conducted during the 1994 growing season; three trials in Texas, two in Mississippi, three in Louisiana, two in Arkansas, one in Alabama, and one in Tennessee.
Six additional supervised field residue trials were conducted during the 1998 growing season to provide cotton gin trash residue data resulting from a 2.24 kg ai/ha post harvest fall application of dicamba. Of the six trials, two trials were conducted in Oklahoma, two in Mississippi, one in California, and one in Texas.
Gin trash samples were analysed by method AM-0691B-0297-4. The mean dicamba recovery was 88 ± 14% (n = 9); the mean 5-OH dicamba recovery was 92 ± 21% (n = 9).
Because of the high LOQs of 0.04 and 0.05 mg/kg due to interference of co-extracted plant materials, and taking into consideration nil residue situation after pre-plant application, where both dicamba and 5-OH dicamba were < 0.04 or < 0.05 mg/kg, the total residues were calculated to be < 0.04 or < 0.05 mg/kg, respectively. When either dicamba or 5-OH dicamba was < 0.04 or < 0.05 mg/kg while the other was higher than the LOQ, residues at < 0.04 or < 0.05 mg/kg were assumed to be zero in calculating the total residues.
Table 88 Residues of dicamba and 5-OH dicamba from supervised trials on cotton in the USA
CROP Country, Year Location (variety) Trial No.
Application
PHI(d)
Portion analysed
Residues (mg/kg) Author Report Year Study No. DocID.
Formulation Method Rate (kg ai/ha)
Growth stage (BBCH)
No. Dicamba5-OH dicamba
Total*
cotton 240SL
pre plant
0.56 14 days 1 143 gin trash 0.05 < 0.04 0.05 Guirguis, M. J.
USA, 1994 pre plant 1995 Texas 137 DPL 20 1995/5297 108/94/01-617-01
cotton 240SL
pre plant
0.56 13 days 1 156 gin trash < 0.04 < 0.04 < 0.04 Guirguis, M. J.
USA, 1994 pre plant 1995 Texas 137 DPL 50 1995/5297 108/94/01-617-02
cotton 240SL
pre plant
0.56 14 days 1 187 gin trash < 0.04 < 0.04 < 0.04 Guirguis, M. J.
USA, 1994 pre plant 1995 Texas 137 Paymaster HS 200
1995/5297
108/94/01-616-01

1058 Dicamba
CROP Country, Year Location (variety) Trial No.
Application
PHI(d)
Portion analysed
Residues (mg/kg) Author Report Year Study No. DocID.
Formulation Method Rate (kg ai/ha)
Growth stage (BBCH)
No. Dicamba5-OH dicamba
Total*
cotton 240SL
pre plant
0.56 15 days 1 146 gin trash 0.05 < 0.04 0.05 Guirguis, M. J.
USA, 1994 pre plant 1995 Mississippi 137 DPL 50 1995/5297 108/94/01-618-01
cotton 240SL
pre plant
0.56 16 days 1 189 gin trash < 0.04 < 0.04 < 0.04 Guirguis, M. J.
USA, 1994 pre plant 1995 Mississippi 137 LA 877 1995/5297 108/94/01-618-02
cotton 240SL
pre plant
0.56 NA days 1 183 gin trash < 0.04 < 0.04 < 0.04 Guirguis, M. J.
USA, 1994 pre plant 1995 Louisiana 137 (not reported) 1995/5297 108/94/01-672-01
cotton 240SL
pre plant
0.56 14 days 1 161 gin trash < 0.04 < 0.04 < 0.04 Guirguis, M. J.
USA, 1994 pre plant 1995 Louisiana 137 DPL 20 1995/5297 108/94/01-672-02
cotton 240SL
pre plant
0.56 14 days 1 159 gin trash < 0.04 < 0.04 < 0.04 Guirguis, M. J.
USA, 1994 pre plant 1995 Louisiana 137 DPL 51 1995/5297 108/94/01-672-03
cotton 240SL
pre plant
0.56 14 days 1 166 gin trash < 0.04 0.071 0.07 Guirguis, M. J.
USA, 1994 pre plant 1995 Arkansas 137 DPL 20 1995/5297 108/94/01-665-01
cotton 240SL
pre plant
0.56 16 days 1 162 gin trash < 0.04 < 0.04 < 0.04 Guirguis, M. J.
USA, 1994 pre plant 1995 Arkansas 137 (not reported) 1995/5297 108/94/01-665-02
cotton 240SL
pre plant
0.56 14 days 1 158 gin trash < 0.04 < 0.04 < 0.04 Guirguis, M. J.
USA, 1994 pre plant 1995 Tennessee 137 DPL 50 1995/5297 108/94/01-621-01

Dicamba 1059
CROP Country, Year Location (variety) Trial No.
Application
PHI(d)
Portion analysed
Residues (mg/kg) Author Report Year Study No. DocID.
Formulation Method Rate (kg ai/ha)
Growth stage (BBCH)
No. Dicamba5-OH dicamba
Total*
cotton 240SL
pre plant
0.56 14 days 1 172 gin trash 0.06 < 0.04 0.06 Guirguis, M. J.
USA, 1994 pre plant 1995 Alabama 137 DPL 50 1995/5297 108/94/01-664-01
cotton 480SL
pre plant
2.24 225 days 1 386 gin trash 0.46 0.30 0.76 Haughey, D. and
USA, 1998 pre plant Malinsky, D. S.Texas 2000 (PM 2200 RR) 97075 RCN 98137 2000/5151
cotton 480SL
pre plant
2.24 224 days 1 388 gin trash < 0.05 < 0.05 < 0.05 Haughey, D. and
USA, 1998 pre plant Malinsky, D. S.Oklahoma 2000 (Paymaster) 97075 RCN 98138 2000/5151
cotton 480SL
pre plant
2.24 214 days 1 374 gin trash < 0.05 < 0.05 < 0.05 Haughey, D. and
USA, 1998 pre plant Malinsky, D. S.Oklahoma 2000 (paymaster 145) 97075 RCN 98139 2000/5151
cotton 480SL
pre plant
2.24 233 days 1 336 gin trash < 0.05 < 0.05 < 0.05 Haughey, D. and
USA, 1998 pre plant Malinsky, D. S.California 2000 (SJ 2) 97075 RCN 98140 2000/5151
cotton 480SL
pre plant
2.24 242 days 1 382 gin trash < 0.05 < 0.05 < 0.05 Haughey, D. and
USA, 1998 pre plant Malinsky, D. S.Mississippi 2000 (BXN 47) 97075 RCN 98141 2000/5151
cotton 480SL
pre plant
2.24 220 days 1 381 gin trash < 0.05 < 0.05 < 0.05 Haughey, D. and
USA, 1998 pre plant Malinsky, D. S.Mississippi 2000 (Paymaster 1218)
97075
RCN 98142 2000/5151
* Dicamba + 5-OH dicamba; highest residue is taken into consideration in case different salt formulations of dicamba are applied side-by-side
FATE OF RESIDUES IN STORAGE AND PRCESSING
In processing
The Meeting received information on aqueous hydrolysis and processing of corn, wheat, cotton, sugarcane and soya beans.
Aqueous hydrolysis
Aqueous solutions of [Phenyl-U-14C]-dicamba (specific activity, 17.5 mCi/mmol (2.93 MBq/mg, 79.2 µCi/mg; purity, 98.3%) at a nominal concentration of 5μg/mL were subjected to hydrolysis at pH 4, 5 and 6 in vacuo at various temperatures with constant stirring (Grout, 2003).

1060 Dicamba
The pH 4 solutions were heated to 90 °C for 20 minutes to simulate pasteurisation, the pH 5 solutions to 100 °C for 60 minutes to simulate baking, brewing and boiling and the pH 6 solutions to 120 °C for 20 minutes to simulate sterilization. All test samples and controls were shielded from light to minimize any photolytic effects.
The recoveries of original radioactivity were between 103% and 108% for the controls and between 102% and 111% for the test samples. These results indicated that there were no losses of radioactivity during the experimental procedures.
Chromatographic data showed that dicamba was recovered unchanged after hydrolysis regardless of the conditions. Dicamba accounted for a minimum of 98.5% of the radioactivity present in each sample, as determined by TLC. No other discrete components were detected in any of the TLC systems and the results were further confirmed by HPLC. Dicamba is therefore stable to all three hydrolytic procedures.
Soya beans
In order to determine whether dicamba, 5-OH dicamba and DCSA concentrate in processed commodities, a processing study was conducted (Formanski, et al., 1995). Dicamba was applied at 11.2 kg ai/ha, corresponding to 5 times the proposed maximum labelled rate (2.24 kg ai/ha) for soya beans at either seven (at Daniville, Iowa) or nine days (Carlyle, Illinois) prior to harvest.
Samples were pre-analysed for residues of dicamba and 5-OH dicamba according to analytical method AM-0691B-0593-3. Samples from Carlyle were processed using techniques that simulate commercial processes except that the samples were processed by batch rather than continuous, as in commercial operation. The samples were not washed or treated before processing. The following control and treated fractions were produced: hull, crude and refined oil, and meal. In addition, aspirated grain fractions were generated. The soya bean grain, hull, crude and refined oil, and meal fractions, and the grain dust were analysed for dicamba, 5-OH dicamba, and DCSA residues according to analytical method AM-0941-1094-0.
Residues of dicamba were detected in treated soya bean grain, hulls, and grain dust. Residues of 5-OH dicamba and DCSA were also detected in treated grain dust. The grain dust had a mean total residue level (dicamba + 5-OH) of 365 mg/kg. In whole grain, the mean total residue level was 0.44 mg/kg. In the processed fractions, residue was detected only in the hulls and meal. The mean total residue level in hulls was 2.1 mg/kg. This value represents a concentration factor of 4.8. In meal, the total residue level was 0.19 mg/kg. In crude and refined oil, the total residue level from an application of 5 times the normal use rate was < 0.01 mg/kg.
A three month storage stability study for dicamba, 5-OH dicamba and DCSA was conducted at -16 °C for the grain and refined oil using control samples fortified with the three compounds. The stability of dicamba in grain was determined also after six months of frozen storage. There was no loss of any of the three compounds in any of the fortified control samples analysed after three months of frozen storage or dicamba in grain after six months of frozen storage.
The results are summarised in Table 89.
Table 89 Residues in processed commodities after the simulated processing of soya bean.
Commodity Residues (mg/kg) Processing factor Dicamba
5-OH Dicamba
DCSA Total* Dicamba Total residue
Grain 0.54 < 0.01 0.014 0.55 - - Meal 0.19 < 0.01 < 0.01 0.20 0.35 0.36 Hulls 2.09 < 0.01 < 0.01 2.10 3.9 3.8 Crude oil < 0.01 < 0.01 < 0.01 < 0.02 < 0.019 < 0.036 Refined oil < 0.01 < 0.01 < 0.01 < 0.02 < 0.019 < 0.036 Grain dust 365 2.8 3.0 368 676 669
* Dicamba + 5-OH dicamba

Dicamba 1061
Maize
Corn grain grown to maturity and treated 7 days before harvest with dicamba was processed into commercial fractions using wet and dry processing procedures that simulated commercial processes (Bade, 1989). The application rates were 11.2 kg ai/ha and 2.24 ai/ha, five times the intended use rate and the intended maximum label use rate, respectively. The high dose sample was processed using procedures that duplicated commercial wet processing and commercial dry processing procedures. The processing fractions were then analysed for residues of dicamba and 5-OH dicamba using analytical method AM-0691B.
Levels of dicamba and 5-OH dicamba observed in the unprocessed grain were 0.35 mg/kg and 0.01 mg/kg, respectively. Levels of dicamba observed in the processed samples ranged from 0.109 mg/kg to < 0.01 mg/kg, and were all less than the corresponding residue levels in the whole grain. Therefore, there is no concentration of dicamba residue during wet or dry processing. No detectable levels of 5-OH dicamba were observed in any processing fraction from wet or dry processing.
The results are summarised in Table 90.
Table 90 Residues in processed commodities after the simulated processing of maize
Commodity Residues (mg/kg) Processing factor Dicamba 5-OH dicamba Total Dicamba Total
Dry milling Grain 0.348 0.01 0.358 - - Hulls 0.109 < 0.01 0.119 0.31 0.33 Flour 0.089 < 0.01 0.099 0.26 0.28 Large Grits 0.070 < 0.01 0.080 0.20 0.22 Meal 0.024 < 0.01 0.034 0.069 0.095 Soapstock < 0.01 < 0.01 < 0.02 < 0.029 < 0.058 Refined Oil < 0.01 < 0.01 < 0.02 < 0.029 < 0.058 Crude Oil (Expelled) < 0.01 < 0.01 < 0.02 < 0.029 < 0.058 Crude Oil (Extracted) < 0.01 < 0.01 < 0.02 < 0.029 < 0.058 Wet milling Grain 0.348 0.01 0.358 - - Gluten 0.050 < 0.01 0.060 0.14 0.17 Hulls 0.014 < 0.01 0.024 0.040 0.067 Soapstock 0.027 < 0.01 0.037 0.078 0.10 Starch < 0.01 < 0.01 < 0.02 < 0.029 < 0.056 Refined Oil < 0.01 < 0.01 < 0.02 < 0.029 < 0.056 Crude Oil (Expelled) < 0.01 < 0.01 < 0.02 < 0.029 < 0.056 Crude Oil (Extracted) < 0.01 < 0.01 < 0.02 < 0.029 < 0.056
Wheat
A study was conducted to determine processing factors for processed wheat commodities from wheat treated pre-harvest with dicamba (Bade, 1990).
Wheat, grown to maturity and then treated 7 days pre-harvest with dicamba, was processed into commercial fractions using procedures that simulated commercial processing. The application rates were 0.28 kg ai/ha and 1.4 kg ai/ha. These rates correspond to the maximum intended label use rate and five times the maximum intended label use rate, respectively. The control sample, untreated wheat from the same field, and the high application rate (5) sample were processed and the processing fractions were analysed for residues of dicamba and 5-OH dicamba using analytical method AM-0691B.
Levels of dicamba and 5-OH dicamba observed in the unprocessed grain from the 5 application were 0.44 mg/kg and 0.034 mg/kg, respectively. Levels of dicamba observed in the processing commodities ranged from 0.436 mg/kg to 0.023 mg/kg. Dicamba was detected in bran (0.436 mg/kg), middlings (0.070 mg/kg), shorts & germ (0.236 mg/kg), and patent flour

1062 Dicamba
(0.023 mg/kg). Levels of 5-OH dicamba observed in processing commodities were 0.037 mg/kg in bran, < 0.01 mg/kg in middlings, 0.030 mg/kg in shorts and germ, and < 0.01 mg/kg in patent flour.
The results are summarised in Table 91.
Table 91 Residues in processed commodities after the simulated processing of wheat
Commodity Residues (mg/kg) Processing factor Dicamba 5-OH
dicamba Total Dicamba 5-OH
dicamba Total
Whole wheat 0.440 0.034 0.474 - - - Bran 0.436 0.037 0.473 0.99 1.1 1.0 Middlings 0.070 < 0.01 0.08 0.16 < 0.29 < 0.17 Shorts & Germ 0.236 0.030 0.266 0.54 0.88 0.56 Patent Flour 0.023 < 0.01 0.033 0.052 < 0.29 < 0.070
The whole grain before the generation of grain dusts had a total residue of dicamba of 0.44 mg/kg. The separated grain dust sample (composite of > 425 microns, > 1180 microns and > 2030 microns) and the grain dust sample (< 425 microns) had total residues of 4.8 mg/kg and 4.7 mg/kg, respectively. The total elevator grain dusts residue level was 4.7 mg/kg from < 400 microns to 2500 microns. The processing factor from wheat grain to grain dust was calculated to be 11.
Sugar cane
A study was conducted to determine processing factors of dicamba and 5-OH dicamba in the processed commodities of sugar cane, which was treated pre-harvest with dicamba (Formanski, 1994b).
Dicamba was applied at 5 times (11.2 kg ai/ha) the proposed maximum label rate (2.24 kg ai/ha) for sugar cane in two field trials in Opelousas and Washington, Louisiana. Samples were pre-analysed for residues of dicamba and 5-OH dicamba according to analytical method AM-0691B-0593-3. Samples from Washington were processed using techniques that simulate commercial processes. The samples were not washed or treated before processing.
Control and treatment samples of the following commodities were produced: mixed juice, bagasse, clarified juice, syrup, final molasses, raw and sugar, thickened mud (clarifier underflow), filter cake, white sugar, filter cake (during production of white sugar), refinery molasses, and fine liquor. The sugar cane sample and the bagasse, final molasses, and white sugar were analysed for dicamba and 5-OH dicamba according to the analytical method indicated above.
Residues of dicamba and 5-OH dicamba were detected in the treated sugar cane sample and in the bagasse and final molasses. The mean total residue in raw sugar cane (dicamba and 5-OH dicamba) was 0.054 mg/kg. The mean total residues in the bagasse and in the final molasses for the high application rate were 0.356 mg/kg and 1.3 mg/kg, indicating concentration. Residues of dicamba and 5-OH dicamba were not detected in the refined white sugar sample from treated sugar cane.
In a two month storage stability study conducted for the white sugar, bagasse, and final molasses in a freezer, there was no loss of dicamba and 5-OH dicamba in the white sugar and bagasse samples and sugar cane samples for the interval indicated above. In the final molasses samples, there was no loss of dicamba, but a 23% loss of 5-OH dicamba was observed for this sample.
The results are summarised in Table 92.
Table 92 Residues in processed commodities after the simulated processing of sugar cane
Commodity Residues (mg/kg) Processing factor Dicamba 5-OH
dicamba Total Dicamba 5-OH
dicamba Total
Sugar cane 0.013 0.041 0.054 - - - Bagasse 0.220 0.136 0.356 17 3.2 6.6

Dicamba 1063
Commodity Residues (mg/kg) Processing factor Dicamba 5-OH
dicambaTotal Dicamba 5-OH
dicamba Total
Final molasses 0.549 0.771 1.320 42 19 24 White sugar < 0.01 < 0.01 < 0.02 < 0.77 < 0.24 < 0.37
Cotton
A study was conducted to determine dicamba residues in delinted and non-delinted cotton seed, hulls, meal, crude oil, refined oil, and soapstock (Cahill, 1980 and 1981).
Samples of processed cottonseed commodities from cotton treated in with dicamba (2 0.06 kg ai/ha, 41 days pre-harvest and 0.11 kg ai/ha, 57 days pre-harvest) were analysed for dicamba according to AM-0691. The seeds from the 0.06 kg ai/ha treatment (PHI 41d) were processed and one sample each of the delinted seeds, hulls, meal, crude oil, refined oil, refined and bleached oil, and soapstock was analysed for dicamba according to method AM-0691. One sample each of delinted and non-delinted seed from the 0.11 kg ai/ha treatment cotton was also analysed.
Cahill (1981) further analysed samples of processed cottonseed commodities from cotton treated as in the above study for dicamba and 5-OH dicamba according to analytical method AM-0691.
In addition, delinted cottonseed samples from cotton treated 88 days prior to harvest at 0.06 kg ai/ha dicamba (in combination with the same rate of chlorflurenol) during the 1980 growing season were analysed.
Dicamba levels, expressed in mg/kg, in processed commodities from the cotton treated with 0.06 kg ai/has were: meal, 1.8; delinted seed, 1.1; hulls, 1.0; and soapstock, 0.035. Crude, refined, and refined and bleached cottonseed oil did not contain dicamba above 0.01 mg/kg. Dicamba levels for the 0.11 kg ai/ha treatment samples were 2.4 mg/kg for delinted seed and 1.4 mg/kg non-delinted seed. Mean residues of 5-OH dicamba in the seed, hull, and meal were 0.035, 0.050, and 0.068 mg/kg, respectively. Residue was not detected in the oil and soapstock samples. The mean dicamba level for the delinted seeds (1980) was 0.36 mg/kg; 5-OH dicamba was < 0.01 mg/kg in all of these samples. Recoveries from samples fortified at 0.1 mg/kg dicamba ranged from 78% for meal to 97% for soapstock (1978 and 1980). Recovery of 5-OH dicamba from delinted seeds, crude oil, and soapstock at 0.1 and 1.0 mg/kg ranged from 88 to 105 %.
Results are shown in Table 93.
Table 93 Residues in processed commodities after the simulated processing of cotton seed with dicamba treatment at different rate and PHI.
Commodity Residues (mg/kg) Processing factor Dicamba 5-OH
dicamba Total Dicamba 5-OH
dicamba Total
From cotton seed treated at 2 x 0.06 kg ai/ha with PHI of 41 days Delinted seed 1.1 0.035 1.14 - Hulls 1.0 0.050 1.05 0.91 1.43 0.92 Meal 1.8 0.068 1.87 1.64 1.94 1.64 Crude oil < 0.01 < 0.01 < 0.02 < 0.01 < 0.29 < 0.02 Refined oil < 0.01 < 0.01 < 0.02 < 0.01 < 0.29 < 0.02 Soapstock 0.035 < 0.01 0.045 0.03 < 0.29 0.04 Refined and bleached oil < 0.01 < 0.01 < 0.02 < 0.01 < 0.29 < 0.02 From cotton seed treated at 0.11 kg ai/ha with PHI of 57 days Delinted seeds 2.4 < 0.01 2.41 - - - Non-delinted seeds 1.4 I* - - - - From cotton seed treated at 0.06 kg ai/ha with PHI of 80 days Delinted seeds 0.27 < 0.01 0.28 - - - Non-delinted seeds 0.45 < 0.01 0.46 - - -
* Interference

1064 Dicamba
Summary of processing studies
Processed Product
Processing factor Dicamba Total residues
Soya bean Meal 0.35 0.36 Hulls 3.9 3.8 Grain dust 676 669 Refined oil < 0.019 < 0.036 Maize Flour 0.26 0.28 Large grits 0.20 0.22 Meal 0.069 0.095 Gluten 0.14 0.17 Starch < 0.029 < 0.029 Crude oil < 0.029 < 0.029 Wheat Bran 0.99 1.0 Flour 0.052 < 0.070 Grain dust - 11 Sugar cane Bagasse 17 6.6 Molasses 42 24 White sugar < 0.77 < 0.37 Cotton Meal 1.60 0.92 Refined oil < 0.01 < 0.02
RESIDUES IN ANIMAL COMMODITIES
Farm animal feeding studies
Lactating cows
Ten lactating dairy cows were acclimated and assigned to 4 dose level groups, i.e., one control cow, three 1x cows dosed at 40 ppm (600 mg dicamba fed daily), three 3 cows dosed at 120 ppm (1800 mg dicamba fed daily), and three 10 cows dosed at 400 ppm (6000 mg dicamba fed daily), based on a 15 kg feed intake per day (Gilsdorf and Weissenburger, 1979; and Tims et al., 1979). After acclimation, dicamba was administered twice daily during the milking periods to the cows in gelatine capsules for 30 days, in addition to 15 kg feed per day consisting of alfalfa cubes, hay and grain.
Milk samples were collected twice daily (morning and evening) on days -1 (pre-dose), 1, 4, 8, 12, 16, 20, 25, and 30. Post treatment samples were collected 1, 4, 8, 11, and 14 days after the last dosing to determine the withdrawal characteristics. Daily composite milk samples were created using equal amounts from each milking.
Tissue samples were collected on day 30 from the control cow and two cows in each dose group. Tissues collected at sacrifice were liver, kidney, muscle, and mixed omental and renal fat. Three animals, one from each dosage level, were maintained on a withdrawal diet for 14 days. These animals were sacrificed on day 44 of the study. Tissues were taken as previously described.
Milk and tissue samples were analysed for combined residues of dicamba and DCSA. The analytical method used determined residues of dicamba and DSCA as the methyl ester of dicamba after methylation of these compounds with diazomethane. Residue levels reported were therefore the sum of the two compounds.
Recoveries from fortified tissue samples were in the range of 75–120%. Recovery in milk ranged between 69–100%. No residues were found in tissues and milk of the control animals.

Dicamba 1065
The total combined residues of dicamba and DCSA in cow tissues are compiled in Table 94. A comparison of the residue levels observed at day 30 (i.e., last day of feeding dicamba containing feed) with reduced residue levels, obtained after a 14 day withdrawal period (i.e., feeding untreated feed), is shown in Table 95 Significant residues of dicamba in kidney were found in all dose groups. However residues in muscle (meat) were generally low and were below LOQ (< 0.010 mg/kg) at the 1x dose rate, after feeding dicamba in the diet for 30 consecutive days. Residues in all tissues declined after withdrawal of treated food and were below LOQ at the 1 and 3 dose rate after a 14 day withdrawal period, except in kidneys at the 3 rate which amounted to 0.056 mg/kg.
Table 94 Sum of residues of dicamba and DCSA in tissues of dairy cow after feeding dicamba-containing diet for 30 days
Dose Group Cow ID Sum of dicamba and DCSA (mg/kg expressed as dicamba) Muscle (Meat) Liver Kidney Fat
Control 277 < 0.01 < 0.01 < 0.01 < 0.01 1 (40 ppm)
362 < 0.01 0.023 0.174 0.046 331 < 0.01 0.029 0.134 < 0.01
Average < 0.01 0.026 0.154 0.023 3 (120 ppm)
227 0.014 0.062 0.288 0.017 387 0.011 0.070 0.276 0.034
Average 0.012 0.066 0.282 0.025 10 (400 ppm)
643 0.037 0.207 0.408 0.035 628 0.024 0.207 0.885 0.059
Average 0.030 0.207 0.646 0.047
Table 95 Comparison of the sum of dicamba and DCSA in tissues of dairy cow after feeding dicamba-containing diet for 30 days followed by a 14-day withdrawal period
Dose Level Tissue/Milk Sum of dicamba and DCSA (mg/kg expressed as dicamba) End of feeding period* End of withdrawal period
Control All < 0.01 -- 40 ppm Milk 0.02 < 0.01 Liver 0.026 < 0.01 Muscle (Meat) < 0.01 < 0.01 Kidney 0.154 < 0.01 Fat 0.023 < 0.01 120 ppm Milk 0.05 < 0.01 Liver 0.066 < 0.01 Muscle (Meat) 0.012 < 0.01 Kidney 0.282 0.056 Fat 0.025 < 0.01 400 ppm Milk 0.36 < 0.01 Liver 0.207 0.064 Muscle (Meat) 0.030 0.01 Kidney 0.646 0.280 Fat 0.047 0.011
* Mean of two cows (except control cow).
The average and maximum residues observed in cow milk as well as the decline of residues in milk during the withdrawal period are presented in Table 96 and 97.
Residues in milk were observed in samples from Day 1 through Day 30, reaching their plateaus after approximately 12 days of feeding. At the 1 (40 ppm) feeding rate, maximum residues for the three cows ranged from 0.023 mg/kg to 0.039 mg/kg, whereas at the 3 (120 ppm) level, maximum residues ranged from 0.041 mg/kg to 0.069 mg/kg. At the 10 level (400 ppm) the maximum residues were in the range of between 0.205 m/kg and 0.341 mg/kg.
Residues in milk declined to < 0.01 mg/kg by Day 31, Day 38 and Day 41 for the 40 ppm, 120 ppm, and 400 ppm feeding levels during the withdrawal period, respectively.

1066 Dicamba
Table 96 Average dicamba residues in milk during dosing period and withdrawal period
Dose Group
Sum of dicamba and DCSA in milk on specific dosing day (mg/kg expressed as dicamba) Day 0 Day 1 Day 4 Day 8 Day 12 Day 16 Day 20 Day 25
Control < 0.01 < 0.01 < 0.01 < 0.01 < 0.01 < 0.01 < 0.01 < 0.01 < 0.01 < 0.01 < 0.01 < 0.01 < 0.01 < 0.01 < 0.01 < 0.0
140 ppm < 0.01 < 0.01 < 0.01 < 0.01 0.01 < 0.01 0.01 0.01 < 0.01 < 0.01 0.02 0.01 0.02 0.02 0.02 0.02 120 ppm < 0.01 < 0.01 < 0.01 < 0.01 0.01 0.01 0.02 0.02 0.03 0.03 0.04 0.04 0.04 0.03 0.04 0.04 400 ppm < 0.01 < 0.01 0.02 0.02 0.08 0.07 0.13 0.12 0.19 0.19 0.18 0.17 0.19 0.20 0.17 0.17
Day 30 Day 31 Day 34 Day 38 Day 41 Day 44 Skim milk a Ratio b
Control < 0.01 < 0.01 - - - - - - - - - - < 0.01 < 0.01 - 40 ppm 0.01 0.02 < 0.01 < 0.01 < 0.01 < 0.01 < 0.01 < 0.01 < 0.01 < 0.01 < 0.01 < 0.01 0.02 0.02 109% 120 ppm 0.04 0.04 < 0.01 < 0.01 0.01 0.01 < 0.01 < 0.01 < 0.01 < 0.01 < 0.01 < 0.01 0.04 0.04 102% 400 ppm 0.20 0.22 0.05 0.06 0.17 0.20 < 0.01 0.01 < 0.01 < 0.01 < 0.01 < 0.01 0.29 0.31 142%
When residues were < 0.01 mg/kg, 0.01 mg/kg was used for calculating average.
Up to Day 30, average of three cows and thereafter value from one cow. a Skimmed milk prepared from the Day 30 milk. b Ratio of dicamba equivalents found in skimmed milk to those found in whole milk.
Table 97 Maximum dicamba residues in milk from three cows during dosing period.
Dose Group
Sum of dicamba and DCSA in milk on specific dosing day (mg/kg expressed as dicamba) Day 0 Day 1 Day 4 Day 8 Day 12 Day 16 Day 20 Day 25
Control < 0.01 < 0.01 < 0.01 < 0.01 < 0.01 < 0.01 < 0.01 < 0.01 < 0.01 < 0.01 < 0.01 < 0.01 < 0.01 < 0.01 < 0.01 < 0.0140 ppm < 0.01 < 0.01 < 0.01 < 0.01 0.01 < 0.01 0.01 0.02 < 0.01 < 0.01 0.02 0.01 0.03 0.03 0.03 0.03 120 ppm < 0.01 < 0.01 < 0.01 < 0.01 0.02 0.02 0.03 0.03 0.04 0.04 0.06 0.05 0.05 0.03 0.05 0.05 400 ppm < 0.01 < 0.01 0.03 0.03 0.13 0.11 0.20 0.19 0.28 0.28 0.22 0.23 0.28 0.31 0.22 0.26 Day 30 Control < 0.01 < 0.01 40 ppm 0.02 0.02 120 ppm 0.05 0.04 400 ppm 0.24 0.30
Values in bold are those different from the average values.
In another study by Wofford et al.(2002), eight lactating dairy cows were acclimated and assigned to one control group (three cows) an one dose group (five cows) with a daily dose of 1000 ppm (20 g dicamba fed daily), which was calculated on a basis of the average daily feed consumption value from the previous week for each animal. Animals were dosed once daily in-between the two milk samplings via a balling gun for a period of 31 days.
Milk samples were collected twice daily (morning and evening) on days -1, 1, 2, 4, 7, 10, 14, 17, 21, 24 and 28 and pooled (PM sample was pooled with AM sample of the following day). The animals were sacrificed on the last day of dosage, except that two animals of the dosage group were sacrificed 5 and 10 days after the last dosage, to determine residue decline. Therefore milk samples were also collected as described above on days 32, 33, 35, 37 and 39.
At sacrifice, 2 hours after the final dose, a composite of thigh and loin muscle, composite samples of the distal portions of each lobe of liver, both kidneys, and a composite of mesenteric and peripheral fat samples were collected. Milk and tissue samples were analysed by converting dicamba and DCSA to the methyl ester of dicamba before the determination by GC-ECD.
Combined residues of dicamba and DCSA as analysed were reported as dicamba. Average recoveries from fortified control tissue samples were 86 ± 25% for dicamba and 78 ± 21% for DCSA, and from milk, 95 ± 16% and 85 ± 17 %, respectively.
As shown in Table 98, the 1000 ppm dose level, average dicamba residues in milk ranged from 0.08 to 0.21 mg/kg, with a plateau at Day 21. Skim milk and cream had average dicamba residues of 0.16 mg/kg each.

Dicamba 1067
At the 1000 ppm dose level, dicamba residues were at the highest concentration in kidney and liver. Average residues in kidney and liver were 21 and 3.4 mg/kg, respectively. The maximum dicamba residues detected in kidney and liver were 47 and 5.1 mg/kg, respectively. Dicamba residues concentrations were significantly lower in fat and muscle. Average residues were 0.32 and 0.21 mg/kg for fat and muscle, respectively.
Two additional cows in dosage group were sacrificed five and ten days, respectively, after the last dose was administered. The average dicamba residues detected in milk and tissues ranged from < 0.01 to 0.22 mg/kg for the two depuration cows.
Table 98 Dicamba residues in milk and tissues of dairy cows during and after feeding of 1000 ppm dicamba for 31 days followed by withdrawal period
Milk/Tissue Days after initiation of study
Dicamba+DCSA (mg/kg expressed as dicamba) Range Average*
Whole Milk -1 < 0.01 < 0.01 1 0.071–0.224 0.11 2 0.068–0.173 0.12 4 0.046–0.185 0.10 7 0.054–0.111 0.08 10 0.071–0.144 0.10 14 0.019–0.225 0.10 17 0.097–0.261 0.15 21 0.134–0.506 0.21 24 0.076–0.291 0.17 28 < 0.01–0.241 0.15 32 0.016, 0.051 0.03 33 < 0.01 < 0.01 35 < 0.01 < 0.01 37 < 0.01 < 0.01 39 < 0.01 < 0.01 Skim Milk 30 0.138–0.191 0.16 Cream 30 0.141–0.164 0.16 Fat 31 0.20–0.51 0.32 36 < 0.01 41 0.02 Kidney 31 9.81–46.6 21.2 36 0.04 41 0.03 Liver 31 2.43–5.10 3.35 36 0.01 41 0.22 Muscle 31 0.11–0.39 0.21 36 0.01 41 < 0.01
* For tissues, average of three cows for Day 31 samples and value of one cow each for withdral samples; and for milk average of five cows up to day 28 and of two cows therafter.
In a study conducted by Gasser (2001), 11 lactating dairy cows were acclimated and assigned to 4 dosing level groups; 2 control cows (one serving as back-up), 3 cows dosed at 400 mg, 3 cows dosed at 1200 mg, and 3 cows dosed at 4000 mg of 5-OH dicamba which is present in treated plants. Based on average daily feed consumption of 20.9 kg, 20.3 kg, and 21.9 kg, the dose levels of 5-OH dicamba were equivalent to 19.1 ppm, 59.1 ppm, and 182.6 ppm in the diet. After acclimation, 5-OH dicamba was administered daily to the cows in gelatine capsules for 29-30 consecutive days. The animals were sacrificed between 20 and 24 hours after receiving the final dose. Milk samples were collected twice daily (morning and evening) on day 0 (pre-dose), 1, 2, 3, 5, 8, 12, 15, 19, 22, and 28. Daily composite milk samples were created using equal amounts from each milking. Blood and tissue specimens were collected on day 29 from one cow in each treatment group and day 30 from two cows in each group (except the control). Tissues collected were liver, kidney, perirenal fat, omental fat, round muscle, tenderloin muscle, and diaphragm muscle.

1068 Dicamba
Milk samples were analysed for residues of 5-OH dicamba using analytical method REM 193.04. The limit of quantitation was 0.01 mg/kg for tissues, 0.01 mg/L for blood, and 0.005 mg/L for milk.
Storage Stability to cover the interval between sample reception date and date of last analysis was demonstrated using fortified specimens, stored at -18 °C, of milk, blood, muscle, fat, liver, and kidney.
Residues found in tissues, fat, and blood and their average values are presented in Table 99.
Table 99 Residues of 5-OH dicamba in tissues and blood of dairy cows after feeding period of 29–30 days
Dose Group
Cow ID
5-OH dicamba (mg/kg for tissue; and mg/L for blood) Muscle Tenderloin
Muscle Round
Diaphragm Liver Kidney Fat Perirenal
Fat Omental
Blood
Control 1 < 0.01 < 0.01 < 0.01 < 0.01 < 0.01 < 0.01 < 0.01 < 0.01 400 mg (19.1 ppm)
2 < 0.01 < 0.01 < 0.01 < 0.01 0.02 < 0.01 < 0.01 0.02 3 < 0.01 < 0.01 < 0.01 < 0.01 < 0.01 < 0.01 < 0.01 < 0.01 8 < 0.01 < 0.01 < 0.01 < 0.01 0.04 < 0.01 < 0.01 0.01
Average < 0.01 < 0.01 < 0.01 < 0.01 0.02 < 0.01 < 0.01 0.01 1200 mg (59.1 ppm)
6 < 0.01 < 0.01 < 0.01 < 0.01 0.02 < 0.01 < 0.01 < 0.01 9 < 0.01 < 0.01 < 0.01 < 0.01 < 0.01 < 0.01 < 0.01 < 0.0110 < 0.01 < 0.01 < 0.01 < 0.01 0.01 < 0.01 < 0.01 < 0.01
Average < 0.01 < 0.01 < 0.01 < 0.01 0.01 < 0.01 < 0.01 < 0.01 4000 mg (182.6 ppm)
4 < 0.01 < 0.01 0.01 (0.011) 0.02 (0.017)
0.26 0.01 (0.010)
0.01 (0.010)
0.11
5 0.02 (0.017) 0.02 (0.015)
0.04 (0.036) 0.06 (0.061)
0.54 0.02 (0.021)
0.03 (0.025)
0.32
7 < 0.01 < 0.01 < 0.01 < 0.01 0.02 < 0.01 < 0.01 0.03 Average < 0.01 < 0.01 0.02 0.03 0.27 0.01 0.01 0.15
Average results were calculated from individual raw results. If results were below the LOQ, then LOQ/2 (0.005) was used for the calculation.
For the tissues, residues of 5-OH dicamba were only found in kidney and blood at the 400 mg (19.1 ppm in the diet) treatment level. Residues in kidney ranged from < 0.01 to 0.04 mg/kg. Residues in blood were in the range of < 0.01 to 0.02 mg/kg.
At the 1200 mg (59.1 ppm in the diet) level, residues were only detected in kidney (< 0.01 to 0.02 mg/kg).
At the 4000 mg (182.6 ppm in the diet) level, residues in muscle (tenderloin, round, diaphragm) ranged from < 0.01 to 0.04 mg/kg. Residues in liver were in the range of < 0.01 to 0.06 mg/kg, whereas residues in kidney ranged from 0.02 to 0.54 mg/kg. The range of residue levels in fat (perirenal, omental) was from < 0.01 to 0.03 mg/kg. Blood residues were in the range of 0.03 to 0.32 mg/kg.
No residues above LOQ (0.005 ppm) were observed in milk at the 400 mg treatment level. In the 1200 mg feeding group, 5-OH dicamba was found at the LOQ in a Day 19 sample from one cow. Quantifiable residues were observed in 11 of the 33 milk samples in the 4000 mg feeding group. Those were at the LOQ except for 0.014 mg/kg found in milk from one cow on day 28.
Residues found in milk are displayed in Table 100.
Table 100 Residues of 5-OH dicamba in cow milk during feeding period of 29–30 days
Dose Group
5-OH dicamba in milk on specific dosing day (mg/kg) 0 1 2 3 5 8 12 15 19 22 28
Control < 0.005 < 0.005 < 0.005 < 0.005 < 0.005 < 0.005 < 0.005 < 0.005 < 0.005 < 0.005 < 0.005 400 mg < 0.005 < 0.005 < 0.005 < 0.005 < 0.005 < 0.005 < 0.005 < 0.005 < 0.005 < 0.005 < 0.005 1200 mg < 0.005 < 0.005 < 0.005 < 0.005 < 0.005 < 0.005 < 0.005 < 0.005 < 0.005–
0.005* < 0.005 < 0.005

Dicamba 1069
Dose Group
5-OH dicamba in milk on specific dosing day (mg/kg)0 1 2 3 5 8 12 15 19 22 28
4000 mg < 0.005 < 0.005–0.005
< 0.005–0.005
< 0.005–0.005
< 0.005–0.005*
< 0.005 < 0.005–0.005
< 0.005 < 0.005–0.005
< 0.005–0.005*
< 0.005–0.014*
*Average results of multiple analyses.
Laying hens
Forty laying hens were acclimated and assigned to four dose level groups. The groups consisted of control, 1 (2.0 ppm in the diet), 3 (6.0 ppm in the diet), and 10 (20 ppm in the diet)(Cahill and Johnson, 1984; and Cahill, 1986). The test material, dicamba, was incorporated into the daily ration. Feed samples were analysed to confirm diet concentrations and stability over the course of the study.
The hens were dosed for 28 consecutive days. On Day 28, one-half of the hens were sacrificed. The remaining hens were fed untreated laying mash for an additional three days. The remaining hens were sacrificed after the withdrawal period. Eggs were collected on test Days 1, 3, 7, 14, and 28 plus on Day 31 (three days after being placed on untreated diet). The hens were sacrificed within eighteen hours after the last dose. Tissues collected were breast muscle, leg and thigh muscle, visceral fat, liver, and skin.
Based on results of the hen metabolism studies, samples were analysed for dicamba residues only. The limit of quantitation in chicken tissues and eggs was 0.01 mg/kg.
Residues found in tissues are presented in Table 101. The depuration of residues three days after the cessation of feeding treated feed is shown in Table 102.
All egg samples from the 20 ppm dose group and the Day 28 egg samples from the 6 ppm dose group were analysed for dicamba residues and none showed residues above the LOQ of 0.01 mg/kg.
At the 20 ppm feeding level, no residues above the LOQ (0.010 mg/kg) were found in leg muscle. Residues of 0.013 mg/kg were noted in breast muscle of one of the five birds sacrificed. Similarly, adipose tissue sample from one out of five birds was found to contain 0.025 mg/kg of dicamba residues. Residues, ranging from 0.027 to 0.068 mg/kg, were found in four of the five skin samples. Residue levels, ranging from 0.017 to 0.053 mg/kg, were observed in all five liver samples.
At the feeding level equivalent to 6 ppm in the diet, no residues above the LOQ were found in eggs, adipose tissue, skin, breast, or leg muscle samples. Residues, ranging from 0.012 to 0.023 mg/kg, were found in three of the five liver samples.
Of all the tissue samples of the 2 ppm feeding level, only liver and adipose tissue samples were analysed. No residues above the LOQ were found in any of the samples at this feeding level.
After a 3-day withdrawal period, samples from 3 hens originally treated at the 20 ppm dose level were analysed. No residues above the LOQ were found in eggs (pooled sample), liver, breast, or leg muscle. An isolated residue value in the adipose tissue of one single hen indicated a residue of 0.081 mg/kg. However, due to its unusually dark colour, another sample, subsequently taken from the same hen, was taken, which yielded a residue of 0.020 mg/kg after analysis. Residues were also noticed in two of the three skin samples.
Table 101 Residues in tissues of hens after feeding period of 28 days
Tissue Dicamba (mg/kg) 2 ppm dose group 6 ppm dose group 20 ppm dose group
Liver < 0.01 < 0.01–0.023 0.017–0.053 Adipose < 0.01 < 0.01 < 0.01–0.025 Skin NA < 0.01 < 0.01–0.068 Breast NA < 0.01 < 0.01–0.013 Leg NA < 0.01 < 0.01
N/A = not analysed

1070 Dicamba
Cl
Cl
O
COOH
Cl
Cl
O
COOH
OH
Cl
Cl
OH
COOH
Cl
OHCl
NH2
Cl
OHCl Cl
Cl
OH
COOH
OH
Table 102 Residues in tissues and eggs of chickens in the 20 ppm dose group after a 3-day withdrawal period (i.e., on Day 31)
Tissue/Egg Dicamba (mg/kg) Hen C-36 Hen C-37 Hen C-38
Liver < 0.01 < 0.01 < 0.01 Adipose < 0.01 < 0.01 0.081a, 0.020 Skin 0.020, < 0.01 < 0.01 0.034b Breast < 0.01 < 0.01 < 0.01 Leg < 0.01 < 0.01 < 0.01 Egg < 0.01c
a This sample was considerably darker than other adipose samples and should not be considered a representative sample. Another sample was taken from the same bird and analysed as shown. b Average of three analyses. c Pooled sample
APPRAISAL
Dicamba, a systemic broad-spectrum herbicide, is used in a variety of crops. Its mode of action is similar to that of endogenous auxin (IAA) and other auxin-type herbicides and appears to involve cell wall plasticity and nucleic acid metabolism.
It was identified as a priority new compound at the Forty-second Session of the CCPR in 2009 (ALINORM 09/30/24, para. 193) for evaluation for the first time by the 2010 JMPR. The Meeting received information on physical and chemical properties, animal and plant metabolism, environmental fate, analytical methods, storage stability, use patterns, supervised trials, processing and farm animal feeding.
The structures of dicamba, along with those of metabolites referred to in this appraisal, are shown below.
Dicamba 5-OH Dicamba DCSA 2A36DCP DCP DCGA
Animal metabolism
The Meeting received information on the fate of orally-dosed dicamba in lactating goats and cow, and laying hens.
When 14C-dicamba, uniformly labelled with 14C in the phenyl ring, was administered orally at a dose equivalent to a dietary concentration of 10 ppm to a lactating goat daily for four consecutive days, 83%, 8.5% and 0.019% of the total administered radioactivity (TAR) was eliminated via urine, faeces and milk respectively, indicating that the majority of administered radioactivity was rapidly incorporated and excreted in urine. Total recovered radioactivity was 93% of the TAR.

Dicamba 1071
Radioactivity in milk was low throughout the 4 day study period with the cumulative radioactivity of only 0.019% of the TAR. The maximum radioactive residues were 0.002 mg/kg in dicamba equivalents.
Total radioactive residues (TRR) in tissues after sacrifice (24 hours after the last dose) were also low at 0.014 mg/kg (0.023% of TAR), 0.054 mg/kg (0.014% of TAR), 0.011 mg/kg (0.033% of TAR) and 0.004 mg/kg (0.12% of TAR) in parent equivalents in liver, kidney, fat and muscle respectively.
Dicamba was rapidly incorporated into body of lactating goat after oral administration but poorly metabolized. The primary residue was the parent compound (63–93% of TRR) in all tissues analysed with much smaller amounts of DCSA (1.2–12% of TRR). An unidentified metabolite was found at 0.10% of TRR.
Acid hydrolysis of unextracted radioactivity of liver, kidney and fat released 26–30% of TRR into ethyl acetate fraction which contained metabolites identical to dicamba and DCSA.
Radioactive residues in milk and muscle were not characterised due to their extremely low levels (maximum 0.002 mg/kg in milk and 0.004 mg/kg in muscle expressed in dicamba equivalents).
The result indicates that the major metabolism of dicamba involves O-demethylation to form DCSA although the parent compound was the predominant residue observed in excreta and tissues.
When [phenyl-U-14C]-dicamba was administered orally at a dose equivalent to a dietary concentration of 60 ppm to a lactating cow twice a day for five consecutive days, 89%, 1.5% and 0.018% of TAR were recovered from urine, faeces and milk, respectively. This indicates that the administered radioactive carbon was rapidly incorporated and excreted into urine.
Radioactivity in milk was very low throughout the 5 day study period with the cumulative radioactivity of only 0.018% of the TAR. The maximum radioactive residues were 0.004 mg/kg in dicamba equivalents.
The TRR in tissues after sacrifice (6 hours after the last dose) were also low at 0.30 mg/kg, 2.59 mg/kg, 0.02 mg/kg and 0.03 mg/kg in parent equivalents in liver, kidney, fat and muscle respectively.
Unchanged dicamba was the major radioactive residue found in excreta (75–84% of TRR) and also tissues (51% of TRR in liver, and 70% of TRR in kidney). Much smaller amount of DCSA was found in urine (14–18% of TRR), faeces (8–13% of TRR), liver (21% of TRR) and kidney (11% of TRR). DCSA was the only detected metabolite in milk but its too low level did not allow confirmation of the structure. Radioactive residues in muscle were not characterised due to their low level.
The only other metabolites detected were DCSA glucuronide and DCP in urine but both were less than 4% of TRR.
The above result indicates that the metabolism of dicamba in cow occurs primarily through O-demethylation. It also involves conjugation of DCSA with glucuronic acid and decarboxylation of DCSA to produce DCP.
When [phenyl-U-14C]-dicamba was administered orally at a dose equivalent to a dietary concentration of 10 ppm to a group of laying hens once a day for four consecutive days, 89% and 0.014% of TAR were eliminated in excreta and eggs, respectively. The total recovered radioactivity was 89% of the TAR.
The TRR in tissues after sacrifice (24 hours after the last dose) were very low at 0.0029 mg/kg (0.003% of TAR), 0.0003 mg/kg (0.004% of TAR), 0.0005 mg/kg (0.004% of TAR) and 0.0002 mg/kg (0.001% of TAR) in parent equivalents in liver, breast muscle, leg muscle and fat, respectively, showing little transfer to edible portion of chicken. The radioactive residues in egg white and yolk were also low and never exceeded 0.0035 mg/kg in dicamba equivalents or 0.001% of TAR.

1072 Dicamba
Almost the entire radioactivity found in excreta was attributed to unchanged dicamba and 61% of the TRR in liver and 95% of the TRR in eggs were also attributed to dicamba. 2A36DCP was identified from liver at 36% of the TRR but not from excreta. DCSA and 5-OH dicamba were only identified from urine at 1.6% and 0.0004% of the TRR, respectively. Radioactive residues in muscle and fat were not characterised due to their extremely low level (< 0.0005 mg/kg in dicamba equivalents).
When laying hens were given [phenyl-U-14C]-dicamba as a single oral dose (equivalent to 1 ppm and 100 ppm in the diet) or intravenously (equivalent to 1 ppm in the diet), radioactivity was rapidly incorporated and then eliminated in excreta (78–87% of TAR).
Soon after administration, radioactivity appeared in blood, reached the maximum only 30 min after dose, and decreased rapidly. The half-life of 1.1 hours in blood was calculated.
Only very low amounts of radioactivity were found in the tissues. A total of about 0.06% of the intravenously administered radioactivity was found in eleven tissues 24 hour after administration while 0.7–0.8% of the orally administered radioactivity (1 mg/kg bw) was found in these tissues after the same period. Most of the recovered radioactivity was found in kidney in both experiments.
Dicamba is almost only radioactive compound found in excreta and kidney (≥ 94% of TRR) with small amounts of DCSA (0–4.9%). There are a number of unidentified metabolites found but none exceeded 1.1% of TRR except in kidney one unidentified metabolite accounted for 5.8% of TRR.
Limited metabolism of dicamba was observed in ruminants and hens as the unchanged parent compound was the primary residue component in milk and all ruminant tissues as well as eggs and all avian tissues. Metabolism of dicamba appears to follow the same pathway in goat, cow, hen and rat. The metabolic pathway involves O-demethylation to give DCSA; hydroxylation to produce 5-OH dicamba; decarboxylation of DCSA to give DCP; substitution of carboxyl group of DCSA with amino group to form 2A36DCP; and conjugation of DCSA with glucuronic acid.
Plant metabolism
The Meeting received information on the fate of dicamba after foliar applications or treatment simulating foliar application of [phenyl-U-14C]-dicamba on soya bean, wheat, sugar cane and cotton for which residue trial data were submitted to the present Meeting. Soya bean, wheat and cotton were treated and grown in the field while sugar cane was treated and grown in glasshouse.
[14C]-Dicamba was applied at a sub-toxic rate of 5.17 μg/plant to soya bean plants (foliar application) grown on untreated soil at two different timings.
With the early podfill growth stage application, radioactivity rapidly decreased from 85% to 4.6% of the total applied radioactivity (TAR) in treated leaves in the first seven days after application. After 14 days, the total recovered radioactivity averaged 42% of the TAR, about a half of which was found in immature beans. This indicates rapid and significant incorporation and translocation from leaf to beans.
Over 64% and 94% of respective TRR were attributed to unchanged dicamba in treated leaves and immature beans 14 days after treatment. About 17% of the TRR in the leaf samples collected 14 days after treatment (DAT) was attributed to DCSA while only 0.6% of the TRR in the 14-DAT immature bean samples was DCSA. No di-hydroxylated metabolites were observed.
The result indicates that dicamba is translocated without metabolization or conjugation while at the site of application, dicamba goes through gradual O-demethylation.
With late senescent growth stage application, also rapid decline of radioactivity from 77% to 11% of TRR was observed in treated leaves 6 days after application. Only 63% of the TAR was recovered in the plant 6 days after treatment, among which 26% was found in the intact plant while another 24% was recovered from abscised leaves.

Dicamba 1073
Untreated leaves, stems, roots, pods and immature beans 6 days after treatment contained similar radioactivity. Their radioactivity levels were similar also to those of the same tissues after early podfill stage application except immature beans. With late senescent growth stage application, there was far less translocation of dicamba to beans compared to early podfill stage application. Only 2.1% of TAR or 8% of the TRR remained in immature beans 6 days after treatment.
About 64% and 44% of respective TRR were attributed to unchanged dicamba in treated leaves (not abscised) and beans 6 days after treatment. Only 0.3% and 0.7% of the respective TRR were attributed to DCSA in 6-DAT bean sample and treated leaves (not abscised). Similarly small amounts of 5-OH dicamba and DCGA were also found in treated leaves and immature beans but neither exceeded 1.0% of TRR.
Foliar application of [14C]-dicamba to spring wheat resulted in the majority of radioactivity recovered from leaves and stems and later from straw (1.1–1.9 mg/kg in dicamba equivalents). On the other hand, there was little translocation to grain at 0.056 mg/kg in dicamba equivalents.
In grain, forage and straw samples, none of free individual metabolites were > 5% of TRR and > 0.01 mg/kg, except free dicamba in grain (16% of TRR but 0.009 mg/kg). Including conjugated forms, 5-OH dicamba was the most predominant radioactive residue in straw at 3.7% of TRR and 0.70 mg/kg, and dicamba in grain as described above.
Significant amounts of radioactivity were incorporated into unextracted plant matrix constituents, such as protein, cellulose, pectin and lignin.
The above result indicates that metabolism of dicamba in wheat was extensive and includes hydroxylation at 5-position of dicamba to form 5-OH dicamba and its O-demethylation to form DCGA; O-demethylation of dicamba to form DCSA; O-demethylation of dicamba and hydroxylation at 5-position to form DCGA; and conjugation and incorporation into plant matrix constituents.
After foliar application of [14C]-dicamba to 6-week old sugar cane plants grown in untreated soil at a rate of 3.06 mg/plant, dicamba was rapidly taken up by leaves with 46% of TAR recovered from plant 28 days after treatment. More than 90% of the incorporated radioactivity remained in treated leaves with about 6% TAR translocated to other parts of the plant 28 days after treatment.
Dicamba was predominant radioactive residue in treated leaves at 0 DAT (more than 90% of TRR) but decreased to less than half of TRR by 12 DAT. Over time 5-OH dicamba was formed and reached 49% of TRR by 12 DAT. At 28 DAT, the total extractable amount of 5-OH dicamba was greater than that of dicamba itself. Small amount of DCGA was also found at a total of about 2% of TRR. Amounts of unextracted radioactivity were also significant indicating incorporation of radioactivity into plant matrix. β-Glucosidase treatment released significant amount of DCSA.
Metabolism of dicamba in sugar cane seems to involve as primary pathway, hydroxylation to form 5-OH dicamba. Other pathway may include O-demethylation to form DCSA and its conjugation to form β-D-glucosides; and O-demethylation of 5-OH dicamba and hydroxylation of DCSA to form DCGA.
[14C]-Dicamba was applied to cotton grown in untreated soil at a rate of 60 μg/plant, a sub-toxic rate, at the green-boll growth stage. Radioactivity in treated plants rapidly declined from 16% to 1.9% of TAR in 14 days after foliar application. On the other hand, the 14 DAT untreated leaf, stem root and boll samples contained comparable radioactivity; in particular, bolls contained 22% of TAR. This indicates significant translocation to bolls.
Among parts of the 14 DAT bolls, the majority of radioactivity (17% of TAR) is located in carpels with 2.5% and 2.6% of TAR in seed and lint respectively.
Dicamba was the predominant radioactive residue in ether fractions of treated seed (14 DAT) at 2.2% of TAR. Further analysis indicated that dicamba was poorly metabolized or not conjugated in cotton seed.
Dicamba was the predominant residue in all analysed cotton parts with very slow metabolization showing minor amounts of 5-OH dicamba.

1074 Dicamba
In summary, in wheat and sugar cane, there is little translocation and dicamba was rapidly metabolized after foliar application of dicamba. In these plants, hydroxylation to form 5-OH dicamba appears to be the primary metabolic pathway. Conjugation of 5-OH dicamba is also observed.
In soya beans and cotton, which are susceptible to dicamba, metabolism of dicamba appears to be slow and limited to occur in treated leaves. However, significant translocation was observed.
Despite some differences in the rate of metabolism and translocation, there seems to be a common metabolic pathway of dicamba after its foliar application to these four plant species. The metabolism of dicamba appear to follow: hydroxylation of dicamba at the 5-position to form 5-OH dicamba; O-demethylation of 5-OH dicamba to form DCGA; O-demethylation of dicamba to form DCSA; O-demethylation of dicamba and hydroxylation to form DCGA; and conjugation of 5-OH dicamba and DCSA with glucose to form the β-D-glucosides.
Environmental fate in soil
The Meeting reviewed information on aerobic soil metabolism, aqueous photolysis and rotational crop study.
Aerobic soil metabolism
Aerobic soil metabolism studies were conducted using 14C-dicamba applied to various soils and incubated under aerobic conditions at 20–25 C. Under aerobic conditions, dicamba applied to soil was degraded very rapidly with O-demethylation, which was induced by microorganisms. DCSA was the predominant degradate in soil with its maximum level at 14–59% of the applied radioactivity. It is further degraded to 0.1–15% of the applied radioactivity at the termination of studies. A small amount of 2,5-diOH dicamba was also observed indicating possible hydroxylation of DCSA. Mineralization in the presence of microorganism was also rapid and amounting to 27–67% of the applied radioactivity at the termination of studies.
Components associated with fulvic acid were low with the maximum at 1.4–11% of applied radioactivity. However those associated with humic acid were higher with the maximum at 16–34% of the applied radioactivity.
Calculated half-life of dicamba ranged between 2.1 day and 26 days under laboratory conditions at 20–25 °C. That of DCSA ranged between 1.7 days and 45 days. These values indicate that dicamba is not persistent in soil under laboratory conditions.
Field dissipation studies with the application rate of 480 g ai/ ha confirmed fast degradation. Only the 0-10 cm soil layer contained significant amount of dicamba at the beginning of the study and the 10-20 cm and 20-30 cam soil layers contained trace amounts of dicamba. Dicamba was rapidly degraded to < 0.01 mg/kg within 21 days.
DCSA was found only in the top 0–10 cm soil layer at a maximum of 0.03 mg/kg between 6 days and 14 days after treatment. After 28 days, it also decreased to 0.01 mg/kg or less.
Dicamba and DCSA were shown to be not persistent in soil in the field.
In the other field studies with application rate of 360 g/ha, dicamba applied to soil surface decreased rapidly to < 0.01–0.29 mg/kg in the top 10 cm soil in 2–3 days after application. Within 30–60 days after treatment, dicamba decreased to 0.01 mg/kg or below.
DCSA was formed during the test period. In one study it, reached its maximum between 7 days and 15 days after application at 0.09 mg/kg and decreased thereafter to 0.02–0.05 mg/kg 120 days after application.
Calculated half-life of dicamba ranged between 1.4 and 11 days under the field condition and that for DCSA was about 10 days. These results also confirm that neither dicamba nor DCSA is persistent in soil.
Degradation pathway of dicamba in aerobic soil appears to involve O-demethylation of dicamba to form DCSA; hydroxylation of DCSA to form 2,5-diOH dicamba; hydroxylation of

Dicamba 1075
dicamba to form 5-OH dicamba followed by O-demethylation to form 2,5-diOH dicamba; incorporation of further degradates into soil matrix: and mineralization.
Photolysis on dry soil
Under xenon arc (simulating 40N latitude summer sunlight) at 25 °C, dicamba degraded slowly on dry soil surface with about 20% of dicamba photo-degraded in 30 days. Without irradiation, no significant loss of dicamba was observed in 30 days. This indicates that photolysis on soil surface by light is not regarded as an important degradation pathway for dicamba.
Residues in succeeding crops
In an outdoor confined rotation study, mustard, turnip and wheat were planted at 32, 131 and 369 days after the application of 14C-dicamba at a rate of 560 g ai/ha to soil.
Only samples from rotational crops planted 32 days after soil treatment contained detectable radioactive residues. No radioactive residues were detected in samples from crops planted 131 or 369 days after soil treatment. These results indicate negligible uptake of dicamba by rotational crops from soil. Crops planted 32 days after treatment contained 0.0015 mg/kg (turnip tops) to 0.21 mg/kg (mustard tops) in dicamba equivalents. Wheat forage contained 0.033 mg/kg in dicamba equivalents.
DCSA or 5-OH dicamba was not detected in these crops from all plant back intervals.
These results indicate rapid degradation of dicamba in soil and limited uptake of dicamba into plants. Analysis of soil confirmed the rapid degradation and dissipation of both dicamba and DCSA in soil.
In another rotational crop study with plant back intervals of 214, 301 and 542 days after treatment at a rate of 2.24 kg ai/ha, similar results were observed with the maximum at 0.043 mg/kg in dicamba equivalents in turnip tops from 214 day plant back interval. Analysis of soil also showed rapid degradation and dissipation of dicamba and DCSA in soil.
In the third rotational crop study, collard greens, carrot and barley were planted 30, 120 and 365 days after treatment at a rate of 840 g ai/ha. While these crops planted 30 days after treatment contained radioactive residues at 0.026–9.5 mg/kg in dicamba equivalents, those planted 120 days after treatment contained radioactive residues at < 0.01–0.036 mg/kg and no crop planted 365 days after treatment contained detectable radioactive residues.
It is concluded that no or little dicamba residues were expected to occur in rotational crops.
Methods of analysis
Analytical methods for determination of residues of dicamba and its metabolites were developed for a wide range of matrices of plant and animal origin. In general, these methods employ homogenization, hydrolysis at 95 °C for 1.5 hours and extraction with 1N HCl, neutralization, and re-acidification, extraction with ethyl ether, methylation with diazomethane, clean-up, and analysis using GC/ECD. Confirmation was done using GC/MSD. The HCl hydrolysis process releases conjugated dicamba and its metabolites.
The methods for plant matrices were validated for each analyte at 0.01–1.0 mg/kg, and in case of pasture grass and hay at 20–100 mg/kg.
Method AM-0-766A was successfully validated at the fortification levels of 0.01–0.50 mg/kg for dicamba and DCSA in asparagus.
Method AM-069B and its better presented method AM-0691B-0297-4 were successfully validated (recovery 70–120%) at the fortification levels of 0.05–5.0 mg/kg for dicamba and 5-OH dicamba in barley grain and straw; maize grain, silage, stalk and stover; cotton seed, trash, seed hull, seed meal, crude seed oil and refined seed oil; peanut hay (green); sorghum grain and silage; soya bean seed, forage, stalk and straw; sugar cane leaf and stalk; tomato, tomato juice, tomato pomace and tomato sauce; and wheat grain, silage, straw, bran, germ and flour. It was also validated at fortification

1076 Dicamba
levels of 20–100 mg/kg for dicamba and 5-OH dicamba in pasture grass and hay. However, the overall mean relative standard deviation was slightly higher than 20% (21–23%) for 5-OH dicamba in soya bean seed and forage, and wheat silage.
Method AM-0691B-0297-3 was also successfully validated for the same fortification levels as above for dicamba and 5-OH dicamba in barley grain and straw: maize forage, grain, silage and fodder; wheat grain, and pasture grass and hay. However, the relative standard deviation was slightly higher than 20% (23 and 26%) for 0.10 mg/kg 5-OH dicamba in barley grain and wheat grain.
Method AM-766A-1093-2 involving butylation with diazobutane, was validated successfully for 0.01–3 mg/kg of dicamba and 0.01–0.1 mg/kg of DCSA in asparagus.
Method AM-0941-1094-0, using butylation, rather than methylation, was successfully validated for 0.02–5.0 mg/kg of dicamba and DCSA and 5-OH dicamba in asparagus and soya bean except fortification level of 0.10 mg/kg in soya bean which showed a recovery of 63%. However, overall relative standard deviation of fortified soya bean samples were higher than 20% (25% for dicamba, 28% for DCSA and 25% for 5-OH dicamba.
Method REM 193.01 was successfully validated for the purpose of enforcement for 0.01 and 0.10 mg/kg of dicamba and 5-OH dicamba in maize, whole plant, grain and straw; rape seed; pasture and oranges.
The multiresidue methods described in the FDA PAM were tested for DCSA and 5-OH dicamba. After screening, Protocols C, A and B were tested. While GPC test resulted in recoveries of 5-OH dicamba and DCSA within acceptable range, recoveries of 5-OH dicamba and DCSA in soya bean forage through complete Protocol B were at or below 6%. From the soya bean seed, 5-OH dicamba showed 0% of recovery at all fortified levels.
The methods for animal matrices employ very similar procedures as the methods for plant matrices described above. They were validated for dicamba and DCSA at 0.01–3.0 mg/kg in bovine tissues, milk and eggs.
Method AM-0938-0994-0, using butylation with diazobutane, was successfully validated for 0.01–0.50 mg/kg of dicamba in beef fat, kidney, liver, muscle and milk except that for 0.01 mg/kg fortification to liver, the recovery was 65%. For 0.01–0.50 mg/kg of DCSA, the recoveries of around 65% were seen for beef fat and liver. On the contrary, the recovery of 140% was seen for kidney. Relatively high relative standard deviations (25–47%) were seen for fat, liver and milk. It was successfully validated for muscle. In the confirmatory trial, it was again successfully validated for 0.1–3.0 mg/kg dicamba in beef fat and liver and for 0.10–0.50 mg/kg DCSA in fat. However, in the confirmatory trial, recoveries of 0.75–3.0 mg/kg DCSA in liver were in a range of 50–56%.
Method GRM022.03A using N-(tert-butyldimethylsilyl)-N-methyl-trifluoroacetamide to produce tertiary butyl demethyl silyl esters was successfully validated as enforcement method for 0.01 and 0.10 mg/kg of dicamba and DCSA in eggs, milk, beef muscle, fat, liver and kidney. However, in the second validation study, the method was successfully validated only for 0.01 and 0.10 mg/kg dicamba in eggs, milk, beef muscle, liver and kidney and 0.01 and 0.10 mg/kg DCSA in muscle and liver.
In most methods, limit of quantitation was 0.01 mg/kg. For some matrices, such as asparagus, soya beans and cotton, the LOQs were higher at 0.02 mg/kg.
The methods used in cattle feeding studies were not described among the analytical methods. The method used in the 1979 studies determined dicamba and DCSA inseparably as methyl ester of dicamba using GC/ECD.
Stability of residues in stored analytical samples
Stability of dicamba and its metabolites (fortification level of 0.1–0.5 mg/kg) in homogenised asparagus, soya bean, maize and sorghum stored in deep freezer was investigated 3–36 months reflecting the sample storage periods in residue trials.

Dicamba 1077
In asparagus, remaining dicamba and DCSA were 75% and 81% respectively after 104 days of frozen storage, and remaining 5-OH dicamba was 87% (unadjusted for procedural recovery) after 119 days frozen storage. In these specified time, dicamba, DCSA and 5-OH dicamba are stable in the frozen storage.
After frozen storage for 81 days, residues of dicamba and 5-OH dicamba were stable in sugar cane, and for 60 days in bagasse and final molasses with more than 95% of the original residues remaining.
After frozen storage for 3 months, residues of dicamba and 5-OH dicamba were stable in soya bean with 79% and 91% of the original residues remaining respectively. They were similarly stable in refined soya bean oil with 79% and 86% remaining respectively. However, 63% and 65% of DCSA were remaining after 3 month frozen storage in seeds and refined oil showing some degradation but procedural recoveries were also low at 68% and 71% in seeds and refined oil respectively.
Dicamba in maize grain, forage, fodder and silage was stable frozen up to 36 months. 5-OH dicamba was stable frozen for up to 36 months in maize grain and forage but up to only 3 months in fodder and silage.
Dicamba and 5-OH dicamba were stable up to 5 months in sorghum grain and up to 2 months in grain dust.
Dicamba was demonstrated to be stable frozen up to 18 months in animal tissues. DCSA was generally stable for the same period in animal tissues but, in liver and muscle, showed to be unstable beyond 3 months.
Definition of the residue
In goats, cows and hens, metabolism of dicamba was limited. The parent compound remained as major components in ruminant and avian tissues. In goats and cows, much smaller amount of DCSA was found in liver and kidney. In hen metabolism studies after oral administration of dicamba at a dose level equivalent to 10 ppm, 2A36DCP was identified from liver extract at 0.001 mg/kg (36% of TRR) while DCSA was not detected from analysed matrices, liver, kidney or eggs.
In soya bean and cotton, the predominant residue was dicamba. In soya bean much less amount of 5-OH dicamba was detected. While DCSA was not found after early podfill stage foliar treatment, it was found at a very small amount after late senescent stage foliar application.
In sugar cane, major residues were 5-OH dicamba and dicamba with a very small amount of DCGA after foliar application.
In wheat grain, forage and straw, free metabolites were all < 0.01 mg/kg. Dicamba was predominant in grain while 5-OH dicamba was the predominant residue in straw.
Sufficiently validated GC/ECD methods were available for determining the parent compound, 5-OH dicamba and DCSA in a wide range of plant commodities and animal tissues, milk and eggs.
Based on the above findings, the Meeting considered that the parent dicamba was suitable residue for enforcement.
However, as DCSA is a major metabolite in goats and cows and in the cattle feeding study DCSA was not separately determined from dicamba, the Meeting decided to include DCSA in the residue definition for both enforcement and estimation of dietary intake for animal commodities. In many trials on crops, DCSA was not determined.
5-OH dicamba, a major metabolite in plants, is formed in significant amounts in some plant species, the Meeting decided to include this compound in the residue definition for plant commodities for estimation of dietary intake.
Dicamba has logPow of –0.5 and –1.8 at pH 5 and 7, respectively, at 25 C, indicating that dicamba is not fat-soluble. In animal metabolism studies, there was no specific residue concentration found in tissues with higher fat content.

1078 Dicamba
The Meeting recommended the following residue definition for plant and animal commodities:
Definition of the residue for plant commodities (for compliance with the MRL): Dicamba
Definition of the residue (for estimation of dietary intake) for plant commodities: Sum of dicamba and 5-OH dicamba expressed as dicamba
Definition of the residue (for compliance with the MRL and for estimation of dietary intake) for animal commodities: Sum of dicamba and DCSA
Residue is not fat-soluble.
Results of supervised residue trials on crops
The Meeting received supervised trial data for dicamba on sweet corn, soya bean, asparagus, barley, maize (field corn), sorghum, wheat, sugar cane, cotton and pasture grasses. All trials were conducted in the USA.
For all analytes and matrices, generally the LOQ was 0.01 mg/kg unless as otherwise stated.
For summing up the total residues, if dicamba, 5-OH dicamba and DCSA were below the LOQ, the LOQ value of each was used for calculation.
Sweet corn
Nine supervised trials were conducted. Two treatments were applied side-by-side consisting of two applications of 0.14 kg ai/ha (total 0.28 kg ai/ha; 50% WG) and two applications of 0.28 kg ai/ha (total 0.56 kg ai/ha; 480 g/L SL). The timings for the sequential applications were early post-emergence (12 inch tall corn plant) and mid post-emergence (24 inch tall corn plant). The LOQ was 0.02 mg/kg for dicamba and 5-OH dicamba. DCSA was not determined.
The US GAP allows one application at a rate of 0. 14 kg ai/ha with a PHI of 72 days.
The trials were conducted with 2 applications at a rate of 0.14 kg ai/ha with PHI of 21–60 days. Under this condition, which would lead to higher residues, resulting dicamba residues were < 0.02 (8) and 0.02 mg/kg.
Taking into consideration the trial condition, the Meeting estimated a maximum residue level of 0.02 mg/kg for sweet corn.
Corresponding total residues of dicamba and 5-OH dicamba in rank order were: < 0.04 (8) and 0.04mg/kg.
The Meeting estimated an STMR and HR at 0.04 and 0.04 mg/kg.
Because residues were mostly below the limit of quantitation the NAFTA calculator was not used.
Soya bean
A total of 23 trials were conducted.
Each formulation was applied at the maximum proposed label rate according to the methods and conditions representing U.S. soya bean production.
US GAP allow two different applications: application of 0.56 kg ai/ha as a broadcast made to the soil surface approximately 14 prior to planting and application of 2.24 kg ai/ha applied approximately 14 days prior to harvest. The PHI is 14 days for the latter use. .
In all the trials, the second application was carried out 7 days before normal harvest, shorter than GAP PHI. In addition, the total applied rate exceeded the maximum seasonal rate. There were significant residues found in soya bean seeds but it is not possible to estimate residue levels at 14 day PHI.

Dicamba 1079
The Meeting concluded that since no trial matched the GAP, no maximum residue level could be recommended.
Asparagus
US GAP allows the use of dicamba in asparagus with one application of 0.56 kg ai/ha (0.56 kg ai/ha total maximum seasonal application) and PHI of one day.
A total of eight supervised field residue trials were conducted. The formulations used at each site were the dimethylamine salt (DMA+), the diglycolamine salt (DGA+), and the sodium salt (Na+) of dicamba. Each formulation was applied at the maximum proposed label rate according to the methods and conditions representing U.S. asparagus production. There was no statistically significant difference in residues after application with different salt type.
Residues from trials matching the GAP were: 0.45, 0.49, 0.58, 0.78, 0.96, 1.1, 2.3 and 3.3 mg/kg.
The Meeting estimated a maximum residue level of 5 mg/kg.
Corresponding total residues of dicamba were: 0.46, 0.50, 0.59, 0.79, 0.97, 1.11, 2.34 and 3.28 mg/kg.
The Meeting estimated an STMR and HR at 0.87 mg/kg and 3.3 mg/kg.
The maximum residue level estimate derived from use of the NAFTA statistical calculator was 6 mg/kg. The Meeting recommended 5 mg/kg as the maximum residue level because only one value among the eight values was above 50% of the value 5.
Barley
US GAP allows two applications: one application of 0.14 kg ai/ha immediately prior to the first joint stage and one application of 0.28 kg ai/ha. The PHI is 7 days.
A total of 11 supervised field residue trials were conducted. The dimethylamine salt (DMA+) of dicamba was applied in five trial locations. Side by side trials with three formulations (the dimethylamine salt (DMA+), the diglycolamine salt (DGA+), and the sodium salt (Na+) of dicamba) were conducted at four locations to determine the similarity of residues from the different salts. The statistical analysis indicated different salt type did not influence residue levels.
Residues of dicamba from trials matching US GAP were: 0.78, 1.1, 1.1, 1.5, 1.6, 1.6, 1.8, 2.7, 2.8 and 5.0 mg/kg.
The Meeting estimated a maximum residue level of 7 mg/kg. An STMR for the estimation of animal dietary burden was estimated to be 1.6 mg/kg.
Corresponding total residues of dicamba in rank order were: 0.83, 1.1, 1.1, 1.7, 1.7, 1.7, 1.9, 2.8, 2.9 and 5.1 mg/kg.
The Meeting estimated an STMR at 1.7 mg/kg.
The maximum residue level estimate derived from use of the NAFTA statistical calculator was 7 mg/kg, which was in agreement with the Meetings estimate.
Maize (field corn)
US GAP allows one to two applications per season, for a maximum seasonal application of 0.84 kg ai/ha. The normal use pattern consists of one application of 0.56 kg ai/ha applied pre-plant, pre-emergence or early post-emergence (up to the 5 leaf stage) and, if required, one application of 0.28 kg ai/ha applied late post-emergence (20–90 cm tall or 15 days before tassel emergence). No PHI was specified.
A total of 19 supervised field residue trials were conducted. The dimethylamine salt (DMA+) of dicamba was applied in 11 trial locations. Side by side trials with three formulations (the

1080 Dicamba
dimethylamine salt (DMA+), the diglycolamine salt (DGA+), and the sodium salt (Na+) of dicamba) were conducted at eight locations resulting in no significant effect of salt type on residues.
There was a fallow application in the previous fall. Since in the USA one season for maize is specified to be from March to October, this application is not regarded to be included in the maximum seasonal rate
Residues of dicamba from trials matching GAP were all < 0.01 mg/kg.
The Meeting estimated a maximum residue level of 0.01(*) mg/kg for maize. An STMR for the estimation of animal dietary burden was estimated to be 0.01mg/kg.
Corresponding total residues of dicamba in rank order were: < 0.02 (16), 0.02, (2) and 0.03 mg/kg.
The Meeting estimated an STMR at 0.02 mg/kg.
Sorghum
US GAP allows two applications: one application of 0.28 kg ai/ha immediately prior to the first joint stage and one application of 0.28 kg ai/ha applied at the soft dough stage. The PHI is 30 days.
A total of 11 supervised field residue trials were conducted.
Residues of dicamba from trials matching GAP were: 0.39, 0.41, 0.78, 0.97, 1.0, 1.2, 1.2, 1.3 and 2.0 mg/kg.
The Meeting estimated a maximum residue level of 4 mg/kg. An STMR for the estimation of animal dietary burden was estimated to be 1.0 mg/kg.
Corresponding total residues of dicamba in rank order were: 0.54, 0.85, 1.3, 1.7, 2.0, 2.2, 2.4, 2.7 and 3.2 mg/kg.
The Meeting estimated an STMR at 2.0 mg/kg.
The maximum residue level estimate derived from use of the NAFTA calculator was 3.5 mg/kg, which was in agreement with the Meetings estimate. As the FAO Manual recommends to use one significant digit at this level, the Meeting recommended 4 mg/kg as maximum residue level.
Wheat
US GAP allows two applications: one spring application of 0.28 kg ai/ha immediately prior to the first joint stage and one broadcast application of 0.28 kg ai/ha. The PHI is 7 days.
A total of 20 supervised field residue trials were conducted,
Residues of dicamba from trials matching GAP were: 0.05, 0.07, 0.08, 0.11, 0.11, 0.11, 0.16, 0.19, 0.19, 0.25, 0.29, 0.34, 0.35, 0.47, 0.53, 0.81, 0.84 and 1.1 mg/kg.
The Meeting estimated a maximum residue level of 2 mg/kg. An STMR for the estimation of animal dietary burden was estimated to be 0.22 mg/kg.
Corresponding total residues of dicamba were: 0.06, 0.09, 0.09, 0.12, 0.12, 0.16, 0.17, 0.20, 0.22, 0.30, 0.35, 0.37, 0.39, 0.50, 0.63, 1.1, 1.2 and 1.3 mg/kg.
The Meeting estimated an STMR at 0.26 mg/kg.
The maximum residue level estimate derived from use of the NAFTA calculator was 2 mg/kg, which was in agreement with the Meetings estimate.
Sugar cane
US GAP allows one application at 2.24 kg ai/ha (2.24 kg ai/ha total maximum seasonal application) applied at lay-by. Under these conditions, a PHI is not necessary.
A total of eight supervised field residue trials were conducted.

Dicamba 1081
Residues of dicamba from trials matching GAP were: < 0.01, 0.01, 0.02, 0.03, 0.03, 0.05, 0.05, 0.96 mg/kg.
The Meeting estimated a maximum residue level of 1 mg/kg. An STMR for the estimation of STMR-P was estimated to be 0.03 mg/kg.
Corresponding total residues of dicamba were: 0.02, 0.03, 0.05, 0.08, 0.11, 0.13, 0.20 and 1.1 mg/kg.
The Meeting estimated an STMR and HR at 0.095 mg/kg and 1.1 mg/kg
The maximum residue level estimate derived from use of the NAFTA calculator was 1.3 mg/kg. As the FAO Manual recommends to use one significant digit at this level, the Meeting recommended 1 mg/kg as maximum residue level.
Cotton
The GAP of the USA allows a single pre-plant application at 0.28 kg ai/ha. Residue trials were conducted at 0.56 kg ai/ha, which was the originally proposed application rate. Under this use condition, a PHI is not necessary.
A total of 12 supervised field residue trials were conducted. The LOQ was 0.04 mg/kg due to interference.
With the double rate, residues of dicamba were all < 0.04 mg/kg.
The Meeting therefore decided to estimate a maximum residue level of 0.04 (*) mg/kg for cotton seed.
As the LOQ is higher than those in other trials and application was made pre-plant possibly leading to nil residue situation, when both dicamba and 5-OH dicamba were < 0.04 mg/kg, the total residues were calculated to be < 0.04 mg/kg. When either dicamba or 5-OH dicamba was < 0.04 mg/kg and the other was higher than 0.04 mg/kg, residues at < 0.04 mg/kg were assumed to be zero in calculating the total residues.
Corresponding total residues of dicamba were: < 0.04 (11) and 0.05 mg/kg.
Since the trials were conducted at double rate with relatively high LOQ, the Meeting estimated an STMR at 0.04 mg/kg.
Soya bean forage and hay
Soya bean forage and hay samples were collected before the second application was made to avoid abscission. Therefore, residues in these commodities came from pre-plant application.
Since the residues from the pre-plant application were expected to be very low and harvesting soya bean plants before harvesting soya bean seeds does not seem to be a common practice, the Meeting did not estimate a maximum residue level for soya bean forage and hay.
Barley and wheat straw
Since barley and wheat straw are not distinguishable in trade, their trial results were evaluated together. US GAP for barley and wheat were similar, see under the trials reported for the specific raw agricultural commodities.
Residues of dicamba in barley straw were: 1.0, 2.5, 3.1, 3.6, 3.6, 3.7, 5.5, 6.6, 10 and 30 mg/kg.
Residues of dicamba in wheat straw were: 0.40, 0.60, 1.1, 1.4, 2.2, 2.4, 2.4, 3.2, 3.6, 4.0, 4.4, 5.0, 5.2, 5.3, 7.1, 7.3, 21 and 23 mg/kg.
The Meeting concluded that the residue populations are similar and estimated a maximum residue level of 50 mg/kg. The highest dicamba residue and median residue for the estimation of animal dietary burden were 30 and 3.65 mg/kg for barley straw and 23 and 3.8 mg/kg for wheat straw.
1082 Dicamba
The maximum residue level estimate derived from use of the NAFTA statistical calculator was 25 mg/kg based on barley straw data and 40 mg/kg based on wheat straw data. The Meeting recommended a maximum residue level of 50 mg/kg in order to cover both barley and wheat straw
Grasses forage and hay
The GAP of the USA allows one application of dicamba at 0.56 kg ai/ha. PHI for hay is 37 days and the shortest PHI for forage is 7 days.
The Meeting received trials data for various kinds of grasses, which are reviewed together in this evaluation.
Residues of dicamba in hay from those trials conducted according to GAP were: 1.4, 2.9, 3.1, 3.2, 3.4, 4.0, 6.3, 6.8, 6.9, 8.3, 8.6, 16 and 19 mg/kg.
The Meeting estimated a maximum residue level of 30 mg/kg for hay. The highest dicamba residue and median residue for the estimation of animal dietary burden were 19 and 6.3 mg/kg.
The maximum residue level estimate derived from use of the NAFTA statistical calculator was 30 mg/kg, which was in agreement with the estimate of the Meeting.
Residues of dicamba in forage from those trials conducted according to GAP were: 2.2, 2.4, 6.6, 6.6, 6.9, 9.8, 11, 11, 12, 15, 15, 25 and 35 mg/kg.
The Meeting estimated the highest residue of 35 mg/kg and median residue of 11 mg/kg (fresh weight basis) for the calculation of animal dietary burden. These are equivalent to 140 mg/kg and 44 mg/kg on a dry weight basis after applying the dry matter of 25%.
Maize forage and fodder
Residues of dicamba in maize fodder from trials according to US GAP (total 0.56 kg ai/ha, 2 applications with a PHI of 60 days) were: 0.01, 0.01, 0.03, 0.04, 0.05, 0.06, 0.06, 0.06, 0.06, 0.06, 0.08, 0.08, 0.10, 0.10, 0.13, 0.24, 0.18, 0.20 and 0.33 mg/kg.
For trials on sweet corn, dicamba was applied twice instead of once as specified in GAP. However, even with two applications, residues of dicamba were mostly < 0.02 mg/kg and the highest residue was 0.05 mg/kg.
Based on trials on maize, the Meeting estimated a maximum residue level of 0.6 mg/kg for maize fodder. The highest dicamba residue and median residue for the estimation of animal burden were 0.33 and 0.06 mg/kg, respectively using the dry matter of 40%.
The maximum residue level estimate derived from use of the NAFTA statistical calculator was 0.60 mg/kg, which was in agreement with the estimate of the Meeting.
Residues of dicamba in forage from trials matching GAP were: 0.02, 0.06, 0.07, 0.07, 0.08, 0.09, 0.10, 0.12, 0.14, 0.16, 0.16, 0.18, 0.18, 0.19, 0.20, 0.25, 0.30, 0.30 and 0.31 mg/kg.
The Meeting estimated the highest residue and median residue for calculating animal dietary burden to be 0.31 and 0.16 mg/kg for maize forage on a fresh weight basis which are equivalent to 0.775 mg/kg and 0.40 mg/kg respectively.
Sorghum fodder
Residues of dicamba in sorghum fodder according to US GAP were: 0.57, 0.64, 0.81, 1.3, 1.3, 1.4, 1.6, 4.3 and 5.4 mg/kg.
The Meeting estimated a maximum residue level of 8 mg/kg. The highest dicamba residue and median residue for the estimation of animal dietary burden were 5.4 and 1.3 mg/kg.
The maximum residue level estimate derived from use of the NAFTA statistical calculator was 9 mg/kg. As the Meeting does not normally use values 9 10n, such as 0.9 or 9, the Meeting decided to recommend 8 mg/kg as maximum residue level

Dicamba 1083
Cotton gin trash
Residues of dicamba were even at double rate mostly < 0.04 mg/kg. In two trials residues of 0.05 and 0.06 mg/kg were observed. Since cotton gin trash is not an important trade item, no maximum residue level was recommended. The highest dicamba residue and median residue were 0.06 and 0.04 mg/kg. Although the trials were not in compliance with the current US GAP, the above mentioned values can be used for calculation of animal burden as an STMR and highest residue.
Fate of residues during processing
The Meeting received information on processing of soya beans to meal and oil; maize to flour, grits, meal, starch and oil; sugar cane to molasses and sugar; and cotton to meal and oil.
Processing factors were calculated for the processed commodities of the above and STMR-Ps for these commodities are shown below:
Processed Orange Product
Processing factor STMR/STMR-P (mg/kg) Dicamba Total residues
Soya bean Refined oil < 0.019 < 0.036 Maize 0.02 Flour 0.26 0.28 0.0056 Large grits 0.20 0.22 0.0044 Meal 0.069 0.095 0.0019 Crude oil < 0.029 < 0.058 0.00116 Wheat 0.26 Bran 0.99 1.0 0.26 Flour 0.052 < 0.070 0.02 Sugar cane 0.14 Molasses 42 24 3.4 White sugar < 0.77 < 0.37 0.05 Cotton seed 0.04 Refined oil < 0.01 < 0.02 0.008
As there is no concentration of dicamba and 5-OH dicamba observed in these processed commodities, no maximum residue levels are necessary for these commodities.
For the purpose of calculating animal dietary burden for estimating maximum residue levels for commodities of animal origin, STMR-P for maize hull and gluten, wheat bran and grain dust, sugar cane molasses and bagasse, and cotton seed meal were calculated based on dicamba residues only to be 0.0033, 0.014, 0.26, 2.3, 4.0, 0.198 and 0.07 mg/kg respectively..
Residues in Animal Products
Estimation of dietary burdens
Barley, maize, sorghum and wheat grains; soya bean forage and hay; straw of barley and wheat; grass forage and hay; processed maize byproducts; processed wheat byproducts; processed sugar cane products: and cotton gin trash and processed cotton byproducts may be fed to dairy cattle, beef cattle, broilers and layers. The maximum and dietary burdens were calculated using the highest residue or STMR/STMR-Ps of dicamba in commodities for which maximum residue levels were recommended on a basis of the OECD Animal Feeding Table.
5-OH Dicamba was not included in the calculation of animal burden as the feeding study with 5-OH dicamba resulted in very low uptake of 5-OH (< 0.01 mg/kg) into tissues, milk or blood of cattle at a dose equivalent to 59 ppm in the diet.
Summary of livestock dietary burdens (ppm of dry matter diet)

1084 Dicamba
US/CAN EU Australia Japan
max mean max mean max mean max mean Beef cattle 6.0 2.6 71.2 23.2 140a 44.0b 15.7 5.8 Dairy cattle 64.3 21.1 85.0 27.4 140c 44.0d 27.5 9.2 Broilers 1.4 1.4 1.3 1.3 1.0 1.0 0.84 0.84 Layers 1.4 1.4 15.6e 6.0f 1.0 1.0 0.73 0.73
a c Suitable for estimating maximum residue levels for milk, meat, fat and edible offal of cattle. b d Suitable for estimating STMRs for milk, meat, fat and edible offal of cattle. e Suitable for estimating maximum residue levels for meat, fat and edible offal of poultry and eggs. f Suitable for estimating STMRs for meat, fat and edible offal of poultry and eggs.
Residues in milk and cattle tissues
Lactating dairy cows were dosed daily for 30 consecutive days via gelatin capsules containing dicamba (40–400 ppm in diet).
Significant residues of dicamba and DCSA were found in kidney in all dose groups. However, in muscle, residues of dicamba and DCSA were generally low and < 0.01 mg/kg in the 40 ppm dose group. Residues in all tissues declined after withdrawal period to < 0.01 mg/kg in the 40 and 120 ppm dose groups. However, in kidney residues of 0.056 mg/kg was found in the 120 ppm group. Tissues from the 400 dose group contained significant amount of residues (0.01–0.28 mg/kg).
The maximum residues in milk were 0.023–0.039 mg/g in the 40 ppm dose group, 0.041–0.069 mg/kg in the 120 ppm dose group, and 0.21–0.34 mg/kg in the 400 ppm dose group. Residues in milk declined to < 0.01 mg/kg one day after termination of feeding dicamba.
In another study with 1000 ppm dose for 31 days, significant levels of residues were observed in liver (2.4–5.1 mg/kg) and kidney (9.8–47 mg/kg) . However, after 5 day withdrawal period, residues were reduced to 0.03 mg/kg in kidney and 0.22 mg/kg in liver. Muscle contained 0.11–0.39 mg/kg after 31 days of feeding period.
Milk contained up to 0.51 mg/kg of residues but within two days of withdrawal the concentration declined to < 0.01 mg/kg.
In a third study with 19, 59 and 183 ppm dose groups, no tissues contained residues above 0.01 mg/kg with an exception of 0.02–0.04 mg/kg occasionally found in kidney.
In the 183 ppm dose group, kidney contained up to 0.54 mg/kg of residues. In other tissues, residues above 0.01 mg/kg (up to 0.04 mg/kg) were found.
5-OH dicamba was fed to lactating cows at a dose rate equivalent to 19 ppm in the diet. However, the incorporation of 5-OH dicamba was minimal showing residues mostly below 0.005 mg/kg with occasional observation of 0.005 mg/kg.
Using the dietary burdens for beef and dairy cattle and the results in the lactating cattle feeding study, the maximum residue levels and STMRs were estimated. The calculated residues in cattle tissues and milk are summarised below.
Dietary burden mg/kg Feeding level [mg/kg]
Dicamba and DCSA residues, mg/kg
Milk Muscle Liver Kidney Fat
MRL highest highest highest highest highest 140.0 0.071 0.016 0.082 0.331 0.036 [120/400] [0.06/0.31] [0.014/0.037] [0.072/ 0.207] [0.288/ 0.885] [0.034/0.059] STMR mean mean mean mean mean 44.0 0.021 0.010 0.028 0.160 0.023 [40/120] [0.02/0.04] [< 0.01/0.012] [0.026/0.066] [0.154/0.282] [0.023/0.025]

Dicamba 1085
The Meeting estimated a maximum residue level for dicamba and DCSA in milks, mammalian meat, liver, kidney and fat at 0.2, 0.03, 0.2, 0.7 and 0.07 mg/kg. Based on the maximum residue levels for liver and kidney, the Meeting agreed to recommend a maximum residue level of 0.7 mg/kg for edible offal (mammalian).
STMRs were estimated to be 0.021, 0.010, 0.028 0.160 and 0.023 mg/kg for milks, mammalian meat, liver, kidney and fat. HRs were estimated to be 0.016, 0.082, 0.331 and 0.036 mg/kg for mammalian meat, liver, kidney and fat.
Residues in eggs and poultry tissues
Laying hens were fed with dicamba at a rate equivalent to 2, 6 and 20 ppm in the diet for 28 consecutive days. Tissues from the 2 and 6 ppm group, no residues above 0.01 mg/kg were observed except in liver up to 0.023 mg/kg of residues were found. In the 20 ppm dose group, up to 0.068 mg/kg of residues were found in liver, fat, skin and breast muscle. The residue concentration was lower in muscle than in other tissues.
Residues in pooled egg samples were < 0.01 mg/kg.
Using the dietary burdens for poultry broiler and layer and the results in the laying hen feeding study, the maximum residue levels and STMRs were estimated. The calculated residues in cattle tissues and milk are summarised below.
Dietary burden mg/kg Feeding level [mg/kg]
Dicamba residues, mg/kg
Eggs Muscle Liver Fat
MRL highest highest highest highest 15.6 < 0.01 0.012 0.044 0.020 [6/20] [< 0.01/< 0.01] [< 0.01/0.013] [0.023/0.053] [< 0.01/0.025] STMR Mean Mean Mean mean 6 < 0.01 < 0.01 < 0.01 < 0.01 [6] [< 0.01] [< 0.01] [< 0.01] [< 0.01]
The Meeting estimated a maximum residue level for dicamba and DCSA in eggs, poultry meat, liver and fat at 0.01*, 0.02, 0.07 and 0.04 mg/kg. Based on the maximum residue level for liver, the Meeting recommended a maximum residue level of 0.07 mg/kg for edible offal of poultry.
STMRs were estimated to be 0.01, 0.01, 0.01 and 0.01 mg/kg for eggs, poultry meat, liver and fat. HRs were estimated to be 0.01, 0.012, 0.044 and 0.01 mg/kg for these commodities.
RECOMMENDATIONS
On the basis of the data from supervised trials the Meeting concluded that the residue levels listed below are suitable for establishing maximum residue limits and for IEDI and IESTI assessment.
Definition of the residue for compliance with MRLs for plant commodities: Dicamba
Definition of residues for estimation of dietary intake for plant commodities: Dicamba and 5-OH dicamba
Definition of the residue for compliance with MRLs and for estimation of dietary intake for animal commodities: Dicamba and 3,6-dichlorosalicylic acid (DCSA) expressed as dicamba
Residue is not fat-soluble.

1086 Dicamba
Commodity Recommended maximum residue level, mg/kg STMR/STMR-P
mg/kg HR/HR-P mg/kg CCN Name New Previous
VS 0621 Asparagus 5 0.87 3.3 GC 0640 Barley 7 1.7
1.6 (ab) -
AS 0640 Barley straw 50 3.65 (ab) 30 (ab) SO 0691 Cotton seed 0.04* 0.04 - OR 0691 Cotton seed oil, edible 0.008 AS 0162 Hay or fodder (dry) of grasses 30 6.3 (ab) 19 (ab) Grass forage 44 (ab) 140 (ab) MO 0105 Edible offal (Mammalian) 0.7 0.160(kidney)
0.028 (liver) 0.331 (kidney) 0.082 (liver)
GC 0645 Maize 0.01* 0.02 0.01 (ab)
-
OC 0645 Maize oil, crude 0.00116 - AS 0645 Maize fodder 0.6 0.06 (ab) 0.33 (ab) AF 0645 Maize forage 0.40 (ab) 0.775 (ab) MF 0100 Mammalian fats (except milk fats) 0.07 0.023 0.036 MM 0095 Meat (from mammals other than
marine mammals) 0.03 0.01 0.016
ML 0106 Milks 0.2 0.021 - PF 0111 Poultry fats 0.04 0.01 0.01 PM 0110 Poultry meat 0.02 0.01 0.012 PO 0111 Poultry, edible offal of 0.07 0.01 (liver) 0.044 (liver) PE 0112 Eggs 0.01* 0.01 0.01 GC 0651 Sorghum 4 2.0
1.0 (ab) -
AS 0651 Sorghum straw and fodder, dry 8 1.3 (ab) 5.4 (ab) GS 0659 Sugar cane 1 0.095 1.1 DM 0659 Molasses 3.4
4.0 (ab)
White sugar 0.05 VO 1275 Sweet corn (kernel) 0.02 0.04 0.04 GC 0654 Wheat 2 0.26
0.22 (ab) -
CM 0654 Wheat bran unprocessed 0.26 CF 1211 Wheat flour 0.02 AS 0654 Wheat straw 50 3.8 (ab) 23 (ab)
( ab): highest residue and median residue for the estimation of animal dietary burden expressed on a dry weight basis (residues of dicamba only)
DIETARY RISK ASSESSMENT
Long-term intake
The International Estimated Dietary Intakes (IEDIs) of dicamba were calculated for the 13 GEMS/Food cluster diets using STMRs and STMR-Ps estimated by the current Meeting (see Annex 3 of the 2010 JMPR Report). The ADI is 0–0.3 mg/kg bw and the calculated IEDIs were 0–1% of the maximum ADI. The Meeting concluded that the long-term intake of residues of dicamba resulting from the uses considered by the current JMPR is unlikely to present a public health concern.
Short-term intake
The International Estimated Short-Term Intakes (IESTI) of dicamba were calculated for food commodities and their processed commodities using HRs/HR-Ps or STMRs/STMR-Ps estimated by the current Meeting (see Annex 4 of the 2010 JMPR Report). The ARfD is 0.5 mg/kg and the

Dicamba 1087
calculated IESTIs were 0–4% of the ARfD for the general population and 0–9% of the ARfD for children. The Meeting concluded that the short-term intake of residues of dicamba, when used in ways that have been considered by the JMPR, is unlikely to present a public health concern.
REFERENCES
Author(s) Year Title, Report reference, Published/unpublished Report No. Chirchirillo M.T., Kim J.S.
1968 Biodegradation of Banvel D under varying conditions of temperature and moisture Velsicol Chemical Corp.; Chicago IL; United States of America 1968/5003 unpublished
1968/5003
John L.E.S., Lisk D.J.
1969 Metabolism of Banvel-D herbicide in a dairy cow 1969/5009 No, not subject to GLP regulations J. Dairy Sci., vol. 52, no. 3, 392-393
1969/5009
Tims M.O. et al.
1979 Effect of feeding Dicamba to dairy cattle (Residues in milk) Analytical Development Corp.; Monument CO; United States of America 1979/5063 unpublished
1979/5063
Gilsdorf D.V., Weissenburger B.
1979 Effect of feeding Dicamba to dairy cattle (Residues in liver, kidney, muscle and fat) Analytical Development Corp.; Monument CO; United States of America 1979/5064 unpublished
1979/5064
Oehler D.D., Ivie G.W.
1980 Metabolic fate of the herbicide Dicamba in a lactating cow 1980/5080 Journal of Agricultural and Food Chemistry, Vol. 28, No. 4, 685-689
1980/5080
Cahill W.P. 1980 Analysis of processed cottonseed fractions for Dicamba Velsicol Chemical Corp.; Chicago IL; United States of America 1980/5091 unpublished
1980/5091
Cahill W.P. 1981 Analysis of processed cottonseed fractions for Dicamba and 5-hydroxy Dicamba Velsicol Chemical Corp.; Chicago IL; United States of America 1981/5173 unpublished
1981/5173
Butz R.G., Atallah Y.H.
1981a Metabolic fate of Dicamba in sugarcane plants Velsicol Chemical Corp.; Chicago IL; United States of America 1981/5192 unpublished
1981/5192
Butz R.G., Atallah Y.H.
1981b Extractability of Dicamba residues from sugarcane leaves Velsicol Chemical Corp.; Chicago IL; United States of America 1981/5230 unpublished
1981/5230
Butz R.G., Atallah Y.H.
1982 Foliar absorption, metabolism and translocation of Dicamba by soya beans at early podfill and late senescent stages Velsicol Chemical Corp.; Chicago IL; United States of America 1982/5127 unpublished
1982/5127
Butz R.G. 1982 Foliar absorption metabolism and translocation of Dicamba by cotton plants Velsicol Chemical Corp.; Chicago IL; United States of America 1982/5140 unpublished
1982/5140
Yu C.C., Atallah Y.H.
1983 Pharmacokinetics and metabolism of 14C-Dicamba in hens Velsicol Chemical Corp.; Chicago IL; United States of America 1983/5142 unpublished
1983/5142
Butz R.G. et al. 1984 Characterisation of radiocarbon from seeds of 14C-Dicamba treated cotton plants after acid hydrolysis Velsicol Chemical Corp.; Chicago IL; United States of America 1984/5055 unpublished
1984/5055

1088 Dicamba
Author(s) Year Title, Report reference, Published/unpublished Report No. Cahill W.P., Johnson L.R.
1984 Determination of Dicamba residue in laying hen tissues and eggs after a 28 day feeding study Velsicol Chemical Corp.; Chicago IL; United States of America 1984/5078 unpublished
1984/5078
Anonymous 1985 Determination of Dicamba and Dichlorosalicylic acid in soil Sandoz Crop Protection Corp.; Des Plaines IL; United States of America 1985/5108 unpublished
1985/5108
Cahill W.P. 1986 Analysis of egg samples from a Dicamba/chicken feeding study Velsicol Chemical Corp.; Chicago IL; United States of America 1986/5149 unpublished
1986/5149
Anonymous 1986 Determination of Dicamba and 5-Hydroxy Dicamba residues in barley, corn, cotton, cotton processing fraction, pasture grass, peanut, sorghum, soya bean, sugar cane, tomato, tomato processed fractions, wheat and wheat processed fractions (GC) Sandoz Crop Protection Corp.; Chicago IL; United States of America 1986/5181 unpublished
1986/5181
Krueger J.P., Butz R.G.
1988 Aerobic soil metabolism of Dicamba Sandoz Crop Protection Corp.; Des Plaines IL; United States of America 1988/5458 unpublished
1988/5458
Butz R.G. et al. 1988 Uptake, translocation and metabolism of Dicamba herbicide in cotton after fallow application Sandoz Crop Protection Corp.; Des Plaines IL; United States of America 1988/5471 unpublished
1988/5471
Moore P.A., Butz R.G.
1989 Confined accumulation studies of Dicamba on rotational crops after spring application Sandoz Crop Protection Corp.; Des Plaines IL; United States of America 1989/5231 unpublished
1989/5231
Bade T.R. 1989 Dicamba Residues in Corn Processing Fractions From a Pre-Harvest Application of Banvel Sandoz Crop Protection Corp.; Des Plaines IL; United States of America 1989/5238 unpublished
1989/5238
Ochsenbein U. 1989 Leaching characteristics of aged residues of Dicamba techn. in two soils RCC Umweltchemie AG; Itingen; Switzerland 1989/5253 Unpublished
1989/5253
Bade T.R. 1990 Dicamba residues in wheat processing fractions from a pre-harvest application of Banvel Sandoz Crop Protection Corp.; Des Plaines IL; United States of America 1990/5174 unpublished
1990/5174
Hertl P. 1991a Dissipation of residues of Dicamba from field soil after application of Banvel 4S to corn under field conditions in Germany, 1989 (Field soil dissipation/leaching study) Sandoz Agro Ltd.; Basel; Switzerland 1991/5278 unpublished
1991/5278
Hertl P. 1991b Dissipation of residues of Dicamba from field soil after application of Banvel 4S to corn under field conditions in Germany, 1989 (Field soil dissipation/leaching study) Sandoz Agro Ltd.; Basel; Switzerland 1991/5279 unpublished
1991/5279
Hertl P. 1991c Dissipation of residues of Dicamba from field soil after application of Banvel 4S to corn under field conditions in Germany, 1989 (Field soil dissipation/leaching study) Sandoz Agro Ltd.; Basel; Switzerland 1991/5280 unpublished
1991/5280

Dicamba 1089
Author(s) Year Title, Report reference, Published/unpublished Report No. Moore P.A. 1991 Confined accumulation studies of Dicamba on rotational crops after fall
application Sandoz Crop Protection Corp.; Des Plaines IL; United States of America 1991/5281 unpublished
1991/5281
Hertl P. 1991d Dissipation of residues of Dicamba from field soil after application of Banvel 4S to corn under field conditions in Germany, 1989 (Field soil dissipation/leaching study) Sandoz Agro Ltd.; Basel; Switzerland 1991/5282 unpublished
1991/5282
Figge K. 1992 Quantitative investigation of the degradation and percolation behaviour of the test substance Dicamba in an agriculturally utilized soil - Outdoor lysimeter study NATEC - Institut fuer naturwissenschaftlich-technische Dienste GmbH; Hamburg; Germany Fed.Rep. 1992/5243 unpublished
1992/5243
Figge K. 1993 Aerobic soil metabolism of 14C-Dicamba NATEC - Institut fuer naturwissenschaftlich-technische Dienste GmbH; Hamburg; Germany Fed.Rep. 1993/5000159 unpublished
1993/5000159
Sen P.K. et al. 1993a Dicamba: Photodegradation study in pH 7 aqueous solution Sandoz Agro Inc.; Des Plaines IL; United States of America 1993/5237 unpublished
1993/5237
Sen P.K. et al. 1993b Dicamba: Photodegradation study on soil Sandoz Agro Inc.; Des Plaines IL; United States of America 1993/5244 unpublished
1993/5244
Tong T.-M.R. 1993a Soil adsorption and desorption of Dicamba, unaged, by the batch, equilibrium method Sandoz Agro Inc.; Des Plaines IL; United States of America 1993/5247 unpublished
1993/5247
Bebel J.C. 1993 Dissociation constant of Dicamba Sandoz Agro Inc.; Des Plaines IL; United States of America 1993/5249 unpublished
1993/5249
Widlak A. 1993b Physical state of Dicamba, technical Sandoz Agro Inc.; Des Plaines IL; United States of America 1993/5252 unpublished
1993/5252
Pal A. 1993 Density of Dicamba, technical Sandoz Agro Inc.; Des Plaines IL; United States of America 1993/5254 unpublished
1993/5254
Jimenez N. 1993 Determination of Dicamba and 5-Hydroxy Dicamba residues in barley, corn, cotton, cotton processed fractions, pasture grass, peanuts, sorghum, soya bean, sugar cane, tomato, tomato processed fractions, wheat and wheat processed fractions (GC) Sandoz Agro Inc.; Des Plaines IL; United States of America 1993/5261 unpublished
1993/5261
Buck B.L. 1993a Determination of odor for Dicamba technical, purified Sandoz Agro Inc.; Des Plaines IL; United States of America 1993/5269 unpublished
1993/5269
Buck B.L. 1993b Determination of odor for Dicamba technical Sandoz Agro Inc.; Des Plaines IL; United States of America 1993/5270 unpublished
1993/5270

1090 Dicamba
Author(s) Year Title, Report reference, Published/unpublished Report No. Widlak A. 1993c Physical state of Dicamba, reference (high purity) grade
Sandoz Agro Inc.; Des Plaines IL; United States of America 1993/5271 unpublished
1993/5271
Tong T.-M.R. 1993b Soil adsorption and desorption of the major soil metabolite of Dicamba, 3,6-dichlorosalicylic acid (3,6-DCSA), by the batch equilibrium method Sandoz Agro Inc.; Des Plaines IL; United States of America 1993/5290 unpublished
1993/5290
Chen H. 1994 Vapor pressure of Dicamba using the Thermal Evolution Analyser Sandoz Agro Inc.; Des Plaines IL; United States of America 1994/5202 unpublished
1994/5202
Clouser A.R. et al.
1994a Crop residue study with Dicamba formulations on asparagus Sandoz Agro Inc.; Des Plaines IL; United States of America 1994/5217 unpublished
1994/5217
Nietschmann D.A., Yu C.C.
1994 Dicamba: Metabolism in laying hens Sandoz Agro Inc.; Des Plaines IL; United States of America 1994/5218 unpublished
1994/5218
Guirguis A.S., Yu C.C.
1994 Metabolism of Dicamba in lactating goats Sandoz Agro Inc.; Des Plaines IL; United States of America 1994/5219 unpublished
1994/5219
Jimenez N.C. 1994a Crop residue studies with Dicamba formulations on grain sorghum Minnesota Valley Testing Laboratories Inc.; New Ulm MN; United States of America 1994/5220 unpublished
1994/5220
Wendt D.R. 1994 Aerobic soil metabolism of Dicamba acid Sandoz Agro Inc.; Des Plaines IL; United States of America 1994/5222 unpublished
1994/5222
Rosas M. 1994 Dicamba residue study on sorghum grain and sorghum processed fractions Sandoz Agro Inc.; Des Plaines IL; United States of America 1994/5232 unpublished
1994/5232
Formanski L.J. 1994b Dicamba residue study on sugar cane and sugar cane processed fractions Sandoz Agro Inc.; Des Plaines IL; United States of America 1994/5233 unpublished
1994/5233
Jimenez, N.C. 1994b Crop residue study with Dicamba formulations on grass forage and hay Sandoz Agro Inc.; Des Plaines IL; United States of America 1994/5295 unpublished
1994/5295
Clouser A.R. et al.
1994b Crop residue study with Dicamba formulations on asparagus Sandoz Agro Inc.; Des Plaines IL; United States of America 1994/5314 unpublished
1994/5314
Baldi B.G. 1994 Confirmatory method trial of the residue method, AM-0938-0994-0: Determination of Dicamba and Dichlorosalicylic acid residues in beef tissues (GC) EN-CAS Analytical Laboratories; Winston-Salem NC; United States of America 1994/5334 unpublished
1994/5334
Pierotti M.V. 1995 Confined accumulation studies of Dicamba on rotational crops Sandoz Agro Inc.; Des Plaines IL; United States of America 1995/5262 unpublished
1995/5262

Dicamba 1091
Author(s) Year Title, Report reference, Published/unpublished Report No. Smith M. 1995 Confirmatory method trial for the residue method, AM-0941-1094-0:
Determination of Dicamba, Dichlorosalicylic acid and 5-hydroxy Dicamba residues in asparagus and soya beans (GC) EPL Bio-Analytical Services Inc.; Harristown IL; United States of America 1995/5278 unpublished
1995/5278
Guirguis M.J. 1995 Crop residue study with Dicamba on cotton Sandoz Agro Inc.; Des Plaines IL; United States of America 1995/5297 unpublished
1995/5297
Jimenez N.C. 1995a Crop residue study with Dicamba formulations on soya beans Sandoz Agro Inc.; Des Plaines IL; United States of America 1995/5298 unpublished
1995/5298
Formanski L.J. et al. 1995 Dicamba residue study on soya bean grain and soya bean processed fractions Sandoz Agro Inc.; Des Plaines IL; United States of America 1995/5299 unpublished
1995/5299
Jimenez N.C. 1995b Stability of Dicamba and 5-Hydroxy Dicamba in stored frozen field corn Minnesota Valley Testing Laboratories Inc.; New Ulm MN; United States of America 1995/5362 unpublished
1995/5362
Murray W.A. 1996 Confirmatory method trial of the residue method, AM-0766A-1093-2, Determination of Dicamba and Dichlorosalicylic acid residues in soil (GC) Triangle Laboratories Inc.; Durham NC; United States of America 1996/5296 unpublished
1996/5296
Jimenez N.C. 1996 Crop residue study with Dicamba formulations on wheat Sandoz Agro Inc.; Des Plaines IL; United States of America 1996/5305 unpublished
1996/5305
Guirguis M.J. 1996 Crop residue and residue decline study with Dicamba formulation on soya bean Sandoz Agro Inc.; Des Plaines IL; United States of America 1996/5312 unpublished
1996/5312
Jimenez N.C. 1996a Crop reside study with Dicamba formulations on barley EPL Bio-Analytical Services Inc.; Harristown IL; United States of America 1996/5314 unpublished
1996/5314
Guirguis M. 1996 Crop residue study with Dicamba formulation on sorghum Sandoz Agro Inc.; Des Plaines IL; United States of America 1996/5329 unpublished
1996/5329
Jimenez N.C. 1996b Crop residue study with Dicamba formulations on field corn EPL Bio-Analytical Services Inc.; Harristown IL; United States of America 1996/5331 unpublished
1996/5331
Formanski L.J. 1996a Crop residue study with Dicamba formulations on sugar cane Sandoz Agro Inc.; Des Plaines IL; United States of America 1996/5334 unpublished
1996/5334
Formanski L.J. 1996b Stability of Dicamba and 3,6-Dichlorosalicylic Acid in stored frozen beef tissues and milk Sandoz Agro Inc.; Des Plaines IL; United States of America 1996/5350 unpublished
1996/5350
Gasser A. 1997 Laboratory validation of an analytical method for the determination of residues of Dicamba and its metabolite 5-hydroxy Dicamba in corn, 1997 Novartis Agro Europe; Huningue; France 1997/5000071 unpublished
1997/5000071

1092 Dicamba
Author(s) Year Title, Report reference, Published/unpublished Report No. Graben M. 1997 Determination of Dicamba and 5-Hydroxy Dicamba residues in barley, corn,
cotton, cotton processed fractions, pasture grass, peanut, sorghum, soya bean, sugar cane, tomato, tomato processed fractions, wheat and wheat processed fractions (GC) Sandoz Agro Inc.; Des Plaines IL; United States of America 1997/5441 unpublished
1997/5441
Stamm E. 1998 Atmospheric oxidation of Dicamba SAN 837 H by hydroxyl radicals; rate estimation Novartis Crop Protection AG; Basel; Switzerland 1998/5000050 unpublished
1998/5000050
Gasser A. 1998 Dicamba (SAN 837): Determination of parent compound and metabolite 5-hydroxy Dicamba by gas chromatography (MSD), plant material Novartis Crop Protection AG; Basel; Switzerland 1998/5000051 unpublished
1998/5000051
Abdel-Baky S., Riley M.E.
1998 Sweet corn residues of Diflufenzopyr and Dicamba resulting from application of Distinct (BAS 662 H) BASF Corp. Agricultural Products Center; Research Triangle Park NC; United States of America 1998/5077 unpublished
1998/5077
Angly H. 1999a Test report 1999.4046.EXP - Explosive properties Institute of Safety & Security; Basel; Switzerland 1999/5000157 unpublished
1999/5000157
Martin N. 1999 Surface tension Solvias AG; Basel; Switzerland 1999/5000158 unpublished
1999/5000158
Burkhard N. 1999 SAN 837 H - Dissociation constant Novartis Crop Protection AG; Basel; Switzerland 1999/5000159 unpublished
1999/5000159
Angly H. 1999b Test report 1999.4046.FLS - Flammability of solids Institute of Safety & Security; Basel; Switzerland 1999/5000162 unpublished
1999/5000162
Oggenfuss P. 1999 Report on spectra Novartis Crop Protection Muenchwilen AG; Muenchwilen; Switzerland 1999/5000164 unpublished
1999/5000164
Angly H. 1999c Test report 1999.4046.OXP - Oxidizing properties of solids Institute of Safety & Security; Basel; Switzerland 1999/5000166 unpublished
1999/5000166
Kettner R. 1999a Octanol/water partition coefficient of SAN 837 Novartis Crop Protection Muenchwilen AG; Muenchwilen; Switzerland 1999/5000167 unpublished
1999/5000167
Das R. 1999 Boiling point/boiling range of SAN 837 Novartis Crop Protection Muenchwilen AG; Muenchwilen; Switzerland 1999/5000168 unpublished
1999/5000168
Kettner R. 1999b Water solubility of SAN 837 Novartis Crop Protection Muenchwilen AG; Muenchwilen; Switzerland 1999/5000169 unpublished
1999/5000169
Anonymous 1999 Henry s law constant Syngenta Crop Protection AG; Basel; Switzerland 1999/5000170 unpublished
1999/5000170

Dicamba 1093
Author(s) Year Title, Report reference, Published/unpublished Report No. Morgenroth U. 2000 Hydrolysis of [phenyl-U-14C]-SAN 837 H under laboratory conditions
Novartis Crop Protection AG; Basel; Switzerland 2000/5000164 unpublished
2000/5000164
Morgenroth U. 2000b Adsorption/desorption of [Phenyl-U-14C]-SAN 837 H in various soils Novartis Crop Protection AG; Basel; Switzerland 2000/5000169 unpublished
2000/5000169
Ellgehausen H. 2000 Calculation of the degradation kinetics of soil metabolite 3,6-Dichlorosalicylic acid (3,6-DCSA) in various soils Syngenta Crop Protection AG; Basel; Switzerland 2000/5000170 unpublished
2000/5000170
Glaenzel A. 2000 Rate of degradation of 14C-phenyl labelled SAN 837 H (Dicamba) in various soils under laboratory conditions at 20 degrees C Syngenta Crop Protection AG; Basel; Switzerland 2000/5000171 unpublished
2000/5000171
Haughey D.W., Malinsky D.S.
2000 The magnitude of Dicamba residues in cotton gin byproducts BASF Corp.; Research Triangle Park NC; United States of America 2000/5151 unpublished
2000/5151
Voellmin S. 1999 Metabolism and behavior of Dicamba in fieldgrown spring wheat after application of [phenyl-(U)-14C] material Novartis Crop Protection AG; Basel; Switzerland 2001/5001373 unpublished
2001/5001373
Gasser A. 2001 Residues of NOA 405873 in milk, blood and tissues (muscle, fat, liver, kidney) of dairy cattle resulting from feeding of NOA 405873 (metabolite of Dicamba, SAN 837) at three dose levels Syngenta Crop Protection AG 2001/5003579 unpublished
2001/5003579
Das R. 2001 Solubility in organic solvents of SAN 837 Syngenta Crop Protection Muenchwilen AG; Muenchwilen; Switzerland 2001/5003583 unpublished
2001/5003583
Wofford J.T. et al.
2002 Amended final report: A meat and milk magnitude of the residue study with Dicamba in lactating dairy cows BASF Corp. Agro Research; Princeton NJ; United States of America 2002/5002064 unpublished
2002/5002064
Schmidt E. 2002 Direct phototransformation of Dicamba (SAN837) in water Solvias AG; Basel; Switzerland 2002/5004807 unpublished
2002/5004807
Tribolet R. 2003 Soil dissipation study with Dicamba (SAN 837) in or on bare ground in Switzerland Syngenta Crop Protection AG; Basel; Switzerland 2003/5000636 unpublished
2003/5000636
Grout S.J. 2003 Aqueous hydrolysis at 90 100 and 120 C Syngenta Environmental Sciences; Bracknell Berkshire RG42 6EY; United Kingdom 2003/5000637 unpublished
2003/5000637
Gurney A. 2003 Leaching behaviour of Dicamba (SAN 837H) and its metabolite NOA 414746 under conditions of the FOCUS groundwater scenarios - A modelling conducted with FOCUSPELMO 3.3.2 Syngenta Crop Protection AG; Basel; Switzerland 2003/5000639 Unpublished
2003/5000639

1094 Dicamba
Author(s) Year Title, Report reference, Published/unpublished Report No. Heillaut C. 2008 Validation of residue method GRM022.03A for Dicamba (SAN837) and
NOA414746 metabolite in animal matrices (milk, eggs, muscle, fat, liver and kidney) ADME Bioanalyses; Vergeze; France 2008/1096010 unpublished
2008/1096010
Richardson M. 2008 GRM022.03A - Dicamba - Analytical method for the determination of residues of Dicamba (SAN837) and its metabolite NOA414746 in animal matrices. Final determination by GC-MSD Syngenta Ltd.; Bracknell Berkshire RG42 6EY; United Kingdom 2008/1096011 unpublished
2008/1096011
Morriss A. 2009 Dicamba - Independent laboratory validation of a method (GRM022.03A) for the determination of residues of Dicamba and its metabolite NOA414746 in animal matrices - Validation report CEMAS - CEM Analytical Services Ltd.; North Ascot Berkshire SL5 8JB; United Kingdom 2009/1122884 unpublished
2009/1122884
Perez R. et al. 2010 Evaluation of 5-OH-Dicamba and 3,6-Dichlorosalicylic acid (DCSA) FDA multiresidue method (MRM) testing ADPEN Laboratories Inc.; Jacksonville FL; United States of America 2010/7002976 unpublished
2010/7002976
Widlak A. 1993a Melting point of Dicamba, reference (high purity) grade Sandoz Agro Inc.; Des Plaines IL; United States of America SAN837/5293 unpublished
SAN837/5293
Formanski L.J. 1994 Method AM-0938-0994-0: Determination of Dicamba and Dichlorosalicylic acid residues in beef tissues (GC) Sandoz Agro Inc.; Des Plaines IL; United States of America SAN837/5887 unpublished
SAN837/5887
Maffezzoni M. 2004 Dicamba (SAN 837): Validation of residue method REM 193.01 in corn, rape seed, pasture and orange ADME Bioanalyses; Vergeze; France SAN837/6146 unpublished
SAN837/6146
Steinhauer S. 2004 Dicamba (SAN 837): Independent laboratory validation of residue method REM 193.01 for the determination of Dicamba (SAN 837) and 5-OH Dicamba (NOA 405873) in maize (grain) and pasture Dr. Specht & Partner Chemische Laboratorien GmbH; Hamburg; Germany Fed.Rep. SAN837/6260 unpublished
SAN837/6260
Bieber W.-D. 1993 SAN 845 H 70 WG (Dicamba): Leaching characteristics in three soils NATEC Institut; Hamburg; Germany Fed.Rep. SAN845/5102 unpublished
SAN845/5102