Embed Size (px)
Citation preview

Azoxystrobin 1
AZOXYSTROBIN (229)
First draft prepared by Dr. Katerina Mastovska, Agricultural Research Service,
United States Department of Agriculture, Wyndmoor, PA, USA.
EXPLANATION
Azoxystrobin is a systemic, broad-spectrum fungicide belonging to the class of methoxyacrylates, which are derived from the naturally-occurring strobilurins. It exerts its fungicidal activity by inhibiting mitochondrial respiration in fungi. At the 39th session of the CCPR (ALINORM 07/30/24), azoxystrobin was scheduled for the evaluation as a new compound by the 2008 JMPR.
The manufacturer submitted information on physical and chemical properties, metabolism (plant and animal), environmental fate, analytical methods, storage stability, use pattern, supervised field trials, fates of residues during processing, farm animal feeding studies, and national maximum residue limits. The supervised trial information included data on citrus fruits (post-harvest and foliar treatments), stone fruits (cherry, peach and plum), berries and small fruit (blackberry, blueberry, cranberry, grapes, raspberry and strawberry), tropical fruits with inedible peel (banana, mango and papaya), bulb vegetables (bulb onion, spring onion and leeks), brassica vegetables (broccoli, Brussels sprouts, cabbage, cauliflower and kohlrabi), fruiting vegetables (cucumber, gherkin, melon, summer squash, pepper and tomato), lettuce, legume vegetables (beans and peas), pulses (soybeans), root and tuber vegetables (beetroot, carrot, chicory, potato, radish and sugar beet), stalk and stem vegetables (artichokes, asparagus, celery, witlof and chicory), cereal grains (barley, oat, rye, triticale, wheat, maize and rice), tree nuts (almonds, pecans and pistachios), oil seeds (cottonseed, peanuts and sunflower), herbs (basil, chives, parsley and mint), peanut hay, soya bean forage and hay, straw, fodder and forages of cereal grains (barley, oat, rye, triticale, wheat, maize and rice), sugar beet tops, dried herbs (basil, chives, parsley and hops), and almond hulls. Residue data on papaya was submitted by Malaysia and GAP information by Australia, Japan, and Malaysia.
IDENTITY
ISO common name: Azoxystrobin Chemical name: IUPAC: CA:
Methyl (E)-2-{2 [6-(2-cyanophenoxy)pyrimidin-4-yloxy]phenyl}-3-methoxyacrylate Methyl (E)-2-[[6-(2-cyanophenoxy)-4-pyrimidinyl]oxy]-α-(methoxymethylene)benzeneacetate
CAS No.: 131860-33-8 CIPAC No. 571 Structural formula:
O
NN
O
OCH3CN
O
CH3O
Molecular formula: C22H17N3O5 Molecular weight: 403.4 g/mol

2 Azoxystrobin
PHYSICAL AND CHEMICAL PROPERTIES
Pure active ingredient (990 g/kg)
Property Results Reference
Appearance White powder with no characteristic odour RJ1412B Wollerton and Husband, 1993
Vapour pressure at 20 ºC
1.1 × 10⁻¹⁰ Pa RJ1412B Wollerton and Husband, 1993
Melting point 116 ºC RJ1412B Wollerton and Husband, 1993
Octanol-water partition coefficient Log Pow = 2.5 (20 ºC, pH 7) RJ1412B Wollerton and Husband, 1993
Solubility in water at 20 ºC 6 mg/L in purified water RJ1412B Wollerton and Husband, 1993
Relative density at 20 ºC 1.34 g/cm3 RJ1952B Wollerton and Husband, 1995
Volatility Henry’s Law constant 7.3 x 10⁻⁹ Pa m3/mol
Calculated from vapour pressure at 20 ºC and water solubility determined in purified water
DT50 at 25 ºC and pH 5–9 = stable DT50 at 50 ºC and pH 5–7 = stable DT50 at 50 ºC and pH 9 = 12.1d
Hydrolysis
DT50 at 60 ºC and pH 9 = 2.6 d
RJ1717B Steel and Joseph, 1994 RJ1967B Tummon and Hurt, 1995
Photolysis (in water) DT50 at pH 7 = 8.7–13.9 d RJ1705B Kuet and Hadfield, 1994
Dissociation constant Not expected to dissociate (shows neither acidic nor basic properties)
RJ1412B Wollerton and Husband, 1993
Spectral data UV/VIS Molar absorptivity (mol–1 cm–1): 60700 (at 202.6 nm), 17800 at (242.7 nm), 302 at (295.0 nm)
RJ1412B
Wollerton and Husband, 1993
IR (KBr disc)
Absorption bands (cm–1): 3110, 3068, 2992, 2950, 2849, 2231, 1709, 1626, 1606, 1588, 1563, 1458, 1445, 1269, 1228, 1256, 1155, 1201, 955, 688
1H-NMR (in d-chloroform) Chemical shift (ppm): 8.40 (doublet), 7.71 (double doublet), 7.67 (double double doublet), 7.50 (singlet), 7.41–7.22 (complex multiplet), 6.42 (doublet), 3.75 (singlet), 3.64 (singlet), 1.70 (singlet)
13C-NMR (in d-chloroform) Chemical shift (ppm): 171.1 (s = singlet), 170.01 (s), 167.38 (s), 160.69 (d = doublet), 157.89 (d), 154.06 (s), 150.11 (s), 134.17 (d), 133.54 (d), 132.68 (d), 129.11 (d), 126.06 (d), 125.94 (s), 125.84 (d), 123.02 (d), 122.01 (d), 115.18 (s), 107.26 (s), 106.90 (s), 92.37 (d), 61.94 (q = quartet), 51.57 (q)
MS - EI Characteristic m/z: 403 (M+), 388 (M-CH3), 372 (M-OCH3), 344 (M-CO2CH3, base peak), 191, 102, 75

Azoxystrobin 3
Technical material (962 g/kg)
Property Results Reference
Appearance Pale brown powder with no characteristic odour RJ1411B Wollerton and Husband, 1993
Density 1.25 g/cm3 (at 25 ºC) RJ1411B Wollerton and Husband, 1993
Melting range 114–116 ºC RJ1411B Wollerton and Husband, 1993
Stability Stable for at least 1 year at ambient temperature (15–25 ºC)
Accelerated storage stability—stable for at least 14 days at 54 ºC
Not expected to be sensitive to metals and metal ions Compatible with oxidizing and reducing agents Not expected to be explosive
RJ1411B
Wollerton and Husband, 1993
6.7 mg/L in pH 5.2 buffered water
6.7 mg/L in pH 7 buffered water
Solubility in water at 20 ºC
5.9 mg/L in pH 9.2 buffered water
RJ1411B Wollerton and Husband, 1993
Solvent Solubility (g/L)
Hexane 0.057
Octan-1-ol 1.4
Methanol 20
Toluene 55
Acetone 86
Ethyl acetate 130
Acetonitrile 340
Solubility in organic solvents at 20 ºC
Dichloromethane 400
RJ1411B Wollerton and Husband, 1993
For azoxystrobin, specifications for the technical material (TC) as well as for the SC and WG formulations (mentioned below) were established through the Joint FAO/WHO Meeting on Pesticide Specifications (JMPS) and published as FAO Specifications and Evaluations for Agricultural Pesticides compounds in 2008.1
Formulations
Azoxystrobin is available in the following formulations:
• Water-dispersible granule (WG) formulation containing 500 g/kg, 800 g/kg, or 0.80 lb/lb azoxystrobin usually marketed under the trade name Amistar.
• Suspension concentrate (SC) formulation containing 250 g/L or 2.08 lb/gallon azoxystrobin, marketed under any of the following trade names: Ortiva, Abound,
Quadris, Priori, Amistar.
In addition, suspension concentrate (SC) formulations containing mixtures of azoxystrobin and other fungicides are available under the respective trade names:
1 see http://www.fao.org/ag/agp/agpp/pesticid/default.htm

4 Azoxystrobin
• Quadris Opti, containing 4.6% azoxystrobin and 46% chlorothalonil
• Quilt, containing 7% azoxystrobin and 11.7% propiconazole
• Prior Xtra, containing 20% azoxystrobin and 8% cyproconazole
• Amistar Pro, containing 9.8% azoxystrobin and 27.5% fenpropimorph
• Amistar Top, containing 20% azoxystrobin and 12.5% difenoconazole.
METABOLISM AND ENVIRONMENTAL FATE
Table 1 shows compounds (including their identification number or letter, manufacturer code number, IUPAC name and structure) found in azoxystrobin metabolism and/or environmental fate studies.
Table 1 Azoxystrobin and its metabolites/degradation products observed in metabolism and/or environmental fate studies
Compound (Code) IUPAC name
Structure Identified in studies on:
Compound 1 = Azoxystrobin (ICIA5504)
Methyl (E)-2-{2-[6-(2-cyano-phenoxy)pyrimidin-4-yloxy] phenyl}-3-methoxyacrylate
O
NN
O
OCH3CN
O
CH3O
Plant metabolism Rotated crops Livestock metabolism Soil metabolism
Water sediment Hydrolysis Aqueous photolysis Soil surface photolysis
Compound 2 (R234886) (E)-2-{2-[6-(2-cyano-phenoxy)pyrimidin-4-yloxy]phenyl}-3-methoxy- acrylic acid
O
NN
O
OCH3CN
O
OH
Plant metabolism Rotated crops Livestock metabolism Soil metabolism Water sediment Hydrolysis
Compound 3 (R219277) Methyl (E)-2-{2-[(6-hydroxy)pyrimidin-4-yloxy]phenyl}-3-methoxyacrylate
OH
NN
O
O
CH3O OCH
3
Plant metabolism Rotated crops Livestock metabolism Soil metabolism Water sediment Soil surface photolysis
Compound 9 (R230310)
Methyl (Z)-2-{2-[6-(2-cyanophenoxy)pyrimidin-4-yloxy]phenyl}-3-methoxyacrylate
O
NN
O
CN
O
CH3O
OCH3
Plant metabolism Rotated crops Aqueous photolysis Soil surface photolysis
Compound 10 (R232493)
(E)-2-{2-[6-(2-hydroxy)pyrimidin-4-yloxy]phenyl}-3-methoxyacrylic acid
OH
NN
O
OCH3
O
OH
Livestock metabolism Rotated crops

Azoxystrobin 5
Compound (Code) IUPAC name
Structure Identified in studies on:
Compound 13 (R71395) 2-Hydroxybenzonitrile
OH
CN
Plant metabolism Rotated crops Livestock metabolism Soil surface photolysis
Compound 18 (R176586)
Methyl (E)-2-(2-hydroxyphenyl)-3-methoxyacrylate
OH
OCH3
O
CH3O
Livestock metabolism
Compound 19 (R230309)
Methyl 2-{2-[6-(2-cyanophenoxy)pyrimidin-4-yloxy]phenyl}oxoacetate
O
NN
O
OCN
O
CH3O
Plant metabolism Soil surface photolysis
Compound 20 (R400050)
2-[6-(2-cyanophenoxy)pyrimidin-4-yloxy]phenylacetic acid
O
NN
O
CN OH
O
Livestock metabolism Hydrolysis
Compound 21 (R400051)
Methyl 2-[6-(2-cyano- phenoxy) pyrimidin-4-yloxy]phenylacetate
O
NN
O
CN
O
OCH3
Aqueous photolysis
Compound 22 (R400297) Methyl (E)-2-{2-[6-(2-cyano-5-hydroxyphenoxy)pyrimidin-4-yloxy]phenyl}-3-methoxy acrylate
O
NN
O
OCH3CN
O
CH3O
OH
Plant metabolism Rotated crops
Compound 23 (R400299)
Methyl (E)-2-{2-[6-(2-cyano-4-hydroxyphenoxy)pyrimidin-4-yloxy]phenyl}-3-methoxy acrylate
O
NN
O
OCH3CN
O
CH3O
OH
Plant metabolism Rotated crops Animal metabolism
Compound 24 (R400753)
Methyl 2-{2-[6-(2-cyanophenoxy)pyrimidin-4-yloxy]phenyl}-glycolate
O
NN
O
CN
O
CH3O
OH
Plant metabolism Rotated crops Livestock metabolism Aqueous photolysis Soil surface photolysis

6 Azoxystrobin
Compound (Code) IUPAC name
Structure Identified in studies on:
Compound 26 (R401487)
2-[(6-hydroxy)pyrimidin-4-yloxy]phenylacetic acid
OH
NN
O
OH
O
Rotated crops
Compound 28 (R401553)
4-(2-cyanophenoxy)-6-hydroxypyrimidine
O
NN
OH
CN
Plant metabolism Rotated crops Livestock metabolism Soil metabolism Water sediment Aqueous photolysis Soil surface photolysis
Compound 30 (R402173)
2-[6-(2-cyanophenoxy)pyrimidin-4-yloxy]benzoic acid
O
NN
O
CNOH O
Plant metabolism Rotated crops Aqueous photolysis Soil surface photolysis
Compound 35/U3 (R402987)
2-{2-[6-(2-cyanophenoxy)pyrimidin-4-yloxy]phenyl}-glycolic acid
O
NN
O
CN
O
OHOH
Plant metabolism
Compound 36 (R403314)
(E)-2-{2-[6-(2-carbamoylphenoxy)pyrimidin-4-yloxy]phenyl}-3-methoxyacrylic acid
O
NN
O
O
OH OCH3CONH
2
Plant metabolism Soil metabolism Water sediment
Compound 40 (R405270) 2-Glucosylbenzonitrile
OGlucose
CN
Plant metabolism Rotated crops
Compound 41
4-(2-cyanophenoxy)-6-(ß-D-glucopyranosyloxy) pyrimidine
O
NN
O
CN
Glucose
Rotated crops
Compound 42 (R405287) 6-(2-cyanophenoxy)- 3-glucosylpyrimidin-4-one
O
NN
O
CN
Glucose
Plant metabolism Rotated crops
Compound U3/35 (R402987)
2-{2-[6-(2-cyanophenoxy)pyrimidin-4-yloxy]phenyl}-glycolic acid
O
NN
O
CN
O
OHOH
Plant metabolism

Azoxystrobin 7
Compound (Code) IUPAC name
Structure Identified in studies on:
Compound U5
2-{2-[6-(2-cyanophenoxy)pyrimidin-4-yloxyl]-phenyl}- 3-methoxypropionic acid
O
NN
O
OCH3CN
O
OH
Plant metabolism
Compound U6
2-{2-[6-(2-cyanophenoxy)pyrimidin-4-yloxyl]-phenyl}- 3-methoxylactic acid
O
NN
O
OCH3CN
O
OHOH
Plant metabolism
Compound U13
Methyl 3-[6-(2-cyanophenoxy)pyrimidin-4-yloxy]-2-methoxy-2H-3-benzofuroate O
NN
O
CN OCH3
O
OO
CH3
Plant metabolism Soil surface photolysis
Compound C
2-[-(6-hydroxypyrimidinyl-4-yloxy)]benzamide
O
NN
OH
NH2
O
Rotated crops
Compound K1
(glucuronide conjugate of Compound L1)
O
N N
O
O
OHOH
OH
CO2H
O
CN H3CO
O
OCH3
Livestock metabolism
Compound K2 (E)-2-{6-[2-(1-carboxy-2-methoxy-propyl)phenoxy]pyrimidin-yloxy}-benzamide
O
NN
O
OCH3
O
OHNH
2O
Rotated crops
Compound L1 (phenylacrylate ring hydroxy derivative of azoxystrobin)
O
N
O
OCH3
O
H3COCN
N
OH
Livestock metabolism
Compound L4 (ring hydroxy derivative of S-(2-cyanophenyl)cysteine)
S
CN
CO2H
NH2
HO
Livestock metabolism
Compound L9
(phenylacrylate ring hydroxy derivative of Compound 30)
O
N N
O
CN CO2H
OH
Livestock metabolism

8 Azoxystrobin
Compound (Code) IUPAC name
Structure Identified in studies on:
Compound G2
2-Ammonium-3-[6-(2-cyano-phenoxy)pyrimidin- 4-yloxy]propionate
O
NN
O
CN
O
O
NH3
+
Rotated crops
Compound M1 Glucosyl 2-{6-(2-cyano-phenoxy)pyrimidin-4-yloxy}benzoate
O
NN
O
CNOO
glucose
Rotated crops
Compound M2 Malonyglucosyl 3-hydroxy-2-[2-
{6-(2-cyanophenoxy)pyrimidin-4-yloxy}phenyl]propionate
O
NN
O
CN
O
O OH
malonylglucose
Rotated crops
Compound M3
Methyl(E)-2-{2-[6-(2-cyanophenoxy)pyrimidin-4-yloxy]phenyl}-3-glucosylacrylate
O
NN
O
CN
O
CH3O O
glucose
Rotated crops
Compound O1
Methyl (E)-2-{2-[6-(2-cyanophenoxy)pirimidin-4-yloxy]phenyl}-3-(glucosylmalonyl)-acrylate
O
NN
O
CN
O
CH3O Malonylglucose
Rotated crops
Compound O2
Glucosylmalonyl 2-{2-[6-(2-cyanophenoxy)pyrimidin-4-yloxy]phenyl}-3-methoxypropionate
O
NN
O
OCH3CN O
OMalonylglucose
Rotated crops
Compound O3
Glucosylmalonyl (E)-2-{2-[6-(2-cyanophenoxy)pyrimidin-4-yloxy]phenyl}-3-methoxyacrylate
O
NN
O
OCH3CN O
OMalonylglucose
Rotated crops
Compound N1
Glucosyl (E)-2-{2-[6-(2-cyanophenoxy)pyrimidin-4-yloxy]phenyl}-3-methoxypropionate
O
NN
O
OCH3CN O
OGlucose
Rotated crops

Azoxystrobin 9
Compound (Code) IUPAC name
Structure Identified in studies on:
Compound N2
Glucosyl -2-{2-[6-(2-cyanophenoxy)pyrimidin-4-yloxy]phenyl}-3-methoxyacrylate
O
NN
O
OCH3CN O
OGlucose
Rotated crops
Note: Compounds 1 through 42 were synthesised and the structures confirmed by NMR and mass spectroscopy (MS). Metabolites were then identified by co-chromatography with reference standards and /MS. Unlabelled reference compounds were not synthesised for the metabolites above designated U, G, N and O. These metabolites were isolated as radiolabelled compounds and identified based on spectroscopic data.
In metabolism studies azoxystrobin was uniformly labelled with 14C in the cyanophenyl or phenylacrylate ring or singularly labeled in the pyrimidinyl ring as illustrated below:
* [14C]Cyanophenyl-labelled azoxystrobin [14C]Pyrimidinyl-labelled azoxystrobin + [14C]Phenylacrylate-labelled azoxystrobin
Animal metabolism
The Meeting received information on the fate of azoxystrobin administered orally to lactating goats and laying hens.
Lactating goats
Lactating goats (45–55 kg) were dosed twice daily at each milking with either cyanophenyl-, pyrimidinyl, or phenylacrylate-[14C]-labelled azoxystrobin in gelatin capsules at a nominal rate of 25 mg/kg in the diet (on a dry weight basis) for seven consecutive days (Mayes et al., 1995, RJ1805B; Webb et al., 1996, RJ2083B), corresponding to a daily dose of approximately 1 mg/kg bw. Dose capsules were prepared fresh and concentrations were determined each day. The dose rate was equivalent to 23–33 mg/kg in the diet. Approximately 18 hours after the final dose, the goats were sacrificed and samples of meat, fat, liver, and kidney were collected for analysis. Milk, urine, and faeces were collected throughout the dosing period.
Total radioactivity was determined using combustion and/or LSC (fatty tissues were solubilised in NCS-11 tissue solubiliser). Samples were extracted using a range of solvents of varying polarity (dichloromethane, chloroform/methanol, acetonitrile, acetonitrile/water or water). Aqueous fractions were liquid-liquid partitioned with diethyl ether, acidified and extracted using ethyl acetate and back partitioned with water. Sodium dodecylsulphate was used to dissociate proteins and lipoproteins from cell membranes. Milk, kidney and liver samples were subjected to protein precipitation. Kidney samples were also extracted using mild and strong base hydrolysis and
CN
O
N N
O
OCH3
OCH3
O
* +

10 Azoxystrobin
hydrolysis with β-glucuronidase. Identification/characterization was carried out by 2D-TLC, radio-HPLC with UV-detection or LC with MS or MS/MS detection.
Table 2 shows that the majority of the administered radiolabelled dose was recovered (90–93%). The gastrointestinal tract was not analysed which potentially accounts for the remaining radioactivity. The primary route of excretion was via the faeces (62–72% of the administered dose). Excretion via the urine accounted for a further 18–24% of the administered dose, resulting in 83–92% of the administered dose being excreted in faeces and urine. Table 3 shows that the total radioactive residues (TRR) in milk, muscle and fat were very low (0.004–0.025 mg/kg of azoxystrobin equivalents), corresponding to < 0.01% of the administered dose. Characterization of these radioactive residues by fractionation showed that they were unlikely to be attributed to any individual compound at a significant level. Radioactivity in milk reached a plateau of only 0.01 mg/L after 3–4 days of dosing. Most of the radioactivity was recovered in the liver (0.58–1.2 mg/kg) and kidney (0.18–0.25 mg/kg), corresponding to 0.2–0.4% and 0.06–0.08% of the administered dose.
Table 2 Recovery of radioactivity from lactating goats after dosing at the equivalent of 25 mg/kg in diet twice per day for seven consecutive days
Sample % administered dose
Total recovery 90–93
Faeces 62–72
Urine 18–24
Cage washing 0.7–1.4
Table 3 Radioactive residues in milk and tissues of lactating goats
Tissue Radioactivity concentration (mg/kg or mg/l of azoxystrobin equivalents)a
% administered dose a
Liver 0.58–1.22 0.2–0.4
Kidney 0.18–0.25 0.06–0.08
Milk 0.004–0.01 < 0.01
Muscle 0.006–0.016 < 0.01
Fat 0.011–0.025 < 0.01
a Range for three different labelled compounds.
Tables 4–8 summarize the distribution and characterization of radioactive residues in milk, muscle, fat, kidney, and liver, respectively. Radioactive residues in the liver and kidney were fractionated with diethyl ether at pH 7, followed by ethyl acetate at pH 2. Unextractable residues were subjected to mild alkali hydrolysis (0.1 M sodium hydroxide at 25 ºC for 24 hours). The nature of the residue was characterized by TLC. HPLC and MS were used to identify major components of the residues in the liver.
Table 4 Characterization of radioactive residues in the milk of lactating goats in mg/L of azoxystrobin equivalents (% TRR in parenthesis)
Label position [Cyanophenyl-14C] [Pirimidinyl-14C] [Phenylacrylate-14C]
Day 1 Day 7 Day 1 Day 7 Day 1 Day 7
Total residue 0.004 (100) 0.007 (100) 0.005 (100) 0.008 (100) 0.006 (100) 0.01 (100)
Fat 0.0004 (10.7)
0.0009 (12.7)
0.0004 (8.2) 0.0008 (10.0)
0.0004 (6.9) 0.0004 (4.1)
Protein 0.0008 (20.4)
0.001 (19.3) 0.001 (23.2) 0.002 (27.5) 0.002 (34.4) 0.004 (37.1)

Azoxystrobin 11
Label position [Cyanophenyl-14C] [Pirimidinyl-14C] [Phenylacrylate-14C]
Day 1 Day 7 Day 1 Day 7 Day 1 Day 7
Aqueous 0.002 (61.4) 0.004 (55.1) 0.002 (48.0) 0.003 (39.3) 0.003 (57.4) 0.005 (52.4)
Filters 0.00005 (1.2)
0.0001 (2.0) 0.0002 (4.8) 0.002 (22.3) 0.00008 (1.3)
0.0001 (1.1)
Table 5 Characterization of radioactive residues in muscle of lactating goats
Label position [Cyanophenyl-14C] [Pirimidinyl-14C] [Phenylacrylate-14C]
mg/kga %TRR mg/kga %TRR mg/kga %TRR
Total residue 0.006 100 0.008 100 0.016 100
Diethyl ether (pH7) 0.0009 15.2 0.001 11.7 0.001 7.2
Ethyl acetate (pH2) 0.0007 12.4 0.001 6.9 0.0004 2.5
Aqueous 0.0006 9.9 0.001 6.4 0.0008 4.7
Debris 0.004 62.9 0.006 72.3 0.014 84.8
Filters 0.00002 0.4 NS – NS –
a mg/kg of azoxystrobin equivalents;
NS = no sample
Table 6 Characterization of radioactive residues in fat of lactating goats
Label position [Cyanophenyl-14C] [Pyrimidinyl-14C] [Phenylacrylate-14C]
mg/kga %TRR mg/kga %TRR mg/kga %TRR
Total residue 0.011 100 0.012 100 0.025 100
Acetonitrile 0.005 41.5 0.007 59.6 0.010 39.6
Hexane 0.001 9.0 < 0.0003 < 2.2 0.0008 3.2
Dichloromethane 0.0005 4.5 0.0006 5.2 NS –
Dichloromethane ‘fat’b 0.0001 1.2 NS – NS –
Debris 0.004 38.2 0.004 31.5 0.014 56.4
Filters 0.0001 1.2 0.0001 0.9 0.00003 0.1
a mg/kg of azoxystrobin equivalents; b fat precipitate;
NS = no sample
Table 7 Characterization of radioactive residues in kidney of lactating goats
Label position [Cyanophenyl-14C] [Pyrimidinyl-14C] [Phenylacrylate-14C]
mg/kga %TRR mg/kga %TRR mg/kga %TRR
Azoxystrobin 0.002 1.2 0.002 0.8 0.005 2.0
Compound 2 0.02 10.9 0.006 2.4 0.005 2.0
Compound 20 0.01 6.9 0.05 20.4 0.02 8.7
Compound 23 0.002 0.8 0.004 1.5 0.003 1.4
Compound 28 NA NA 0.01 5.0 NP NP
K1 0.03 15.5 0.03 10.0 0.02 8.2
L1 0.007 3.8 0.009 3.7 0.009 3.5
Total identified 39.1 43.8 25.8
K2 (not identified) 0.003 1.7 0.01 4.0 0.009 3.7

12 Azoxystrobin
Label position [Cyanophenyl-14C] [Pyrimidinyl-14C] [Phenylacrylate-14C]
mg/kga %TRR mg/kga %TRR mg/kga %TRR
Unknowns < 0.01 mg/kg (number)
0.03 (12)
16.8 0.05 (18)
18.6 0.05 (19)
22.9
Organic fraction 0.009 5.1 None None None None
Aqueous fraction 0.02 13.1 0.04 17.1 0.06 24.5
Debris and filters 0.02 12.2 0.01 4.1 0.02 7.4
Remainder 0.03 15.1 0.02 9.7 0.03 13.2
Losses/gains –0.006 –3.1 0.01 2.7 0.01 2.5
Total 0.18 100 0.25 100 0.24 100 a mg/kg of azoxystrobin equivalents;
NP = not present;
NA = no analysis done
Table 8 Characterization of radioactive residues in liver of lactating goats
Label position [Cyanophenyl-14C] [Pyrimidinyl-14C] [Phenylacrylate-14C]
mg/kga %TRR mg/kga %TRR mg/kga %TRR
Azoxystrobin 0.007 0.6 0.009 1.5 0.02 1.8
Compound 2 0.02 1.9 0.004 0.7 0.008 0.8
Compound 3 NP NP 0.004 0.5 0.005 0.5
Compound 10 NP NP 0.002 0.3 0.003 0.3
Compound 13 0.03 2.5 NP NP NP NP
Compound 20 0.002 0.2 0.006 0.9 0.007 0.7
Compound 28 0.04 3.0 0.13 19.8 NP NP
L1 0.02 1.8 0.02 3.6 0.03 3.4
L4 0.35 29.4 NP NP NP NP
K1 0.006 0.5 0.01 1.9 0.005 0.5
L9 NP NP 0.006 1.0 0.01 1.4
Total identified 39.9 30.2 9.4
L2 0.008 0.7 0.009 1.4 0.01 1.3
L3 NQ NQ 0.006 1.0 0.01 1.2
L6 0.01 0.9 0.001 0.2 0.003 0.3
L12 ND ND 0.01 1.6 0.01 1.1
L24 0.02 2.0 0.0006 0.1 0.01 1.1
Unknownsb (number)
0.05 (11)
4.2 0.07 (17)
11.5 0.15 (19)
15.2
Baseline 0.03 2.2 0.01 2.0 0.03 2.8
Aqueous fraction 0.26 21.9 0.22 34.0 0.53 52.3
Debris and filters 0.09 7.4 0.03 4.7 0.04 3.5
Remainder 0.15 12.3 0.05 7.6 0.12 12.4
Losses/gains 0.10 8.5 0.04 5.7 –0.009 –0.9
Total 1.19 100 0.64 100 1.00 100
a mg/kg of azoxystrobin equivalents b unknown compounds L10 and L7 were later found to be artefacts of the extraction process (Turner and Bramley, et al.,
1995; RJ1957B)
NP = not present; ND = not detected with this position of radiolabelling
Azoxystrobin 13
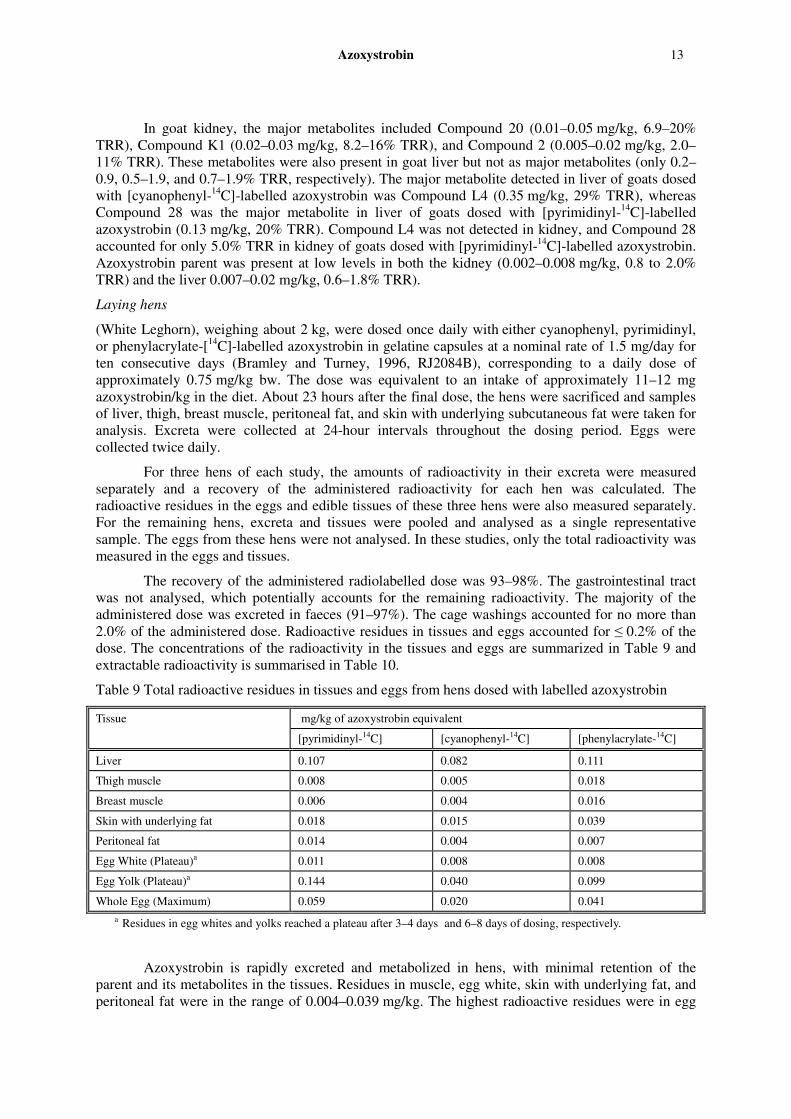
In goat kidney, the major metabolites included Compound 20 (0.01–0.05 mg/kg, 6.9–20% TRR), Compound K1 (0.02–0.03 mg/kg, 8.2–16% TRR), and Compound 2 (0.005–0.02 mg/kg, 2.0–11% TRR). These metabolites were also present in goat liver but not as major metabolites (only 0.2–0.9, 0.5–1.9, and 0.7–1.9% TRR, respectively). The major metabolite detected in liver of goats dosed with [cyanophenyl-14C]-labelled azoxystrobin was Compound L4 (0.35 mg/kg, 29% TRR), whereas Compound 28 was the major metabolite in liver of goats dosed with [pyrimidinyl-14C]-labelled azoxystrobin (0.13 mg/kg, 20% TRR). Compound L4 was not detected in kidney, and Compound 28 accounted for only 5.0% TRR in kidney of goats dosed with [pyrimidinyl-14C]-labelled azoxystrobin. Azoxystrobin parent was present at low levels in both the kidney (0.002–0.008 mg/kg, 0.8 to 2.0% TRR) and the liver 0.007–0.02 mg/kg, 0.6–1.8% TRR).
Laying hens
(White Leghorn), weighing about 2 kg, were dosed once daily with either cyanophenyl, pyrimidinyl, or phenylacrylate-[14C]-labelled azoxystrobin in gelatine capsules at a nominal rate of 1.5 mg/day for ten consecutive days (Bramley and Turney, 1996, RJ2084B), corresponding to a daily dose of approximately 0.75 mg/kg bw. The dose was equivalent to an intake of approximately 11–12 mg azoxystrobin/kg in the diet. About 23 hours after the final dose, the hens were sacrificed and samples of liver, thigh, breast muscle, peritoneal fat, and skin with underlying subcutaneous fat were taken for analysis. Excreta were collected at 24-hour intervals throughout the dosing period. Eggs were collected twice daily.
For three hens of each study, the amounts of radioactivity in their excreta were measured separately and a recovery of the administered radioactivity for each hen was calculated. The radioactive residues in the eggs and edible tissues of these three hens were also measured separately. For the remaining hens, excreta and tissues were pooled and analysed as a single representative sample. The eggs from these hens were not analysed. In these studies, only the total radioactivity was measured in the eggs and tissues.
The recovery of the administered radiolabelled dose was 93–98%. The gastrointestinal tract was not analysed, which potentially accounts for the remaining radioactivity. The majority of the administered dose was excreted in faeces (91–97%). The cage washings accounted for no more than 2.0% of the administered dose. Radioactive residues in tissues and eggs accounted for ≤ 0.2% of the dose. The concentrations of the radioactivity in the tissues and eggs are summarized in Table 9 and extractable radioactivity is summarised in Table 10.
Table 9 Total radioactive residues in tissues and eggs from hens dosed with labelled azoxystrobin
Tissue mg/kg of azoxystrobin equivalent
[pyrimidinyl-14C] [cyanophenyl-14C] [phenylacrylate-14C]
Liver 0.107 0.082 0.111
Thigh muscle 0.008 0.005 0.018
Breast muscle 0.006 0.004 0.016
Skin with underlying fat 0.018 0.015 0.039
Peritoneal fat 0.014 0.004 0.007
Egg White (Plateau)a 0.011 0.008 0.008
Egg Yolk (Plateau)a 0.144 0.040 0.099
Whole Egg (Maximum) 0.059 0.020 0.041
a Residues in egg whites and yolks reached a plateau after 3–4 days and 6–8 days of dosing, respectively.
Azoxystrobin is rapidly excreted and metabolized in hens, with minimal retention of the parent and its metabolites in the tissues. Residues in muscle, egg white, skin with underlying fat, and peritoneal fat were in the range of 0.004–0.039 mg/kg. The highest radioactive residues were in egg

14 Azoxystrobin
yolk (0.040–0.14 mg/kg) and liver (0.082–0.11 mg/kg), both of these representing ≤ 0.1% of the administered dose. These residues were fractionated to show that no single organosoluble fraction exceeded < 0.01 mg/kg and aqueous or unextractable fractions represented < 0.05 mg/kg.
Table 10 Extractable radioactivity (%TRR) in hen tissues and eggs
Hexane Dichloromethane
Acetonitrile Acetonitrile/water
Water 0.1M NaOH Debris/filters
Labelling position
py ph cy py ph cy py ph cy py ph cy py ph cy py ph cy py ph cy
Liver NU 1.2 1.1 NU NU NU 20.3 12.5 12.0 10.9 4.3 13.0 7.1 14.8 10.9 58.1 62.7 57.2 2.4 6.6 4.3
Egg yolk NU 1.5 1.0 38.2 NU NU 8.8 11.7 29.3 2.2 5.6 4.9 4.1 16.0 17.7 26.5 50.4 32.3 2.1 17.6 16.6
Egg white NU NU NU NU NU NU 63.8 45.7 84.8 3.2 12.7 8.8 5.1 3.9 1.5 NU NU NU 27.9 37.7 4.9
Peritoneal fat
NU NU NU 75.7 NU NU 4.1 NU NU NU NU NU NU NU NU NU NU NU 20.2 76.0 NU
Muscle NU 8.0 NU NU NU NU NU 8.8 NU NU 4.3 NU NU 2.9 NU NU NU NU NU NU NU
Skin with underlying fat
13.3 10.1 7.4 NU NU NU 15.7 14.1 25.3 NU 4.5 8.0 NU 2.1 3.7 NU NU NU 71.1 69.2 55.6
NU = not used
py = [pyrimidinyl-14C]
ph = [phenylacrylate-14C]
cy = [cyanophenyl-14C]
Residues in egg whites reached a plateau of only 0.008–0.011 mg/kg after 3–4 days of dosing. In egg yolks, the residues plateaued at 0.040–0.14 mg/kg after 6–8 days of the dosing.
Azoxystrobin (< 0.001–0.006 mg/kg, 0.3–12% TRR) and Compound 28 (0.002–0.004 mg/kg of parent equivalents, 1.8–8.4% TRR), were identified in egg yolk. A significant portion of the radioactivity (0.018 mg/kg parent equivalents; 15% TRR) in egg yolk from the pyrimidinyl dose was due to the breakdown of azoxystrobin into small components, which were then incorporated through biosynthetic pathways into fatty acids.
Proposed metabolic pathways in animals
The metabolism in the goat and hen was quantitatively similar to rats. In the goat and hen, azoxystrobin was rapidly metabolized with the majority (83–92% and 91–97%, respectively) of the administered radiolabelled dose excreted in the faeces and urine. The total radioactive residues in goat milk, muscle, and fat were very low and characterization showed that the residues were unlikely to be attributed to any individual compound at a significant level. The residues were higher in kidney and liver, reflecting the role of these organs in metabolism and excretion. The hen metabolism studies also showed very low transfer of TRR into tissues and eggs. Levels of radioactive residues in milk and egg whites plateaued within 3–4 days; the plateau in egg yolks was reached within 6–8 days of dosing.
The proposed metabolic pathway for azoxystrobin in goats and hens (poultry) is shown in Figure 1. The extensive metabolism of azoxystrobin in the lactating goat includes to following proposed mechanisms:

Azoxystrobin 15
(i) Cleavage of the ether linkage between the phenylacrylate ring and the pyrimidinyl ring to give Compound 28.
(ii) Cleavage of the ether linkage between the cyanophenyl ring and the pyrimidinyl ring to give Compounds 13 and 3.
(iii) Hydrolysis of the ester group or oxidative o-dealkylation to give Compound 2, which is further metabolized by cleavage of the ether linkage between the cyanophenyl ring and the pyrimidinyl ring to give Compound 10 (Compound 10 could also result from o-demethylation of Compound 3, and Compound 2 also undergoes o-demethylation to give Compound 20).
(iv) Hydroxylation of the phenylacrylate ring (hydroxyl position undetermined) to give Compound L1, followed by conjugation with glucuronic acid to give Compound K1.
(v) Hydroxylation on the cyanophenyl ring to give Compound 23.
(vi) Hydroxylation of the phenylacrylate ring (hydroxyl position undetermined) followed by oxidative degradation of the methoxyacrylate group to the benzoic acid to give Compound L9 (the formation of L9 could follow the formation of L1, depending on the hydroxyl position).
Several mechanisms were proposed for the formation of Compound L4 (the major metabolite in liver), which should involve hydroxylation of the cyanophenyl ring, cleavage of the ether linkage between the cyanophenyl ring and the pyrimidinyl ring, and conjugation with cysteine (different order of these reactions, resulting in different hydroxyl position on the cyanophenyl ring, which was not determined). The hen metabolism also includes formation of Compounds 28, 13, and 2, in addition to the incorporation of the fragment of the pyrimidinyl ring in fatty acids.
O
NN
O
OCH3OH3C
O
CN
O
NN
O
OCH3OH3C
O
CN
O
NN
OH
CN
HO
NN
O
OCH3OH3H
O
HO
NN
O
OCH3HO
O
O
NN
O
OCH3HO
O
CN
HO
NN
OH
HO
OO
OH
OH
CN
O
NN
O
HO
O
CN
HO
azoxystrobin
compound 28 (g, p)
compound 20 (g)
compound 23 (g)
compound 13 (g, p)
compound 3 (g)
compound 10 (g)
compound 2 (g,p)
fatty acids
O
NN
O
OCH3OH3C
O
CN
O
NN
O
OCH3OH3C
O
CN
O
NN
O
CO2HCN
SCO2H
CN
OH
L9 (g)
L4 (g)
HO
NH2
L1 (g)
OH
K1 (g)
O
O OH
OH
OH
CO2H
Figure 1 Proposed metabolic pathway of azoxystrobin in goats (g) and poultry (p).

16 Azoxystrobin
Plant metabolism
The Meeting received information on azoxystrobin metabolism studied in wheat, grapes, peanuts, rice, and cotton.
Wheat
Two studies were carried out between 1991 and 1994 in the United Kingdom to determine the uptake and metabolism of azoxystrobin in wheat grown under field conditions (Wilkinson et al., 1994, RJ1682B). The first study was conducted with [pyrimidinyl-14C]azoxystrobin and the second with either [cyanophenyl-14C] or [phenylacrylate-14C]azoxystrobin. In all cases, the radiolabelled azoxystrobin was formulated as a suspension concentrate containing 250 g ai/L and applied as a foliar spray twice at a nominal rate of 0.5 kg ai/ha. Applications were made at BBCH growth stages 30–31 and 59–61. Approximately 10% of the treated plants were harvested as immature wheat (forage) 13 days after the second treatment. The mature crop was harvested 61–62 days after the last treatment and separated into grain, straw, chaff, and ear stems. Only the forage, grain, and straw samples were analysed.
The radioactive residues in the grain, straw and forage, for each radiolabel, were extracted with acetonitrile, acetonitrile/water and water. Extracts were fractionated by liquid/liquid partition and solid phase extraction. Extracts were analysed by 1 and 2-dimensional TLC and radioactive regions located by autoradiography or bio-imaging analysis. HPLC was used to identify radioactive sugars formed by natural incorporation of 14CO2 and to isolate metabolites MS analysis. Enzymes and 0.1M sodium hydroxide were used to examine unextracted residues. Enzymes were also used to hydrolyze conjugated metabolites.
The metabolic profile of azoxystrobin in wheat was very complex with at least 23 metabolites detected. Residues were mainly in the forage and straw. The total radioactive residues in the grain were very low (Table 11). The metabolic profile of the extractable residue of azoxystrobin was essentially the same in each analysed commodity and very similar in each radiolabel.
Table 11 Total radioactive residues in wheat
Sample Cyanophenyl label (mg/kg)
Pyrimidinyl label (mg/kg)
Phenylacrylate label (mg/kg)
Grain 0.075 0.077 0.076
Straw 9.41 3.06 7.22
Forage 2.79 1.02 2.14
In wheat grain, the total radioactive residues ranged from 0.075–0.077 mg/kg (azoxystrobin equivalents). The results of characterization of the residues in wheat grain are shown in Table 12. The only significant residue in grain was the parent, azoxystrobin, (17–22% of the TRR, equivalent to 0.013–0.017 mg/kg). No other discrete metabolite was present at greater than 3.3% TRR (0.002 mg/kg). In total, 41–44% (0.031–0.034 mg/kg) of TRR was identified and 2.4–5.5% (0.002–0.004 mg/kg) characterized by TLC or HPLC. A further 7.1–14% (0.005–0.01 mg/kg) was identified as methanol-soluble polar/conjugates fractions. All other fractions were less than 9.3% of TRR (0.007 mg/kg). About 12–16% (0.01–0.012 mg/kg) remained unextracted following both solvent extraction and enzyme hydrolysis. Unanalysed extracted radioactivity accounted for up to 27% (0.02 mg/kg) of the residue. Naturally this incorporated glucose comprised 9.7–21% (0.007–0.016 mg/kg) of the total radioactive residue.
Table 12 Characterization of the radioactive residues in treated wheat grain
Position of radiolabel
Cyanophenyl Pyrimidinyl Phenylacrylate
Compounds detected (free and conjugated) and fractions characterized
%TRR mg/kg %TRR mg/kg %TRR mg/kg
Azoxystrobin 17.1 0.013 17.3 0.013 22.0 0.017

Azoxystrobin 17
Position of radiolabel
Cyanophenyl Pyrimidinyl Phenylacrylate
Compounds detected (free and conjugated) and fractions characterized
%TRR mg/kg %TRR mg/kg %TRR mg/kg
Compound 2 3.3 0.002 0.5 < 0.001 1.6 0.001
Compound 9 2.4 0.002 1.4 0.001 2.3 0.002
Compound 13 0.6 > 0.001 NPa NPa NPa NPa
Compound 19 NDb NDb NDb NDb 0.7 0.001
Compound 23 0.7 0.001 NDb NDb 0.5 < 0.001
Compound 24 0.7 0.001 0.5 < 0.001 0.8 0.001
Compound 28 3.1 0.002 1.4 0.001 NPa NPa
Compound 35 1.5 0.001 0.7 0.001 1.3 0.001
U5c 0.3 < 0.001 0.2 < 0.001 0.5 < 0.001
U6c 0.5 < 0.001 0.4 < 0.001 0.5 < 0.001
U13d NDb NDb 0.3 < 0.001 0.6 < 0.001
Glucosee 13.8 0.010 20.9 0.016 9.7 0.007
Other sugarse 1.7 0.001 NDb NDb NDb NDb
Unidentified compoundsf 3.8 0.003 2.4 0.002 5.3 0.004
Unanalysed extracted radioactivity 23.5 0.018 27.0 0.020 24.8 0.019
Unextracted 16.0 0.012 12.4 0.010 15.7 0.012
Balanceg 4.5 0.003 6.3 0.005 6.1 0.005
Total 100 0.075 100 0.077 100 0.076
a Not present with this radiolabel position
b Not detected c Structure tentatively assigned from MS analysis d Structure established by NMR and MS analysis e This results from the incorporation of 14CO2 (generated by degradation in the soil) into these sugars f All the individual components of this unidentified radioactivity were present at levels of ≤ 0.001 mg/kg g Radioactivity on chromatograms not assigned to any discrete component
In wheat straw, the total radioactive residues ranged from 3.1 to 9.4 mg/kg (azoxystrobin equivalents). The results of characterization of the residues in wheat straw are shown in Table 13. As in grain, the major residue was the parent, azoxystrobin (22–43% of the TRR, equivalent to 0.67–4.1 mg/kg). Fourteen metabolites were identified, of which Compound 28 was the most significant (sum of free, conjugated and bound forms, 8.2–10% of the TRR, equivalent to 0.32–0.77 mg/kg). Compound 28 is the product of the cleavage of the ether linkage between the phenyacrylate ring and the pyrimidinyl ring. It was also detected as a simple sugar conjugate at levels of 0.8 to 2.8 % (0.075–0.086 mg/kg). The two other important metabolites were Compound 2 (3.0–3.4% of the TRR, equivalent to 0.10–0.29 mg/kg) and Compound 9, the Z-isomer of azoxystrobin (2.1–3.5% of the TRR, equivalent to 0.064–0.33 mg/kg). Compound 2 can be formed from azoxystrobin either by hydrolysis of the ester group or by oxidative de-alkylation. Compound 9 is the photoisomerization product of azoxystrobin. No other discrete metabolite comprised more than 2.4% of the TRR (0.13 mg/kg). In total, 48–66% of TRR (1.5–6.2 mg/kg) was identified and 7.9–18% (0.53–1.3 mg/kg) was characterized by TLC. All other extractable fractions were below 2.8% (< 0.11 mg/kg). About 6.5–8.1% (0.25–0.61 mg/kg) remained unextracted following both solvent extraction and alkali hydrolysis.
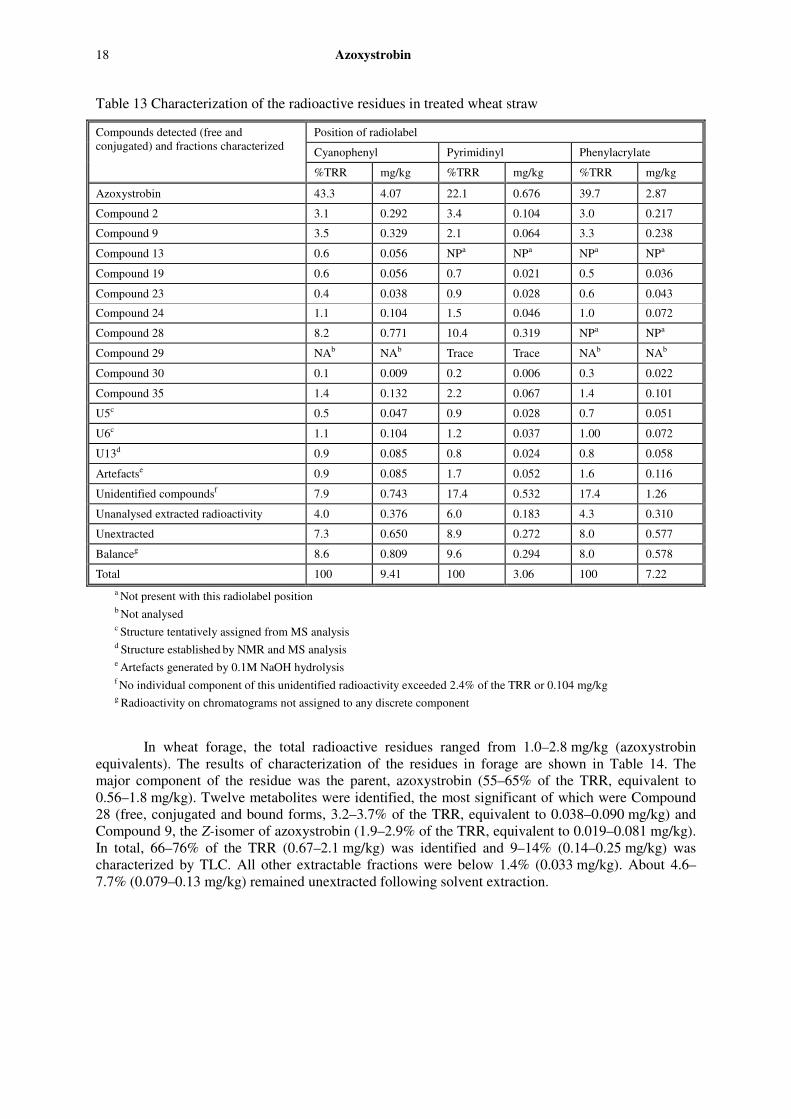
18 Azoxystrobin
Table 13 Characterization of the radioactive residues in treated wheat straw
Position of radiolabel
Cyanophenyl Pyrimidinyl Phenylacrylate
Compounds detected (free and conjugated) and fractions characterized
%TRR mg/kg %TRR mg/kg %TRR mg/kg
Azoxystrobin 43.3 4.07 22.1 0.676 39.7 2.87
Compound 2 3.1 0.292 3.4 0.104 3.0 0.217
Compound 9 3.5 0.329 2.1 0.064 3.3 0.238
Compound 13 0.6 0.056 NPa NPa NPa NPa
Compound 19 0.6 0.056 0.7 0.021 0.5 0.036
Compound 23 0.4 0.038 0.9 0.028 0.6 0.043
Compound 24 1.1 0.104 1.5 0.046 1.0 0.072
Compound 28 8.2 0.771 10.4 0.319 NPa NPa
Compound 29 NAb NAb Trace Trace NAb NAb
Compound 30 0.1 0.009 0.2 0.006 0.3 0.022
Compound 35 1.4 0.132 2.2 0.067 1.4 0.101
U5c 0.5 0.047 0.9 0.028 0.7 0.051
U6c 1.1 0.104 1.2 0.037 1.00 0.072
U13d 0.9 0.085 0.8 0.024 0.8 0.058
Artefactse 0.9 0.085 1.7 0.052 1.6 0.116
Unidentified compoundsf 7.9 0.743 17.4 0.532 17.4 1.26
Unanalysed extracted radioactivity 4.0 0.376 6.0 0.183 4.3 0.310
Unextracted 7.3 0.650 8.9 0.272 8.0 0.577
Balanceg 8.6 0.809 9.6 0.294 8.0 0.578
Total 100 9.41 100 3.06 100 7.22
a Not present with this radiolabel position b Not analysed c Structure tentatively assigned from MS analysis d Structure established by NMR and MS analysis e Artefacts generated by 0.1M NaOH hydrolysis f No individual component of this unidentified radioactivity exceeded 2.4% of the TRR or 0.104 mg/kg g Radioactivity on chromatograms not assigned to any discrete component
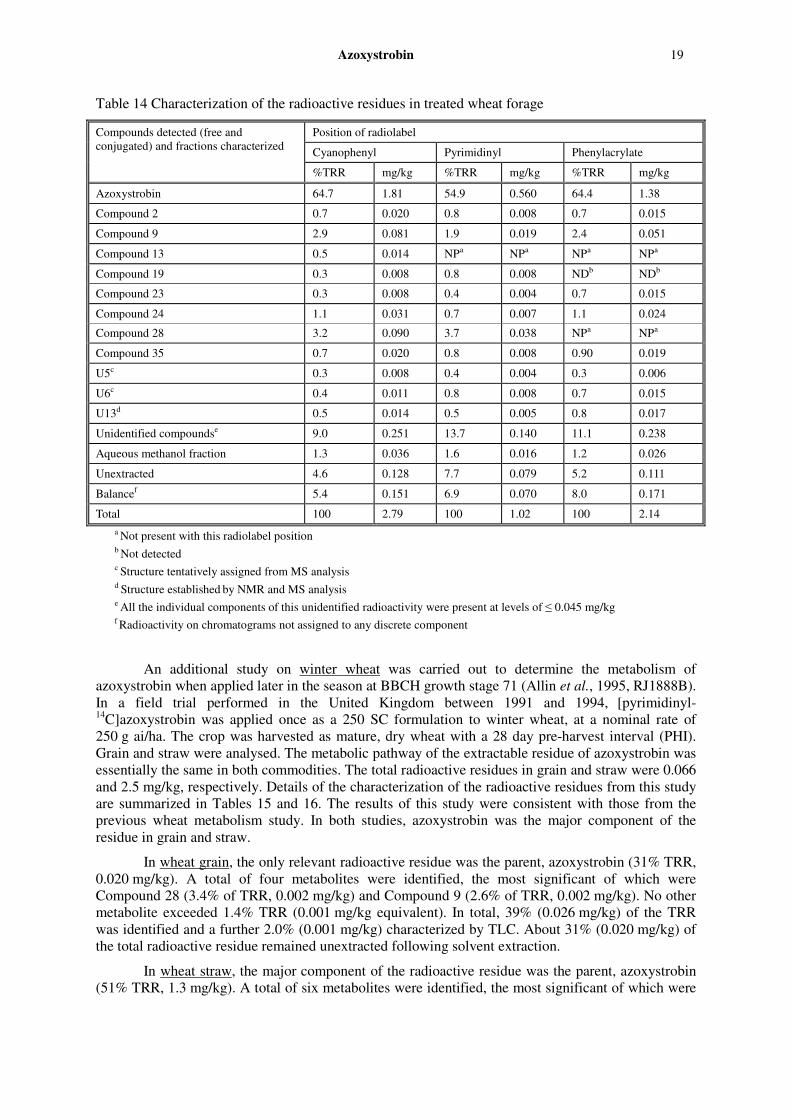
In wheat forage, the total radioactive residues ranged from 1.0–2.8 mg/kg (azoxystrobin equivalents). The results of characterization of the residues in forage are shown in Table 14. The major component of the residue was the parent, azoxystrobin (55–65% of the TRR, equivalent to 0.56–1.8 mg/kg). Twelve metabolites were identified, the most significant of which were Compound 28 (free, conjugated and bound forms, 3.2–3.7% of the TRR, equivalent to 0.038–0.090 mg/kg) and Compound 9, the Z-isomer of azoxystrobin (1.9–2.9% of the TRR, equivalent to 0.019–0.081 mg/kg). In total, 66–76% of the TRR (0.67–2.1 mg/kg) was identified and 9–14% (0.14–0.25 mg/kg) was characterized by TLC. All other extractable fractions were below 1.4% (0.033 mg/kg). About 4.6–7.7% (0.079–0.13 mg/kg) remained unextracted following solvent extraction.
Azoxystrobin 19
Table 14 Characterization of the radioactive residues in treated wheat forage
Position of radiolabel
Cyanophenyl Pyrimidinyl Phenylacrylate
Compounds detected (free and conjugated) and fractions characterized
%TRR mg/kg %TRR mg/kg %TRR mg/kg
Azoxystrobin 64.7 1.81 54.9 0.560 64.4 1.38
Compound 2 0.7 0.020 0.8 0.008 0.7 0.015
Compound 9 2.9 0.081 1.9 0.019 2.4 0.051
Compound 13 0.5 0.014 NPa NPa NPa NPa
Compound 19 0.3 0.008 0.8 0.008 NDb NDb
Compound 23 0.3 0.008 0.4 0.004 0.7 0.015
Compound 24 1.1 0.031 0.7 0.007 1.1 0.024
Compound 28 3.2 0.090 3.7 0.038 NPa NPa
Compound 35 0.7 0.020 0.8 0.008 0.90 0.019
U5c 0.3 0.008 0.4 0.004 0.3 0.006
U6c 0.4 0.011 0.8 0.008 0.7 0.015
U13d 0.5 0.014 0.5 0.005 0.8 0.017
Unidentified compoundse 9.0 0.251 13.7 0.140 11.1 0.238
Aqueous methanol fraction 1.3 0.036 1.6 0.016 1.2 0.026
Unextracted 4.6 0.128 7.7 0.079 5.2 0.111
Balancef 5.4 0.151 6.9 0.070 8.0 0.171
Total 100 2.79 100 1.02 100 2.14
a Not present with this radiolabel position b Not detected c Structure tentatively assigned from MS analysis d Structure established by NMR and MS analysis e All the individual components of this unidentified radioactivity were present at levels of ≤ 0.045 mg/kg f Radioactivity on chromatograms not assigned to any discrete component
An additional study on winter wheat was carried out to determine the metabolism of azoxystrobin when applied later in the season at BBCH growth stage 71 (Allin et al., 1995, RJ1888B). In a field trial performed in the United Kingdom between 1991 and 1994, [pyrimidinyl-14C]azoxystrobin was applied once as a 250 SC formulation to winter wheat, at a nominal rate of 250 g ai/ha. The crop was harvested as mature, dry wheat with a 28 day pre-harvest interval (PHI). Grain and straw were analysed. The metabolic pathway of the extractable residue of azoxystrobin was essentially the same in both commodities. The total radioactive residues in grain and straw were 0.066 and 2.5 mg/kg, respectively. Details of the characterization of the radioactive residues from this study are summarized in Tables 15 and 16. The results of this study were consistent with those from the previous wheat metabolism study. In both studies, azoxystrobin was the major component of the residue in grain and straw.
In wheat grain, the only relevant radioactive residue was the parent, azoxystrobin (31% TRR, 0.020 mg/kg). A total of four metabolites were identified, the most significant of which were Compound 28 (3.4% of TRR, 0.002 mg/kg) and Compound 9 (2.6% of TRR, 0.002 mg/kg). No other metabolite exceeded 1.4% TRR (0.001 mg/kg equivalent). In total, 39% (0.026 mg/kg) of the TRR was identified and a further 2.0% (0.001 mg/kg) characterized by TLC. About 31% (0.020 mg/kg) of the total radioactive residue remained unextracted following solvent extraction.
In wheat straw, the major component of the radioactive residue was the parent, azoxystrobin (51% TRR, 1.3 mg/kg). A total of six metabolites were identified, the most significant of which were

20 Azoxystrobin
Compound 9 (2.9% TRR, 0.073 mg/kg), Compound 24 (2.9% TRR, 0.073 mg/kg) and Compound 28 (3.0% TRR, 0.076 mg/kg), of which 0.8% (0.02 mg/kg) was in the conjugated form.
Table 15 Characterization of the radioactive residues in wheat grain treated with [pyrimidinyl-14C]-azoxystrobin at BBCH 71
Compounds detected (free and conjugated) and fractions characterized
% TRR mg/kg
Azoxystrobin 30.5 0.020
Compound 2 1.4 0.001
Compound 9 2.6 0.002
Compound 24 1.1 0.001
Compound 28 3.4 0.002
Unidentified compoundsa 1.4 0.001
Polar compounds 5.4 0.004
Water soluble radioactivity 18.8 0.013
Unextracted radioactivity 30.5 0.020
Losses during work-up 0.6 < 0.001
Remainderb 4.3 0.003
Total 100 0.066
a All the individual components were < 0.7% of the TRR (i.e. none > 0.001mg/kg) b Radioactivity on chromatograms not assigned to any discrete component
Table 16 Characterisation of the radioactive residue in wheat straw treated with [pyrimidinyl-14C]azoxystrobin at BBCH 71
Compounds detected (free and conjugated) and fractions characterized
% TRR mg/kg
Azoxystrobin 50.6 1.28
Compound 2 1.8 0.046
Compound 9 2.9 0.073
Compound 24 2.9 0.073
Compound 28 2.2 0.056
Compound 35 1.5 0.038
Compound 42 0.8 0.020
Unidentified compoundsa 6.2 0.156
Polar compounds 4.2 0.107
Aqueous methanol soluble radioactivity 1.0 0.026
Unextracted radioactivity 15.2 0.385
Losses during work-up 4.0 0.101
Remainderb 6.7 0.170
Total 100 2.53
a All the individual components were < 1.1% of the TRR (i.e. none > 0.028 mg/kg) b Radioactivity on chromatograms not assigned to any discrete component
Grapes
A field study was carried out in Southern France in 1992 to determine the uptake and metabolism of radiolabelled azoxystrobin in grape vines (Earl and Hadfield, 1994, RJ1676B). Azoxystrobin, separately labelled as either [cyanophenyl-14C], [pyrimidinyl-14C] or [phenylacrylate-14C]

Azoxystrobin 21
azoxystrobin was applied as a 250 SC formulation to three grape vines (one vine for each radiolabel). Azoxystrobin was applied as a foliar spray four times with application rates of 0.25, 1.0, 1.0, and 0.25 kg ai/ha. Grapes and leaves were harvested 21 days after the last application. Grapes were separated into juice and pulp and the pulp was extracted with acetonitrile, acetonitrile/water and water. The extracts and juice were fractionated by liquid/liquid partition and solid phase extraction. The fractions were analysed by TLC and radioactive regions located by autoradiography and bio-imaging analysis. HPLC was used to isolate metabolites for MS analysis. Enzymes were used to extract bound residues and to hydrolyze conjugated metabolites.
Table 17 summarizes the characterization of the radioactive residues in grapes. The total radioactive residues in grapes were found to be 0.38 mg/kg from the cyanophenyl, 1.4 mg/kg from the pyrimidinyl, and 0.95 mg/kg from the phenylacrylate-labelled azoxystrobin treatments. The major residue for each radiolabel was the parent, azoxystrobin (35–65% TRR, equivalent to 0.13–0.92 mg/kg). In addition, the metabolism of azoxystrobin in grape vines showed a complex pathway with at least 15 metabolites present at low levels.
Table 17 Characterization of the radioactive residues in treated grapes
Position of radiolabel
Cyanophenyl Pyrimidinyl Phenylacrylate
Compounds detected (free and conjugated) and fractions characterized
%TRR mg/kg %TRR mg/kg %TRR mg/kg
Azoxystrobin 34.6 0.132 64.6 0.924 56.3 0.535
Compound 2 0.8 0.003 0.4 0.006 0.4 0.004
Compound 9 2.3 0.009 1.9 0.027 4.0 0.038
Compound 13 5.7 0.022 NPa NPa NPa NPa
Compound 19 0.7 0.003 0.6 0.009 0.4 0.004
Compound 24 3.9 0.015 2.5 0.036 2.9 0.028
Compound 28 5.2 0.020 2.6 0.037 NPa NPa
Compound 35 2.3 0.009 1.2 0.017 0.9 0.009
U5b 0.7 0.003 0.6 0.009 0.3 0.003
Glucosec 2.3 0.009 2.2 0.031 1.4 0.013
Fructosec 3.2 0.012 2.5 0.036 2.0 0.019
Sucrosec NDd NDd NDd NDd 0.4 0.004
Unidentified compoundse 15.3 0.058 8.7 0.124 14.0 0.133
Remainderf 4.6 0.018 4.2 0.060 3.4 0.032
Organo-soluble radioactivity 0.6 0.002 0.4 0.006 0.6 0.006
Water-soluble radioactivity 5.8 0.022 1.2 0.017 3.5 0.033
Totalg 100.6 0.384 99.1 1.42 101.5 0.965
a Not present with this radiolabel position b Structure tentatively assigned from mass spectral analysis c This results from the incorporation of 14CO2 (generated by degradation in the soil) into these sugars d Not detected e All the individual components were < 5% of the TRR (i.e. none > 0.072 mg/kg) f Radioactivity on chromatograms not assigned to any discrete component g Differences from 100% result from losses/gains in the concentration of fractions prior to TLC analysis
A total of nine metabolites were identified and the most significant were Compound 13 (5.7% TRR, 0.022 mg/kg), Compound 28 (2.6–5.2% TRR, 0.020–0.037 mg/kg), Compound 9 (1.9–4.0% TRR, 0.09–0.038 mg/kg), and Compound 24 (2.5–3.9% TRR, 0.036–0.015 mg/kg). Compound 13 is formed by diphenyl ether cleavage between the cyclophenyl and pyrimidinyl rings of Compound 28. Two more unknown metabolites, Compounds U3 and U5, were characterized by MS. Compounds U3

22 Azoxystrobin
and U5 are probably formed by oxidative cleavage or reduction of the acrylic bond of the free acrylic acid, Compound 2.
Incorporation of radioactivity into naturally occurring sugars indicated mineralization of [14C]azoxystrobin in soil, with subsequent assimilation of 14CO2. This radiolabelled carbon dioxide being taken up by the plant results in the formation of [14C]sugars via photosynthesis. The sugars, characterized by HPLC were identified as glucose, fructose, and sucrose.
Enzyme hydrolysis showed that some of the polar compounds were conjugates of known metabolites. No new metabolites could be detected after hydrolysis. In addition to the parent compound, the other metabolites released by enzyme hydrolysis were Compounds 13 and 28. The overall levels of total identified radioactive residues were 59%, 77% and 68% for [cyanophenyl-14C], [pyrimidinyl-14C] and [phenylacrylate-14C]azoxystrobin, respectively. The remaining individual unknown components were all below 5% TRR (0.072 mg/kg azoxystrobin equivalent).
Peanuts
A study was carried out between 1993 and 1994 to determine the uptake and metabolism of azoxystrobin in peanut vines grown under field conditions in the USA (Webb et al., 1995, RJ1807B). [14C]azoxystrobin formulated as a 250 g ai/L suspension concentrate, separately labelled in either the cyanophenyl, pyrimidinyl or phenylacrylate ring, was applied as a foliar spray to peanut vines. Each plant received two foliar applications at a rate of 0.85 kg ai/ha (0.17 kg ai/hL), 53 and 95 days after planting and one application at a rate of 0.3 kg ai/ha (0.06 kg ai/hL) at day 144. The total seasonal application rate was 2 kg ai/ha. Ten days after the last application, the plants were lifted and approximately 50% of the vines were stored fresh. The remaining vines and pods (nuts and hulls intact) were left to dry in the sun for four days. The dried crop was then separated into nuts, hulls (shells) and hay (dried vine) and analysed. Table 18 shows TRR found in the collected samples for each radiolabel.
Table 18 Total radioactive residues in each of the peanut analytes
Position of Radiolabel Total Radioactive Residue (mg/kg)
Nut Hull Hay Vine
Cyanophenyl 0.24 0.71–0.75 40.2–44.9 15.5–17.4
Pyrimidinyl 0.60–0.65 0.87–0.90 39.2–46.2 16.4–20.8
Phenylacrylate 0.47–0.49 0.67–0.68 46.0–46.6 19.6–21.4
The most significant residues identified in the nut were the fatty acids, oleic and linoleic, accounting for 28–32% TRR (0.074–0.21 mg/kg) and 11–16% (0.27–0.11 mg/kg), respectively. Natural incorporation of radioactivity into sugars was identified by HPLC analysis, indicating mineralization of [4C]azoxystrobin in soil with subsequent assimilation of 14CO2. This radiolabelled carbon dioxide is taken up by the plant with subsequent formation of the [14C] sugars via photosynthesis. HPLC analysis identified sucrose (1.7–5.6% TRR, 0.004–0.027 mg/kg), glucose (1.5–1.9% TRR, 0.005–0.010 mg/kg), and fructose (1.4–2.2%TRR, 0.005–0.012 mg/kg). The presence of radiolabelled glutamic acid was also confirmed. Parent azoxystrobin was not detected in the nut and no individual metabolite was present at a level greater than 1.0% (0.002 mg/kg). In total, 49–55% TRR (0.118–0.369 mg/kg) was identified and an additional 3.9–6.2% (0.015–0.038 mg/kg) remained unextracted following both solvent extraction and enzyme hydrolysis. All radioactive residues in the nut are listed in Table 19.
Table 19 Characterization of the radioactive residues in treated peanut nut
Position of radiolabel
Cyanophenyl Pyrimidyl Phenylacrylate
Compounds detected (free and conjugated) and fractions characterized
%TRR mg/kg %TRR mg/kg %TRR mg/kg
Compound 3 NPa NPa < 0.1 < 0.001 0.1 < 0.001

Azoxystrobin 23
Position of radiolabel
Cyanophenyl Pyrimidyl Phenylacrylate
Compounds detected (free and conjugated) and fractions characterized
%TRR mg/kg %TRR mg/kg %TRR mg/kg
Compound 13 0.3 0.001 NPa NPa NPa NPa
Compound 36 0.1 < 0.001 < 0.1 < 0.001 0.1 < 0.001
Compound 42 1.0 0.002 0.3 0.002 NPa NPa
Oleic Acid 30.9 0.074 32.3 0.210 27.5 0.135
Linoleic Acid 11.2 0.027 16.3 0.106 16.2 0.079
Sucrose 1.7 0.004 2.5 0.016 5.6 0.027
Glucose 1.9 0.005 1.6 0.010 1.5 0.007
Fructose 2.2 0.005 1.9 0.012 1.4 0.007
Characterized Sugars / Amino Acids b
15.1 0.036 13.9 0.090 12.4 0.061
Unknowns c (None > )
7.9 (2.3)
0.019 (0.006)
2.6 (0.3)
0.017 (0.002)
5.2 (0.7)
0.025 (0.003)
Remainder d 13.1 0.031 8.7 0.057 13.3 0.065
Filter Papers 0.8 0.002 0.7 0.004 0.7 0.003
Methanol (Debris)e 3.2 0.008 2.1 0.014 2.6 0.013
Aqueous (Hexane) f 2.4 0.006 2.3 0.015 2.4 0.012
Debris 6.2 0.015 5.8 0.038 3.9 0.019
Fractionation Losses 2.0 0.005 9.0 0.059 7.3 0.036
Balance g 0.0 0.0 0.0 0.0 –0.2 –0.001
Total 100.0 0.24 100.0 0.65 100.0 0.49
a Not present with this radiolabel position b This fraction sums the radioactivity from further extraction of the debris, which was characterized as natural
incorporation of radioactivity into simple sugars and amino acids by HPLC. In addition, a subsample of the debris from the [14C]pyrimidinyl labelled treatment was base hydrolysed and IsBOC derivatised to give an organic fraction which when analysed by TLC enabled the identification of naturally incorporated radioactivity as glutamic acid (3.7% TRR, 0.024 mg/kg)
c The sum of unknowns detected in the extracted organosoluble radioactivity, the level of the largest individual component of these unknowns is shown in parenthesis.
d The sum of streaking and unassigned activity on the TLC plates as well as losses from the HPLC columns. e The methanol (debris) fraction resulted from a tC18 bond elut column that was run on the hydrolysate produced from
enzyme hydrolysis of the unextractable material. f The aqueous (hexane) fraction resulted from saponification of the hexane fraction, followed by partitioning with diethyl
ether. g The differences between the sum of the identified/characterized radioactivity and the total radioactive residue (TRR)
and were accounted for by the calculation of mean % TRR values, remainder and baseline values.
In hulls, the major component of the radioactive residue was the parent, azoxystrobin (13–14% TRR, 0.088–0.11 mg/kg). A total of 11 metabolites were identified, the most significant of which were Compound 28 (2.5–2.6% TRR, 0.020–0.022 mg/kg) and Compound 42 (1.2–1.9% TRR, 0.010–0.014 mg/kg). No other residue component was greater than 1.6% TRR (0.012 mg/kg). In total, 20–26% (0.137–0.193 mg/g) of the radioactive residue was identified and a further 5.4–14% TRR (0.041–0.121 mg/kg) remained unextracted following both solvent extraction and alkali hydrolysis. All radioactive metabolites detected in the hull are summarized in Table 20.

24 Azoxystrobin
Table 20 Characterization of the radioactive residues in treated peanut hull
Position of radiolabel
Cyanophenyl Pyrimidyl Phenylacrylate
Compounds detected (free and conjugated) and fractions characterized
%TRR mg/kg %TRR mg/kg %TRR mg/kg
Azoxystrobin 13.5 0.101 12.5 0.109 12.9 0.088
Compound 9 1.2 0.009 1.0 0.009 1.2 0.008
Compound 13 1.6 0.012 NPa NPa NPa NPa
Compounds 28, 41 and 42b 5.5 0.041 4.5 0.034 NPa NPa
Compound 30 0.5 0.004 0.5 0.004 1.5 0.010
Compound 35 0.5 0.004 0.6 0.005 1.5 0.010
Compound 24 0.6 0.005 0.5 0.004 0.7 0.005
Compound 19 0.9 0.007 0.5 0.004 0.7 0.005
Compound 2 0.9 0.007 0.9 0.008 1.1 0.007
U13 0.5 0.004 0.4 0.003 0.6 0.004
Glucose 0.7 0.005 1.6 0.014 2.8 0.019
Other Sugars 1.2 0.009 3.4 0.030 4.0 0.027
Unknownsc (None > )
9.2 (2.3)
0.069 (0.017)
6.9 (1.9)
0.060 (0.017)
14.7 (2.3)
0.100 (0.016)
Remainder d 12.3 0.098 10.4 0.090 8.1 0.055
Organic (Debris)e 6.7 0.050 4.4 0.038 4.1 0.028
Aqueous (Debris)e 3.9 0.029 4.8 0.042 3.7 0.025
Aqueous (Debris)f 0.8 0.006 1.5 0.013 1.6 0.011
5% Aqueous Methanol (Debris)g 13.9 0.104 15.8 0.137 14.2 0.097
Methanol (Debris)g 1.7 0.013 3.7 0.032 3.3 0.022
Debris 5.4 0.041 13.9 0.121 11.7 0.080
Fractionation Losses 14.2 0.102 10.3 0.093 11.3 0.072
Balanceh 4.5 0.034 1.9 0.017 0.3 0.002
Total 100.2 0.75 100.0 0.87 100.0 0.68
a Not present with this radiolabel position b Compounds 28, 41 and 42 were grouped together since Compounds 41 and 42 are conjugated metabolites of
Compound 28. Their individual residues were 2.6% TRR (0.020 mg/kg) for Compound 28, 1.0% TRR (0.008 mg/kg) for Compound 41 and 1.9% TRR (0.014 mg/kg) for Compound 42 in the cyanophenyl labelled treatment. For the pyrimidinyl labelled treatment, their individual residues were 2.5% TRR (0.022 mg/kg) for Compound 28, 0.8% TRR (0.007 mg/kg) for Compound 41 and 1.2% TRR (0.010 mg/kg) for Compound 42.
c This is the sum of unknowns detected in the extracted organosoluble radioactivity; the level of the largest individual component of these unknowns is shown in parenthesis
d The sum of streaking and unassigned activity on the TLC plates as well as losses from the HPLC columns. e Fractions resulting from partition of the aqueous filtrate following 0.1 M base hydrolysis of the debris. f This fraction resulted from enzyme hydrolysis performed on the debris from a 5 M base hydrolysis.
g The 5% aqueous methanol (debris) and methanol (debris) fractions resulted from a C18 bond elut column run on the hydrolysate from a 5M base hydrolysis of the debris. The 5% aqueous methanol (debris) fractions were not further analysed. However, analysis of similar fractions in the nut, hay and indeed hull have shown that the activity associated with these fractions as being characteristically natural incorporation of radioactivity as simple sugars and/or amino acids.
h The balance values represent the differences between the sum of the identified/characterized radioactivity and the total radioactive residue (TRR) and were accounted for by the calculation of mean % TRR values, remainder and baseline values (i.e., the mean of more than one TLC solvent system).
In hay, the most significant residue was the parent, azoxystrobin (33–44% TRR, 13–20 mg/kg). Ten metabolites were identified; the most significant of which were Compound 28 (3.9%

Azoxystrobin 25
TRR, 1.5–1.6 mg/kg) and Compound 42, a simple sugar conjugate of Compound 28, at a level of 2.9–5.1% TRR (1.1–2.1 mg/kg). The next most significant metabolites were Compound 13 in both the free and conjugated forms, present at 6.3% TRR (2.53 mg/kg) and Compound 9, present at 2.4–2.8% TRR (0.97–1.3 mg/kg). No other residue component was greater than 2.3% TRR, (0.93 mg/kg). In total, 51–57% (20–25 mg/kg) of the total radioactive residue was identified and a further 3.3–6.3% (1.3–2.5 mg/kg) remained unextracted following both solvent extraction and alkali hydrolysis. The characterization of the radioactive residues in hay is summarized in Table 21. The nature of the residue in the vine was shown to be qualitatively similar to that in the hay; therefore, further detailed analysis was not carried out.
Table 21 Characterization of the radioactive residues in treated peanut hay
Position of radiolabel
Cyanophenyl Pyrimidyl Phenylacrylate
Compounds detected (free and conjugated) and fractions characterized
%TRR mg/kg %TRR mg/kg %TRR mg/kg
Azoxystrobin 33.0 13.3 34.4 13.5 43.8 20.4
Compound 9 2.4 0.965 2.8 1.10 2.8 1.30
Compound 13 and 40 b 6.3 2.53 NPa NPa NPa NPa
Compound 28 and 42 c 9.0 3.62 6.9 2.70 NPa NPa
Compound 30 1.9 0.764 2.2 0.862 2.0 0.932
Compound 35 1.3 0.523 1.7 0.666 1.9 0.885
Compound 24 1.3 0.523 1.5 0.588 1.5 0.699
Compound 19 1.0 0.402 1.1 0.431 1.2 0.559
U13 0.8 0.322 2.3 0.902 1.1 0.513
Unknowns d (None > )
9.7 (1.5)
3.90 (0.603)
11.2 (1.4)
4.39 (0.549)
12.7 (1.5)
5.92 (0.699)
Remainder e 17.0 6.83 19.9 7.80 16.8 7.83
5% Aqueous Methanolf 2.2 0.884 6.2 2.43 5.4 2.52
Debris 3.3 1.33 6.3 2.47 3.7 1.72
Fractionation Losses 6.9 2.77 1.3 0.510 4.6 2.14
Balance g 3.9 1.57 2.2 0.862 2.5 1.17
Total 100.0 40.2 100.0 39.2 100.0 46.6
a Not present with this radiolabel position
b Compounds 13 and 40 were grouped together since Compound 40 is a conjugated metabolite of Compound 13. Their individual residues were 2.4% TRR (0.97 mg/kg) for Compound 13 and 3.9% TRR (1.6 mg/kg) for Compound 40. c Compounds 28 and 42 were grouped together since Compound 42 is a conjugated metabolite of Compound 28. Their individual residues were 3.9% TRR (1.6 mg/kg) for Compound 28 and 5.1% TRR (2.1 mg/kg) for Compound 42 in the cyanophenyl labelled treatment. For the pyrimidinyl labelled treatment, their individual residues were 4.0% TRR (1.6 mg/kg) for Compound 28 and 2.9% TRR (1.1 mg/kg) for Compound 42. d The sum of unknowns detected in the extracted organosoluble radioactivity, the level of the largest individual component of these unknowns is shown in parenthesis. e The sum of streaking and unassigned activity on the TLC plates as well as losses from the HPLC columns. f The activity associated with the 5% aqueous methanol fractions was mainly characterized as natural incorporation of radioactivity into simple sugars (1.4–4.8% TRR, 0.54–2.2 mg/kg). g The differences between the sum of the identified/characterized radioactivity and the total radioactive residue (TRR) and were accounted for by the calculation of mean % TRR values, remainder and baseline values.
Rice
A study was carried out in the United Kingdom under greenhouse conditions in 1994 to determine the metabolism of radiolabelled azoxystrobin in rice through both foliar and root uptake (Joseph et al., 1994, RJ1861B). The study consisted of two separate experiments; one with a single foliar spray and the other with two granular paddy applications. For the foliar spray, azoxystrobin was applied

26 Azoxystrobin
formulated as a suspension concentrate labelled separately in each of the three rings. Rice plants were treated just after heading at rates equivalent to a total field application of 0.36–0.55 kg ai/ha. For the paddy application, the compound was formulated as a granular product labelled separately in each of the three rings. Two applications were made to the paddy water to give a total seasonal application rate of 1.73–1.92 kg ai/ha. The applications were at 11–13 days after transplanting rice plants at the three-leaf stage, and again after a further 36 days, just prior to heading.
Crops were harvested at maturity after a pre-harvest interval of 75–95 days for the foliar-treated plants and a PHI of 95–98 days after the second application for the granular treated rice plants. Grain and straw samples were analysed, using similar methods as for the wheat metabolism study. The distribution of the radioactivity in rice plants is summarized in Table 22, with the majority of the residue found in rice straw.
Table 22 Total radioactive residues in rice grain and straw
Sample Cyanophenyl label (mg/kg)
Pyrimidinyl label (mg/kg)
Phenylacrylate label (mg/kg)
Grain Granular 0.61 0.53 0.74
Foliar 0.40 0.34 0.32
Straw Granular 8.2 10.5 9.1
Foliar 5.7 7.8 7.7
In rice grain, the only significant residues from the granular application (Table 23) were radiolabelled sugars (43–58% TRR) and the parent compound (3.4–5.3% TRR). Similarly, the foliar application resulted mainly in the residues of the parent (36–72% TTR) and radiolabelled sugars (4.9–17% TRR), see Table 24.
Table 23 Characterization of the radioactive residues in rice grain (granular application)
Position of radiolabel
Cyanophenyl Pyrimidinyl Phenylacrylate
Compounds detected (free and conjugated) and fractions characterized
%TRR mg/kg %TRR mg/kg %TRR mg/kg
Azoxystrobin 3.4 0.021 5.3 0.028 3.4 0.024
Compound 3 ND ND 2.8 0.015 1.8 0.013
Compound 9 ND ND 0.3 0.002 ND ND
Compound 23 ND ND 0.6 0.003 0.7 0.005
Compound 28 0.8 0.005 0.6 0.003 ND ND
Sugars 57.9 0.351 43.2 0.228 48.1 0.358
Polar material in TLC 5.4 0.033 16.0 0.084 6.3 0.045
Unknowns 26.7 0.152 10.9 0.058 25.6 0.187
Unextracted residue 6.7 0.041 12.8 0.067 10.6 0.079
Fractionation loss/gain 0.9 0.005 –7.5 0.040 –3.5 –
Total 100 0.608 100 0.528 100 –
ND=not detected

Azoxystrobin 27
Table 24 Characterization of the radioactive residues in rice grain (foliar application)
Position of radiolabel
Cyanophenyl Pyrimidinyl Phenylacrylate
Compounds detected (free and conjugated) and fractions characterized
%TRR mg/kg %TRR mg/kg %TRR mg/kg
Azoxystrobin 63.8 0.256 36.3 0.123 71.5 0.230
Compound 9 4.2 0.017 3.3 0.011 4.3 0.014
Compound 24 1.0 0.004 ND ND ND ND
Compound 28 4.6 0.018 3.3 0.011 ND ND
Compound 35 1.3 0.005 ND ND 1.1 0.004
Sugars 4.9 0.019 16.5 0.0566 5.1 0.017
Polar material in TLC 2.8 0.11 11.5 0.039 2.6 0.008
Unknowns 15.7 0.063 14.5 0.049 17.3 0.056
Unextracted residue 3.6 0.014 5.7 0.019 2.6 0.008
Fractionation loss/gain 1.9 0.008 –8.9 0.030 4.5 0.014
Total 100 0.399 100 0.338 100 0.323
ND=not detected
In rice straw, the major components from the granular application (Table 25) were the parent (3.3–5.6 % TRR), Compounds 22/23 (5.1–8.1 %TRR) and Compound 2 (3.6–6.7% TRR). In foliar application (Table 26), the parent, azoxystrobin, was the single most abundant component (38–46% TRR), followed by Compound 28 (5.2–8.5% TRR). Similarly to rice grain, a portion of the radioactivity was identified as radiolabelled sugars (1.9–3.9% TRR and 1.1–1.8% TRR for granular and foliar applications, respectively). The presence of radioactivity in these natural products is a result of mineralization of azoxystrobin in soil and subsequent assimilation and incorporation of the 14CO2 into natural products via photosynthesis.
Table 25 Characterization of the radioactive residues in rice straw (granular application)
Position of radiolabel
Cyanophenyl Pyrimidinyl Phenylacrylate
Compounds detected (free and conjugated) and fractions characterized
%TRR mg/kg %TRR mg/kg %TRR mg/kg
Azoxystrobin 5.1 0.416 5.6 0.586 3.3 0.300
Compound 2 6.7 0.547 3.6 0.377 4.8 0.437
Compound 3 NA NA 4.0 0.419 2.5 0.228
Compound 9 1.3 0.106 0.7 0.073 1.3 0.118
Compound 10 NA NA 1.6 0.168 0.3 0.027
Compound 19 ND ND 0.8 0.084 ND ND
Compound 20 ND ND 1.2 0.126 ND ND
Compound 24 1.4 0.114 0.8 0.084 1.2 0.109
Compound 28 3.2 0.261 3.0 0.314 NA NA
Compound 30 2.6 0.212 2.5 0.262 2.6 0.237
Compound 35 0.4 0.033 2.0 0.209 2.1 0.191
Compound 22/23 5.1 0.416 7.7 0.806 8.1 0.737
Sugars 3.0 0.245 1.9 0.199 3.9 0.355
Polar material in TLC 3.0 0.245 9.6 1.01 9.1 0.828
Unknowns 42.7 3.48 33.9 3.55 37.3 3.40
Unextracted fraction 6 2.1 0.171 1.2 0.126 2.9 0.264
Unextracted residue 6.2 0.506 6.7 0.701 8.9 0.808

28 Azoxystrobin
Position of radiolabel
Cyanophenyl Pyrimidinyl Phenylacrylate
Compounds detected (free and conjugated) and fractions characterized
%TRR mg/kg %TRR mg/kg %TRR mg/kg
Particulate fraction 1.9 0.155 NA NA 1.0 0.091
Fractionation losses 15.3 1.25 13.2 1.38 10.7 0.974
Total 100 8.16 100 10.47 100 9.10
NA=no analysis done
ND=not detected
Table 26 Characterization of the radioactive residues in rice straw (foliar application)
Position of radiolabel
Cyanophenyl Pyrimidinyl Phenylacrylate
Compounds detected (free and conjugated) and fractions characterized
%TRR mg/kg %TRR mg/kg %TRR mg/kg
Azoxystrobin 40.2 2.30 37.6 2.94 45.9 3.54
Compound 2 0.7 0.040 1.1 0.086 0.6 0.061
Compound 3 ND ND 0.9 0.070 4.2 0.324
Compound 9 3.5 0.200 0.70 0.055 3.0 0.232
Compound 10 ND ND 0.40 0.031 0.70 0.054
Compound 19 ND ND 0.80 0.062 ND ND
Compound 24 1.7 0.097 1.4 0.109 2.2 0.170
Compound 28 5.2 0.297 8.5 0.664 ND ND
Compound 30 1.6 0.091 2.0 0.156 1.7 0.131
Compound 35 2.4 0.137 1.6 0.125 2.3 0.178
Compound 22/23 0.6 0.034 1.1 0.086 0.9 0.069
Sugars 1.7 0.097 1.1 0.086 1.8 0.139
Polar material in TLC 2.0 0.114 4.1 0.320 1.3 0.100
Unknowns 19.2 1.09 28.6 0.812 20.1 1.55
Unextracted fractions 5/ 6 NA NA 2.4 0.187 NA NA
Unextracted residue 14.2 0.811 3.4 0.265 12.7 0.980
Fractionation losses 7.0 0.400 4.3 0.336 2.3 0.178
Total 100 5.71 100 7.81 100 7.72
NA=no analysis done
ND=not detected
Cotton
A study was carried out in 1997–1998 in the USA to determine the metabolism of radiolabelled azoxystrobin in cotton after an in-furrow application of azoxystrobin (Panel et al., 1990, RJ2695B). [Pyrimidinyl-14C]azoxystrobin was formulated as a suspension concentrate formulation and applied to cotton at planting as an in-furrow application at a rate of 18 g ai per km (0.19 oz ai per 1000 ft row). Approximately half of the cotton was harvested immature as forage, while the remainder was allowed to reach maturity. The mature cotton was separated into seed, lint, and gin trash. The total radioactive residues in cotton are summarized in Table 27.

Azoxystrobin 29
Table 27 Total radioactive residues in cotton samples
Radioactive residue, mg/kg azoxystrobin equivalent Samples By direct quantification of sample By summation of extracts and debris
radioactivity
Treated Control Treated Control
Seed 0.005 0.005 0.006 0.004
Forage 0.081 0.0002 0.085 0.0002
Lint 0.004 0.003 NA NA
Gin trash NA NA 0.007 0.003
NA=no analysis done
Characterization of the residues was not carried out in seed, lint, and gin trash, in which the TRR were < 0.01 mg/kg. An attempt was made to characterize the residues in forage, in which the total radioactive residue was 0.085 mg/kg. The results are summarized in Table 28. The most significant residue in the forage was the parent, representing 15% TRR (0.013 mg/kg). At least eight unknowns were detected, not one representing > 0.01 mg/kg of parent equivalent. None of the unknowns co-chromatographed with any of the applied reference substances. To further characterize the radioactive residues, the forage extract was partitioned with diethyl ether at pH 6–7 and then ethyl acetate at pH 1–2. All partitioned fractions were quantified by LSC and analysed by TLC. The presence of azoxystrobin was confirmed by HPLC.
Table 28 Characterization of the radioactive residues in cotton forage
Component % TRR Azoxystrobin equivalent (mg/kg)
Azoxystrobin 15 0.013
Unknown 1 1.7 0.001
Unknown 2 11 0.010
Unknown 3 3.4 0.003
Unknown 4 2.8 0.002
Unknown 5 7.4 0.006
Unknown 6 5.0 0.004
Unknown 7 5.5 0.005
Unknown 8 6.3 0.005
Polar material in TLC 1.7 0.001
Remainder 16 0.013
Debris 20 0.017
Filters 0.3 < 0.001
Losses 3.9 0.004
Total 100 0.085
Proposed metabolic pathway in plants
The metabolism of azoxystrobin in wheat, rice, grapes, peanut vines and cotton was very similar, with the parent, azoxystrobin, being the major component of the residue. In peanut nuts, fatty acids (oleic and linoleic) accounted for most of the TRR. In cotton, no significant residues were detected in cottonseed.
The proposed metabolic pathway for azoxystrobin in plants is shown in Figure 2. The metabolism of azoxystrobin was complex, resulting in the formation of many metabolites, the most

30 Azoxystrobin
common being Compound 28, which was present at levels of up to 10% of TRR in wheat straw, 9% in peanut hay, 8.5% in rice straw, 4.6% in rice grain, and 5.7% in grapes. Levels of compound 28 in wheat grain and nuts were < 3% and < 1%, respectively. Compound 13, another significant metabolite, was present at 5.7% of TRR in grapes and 6.3% of TRR in peanut hay. Both Compound 28 and Compound 13 are structurally dissimilar to the parent and are animal metabolites.
Compounds 22 and 23 which are isomers of hydroxylated azoxystrobin, were found only in rice straw at levels of 8.1% TRR, following granular applications, The rest of the metabolites (Compounds 2, 9, and 24) were present at levels < 4% of TRR in all commodities. In most of the studies, a significant portion of the radioactivity was identified as radiolabelled natural products such as sugars, starch, fatty acids, and amino acids. The presence of radioactivity in these natural products is believed to result from the mineralization of azoxystrobin in soil and subsequent incorporation of 14CO2 via photosynthesis.
O
NN
O
CN
O
CH3O OCH3
O
NN
O
CN
O
OHCH3O
O
NN
O
CN
O
OCH3O
O
NN
O
CN
OCH3O
CH3O
O
NN
CN
OH
OO
CH3
O OCH3
O
N N
CN
O
O
NN
O
CN CO2H
O
NN
O
CN
O
OCH3CH3O
HO
O
NN
O
CN
O
OCH3OH
HO
O
NN
O
CN
O
HOOH
O
NN
O
CN
O
OCH3HO
OH
CN
O
NN
O
CN
O
OCH3HO
ICIA5504
U6
Compound 35 Compound 30
Compound 19
Compound 24
Compound 9
U13
Compound 23
Compound 13
Compound 28
Compound 2U5
Figure 2 Proposed metabolic pathway of azoxystrobin in plants.

Azoxystrobin 31
Environmental fate in soil
The Meeting received information on aerobic and anaerobic degradation of azoxystrobin in soil; photolysis on soil surface; mobility in soil; field dissipation studies performed in the Northern and Southern Europe; and azoxystrobin residues in rotational crops.
Aerobic and anaerobic degradation
The Meeting received two studies on the aerobic and anaerobic metabolism of [14C]azoxystrobin (labelled separately in the pyrimidinyl, cyanophenyl and phenylacrylate rings). In the first study (Mason and Butters, 1994, RJ1754B), the metabolism of labelled azoxystrobin was studied in a sandy loam soil for a period of 360 days. Azoxystrobin was applied to the surface of the soil with an initial concentration equivalent to an application rate of between 2.7 and 3.7 kg ai/ha. This application rate is more than ten times the single maximum application rate for most crops in the USA and Europe. The treated soil, maintained at 40% moisture holding capacity, was incubated separately in the dark under aerobic, anaerobic and sterile conditions at 20 °C and also under aerobic conditions at 5 °C.
Under aerobic conditions at 20 °C, azoxystrobin degraded with a mean half-life of 279 days, with 24–42% azoxystrobin remaining after 360 days. At 5 °C, 77% azoxystrobin was recovered over the same time period. There was no significant degradation of azoxystrobin in the sterile treatment, which suggests that the aerobic degradation observed in the other treatments was due to microbial activity.
Table 29 shows composition of radioactive residue (mean values for the three radiolabels) obtained after 360 days at 20 °C. Two metabolites were detected in significant amounts—Compound 2, which accounted for 15–21% of the radioactivity after 360 days incubation and Compound 36, which reached 4.6–8.8% during the same time. No other degradation product was detected which accounted for more than 5% of the applied radioactivity.
Table 29 Radioactivity recovered from aerobic soil after incubation at 20 °C for 360 days
Radioactive Component % of applied radioactivity (mean of 3 radiolabels)
Azoxystrobin 33
Compound 2 18
Compound 36 6.1
Polar compounds 1.6
Others 5.9
CO2 12
Unextracted 21
Total 97
Under anaerobic conditions (Table 30), degradation of azoxystrobin was more rapid with a mean half-life of 181 days and 25–33% remaining after 360 days. Compound 2 accounted for 48–51% of the radioactivity after 360 days incubation. Compound 36 was not detected.
Mineralization to CO2 was significant with up to 14% detected after 360 days under aerobic conditions at 20 °C. At 5 °C, less than 2% CO2 was recovered in the same time period. There was negligible CO2 evolution from the anaerobic and sterile aerobic treatments. No other volatile compounds were observed during the course of the study.

32 Azoxystrobin
Table 30 Radioactivity recovered from anerobic soil and surface water after 360 days
Radioactive Component % of applied radioactivity (mean of 3 radiolabels)
Azoxystrobin 28
Compound 2 49
Others 4.6
Unextracted 12
Total 94
In the second study (Warinton et al., 1995, RJ1801B), the aerobic metabolism of
[14C]azoxystrobin was studied in two UK soils, a silt loam and a sandy clay loam, and a sandy loam soil from the USA. The UK soils were treated with [14C]azoxystrobin separately labelled in each of the three aromatic rings, while the USA soil was treated with [14C]azoxystrobin labelled in the pyrimidyl ring only. Radiolabelled azoxystrobin was incorporated into the soil with an initial concentration equivalent to an application rate of 0.56 kg ai/ha. The treated UK soils, maintained at 75% of 1/3 bar moisture, were incubated separately in the dark under aerobic and anaerobic conditions at 20 °C for up to 120 days. The sandy loam soil from the USA was incubated under aerobic conditions only.
Under aerobic conditions, azoxystrobin degraded with DT50 values of about 56 and 84 days in the two UK soils. Degradation in the US soil was slower with a projected DT50 of about 160 days. This difference was attributed to the much lower microbial biomass in this soil. The only major metabolite was Compound 2, which accounted for up to 20% of the applied radioactivity during the initial rapid decline in azoxystrobin concentration, up to 62 days after application in the UK soils. However, Compound 2 was a relatively short-lived metabolite in aerobic soils, with an estimated half-life in soil of less than two weeks. No other product was detected which accounted for more than 5% of the applied radioactivity at any time (see Table 31 for results obtained after 120 days).
Table 31 Radioactivity recovered from aerobic soil after 120 days
% of applied radioactivity after 120 days (mean of 3 radiolabels)
Radioactive Component
Silt Loam (UK) Sandy Clay loam (UK) Sandy Loam (USA)
Azoxystrobin 31% 36% 55%
Compound 2 15% 9.5% 12%
Compound 3 0.5% 0.4% 3.1%
Compound 28 0.7% 1.0% 2.1%
Compound 36 1.6% 2.8% 0.4%
Polar compounds 1.9% 2.6% 1.0%
Others 3.3% 4.1% 5.7% 14CO2 24% 18% 1.8%
Unextracted 22% 22% 17%
Total 100% 96% 98%
The anaerobic metabolism study was only conducted on the UK soils by addition of azoxystrobin to the water. Degradation of azoxystrobin was more rapid with DT50 of about 49 and 56 days. Compound 2 accounted for 44–69% of the applied radioactivity after 120 days incubation (Table 32). Compounds 28, 3 and 36 were also detected at very low levels not exceeding 3% of the applied radioactivity.

Azoxystrobin 33
Table 32 Radioactivity recovered from anaerobic soil after 120 days
% of applied radioactivity (mean of 3 radiolabels)
Radioactive Component
Silt Loam (UK) Sandy Clay Loam (UK)
Azoxystrobin 18.7% 20.7%
Compound 2 57.2% 58.5%
Compound 3 0.0% 0.0%
Compound 28 3.3% 0.8%
Compound 36 0.0% 0.0%
Polar compounds 1.1% 1.2%
Others 4.7% 6.1% 14CO2 2.5% 2.1%
Unextracted 10.4% 5.9%
Total 97.9% 95.3%
Mineralization to CO2 was significant with up to 27% detected after 120 days under aerobic conditions at 20 °C. Under anaerobic conditions, CO2 evolution was greatly reduced and accounted for up to 5% of the applied radioactivity after 120 days. All the components shown are ultimately mineralised to CO2 in soil in the dark.
Photolysis on soil surface
The Meeting received a study on photodegradation of azoxystrobin on a soil surface (Winter and Joseph, 1995, RJ1716B), in which [14C]azoxystrobin (labelled separately in all three rings) was applied to thin (approximately 1 mm) layers of sandy loam soil at a rate equivalent to 0.5 kg ai/ha and irradiated for up to the equivalent of 30 days Florida summer sunlight.
Azoxystrobin underwent rapid degradation on the soil surface with a mean DT50 of 11 days Florida summer sunlight which is equivalent to 11.5 days summer sunlight at 50 °N. The degradation was complex, with many minor products formed, none of which were seen to build up with time. A total of nine photolysis products were identified, the most significant of which was Compound 9 (Z-isomer), which reached levels of up to 9% of applied radioactivity. Compounds 30 and 28 were also identified, with maximum levels of 7.5 and 5.7% of applied radioactivity, respectively. The remaining products were typically present at levels of 1 to 5% of the applied radioactivity. The only significant product (> 10% of applied radioactivity) was 14CO2, from all three labels, reaching levels of up to 29% of applied radioactivity, which indicates complete mineralization of the compound.
Degradation under field conditions
Laboratory studies showed that both photolysis and microbial degradation were possible routes of degradation. A study was to carry out using [14C]azoxystrobin to identify significant degradation products following application to soil under field conditions (Mason et al., 1995, RJ1830B). [14C]Azoxystrobin (labelled separately in all three rings) formulated as a suspension concentrate was applied to bare soil plots under field conditions in California, USA. The soil type was a sandy loam and it was the same as the one used in the second soil laboratory metabolism study (Warinton et al., 1995, RJ1801B). A single application was made to separate plots for each radiolabel at application rates equivalent to 536 to 589 g ai/ha. Soil samples were collected at intervals up to 45 cm depth (and at four months after treatment, samples were also taken to a depth of 100 cm). This trial was irrigated with an equivalent of 100 mm of rain per month. (As a comparison, the average rainfall for the same months in Northern Europe is 66 mm, based on 30 year averages).
[14C]Azoxystrobin degraded rapidly under field conditions with a mean half-life of 14 days across the three plots. The major degradates under field conditions were Compounds 28 and 30, at

34 Azoxystrobin
levels up to 8% (equivalent to 0.04 mg/kg) and 5% (equivalent to 0.05 mg/kg) of the applied radioactivity by 28 days after treatment, respectively. Four months after treatment, the levels of both degradates had decreased to 4.1% of the applied radioactivity. No other individual product accounted for more than 2% of the applied radioactivity during the four month period.
In the vast majority of analyses no radioactivity was detected below six inches (approximately 15 cm), demonstrating the low mobility of azoxystrobin and its degradates under field conditions. The total radioactive recovery declined throughout the four month study period ranging from 95–106% initially to between 13–23% from soil sampled four months after treatment. Azoxystrobin has been shown to mineralize to 14CO2 via both photolytic breakdown on a soil surface and microbial metabolism in the soil, and the loss of 14CO2 is therefore believed to be the cause of the decrease in recovery with time. Based on laboratory and field studies, the proposed overall degradation pathway for azoxystrobin in soil is shown in Figure 3.
O
NN
O
O
CH3O OCH3CN
O
NN
O
O
CH3OCN
OCH3
O
NN
O
O
CH3OCNOH
O
NN
O
O
CH3OCNO
O
NN
O
CN CO2H
NN
O
O
CH3O OCH3
HO
OH
CN
O
O
CN
N N
O
O OCH3
O
CH3
O
NN
CN
OH
Compound U13
Compound 28Compound 9
Compound 13
ICIA5504
Compound 3
Compound 24
Compound 19
Compound 30
O
NN
O
O
OCH3CN HO
Compound 36
Compound 2
O
NN
O
O
OCH3HOCONH2
Figure 3 Proposed metabolic pathway of azoxystrobin in soil.

Azoxystrobin 35
Mobility in soil
The adsorption and desorption properties of azoxystrobin were studied in six soils (two loamy sands, a sandy clay loam, a sand, a silty clay loam and a clay loam) (Rowe and Lane, 1994; RJ1541B). The pH of the soils ranged between 4.9 and 7.9. Azoxystrobin was added to a soil-water slurry at five rates of application (0.05, 0.1, 0.2, 0.4 and 0.8 µg/cm3).
The adsorption of azoxystrobin in soil varied from moderate to strong, with average Kd values (adsorption coefficients) ranging from 2.1 in the sand (pH 5.4, 0.5% organic matter) to 20 in the clay loam (pH 5.5, 4.8% organic matter) (Table 33). Freundlich adsorption coefficients (K') followed a similar pattern ranging from 1.5 to 15. The adsorption of azoxystrobin was shown to be directly related to soil organic matter content and to a lesser extent inversely related to pH. Average Kd values adjusted for soil organic carbon content (Koc values) ranged from 300 in the alkaline loamy sand to 760 in the acidic silty clay loam, which gives a mean Koc of 590. K' values similarly adjusted for organic matter content (K'oc) ranged from 210 to 580.
In the desorption step, increases in Kd values ranged from 16–82%, which suggested that the adsorption of azoxystrobin was not entirely reversible. Based on the results, it can be concluded that azoxystrobin has medium to low potential mobility in soil based on the McCall Scale of Pesticide mobility in soil.
Table 33 Azoxystrobin adsorption coefficients in different types of soils
Soil Type pH % organic matter Kd Koc
Loamy sand 7.9 5.1 9 300
Sandy clay loam 7.5 3.0 12 700
Loamy sand 7.8 2.9 6 360
Sand 5.5 0.5 2.1 710
Silty clay loam 4.9 2.8 12 760
Clay loam 5.5 4.8 20 720
A study on aged leaching in three soils was conducted using radiolabelled azoxystrobin (Butters and Mason, 1994; RJ1694B). [14C]Azoxystrobin (separately labelled in all three rings) was applied to three soils (a sandy loam and two loamy sands, see Table 34) at a concentration ranging between 19 and 20 mg/kg soil. The treated soils were incubated in the dark between 19 and 24 °C under aerobic conditions at 40% moisture holding capacity for a period of 30 days. These samples were transferred to columns of the corresponding soil type to which water was applied at a rate equivalent to 200 mm of 'rain' over a period of approximately 48 hours.
Table 34 Characteristics of three soil samples in an aged leaching study of azoxystrobin
Soil Type pH % OM Sand Content
Sandy loam 7.4 3.0 56
Loamy sand 6.3 1.1 88
Loamy sand 5.9 4.2 84
Following 30 days of incubation, up to 89% of the applied azoxystrobin was identified as parent compound, the remainder being unextracted material (up to 4.7%) and other extractable components (up to 3.5% at the 30 day interval with no single component > 1%). After the leaching period, 90% of the recovered radiocarbon remained in the top 5 cm, except for one of the loamy sand soils (pH 6.3, 1.1% organic matter), in which some movement of azoxystrobin was observed into the top 15 cm of the column. Less than 2% of the applied radioactivity was found in any of the leachates.

36 Azoxystrobin
It can be concluded that azoxystrobin and its degradation products showed low mobility in soil under the conditions of this test.
Laboratory dissipation studies
A study was conducted to investigate the rate of degradation of azoxystrobin in three selected UK soils (sand, silty clay loam and sandy clay loam) under laboratory conditions (Tummon, 1995, RJ1819B). The soils were fortified with 0.25 mg/kg of azoxystrobin and maintained between 15 and 25 ºC, in the dark and at 40% of their moisture holding capacity for up to 127 days (see Table 35).
Azoxystrobin degraded in all three soil types under the conditions of the test with DT50 of 60, 94 and 57 days in the sand, silty clay loam and sandy clay loam soils, respectively. These data are in good agreement with the degradation rates determined from the second [14C]azoxystrobin soil metabolism study (Warinton et al., 1995, RJ1801B).
Table 35 Dissipation of azoxystrobin in laboratory soils
Mean azoxystrobin residue (mg/kg) Time (Days)
sand, pH 7.9 silty clay loam, pH 5.9 sandy clay loam, pH 6.4
0 0.26 0.25 0.25
4–6 0.24 0.24 0.25
13–14 0.23 0.18 0.21
22–23 ND 0.21 0.18
33–39 0.16 0.16 0.17
57–58 0.13 0.15 0.12
83–84 0.12 0.14 0.09
106–110 0.09 0.12 0.07
127 NA 0.10 NA
NA= no analysis done
ND=not detected
Field dissipation studies
Field soil dissipation studies were carried out between 1993 and 1995 in Northern Europe in Germany (Earl and Chamier, 1995; RJ1935B; and Earl and Kappes, 1995; RJ1946B), United Kingdom (Earl, et
al., 1995; RJ1940B and RJ1945B) and Northern France (Earl, et al., 1995; RJ1938B). Similar trials were also conducted at the same time in Southern Europe in Italy (Earl, et al., 1995; RJ1942B and RJ1944B) and Southern France (Earl, et al., 1995; RJ1928B, RJ1941B and RJ1943B). All field dissipation studies applied a 250 SC formulation of azoxystrobin directly onto bare soil at a nominal rate of 750 g ai/ha. Soil samples were collected at intervals to a depth of 30 cm and analysed for azoxystrobin, Compound 9 (its major photolytic breakdown product on soil under laboratory conditions), Compound 2 (its major soil metabolite under laboratory conditions), and Compounds 28 and 30 (laboratory photolytic and radiolabelled field study metabolites).
Similar results were obtained from the different trials in Northern and Southern Europe. All trials showed that azoxystrobin is rapidly degraded under field conditions. No measurable residues of azoxystrobin were determined below 10 cm. No measurable residues of Compound 2 or Compound 9 were determined in any samples from any trials with the exception of detection of Compound 2 in one trial in Northern Europe (0.03 mg/kg) in 0–10 cm horizon. Residues of Compound 28 and 30 ranged between < 0.01–0.03 and < 0.01–0.05 mg/kg respectively in the 0–10 cm horizon and declined to < 0.01 mg/kg by 28–195 days after application. No measurable residues of Compounds 28 and 30 were determined below 10 cm. DT50 values for azoxystrobin ranged between 3 and 39 days and DT90 were calculated to be between 87 and 433 days. A summary of the DT50 and DT90 values from all the European field dissipation trials is provided in Table 36.

Azoxystrobin 37
Table 36 DT50 and DT90 values for azoxystrobin in the European field dissipation trials
Country Year Soil Type Organic Matter (%) pH DT50 (days) DT90 (days)
Germany 1993/94 sandy loam 2.2 6.4 3 87
1994/95 sandy clay loam 2.2 6.2 4 353
United Kingdom 1993/94 clay 3.4 8.0 9 254
1994/95 clay 4.8 8.1 11 298
Northern France 1993/94 silt loam 1.9 6.1 12 133
Southern France 1993/94 sandy loam 1.1 8.5 21 231
1993/94 clay loam 1.8 7.7 17 190
1994/95 clay loam 1.6 8.5 39 433
Italy 1993/94 clay loam 1.4 8.2 7 182
1994/95 silty clay loam 1.7 8.3 24 260
Residues in rotational crops
The Meeting received three greenhouse confined accumulation studies on potential for uptake of azoxystrobin residues from the soil into rotational crops performed in the USA in 1993–1994.
In the first study (Tambling et al., 1995; RR95–011B), [phenylacrylate-14C]azoxystrobin was applied directly to sandy loam soil at 2.2 kg ai/ha. The application rate was based on the maximum seasonal application rate for azoxystrobin in the USA (corresponding to maximum of six applications of a single rate of 0.37 kg ai/ha or maximum of eight applications of a single rate of 0.28 kg ai/ha). Azoxystrobin was allowed to age on the soil for 30, 200, and 365 days. Rotational crops represented by radish, lettuce, and wheat were planted 30, 200, and 365 days after the treatment. The rotation intervals were based on crop failure (30 days), normal spring (200 days), and annual (365 days) rotation. Radish and lettuce were harvested at maturity while wheat was harvested at an immature stage to represent forage, and at maturity for separate analysis of grain and straw. All commodities were analysed for residues. In addition, soil samples collected at treatment and each planting interval were also analysed.
The total radioactive residues in the soil declined from 0.82 mg/kg at treatment to 0.69, 0.42, and 0.02 mg/kg at 30, 200, and 365 days after treatment, respectively. Radioactive residues were released from the crop samples by extraction with acetone/water and by enzyme or alkali hydrolysis.
The metabolism of azoxystrobin in rotational crops was complex with a large number of conjugated metabolites formed. The residues declined significantly with longer ageing time (plant back interval). Radioactive residues in the 365-day crops were generally in concentrations below 0.01 mg/kg. All metabolites detected in the extractable components of the 200 and 365-day rotational crops were also present in the 30-day crops. Since the residues were much higher in the 30-day crops, metabolites were identified in those samples.
Many of the metabolites in the rotational crops were glucose or amino acid conjugates of the corresponding primary crop metabolites. As in the primary crops, parent azoxystrobin represented the major residue detected in all rotated crops (up to 24% TRR), with very low actual residue levels in the tested crops (< 0.01–0.03 mg/kg at 30 days and < 0.01 mg/kg at 200 days), except for wheat forage and wheat straw at 30 days (0.15 and 1.4 mg/kg, respectively), which declined significantly with the longer aging time of 200 days (to 0.02 and 0.12 mg/kg, respectively). Compounds N1, N2, O2, and O3, which are the principal metabolites in rotated crops, are glucose conjugates and are found in the primary crops in both free and conjugated forms. A summary of the metabolites found in rotational crops treated with [14C]-phenylacrylate-labelled azoxystrobin is provided in Table 37.
In the second greenhouse crop rotation trial (Goldsby et al., 1995; RR95-034B), [pyrimidinyl-14C]azoxystrobin was applied to sandy loam soil at a rate of 2.2 kg ai/ha, in a single application, to

38 Azoxystrobin
simulate a worst case application. The rotational crops lettuce, radish and wheat were planted 30, 200 and 365 days after the last application. Time and interval of harvest of the different crops were the same as in the previous study with [phenylacrylate-14C]azoxystrobin.
The total radioactivity of [pyrimidinyl-14C]azoxystrobin in the soil declined from 1.0 mg/kg at treatment to 0.79, 0.67 and 0.24 mg/kg at day 30, 200, and 365 after the last treatment, respectively. Metabolism was extensive with a large amount of conjugated residues formed. All metabolites present in the 30-day crops were also detected in the 200 and 365-day crops but with rapidly decreasing amounts. Therefore, identification and characterization of metabolites were carried out with the residues of the 30-day crops. Metabolites present in the crops from the 200 and 365 day rotation were identified by comparison with the 30-day crop residue profile. Many of the metabolites in rotated crops were glucose or amino acid conjugates of the corresponding primary crop metabolites. Parent azoxystrobin was the major residue detected in all crops (up to 44% TRR), with very low levels present in the tested crops (< 0.01–0.08 mg/kg, < 0.01–0.01 mg/kg, and < 0.01 at 30, 200, and 365 days, respectively), except for wheat forage and wheat straw at 30 days (0.26 and 1.3 mg/kg, respectively), which declined significantly with the longer aging times (to 0.02 and 0.13 mg/kg, respectively at 200 days and < 0.01 and 0.01 mg/kg at 365 days). Compounds 42, N2, O2, and O3, which are the major metabolites detected in the rotational crops, are glucose conjugates and are found in the primary crops in both free and conjugated forms. Compound G2, a principal metabolite found in radish tops (14–25% TRR, < 0.01–0.2 mg/kg), is an amino acid conjugate of Compound 28. A summary of the metabolites found in rotational crops treated with [phenylacrylate-14C]azoxystrobin is provided in Table 38.
The third greenhouse crop rotation study (Miller, 1995; RR95-017B) was carried out in applying [cyanophenyl-14C]azoxystrobin and using the same study conditions, rate of application, rotational crops, planting times, and harvest intervals as in the two other studies using either the azoxystrobin labelled in the pyrimidinyl or phenylacrylate ring.
The total radioactivity of [14C]cyanophenyl-labelled azoxystrobin in the soil declined from 0.74 mg/kg at treatment to 0.74, 0.37, and 0.10 mg/kg at day 30, 200, and 365 after the last treatment, respectively. The metabolism in rotated crops was similar to the two previous studies. The major metabolites which were analysed are listed in Table 39.
Results from the three confined rotational crop studies were similar when using either pyrimidinyl, cyclophenyl, or phenylacrylate-labeled azoxystrobin. The metabolism of azoxystrobin in rotational crops was similar across the analysed crops (wheat, radish, and lettuce) and similar, but more extensive than that observed in the primary crops. A large number of metabolites were produced in low concentrations.
Many of the metabolites produced were glucose or amino acid conjugates of metabolites which were found unconjugated in the primary crop metabolism studies. As in the primary crops, the parent, azoxystrobin was mostly found in amounts above 10% of the total radioactive residue. Other major metabolites found in the rotational crops were Compounds M2, N2, O2, and O3, which were also found in the primary crops at lower percentages of the total radioactive residue.
In general, [14C]azoxystrobin was metabolized in succeeding crops by four major routes:
• hydrolysis of the ester to produce the free acid (Compound 2) followed by conjugation to glucose (Compound N2) and malonylglucose (Compound O3)
• (ii) reduction of the double bond on the acid (Compound 2) followed by conjugation to glucose (Compound N1) and malonylglucose (Compound O2 and M2)
• (iii) cleavage of the ether linkage to give two ring compounds followed by further conjugation to glucose (Compounds 40 and 42)
• (iv) mineralization to 14CO2 and subsequent incorporation into natural products.

Azoxystrobin 39
Table 37 Major metabolites of [phenylacrylate-14C]-azoxystrobin in 30- and 200-day rotational crops
Metabolites % (mg/kg) Crop Inter-val days
Parent Comp’d 2
Comp’d 30
Comp’d 3
Comp’d K2
Comp’d M1
Comp’d M2
Comp’d N1
Comp’d N2
Comp’d O1
Comp’d O2
Comp’d O3
Lettuce 30 17.4 (0.03)
3 (0.01)
1.9 (0.01)
– 7.5 (0.01)
8.6 (0.01)
2.8 (< 0.01)
14.8 (0.02)
17.6 (0.03)
200 2.4 (< 0.01)
4.7 (< 0.01)
5.3 (< 0.01)
– 10 (< 0.01)
11.8 (< 0.01)
13.6 (< 0.01)
Radish root
30 20.3 (0.02)
2.4 (< 0.01)
14.9 (0.02)
4.3 (< 0.01)
– 11 (0.01)
– 10 (0.01)
0.7 (< 0.01)
200 Trace (< 0.01)
14.2 (< 0.01)
– (< 0.01)
– 17.1 (< 0.01)
– 17.3 (< 0.01)
–
Radish top
30 2.5 (0.01)
– 2.8 (0.01)
2 (< 0.01)
9.7 (0.05)
3.5 (0.02)
– 29 (0.14)
2.6 (0.01)
6.2 (0.03)
8.3 (0.04)
200 – – 15.5 (0.02)
– 2.7 (< 0.01)
– 35.7 (0.05)
5.9 (< 0.01)
Wheat forage
30 12.3 (0.15)
2.4 (0.03)
6.7 (.08)
– – – 13.4 (0.16)
– 9.4 (0.11)
8.9 (0.1)
200 9.5 (0.02)
5.1 (< 0.01)
14.6 (0.02)
– – – 7.8 (0.01)
11 (0.02)
Wheat straw
30 23.8 (1.4)
5.6 (0.34)
10.4 (0.61)
– – – 5.8 (0.34)
2.1 (0.12)
3.7 (0.22)
8.1 (0.48)
200 18.3 (0.12)
4.4 (0.03)
12.1 (0.08)
– – – 6.8 (0.05)
8.4 (0.06)
Wheat grain
30 19 (< 0.01)
0.9 (< 0.01)
– – – – – – – – – –
Table 38 Major metabolites of [pyrimidinyl-14C]azoxystrobin in 30, 200 and 365-day rotational crops
Metabolites % (mg/kg) Crop Interval (days) Parent Compound
42 Compound N1
Compound N2
Compound O2
Compound O3
Compound G2
30 5.2 (0.01)
39 (0.11)
3.2 (< 0.01)
10.1 (0.03)
–
200 2.7 (0.01)
36.9 (0.04)
2.9 (< 0.01)
5 (0.01)
–
Lettuce
365 2.8 (< 0.01)
29.4 (< 0.01)
11.1 (< 0.01)
–
30 43.9 (0.08)
2.3 (< 0.01)
2.4 (< 0.01)
– – Radish root
200 6.5 (< 0.01)
4.7 (< 0.01)
2.7 (< 0.01)
– –
30 1.4 (0.02)
5.7 (0.06)
9.6 (0.11)
5.7 (0.06)
5.7 (0.06)
17.7
200 0.3 (< 0.01)
5 (0.03)
10.1 (0.05)
4.6 (0.02)
25.1
Radish tops
365 – 4.3 (< 0.01)
12.1 (< 0.01)
14.4

40 Azoxystrobin
Metabolites % (mg/kg) Crop Interval (days) Parent Compound
42 Compound N1
Compound N2
Compound O2
Compound O3
Compound G2
30 11.2 (0.26)
15.7 (0.37)
2.5 (0.06)
3.2 (0.07)
1.7 (0.04)
–
200 3.9 (0.02)
10.5 (0.07)
1.9 (0.01)
1.4 (< 0.01)
1.9 (0.01)
–
Wheat forage
365 1.3 (< 0.01)
22.2 (0.02)
– 1.4 (0.01
–
30 8.3 (1.26)
12.8 (1.94)
3.3 (0.51)
1.6 (0.25)
2.4 (0.37)
–
200 5.2 (0.13)
12.8 (0.32)
2.1 (0.05)
2 (0.05)
1.9 (0.05)
–
Wheat straw
365 2.7 (0.01)
13.7 (0.05)
3.7 (0.01)
8.1 (0.03)
–
30 2.2 (< 0.01)
1.9 (< 0.01
– 1.8 (< 0.01)
– Wheat grain
200 – – – – – –
Table 39 Major metabolites of [cyanophenyl–14C]-azoxystrobin in 30- and 200-day rotational crops
Metabolites % (mg/kg) Crop Interval (days)
Parent
Compound 2
Compound 9
Compound 28
Compound 30
Compound 42
Carbo-hydrates
Compound C
Compound G2
Compound K2
30 17.3 (0.08)
– – 4.3 (0.02)
– 41 (0.18)
– – – – Lettuce
200 9.5 (0.01)
– – 7.4 (< 0.01)
7.2 (< 0.01)
36.6 (0.04)
3.9 (< 0.01)
3.2 (< 0.01)
– –
30 16.3 (0.03)
2.3 (< 0.01)
– 9.5 (0.02)
5.9 (0.01)
– – – – 3.2 (< 0.01)
Radish root
200 8.7 (< 0.01)
– – 13.7 (< 0.01)
7.7 (< 0.01)
– 18.8 (< 0.01)
– – –
30 1.5 (0.01)
– – 5.2 (0.04)
0.9 (0.01)
6.7 (0.05)
4 (0.03)
1.6 (0.01)
31.2 (0.24)
6.6 (0.05)
Radish top
200 – – – 5.7 (0.02)
– 4.9 (0.01)
7.9 (0.02)
4.4 (0.01)
37.8 (0.11)
6.4 (0.02)
30 15.6 (0.34)
1.3 (0.04)
– 4.6 (0.01)
1.6 (0.04)
24.3 (0.53)
11.2 (0.24)
2.8 (0.06)
– 1 (0.02)
Wheat forage
200 12.7 (0.05)
– – 4.8 (0.02)
– 39.7 (0.17)
12.1 (0.05)
10.9 (0.05)
– –
30 14.8 (1.94)
3 (0.39)
0.9 (0.12)
5.9 (0.77)
2 (0.25)
23.3 (2.95)
11.7 (1.53)
3.2 (0.42)
– – Wheat straw
200 2.2 (0.06)
0.8 (0.02)
– 4.2 (0.12)
3 (0.08)
33.2 (0.97)
12.8 (0.37)
10 (0.29)
– –
30 2.3
(< 0.01)
2.3 (< 0.01)
– 1.7 (< 0.01)
1.5 (< 0.01)
1.5 (< 0.01)
12 (0.02)
3.2 (< 0.01)
– – Wheat grain
200 – – – – 1.9 (< 0.01)
1.9 (< 0.01)
30.6 (0.02)
3.6 (< 0.01)
– –

Azoxystrobin 41
Metabolites % (mg/kg) Crop Interval (days) Compound
M1 Compound M2
Compound M3
Compound N1
Compound N2
Compound O1
Compound O2
Compound O3
Lettuce 30 – – – – 2.8 (< 0.01)
– 13.3 (0.06)
12.3 (0.06)
200 – – – – – – 3.8 (< 0.01)
2.1 (< 0.01)
Radish root
30 1.9 (< 0.01)
3.4 (< 0.01)
3.4 (< 0.01)
1.9 (< 0.01)
3.4 (< 0.01)
1.9 (< 0.01)
– –
200 – – – 17.5 (< 0.01)
– – –
Radish top
30 – 1.3 (0.01
2.2 (0.02)
– 12.5 (0.1)
1.2 (0.01)
5.4 (0.04)
5.5 (0.04)
200 – – – – 13 (0.04)
– – –
Wheat forage
30 1.5 (0.03)
1.5 (0.03)
– 4.7 (0.1)
– 4.7 (0.1)
5.8 (0.12)
1.6 (0.04)
Wheat straw
30 – – – 1.2 (0.16)
1.7 (0.22)
1.2 (0.17)
3.3 (0.43)
6.2 (0.8)
200 – – – – – – 1.7 (0.05)
1.6 (0.05)
Wheat grain
30 – – – 2.6 (< 0.01)
– – – –
Environmental fate in water-sediment systems
Hydrolysis
The hydrolysis rate of of [14C]azoxystrobin labelled in the cyanophenyl ring was determined at 25 °C and 50 °C in buffered aqueous solutions at pH 5, 7 and 9 (Steel and Joseph, 1994; RJ1717B). The study was carried out under sterile conditions in the dark for up to 31 days. The initial concentrations of azoxystrobin were 2.5 and 2.6 µg/l for both the 25 °C and 50 °C experiments, respectively, and samples were taken for analysis by liquid scintillation counting (LSC) and TLC.
At 25 °C, there was no significant hydrolysis (< 10%) at any pH. At 50 °C, there was no significant hydrolysis (< 10%) at pH 5 or 7. At 50 °C and pH 9, analysis showed significant hydrolysis. Two products were identified: Compound 2 (up to 12%) and Compound 20 (up to 7.6%). The hydrolytic half-life of azoxystrobin at pH 9 and 50 °C was calculated to be 12.56 days. The systems were shown to be sterile, confirming the degradation at pH 9 and 50 °C to be true hydrolysis.
An additional study was carried out to study hydrolysis at pH 9 and 60 °C in order to be able to draw an Arrhenius plot to extrapolate azoxystrobin half-life at 20 °C (Tummon and Hurt, 1995; RJ1967B). The hydrolytic half-life of azoxystrobin at pH 9 and 60 °C was calculated to be 2.6 days. The system was shown to be sterile confirming the degradation at pH 9 and 60 °C to be true hydrolysis. Using the results of these two hydrolysis studies, an Arrhenius plot was drawn and the estimated hydrolytic half-life of azoxystrobin at 20 °C and pH 9 was calculated to be 2313 days.
Aqueous photolysis
The photolysis of [14C]azoxystrobin, separately radiolabelled in the cyanophenyl, pyrimidinyl and phenylacrylate ring, in water was studied at 25 ± 1 °C in buffered aqueous solutions at pH 7 (Kuet and Hadfield, 1994; RJ1705B). The study was carried out under sterile conditions over a period of approximately 30 days using an artificial light source. The initial concentrations of azoxystrobin were
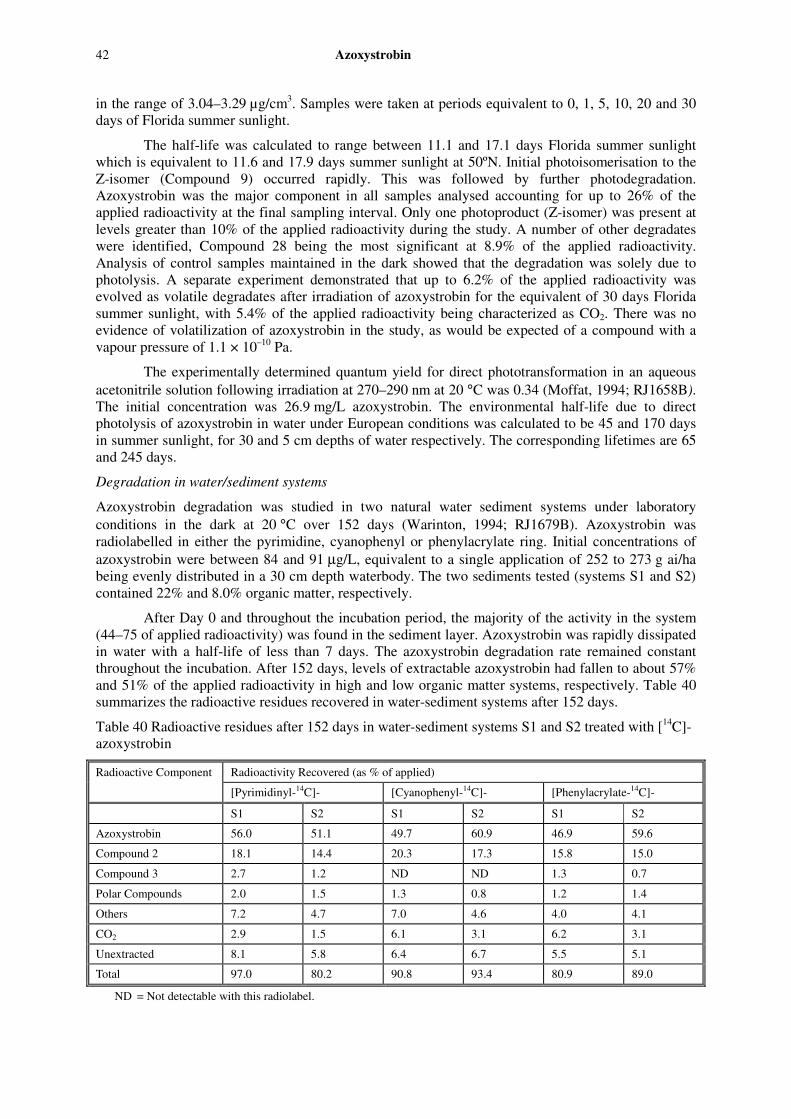
42 Azoxystrobin
in the range of 3.04–3.29 µg/cm3. Samples were taken at periods equivalent to 0, 1, 5, 10, 20 and 30 days of Florida summer sunlight.
The half-life was calculated to range between 11.1 and 17.1 days Florida summer sunlight which is equivalent to 11.6 and 17.9 days summer sunlight at 50ºN. Initial photoisomerisation to the Z-isomer (Compound 9) occurred rapidly. This was followed by further photodegradation. Azoxystrobin was the major component in all samples analysed accounting for up to 26% of the applied radioactivity at the final sampling interval. Only one photoproduct (Z-isomer) was present at levels greater than 10% of the applied radioactivity during the study. A number of other degradates were identified, Compound 28 being the most significant at 8.9% of the applied radioactivity. Analysis of control samples maintained in the dark showed that the degradation was solely due to photolysis. A separate experiment demonstrated that up to 6.2% of the applied radioactivity was evolved as volatile degradates after irradiation of azoxystrobin for the equivalent of 30 days Florida summer sunlight, with 5.4% of the applied radioactivity being characterized as CO2. There was no evidence of volatilization of azoxystrobin in the study, as would be expected of a compound with a vapour pressure of 1.1 × 10⁻¹⁰ Pa.
The experimentally determined quantum yield for direct phototransformation in an aqueous acetonitrile solution following irradiation at 270–290 nm at 20 °C was 0.34 (Moffat, 1994; RJ1658B). The initial concentration was 26.9 mg/L azoxystrobin. The environmental half-life due to direct photolysis of azoxystrobin in water under European conditions was calculated to be 45 and 170 days in summer sunlight, for 30 and 5 cm depths of water respectively. The corresponding lifetimes are 65 and 245 days.
Degradation in water/sediment systems
Azoxystrobin degradation was studied in two natural water sediment systems under laboratory conditions in the dark at 20 °C over 152 days (Warinton, 1994; RJ1679B). Azoxystrobin was radiolabelled in either the pyrimidine, cyanophenyl or phenylacrylate ring. Initial concentrations of azoxystrobin were between 84 and 91 µg/L, equivalent to a single application of 252 to 273 g ai/ha being evenly distributed in a 30 cm depth waterbody. The two sediments tested (systems S1 and S2) contained 22% and 8.0% organic matter, respectively.
After Day 0 and throughout the incubation period, the majority of the activity in the system (44–75 of applied radioactivity) was found in the sediment layer. Azoxystrobin was rapidly dissipated in water with a half-life of less than 7 days. The azoxystrobin degradation rate remained constant throughout the incubation. After 152 days, levels of extractable azoxystrobin had fallen to about 57% and 51% of the applied radioactivity in high and low organic matter systems, respectively. Table 40 summarizes the radioactive residues recovered in water-sediment systems after 152 days.
Table 40 Radioactive residues after 152 days in water-sediment systems S1 and S2 treated with [14C]-azoxystrobin
Radioactivity Recovered (as % of applied) Radioactive Component
[Pyrimidinyl-14C]- [Cyanophenyl-14C]- [Phenylacrylate-14C]-
S1 S2 S1 S2 S1 S2
Azoxystrobin 56.0 51.1 49.7 60.9 46.9 59.6
Compound 2 18.1 14.4 20.3 17.3 15.8 15.0
Compound 3 2.7 1.2 ND ND 1.3 0.7
Polar Compounds 2.0 1.5 1.3 0.8 1.2 1.4
Others 7.2 4.7 7.0 4.6 4.0 4.1
CO2 2.9 1.5 6.1 3.1 6.2 3.1
Unextracted 8.1 5.8 6.4 6.7 5.5 5.1
Total 97.0 80.2 90.8 93.4 80.9 89.0
ND = Not detectable with this radiolabel.

Azoxystrobin 43
Compound 2 was the major metabolite, present at about 17% of the applied activity 152 days after incubation. Compound 3 was detected at levels up to 2% of the applied radioactivity. After 152 days incubation, up to 6% of the applied radioactivity had been mineralized to CO2. The maximum level of unextractable residue accounted for 6% of the applied radioactivity.
METHODS OF RESIDUE ANALYSIS
Analytical methods
The Meeting received information on analytical methods for azoxystrobin and its Z-isomer in samples of plant and animal origin.
Samples of plant origin
The analytical methods for samples of plant origin are summarized below, including the commodities, for which the methods were validated, analytes and their limit of quantitation (LOQ), determination technique, and a brief description of the method. The recoveries are summarized in Tables 41–44.
Method:
(Reference)
RAM 243
Burke and Sapiets, 1995; (RJ1729B); Burke and Sapiets, 1998 (RAM 243 EPA); Burke, 2000 (SOP RAM 243/06); Clarke, 1994 (RJ1557B); McGill, 2004; (02-6089)
Recoveries: Table 41
Commodities: Cereal grains, processed cereals, dried beans, peas, leafy crops, soft fruits, processed soft fruits, citrus fruits and juice, fruiting vegetables, root crops, stone fruits, and wine
Analytes: Azoxystrobin and its Z-isomer
LOQ: 0.01 mg/kg (or mg/L), except for forage and straw (0.02 mg/kg)
Determination: GC/NPD or HPLC-UV
Description: Homogenized samples of banana, rice, leafy crop, dried beans, pea, cereal and processed cereal samples are extracted in 9:1 (v/v) acetonitrile:water solution. An aliquot of the extract is cleaned up by adsorption chromatography on a Florisil column. The eluate is evaporated to dryness and taken up in a known volume of toluene for analysis by GC-NPD.
Citrus, root crops, stone fruit, fruiting vegetables, soft fruits and processed soft fruit samples are extracted in 9:1 (v/v) acetonitrile:water, then partitioned with dichloromethane. Liquid samples such as wine and citrus juice are partitioned directly into dichloromethane. An aliquot of the extract is cleaned up by adsorption chromatography on a silica sorbent. The eluate is evaporated to dryness and taken up in a known volume of toluene for analysis by GC-NPD or in a mobile phase for analysis by HPLC-UV.
Method:
(Reference)
RAM 260
Burke, 1997; (SOP RAM 260/03); Burke, 1997; (RAM 260 EPA); Burke, 1995; (RJ1787B); Burke, 1997; (RJ2385B)
Recoveries: Table 42

44 Azoxystrobin
Commodities: Crops of high lipid content (peanut kernel and hull, processed peanut, pecan kernel, coffee bean, citrus skin, and canola oil)
Analytes: Azoxystrobin and its Z-isomer
LOQ: 0.01 mg/kg
0.05 mg/kg (or mg/L for peanut meal, peanut oil and oil seed rape
0.1 mg/kg for peanut hull
Determination: GC/NPD
Description: Homogenized samples of peanut hull and kernel, pecan kernel, coffee bean, oil seed rape, citrus skin and processed peanut (except peanut oil) samples are extracted in 9:1 (v/v) acetonitrile:water solution. Peanut oil is extracted by shaking with acetonitrile. An aliquot of the extract is cleaned up by partitioning into dichloromethane. The eluate is then evaporated to dryness and re-dissolved in 75:25 (v/v) ethyl acetate:methanol for further clean up by gel permeation chromatography (GPC) eluting through Alumina-N and Florisil solid phase extraction cartridges. The eluate is evaporated to dryness and taken up in a known volume of acetone for analysis by GC-NPD.
Method:
(Reference)
RAM 305
Chaggar, et al., 2004; (SOP RAM 305/03); Lister, 1999; (RJ2770B); Chaggar, 2004; (RJ3552B); Kang, 2003; CEMR-1995; Kang, 2004; CEMR-1708
Recoveries: Table 43
Commodities: Various plant materials
Analytes: Azoxystrobin and its Z-isomer
LOQ: 0.01 mg/kg
Determination: LC-MS/MS
Description: Homogenized samples are extracted with a 9:1 (v/v) mixture of acetonitrile and water. After clean-up using a C18 solid phase extraction procedure, residues of azoxystrobin and Z-isomer are determined by HPLC using triple quadrupole mass spectrometric detection (LC-MS/MS).
Method:
(Reference)
DFG method S-19, extended revision (German multiresidue enforcement method)
Klimmek, 2004; (IF-04/00192716); Specht, 1994; (ZEN-9402V); Weeren and Pelz, 2001; (ZEN-0002V); Lakaschus, 2005; (SYN-0422V)
Recoveries: Table 44
Commodities: Various plant materials
Analytes: Azoxystrobin and its Z-isomer
LOQ: 0.01 mg/kg
Determination: GC-MS or LC-MS/MS
Description: Homogenized samples are extracted using acetone. Water is added before extraction to obtain water: acetone ratio of 2:1 (v/v). After addition of sodium chloride, azoxystrobin is partitioned into ethyl acetate:cyclohexane (1:1, v/v). The extract is cleaned by GPC, followed by a silica gel clean-up. The analysis is performed by GC-MS or LC-MS/MS.

Azoxystrobin 45
Table 41 Recoveries of azoxystrobin and its Z-isomer in samples of plant origin using method RAM 243
Matrix Fortification (mg/kg)
Analyte n Mean recovery
(%)
Range recovery
(%)
RSD (%)
Reference
Banana 0.02–0.10 Azoxystrobin 13 102 95–110 5 Z-isomer 13 108 99–115 5
Burke, 1998 RAM 243 EPA
0.01 Azoxystrobin 8 107 101–115 5 Cereals, processed Z-isomer 8 99 93–102 3
Burke, 1998 RAM 243 EPA
Cherry 0.01–1.0 Azoxystrobin 3 100 92–116 14 Z-isomer 3 85 80–89 5
Bussey, 1998 RR 98-006B
Cucumber 0.10–0.50 Azoxystrobin 8 100 97–103 2 Z-isomer 8 108 101–112 3
Burke, 1998 RAM 243 EPA
Grain 0.01–0.20 Azoxystrobin 9 97 84–106 6 Burke, 1995 Z-isomer 9 107 96–127 7 RJ1729B Grain 0.01–0.50 Azoxystrobin 20 102 95–110 5 Clarke, 1994 Z-isomer 20 98 92–100 4 RJ1557B Grape 0.01–0.50 Azoxystrobin 20 100 98–110 5 Burke, 2000 Z-isomer 20 98 95–106 6 SOP 243/06 Grape 0.01–0.50 Azoxystrobin 20 102 98–110 3 Clarke, 1994 Z-isomer 20 101 95–106 3 RJ15571B Forage 0.20–2.0 Azoxystrobin 8 103 93–102 7 Burke, 1995
RJ1729B Mango 0.01–0.20 Azoxystrobin 10 84 73–88 6 Z-isomer 10 81 77–84 3
McGill, 2007 026089
Melon 0.2–0.50 Azoxystrobin 6 103 98–109 4 skin Z-isomer 6 105 99–110 8
Burke, 1998 RAM 243 EPA
Melon 0.02–0.10 Azoxystrobin 4 103 95–115 8 pulp Z-isomer 4 107 101–125 11
Burke, 1998 RAM 243 EPA
0.01–0.05 Azoxystrobin 8 104 98–113 5 Orange juice Z-isomer 8 103 97–107 3
Burke, 1998 RAM 243 EPA
Peach 0.10–0.20 Azoxystrobin 8 101 96–109 3 Z-isomer 8 109 103–114 3
Burke, 1998 RAM 243 EPA
Peach 0.01–2.0 Azoxystrobin 5 94 87–102 6 Bussey, 1998 Z-isomer 5 83 75–91 8 RR 98-009B Plum 0.01–1.0 Azoxystrobin 4 86 70–95 13 Z-isomer 4 80 77–85 5
Bussey, 1998 RR 98-010B
Straw 0.02–0.20 Azoxystrobin 12 99 85–110 8 Burke, 2000 Z-isomer 22 90 70–102 10 SOP 243/06 Straw 0.02–5.0 Azoxystrobin 20 103 99–105 3 Clarke, 1994 Z-isomer 20 95 85–100 4 RJ1557B Tomato 0.05–0.50 Azoxystrobin 9 102 99–107 3 Z-isomer 9 113 103–118 6
Burke, 1998 RAM 243 EPA
Tomato, 0.10–0.50 Azoxystrobin 3 102 99–101 2 processed Z-isomer 3 106 99–111 4
Burke, 1998 RAM 243 EPA
Wine 10–500 µg/L Azoxystrobin 20 100 96–106 3 Burke, 2000 Z-isomer 20 100 94–106 3 SOP 243/06 Wine 10–500 µg/L Azoxystrobin 20 100 96–106 3 Clarke, 1994 Z-isomer 20 100 94–106 3 RJ15571B
Table 42 Recoveries of azoxystrobin and its Z-isomer in samples of plant origin using method RAM 260
Matrix Fortification (mg/kg)
Analyte n Mean recovery
(%)
Range recovery
(%)
RSD (%)
Reference
Coffee 0.05–0.50 Azoxystrobin 9 97 94–101 2 Burker, 1997 bean Z-isomer 9 105 96–110 4 RJ2385B Coffee 0.01–0.10 Azoxystrobin 12 104 98–110 5 Burke, 1997 bean Z-isomer 12 108 102–110 5 SOP RAM 260/03

46 Azoxystrobin
Matrix Fortification (mg/kg)
Analyte n Mean recovery
(%)
Range recovery
(%)
RSD (%)
Reference
Lemon 0.1–5.0 Azoxystrobin 9 99 97–103 2 Burke, 1997 skin Z-isomer 9 105 100–110 3 RJ2385B
0.1 Azoxystrobin 8 98 90–104 6 Burke, 1997 Oil seed rape Z-isomer 8 100 92–112 6 SOP RAM 260/03
0.05–1.0 Azoxystrobin 15 100 83–112 10 Burke, 1997 Oil seed rape Z-isomer 15 104 88–122 11 SOP RAM 260/03 Orange 0.01–0.05 Azoxystrobin 10 105 88–123 10 Burke, 1997 skin Z-isomer 10 105 90–126 10 SOP RAM 260/03 Pecan 0.01–0.10 Azoxystrobin 12 98 93–101 2 Burke, 1995 kernel Z-isomer 12 106 96–110 5 RJ1787B Pecan 0.05–0.20 Azoxystrobin 6 104 95–108 5 Sapiets, 1995,1996 kernel Z-isomer 6 102 98–104 3 RJ2115B;RJ1950B Peanut 0.01–0.1 Azoxystrobin 16 100 94–106 4 Burke, 1995 kernel Z-isomer 16 100 94–110 4 RJ1787B Peanut 0.02–0.05 Azoxystrobin 10 105 95–115 7 Bussey, 1999 kernel Z-isomer 10 105 90–116 8 RR 98-046B Peanut 0.05–0.10 Azoxystrobin 15 102 92–116 6 Burke, 1997 kernel Z-isomer 15 95 88–104 5 SOP RAM 260/03 Peanut 0.02 Azoxystrobin 3 92 85–95 6 Burker, 1997 kernel Z-isomer 3 97 90– 10 6 RJ2385B Peanut 0.1 Azoxystrobin 4 103 100–105 2 Burke, 1995 hull Z-isomer 4 107 104– 14 4 RJ1787B Peanut 0.05–0.10 Azoxystrobin 4 102 95–108 5 Burke, 1997 meal Z-isomer 4 97 92–104 5 SOP RAM 260/03 Peanut Azoxystrobin 6 99 93–102 3 Burke, 1997 oil
0.05–0.10 µg/L Z-isomer 6 102 96–107 4 SOP RAM 260/03
Table 43 Recoveries of azoxystrobin and its Z-isomer in samples of plant origin using method RAM 305
Matrix Fortification (mg/kg)
Analyte n Mean recovery
(%)
Range recovery
(%)
RSD (%)
Reference
Avocado 0.01–1.0 Azoxystrobin 11 90 83–103 6 Lister, 1999 Z-isomer 11 90 86–94 2 RJ2770B Barley grain 0.01–1.0 Azoxystrobin 8 84 83–86 1 Lister, 1999 Z-isomer 8 87 82–91 4 RJ2770B Beer 0.01–0.1 Azoxystrobin 10 86 61–97 11 Chaggar, 2004 Z-isomer 10 87 58–92 9 RJ3552B Cabbage 0.01–1.0 Azoxystrobin 8 96 92–101 3 Lister, 1999 Z-isomer 8 96 92–100 3 RJ2770B Cabbage 0.01–0.30 Azoxystrobin 10 90 83–96 5 Chaggar, 2004 Z-isomer 10 90 87–95 3 RJ3552B Carrot 0.01–1.0 Azoxystrobin 8 84 76–89 5 Lister, 1999 Z-isomer 8 83 73–87 6 RJ2770B Grape 0.01–1.0 Azoxystrobin 8 92 78–102 10 Lister, 1999 Z-isomer 8 90 83–104 7 RJ2770B Hops, dry 0.01–20 Azoxystrobin 10 82 15 Kang, 2003 Z-isomer 10 80 12 CEMR-1995 Kale 0.01–1.0 Azoxystrobin 10 92 88–97 4 Kang, 2003 Z-isomer 10 90 85–94 4 CEMR-1708 Leeks 0.01–1.0 Azoxystrobin 8 83 75–88 7 Lister, 1999 Z-isomer 8 88 84–91 3 RJ2770B Lentil 0.01–1.0 Azoxystrobin 8 82 69–98 12 Lister, 1999 Z-isomer 8 82 66–98 12 RJ2770B Lettuce 0.01–1.0 Azoxystrobin 8 89 80–94 5 Lister, 1999 Z-isomer 8 93 78–99 7 RJ2770B Lettuce 0.01–3.0 Azoxystrobin 10 92 89–95 2 Kang, 2003 Z-isomer 10 90 86–95 4 CEMR-1708 Mandarin 0.01–10 Azoxystrobin 10 98 95–100 2 Chaggar, 2004 Z-isomer 10 95 88–103 6 RJ3552B

Azoxystrobin 47
Matrix Fortification (mg/kg)
Analyte n Mean recovery
(%)
Range recovery
(%)
RSD (%)
Reference
Melon 0.01–1.0 Azoxystrobin 8 91 81–97 7 Lister, 1999 Z-isomer 8 96 93–100 3 RJ2770B Oil seed 0.01–1.0 Azoxystrobin 8 84 80–88 3 Lister, 1999 rape Z-isomer 8 84 79–89 4 RJ2770B Onion 0.01–1.0 Azoxystrobin 8 80 61–87 11 Lister, 1999 Z-isomer 8 80 60–87 11 RJ2770B Orange skin 0.01–1.0 Azoxystrobin 8 94 83–118 11 Lister, 1999 Z-isomer 8 90 87–94 3 RJ2770B Orange flesh 0.01–1.0 Azoxystrobin 8 97 88–107 7 Lister, 1999 Z-isomer 8 86 79–95 6 RJ2770B Pea seed 0.01–1.0 Azoxystrobin 8 97 90–108 5 Lister, 1999 Z-isomer 8 94 85–99 4 RJ2770B Pear 0.01–1.0 Azoxystrobin 8 95 91–103 4 Lister, 1999 Z-isomer 8 91 88–94 2 RJ2770B Plum 0.01–1.0 Azoxystrobin 8 99 87–116 11 Lister, 1999 Z-isomer 8 97 87–114 10 RJ2770B Potato 0.01 1.0 Azoxystrobin 8 91 86–95 4 Lister, 1999 Z-isomer 8 89 86–92 2 RJ2770B Potato 0.01–0.1 Azoxystrobin 10 93 90–99 3 Kang, 2003 Z-isomer 10 93 90–96 2 CEMR-1708 Strawberry 0.01–1.0 Azoxystrobin 8 90 79–107 9 Lister, 1999 Z-isomer 8 92 87–98 4 RJ2770B Sunflower 0.01–0.5 Azoxystrobin 10 93 81–114 9 Chaggar, 2004 seed Z-isomer 10 93 86–101 5 RJ3552B Sugarbeets 0.01–1.0 Azoxystrobin 11 94 80–115 13 Lister, 1999 Z-isomer 11 94 82–112 9 RJ2770B Tomato 0.01–1.0 Azoxystrobin 8 87 80–90 4 Lister, 1999 Z-isomer 8 87 80–91 4 RJ2770B Wheat straw 0.01–1.0 Azoxystrobin 8 99 91–110 8 Lister, 1999 Z-isomer 8 94 89–100 4 RJ2770B Wheat straw 0.01–7.5 Azoxystrobin 10 87 81–99 6 Chaggar, 2004 Z-isomer 10 87 84–91 3 RJ3552B Wheat grain 0.01–0.3 Azoxystrobin 10 87 81–99 8 Chaggar, 2004 Z-isomer 10 95 89–102 4 RJ3552B Wheat flour 0.01–0.10 Azoxystrobin 10 92 85–97 4 Chaggar, 2004 Z-isomer 10 92 86–96 4 RJ3552B Wheat 0.01–1.0 Azoxystrobin 8 99 90–103 5 Lister, 1999 forage Z-isomer 8 97 89–106 5 RJ2770B
Table 44 Recoveries of azoxystrobin and its Z-isomer in samples of plant origin using the multiresidue method DFG S-19 (extended revision)
Matrix Fortification (mg/kg)
Analyte n Mean recovery
(%)
Range recovery
(%)
RSD (%)
Reference
Wheat 0.01–0.1 Azoxystrobin 4 105 95–121 10 Specht, 1994 forage Z-isomer 4 111 101–119 7 ZEN-9402V
Wheat 0.01–0.1 Azoxystrobin 4 92 82–106 12 Specht, 1994 grain Z-isomer 4 93 83–105 10 ZEN-9402V Wheat 0.01–0.1 Azoxystrobin 4 110 100–119 7 Specht, 1994 straw Z-isomer 4 104 93–116 12 ZEN-9402V Rye grain 0.01–0.1 Azoxystrobin 4 106 102–109 3 Specht, 1994 Z-isomer 4 92 87–101 7 ZEN-9402V Rye straw 0.01–0.1 Azoxystrobin 4 109 93–120 12 Specht, 1994 Z-isomer 4 94 80–100 10 ZEN-9402V Barley 0.01–0.1 Azoxystrobin 4 92 71–105 18 Specht, 1994 grain Z-isomer 4 110 99–121 8 ZEN-9402V Barley 0.01–0.1 Azoxystrobin 4 88 74–109 17 Specht, 1994 straw Z-isomer 4 84 72–99 13 ZEN-9402V Grape 0.01–0.1 Azoxystrobin 4 97 94–106 7 Specht, 1994 Z-isomer 4 101 89–105 8 ZEN-9402V

48 Azoxystrobin
Matrix Fortification (mg/kg)
Analyte n Mean recovery
(%)
Range recovery
(%)
RSD (%)
Reference
Orange 0.02–0.2 Azoxystrobin 10 90 81–102 7 Kohlrabi 0.02–0.2 Azoxystrobin 6 105 89–120 12 Garlic 0.05– 0.5 Azoxystrobin 6 111 100–120 6 Chamomile 0.05–0.5 Azoxystrobin 6 99 79–126 22 Fennel seed 0.05–0.5 Azoxystrobin 6 119 109–131 7 Black tea 0.05–0.5 Azoxystrobin 6 77 62–94 17
Weeren, 2001 ZEN-0002V
Lettuce 0.01–3.0 Azoxystrobin 10 88 84–95 4 Klimmek, 2004 Z-isomer 10 89 84–97 4 IF-04/00192716 Wheat grain 0.01–0.3 Azoxystrobin 10 83 76–92 5 Klimmek, 2004 Z-isomer 10 84 81–89 3 IF-04/00192716 Oilseed rape 0.01–0.5 Azoxystrobin 10 87 71–95 10 Klimmek, 2004 Z-isomer 10 87 68–99 12 IF-04/00192716 Orange 0.01–10 Azoxystrobin 10 84 75–94 7 Klimmek, 2004 Z-isomer 10 80 65–96 14 IF-04/00192716
Samples of animal origin
The analytical methods for samples of animal origin are summarized below, including the commodities, for which the methods were validated, analytes and their limit of quantitation (LOQ), determination technique, and a brief description of the method. The recoveries are summarized in Tables 45–47.
Method: (Reference)
RAM 255 Ryan, 1999; (SOP RAM 255); Burke and Sapiets, 1998; (RAM 255 EPA); Coombe, 1996; (CEMR-516)
Recoveries: Table 45 Commodities: Animal tissues, milk and eggs Analytes: Azoxystrobin and its Z-isomer LOQ: 0.01 mg/kg
0.001 mg/kg for milk Determination: GC/NPD Description: Homogenized samples of animal tissues and eggs are extracted with acetonitrile.
Milk is extracted using acetonitrile and partitioned into dichloromethane. An aliquot of the extract is cleaned up GPC eluting through alumina and Florisil solid phase extraction cartridges. The eluate is evaporated to dryness and taken up in a known volume of toluene for analysis by GC-NPD.
Method: (Reference)
RAM 399
Crook, 2002; (SOP RAM 399); Richards, 2002; (RJ3350B); Atkinson, 2003; (CEMR-1907)
Recoveries: Table 46 Commodities: Animal tissues, milk and eggs Analytes: Azoxystrobin and its Z-isomer LOQ: 0.01 mg/kg Determination: LC-MS/MS Description: Homogenized samples are extracted with acetonitrile. Extracts are centrifuged and
aliquots are diluted with ultra-pure water. A C18 solid phase extraction (SPE) procedure is carried out to facilitate sample clean-up. The analysis is performed using LC-MS/MS.
Method: (Reference)
DFG method S-19, extended revision (German multiresidue enforcement method) Specht and Thier, 1995; ZEN-9505V
Recoveries: Table 47 Commodities: Animal tissues, milk and eggs

Azoxystrobin 49
Analytes: Azoxystrobin LOQ: 0.02 mg/kg Determination: GC-MS Description: Homogenized samples are extracted using acetone. Water is added before
extraction to obtain water: acetone ratio of 2:1 (v/v). After addition of sodium chloride, azoxystrobin is partitioned into ethyl acetate:cyclohexane (1:1, v/v). The extract is cleaned by GPC, followed by a GC-MS analysis.
Table 45 Recoveries of azoxystrobin and its Z-isomer in samples of animal origin using method RAM 255
Matrix Fortification (mg/kg)
Analyte n Mean recovery
(%)
Range recovery
(%)
RSD (%)
Reference
Milk 0.001–0.02 Azoxystrobin 18 96 74–119 11 Ryan and Sapiets, Z-isomer 102 79–122 14 1996, RJ1809B
Egg 0.01–0.10 Azoxystrobin 16 86 78–100 8 Ryan and Sapiets, Z-isomer 98 90–110 6 1996, RJ1809B
Liver 0.01–0.10 Azoxystrobin 18 98 78–122 12 Ryan and Sapiets, Z-isomer 18 99 83–125 10 1996, RJ1809B
Muscle 0.01–0.10 Azoxystrobin 6 97 86–106 7 Ryan and Sapiets, Z-isomer 6 112 87–140 18 1996, RJ1809B
Fat 0.01–0.10 Azoxystrobin 6 99 85–124 13 Ryan and Sapiets, Z-isomer 6 100 91–111 8 1996, RJ1809B
Table 46 Recoveries of azoxystrobin and its Z-isomer in samples of animal origin using method RAM 399
Matrix Fortification (mg/kg)
Analyte n Mean recovery
(%)
Range recovery
(%)
RSD (%)
Reference
Bovine 0.01–0.1 Azoxystrobin 10 97 94–99 2 Richards, 2002 muscle Z-isomer 10 95 90–100 4 RJ3350B Bovine 0.01–0.1 Azoxystrobin 10 96 91–109 5 Atkinson, 2003 muscle Z-isomer 10 96 91–109 6 CEMR-1907 Bovine fat 0.01–0.1 Azoxystrobin 10 96 92–101 3 Richards, 2002 Z-isomer 10 91 87–97 3 RJ3350B Bovine milk 0.01–0.1 Azoxystrobin 10 94 89–101 3 Richards, 2002 Z-isomer 10 94 91–97 2 RJ3350B Bovine milk 0.01–0.1 Azoxystrobin 10 98 91–110 7 Atkinson, 2003 Z-isomer 10 98 90–111 8 CEMR-1907 Lamb’s 0.01–0.1 Azoxystrobin 10 98 91–104 4 Richards, 2002 kidney Z-isomer 10 97 92–107 5 RJ3350B Lamb’s 0.01–0.1 Azoxystrobin 10 93 87–07 4 Richards, 2002 liver Z-isomer 10 90 87–95 3 RJ3350B Hen’s 0.01–0.1 Azoxystrobin 10 95 91–98 3 Richards, 2002 eggs Z-isomer 10 95 89–98 3 RJ3350B
Table 47 Recoveries of azoxystrobin in samples of animal origin using the multiresidue method DFG S-19 (extended revision)
Matrix Fortification (mg/kg)
Analyte n Mean recovery
(%)
Range recovery
(%)
RSD (%)
Reference
Milk 0.02–0.2 Azoxystrobin 4 94 80–112 14 Specht and Their, 1995, ZEN-9595V Muscle 0.02–0.2 Azoxystrobin 4 102 92–118 11 Specht and Their, 1995, ZEN-9595V
Liver 0.2 Azoxystrobin 2 83 80–86 – Specht and Their, 1995, ZEN-9595V

50 Azoxystrobin
Stability of pesticide residues in stored analytical samples
The Meeting received information on the stability of azoxystrobin in freezer-stored samples of plant and animal origin.
Samples of wheat straw, grain, grapes, wine, peanuts, pecans, tomatoes, apples, bananas, cucumbers, peaches, and oilseed rape were fortified with azoxystrobin and analysed after 3–24 months of storage at ≤ –18°C [Burke, 1995 (RJ1858B); Burke, 1996 (RJ 2056B); Burke, 1997 (RJ2404B)]. Samples were analysed following extraction with acetonitrile/water, purification by adsorption chromatography and analysis by method RAM 243 with amendments. In high lipid compounds like peanuts, pecans and oilseed rape, azoxystrobin residues were determined by method RAM 260.
Procedural recoveries from samples fortified with azoxystrobin at 0.1 mg/kg are shown in Table 48. The stability of residues in stored crops is shown in Table 49. Recoveries of residues from stored samples ranged from 74–146% of azoxystrobin indicating that residues were stable following up to 2 years of storage under frozen conditions.
Table 48 Procedural recoveries of azoxystrobin in storage stability samples
Crop Mean recovery (%)
RSD (%)
Wheat straw 100 5 Wheat grain 103 3 Grapes 101 3 Wine 101 2 Peanuts 103 6 Pecans 101 6 Tomatoes 99 7 Bananas 95 8 Cucumbers 97 3 Apples 97 4 Peaches 98 5 Oilseed rape seed 99 5
Table 49 Stability of azoxystrobin in various freezer-stored crops (3–24 months of storage)
Azoxystrobin (mg/kg) Storage period (days) 0 91–92 143–
155 163–173
293 296–297
369–387
434 717–739
Range recovery (%)
Wheat straw 2.4 3.5 2.8 2.7 3 2.7 113–146
Wheat grain 0.1 0.11 0.1 0.09 0.08 80–110
Grapes 0.39 0.42 0.37 99 0.41 0.4 95–108
Wine 99 111 104 100 100–120
Peanuts 0.11 0.11 0.09 0.08 73–100
Pecans 0.1 0.11 0.08 0.08 73–100
Tomatoes 0.1 0.08 0.09 0.08 80–90
Bananas 0.1 0.1 0.09 0.09 90–100
Cucumbers 0.09 0.1 0.09 0.09 100–111
Apples 0.21 0.18 0.19 0.2 86–95
Peaches 0.21 0.18 0.19 0.2 86–95
Oilseed rape 0.1 0.09 0.1 0.1 90–100
Samples of soyabean meal, maize grits, carrot root, lettuce leaf, wheat forage, orange oil, juice and pulp were fortified with 0.1 mg/kg azoxystrobin and analysed after 1–24 months of storage at ≤ –18°C (Gill, 2005; RJ3170B). Straw samples contained incurred residues. Samples were analysed

Azoxystrobin 51
using the LC-MS/MS method (RAM 305). Residues found following storage and procedural recoveries are shown in Table 50. Recoveries of residues from stored samples ranged from 56–109% of azoxystrobin indicating that residues were stable following up to two years of frozen storage. The low (below 70%) recovery of 56% occurred from a single sample of orange pulp which also had low (69%) concurrent recoveries.
Table 50 Residues and procedural recoveries of azoxystrobin in various freezer-stored crops (1–24 months of storage)
Storage period (months)
0 1 6 12–15 24 Range % recoverya
Residue (mg/kg) 0.095 0.083 0.078 0.092 0.086 83–95 Soybean meal
Recovery (%) 98 93 87 81 90
Residue (mg/kg) 0.098 0.1 0.086 0.084 0.098 84–100 Maize grits
Recovery (%) 99 93 94 76 96
Residue (mg/kg) 0.096 0.094 0.078 0.093 0.097 78–97 Carrot root
Recovery (%) 94 100 75 92 95
Residue (mg/kg) 0.105 0.103 0.09 0.091 0.096 90–105 Leaf lettuce
Recovery (%) 100 103 100 87 91
Residue (mg/kg) 0.08 0.098 0.079 0.086 0.096 79–99 Wheat forage
Recovery (%) 88 95 86 88 97
Residue (mg/kg) 0.094 0.105 0.082 0.098 0.094 82–105 Orange oil
Recovery (%) 95 106 80 82 83
Residue (mg/kg) 0.109 0.081 0.085 0.086 0.089 81–109 Orange juice
Recovery (%) 108 94 89 79 85
Residue (mg/kg) 0.079 0.091 0.056 0.078 0.096 56–96 Orange pulp
Recovery (%) 80 109 69 76 96
a Uncorrected recovery
Samples of peanut oil and meal, wheat bran and tomato juice and paste were fortified with 0.1 mg/kg azoxystrobin and analysed after 4–12 months of storage at ≤ –18 °C (Burke, 1996; RJ2221B). Samples were analysed following extraction with acetonitrile/water, purification by adsorption chromatography and analysis by method RAM 243 or RAM 260 (peanut meal and oil). Procedural recoveries from samples and azoxystrobin residues in stored processed commodities are shown in Table 51. Recoveries of residues from stored samples ranged from 90–110%, indicating that residues were stable following up to one year of storage.
Table 51 Residues and procedural recoveries of azoxystrobin in various freezer-stored processed plant commodities (4–12 months of storage)
Storage period (days)
Peanut oil (mg/kg)
Peanut meal (mg/kg)
Wheat bran (mg/kg)
Tomato juice (mg/kg)
Tomato paste (mg/kg)
0 96 0.10 0.10 0.10 0.10
125 0.09
131 0.09
133 86
135 0.10 0.09
362 0.10 0.09
365 0.10
371 100
372 0.11

52 Azoxystrobin
Storage period (days)
Peanut oil (mg/kg)
Peanut meal (mg/kg)
Wheat bran (mg/kg)
Tomato juice (mg/kg)
Tomato paste (mg/kg)
Range %
recovery
90–104 90–100 90–110 100 90
Procedural recovery (%)
99 103 105 98 98
RSD (%) 3 5 2 4 3
The stability of azoxystrobin in beef muscle, liver, kidney, fat, milk and eggs under freezer storage conditions was investigated at ≤ –18 °C for up to about ten months (Sapiets, 1997; RJ2351B). Samples were homogenized and aliquots of each tissue weighed into pre-labelled PVC tubes similar to those used for routine storage. The samples were fortified with 0.1 mg/kg azoxystrobin (milk with 0.01 mg/kg) prior to storage in the freezer. Duplicate samples were removed and analysed by method RAM 255 at nominal zero time and after storage for approximately four and nine months. No apparent decrease in residue levels was found in any of the samples. Minimum of 80% of the initial fortification was recovered at each interval. Azoxystrobin residues were stable for at least ten months under freezer storage conditions (≤ –18 °C). Results are summarized in Table 52.
Table 52 Residues and procedural recoveries of azoxystrobin in freezer-stored animal commodities (4–10 months of storage)
Recovery from stored samples Tissue
Storage period (months)
Procedural recovery (%)
Individual stored samples (mg/kg)
Mean (mg/kg)
Mean Corrected (mg/kg)a
% of fortification levelb
0 98 0.097 0.094 0.10 0.10 100
4–5 101 0.094 0.098 0.10 0.10 102
Beef muscle
9–10 105 0.102 0.099 0.10 0.10 98
Beef liver 0 91 0.088 0.091 0.09 0.10 100
4–5 96 0.104 0.098 0.10 0.10 105
9–10 93 0.098 0.102 0.10 0.11 109
Beef kidney 0 98 0.092 0.095 0.09 0.09 100
4–5 96 0.100 0.099 0.10 0.10 113
9–10 99 0.087 0.098 0.09 0.09 99
Beef fat 0 97 0.095 0.094 0.09 0.09 100
4–5 99 0.098 0.098 0.10 0.10 109
9–10 104 0.099 0.086 0.09 0.09 93
Milk 0 102 0.010 0.010 0.01 0.01 100
4–5 94 0.011 0.010 0.01 0.01 100
9–10 106 0.010 0.009 0.01 0.01 100
Eggs 0 99 0.103 0.112 0.11 0.11 100
4–5 100 0.110 0.113 0.11 0.11 99
9–10 101 0.092 0.096 0.09 0.09 80 a corrected for control and procedural recovery < 100% b corrected for control and procedural recovery < 100% and normalised on mean 0 month recovery
USE PATTERN
Azoxystrobin is a broad spectrum fungicide from the strobilurin group of compounds. It exerts its fungicidal activity by inhibiting mitochondrial respiration in fungi. Azoxystrobin is a systemic

Azoxystrobin 53
compound that is translocated in the transpiration stream from the roots to the stem and into the leaves. Taken up by leaves, roots and seeds, it is claimed to have protectant and eradicant properties. Compared with the major classes of systemic fungicides, azoxystrobin has a high level of intrinsic activity and the broadest spectrum; therefore, it is active at very low doses against a wide range of fungal pathogens.
The Meeting received information on azoxystrobin registered uses in Brazil, France, Germany, Italy, Malaysia, the Netherlands, South Africa, Spain, Switzerland, the UK, and the USA. Table 52 provides a summary of the use pattern for crops, on which supervised trials were conducted. This information is based on the original labels and their translations provided by the manufacturer.
Table 53 Registered uses of azoxystrobin in Brazil, France, Germany, Italy, Malaysia, the Netherlands, South Africa, Spain, Switzerland, the UK, and the USA
Formulation Application Crop Country g ai/L
or g ai/kg
Type Method Rate kg
ai/ha
Rate kg
ai/hL
Season max kg
ai/ha or (No)
PHI days
Almond USA 800 WG Foliar 0.28 1.7 (6) 28 Almond USA 250 SC Foliar 0.28 1.7 (6) 28 Artichoke Spain 250 SC Foliar 0.25 (3) 7 Artichoke France 250 SC Foliar 0.25 (3) 7 Artichoke USA 800 WG Foliar 0.28 1.7 (6) 0 Artichoke USA 250 SC Foliar 0.28 1.7 (6) 0 Asparagus UK 250 SC Foliar 0.25 (3) Asparagus France 250 SC Foliar 0.25 (3) – Asparagus Germany 250 SC Foliar 0.25 (2) – Asparagus Italy 250 SC Foliar 0.25 (3) – Asparagus USA 800 WG Foliar 0.28 1.7 (6) 100 Asparagus USA 250 SC Foliar 0.28 1.7 (6) 100 Banana USA 800 WG Foliar 0.15 1.2 (8) 0 Banana USA 250 SC Foliar 0.15 1.2 (8) 0 Banana USA 250 SC Post-harvest
spray, dip or paint
0.04 (1) –
Barley France 250 SC Foliar 0.25 (2) 42 Barley Germany 250 SC Foliar 0.25 (2) 35 Barley Italy 250 SC Foliar 0.25 (2) 35 Barley Netherlands 250 SC Foliar 0.25 (2) 35 Barley Spain 250 SC Foliar 0.20–
0.25 (2) 36
Barley Switzerland 250 SC Foliar 0.25 (1) – Barley UK 250 SC Foliar 0.25 (2) Up to
GS 71 Barley UK 200f SC Foliar 0.20 (2) Up to
GS 71 Berries, bushberry subgroupa
USA 800 WG Foliar 0.28 0.84 (3) 0
Berries, bushberry subgroupa
USA 250 SC Foliar 0.28 0.84 (3) 0
Berries, caneberry subgroupb
USA 800 WG Foliar 0.28 1.7 (6) 0
Berries, caneberry subgroupb
USA 250 SC Foliar 0.28 1.7 (6) 0
Broccoli France 250 SC Foliar 0.25 (2) 14 Broccoli Netherlands 250 SC Foliar 0.25 (2) 14 Broccoli Germany 250 SC Foliar 0.25 (2) 14 Broccoli UK 250 SC Foliar 0.25 (2) 14

54 Azoxystrobin
Formulation Application Crop Country g ai/L
or g ai/kg
Type Method Rate kg
ai/ha
Rate kg
ai/hL
Season max kg
ai/ha or (No)
PHI days
Brassica, head and stem subgroupc
USA 800 WG Foliar 0.28 1.7 (6) 0
Brassica, head and stem subgroupc
USA 250 SC Foliar 0.28 1.7 (6) 0
Brassica, leafy greens subgroupd
USA 800 WG Foliar 0.28 0.84 (3) 0
Brassica, leafy greens subgroupd
USA 250 SC Foliar 0.28 0.84 (3) 0
Brussels sprouts Italy 250 SC Foliar 0.25 (2) 14 Brussels sprouts France 250 SC Foliar 0.25 (2) 14 Brussels sprouts UK 250 SC Foliar 0.25 (2) 14 Brussels sprouts Netherlands 250 SC Foliar 0.25 (2) 14 Brussels sprouts Germany 250 SC Foliar 0.25 (2) 14 Bulb vegetablese USA 800 WG Foliar 0.28 1.7 (6) 0 Bulb vegetablese USA 250 SC Foliar 0.28 1.7 (6) 0 Cabbage Italy 250 SC Foliar 0.25 (2) 14 Cabbage France 250 SC Foliar 0.25 (2) 14 Cabbage UK 250 SC Foliar 0.25 (2) 14 Cabbage Netherlands 250 SC Foliar 0.25 (2) 14 Cabbage Germany 250 SC Foliar 0.25 (2) 14 Cauliflower Italy 250 SC Foliar 0.25 (2) 14 Cauliflower France 250 SC Foliar 0.25 (2) 14 Cauliflower Netherlands 250 SC Foliar 0.25 (2) 14 Cauliflower Germany 250 SC Foliar 0.25 (2) 10 Cauliflower UK 250 SC Foliar 0.25 (2) 14 Celery France 250 SC Foliar 0.20 (3) 14 Celery Germany 250 SC Foliar 0.25 (2) 14 Celery Italy 250 SC Foliar 0.25 (3) 7 Citrus fruit USA 800 WG Foliar 0.28 1.7 (6) 0 Citrus fruit USA 250 SC Foliar 0.28 1.7 (6) 0 Citrus fruit USA 250 SC Post-harvest dip 0.12 (2) – Citrus fruit USA 250 SC Post-harvest
drench, flood, or spray
4 kg ai/ ton fruit
(2) –
Cotton USA 800 WG In-furrow Cotton USA 250 SC In-furrow
0.019 kg
ai/km
(1) –
Cotton USA 250 SC Foliar 0.17 0.5 (3) 45 Cranberry USA 800 WG Foliar 0.28 1.7 (6) 3 Cranberry USA 250 SC Foliar 0.28 1.7 (6) 3 Cucumber France 250 SC Foliar 0.020 (3) 3 Cucumber, outdoor
Italy 250 SC Foliar 0.20 (3) 3
Cucumber Italy 250 SC Foliar 0.025 (3) 3 Cucumber, field Germany 250 SC Foliar 0.25 (2) 3 Cucumber, glasshouse
Germany 250 SC Foliar 0.24 (2) 3
Cucumber, glasshouse
Netherlands 250 SC Foliar 0.020 (3) 1
Cucumber Spain 250 SC Foliar 0.20 (3) 3 Cucumber Switzerland 250 SC Foliar 0.025 (3) 3 Cucurbitsg USA 250 SC Foliar 0.28 1.7 (6) 1 Cucurbitsg USA 800 WG Foliar 0.28 1.7 (6) 1 Endive Germany 250 SC Foliar 0.25 (2) 14 Endive (root production)
France 250 SC Foliar 0.25 (3) 21

Azoxystrobin 55
Formulation Application Crop Country g ai/L
or g ai/kg
Type Method Rate kg
ai/ha
Rate kg
ai/hL
Season max kg
ai/ha or (No)
PHI days
Endive (chicon production)
France 250 SC Foliar 2.5 (3) 21
Gherkin France 250 SC Foliar 0.20 (3) 3 Gherkin Italy 250 SC Foliar 0.20 (3) 3 Grapes USA 800 WG Foliar 0.28 1.7 (6) 14 Grapes USA 250 SC Foliar 0.28 1.7 (6) 14 Herbs (basil, chives, parsley, etc.)
USA 800 WG Foliar 0.28 1.7 (6) 0
Herbs (basil, chives, parsley, etc.)
USA 250 SC Foliar 0.28 1.7 (6) 0
Hops Germany 250 SC Foliar 0.4 after
BBHC 55
0.8 (2) 28
Kohlrabi Germany 250 SC Foliar 0.25 (2) 14 Leeks Italy 250 SC Foliar 0.25 (2) 15 Leeks France 250 SC Foliar 0.25 (3) 50 Leeks Germany 250 SC Foliar 0.25 (2) 42 Leeks Netherlands 250 SC Foliar 0.25 (4) 21 Leeks Switzerland 250 SC Foliar 0.25 (2) 14 Leeks UK 250 SC Foliar 0.25 (4) 21 Legume vegetables
USA 800 WG Foliar 0.28 1.7 (6) 0
Legume vegetables
USA 250 SC Foliar 0.28 1.7 (6) 0
Lettuce France 250 SC Foliar 0.25 (3) 14 Lettuce Germany 250 SC Foliar 0.25 (2) 14 Lettuce Italy 250 SC Foliar 0.25 (3) 7 Lettuce Netherlands 250 SC Foliar 0.25 (3) 14 Lettuce Spain 250 SC Foliar 0.25 (3) 7 Lettuce Switzerland 250 SC Foliar 0.25 (3) 21 Lettuce USA 800 WG Foliar 0.28 1.7 (6) 0 Lettuce USA 250 SC Foliar 0.28 1.7 (6) 0 Maize USA 800 WG Foliar 0.28 2.2 (8) 7 Maize USA 250 SC Foliar 0.28 2.2 (8) 7 Mango Brazil 500 WG Foliar 0.06 0.008 (6) 2 Mango South Africa 250 SC Foliar 0.01 (2) 21 Mango USA 800 WG Foliar 0.28 1.7 (6) 0 Mango USA 250 SC Foliar 0.28 1.7 (6) 0 Melon France 250 SC Foliar 0.20 (3) 3 Melon, glasshouse
Germany 250 SC Foliar 0.24 (2) 3
Melon, outdoor Italy 250 SC Foliar 0.20 (3) 3 Melon Italy 250 SC Foliar 0.025 (3) 3 Melon, glasshouse
Netherlands 250 SC Foliar 0.020 (3) 3
Melon Spain 250 SC Foliar 0.20 (3) 3 Melon Switzerland 250 SC Foliar 0.025 (3) 3 Mint (fresh) USA 250 SC Foliar 0.28 0.84 (3) 0 Mint (fresh) USA 800 WG Foliar 0.28 0.84 (3) 0 Mint (for processing
USA 250 SC Foliar 0.28 0.84 (3) 7
Mint (for processing)
USA 800 WG Foliar 0.28 0.84 (3) 7
Oat Germany 250 SC Foliar 0.25 (2) 35 Oat UK 250 SC Foliar 0.25 (2) Up to
GS 71

56 Azoxystrobin
Formulation Application Crop Country g ai/L
or g ai/kg
Type Method Rate kg
ai/ha
Rate kg
ai/hL
Season max kg
ai/ha or (No)
PHI days
Papaya Brazil 500 WG Foliar 0.064 0.008 (4) 3 Papaya Malaysia 250 SC Foliar 0.11 0.011 (2) 1 Peanut USA 250 SC Foliar 0.45 0.9 (2) 14 Peanut USA 800 WG Foliar 0.45 0.9 (2) 14 Pecan USA 800 WG Foliar 0.22 1.3 (6) 45 Pecan USA 250 SC Foliar 0.22 1.3 (6) 45 Pepper France 250 SC Foliar 0.25 (3) 3 Pepper, glasshouse
Germany 250 SC Foliar 0.24 (2) 3
Pepper, outdoor
Italy 250 SC Foliar 0.20 (3) 3
Pepper Italy 250 SC Foliar 0.025 (3) 3 Pepper, glasshouse
Netherlands 250 SC Foliar 0.020 (3) 1
Pepper Spain 250 SC Foliar 0.20 0.020 (3) 3 Pistachio USA 800 WG Foliar 0.28 1.7 (6) 7 Pistachio USA 250 SC Foliar 0.28 1.7 (6) 7 Plantain USA 800 WG Foliar 0.15 1.2 (8) 0 Plantain USA 250 SC Foliar 0.15 1.2 (8) 0 Plantain USA 250 SC Post-harvest
spray, dip or paint
0.04 (1) –
Potato Germany 250 SC Foliar 0.13 (3) 7 Potato Netherlands 250 SC In-furrow 0.75 (1) – Potato Netherlands 250 SC Pre-plant, full
field 1.5 (1) –
Potato Netherlands 250 SC Foliar 0.063 (2) 7 Potato UK 250 SC In-furrow 0.75 (1) – Potato UK 250 SC Pre-plant, full
field 1.5 (1) –
Rapeseed USA 800 WG Foliar 0.28 0.5 30 Rapeseed USA 250 SC Foliar 0.28 0.5 30 Rice USA 800 WG Foliar 0.34 0.78 28 Rice USA 250 SC Foliar 0.34 0.78 28 Root vegetablesh USA 800 WG Foliar 0.37 2.2 (6) 0 Root vegetablesh USA 250 SC Foliar 0.37 2.2 (6) 0 Rye France 250 SC Foliar 0.25 (2) 42 Rye Germany 250 SC Foliar 0.25 (2) 35 Rye Switzerland 250 SC Foliar 0.25 (1) – Rye UK 250 SC Foliar 0.25 (2) Up to
GS 71 Soybeans, seeds USA 800 WG Foliar 0.28 1.7 (6) 14 Soybeans, seeds USA 250 SC Foliar 0.28 1.7 (6) 14 Soybeans, forage and hay
USA 800 WG Foliar 0.28 (1) 0
Soybeans, forage and hay
USA 250 SC Foliar 0.28 (1) 0
Stone fruit USA 800 WG Foliar 0.28 1.7 (6) 0 Stone fruit USA 250 SC Foliar 0.28 1.7 (6) 0 Strawberry USA 800 WG Foliar 0.28 1.1 (4) 0 Strawberry USA 250 SC Foliar 0.28 1.1 (4) 0 Sunflower USA 800 WG Foliar 0.28 0.5 30 Sunflower USA 250 SC Foliar 0.28 0.5 30 Tomato France 250 SC Foliar 0.25 (3) 3 Tomato, glasshouse
Germany 250 SC Foliar 0.24 (2) 3
Tomato, outdoor Italy 250 SC Foliar 0.20 (3) 3 Tomato Italy 250 SC Foliar 0.025 (3) 3 Tomato Spain 250 SC Foliar 0.20 0.020 (3) 3

Azoxystrobin 57
Formulation Application Crop Country g ai/L
or g ai/kg
Type Method Rate kg
ai/ha
Rate kg
ai/hL
Season max kg
ai/ha or (No)
PHI days
Tomato, glasshouse
Netherlands 250 SC Foliar 0.020 (3) 1
Tomato, glasshouse
Switzerland 250 SC Foliar 0.025 (3) 3
Triticale France 250 SC Foliar 0.25 (2) 42 Triticale Germany 250 SC Foliar 0.25 (2) 35 Triticale Switzerland 250 SC Foliar 0.25 (1) – Triticale UK 250 SC Foliar 0.25 (2) Up to
GS 71 Wheat France 250 SC Foliar 0.25 (2) 42 Wheat Germany 250 SC Foliar 0.25 (2) 35 Wheat Italy 250 SC Foliar 0.20–
0.25 (2) 35
Wheat Netherlands 250 SC Foliar 0.25 (2) 35 Wheat Spain 250 SC Foliar 0.20–
0.25 (2) 36
Wheat Switzerland 250 SC Foliar 0.25 (1) – Wheat UK 250 SC Foliar 0.25 (2) Up to
GS 71 Wheat UK 200f SC Foliar 0.20 (2) Up to
GS 71 a Blueberry, currant, elderberry, gooseberry, huckleberry, lingonberry, juneberry, salal b Blackberry, bingleberry, boysenberry, dewberry, lowberry, marionberry, olallieberry, youngberry, loganberry, raspberry c Broccoli, Chinese broccoli, Brussels sprouts, cabbage, Chinese cabbage (napa), Chinese mustard cabbage, cauliflower,
cavalo broccolo, kohlrabi d Broccoli raab, Chinese cabbage, collards, kale, mizuna, mustard greens, mustard spinach, rape greens e Garlic, leek, onion (bulb, green, Welsh), shallot f The formulation also includes 80 g/L of cyproconazole. g Cantaloupe, chayote, Chinese-waxgourd, cucumber, gourds, honeydew, melons, Momordica spp., muskmelon,
watermelon, pumpkin, squash, zucchini h Beet (garden and sugar), burdock, carrot, celeriac, chervil, chicory, ginsing, horseradish, parsley, parsnip, radish,
rutabaga, salsify, skirret, turnip
RESIDUES RESULTING FROM SUPERVISED TRIALS ON CROPS
The Meeting received information on azoxystrobin supervised trials on the following crops:
Commodity Group Table No. Citrus—Post-harvest Citrus fruit 54 Citrus—Foliar 55 Cherry Stone fruit 56 Peach 57 Plum 58 Blackberry and raspberry Berries and small fruit 59 Blueberry 60 Cranberry 61 Grapes 62 Strawberry 63 Banana—Post-harvest Tropical fruits—inedible peel 64 Banana—Foliar 65 Mango 66 Papaya 67 Leek Bulb vegetables 68

58 Azoxystrobin
Commodity Group Table No. Onion bulb, dry 69 Spring onion 70 Broccoli Brassica vegetables 71 Brussels sprouts 72 Cabbage 73 Cauliflower 74 Kohlrabi 75 Cucumber Fruiting vegetables, cucurbits 76 Gherkin 77 Melon 78 Summer squash 79 Pepper Fruiting vegetables other than
cucurbits 80
Tomato 81 Lettuce Leafy vegetables 82 Beans Legume vegetables 83 Peas 84 Soybeans, dry Pulses 85 Beetroot Root and tuber vegetables 86 Carrot 87 Chicory 88 Potato—at planting 89 Potato—foliar 90 Radish 91 Sugar beet 92 Artichokes Stalk and stem vegetables 93 Asparagus 94 Celery 95 Barley Cereal grains 96 Oat 97 Rye 98 Triticale 99 Wheat 100 Maize 101 Rice 102 Almonds Tree nuts 103 Pecans 104 Pistachios 105 Cottonseed Oil seeds 106 Sunflower 107 Peanuts 108 Basil, chives, parley Herbs 109 Mint 110 Soybean forage and hay Legume animal feeds 111 Barley straw and forage Cereal straw and forages 112 Oat straw and forage 113 Rye straw and forage 114 Triticale straw and forage 115 Wheat straw and forage 116 Maize fodder and forage 117 Rice straw 118 Sugar beet tops Miscellaneous forages 119 Hops, dry Dried herbs 120

Azoxystrobin 59
Trials were generally well documented with laboratory and field reports. Laboratory reports included method validation results with procedural recoveries of samples fortified at levels similar to those occurring in samples from the supervised trials. In general, data on procedural recoveries were within the acceptable range 70–120%, with RSDs of < 20%. Dates of analyses and duration of residue sample storage prior to analyses were also provided. Field reports included data on the dates of spray applications, methods used and sampling dates. Although trials included control plots, no control data are recorded in the summary tables below unless residues in control samples exceeded the LOQ. Results reported have not been corrected for concurrent method recoveries unless indicated.
Trials conducted within the same study at the same location, time, and on the same crop variety were generally considered replicate trials (e.g. side-by-side trials with SC and WG formulations or different spray concentrations or number of applications). In most trials, duplicate or multiple field samples from replicate plots were taken at each sampling period and were analysed separately. Each value is reported in the tables and the highest value was taken as the best estimate of the residues in the replicate plots or replicate trials used in the estimation of the maximum residue levels.
When residues were not detected they are shown as below the LOQ (e.g. < 0.01 mg/kg). Residues, application rates and spray concentrations have generally been rounded to two significant figures or, for residues near the LOQ, to one significant figure. Residue values from the trials conducted according to maximum GAP are double underlined. Residues in edible portion used for STMR and HR estimations are single underlined.
Table 54 Azoxystrobin residues resulting from post-harvest application to citrus in the USA
CITRUS Country
Year (variety)
Form g ai/L or g ai/kg
Application ratea
No Commodity
PHI days
Azoxystrobin residue mg/kg
Author Date
Study No
Post-harvest treatment: dip with storage wax
kg ai/hL United States, California 2001 (Marsh)
800 WG 0.12 1 Grapefruit 0 5.3, 3.0
Thompson 2004 IR4-07593
United States, Texas 2001 (Ruby Red)
800 WG 0.12 1 Grapefruit 0 2.1, 1.6
Thompson 2004 IR4-07593
United States Florida 2001 (Valencia)
800 WG 0.11 1 Orange 0 1.6, 1.3
Thompson 2004 IR4-07593
United States, California 2001 (Valencia)
800 WG 0.12 1 Orange 0 2.4, 4.0
Thompson 2004 IR4-07593
United States California 2001 (Eureka)
800 WG 0.12 1 Lemon 0 2.8, 3.5
Thompson 2004 IR4-07593
United States California 2001 (Eureka)
800 WG 0.12 1 Lemon 0 5.1, 6.6
Thompson 2004 IR4-07593
Post-harvest treatment: packing-line spray with Decco storage wax
kg ai /ton fruits
United States California 2001 (Marsh)
800 WG 4.0 1 Grapefruit 0 0.98, 0.93
Thompson 2004 IR4-07593

60 Azoxystrobin
CITRUS Country
Year (variety)
Form g ai/L or g ai/kg
Application ratea
No Commodity
PHI days
Azoxystrobin residue mg/kg
Author Date
Study No
United States, California 2001 (Valencia)
800 WG 4.0 1 Orange 0 0.83, 1.1
Thompson 2004 IR4-07593
United States, California 2001 (Eureka)
800 WG 4.0 1 Lemon 0 1.2, 1.6
Thompson 2004 IR4-07593
Post-harvest treatment: dip without storage wax
kg ai/hL United States, California 2001 (Marsh)
800 WG 0.12 1 Grapefruit 0 1.2, 1.6
Thompson 2004 IR4-07593
United States Texas 2001 (Ruby Red)
800 WG 0.12 1 Grapefruit 0 1.5, 1.7
Thompson 2004 IR4-07593
United States Florida 2001 (Valencia)
800 WG 0.12 1 Orange 0 1.3, 1.5
Thompson 2004 IR4-07593
800 WG 0.12 1 Orange, whole fruit
0 2.0, 1.5
Orange, Pulp
0 0.72, 0.54
United States California 2001 (Valencia)
Orange, peel
0 5.4, 4.9
Thompson 2004 IR4-07593
United States, California 2001 (Eureka)
800 WG 0.12 1 Lemon 0 2.0, 2.5
Thompson 2004 IR4-07593
United States California 2001
800 WG 0.12 1 Lemon 0 1.5, 2.0
Thompson 2004 IR4-07593
Post-harvest treatment: packing-line spray without wax, followed by shipping wax kg ai / ton
fruit
United States California 2001 (Marsh)
800 WG 4.0 1 Grapefruit 0 0.42, 0.55
Thompson 2004 IR4-07593
United States California 2001 (Valencia)
800 WG 4.0 1 Orange 0 0.47, 0.38
Thompson 2004 IR4-07593
United States California 2001 (Eureka)
800 WG 4.0 1 Lemon 0 0.73, 0.79
Thompson 2004 IR4-07593
Post-harvest treatment: dip with storage wax, followed by dip without wax kg ai/ hL United States California 2001 (Ruby Red)
800 WG 0.12 2 Grapefruit 0 2.1, 2.7
Thompson 2004 IR4-07593

Azoxystrobin 61
CITRUS Country
Year (variety)
Form g ai/L or g ai/kg
Application ratea
No Commodity
PHI days
Azoxystrobin residue mg/kg
Author Date
Study No
United States Texas 2001 (Ruby Red)
800 WG 0.12 2 Grapefruit 0 2.9, 2.6
Thompson 2004 IR4-07593
United States California 2001 (Valencia)
800 WG 0.12 2 Orange 0 1.6, 2.2
Thompson 2004 IR4-07593
United States Florida 2001 (Valencia)
800 WG 0.12 2 Orange 0 2.1, 1.8
Thompson 2004 IR4-07593
United States California 2001 (Eureka)
800 WG 0.12 2 Lemon 0 3.7, 5.5
Thompson 2004 IR4-07593
United States California 2001 (Eureka)
800 WG 0.12 2 Lemon 0 8.3, 8.8
Thompson 2004 IR4-07593
United States California 2005 (Satsuma)
800 WG 0.12 2 Mandarin 0 3.4, 3,4
Ediger 2006 T013959-05
United States California 2005 (Satsuma)
250 SC 0.12 2 Mandarin 0 5.0, 6.2
Ediger 2006 T013959-05
United States California 2005 (Dancy)
800 WG 0.12 2 Tangerine 0 2.5, 2.6
Ediger 2006 T013959-05
United States California 2005 (Dancy)
250 SC 0.12 2 Tangerine 0 4.0, 4.2
Ediger 2006 T013959-05
Post-harvest treatment: packing-line spray with Decco 202, followed by wash with Decco Fruit and Vegetable Kleen 241, followed by packing-line spray without wax, followed by Decco 400 kg ai/ ton fruit United States California 2001 (Marsh)
800 WG 4.0 2 Grapefruit 0 0.74, 0.86
Thompson 2004 IR4-07593
United States California 2001 (Valencia)
800 WG 4.0 2 Orange 0 0.58, 0.58
Thompson 2004 IR4-07593
United States California 2001 (Eureka)
800 WG 4.0 2 Lemon 0 0.79, 0.88
Thompson 2004 IR4-07593
aPrior to all post-harvest applications, treated plots received two applications of a 800 WG formulation at the rate of 0.28 kg ai/ha per application at six to eight day intervals. Mature fruits were collected on the day of the final application.
The field-treated fruits were subjected to different types of post-harvest treatments:
• dip with storage wax
• packing-line spray with storage wax;
• dip without wax
• packing-line spray without wax followed by shipping wax

62 Azoxystrobin
• dip with storage wax followed by dip without storage wax;
• packingline spray with wax storage wax followed by washing followed by packing-line spray without wax followed by shipping wax. Storage wax was applied at 10% by volume while shipping wax was applied undiluted.
Table 55 Azoxystrobin residues resulting from foliar application on citrus fruit in the USA
Application CITRUS Country
Year (variety)
Form g ai/L, g
ai/kg
kg ai/ha kg ai/hL Water, L/ha
No. / max
PHI days
Azoxystrobin residue, mg/kg
Author, Date
Study No.
800 WG 0.28 0.06 505 6 0 0.38, 0.50
United States Texas, 1997 Orange (Everhard navel)
800 WG 0.28 0.01 2207 6 0 0.53, 0.49
Bussey and Hampton. 1999 RR 99-012B
United States Florida, 1998 Orange (Valencia)
800 WG 0.28 0.01 2142 6 0 0.22, 0.23
Bussey. and Hampton 1999 RR 99-012B
United States Florida, 1998 Orange (Valencia)
800 WG 0.28 0.01 2140 6 0 0.25, 0.31
Bussey. and Hampton 1999 RR 99-012B
United States Florida, 1998 Orange (Valencia)
800 WG 0.28 0.01 2235 6 0 0.25, 0.32
Bussey. and Hampton 1999 RR 99-012B
United States Florida, 1998 Orange (Valencia)
800 WG 0.28 0.04 627 6 0 0.13, 0.30
Bussey. and Hampton 1999 RR 99-012B
United States Florida, 1998 Orange (Valencia)
800 WG 0.28 0.04 627 6 0 0.29, 0.40
Bussey. and Hampton 1999 RR 99-012B
United States Florida, 1998 Orange (Valencia)
800 WG 0.28 0.04 627 6 0 0.13, 0.28
Bussey. and Hampton 1999 RR 99-012B
United States Florida, 1998 Orange (Valencia)
800 WG 0.28 0.04 627 6 0 0.15, 0.34
Bussey. and Hampton 1999 RR 99-012B
United States California, 1998 Orange (Valencia)
800 WG 0.28 0.05 594 6 0 0.33, 0.37
Bussey. and Hampton 1999 RR 99-012B
United States California, 1998 Orange (Valencia)
800 WG 0.28 0.01 2104 6 0 0.39, 0.41
Bussey. and Hampton 1999 RR 99-012B
United States California, 1998 Orange (Valencia)
800 WG 0.28 0.01 2151 6 0 0.25, 0.26
Bussey. and Hampton 1999 RR 99-012B
800 WG 0.28 0.05 608 6 0 0.74, 0.64
United States Florida, 1998 Lemon (Bearss)
800 WG 0.28 0.01 2086 6 0 0.41, 0.42
Hampton 1999 RR 99-018B
United States Arizona, 1998
800 WG 0.28 0.01 2123 6 0 0.42, 0.52
Hampton 1999

Azoxystrobin 63
Application CITRUS Country
Year (variety)
Form g ai/L, g
ai/kg
kg ai/ha kg ai/hL Water, L/ha
No. / max
PHI days
Azoxystrobin residue, mg/kg
Author, Date
Study No.
Lemon (Ariana) RR 99-018B United States California, 1998 Lemon (Lisbon)
800 WG 0.28 0.05 600 6 0 0.65, 0.57
Hampton 1999 RR 99-018B
United States California, 1998 Lemon (Lisbon)
800 WG 0.28 0.01 2123 6 0 0.27, 0.31
Hampton 1999 RR 99-018B
United States California, 1998 Lemon (Lisbon)
800 WG 0.28 0.05 571 6 0 0.60, 0.54
Hampton 1999 RR 99-018B
800 WG 0.28 0.05 514 6 0 0.29, 0.29
United States Texas, 1997 Grapefruit (Rio Red)
800 WG 0.28 0.01 2207 6 0 0.41, 0.33
Hampton 1999 RR 99-011B
United States Florida, 1998 Grapefruit (Marsh)
800 WG 0.28 0.05 514 6 0 0.16, 0.20
Hampton 1999 RR 99-011B
United States Florida, 1998 Grapefruit (Flame)
800 WG 0.28 0.01 2104 6 0 0.25, 0.23
Hampton 1999 RR 99-011B
United States Florida, 1998 Grapefruit (White)
800 WG 0.28 0.01 2104 6 0 0.20, 0.27
Hampton 1999 RR 99-011B
United States California, 1998 Grapefruit (Marsh Rubi)
800 WG 0.28 0.05 608 6 0 0.17, 0.21
Hampton 1999 RR 99-011B
United States California, 1998 Grapefruit (Marsh)
800 WG 0.28 0.01 2150 6 0 0.17, 0.19
Hampton 1999 RR 99-011B
Table 56 Azoxystrobin residues resulting from foliar application on sweet cherry in the USA
Application CHERRY Country
Year (variety)
Form g ai/L, g ai/kg
kg ai/ha kg ai/hL
Water, L/ha
No./ max
PHI days
Azoxystrobin residue, mg/kg
Author, Date
Study No.
United States Michigan, 1997 (Summerset)
800 WG 0.28 0.05 600 8 0 0.43, 0.50
Bussey 1998 RR 98-006B
United States California, 1997 (Bing)
800 WG 0.28 0.04 664 8 0 0.42, 0.32
Bussey 1998 RR 98-006B
United States Washington, 1997 (Bing)
800 WG 0.28 0.06 468 8 0 0.97, 1.0
Bussey 1998 RR 98-006B
United States Michigan, 1997 (Rainier)
800 WG 0.28 0.01 2217 8 0 0.38, 0.42
Bussey 1998 RR 98-006B
United States California, 1997 (Bing)
800 WG 0.28 0.01 2179 8 0 0.20, 0.20
Bussey 1998 RR 98-006B

64 Azoxystrobin
Application CHERRY Country
Year (variety)
Form g ai/L, g ai/kg
kg ai/ha kg ai/hL
Water, L/ha
No./ max
PHI days
Azoxystrobin residue, mg/kg
Author, Date
Study No.
United States California, 1997 (Lambert)
800 WG 0.28 0.01 2123 8 0 0.31, 0.45
Bussey 1998 RR 98-006B
0.28 0.05 608 8 0 0.98, 0.89
3 0.52, 0.31
6 0.25, 0.18
10 0.20, 0.15
13 0.15, 0.14
United States Michigan, 1997 (Gold)
800 WG
19 0.16, 0.11
Bussey 1998 RR 98-006B
Table 57 Azoxystrobin residues resulting from foliar application on peach in the USA
Application PEACH Country
Year (variety)
Form g ai/L, g
ai/kg
kg ai/ha kg ai/hL
Water, L/ha
No./ max
PHI days
Azoxystrobin residue, mg/kg
Author, Date
Study No.
0.28 0.04 673 8 0 0.62, 0.89 United States Pennsylvania 1997 (Glohaven)
800 WG
7 0.39, 0.41
Bussey 1998 RR 98-009B
United States South Carolina 1997 (Suzy-Q)
800 WG 0.28 0.06 477 8 0 0.64, 0.59
Bussey 1998 RR 98-009B
United States South Carolina 1997 (Red Haven)
800 WG 0.28 0.04 627 8 0 0.78, 0.83 Bussey 1998 RR98-009B
United States Texas, 1997 (Rio Grande)
800 WG 0.28 0.09 300 8 0 0.72, 1.4
Bussey 1998 RR98-009B
United States California, 1997 (O’Henry)
800 WG 0.28 0.05 560 8 0 0.41, 0.40
Bussey 1998 RR98-009B
United States California, 1997 (Carson)
800 WG 0.28 0.04 655 8 0 0.73, 0.59
Bussey 1998 RR98-009B
United States Pennsylvania 1997 (Red Haven)
800 WG 0.28 0.01 2067 8 0 0.60, 0.55
Bussey 1998 RR98-009B
United States Georgia, 1997 (June Gold)
800 WG 0.28 0.01 1936 8 0 0.84, 0.69 Bussey 1998 RR98-009B
United States Georgia, 1997 (O’Henry)
800 WG 0.28 0.01 2011 8 0 0.42, 0.38 Bussey 1998 RR98-009B
United States Michigan, 1997 (Harmony)
800 WG 0.28 0.01 2058 8 0 0.66, 0.86
Bussey 1998 RR98-009B
United States Michigan, 1997 (Florida King)
800 WG 0.28 0.01 1871 8 1 0.22, 0.22
Bussey 1998 RR98-009B
United States California, 1997 (Carson)
800 WG 0.28 0.01 2104 8 0 0.70, 0.74 Bussey 1998 RR98-009B

Azoxystrobin 65
Application PEACH Country
Year (variety)
Form g ai/L, g
ai/kg
kg ai/ha kg ai/hL
Water, L/ha
No./ max
PHI days
Azoxystrobin residue, mg/kg
Author, Date
Study No.
250 SC
0.28 0.05 560 8 0 0.19, 0.28, 0.27 United States Georgia, 1998 (Harmony) 800 WG 0.28 0.05 560 8 0 0.28, 0.26, 0.23
Bussey 1999 RR 99-016B
250 SC 0.28 0.05 589 8 0 0.86, 0.73, 0.71 United States Michigan, 1998 (Red Haven)
800 WG 0.28 0.05 589 8 0 0.94, 0.91, 0.78 Bussey 1999 RR 99-016B
250 SC 0.28 0.05 590 8 0 0.34, 0.25, 0.30 United States California, 1998 (Loadel Clingstone)
800 WG 0.28 0.05 590 8 0 0.58, 0.57, 0.72
Bussey 1999 RR 99-016B
Table 58 Azoxystrobin residues resulting from foliar application on plum in the USA
Application PLUM Country
Year (variety)
Form g ai/L, g ai/kg
kg ai/ha kg ai/hL Water, L/ha
No. / max
PHI days
Azoxystrobin residue, mg/kg
Author, Date
Study No.
United States Michigan, 1997 (Stanley)
800 WG 0.28 0.05 589 8 0 0.24, 0.23
Bussey 1999 RR 98-010B
United States California, 1997 (Santa Rosa)
800 WG 0.28 0.05 560 8 0 0.09, 0.08
Bussey 1999 RR 98-010B
0 < 0.01, 0.02 United States California, 1997 (Nubiana)
800 WG 0.28 0.05 589 8 7 0.02, 0.01
Bussey 1999 RR 98-010B
United States Oregon, 1997 (Italian)
800 WG 0.28 0.05 589 8 0 0.23, 0.24 Bussey 1999 RR 98-010B
United States Michigan, 1997 (Stanley)
800 WG 0.28 0.01 2132 8 0 0.19, 0.30
Bussey 1999 RR 98-010B
United States California, 1997 (French)
800 WG 0.28 0.01 1964 8 0 0.39, 0.42
Bussey 1999 RR 98-010B
United States California, 1997 (French)
800 WG 0.28 0.01 1871 8 0 0.31, 0.37
Bussey 1999 RR 98-010B
United States Oregon, 1997 (Italian)
800 WG 0.28 0.01 2067 8 0 0.25, 0.22
Bussey 1999 RR 98-010B
Table 59 Azoxystrobin residues resulting from foliar application on blackberry and raspberry in the USA
Application CANEBERRY Country
Year (variety)
Form g ai/L, g ai/kg
kg ai/ha kg ai/hL
Water, L/ha
No. / max
PHI days
Azoxystrobin residue, mg/kg
Author, Date
Study No.
United States Washington, 1999 (Raspberry, Meeker)
800 WG 0.28 0.06 431–466
7 0 0.67, 0.71
Starner 2001 06786
United States Oregon, 1999 (Raspberry, Meeker)
800 WG 0.28 0.06 470–494
6 0 2.4, 2.2
Starner 2001 06786
United States Oregon, 1999 (Blackberry, Marion)
800 WG 0.28 0.06 472–487
7 0 2.1, 3.6
Starner 2001 06786

66 Azoxystrobin
Table 60 Azoxystrobin residues resulting from foliar application on blueberry in the USA
Application BLUEBERRY Country
Year (variety)
Form g ai/L, g
ai/kg
kg ai/ha kg ai/hL
Water, L/ha
No./ max
PHI days
Azoxystrobin residue, mg/kg
Author, Date
Study No.
United States Maine, 1998 (Wild blueberry)
800 WG 0.28 0.02 185–187 6 0 1.1, 1.6
Starner 2000 06721
United States Oregon, 1998 (Bluecrop)
800 WG 0.28 0.06 462–481 6 0 0.47, 0.52
Starner 2000 06721
United States North Carolina, 1998 (Croatan)
800 WG 0.28 0.09 310–331 6 0
7
0.85, 0.86
0.43, 0.34
Starner 2000 06721
United States North Carolina, 1998 (Croatan)
800 WG 0.28 0.09 315–329 6 0 0.89, 0.95
Starner 2000 06721
United States Michigan, 1998 (Jersey)
800 WG 0.28 0.06 458–477 6 0
7
1.0, 1.1
0.50, 0.42
Starner 2000 06721
United States Michigan, 1998 (Jersey)
800 WG 0.28 0.06 453–465 6 0 0.56, 0.79
Starner 2000 06721
United States Michigan, 1998 (Jersey)
800 WG 0.28 0.06 457–472 6 0 0.69, 1.1
Starner 2000 06721
Table 61 Azoxystrobin residues resulting from foliar application on cranberry in the USA
Application CRANBERRY Country
Year (variety)
Form g ai/L, g ai/kg
kg ai/ha kg ai/hL
Water, L/ha
No./ Max
seasonal rate
PHI days
Azoxystrobin residue, mg/kg
Author, Date
Study No.
3 0.15, 0.14
United States Massachusetts, 1999 (Howes)
800 WG 0.28 2806 6
14 0.15, 0.15
Thompson 2001 IR-4 06859
3 0.26, 0.26
United States Wisconsin, 1999 (Stevens)
800 WG 0.28 187 6
13 0.05, 0.05
Thompson 2001 IR-4 06859
3 0.31, 0.26
United States Oregon, 1999 (Stevens)
800 WG 0.28 350 6
15 0.15, 0.10
Thompson 2001 IR-4 06859
3 0.17, 0.19
Canada British Columbia, 1999 (Stevens)
800 WG 0.28 375 6
14 0.07, 0.08
Thompson 2001 IR-4 06859
Table 62 Azoxystrobin residues resulting from foliar application on grapes in the USA
Application GRAPES Country
Year (variety)
Form g ai/L, g ai/kg
kg ai/ha kg ai/hL
Water, L/ha
No./ max
PHI days
Azoxystrobin residue, mg/kg
Author, Date
Study No.
United States New York
800 WG 0.28 0.04 700 6 13 0.24 Francis, Roper and Storoni

Azoxystrobin 67
Application GRAPES Country
Year (variety)
Form g ai/L, g ai/kg
kg ai/ha kg ai/hL
Water, L/ha
No./ max
PHI days
Azoxystrobin residue, mg/kg
Author, Date
Study No.
1995 (Concord)
800 WG 0.28 0.02 1870 6 13 0.22 1996 RR96-012B
800 WG 0.28 0.04 645 6 14 0.34 United States California, 1995 (Thompson seedless)
800 WG 0.28 0.02 1852 6 14 0.47
Francis, Roper and Storoni 1996 RR96-012B
800 WG 0.28 0.04 655 6 14 0.23 United States California, 1995 (Thompson seedless)
800 WG 0.28 0.02 1870 6 14 0.53
Francis, Roper and Storoni 1996 RR96-012B
800 WG 0.28 0.04 627 6 14 0.53 United States California 1995 (Merlot)
800 WG 0.28 0.02 1805 6 14 0.32
Francis, Roper and Storoni 1996 RR96-012B
800 WG 0.28 0.04 627 6 14 0.10 United States California,1995 (Sauvignon Blanc)
800 WG 0.28 0.02 1805 6 14 0.11
Francis, Roper and Storoni 1996 RR96-012B
800 WG 0.28 0.04 627 6 14 0.80 United States California,1995 (Muscat Canneli) 800 WG 0.28 0.02 1805 6 14 0.73
Francis, Roper and Storoni 1996 RR96-012B
800 WG 0.28 0.04 627 6 14 0.36 United States California, 1995 (Grenache)
800 WG 0.28 0.02 1805 6 14 0.62
Francis, Roper and Storoni 1996 RR96-012B
800 WG 0.28 0.04 636 6 13 0.60 United States Oregon 1995 (Chardonnay)
800 WG 0.28 0.02 1852 6 13 0.49
Francis, Roper and Storoni 1996 RR96-012B
800 WG 0.28 0.04 636 6 13 0.23 United States Washington 1995 (White Reisling)
800 WG 0.28 0.02 1852 6 13 0.53
Francis, Roper and Storoni 1996 RR96-012B
0.28 0.04 748 6 6 0.70 12 0.64
United States California, 1994 (Thompson Seedless)
800 WG
19 0.73
Sapiets and Roper, 1995 RJ1860B
0.28 0.04 767 6 7 0.36 14 0.27
United States California, 1994 (Chardonnay)
800 WG
21 0.33
Sapiets and Roper, 1995 RJ1860B
0.28 0.06 458 6 7 0.35 14 0.30
United States Michigan 1994 (Concord)
800 WG
21 0.30
Sapiets and Roper, 1995 RJ1860B
0.28 0.05 580 6 6 0.49 13 0.46
21 0.42
United States New York 1994 (Vidal)
800 WG
27 0.47
Sapiets and Roper, 1995 RJ1860B
0.28 0.04 776 6 7 0.16 13 0.13
United States Arkansas 1994 (Mars)
800 WG
19 0.16
Sapiets and Roper, 1995 RJ1860B

68 Azoxystrobin
Application GRAPES Country
Year (variety)
Form g ai/L, g ai/kg
kg ai/ha kg ai/hL
Water, L/ha
No./ max
PHI days
Azoxystrobin residue, mg/kg
Author, Date
Study No.
0.28 0.06 468 6 7 1.0
14 0.76
United States Washington 1994 (Reisling)
800 WG
21 0.58
Sapiets and Roper, 1995 RJ1860B
Table 63 Azoxystrobin residues resulting from foliar application on strawberries in the USA
Application STRAWBERRY Country
Year (variety)
Form g ai/L, g ai/kg
kg ai/ha kg ai/hL
Water, L/ha
No./ max
PHI days
Azoxystrobin residue, mg/kg
Author, Date
Study No.
0 4.3, 2.8
United States Florida, 1998 (FL-93-100)
800 WG 0.27 0.10 281 6
7 0.48, 0.67
Thompson 2000 RR 00-104B
0.28 0.10 280 6 0 4.5, 3.8
United States Florida, 1998 (FL-93-100)
800 WG
7 0.65, 0.51
Thompson 2000 RR 00-104B
United States Oregon, 1998 (Totem)
800 WG 0.28 0.06 495 6 0 0.20, 0.28
Thompson 2000 RR 00-104B
0.28 0.17 164 6 0 0.65, 0.49
United States Wisconsin, 1998 (Honeoye)
800 WG
7 0.19, 0.27
Thompson 2000 RR 00-104B
0.28 0.09 318 7 0 0.24, 0.15
United States California, 1998 (Chandler)
800 WG
7 0.26, 0.19
Thompson 2000 RR 00-104B
United States California, 1998 (PS-592)
800 WG 0.28 0.03 842 6 0 1.3, 0.82
Thompson 2000 RR 00-104B
United States California, 1998 (PS-118)
800 WG 0.28 0.03 828 6 0 1.3, 1.1 Thompson 2000 RR 00-104B
Table 64 Azoxystrobin residues resulting from post-harvest application on banana in Central America (according to the US GAP)
BANANA Country
Year (variety)
Form g ai/L or g
ai/kg
Application rate
kg ai/hL
No Commodity
PHI days
Azoxystrobin residue mg/kg
Author Date
Study No
Mexico 1998 (Grand Nain)
250 SC 0.04 1 Whole fruit
Pulp
0 0.98, 0.79
0.03, 0.03
Kennedy 1998 CEMR-835
Mexico 1998 (Grand Nain)
250 SC 0.04 1 Whole fruit
Pulp
0 1.1, 1.0
0.06, 0.07
Kennedy 1998 CEMR-835
Guatemala 1998 (Grand Nain)
250 SC 0.04 1 Whole fruit
Pulp
0 0.71, 0.48
< 0.02, 0.02
Kennedy 1998 CEMR-835

Azoxystrobin 69
BANANA Country
Year (variety)
Form g ai/L or g
ai/kg
Application rate
kg ai/hL
No Commodity
PHI days
Azoxystrobin residue mg/kg
Author Date
Study No
Guatemala 1998 (Grand Nain)
250 SC 0.04 1 Whole fruit
Pulp
0 0.61, 0.82
0.03, 0.02
Kennedy 1998 CEMR-835
Costa Rica 1998 (Grand Nain)
250 SC 0.04 1 Whole fruit
Pulp
0 0.85, 0.62
0.05, < 0.02
Kennedy 1998 CEMR-835
Costa Rica 1998 (Valorie)
250 SC 0.04 1 Whole fruit
Pulp
0 0.57, 0.58
< 0.02, < 0.02
Kennedy 1998 CEMR-835
Table 65 Azoxystrobin residues resulting from foliar application on bananas in the USA
Application BANANA Country
Year (variety)
Form g ai/L, g
ai/kg
kg ai/ha
Water, L/ha
No. / max
PHI days
Commodity Azoxystrobin residue, mg/kg
Author, Date
Study No.
Bagged
Whole fruit 0.03, 0.05 United States Florida, 1995
(Hawaii)
800 WG 0.15 280 8 0
Pulp < 0.01, < 0.01
Roper 1996
RR96-050B
Whole fruit 0.01, < 0.01
United States Hawaii, 1995
(Valarie)
800 WG 0.15 243 8 0
Pulp < 0.01, < 0.01
Roper 1996
RR96-050B
Whole fruit 0.01, 0.02
United States Hawaii, 1995 (Williams)
800 WG 0.15 187 8 0
Pulp < 0.01, < 0.01
Roper 1996
RR96-050B
Whole fruit 0.05, 0.05
United States Hawaii, 1995 (Williams)
800 WG 0.15 224 8 0
Pulp 0.01, < 0.01
Roper 1996
RR96-050B
Whole fruit 0.02, 0.02
United States Hawaii, 1995 (Williams)
800 WG 0.15 187–256 8 0
Pulp < 0.01, < 0.01
Roper 1996
RR96-050B
Whole fruit 0.11, 0.15
Puerto Rica, 1995
(Grand Nain)
800 WG 0.15 243 8 0
Pulp 0.01, 0.01
Roper 1996
RR96-050B
Unbagged
Whole fruit 0.08, 0.11
United States Florida, 1995
(Hawaii)
800 WG 0.15 280 8 0
Pulp < 0.01, < 0.01
Roper 1996
RR96-050B
Whole fruit 0.17, 0.18
United States Hawaii, 1995
(Valarie)
800 WG 0.15 243 8 0
Pulp 0.02, 0.02
Roper 1996
RR96-050B
Whole fruit 0.10, 0.10
United States Hawaii, 1995
(Williams)
800 WG 0.15 187 8 0
Pulp < 0.01, < 0.01
Roper 1996
RR96-050B
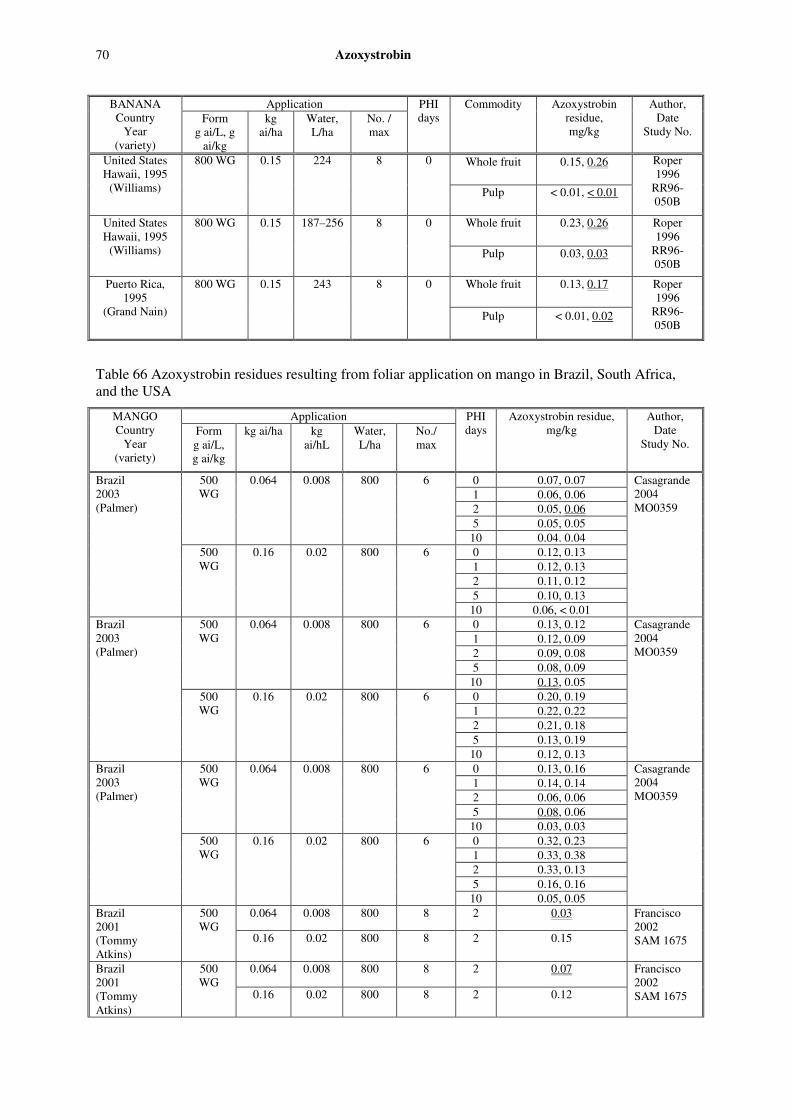
70 Azoxystrobin
Application BANANA Country
Year (variety)
Form g ai/L, g
ai/kg
kg ai/ha
Water, L/ha
No. / max
PHI days
Commodity Azoxystrobin residue, mg/kg
Author, Date
Study No.
Whole fruit 0.15, 0.26
United States Hawaii, 1995
(Williams)
800 WG 0.15 224 8 0
Pulp < 0.01, < 0.01
Roper 1996
RR96-050B
Whole fruit 0.23, 0.26
United States Hawaii, 1995
(Williams)
800 WG 0.15 187–256 8 0
Pulp 0.03, 0.03
Roper 1996
RR96-050B
Whole fruit 0.13, 0.17
Puerto Rica, 1995
(Grand Nain)
800 WG 0.15 243 8 0
Pulp < 0.01, 0.02
Roper 1996
RR96-050B
Table 66 Azoxystrobin residues resulting from foliar application on mango in Brazil, South Africa, and the USA
Application MANGO Country
Year (variety)
Form g ai/L, g ai/kg
kg ai/ha kg ai/hL
Water, L/ha
No./ max
PHI days
Azoxystrobin residue, mg/kg
Author, Date
Study No.
0.064 0.008 800 6 0 0.07, 0.07 1 0.06, 0.06 2 0.05, 0.06 5 0.05, 0.05
500 WG
10 0.04. 0.04 0.16 0.02 800 6 0 0.12, 0.13
1 0.12, 0.13 2 0.11, 0.12 5 0.10, 0.13
Brazil 2003 (Palmer)
500 WG
10 0.06, < 0.01
Casagrande 2004 MO0359
0.064 0.008 800 6 0 0.13, 0.12 1 0.12, 0.09 2 0.09, 0.08 5 0.08, 0.09
500 WG
10 0.13, 0.05 0.16 0.02 800 6 0 0.20, 0.19
1 0.22, 0.22 2 0.21, 0.18 5 0.13, 0.19
Brazil 2003 (Palmer)
500 WG
10 0.12, 0.13
Casagrande 2004 MO0359
0.064 0.008 800 6 0 0.13, 0.16 1 0.14, 0.14 2 0.06, 0.06 5 0.08, 0.06
500 WG
10 0.03, 0.03 0.16 0.02 800 6 0 0.32, 0.23
1 0.33, 0.38 2 0.33, 0.13 5 0.16, 0.16
Brazil 2003 (Palmer)
500 WG
10 0.05, 0.05
Casagrande 2004 MO0359
0.064 0.008 800 8 2 0.03 Brazil 2001 (Tommy Atkins)
500 WG
0.16 0.02 800 8 2 0.15
Francisco 2002 SAM 1675
0.064 0.008 800 8 2 0.07 Brazil 2001 (Tommy Atkins)
500 WG
0.16 0.02 800 8 2 0.12
Francisco 2002 SAM 1675

Azoxystrobin 71
Application MANGO Country
Year (variety)
Form g ai/L, g ai/kg
kg ai/ha kg ai/hL
Water, L/ha
No./ max
PHI days
Azoxystrobin residue, mg/kg
Author, Date
Study No.
0.064 0.008 800 8 0 0.04 1 0.05 2 0.05 3 0.04
500 WG
4 0.06
Brazil 2001 (Tommy Atkins)
500 WG
0.16 0.02 800 8 2 0.09
Francisco 2002 SAM 1675
South Africa 2002 (Tommy Atkins)
250 SC 0.01 2
0 7
10 14 21
Whole fruit: 0.03 0.02 0.02 0.01 0.02
Flesh:
< 0.01 < 0.01 < 0.01 < 0.01 < 0.01
McGill 2004 02-6088
South Africa 2002 (Kent)
250 SC 0.01 2
0 7
10 14 21
Whole fruit: 0.05 0.09 0.08 0.06 0.06
Flesh:
0.01 < 0.01 < 0.01 < 0.01 < 0.01
McGill 2004 02-6089
250 SC 0.01 2
0 21
Whole fruit: 0.08 0.03
Flesh:
< 0.01 < 0.01
South Africa 2002 (Tommy Atkins)
0.02 2
0 21
Whole fruit: 0.13 0.07
Flesh:
< 0.01 < 0.01
McGill 2004 02-6090
250 SC 0.01 2
0 21
Whole fruit: 0.12 0.06
Flesh:
< 0.01 < 0.01
South Africa 2002 (Keith)
0.02 2
0 21
Whole fruit: 0.20 0.09
Flesh:
0.03 < 0.01
McGill 2004 02-6091
United States Florida, 1998 (Kent)
800 WG
0.28 6 0 0.18, 0.31
Thompson 2000 IR-4 PR 06867
United States Florida, 1998 (Kent)
800 WG
0.28 6 0 0.09, 0.05
Thompson 2000 IR-4 PR 06867
United States Florida, 1998 (Tommy Atkins)
800 WG
0.28 6 0 0.41, 0.48
Thompson 2000 IR-4 PR 06867
Note: In Brazilian trials, azoxystrobin was analysed in fruit after removal of stone and the results calculated on whole fruit. In South African trials, whole mango fruit residues were calculated from residues in peel, flesh, and stone, using the weight of each part, compared to the weight of the whole mango fruit. In the US trials, azoxystrobin residues were determined in mango halves (stone removed).

72 Azoxystrobin
Table 67 Azoxystrobin residues resulting from foliar application on papaya in Brazil and Malaysia
Application Azoxystrobin residue, mg/kg
PAPAYA Country
Year (variety)
Form g ai/L, g ai/kg
kg ai/ha
kg ai/hL
Water, L/ha
No./ max
PHI days
Whole fruit
Flesh
Author, Date
Study No.
0.08 0.01 800 6
500 WG
0a
0 3 7 10 14
0.09 0.15 0.12 0.08 0.10 0.08
0.16 0.02 800 6
Brazil 2002 (Golden)
500 WG
0a 0 3 7 10 14
0.15 0.28 0.20 0.13 0.12 0.13
McGill 2004 02-6033
0.08 0.01 800 6
500 WG
0a 0 3 7 10 14
0.05 0.14 0.09 0.06 0.06 0.04
0.02 0.02 0.01
< 0.01 < 0.01 < 0.01
0.16 0.02 800 6
Brazil 2002 (Golden)
500 WG
0a 0 3 7 10 14
0.04 0.34 0.27 0.15 0.17 0.14
0.01 0.07 0.05 0.02 0.02 0.03
McGill 2004 02-6034
0.08 0.01 800 6
500 WG
0a 0 3 7 10 14
0.07 0.16 0.11 0.08 0.08 0.06
0.16 0.02 800 6
Brazil 2002 (Taiwan)
500 WG
0a 0 3 7 10 14
0.13 0.49 0.21 0.16 0.12 0.07
McGill 2004 02-6037
0.08 0.01 800 6
500 WG
0a 0 3 7 10 14
0.05 0.07 0.06 0.04 0.04 0.04
0.01 0.01 0.02
< 0.01 < 0.01 < 0.01
0.16 0.02 800 6
Brazil 2002 (Golden)
500 WG
0a 0 3 7 10 14
0.18 0.27 0.20 0.16 0.12 0.07
0.03 0.04 0.04 0.03 0.02 0.01
McGill 2004 02-6038

Azoxystrobin 73
Application Azoxystrobin residue, mg/kg
0.11 0.011 1000 2
250 SC
–1 0 1 3 7 13
< 0.05 0.08 0.15 0.12 0.07 0.07
0.23 0.023 1000 2
Malaysia 2005 (Exotica III)
250 SC
–1 0 1 3 7 13
0.07 0.28 0.27 0.16 0.08 0.19
Keong 2005 MYF22005B
0.11 0.011 1000 2
Malaysia 2006 (Exotica III)
250 SC
–1 0 1 3 5 7 10 14
< 0.05 < 0.05 < 0.05 < 0.05 < 0.05 < 0.05 < 0.05 < 0.05
Keong 2006 AZX/PPY/2006/ BT/001
0.11 0.011 1000 2
Malaysia 2006 (Exotica III)
250 SC
–1 0 1 3 5 7 10 14
< 0.05 < 0.05 < 0.05 < 0.05 < 0.05 < 0.05 < 0.05 < 0.05
Keong 2006 AZX/PPY/2006/ BT/004
a Before final application
Table 68 Azoxystrobin residues in leeks from supervised trials in Europe
Application LEEKS Country
Year (variety)
Form g ai/L, g ai/kg
kg ai/ha kg ai/hL Water, L/ha
No./ max
PHI days
Azoxystrobin residue, mg/kg
Author, Date
Study No.
250 SC 0.25 0.06 400 3 0a 0.41 0 1.42 7 1.2 13 1.2 21 0.66 28 0.23
France (South) 2003 (Harston F1)
36 0.19
Sole 2004 03-6000
250 SC 0.25 0.08 300 3 0a 0.10 0 1.07 7 0.21 15 0.06 22 0.03 29 0.01
France (South) 2003 (Upton)
35 < 0.01
Sole 2004 03-6034
250 SC 0.25 0.06 400 3 0a 0.24 0 1.4 7 0.22 14 0.14 21 0.08 28 0.04
France (South) 2003 (Primera)
35 0.02
Sole 2004 03-6035
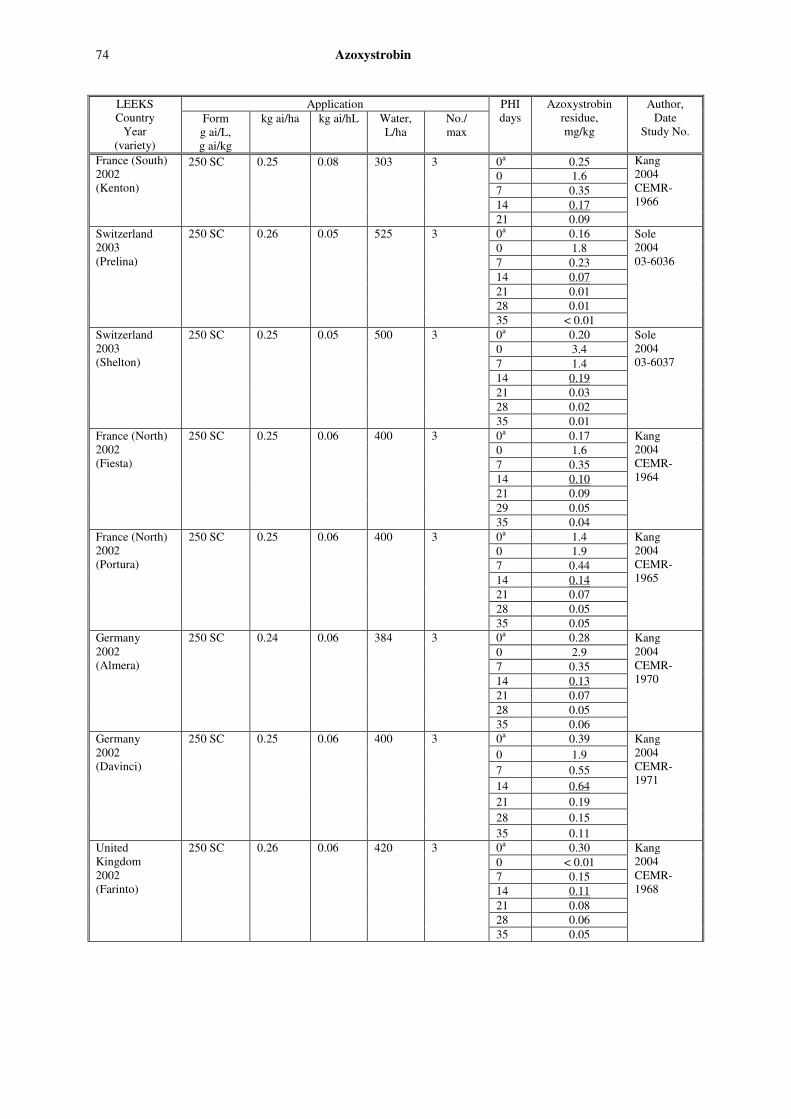
74 Azoxystrobin
Application LEEKS Country
Year (variety)
Form g ai/L, g ai/kg
kg ai/ha kg ai/hL Water, L/ha
No./ max
PHI days
Azoxystrobin residue, mg/kg
Author, Date
Study No.
250 SC 0.25 0.08 303 3 0a 0.25 0 1.6 7 0.35 14 0.17
France (South) 2002 (Kenton)
21 0.09
Kang 2004 CEMR-1966
250 SC 0.26 0.05 525 3 0a 0.16 0 1.8 7 0.23 14 0.07 21 0.01 28 0.01
Switzerland 2003 (Prelina)
35 < 0.01
Sole 2004 03-6036
250 SC 0.25 0.05 500 3 0a 0.20 0 3.4 7 1.4 14 0.19 21 0.03 28 0.02
Switzerland 2003 (Shelton)
35 0.01
Sole 2004 03-6037
250 SC 0.25 0.06 400 3 0a 0.17 0 1.6 7 0.35 14 0.10 21 0.09 29 0.05
France (North) 2002 (Fiesta)
35 0.04
Kang 2004 CEMR-1964
250 SC 0.25 0.06 400 3 0a 1.4 0 1.9 7 0.44 14 0.14 21 0.07
France (North) 2002 (Portura)
28 0.05 35 0.05
Kang 2004 CEMR-1965
250 SC 0.24 0.06 384 3 0a 0.28 0 2.9 7 0.35 14 0.13 21 0.07 28 0.05
Germany 2002 (Almera)
35 0.06
Kang 2004 CEMR-1970
250 SC 0.25 0.06 400 3 0a 0.39 0 1.9 7 0.55 14 0.64 21 0.19 28 0.15
Germany 2002 (Davinci)
35 0.11
Kang 2004 CEMR-1971
250 SC 0.26 0.06 420 3 0a 0.30 0 < 0.01 7 0.15 14 0.11 21 0.08 28 0.06
United Kingdom 2002 (Farinto)
35 0.05
Kang 2004 CEMR-1968

Azoxystrobin 75
Application LEEKS Country
Year (variety)
Form g ai/L, g ai/kg
kg ai/ha kg ai/hL Water, L/ha
No./ max
PHI days
Azoxystrobin residue, mg/kg
Author, Date
Study No.
250 SC 0.25 0.06 400 3 0a 2.7 0 4.5 7 0.96 14 0.34
21 0.19
28 0.07
United Kingdom 2002 (Goliath)
35 0.06
Kang 2004 CEMR-1969
a Before final application
Table 69 Azoxystrobin residues in dry onion bulb from supervised trials in the USA
Application BULB ONION, DRY
Country Year
(variety)
Form g ai/L, g ai/kg
kg ai/ha kg ai/hL
Water, L/ha
No./ max
PHI days
Azoxystrobin residue, mg/kg
Author, Date
Study No.
United States New York, 1998 (Agrow Crusader)
800 WG 0.28 0.17 168 6 0 0.43, 0.66
Bussey 1999 RR99-042B
United States Illinois, 1998 (Yellow Spanish)
800 WG 0.28 0.20 140 6 0 0.18, 0.21
Bussey 1999 RR99-042B
United States Texas, 1998 (Texas early white)
800 WG 0.28 0.27 103 6 0 0.38, 0.51
Bussey 1999 RR99-042B
United States Colorado, 1998 (Valent)
800 WG 0.28 0.20 140 6 0 0.31, 0.28
Bussey 1999 RR99-042B
United States California, 1998 (White sweet Spanish)
800 WG 0.28 0.20 140 6 0 < 0.01, < 0.01
Bussey 1999 RR99-042B
United States California, 1998 (Stockton Red)
800 WG 0.28 0.20 140 6 0 0.13, 0.15
Bussey 1999 RR99-042B
United States Oregon, 1998 (DPSX-1062)
800 WG 0.28 0.16 178 6 0 0.36, 0.20
Bussey 1999 RR99-042B
United States Washington 1998 (Candi)
800 WG 0.28 0.16 178 6 0 0.06, 0.07
Bussey 1999 RR99-042B

76 Azoxystrobin
Table 70 Azoxystrobin residues in spring onion from supervised trials in the USA
Application SPRING ONION Country
Year (variety)
Form g ai/L, g ai/kg
kg ai/ha kg ai/hL Water, L/ha
No./ max
PHI days
Azoxystrobin residue, mg/kg
Author, Date
Study No.
United States Texas, 1998 (Texas Grano 1015y)
800 WG
0.28 0.29 98 6 0 4.7, 6.3
Bussey 1999 RR98-074B
United States Arizona 1998 (Tokyo)
800 WG
0.28 0.17 168 11 0 3.1, 3.3
Bussey 1999 RR98-074B
United States California, 1998 (White Sweet Bunching)
800 WG
0.28 0.20 140 6 0 1.4, 1.4
Bussey 1999 RR98-074B
800 WG
0.28 0.17 168 6 0 1.1, 1.3
United States New York, 2001 (Stuttgartter)
250 SC 0.28 0.17 168 6 0 0.92, 1.1
Ediger 2002 493-01
800 WG
0.28 0.17 160 6 0 1.4, 1.3
United States Texas, 2001 (Rio Blanco Grande)
250 SC 0.28 0.17 160 6 0 1.6, 2.2
Ediger 2002 493-01
800 WG
0.28 0.19 150 6 0 2.6, 2.0
United States California, 2001 (White Lisbon)
250 SC 0.28 0.19 150 6 0 2.7, 1.2
Ediger 2002 493-01
800 WG
0.28 0.21 131 6 0 0.67, 0.49
United States Illinois, 2001 (Walla Sweet)
250 SC 0.28 0.21 131 6 0 0.23, 0.14
Ediger 2002 493-01
Table 71 Azoxystrobin residues in broccoli from supervised trials in Europe, Canada, and the USA
Application BROCCOLI Country
Year (variety)
Form g ai/L, g ai/kg
kg ai/ha kg ai/hL Water, L/ha
No./ max
PHI days
Azoxystrobin residue, mg/kg
Author, Date
Study No.
250 SC 0.25 0.05 495 2 0a < 0.01 0 3.0 3 1.2 7 0.25 10 0.10
Netherlands 2004 (Monaco)
14 0.04
Benazeraf 2005 04-0407
250 SC 0.25 0.05 498 2 0a 0.02 0 1.4 3 0.27 7 0.04 10 0.03
Netherlands 2004 (Monaco)
14 0.01
Benazeraf 2005 04-0407
Germany 2004 (Marathon)
250 SC 0.26 0.05 509 2 14 < 0.01 Elliott 2005 05-6000
Germany 2004
250 SC 0.25 0.08 320 2 14 < 0.01 Elliott 2005 05-6000

Azoxystrobin 77
Application BROCCOLI Country
Year (variety)
Form g ai/L, g ai/kg
kg ai/ha kg ai/hL Water, L/ha
No./ max
PHI days
Azoxystrobin residue, mg/kg
Author, Date
Study No.
250 SC 0.25 0.05 503 2 0a 2.2b 0 3.6b 3 3.2b 7 0.67 10 0.56
Spain 2005 (Maraton)
14 0.58
Benazeraf 2005 04-0604
250 SC 0.25 0.05 503 2 0a 4.4b 0 4.5b 3 3.6b 7 0.34 10 0.25
Spain 2005 (Monaco)
14 0.11
Benazeraf 2005 04-0604
250 SC 0.26 0.05 510 2 0a 0.02 0 0.42 3 0.25 7 0.09 10 0.06
Spain 2005 (Marathon)
14 0.04
Bour 2006 05-0302
250 SC 0.26 0.05 509 2 0a 0.01 0 0.66 3 0.32 7 0.11 10 0.06
Spain 2005 (Chevalier)
14 0.04
Bour 2006 05-0302
Canada, ON 1999
800 WG 0.28 0.07 402 6 0 3 7
0.55, 0.93 0.21, 0.29 0.07, 0.09
Starner 2002 07096
Canada, BC 1999
800 WG 0.28 0.05 515 6 0 1.1, 1.5
Starner 2002 07096
800 WG 0.28 0.04 673 6 0 2.3, 1.9 4 0.27, 0.20
United States California 1999 (Patriot)
6 0.09, 0.08
Starner 2002 07096
United States California 1999 (Green Belt)
800 WG 0.28 0.09 309 6 0 0.25, 0.13
Starner 2002 07096
a Before final application bResidues in whole plant (otherwise in broccoli heads).
Table 72. Azoxystrobin residues in Brussels sprouts from supervised trials in Europe
Application BRUSSELS SPROUTS
Country Year
(variety)
Form g ai/L, g ai/kg
kg ai/ha kg ai/hL Water, L/ha
No./ max
PHI days
Azoxystrobin residue, mg/kg
Author, Date
Study No.
250 SC 0.25 0.06 400 4 0a 0.03 0 0.08 3 0.06 7 0.09 14 0.03 21 0.04
250 SC 0.25 0.06 400 2 0a 0.02 0 0.08 3 0.04
France 2001 (Cyrus)
7 0.02
Unsworth 2002 1983/030-D2149

78 Azoxystrobin
Application BRUSSELS SPROUTS
Country Year
(variety)
Form g ai/L, g ai/kg
kg ai/ha kg ai/hL Water, L/ha
No./ max
PHI days
Azoxystrobin residue, mg/kg
Author, Date
Study No.
14 0.03 21 0.02
250 SC 0.25 0.06 400 4 0a 0.23 0 0.40 3 0.33 7 0.27 14
21 0.18 0.12
250 SC 0.25 0.06 400 2 0a 0.03 0 0.17 3 0.19 7 0.13 14 0.16
France 2001 (Oliver)
21 0.03
Unsworth 2002 1983/030-D2149
250 SC 0.26 0.05 510 2 0a 0.02 0 0.08 3 0.14 7 0.11 14 0.06 21 0.04
250 SC 0.26 0.05 510 4 0a 0.08 0 0.17 3 0.16 7 0.15 14 0.14
Spain 2002 (Oliver)
21 0.06
McGill 2003 02-6101
250 SC 0.26 0.05 514 2 0a 0.02 0 0.18, 0.16 3 0.05 7 0.09, 0.10 14 0.05 21 0.04
250 SC 0.26 0.05 510 4 0a 0.02 0 0.16, 0.15 3 0.09 7 0.12, 0.14 14 0.05
Spain 2002 (Oliver)
21 0.05
McGill 2003 02-6102
250 SC 0.26 0.05 510 4 0a 0.10 0 0.25 3 0.15 7 0.07 10 0.04 14 0.04 21 0.05
250 SC 0.25 0.05 503 2 0a 0.08 0 0.19 3 0.08 7 0.06 10 0.05 14 0.04
Germany 2001 (Icarus)
21 0.02
Unsworth 2002 1983/031-D2149

Azoxystrobin 79
Application BRUSSELS SPROUTS
Country Year
(variety)
Form g ai/L, g ai/kg
kg ai/ha kg ai/hL Water, L/ha
No./ max
PHI days
Azoxystrobin residue, mg/kg
Author, Date
Study No.
250 SC 0.29 0.05 570 4 0a 0.05 0 0.19 3 0.14 7 0.02 10 0.02 14 0.03 21 0.01
250 SC 0.28 0.05 557 2 0a 0.03 0 0.11 3 0.07 7 0.02 10 0.02 14 0.02
Germany 2001 (Icarus)
21 < 0.01
Unsworth 2002 1983/031-D2149
250 SC 0.26 0.05 515 4 0a 0.05 0 0.62 3 0.23 6 0.21 10 0.10 13 0.18 20 0.04
250 SC 0.27 0.05 534 2 0a 0.04 0 0.62 3 0.23 6 0.22 10 0.10 13 0.04
Germany 2001 (Icarus)
20 0.02
Unsworth 2002 1983/031-D2149
250 SC 0.25 0.05 525 4 0a 0.04 0 0.22 3 0.09 7 0.08 11 0.05 14 0.05 20 0.04
250 SC 0.25 0.05 524 2 0a 0.03 0 0.20 3 0.08 7 0.06 11 0.04 14 0.04
Austria 2001 (Oliver)
20 0.03
Mills 2002 1983/032-D2149
250 SC 0.25 0.06 400 4 0a 0.05 0 0.10 3 0.05 7 0.06 14 0.04 21 0.02
250 SC 0.25 0.06 400 2 0a 0.02 0 0.09 3 0.04 7 0.02 14 0.02
United Kingdom 2002 (Hellemus)
20 0.01
Unsworth 2002 1983/033-D2149

80 Azoxystrobin
Application BRUSSELS SPROUTS
Country Year
(variety)
Form g ai/L, g ai/kg
kg ai/ha kg ai/hL Water, L/ha
No./ max
PHI days
Azoxystrobin residue, mg/kg
Author, Date
Study No.
250 SC 0.25 0.06 400 2 0a 0.02 0 0.12 3 0.04 7 0.02 14 0.02 21 0.01
250 SC 0.25 0.06 400 4 0a 0.02 0 0.27 3 0.03 7 0.03 14 0.04
United Kingdom 2002 (Hellemus)
21 0.02
Unsworth 2002 1983/033-D2149
250 SC 0.25 0.05 492 2 0a 0.05 0 0.14 2 0.09 7 0.07 15 0.03 21 0.03
250 SC 0.25 0.05 490 4 0a 0.01 0 0.14 2 0.17 7 0.16 15 0.08
Netherlands 2002 (Abacus)
21 0.06
Kang 2003 CEMR-1962
250 SC 0.24 0.05 483 2 0 0.16 3 0.09 7 0.11 14 0.05 20 0.02
250 SC 0.24 0.05 472 4 0 0.15 3 0.10 7 0.14 14 0.06
Netherlands 2002 (Maximus)
20 0.04
Kang 2003 CEMR-1963
a Before final application
Table 73 Azoxystrobin residues in cabbage from supervised trials in Europe, Canada, and the USA
Application CABBAGE Country
Year (variety)
Form g ai/L, g ai/kg
kg ai/ha kg ai/hL Water, L/ha
No./ max
PHI days
Azoxystrobin residue, mg/kg
Author, Date
Study No.
250 SC 0.25 513 4 0a 0.07 0 1.3 7 0.14 10 0.22 14 0.05 20 0.04
250 SC 0.25 595 2 0a 0.02 0 0.89 7 0.13 10 0.06 14 0.07
Spain 2000 (Savoy King)
20 0.02
McGill 2001 RJ3179B

Azoxystrobin 81
Application CABBAGE Country
Year (variety)
Form g ai/L, g ai/kg
kg ai/ha kg ai/hL Water, L/ha
No./ max
PHI days
Azoxystrobin residue, mg/kg
Author, Date
Study No.
250 SC 0.25 470 4 0a < 0.01 0 0.31 7 0.01 10 < 0.01 14 < 0.01 21 < 0.01
250 SC 0.25 545 2 0a < 0.01 0 0.27 7 0.01 10 < 0.01 14 0.01
Spain 2000 (Retosa)
21 < 0.01
McGill 2001 RJ3179B
250 SC 0.25 405 4 0a < 0.01 0 0.02 7 < 0.01 10 0.03 14 < 0.01
Italy 2001 (ELX 60 91)
21 < 0.01
Unsworth 2002 1983/034-D2149
250 SC 0.25 413 2 0a < 0.01 0 0.03 7 < 0.01 10 < 0.01 14 < 0.01
21 < 0.01
250 SC 0.25 403 4 0a 0.02 0 0.17 7 0.13 10 0.07 14 0.17 21 0.18
250 SC 0.25 407 2 0a < 0.01 0 0.15 7 0.10 10 0.08 14 0.05
Italy 2001 (Rigoletto)
21 0.03
Unsworth 2002 1983/034-D2149
250 SC 0.25 255 4 0 0.05 6 0.02 10 < 0.01 15 < 0.01 22 < 0.01
250 SC 0.25 250 2 0 0.03 6 0.02 10 < 0.01 15 < 0.01
Netherlands 2000 (Eton)
22 < 0.01
McGill 2001 RJ3180B
250 SC 0.25 257 4 0 0.02 6 < 0.01 10 < 0.01 15 < 0.01 22 < 0.01
250 SC 0.25 253 2 0 0.01 6 < 0.01 10 < 0.01 15 < 0.01
Netherlands 2000 (Lennox)
22 < 0.01
McGill 2001 RJ3180B

82 Azoxystrobin
Application CABBAGE Country
Year (variety)
Form g ai/L, g ai/kg
kg ai/ha kg ai/hL Water, L/ha
No./ max
PHI days
Azoxystrobin residue, mg/kg
Author, Date
Study No.
250 SC 0.25 600 4 0 0.12 6 0.09 11 < 0.01 14 0.01 22 < 0.01
250 SC 0.25 600 2 0 0.12 6 0.06 11 < 0.01 14 < 0.01
Germany 2000 (Alaska)
22 < 0.01
Richards 2001 RJ3191B
250 SC 0.25 600 4 0 0.03 6 0.02 9 < 0.01 13 < 0.01 22 < 0.01
250 SC 0.25 600 2 0 0.05 6 < 0.01 9 0.01 13 < 0.01
Germany 2000 (Subaro)
22 < 0.01
Richards 2001 RJ3191B
250 SC 0.25 590 4 0a 0.01 0 0.10 3 0.01 7 0.01 10 < 0.01 14 < 0.01 21 < 0.01
250 SC 0.25 590 2 0a 0.02 0 0.11 3 0.01 7 < 0.01 10 0.01 14 < 0.01
Germany 2001 (Castello)
21 < 0.01
Unsworth 2002 1983/035-D2149
250 SC 0.25 510 4 0a < 0.01 0 0.03 3 0.04 7 < 0.01 10 < 0.01 14 < 0.01 21 < 0.01
250 SC 0.25 510 2 0a < 0.01 0 0.06 3 0.04 7 < 0.01 10 < 0.01 14 < 0.01
Germany 2001 (Castello)
21 < 0.01
Unsworth 2002 1983/035-D2149

Azoxystrobin 83
Application CABBAGE Country
Year (variety)
Form g ai/L, g ai/kg
kg ai/ha kg ai/hL Water, L/ha
No./ max
PHI days
Azoxystrobin residue, mg/kg
Author, Date
Study No.
250 SC 0.25 529 4 0a 0.02 0 0.13 3 0.07 7 0.02 10
14 0.02
< 0.01 21 < 0.01
250 SC 0.25 505 2 0a < 0.01 0 0.08 3 0.04 7 0.03 10 0.02 14 < 0.01
Germany 2001 (Castello
21 < 0.01
Unsworth 2002 1983/035-D2149
250 SC 0.25 515 4 0a 0.03 0 0.54 3 0.19 6 0.11 9 0.10 14 0.08 22 0.09
250 SC 0.25 504 2 0a 0.03 0 0.24 3 0.09 6 0.08 9 0.09 14 0.06
Austria 2001 (Colmar)
22 0.02
Mills, 2002 1983/036-D2149
Canada, ON 1999
800 WG 0.28 402 6 0 1.8 (w/ wrapper
leaves) 0.18
(w/out wrapper leaves)
Starner 2002 07095
Canada, NS 1999
800 WG 0.28 608 6 0 2.0 (w/ wrapper
leaves) 0.17
(w/out wrapper leaves)
Starner 2002 07095
800 WG 0.28 290 6 0 0.90 (w/ wrapper
leaves)
United States Florida, 1999 (Super Red 80 F1) 0 0.10
(w/out wrapper leaves)
Starner 2002 07095
800 WG 0.28 310 6 0 0.32 (w/wrapper
leaves)
United States Wisconsin, 1999 (Grandslam) 0 0.03
(w/out wrapper leaves)
Starner 2002 07095
a Before final application

84 Azoxystrobin
Table 74 Azoxystrobin residues in cauliflower from supervised trials in Europe
Application CAULIFLOWER Country Year (variety)
Form g ai/L, g ai/kg
kg ai/ha
kg ai/hL
Water, L/ha
No./ max
PHI days
Azoxystrobin residue, mg/kg
Author, Date Study No.
250 0.25 0.05 433 4 0a < 0.01 SC 0 0.07
7 0.01 10 < 0.01 15 < 0.01 21 < 0.01
250 0.24 0.05 485 2 0a < 0.01 SC 0 0.05
7 < 0.01 10 < 0.01 15 < 0.01
Spain 2000 (Fremon)
21 < 0.01
McGill 2001 RJ3178B
250 0.24 0.05 460 4 0a 0.01 SC 0 0.56
6 0.15 9 0.31 13 0.44 19 0.20
250 0.24 0.05 533 2 0a 0.02 SC 0 0.49
6 0.29 9 0.15 13 0.23
Spain 2000 (Cabrera)
19 0.08
McGill 2001 RJ3178B
250 0.25 0.06 450 4 0a < 0.01 SC 0 0.05
7 < 0.01 10 < 0.01 14 < 0.01 21 < 0.01
250 0.25 0.05 550 2 0a < 0.01 SC 0 0.02
7 < 0.01 10 < 0.01 14 < 0.01
Spain 2001 (Nautilus)
21 < 0.01
Mills 2002 1983/038-D2149
250 0.25 0.06 450 4 0a < 0.01 SC 0 0.44
7 0.07 10 0.03 14 0.01 21 0.02
250 0.25 0.05 500 2 0a < 0.01 SC 0 0.42
7 0.06 10 0.04 14 0.03
Spain 2001 (Fremont)
21 < 0.01
Mills 2002 1983/038-D2149
250 0.25 0.04 600 4 0 0.65 SC 6 0.20
9 0.04 13 0.02 20 < 0.01
250 0.25 0.04 600 2 0 0.43 SC 6 0.10
9 0.03
Germany 2000 (Fremont F1)
13 0.01
Richards 2001 RJ3192B

Azoxystrobin 85
Application CAULIFLOWER Country Year (variety)
Form g ai/L, g ai/kg
kg ai/ha
kg ai/hL
Water, L/ha
No./ max
PHI days
Azoxystrobin residue, mg/kg
Author, Date Study No.
20 0.02 250 0.25 0.04 600 4 0 0.18 SC 8 < 0.01
11 < 0.01 13 < 0.01 21 < 0.01
250 0.25 0.04 600 2 0 0.20 SC 8 0.02
11 < 0.01 13 < 0.01
Germany 2000 (Fremont)
21 0.01
Richards 2001 RJ3192B
250 0.27 0.06 437 4 0a < 0.01 SC 0 < 0.01
7 < 0.01 10 < 0.01 13 < 0.01 21 < 0.01
250 0.26 0.06 420 2 0a < 0.01 SC 0 0.02
7 < 0.01 10 < 0.01 13 < 0.01
United Kingdom 2001 (Sebini)
21 < 0.01
Mills 2002 1983/037-D2149
250 0.29 0.05 590 4 0a < 0.01 SC 0 0.18
3 0.28 7 0.07 10 0.06 14 0.05 21 0.01
250 0.29 0.05 587 2 0a < 0.01 SC 0 0.20
3 0.17 7 0.07 10 0.07 14 0.02
Germany 2001 (Fremont)
21 < 0.01
Unsworth 2002 1983/039-D2149
250 0.25 0.05 502 4 0a 0.01 SC 0 0.57
3 0.27 7 0.15 10 0.17 14 0.05 21 0.05
250 0.25 0.05 493 2 0a 0.04 SC 0 0.67
3 0.21 7 0.13 10 0.11 14 0.05
Germany 2001 (Fremont)
21 0.05
Unsworth 2002 1983/039-D2149
250 0.25 0.05 500 4 0a 0.23 SC 0 0.84
3 0.30 7 0.36 10 0.42 14 0.15
Germany 2001 (Fremont)
21 0.11
Unsworth 2002 1983/039-D2149

86 Azoxystrobin
Application CAULIFLOWER Country Year (variety)
Form g ai/L, g ai/kg
kg ai/ha
kg ai/hL
Water, L/ha
No./ max
PHI days
Azoxystrobin residue, mg/kg
Author, Date Study No.
250 0.25 0.05 507 2 0a 0.29 SC 0 0.65
3 0.31 7 0.26 10 0.26 14 0.13
21 0.14
250 0.26 0.05 520 4 0a 0.06 SC 0 0.94
3 0.69 7 0.48 10 0.34 14 0.27 21 0.04
250 0.26 0.05 517 2 0a 0.01 SC 0 0.91
3 0.54 7 0.46 10 0.46 14 0.14
Germany 2001 (Fremont)
21 0.08
Unsworth 2002 1983/039-D2149
250 0.25 0.05 505 4 0a < 0.01 SC 0 0.14
3 0.04 7 0.03 10 0.04 14 0.02 21 0.02
250 0.25 0.05 505 2 0a < 0.01 SC 0 0.05
3 0.16 7 0.03 10 0.03 14 0.03
Austria 2001 (Whitney F1)
21 0.02
Mills 2002 1983/040-D2149
a Before final application
Table 75 Azoxystrobin residues in kohlrabi from supervised trials in Germany
Application KOHLRABI Country Year (variety)
Form g ai/L, g ai/kg
kg ai/ha kg ai/hL
Water, L/ha
No./ max
PHI days
Azoxystrobin residue, mg/kg
Author, Date Study No.
250 SC 0.25 0.04 600 2 0 0.16 7 0.10 14 0.06
Germany 1999 (Avanti)
21 0.04
Dissemond 2001 GLP 99/021
250 SC 0.25 0.04 600 2 0 0.35 7 0.10 14 0.05
Germany 1999 (Avanti)
21 0.03
Dissemond 2001 GLP 99/020
250 SC 0.27 0.04 610 2 0 3.8 7 0.02 14 < 0.02 21 < 0.02
Germany 2001 (Latin)
28 < 0.02
Fuchsbichler 2002 HVA 13/02
Germany 250 SC 0.25 0.06 400 2 0 0.33 Fuchsbichler

Azoxystrobin 87
7 0.06 14 0.03 21 < 0.02
28 < 0.02
250 SC 0.25 0.04 600 2 14 0.04 21 < 0.02
Germany 2001 (Cindy) 28 < 0.02
Fuchsbichler 2002 HVA 13/02
250 SC 0.25 0.04 600 2 14 0.09 21 0.02
Germany 2001 (Cindy) 28 < 0.02
Fuchsbichler 2002 HVA 13/02
Table 76 Azoxystrobin residues in cucumber from supervised trials indoors (glasshouse) in Europe and outdoors in Europe and the USA
Application CUCUMBER Country
Year (variety)
Form g ai/L, g ai/kg
kg ai/ha kg ai/hL
Water, L/ha
No./ max
PHI days
Azoxystrobin residue, mg/kg
Author, Date
Study No.
Indoor trials (glasshouse)
250 SC 0.020 4 0 0.18 1 0.23 3 0.13
Germany 1996 (Danora)
7 0.08
Burke 1997 RJ2211B
250 SC 0.020 4 0 0.22 1 0.19 3 0.13
Germany 1995 (Banza 90% and Cordoba 10%) 7 0.06
Ryan 1996 RJ2139B
250 SC 0.020 8 3 0.44 United Kingdom, 1995 (Corona)
7 0.75 Sapiets 1996 RJ2169B
250 SC 0.020 6 3 0.49 United Kingdom,1995 (Suprami F1)
7 0.28 Burke 1997 RJ2223B
250 SC 0.020 6 3 0.20 Greece 1996 (Arabio 7 0.06
Clarke 1997 RJ2251B
250 SC 0.020 6 3 0.03 France, South 1996 (Mosaica)
7 0.02 Farrelly 1997 RJ2266B
Outdoor trials
250 SC 0.020 8 0 0.11 1 0.07 3 0.07 6 0.04
France, North 1995 (Aramon)
10 0.02
Sapiets 1996 RJ2118B
250 SC 0.020 8 0 0.13 1 0.12 3 0.12 7 0.04
France, North 1995 (Tyhria)
10 0.02
Sapiets 1996 RJ2118B
250 SC 0.020 7 0 0.11 1 0.07 3 0.04 7 0.02
France South 1995 (Mosaica)
9 0.01
Sapiets 1996 RJ2118B
250 SC 0.020 6 3 0.02 Italy 1996 (Jazzer)
7 0.01 Clarke 1997 RJ2345B
250 SC 0.020 6 3 0.06 Spain 1996 (Bellando)
7 0.02 Sapiets 1997 RJ2274B
800 WG 0.28 6 0 0.31, 0.26, 0.40 United States Florid 1 0.40, 0.19, 0.25
Bussey 1998

88 Azoxystrobin
Application CUCUMBER Country
Year (variety)
Form g ai/L, g ai/kg
kg ai/ha kg ai/hL
Water, L/ha
No./ max
PHI days
Azoxystrobin residue, mg/kg
Author, Date
Study No.
250 SC 0.28 6 0 0.38, 0.26, 0.44 1997 (Dukes) 1 0.38, 0.25, 0.35
RR98-045B
800 WG 0.28 6 0 0.23, 0.30, 0.35 1 0.31, 0.29, 0.35
250 SC 0.28 6 0 0.47, 0.35, 0.30
United States North Carolina 1997 (Asgrow) 1 0.30, 0.30, 0.35
Bussey 1998 RR98-045B
United States North Carolina 1996 (National Pickle)
800 WG 0.28 6 1 0.06, 0.09
Roper, et al. 1997 RR96-096B
United States North Carolina 1996 (Royal)
800 WG 0.28 6 1 0.06, 0.06
Roper, et al. 1997 RR96-096B
United States Florida, 1996 (Poinsett 76)
800 WG 0.28 6 1 0.04, 0.05
Roper, et al. 1997 RR96-096B
United States Illinois, 1996 (Dasher II)
800 WG 0.28 6 1 0.04, 0.04 Roper, et al. 1997 RR96-096B
United States Michigan, 1996 (Marketmore 76)
800 WG 0.28 6 1 0.06, 0.11
Roper, et al. 1997 RR96-096B
United States Texas, 1996 (Revenue)
800 WG 0.28 6 1 0.07 Roper, et al. 1997 RR96-096B
United States California, 1996 (Armenia)
800 WG 0.28 6 1 0.03, 0.06 Roper, et al. 1997 RR96-096B
Table 77 Azoxystrobin residues in gherkin from supervised trials in Germany
Application GHERKIN Country
Year (variety)
Form g ai/L, g ai/kg
kg ai/ha kg ai/hL Water, L/ha
No./ max
PHI days
Azoxystrobin residue, mg/kg
Author, Date
Study No.
Germany 1997 (Othello)
250 SC 0.25 600 4 3 0.04 Gill 1998 RJ2589B
Germany 1997 (Duet)
250 SC 0.25 600 4 3 0.05 Gill 1998 RJ2589B
Germany 1999 (Melodie)
250 SC 0.25 600 6 0 3
0.17 0.06
Gill 2000 RJ2950B
Germany 1999 (Melodie)
250 SC 0.25 600 6 0 3
0.41 0.15
Gill 2000 RJ2950B
Table 78 Azoxystrobin residues in melons from supervised trials indoors (glasshouse) in Europe and outdoors in Europe and the USA
Application MELONS Country
Year (variety)
Form g ai/L, g ai/kg
kg ai/ha
kg ai/hL
Water, L/ha
No./ max
PHI days
Azoxystrobin residue, mg/kg
Author, Date
Study No.
Indoor trials (glasshouse, poly-tunnel)
Italy 250 SC 0.020 1000 7 3 0.05 Clarke

Azoxystrobin 89
Application MELONS Country
Year (variety)
Form g ai/L, g ai/kg
kg ai/ha
kg ai/hL
Water, L/ha
No./ max
PHI days
Azoxystrobin residue, mg/kg
Author, Date
Study No.
1996 (Harper)
7 0.08 1997 RJ2246B
250 SC 0.020 1150 6 3 0.12 Greece 1996 (Brida)
8 0.18 Clarke 1997 RJ2247B
250 SC 0.020 6 3 0.15 Spain 1996 (Cantaloup)
7 0.16 Sapiets 1997 RJ2336B
250 SC 0.020 5 3 0.17 Spain 1996 (Cantaloup)
7 0.17 Sapiets 1997 RJ2336B
Spain 1995 (Daimiel)
250 SC 0.020 1006 8 3
7
0.03 (whole fruit) 0.01 (pulp) 0.14 (skin)
0.03 (whole fruit) 0.01 (pulp) 0.16 (skin)
Clarke and Gallardo 1996 RJ2064B
Spain 1995 (Braco)
250 SC 0.020 1123 8 3
7
0.29 (whole fruit) 0.06 (pulp) 1.7 (skin)
0.22 (whole fruit) 0.05 (pulp) 1.3 (skin)
Clarke and Gallardo 1996 RJ2136B
250 SC 0.020 6 3 0.38, 0.42 (0.40)
Netherlands 1996 (Haon) 7 0.33, 0.30
(0.32)
Clarke 1997 RJ2253B
250 SC 0.020 7 0 0.03 3 0.03 7 0.03
France, North 1996 (Bufalo)
10 0.02
Clarke 1997 RJ2305B
Outdoor trials
250 SC 0.020 8 3 0.38 (whole fruit) 0.05 (pulp) 1.8 (skin)
Greece 1995 (Birida)
7 0.24 (whole fruit) 0.02 (pulp) 1.3 (skin)
Clarke 1996 RJ2093B
250 SC 0.020 800–825 8 3 0.04 (whole fruit) < 0.01 (pulp) 0.20 (skin)
Italy 1995 (Mambo)
6 0.03 (whole fruit) < 0.01 (pulp) 0.14 (skin)
Clarke 1996 RJ2190B
250 SC 0.020 6 0 0.05 3 0.04
Spain 1996 (Sancho) 7 0.03
Clarke 1997 RJ2238B
250 SC 0.020 1000 6 3 0.06 Italy 1996 (Templar)
7 0.03 Clarke 1997 RJ2246B
250 SC 0.020 800 6 3 0.04 Italy 1996 (Soleado)
6 0.07 Clarke 1997 RJ2246B
Spain 1996 (Braco)
250 SC 0.020 6 3 7
0.04 0.08
Farrelly 1997 RJ2269B
250 SC 0.020 6 0 0.05 3 0.03 7 0.04
France, South 1996 (Diego)
10 0.02
Clarke 1997 RJ2305B
France, North 250 SC 0.020 7 0 0.02 Clarke

90 Azoxystrobin
Application MELONS Country
Year (variety)
Form g ai/L, g ai/kg
kg ai/ha
kg ai/hL
Water, L/ha
No./ max
PHI days
Azoxystrobin residue, mg/kg
Author, Date
Study No.
3 0.01 7 0.01
1996 (Bufalo)
10 0.01
1997 RJ2305B
France, South 1995 (Awrel)
250 SC 0.20 800 8 0
1
3
7
10
0.10 (whole fruit) 0.02 (pulp) 0.46 (skin)
0.10 (whole fruit) 0.03 (pulp) 0.42 (skin)
0.09 (whole fruit) 0.02 (pulp) 0.44 (skin)
0.05 (whole fruit) 0.01 (pulp) 0.22 (skin)
0.04 (whole fruit) 0.01 (pulp) 0.18 (skin)
Clarke and Compagnon 1996 RJ2143B
France, South 1995 (Awrel)
250 SC 0.20 300 8 0
1
3
7
11
0.05 (whole fruit) 0.01 (pulp) 0.23 (skin)
0.07 (whole fruit) 0.02 (pulp) 0.33 (skin)
0.06 (whole fruit) 0.01 (pulp) 0.27 (skin)
0.05 (whole fruit) < 0.01 (pulp) 0.35 (skin)
0.02 (whole fruit) 0.01 (pulp) 0.09 (skin)
Clarke and Compagnon 1996 RJ2143B
United States North Carolina, 1996 (Hale’s Best)
800 WG 0.28 6 1 0.16, 0.17
Roper, et.al. 1997 RR96-096B
United States Illinois, 1996 (Saticoy Hybrid)
800 WG 0.28 6 1 0.16, 0.12
Roper, et.al. 1997 RR96-096B
United States Texas, 1996 (Gold Rush)
800 WG 0.28 6 1 0.09, 0.10
Roper, et.al. 1997 RR96-096B
United States California, 1996 (Heart of Gold)
800 WG 0.28 6 1 0.20, 0.17
Roper, et.al. 1997 RR96-096B
United States California, 1996 (Top Mark)
800 WG 0.28 6 1 0.23, 0.26
Roper, et.al. 1997 RR96-096B
United States Arizona, 1996 Top Mark Cromset)
800 WG 0.28 6 1 0.10, 0.10
Roper, et.al. 1997 RR96-096B
0.28 6 0 0.15, 0.15, 0.12 800 WG 1 0.14, 0.16, 0.14
250 SC 0.28 6 0 0.14, 0.17, 0.15
United States Texas, 1997 (Honeybrew)
1 0.17, 0.12, 0.12
Bussey 1998 RR98-045B

Azoxystrobin 91
Table 79 Azoxystrobin residues in summer squash from supervised trials in the USA
Application SUMMER SQUASH Country
Year (variety)
Form g ai/L, g ai/kg
kg ai/ha kg ai/hL
Water, L/ha
No./ max
PHI days
Azoxystrobin residue, mg/kg
Author, Date
Study No.
United States New York 1996 (Zucchini Elite)
800 WG 0.28 6 1 0.09, 0.07 Roper, et al. 1997 RR96-096B
United States North Carolina 1996 (Crookneck)
800 WG 0.28 6 1 0.16, 0.04
Roper, et al. 1997 RR96-096B
United States Florida, 1996 (Crookneck)
800 WG 0.28 6 1 0.03, 0.07
Roper, et al. 1997 RR96-096B
United States Illinois, 1996 (Seneca Hybrid)
800 WG 0.28 6 1 0.03, 0.06
Roper, et al. 1997 RR96-096B
United States California, 1996 (Ambassador)
800 WG 0.28 6 1 0.11, 0.11 Roper, et al. 1997 RR96-096B
Table 80 Azoxystrobin residues in sweet pepper from supervised trials in Europe
Application PEPPER Country
Year (variety)
Form g ai/L, g ai/kg
kg ai/ha kg ai/hL
Water L/ha
No./ max
PHI days
Azoxystrobin residue, mg/kg
Author, Date
Study No.
Outdoor trials
250 SC 0.025 6 3 0.85 Spain 1996 (Piquillo)
7 0.59
Farrelly 1997 RJ2280B
Spain 1998 (Italiano)
250 SC 0.025 6 0 1 3 7
10
0.25 0.14 0.15 0.13 0.17
Gill 1999 RJ2755B
250 SC 0.025 6 0 1.0 1 0.74 3 0.51 7 0.61
Spain 1998 (Piquillo)
10 0.55
Gill 1999 RJ2755B
250 SC 0.025 6 3 0.45 France, South 1998 (Lamuyo)
7 0.30 Gill 1999 RJ2773B
250 SC 0.025 6 3 0.13 France, South 1998 (Ludo)
6 0.18 Gill 1999 RJ2773B
250 SC 0.025 6 3 0.04 7 0.02
Italy 1997 (Lipari) 10 0.03
Clarke 1998 RJ2662B
250 SC 0.025 6 0 0.45 3 0.44 7 0.42
Spain 1998 (Italiano)
11 0.19
Lister 1999 RJ2742B
Indoor trials
250 SC 0.025 6 3 0.35 7 0.23
Italy 1997 (Pathos) Poly-tunnel
10 0.35
Clarke 1998 RJ2662B

92 Azoxystrobin
Application PEPPER Country
Year (variety)
Form g ai/L, g ai/kg
kg ai/ha kg ai/hL
Water L/ha
No./ max
PHI days
Azoxystrobin residue, mg/kg
Author, Date
Study No.
Italy 1997 (Argo) Poly-tunnel
250 SC 0.025 6 3 6
10
0.33 0.35 0.18
Clarke 1998 RJ2662B
250 SC 0.025 6 0 1.6 3 1.4 7 1.3
Netherlands 1998 (Spirit) Greenhouse 10 1.0
Lister 1999 RJ2746B
250 SC 0.025 6 0 0.21 1 0.28 3 0.27 7 0.22
France, North 1997 (Cadette) Greenhouse
10 0.14
Clarke 1998 RJ2562B
250 SC 0.025 6 0 0.59 1 0.77 3 0.62 7 0.27
France, North 1997 (Vidi) Greenhouse
9 0.25
Clarke 1998 RJ2562B
250 SC 0.25 6 0 0.27 1 0.19 3 0.25 7 0.21
France, North 1997 (Cadette) Greenhouse
10 0.21
Clarke 1998 RJ2562B
250 SC 0.25 6 0 0.79 1 0.64 3 0.58 7 0.30
France, North 1997 (Vidi) Greenhouse
9 0.16
Clarke 1998 RJ2562B
Table 81 Azoxystrobin residues in tomato from supervised trials in Europe
Application TOMATO Country
Year (variety)
Form g ai/L, g ai/kg
kg ai/ha kg ai/hL
Water, L/ha
No./ max
PHI days
Azoxystrobin residue, mg/kg
Author, Date
Study No.
Outdoor trials
250 SC 0.025 6 0 0.19 1 0.11 3 0.08 7 0.07
France, South 1996 (Cannery Row)
10 0.06
Sapiets, et
al.
1997 RJ2294B
250 SC 0.20 0.025 800 6 3 0.19 Italy 1996 (Ideal)
7 0.08 Sapiets 1997 RJ2375
250 SC 0.025 6 3 0.15 7 0.15
Italy 1997 (Ideal peel) 10 0.14
Clarke 1998 RJ2488B
250 SC 0.025 6 3 0.16 7 0.09
Italy 1997 (Snob) 10 0.06
Clarke 1998 RJ2488B
250 SC 0.025 6 3 0.41, 0.15 Spain 1996 (Figaro)
7 0.28, 0.26 Clarke 1997 RJ2345B
250 SC 0.25 6 0 0.28 3 0.32 7 0.40
Spain 1997 (Rio Fuego)
10 0.33
Clarke, 1998 RJ2490B
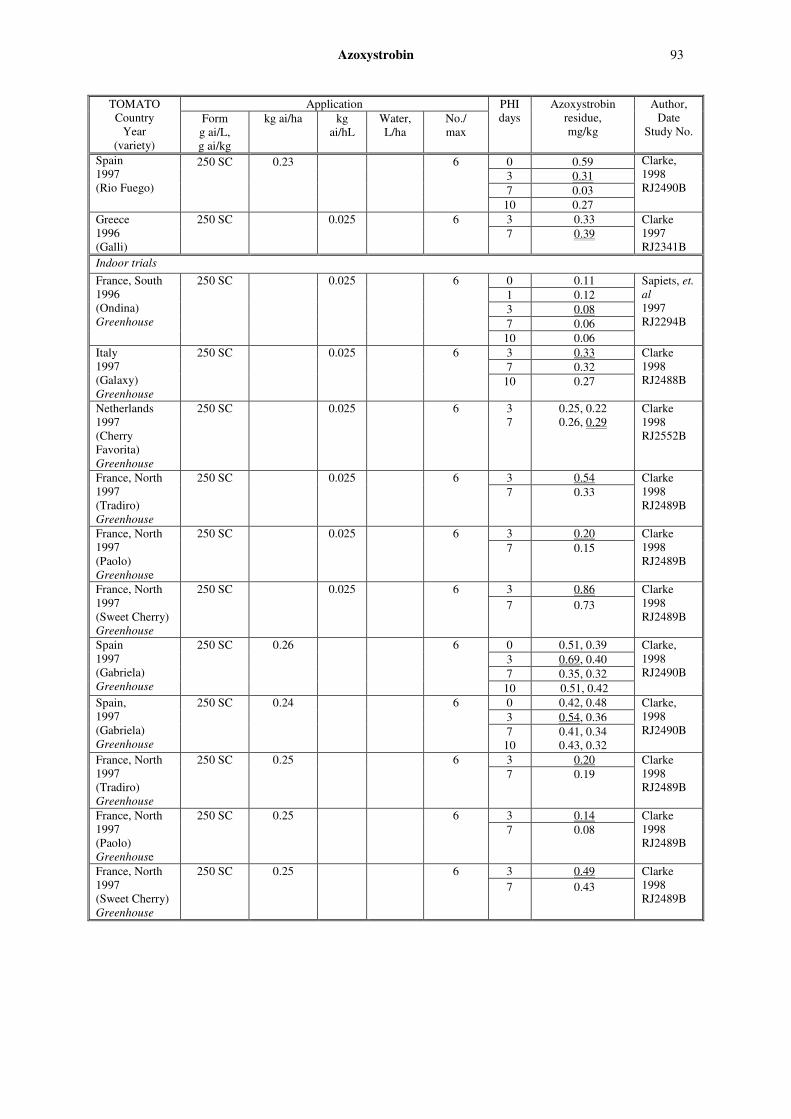
Azoxystrobin 93
Application TOMATO Country
Year (variety)
Form g ai/L, g ai/kg
kg ai/ha kg ai/hL
Water, L/ha
No./ max
PHI days
Azoxystrobin residue, mg/kg
Author, Date
Study No.
250 SC 0.23 6 0 0.59 3 0.31 7 0.03
Spain 1997 (Rio Fuego)
10 0.27
Clarke, 1998 RJ2490B
250 SC 0.025 6 3 0.33 Greece 1996 (Galli)
7 0.39 Clarke 1997 RJ2341B
Indoor trials
250 SC 0.025 6 0 0.11 1 0.12 3 0.08 7 0.06
France, South 1996 (Ondina) Greenhouse
10 0.06
Sapiets, et.
al
1997 RJ2294B
250 SC 0.025 6 3 0.33 7 0.32
Italy 1997 (Galaxy) Greenhouse
10 0.27
Clarke 1998 RJ2488B
250 SC 0.025 6 Netherlands 1997 (Cherry Favorita) Greenhouse
3 7
0.25, 0.22 0.26, 0.29
Clarke 1998 RJ2552B
250 SC 0.025 6 3 0.54 France, North 1997 (Tradiro) Greenhouse
7 0.33 Clarke 1998 RJ2489B
250 SC 0.025 6 3 0.20 France, North 1997 (Paolo) Greenhouse
7 0.15 Clarke 1998 RJ2489B
250 SC 0.025 6 3 0.86 France, North 1997 (Sweet Cherry) Greenhouse
7 0.73 Clarke 1998 RJ2489B
250 SC 0.26 6 0 0.51, 0.39 3 0.69, 0.40 7 0.35, 0.32
Spain 1997 (Gabriela) Greenhouse 10 0.51, 0.42
Clarke, 1998 RJ2490B
250 SC 0.24 6 0 0.42, 0.48 3 0.54, 0.36
Spain, 1997 (Gabriela) Greenhouse
7 10
0.41, 0.34 0.43, 0.32
Clarke, 1998 RJ2490B
250 SC 0.25 6 3 0.20 France, North 1997 (Tradiro) Greenhouse
7 0.19 Clarke 1998 RJ2489B
250 SC 0.25 6 3 0.14 France, North 1997 (Paolo) Greenhouse
7 0.08 Clarke 1998 RJ2489B
250 SC 0.25 6 3 0.49 France, North 1997 (Sweet Cherry) Greenhouse
7 0.43 Clarke 1998 RJ2489B

94 Azoxystrobin
Table 82 Azoxystrobin residues in lettuce from supervised trials in Europe
Application LETTUCE Country
Year (variety)
Form g ai/L, g ai/kg
kg ai/ha kg ai/hL
Water, L/ha
No./ max
PHI days
Azoxystrobin residue, mg/kg
Author, Date
Study No.
250 SC 0.25 0.125 200 4 0 11 3 0.69 7 0.10
United Kingdom 1999 (Roxette) 14 < 0.01
Gill 2000 RJ2925B
250 SC 0.25 0.125 200 4 14 1.2
United Kingdom 1999 (Malibu)
Gill 2000 RJ2925B
250 SC 0.25 0.125 200 4 0 3.5 Gill 3 < 0.01 2000 7 0.02 RJ2925B
United Kingdom 1999 (Saladin Abba)
14 < 0.01
250 SC 0.25 0.125 200 4 14 1.6
United Kingdom 1999 (Siletta)
Gill 2000 RJ2925B
250 SC 0.25 0.06 400 3 0 7.6 Richards 2 2.7 2001 7 1.2 RJ3145B 9 0.76 14 0.19 21 0.46
250 SC 0.25 0.06 400 2 0 5.5 2 2.4 7 0.79 9 0.45 14 0.49
United Kingdom 2000 (Romaine)
21 0.28
250 SC 0.25 0.06 400 3 0 3.0 Richards 3 0.99 2001 7 0.20 RJ3145B 10 0.06 14 < 0.01 21 < 0.01
250 SC 0.25 0.06 400 2 0 2.8 3 1.4 7 0.14 10 0.03 14 < 0.01
United Kingdom 2000 (Little Gem Tozeas)
21 < 0.01
250 SC 0.25 0.06 400 3 0 0.50 Richards 3 0.08 2001 7 < 0.01 RJ3145B 10 < 0.01 13 < 0.01 21 < 0.01
250 SC 0.25 0.06 400 2 0 0.31 3 0.02 7 < 0.01 10 < 0.01 13 < 0.01
United Kingdom 2000 (Iceberg Robinson)
21 < 0.01 250 SC 0.25 0.125 200 4 0 7.7 Gill
3 4.8 2001 7 3.6 RJ3150
United Kingdom 2000 (Malibu)
14 0.39

Azoxystrobin 95
Application LETTUCE Country
Year (variety)
Form g ai/L, g ai/kg
kg ai/ha kg ai/hL
Water, L/ha
No./ max
PHI days
Azoxystrobin residue, mg/kg
Author, Date
Study No.
250 SC 0.25 0.125 200 4 14 0.25 Gill 2001
United Kingdom 2000 (Roxette) RJ3150
250 SC 0.25 0.125 200 4 0 4.0 Gill 3 1.0 2001 7 0.24 RJ3150
United Kingdom 2000 (Little Gem Attico) 14 0.56
250 SC 0.25 0.125 200 4 14 < 0.01 Gill 2001
United Kingdom 2000 (Siletta) RJ3150 France (South) 250 SC 0.25 0.08 300 3 BLA 3.5 White and 1999 0 16 Sutra (Locness) 3 3.3 2001 7 0.44 RJ3106B 14 0.10 21 0.01
France (South) 250 SC 0.25 0.08 300 3 BLA 2.1 White and 1999 0 8.3 Sutra (Nadine) 3 2.2 2001 7 0.85 RJ3106B 14 0.32 21 0.08
France (South) 250 SC 0.25 0.08 300 3 0 3.8 Gill 2000 3 2.2 2001 (Ballerina) 6 1.1 RJ3182B 10 0.80 16 0.14
250 SC 0.25 0.08 300 2 0 3.2 3 2.9 6 1.1 10 1.0 16 0.13
250 SC 0.25 0.08 300 1 0 3.0 3 3.2 6 0.58 10 0.64 16 0.06
France (North) 250 SC 0.25 0.08 300 3 0 6.2 Gill 2000 3 2.0 2001 (Nadege) 7 0.58 RJ3182B 10 0.52 14 0.21 21 0.07
250 SC 0.25 0.08 300 2 0 4.3 3 1.6 7 0.85 10 0.23 14 0.24 21 0.02
250 SC 0.25 0.08 300 1 0 6.2 3 1.1 7 0.44 10 0.32 14 0.13 21 0.08

96 Azoxystrobin
Application LETTUCE Country
Year (variety)
Form g ai/L, g ai/kg
kg ai/ha kg ai/hL
Water, L/ha
No./ max
PHI days
Azoxystrobin residue, mg/kg
Author, Date
Study No.
Spain 250 SC 0.25 0.05 507 3 0 0.35 White 1999 3 0.09 2001 (Toro) 7 0.12 RJ3093B 14 0.05 21 0.01 Spain 250 SC 0.25 0.05 507 3 0 6.5 White 1999 3 1.1 2001 (Odra) 7 1.4 RJ3093B 14 0.43 21 0.12 Spain 250 SC 0.26 0.04 673 3 0 10 Ryan and 1999 3 0.32 Gallardo (Arena) 7 0.08 2001 14 0.14 RJ3112B 21 0.03
250 SC 0.25 0.05 507 3 BLA 0.32 Fillingham 0 2.9 and Iniesta 3 0.29 2001 7 0.12 RJ3131B 9 0.11 14 0.01
250 SC 0.25 0.05 535 2 BLA 0.29 0 1.9 3 0.29 7 0.07 9 0.04
Spain 2000 (Salad Franchesca)
14 0.02 250 SC 0.25 0.04 596 3 BLA
0 3
0.79 1.0 1.3
7 0.23 10 0.24 14 0.08
250 SC 0.25 0.04 700 2 BLA 0
0.23 0.96
3 1.1 7
10 0.31 0.18
Spain 2000 (Aitana)
14 0.01
Fillingham and Iniesta 2001 RJ3131B
Table 83 Azoxystrobin residues in succulent beans from supervised trials in the USA
Application BEANS Country
Year (variety)
Form g ai/L
kg ai/ha kg ai/hL
Water, L/ha
No./ max
PHI days
Azoxystrobin residue, mg/kg
Author, Date
Study No.
United States North Carolina 1999 (Thorogreen)
800 WG 0.28 8 0 No pods: 0.06, 0.07
Spillner 2000 RR-00-051B
United States Illinois 1999 (Butter bean)
800 WG 0.28 8 0 No pods: 0.07, 0.08
Spillner 2000 RR-00-051B
United States California 1999 (Fordbook 242)
800 WG 0.28 7 0 No pods: 0.01, 0.02
Spillner 2000 RR-00-051B

Azoxystrobin 97
Application BEANS Country
Year (variety)
Form g ai/L
kg ai/ha kg ai/hL
Water, L/ha
No./ max
PHI days
Azoxystrobin residue, mg/kg
Author, Date
Study No.
United States North Carolina 1999 (Contender)
800 WG 0.28 7 0 With pods: 0.30, 0.48, 0.38,
0.34
Spillner 2000 RR-00-052B
United States Michigan 1999 (Bush Blue Lake 274)
800 WG 0.28 7 0 With pods: 0.10, 0.09, 0.11,
0.09
Spillner 2000 RR-00-052B
United States Mississippi 1999 (Commodore)
800 WG 0.28 7 0 With pods: 1.0, 0.78, 0.76,
1.5
Spillner 2000 RR-00-052B
Table 84 Azoxystrobin residues in succulent peas from supervised trials in the USA
Application PEAS Country
Year (variety)
Form g ai/L
kg ai/ha kg ai/hL
Water, L/ha
No./ max
PHI days
Azoxystrobin residue, mg/kg
Author, Date
Study No.
United States Illinois, 1999 (Dual)
800 WG 0.28 7 0 No pods: 0.03, 0.03
Bussey 2000 RR99-094B
United States North Carolina 1999 (Early Alaska)
800 WG 0.28 7 0 No pods: 0.05, 0.08
Bussey 2000 RR99-094B
United States North Carolina 1999 (Progress #9)
800 WG 0.28 7 0 No pods: 0.17, 0.13
Bussey 2000 RR99-094B
United States California, 1999 (OSP II)
800 WG 0.28 7 0 With pods: 1.2, 0.99, 0.71,
1.0
Bussey 2000 RR99-095B
United States North Carolina 1999 (Dwarf Gray Sugar)
800 WG 0.28 7 0 With pods: 1.1, 0.65, 1.5, 1.2
Bussey 2000 RR99-095B
United States Illinois, 1999 (Dwarf Gray Sugar)
800 WG 0.28 7 0 With pods: 0.78, 0.87, 0.60,
0.63
Bussey 2000 RR99-095B
Table 85 Azoxystrobin residues in soybeans from supervised trials in the USA
Application SOYBEAN SEEDS Country
Year (variety)
Form g ai/L
kg ai/ha kg ai/hL
Water L/ha
No./ Max
PHI days
Azoxystrobin residue, mg/kg
Author, Date
Study No.
United States Georgia, 1998 (NKS 75-55)
800 WG 0.28 6 14 0.02, 0.05
Bussey and Lipton 1999 RR 99-049B
United States North Carolina, 1998 (Hyperformer 574)
800 WG 0.28 6 13 0.18, 0.17
Bussey and Lipton 1999 RR 99-049B

98 Azoxystrobin
Application SOYBEAN SEEDS Country
Year (variety)
Form g ai/L
kg ai/ha kg ai/hL
Water L/ha
No./ Max
PHI days
Azoxystrobin residue, mg/kg
Author, Date
Study No.
United States Louisiana, 1998 (Delta Pine 3588)
800 WG 0.28 6 13 0.24, 0.23
Bussey and Lipton 1999 RR 99-049B
United States Arkansas, 1998 (Asgrow 5901)
800 WG 0.28 6 12 0.13, 0.15
Bussey and Lipton 1999 RR 99-049B
United States Mississippi, 1998 (Pioneer 9492)
800 WG 0.28 6 12 0.06, 0.06
Bussey and Lipton 1999 RR 99-049B
United States Iowa, 1998 (L2102cn)
800 WG 0.28 6 15 0.23, 0.01
Bussey and Lipton 1999 RR 99-049B
United States Iowa, 1998 (NK 30-06)
800 WG 0.28 6 14 0.01, 0.02
Bussey and Lipton 1999 RR 99-049B
United States Illinois, 1998 (Asgrow A3244)
800 WG 0.28 6 16 0.05, 0.09
Bussey and Lipton 1999 RR 99-049B
United States Illinois, 1998 (S30-06)
800 WG 0.28 7 13 0.02, 0.02
Bussey and Lipton 1999 RR 99-049B
United States Illinois, 1998 (Pioneer 9281)
800 WG 0.28 7 12 0.03, 0.03
Bussey and Lipton 1999 RR 99-049B
United States Indiana, 1998 (Pioneer 9333rr)
800 WG 0.28 6 12 0.33, 0.33
Bussey and Lipton 1999 RR 99-049B
United States Indiana, 1998 (Asgrow AG3601)
800 WG 0.28 6 14 0.05, 0.06
Bussey and Lipton 1999 RR 99-049B
United States Kansas, 1998 (S30-60)
800 WG 0.28 6 10 0.02, 0.03
Bussey and Lipton 1999 RR 99-049B
United States Minnesota, 1998 (Novartis S19-90)
800 WG 0.28 7 13 0.01, 0.02
Bussey and Lipton 1999 RR 99-049B
United States Minnesota, 1998 (T50598)
800 WG 0.28 6 14 0.04, 0.07
Bussey and Lipton 1999 RR 99-049B
United States Missouri, 1998 (NK3911)
800 WG 0.28 6 14 0.02, 0.02
Bussey and Lipton 1999 RR 99-049B
United States Nebraska, 1998 (Pioneer 92b52)
800 WG 0.28 5 12 0.11, 0.12
Bussey and Lipton 1999 RR 99-049B

Azoxystrobin 99
Application SOYBEAN SEEDS Country
Year (variety)
Form g ai/L
kg ai/ha kg ai/hL
Water L/ha
No./ Max
PHI days
Azoxystrobin residue, mg/kg
Author, Date
Study No.
United States Ohio, 1998 (S30-06)
800 WG 0.28 7 14 0.03, 0.06
Bussey and Lipton 1999 RR 99-049B
United States South Dakota, 1998 (Novartis S19-90)
800 WG 1x0.17 6x0.28
7 14 < 0.01, < 0.01
Bussey and Lipton 1999 RR 99-049B
United States South Dakota, 1998 (Cropland L0704)
800 WG 0.28 6 13 0.01, 0.02
Bussey and Lipton 1999 RR 99-049B
Table 86 Azoxystrobin residues in beetroot from supervised trials in the USA
Application Azoxystrobin residue, mg/kg
BEETROOTS Country
Year (variety) Form
g ai/L kg ai/ha kg
ai/hL Water, L/ha
No./ max
PHI days
Roots Tops
Author, Date
Study No.
800 WG 0.28 6 0 0.24, 0.18
12, 11 United States Washington, 2001 (Early Wonder Tall Top)
250 SC 0.28 6 0 0.17 0.32
13, 12
Ediger 2002 495-01
800 WG 0.28 6 0 0.33, 0.34
22, 22 United States New York, 2001 (Detroit Dark Red)
250 SC 0.28 6 0 0.12, 0.15
20, 22
Ediger 2002 495-01
800 WG 0.28 6 0 0.20, 0.18
9.1, 10 United States Texas, 2001 (Detroit Dark Red)
250 SC 0.28 6 0 0.23, 0.20
12, 8.6
Ediger 2002 495-01
800 WG 0.28 6 0 0.18, 0.18
6.4, 7.3 United States Illinois 2001 (Warrior)
250 SC 0.28 6 0 0.10, 0.07
15, 11
Ediger 2002 495-01
Table 87 Azoxystrobin residues in carrot from supervised trials in the USA
Application CARROT Country
Year (variety)
Form g ai/L
kg ai/ha kg ai/hL
Water, L/ha
No./ max
PHI days
Azoxystrobin residue, mg/kg
Author, Date
Study No.
US Champaign, IL 1998 (Goldenhart)
80 WG 0.37 8 0 0.17, 0.16
Aston and Bussey 1999 RR-99-041B
US Alamo, TX 1998 (Danver)
80 WG 0.37 6 0 0.13, 0.08
Aston and Bussey 1999 RR-99-041B
US Visalia, CA 1998 (Coral II)
80 WG 0.37 6 0 0.26, 0.20
Aston and Bussey 1999 RR-99-041B

100 Azoxystrobin
Application CARROT Country
Year (variety)
Form g ai/L
kg ai/ha kg ai/hL
Water, L/ha
No./ max
PHI days
Azoxystrobin residue, mg/kg
Author, Date
Study No.
US Holtville, CA 1998 (Chaktaw)
80 WG 0.37 6 0 0.03, 0.02
Aston and Bussey 1999 RR-99-041B
US Madera, CA 1998 (Mercury Hyb Imp 58 Type)
80 WG 0.37 6 0 0.30, 0.28
Aston and Bussey 1999 RR-99-041B
US Apopka, FL 1998 (Apache)
80 WG 0.37 6 0 0.14, 0.11
Aston and Bussey 1999 RR-99-041B
Table 88 Azoxystrobin residues in chicory from supervised trials in France
Application Azoxystrobin residue, mg/kg
CHICORY Country
Year (variety)
Form g ai/L
kg ai/haa kg ai/hL
Water, L/ha
No./ max
PHI days
Portion Residue
Author, Date
Study No.
250 SC 14 Leaf 0.19
Root 0.02 20 Chicon 0.05
0.25 + 0.01 kg ai/hL
2 + 1
Root 0.18 250 SC 20 Chicon 0.11
France 1998 (Platine)
0.25 +
2.5 2 + 1
Root 0.11
Lister 1999 RJ2815B
250 SC 14 Leaf 0.30 Root 0.04 20 Chicon 0.04
0.25 + 0.01 kg ai/hL
2 + 1
Root 0.15 250 SC 20 Chicon 0.10
France 1998 (Flash)
0.25 +
2.5 2 +1
Root 0.06
Lister 1999 RJ2815B
250 SC 14 Leaf 0.29 Root 0.03 21 Chicon 0.03
0.25 + 0.01 kg ai/hL
2 + 1
Root 0.25 250 SC 21 Chicon 0.05
France 1998 (Turbo)
0.25 +
2.5 2 +1
Root 0.07
Lister 1999 RJ2815B
250 SC 15 Leaf 0.12 Root 0.01 21 Chicon < 0.01
0.25 + 0.01 kg ai/hL
2 + 1
Root 0.50 250 SC 21 Chicon 0.03
France 1999 (Turbo)
0.25 +
2.5 2 +1
Root 0.46
Ryan 2000 RJ3042B
250 SC 15 Leaf 0.36 Root 0.03 21 Chicon < 0.01
0.25 + 0.01 kg ai/hL
2 + 1
Root 0.56 250 SC 21 Chicon 0.03
France 1999 (Turbo)
0.25 +
2.5 2 +1
Root 0.25
Ryan 2000 RJ3042B
aPlants were treated twice with a 250 SC azoxystrobin formulation at the rate of 0.25 kg ai/ha at intervals of 20–22 days. Fourteen days after the second application mature plants were harvested, the leaves removed, and the roots stored in a climate controlled room. After 14 days the roots were separated into two batches and each batch treated with azoxystrobin. The first set of roots were dipped in a solution containing 10 g ai/hL of azoxystrobin for two minutes and the second set were arranged upright, one layer deep, and sprayed once with azoxystrobin at a rate of 2500 g ai/ha. Following the treatments, hydroponic forcing was performed on both sets of roots in dark climate-controlled rooms. When mature chicons (the edible leaves after forcing) had developed, samples were taken and analysed for azoxystrobin.

Azoxystrobin 101
Table 89 Azoxystrobin residues in potato resulting from soil applications in supervised trials in Europe
Application POTATO Country
Year (variety)
Form g ai/L
kg ai/ha kg ai/hL
Water, L/ha
No./ max
PHI days
Azoxystrobin residue, mg/kg
Author, Date
Study No.
250 SC 1.5 1 60 0.02 90 0.01 105 < 0.01 119 < 0.01
250 SC 1 60 0.03 90 0.01 105 < 0.01
France (south) 2005 (Mona Lisa)
0.39 In-
furrow 119 < 0.01
Bour 2006 05-0309
250 SC 1.6 1 55 0.03 90 0.01 105 0.01 120 < 0.01
250 SC 1 55 0.03 90 0.01 105 0.01
France (south) 2005 (Mona Lisa)
0.37 In-
furrow 120 0.01
Bour 2006 05-0309
250 SC 1.5 1 59 0.07 90 0.02 105 0.02 119 0.01
250 SC 1 59 0.03 90 0.01 105 < 0.01
France (south) 2005 (Mona Lisa)
0.39 In-
furrow 119 < 0.01
Bour 2006 05-0309
250 SC 1.5 1 85 0.01 92 0.02 103 0.03 119 0.03
250 SC 1 85 0.01 92 0.01
France (south) 2005 (Europa)
0.38 In-
furrow 103 119
0.02 0.01
Bour 2006 05-0309
250 SC 1.5 1 109 < 0.01 Spain 1999 (Kennebeck)
137 < 0.01 Gill 2000 RJ2934B
250 SC 1.5 1 104 < 0.01 Spain 1999 (Jaerla)
123 < 0.01 Gill 2000 RJ2934B
250 SC 1.4 1 109 < 0.01 Spain 2000 (Kennebeck)
121 < 0.01 Richards 2001 RJ3130B
250 SC 1.4 1 97 < 0.01 Spain 2000 (Kennebeck)
108 < 0.01 Richards 2001 RJ3130B
250 SC 1.5 1 103 < 0.01 Spain 2000 (Jaerla)
122 < 0.01 Richards 2001 RJ3130B
250 SC 1.5 1 102 < 0.01 Spain 2000 (Marfona)
120 < 0.01 Richards 2001 RJ3130B
250 SC 1.5 1 96 0.03 Italy (north) 1999 (Agata)
126 0.01 Gill 2000 RJ2935B
250 SC 1.5 1 105 0.02 Italy (north) 1999 (Vivaldi)
141 0.01 Gill 2000 RJ2935B

102 Azoxystrobin
Application POTATO Country
Year (variety)
Form g ai/L
kg ai/ha kg ai/hL
Water, L/ha
No./ max
PHI days
Azoxystrobin residue, mg/kg
Author, Date
Study No.
250 SC 1.5 1 108 0.01 118 0.01
250 SC 1 108 0.01
Netherlands 1998 (Bildstar)
0.79 In-
furrow 118 0.02
Gill 1999 RJ2795B
250 SC 1.5 1 95 0.01 116 0.01
250 SC 0.78 1 95 0.01
Netherlands 1998 (Bintje)
In-furrow
116 0.03
Gill 1999 RJ2795B
250 SC 1.5 1 98 < 0.01 125 < 0.01
250 SC 0.77 1 98 < 0.01
Netherlands 1999 (Bildstar)
In-furrow
125 < 0.01
Gill 2000 RJ2968B
250 SC 1.6 1 77 < 0.01 124 < 0.01
250 SC 0.79 1 77 < 0.01
Netherlands 1999 (Bintje)
In-furrow
124 < 0.01
Gill 2000 RJ2968B
250 SC 1.5 1 73 0.01 111 < 0.01
250 SC 0.8 In-
furrow
1 73 0.03
Netherlands 2000 (Bildstar)
111 0.01
Fillingham 2001 RJ3120B
250 SC 1.5 1 95 0.01 138 0.01
250 SC 0.73 1 95 < 0.01
Netherlands 2000 (Bildstar)
In-furrow
138 < 0.01
Fillingham 2001 RJ3120B
250 SC 1.5 1 88 < 0.01 United Kingdom 1999 (Estima)
159 < 0.01 Gill 2000 RJ2939B
250 SC 1.5 1 90 < 0.01 United Kingdom 2000 (Estima)
130 < 0.01 Gill 2001 RJ3156B
Table 90 Azoxystrobin residues in potato resulting from foliar applications in supervised trials in Europe
Application POTATO Country
Year (variety)
Form g ai/L
kg ai/ha kg ai/hL
Water, L/ha
No./ max
PHI days
Azoxystrobin residue, mg/kg
Author, Date
Study No.
250 SC 0.125 3 0 < 0.01 1 < 0.01 3 < 0.01 5 < 0.01 7 < 0.01 14 < 0.01
250 SC 0.25 3 0 < 0.01 1 < 0.01 3 < 0.01 5 < 0.01 7 < 0.01
Spain 2001 (Spunta)
14 < 0.01
Nagra 2002 CEMR-1742

Azoxystrobin 103
Application POTATO Country
Year (variety)
Form g ai/L
kg ai/ha kg ai/hL
Water, L/ha
No./ max
PHI days
Azoxystrobin residue, mg/kg
Author, Date
Study No.
250 SC 0.125 3 0 < 0.01 1 < 0.01 3 < 0.01 5 < 0.01 7 < 0.01 14 < 0.01
250 SC 0.25 3 0 < 0.01 1 < 0.01 3 < 0.01 5 < 0.01 7 < 0.01
Spain 2001 (Agria)
14 < 0.01
Nagra 2002 CEMR-1742
250 SC 0.125 3 0 < 0.01 1 < 0.01 3 < 0.01 7 < 0.01 14 < 0.01
250 SC 0.25 3 0 < 0.01 1 < 0.01 3 < 0.01 7 < 0.01
Spain 2001 (Jaerla)
14 < 0.01
Nagra 2002 CEMR-1742
250 SC 0.125 3 0 < 0.01 1 < 0.01 3 < 0.01 7 < 0.01 14 < 0.01
250 SC 0.25 3 0 < 0.01 1 < 0.01 3 < 0.01 7 < 0.01
Spain 2001 (Agria)
14 < 0.01
Nagra 2002 CEMR-1742
250 SC 0.063 3 0 < 0.01 1
2 < 0.01 < 0.01
3 5
< 0.01 < 0.01
7 < 0.01 14 < 0.01
250 SC 0.125 3 0 < 0.01 1
2 < 0.01 < 0.01
3 5
< 0.01 < 0.01
7 < 0.01
Netherlands 2001 (Bintje)
14 < 0.01
Kang 2002 CEMR-1743
250 SC 0.063 3 0 < 0.01 1
2 < 0.01 < 0.01
3 4
< 0.01 < 0.01
7 < 0.01 14 < 0.01
250 SC 0.125 3 0 < 0.01 1 < 0.01 3 < 0.01 7 < 0.01
Netherlands 2001 (Lady Clair)
14 < 0.01
Kang 2002 CEMR-1743

104 Azoxystrobin
Application POTATO Country
Year (variety)
Form g ai/L
kg ai/ha kg ai/hL
Water, L/ha
No./ max
PHI days
Azoxystrobin residue, mg/kg
Author, Date
Study No.
250 SC 0.125 3 0 < 0.01 1 < 0.01 4 < 0.01 7 < 0.01 14 < 0.01
250 SC 0.25 3 0 < 0.01 1 < 0.01 4 < 0.01 7 < 0.01
United Kingdom 2001 (Pentland Squire)
14 < 0.01
Nagra 2002 CEMR-1744
250 SC 0.125 3 0 < 0.01 1 < 0.01 4 < 0.01 7 < 0.01 14 < 0.01
250 SC 0.25 3 0 < 0.01 1 < 0.01 4 < 0.01 7 < 0.01
United Kingdom 2001 (Marfona)
14 < 0.01
Nagra 2002 CEMR-1744
Table 91 Azoxystrobin residues in radish from supervised trials in the USA
Application Azoxystrobin residue, mg/kg
RADISH Country
Year (variety) Form
g ai/L kg ai/ha kg
ai/hL Water, L/ha
No./ max
PHI days
Roots Tops
Author, Date
Study No.
United States New York, 1998 (Champion)
800 WG 0.37 6 0 0.45, 0.37
23, 24
Bussey 1999 RR99-022B
United States Florida, 1998 (Comet)
800 WG 0.37 6 0 0.22, 0.29
23, 37
Bussey 1999 RR99-022B
United States Florida, 1998 (Red Baron)
800 WG 0.37 6 0 0.12, 0.16
13, 13
Bussey 1999 RR99-022B
United States Illinois, 1998 (Cherry Bomb)
800 WG 0.37 6 0 0.36, 0.38
10, 9.7
Bussey 1999 RR99-022B
United States California, 1998 (White Icicle)
800 WG 0.37 6 0 0.13, 0.09
15, 13
Bussey 1999 RR99-022B
Table 92 Azoxystrobin residues in sugar beet from supervised trials in the USA
Application SUGARBEET Country
Year (variety)
Form g ai/L
kg ai/ha kg ai/hL
Water L/ha
No./ max
PHI days
Azoxystrobin residue, mg/kg
Author, Date
Study No.
United States Michigan, 1998 (E-4 Monitor Sugar 6
800 WG 0.37 6 0 < 0.01, 0.05
Bussey 1999 RR99-036B
United States Minnesota, 1998 (Crystal 222)
800 WG 0.37 6 0 0.06, 0.04
Bussey 1999 RR99-036B

Azoxystrobin 105
Application SUGARBEET Country
Year (variety)
Form g ai/L
kg ai/ha kg ai/hL
Water L/ha
No./ max
PHI days
Azoxystrobin residue, mg/kg
Author, Date
Study No.
United States Minnesota, 1998 (Monohikari)
800 WG 0.37 6 0 0.08, 0.24
Bussey 1999 RR99-036B
United States Minnesota, 1998 (Beta seed Kw 1880)
800 WG 0.37 6 0 0.06, 0.09
Bussey 1999 RR99-036B
United States Montana, 1998 (Ach 192)
800 WG
0.37 6 0 0.04, 0.03
Bussey 1999 RR99-036B
United States North Dakota 1998 (Monohikari)
800 WG
0.37 6 0 0.08, 0.11
Bussey 1999 RR99-036B
United States Colorado, 1998 (Seedex XI)
800 WG
0.37 6 0 0.09, 0.09
Bussey 1999 RR99-036B
United States California, 1998 (Ss-7B1r)
800 WG
0.37 6 0 0.10, 0.06
Bussey 1999 RR99-036B
United States Idaho, 1998 (P-M9 Hilleshog)
800 WG
0.37 6 0 0.06, 0.03
Bussey 1999 RR99-036B
Table 93 Azoxystrobin residues in artichokes from supervised trials in France, Spain, the USA
Application ARTICHOKE Country
Year (variety)
Form g ai/L
kg ai/ha kg ai/hL
Water, L/ha
No./ max
PHI days
Azoxystrobin residue, mg/kg
Author, Date
Study No.
250 SC 0.25 500 4 0a 0.25 0 0.71 3 0.43 7 0.22 10 0.24
France 1998 (Macau)
14 0.07
Lister 1999 RJ2738
250 SC 0.25 500 4 0a 0.33 0 0.87 3 0.63 7 0.30 10 0.28
France 1998 (Chrysantheme)
14 0.06
Lister 1999 RJ2738
France 1999 (Camus)
250 SC 0.25 500 4 7 0.16 Lister 2000 RJ2922B
250 SC 0.25 510 4 0 1.6 3 0.89 7 0.42 10 0.33 14 0.39
250 SC 0.25 500 2 0 1.6 3 0.53 7 0.25 10 0.27
France 2000 (Camus)
14 0.16
Lister 2001 RJ3122B
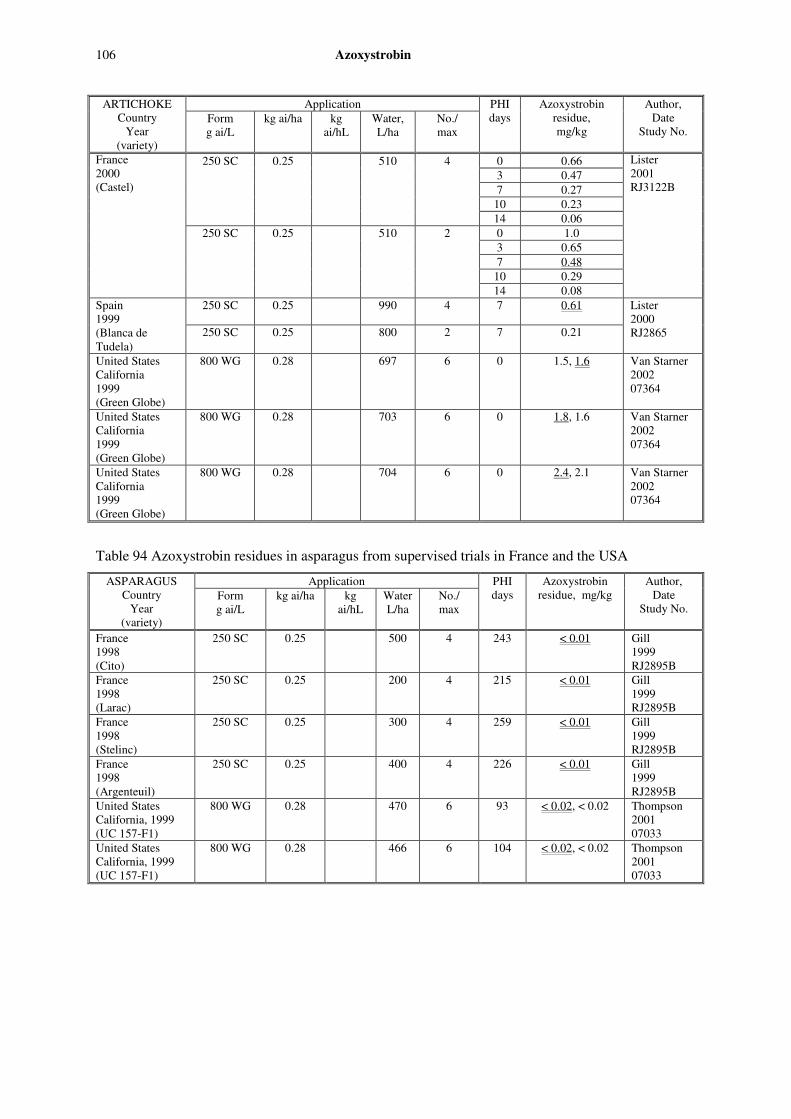
106 Azoxystrobin
Application ARTICHOKE Country
Year (variety)
Form g ai/L
kg ai/ha kg ai/hL
Water, L/ha
No./ max
PHI days
Azoxystrobin residue, mg/kg
Author, Date
Study No.
250 SC 0.25 510 4 0 0.66 3 0.47 7 0.27 10 0.23 14 0.06
250 SC 0.25 510 2 0 1.0 3 0.65 7 0.48 10 0.29
France 2000 (Castel)
14 0.08
Lister 2001 RJ3122B
250 SC 0.25 990 4 7 0.61 Spain 1999 (Blanca de Tudela)
250 SC 0.25 800 2 7 0.21
Lister 2000 RJ2865
United States California 1999 (Green Globe)
800 WG 0.28 697 6 0 1.5, 1.6
Van Starner 2002 07364
United States California 1999 (Green Globe)
800 WG 0.28 703 6 0 1.8, 1.6
Van Starner 2002 07364
United States California 1999 (Green Globe)
800 WG 0.28 704 6 0 2.4, 2.1
Van Starner 2002 07364
Table 94 Azoxystrobin residues in asparagus from supervised trials in France and the USA
Application ASPARAGUS Country
Year (variety)
Form g ai/L
kg ai/ha kg ai/hL
Water L/ha
No./ max
PHI days
Azoxystrobin residue, mg/kg
Author, Date
Study No.
France 1998 (Cito)
250 SC 0.25 500
4 243 < 0.01 Gill 1999 RJ2895B
France 1998 (Larac)
250 SC 0.25 200 4 215 < 0.01 Gill 1999 RJ2895B
France 1998 (Stelinc)
250 SC 0.25 300 4 259 < 0.01 Gill 1999 RJ2895B
France 1998 (Argenteuil)
250 SC 0.25 400 4 226 < 0.01 Gill 1999 RJ2895B
United States California, 1999 (UC 157-F1)
800 WG 0.28 470 6 93 < 0.02, < 0.02
Thompson 2001 07033
United States California, 1999 (UC 157-F1)
800 WG 0.28 466 6 104 < 0.02, < 0.02
Thompson 2001 07033

Azoxystrobin 107
Table 95 Azoxystrobin residues in trimmed and untrimmed celery from supervised trials in Italy and the UK
Application Azoxystrobin residue, mg/kg
CELERY Country
Year (variety)
Form g ai/L
kg ai/ha kg ai/hL
Water L/ha
No./ max
PHI days
Trim Untrim
Author, Date
Study No.
4 6 0.19 1.4 Italy 2000 (Celery D’Elne)
250 SC 0.25 800
14 0.10 0.57
McGill 2001 RJ3213B
250 SC 0.25 800 4 6 0.16 1.0 Italy 2000 (Celery D’Elne) 14 0.09 1.0
McGill 2001 RJ3213B
250 SC 0.25 800 4 6 0.33 2.0 Italy 2000 (Utah) 15 0.38 1.4
McGill 2001 RJ3213B
250 SC 0.25 800 4 6 0.73 2.5 Italy 2000 (Utah) 15 0.42 1.4
McGill 2001 RJ3213B
250 SC 0.25 787 4 0a 0.18 0.30
0 0.66 1.6
3 0.47 0.95
7 0.38 1.0
10 0.41 1.8
Italy 2001 (Florida)
14 0.23 1.3
Kang 2002 CEMR-1732
250 SC 0.25 822 4 0a 0.11 0.69
0 0.34 5.2
3 0.25 0.42
7 0.04 0.11
10 0.12 0.19
Italy 2001 (Florida)
14 0.07 0.09
Kang 2002 CEMR-1732
250 SC 0.25 500 4 0 0.56
3 0.81
7 0.36
United Kingdom 1998 (Celebrity)
14 0.23 2.9
Sapiets 1999 RJ2776B
250 SC 0.25 500 4 0 0.67
3 0.53
7 0.36
United Kingdom 1998 (Claudius)
14 0.33 3.2
Sapiets 1999 RJ2776B
United Kingdom 1998 (Claudius)
250 SC 0.25 500 4 14 0.05 0.43 Sapiets 1999 RJ2776B
United Kingdom 1998 (Claudius)
250 SC 0.25 500 4 14 0.10 Sapiets 1999 RJ2776B
250 SC 0.25 500 5 0 0.26
3 0.28
7 0.71
United Kingdom 1998 (Rijk Zwaan)
14 0.08 0.28
Sapiets 1999 RJ2777B
United Kingdom 1998 (Tango)
250 SC 0.25 500 7 14 0.11 0.23 Sapiets 1999 RJ2777B
250 SC 0.25 500 5 0 0.52
3 0.81
7 0.18
United Kingdom 1999 (Tango)
14 0.09 0.25
Gill 2000 RJ2947B
United Kingdom 1999 (Tango)
250 SC 0.25 500 4 14 0.26 0.96 Gill 2000 RJ2947B

108 Azoxystrobin
Table 96 Azoxystrobin residues in barley grains from supervised trials in Europe
Application BARLEY GRAIN Country
Year (variety)
Form g ai/L
kg ai/ha kg ai/hL
Water L/ha
No./ max
PHI days
Azoxystrobin residue, mg/kg
Author, Date
Study No.
France (south) 2003 (Nevada)
250 SC 0.25 2 37 0.04 Sole 2004 03-0303
250 SC 0.25 2 36 0.01 France (south) 2003 (Reine)
46 0.01
Sole 2004 03-0304
250 SC 0.25 2 35 0.10 France 2004 (Nevada)
43 0.13
Benazeraf 2005 04-0304
France 2004 (Vanessa)
250 SC 0.26 2 35 43
0.13 0.06
Benazeraf 2005 04-0304
France (south) 2001 (Sonja)
250 SC 0.20 400 2 42 0.01 Pointurier 2002 0112701
France (south) 2001 (Baraka)
200 SC 0.20 400 2 42 0.11 Pointurier 2002 0112702
France (south) 2001 (Baraka)
200 SC 0.20 400 2 40 0.03 Pointurier 2002 0112703
France (south) 2001 (Platine)
200 SC 0.20 400 2 40 0.03 Pointurier 2002 0112704
France (south) 2001 (Sonja)
200 SC 0.20 3 42 0.01 Pointurier 2002 0113201
France (south) 2001 (Sonja)
200 SC 0.20 3 42 0.02 Pointurier 2002 0113201
France (south) 2001 (Baraka)
200 SC 0.20 400 2 42 0.19 Pointurier 2002 0113202
France (south) 2001 (Baraka)
200 SC 0.20 400 2 43 0.02 Pointurier 2002 0113203
France (south) 2001 (Platine)
200 SC 0.20 400 2 41 0.02 Pointurier 2002 0113204
250 SC 0.18 300 3 35 0.13 France (south) 1993 (Pastoral) 400
WG 0.25 300 3 35 0.12
Sapiets 1994 RJ1766B
250 SC 0.17 300 3 26 0.04 France (south) 1993 (Volga) 400
WG 0.25 300 3 26 0.06
Sapiets 1994 RJ1766B
250 SC 0.16 3 37 0.01 France 1993 (Plaisant) 400
WG 0.25 3 37 0.05
Sapiets, et al.
1995 RJ1775B
250 SC 0.16 3 47 0.01 France 1993 (Plaisant) 400
WG 0.25 3 47 0.09
Sapiets, et al.
1995 RJ1775B

Azoxystrobin 109
Application BARLEY GRAIN Country
Year (variety)
Form g ai/L
kg ai/ha kg ai/hL
Water L/ha
No./ max
PHI days
Azoxystrobin residue, mg/kg
Author, Date
Study No.
250 SC 0.16 3 37 0.02 France 1993 (Express) 250 SC 0.25 3 37 0.11
Renard and Sapiets 1994 RJ1744B
France 1994 (Baraka)
250 SC 0.25 3 35 0.09 Sapiets 1995 RJ1918B
France 1994 (Labea)
250 SC 0.25 3 35 0.04 Sapiets 1995 RJ1918B
France 1994 (Intro)
250 SC 0.25 3 35 0.08 Sapiets 1995 RJ1918B
Germany 1994 (Teo)
250 SC 0.25 3 35 0.10 Tillkes 1995 ZEN-9403
250 SC 0.17 3 59 < 0.01 Germany 1993 (Hanna) 250 SC 0.26 3 59 0.02
Sapiets 1994 RJ1756B
250 SC 0.17 3 44 < 0.01 Germany 1993 (Sissy) 250 SC 0.26 3 44 0.02
Burke and Sapiets 1994 RJ1762B
Germany 1994 (Teo)
250 SC 0.25 3 35 0.11 Sapiets 1995 RJ1870B
200 SC 0.20 300 3 22 0.48 Germany 1995 (Hanna) 33 0.12
Burke 1996 RJ2070B
200 SC 0.20 300 2 37 0.02 Germany 2001 (Carreo)
49 0.01
Simon 2002 Gba32301
Germany 2001 (Theresa)
200 SC 0.20 300 2 34 0.12 Simon 2002 Gba92301
Italy 2003 (Federal)
250 SC 0.26 2 36 0.08 Sole, 2004 03-0301
Italy 2003 (Nikel)
250 SC 0.25 2 36 0.10 Sole, 2004 03-0302
Netherlands 2003 (Barke)
250 SC 0.25 2 37 0.08 Benazeraf 2004 03-0407
Spain 2003 (Astoria)
250 SC 0.25 2 35 0.03 Sole 2004 03-0305
Spain 2004 (Germania)
250 SC 0.26 2 38 0.28 Benazeraf 2005 04-0305
250 SC 0.25 2 35 0.11 Spain 2004 (Sultane) 49 0.04
Benazeraf 2005 04-0305
Sweden 1994 (Golf)
250 SC 0.25 200 2 42 0.20 Sapiets 1995 RJ1900B

110 Azoxystrobin
Application BARLEY GRAIN Country
Year (variety)
Form g ai/L
kg ai/ha kg ai/hL
Water L/ha
No./ max
PHI days
Azoxystrobin residue, mg/kg
Author, Date
Study No.
0.26 309 2 36 0.01 Switzerland 2003 (Henna)
250 SC
49 0.02
Benazeraf 2004 03-0408
0.26 311 2 36 0.04 Switzerland 2003 (Landi)
250 SC
47 0.02
Benazeraf 2004 03-0418
0.20 400 2 35 0.01 Switzerland 2001 (Pleasant)
200 SC
43 0.01
Pointurier 2002 2071/01
0.20 400 2 35 0.03 Switzerland 2001 (Pleasant)
200 SC
43 0.02
Pointurier 2002 2072/01
0.20 400 2 35 0.02 Switzerland 2001 (Pleasant)
200 SC
43 0.02
Pointurier 2002 2073/01
0.20 400 2 35 0.02 Switzerland 2001 (Pleasant)
200 SC
43 0.02
Pointurier 2002 2074/01
0.25 2 35 0.43 (ears) United Kingdom 2004 (Carat)
250 SC
GS 51–61a 63 0.03
Benazeraf 2005 04-0403
0.25 2 34 0.02 (ears) United Kingdom 2004 (Pearl)
250 SC
GS 55–59a 67 < 0.01
Benazeraf 2005 04-0403
0.25 2 35 0.04 United Kingdom 2003 (Halcyon)
250 SC
GS 55–59a 60 0.01
Benazeraf 2004 03-0406
250 SC 0.16 3 GS 70–71a
54 0.07 United Kingdom 1993 (Bronze) 250 SC 0.25 3
GS 70–71a 54 0.13
Hall et al. 1994 RJ1722B
United Kingdom 1994 (Pastoral)
250 SC 0.25 3 GS 69–71a
38 0.23 Sapiets 1995 RJ1899B
United Kingdom 1994 (Pipkin)
250 SC 0.25 3 GS 69–71a
53 0.14 Sapiets 1995 RJ1899B
United Kingdom 1994 (Fighter C2 Hancock seed)
250 SC 0.25 3 GS 65–69a
55 0.07 Sapiets 1995 RJ1899B
a Growth stage at the last application.
Table 97 Azoxystrobin residues in oat grains from supervised trials in Germany
Application OAT GRAIN Country
Year (variety)
Form g ai/L
kg ai/ha kg ai/hL
Water L/ha
No./ max
PHI days
Azoxystrobin residue, mg/kg
Author, Date
Study No.
Germany 1995 (Lutz)
200 SC 0.20 300 3 33 0.13 Burke 1996 RJ2070B
Germany 1994 (Salomon)
250 SC 0.25 3 35 0.01 Sapiets 1995 RJ1870B
Germany 1994 (Salomon)
250 SC 0.25 3 36 0.06 Tillkes 1995 ZEN-9403

Azoxystrobin 111
Table 98 Azoxystrobin residues in rye grains from supervised trials in Germany
Application RYE GRAIN Country
Year (variety)
Form g ai/L
kg ai/ha kg ai/hL
Water L/ha
No./ max
PHI days
Azoxystrobin residue, mg/kg
Author, Date
Study No.
Germany 1994
250 SC 0.25 3 35 42
0.04 0.03
Tillkes 1995 ZEN-9403
Germany 1995 (Rapid)
200 SC 0.20 300 3 35 44
0.02 0.01
Burke 1996 RJ2070B
Table 99 Azoxystrobin residues in triticale grains from supervised trials in Germany
Application TRITICALE GRAIN Country
Year (variety)
Form g ai/L
kg ai/ha kg ai/hL
Water L/ha No./ max
PHI days
Azoxystrobin residue, mg/kg
Author, Date
Study No.
250 SC 0.25 3 36 0.02 Germany 1994 (Modus) 3 44 0.01
Sapiets 1995 RJ1870B
Germany 1994
250 SC 0.25 3 36 44
< 0.01 < 0.01
Tillkes 1995 ZEN-9403
Table 100 Azoxystrobin residues in wheat grains from supervised trials in Europe
Application WHEAT GRAIN Country
Year (variety)
Form g ai/L
kg ai/ha kg ai/hL
Water L/ha
No./ max
PHI days
Azoxystrobin residue, mg/kg
Author, Date
Study No.
France (south) 2003 (Rapport)
250 SC
0.26 261 2 35 < 0.01 Benazeraf 2004 03-0308
250 SC
0.25 249 2 34 0.04 France (south) 2003 (Sezanne) 40 0.01
Benazeraf 2004 03-0309
250 SC
0.25 300 2 35 < 0.01 France (north) 2003 (Apache) 48 < 0.01
Sole 2004 03-0403
250 SC
0.25 201 2 38 0.14 France (south) 2004 (Galibie) 47 0.03
Benazeraf 2005 04-0302
France (south) 2004 (Soissons)
250 SC
0.26 207 2 35 0.03 Benazeraf 2005 04-0302
250 SC
0.17 3 70 < 0.01 France 1993 (Soissons) 250
SC 0.25 3 70 < 0.01
Renard and Sapiets 1994 RJ1744B
250 SC
0.17 300 3 39 < 0.01 France (south) 1993 (Soissons) 400
WG 0.25 300 3 39 < 0.01
Atger et al. 1994 RJ1766B
250 SC
0.17 300 3 31 0.04 France (south) 1993 (Florence-Aurore) 400
WG 0.25 300 3 31 0.08
Atger et al. 1994 RJ1766B

112 Azoxystrobin
Application WHEAT GRAIN Country
Year (variety)
Form g ai/L
kg ai/ha kg ai/hL
Water L/ha
No./ max
PHI days
Azoxystrobin residue, mg/kg
Author, Date
Study No.
250 SC
0.17 3 28 0.11 France 1993 (Manital) 400
WG 0.25 3 28 0.34
Sapiets et al.
1995 RJ1775B
250 SC
0.17 3 35 < 0.01 France 1993 (Gala) 400
WG 0.25 3 35 0.03
Sapiets et al.
1995 RJ1775B
France 1994 (Manital)
250 SC
0.25 3 35 0.03 Sapiets et al.
1994 RJ1918B
France 1994 (Courtot)
250 SC
0.25 3 40 0.02 Sapiets et al.
1994 RJ1918B
France 1994 (Soisson)
250 SC
0.25 3 40 < 0.01 Sapiets et al.
1994 RJ1918B
France (south) 2001 (Apache)
200 SC
0.20 400 2 42 0.01 Pointurier 2002 0112901
France (south) 2001 (Apache)
200 SC
0.20 300 2 42 < 0.01 Pointurier 2002 0112902
France (south) 2001 (Eureka)
200 SC
0.20 400 2 42 0.01 Pointurier 2002 0113301
France (south) 2001 (Grazia)
200 SC
0.20 400 2 41 0.01 Pointurier 2002 0113302
250 SC
0.17 3 63 < 0.01 Germany 1993 (Orestis) 250
SC 0.25 3 63 < 0.01
Burke and Sapiets 1994 RJ1756B
250 SC
0.17 3 53 < 0.01 Germany 1993 (Nandu) 250
SC 0.25 3 53 0.02
Burke and Sapiets, 1994 RJ1762B
Germany 1994 (Mieka)
250 SC
0.25 3 33 0.28 Sapiets 1995 RJ1870B
Germany 1994 (Kraka)
250 SC
0.25 3 35 0.04 Tillkes 1995 ZEN-9403
200 SC
0.20 300 2 35 < 0.01 Germany 2001 (Aristos) 50 < 0.01
Simon 2002 gwh32401
Germany 1995 (Monopol)
200 SC
0.20 300 3 36 0.01 Burke 1996 RJ2070B
Germany 2001 (Kornett)
200 SC
0.20 300 2 42 0.02 Simon 2002 gwh92401
Italy 2003 (Violet)
250 SC
0.25 252 2 35 < 0.01 Benazeraf 2004 03-0306
Italy 2003 (Soisson)
250 SC
0.26 257 2 35 0.02 Benazeraf 2004 03-0307
0.25 251 2 35 < 0.01 Spain 2003 (Cartaya)
250 SC
43 < 0.01
Benazeraf 2004 03-0310

Azoxystrobin 113
Application WHEAT GRAIN Country
Year (variety)
Form g ai/L
kg ai/ha kg ai/hL
Water L/ha
No./ max
PHI days
Azoxystrobin residue, mg/kg
Author, Date
Study No.
0.25 205 2 35 0.04 Spain 2004 (Kilopondio)
250 SC
41 0.02
Benazeraf 2005 04-0303
Spain 2004 (Lanza)
250 SC
0.25 200 2 35 0.01 Benazeraf 2005 04-0303
Switzerland 2003 (Levis)
250 SC
0.27 247 2 35 < 0.01 Sole 2004 03-0404
Switzerland 2003 (Arina)
250 SC
0.26 307 2 28 0.01 Sole 2004 03-0414
200 SC
0.20 400 2 35 < 0.01 Switzerland 2001 (Albis) 47 < 0.01
Pointurier 2002 2075/01
200 SC
0.20 400 2 35 < 0.01 Switzerland 2001 (Galaxy) 47 < 0.01
Pointurier 2002 2076/01
200 SC
0.20 400 2 35 < 0.01 Switzerland 2001 (Albis) 47 < 0.01
Pointurier 2002 2077/01
0.20 400 2 35 < 0.01 Switzerland 2001 (Galaxy)
200 SC 47 < 0.01
Pointurier 2002 2078/01
0.25 200 35 0.04 (ears) United Kingdom 2003 (Tanker)
250 SC
2 GS 67–69a
53 < 0.01
Sole 2004 03-0401
0.25 200 35 0.23 (ears) United Kingdom 2003 (Hereward)
250 SC
2 GS 69a
58 0.02
Sole 2004 03-0402
0.25 202 35 0.04 United Kingdom 2004 (Deben)
250 SC
2 GS 69a
61 < 0.01
Benazeraf 2005 04-0308
0.25 198 35 0.07 United Kingdom 2004 (Hereward)
250 SC
2 GS 69a
50 < 0.01
Benazeraf 2005 04-0308
250 SC
0.17 3 GS 70–71a
59 0.01 United Kingdom 1993 (Spark) 250
SC 0.25 3
GS 69–71a 59 0.03
Hall et al.
1994 RJ1722B
United Kingdom 1994 (Soisson)
250 SC
0.25 3 GS 71a
40 0.01 Sapiets 1995 RJ1899
United Kingdom 1994 (Apollo)
250 SC
0.25 3 GS 65–71a
48 0.02 Sapiets 1995 RJ1899
United Kingdom 1994 (Beaver)
250 SC
0.25 3 GS 69a
39 0.03 Sapiets 1995 RJ1899
a Growth stage at the last application.

114 Azoxystrobin
Table 101 Azoxystrobin residues in maize grains from supervised trials in the USA
Application MAIZE GRAIN Country
Year (variety)
Form g ai/L
kg ai/ha kg ai/hL
Water L/ha
No./ max
PHI days
Azoxystrobin residue, mg/kg
Author, Date
Study No.
United States New York, 1998 (Agway 257)
800 WG 0.28 8 6 < 0.01, < 0.01
Bussey, 1999 RR 99-050B
United States North Carolina 1998 (Pioneer 3167)
800 WG 0.28 8 6 < 0.01, < 0.01
Bussey, 1999 RR 99-050B
United States Florida, 1998 (Pioneer 3140)
800 WG 0.28 8 6 < 0.01, < 0.01
Bussey, 1999 RR 99-050B
United States Iowa, 1998 (N 46-40 BY)
800 WG 0.28 8 6 < 0.01, < 0.01
Bussey, 1999 RR 99-050B
United States Iowa, 1998 (NK 7070 BT)
800 WG 0.28 8 6 < 0.01, < 0.01
Bussey, 1999 RR 99-050B
United States Illinois, 1998 (Pioneer 3394)
800 WG 0.28 8 6 0.01, 0.01
Bussey, 1999 RR 99-050B
United States Illinois, 1998 (Pioneer 3394)
800 WG 0.28 8 6 < 0.01, < 0.01
Bussey, 1999 RR 99-050B
United States Illinois, 1998 (Pioneer 3394)
800 WG 0.28 8 7 < 0.01, < 0.01
Bussey, 1999 RR 99-050B
United States Indiana, 1998 (Pioneer 33A14 Hybrid)
800 WG 0.28 8 7 < 0.01, < 0.01
Bussey, 1999 RR 99-050B
United States Indiana, 1998 (Pioneer 34G81 Hybrid)
800 WG 0.28 8 6 < 0.01, < 0.01
Bussey, 1999 RR 99-050B
United States Minnesota, 1998 (Pioneer 3568)
800 WG 0.28 8 7 < 0.01, < 0.01
Bussey, 1999 RR 99-050B
United States Minnesota, 1998 (N 2555 Bt))
800 WG 0.28 8 7 0.01, 0.01
Bussey, 1999 RR 99-050B
United States Missouri, 1998 (Pioneer 3568)
800 WG 0.28 8 6 < 0.01, < 0.01
Bussey, 1999 RR 99-050B
United States Nebraska, 1998 (Pioneer 3406)
800 WG 0.28 8 6 < 0.01, < 0.01
Bussey, 1999 RR 99-050B
United States Nebraska, 1998 (Pioneer 34R06)
800 WG 0.28 8 7 < 0.01, < 0.01
Bussey, 1999 RR 99-050B
United States Iowa, 1998 (DK 566)
800 WG 0.28 8 7 0.02, 0.01
Bussey, 1999 RR 99-050B
United States Ohio, 1998 (Pioneer 3394)
800 WG 0.28 8 7 < 0.01, < 0.01
Bussey, 1999 RR 99-050B
United States Wisconsin, 1998 (NK 4242)
800 WG 0.28 8 6 < 0.01, < 0.01
Bussey, 1999 RR 99-050B
United States Texas, 1998 (Mycogen 2868)
800 WG 0.28 8 7 < 0.01, < 0.01
Bussey, 1999 RR 99-050B

Azoxystrobin 115
Application MAIZE GRAIN Country
Year (variety)
Form g ai/L
kg ai/ha kg ai/hL
Water L/ha
No./ max
PHI days
Azoxystrobin residue, mg/kg
Author, Date
Study No.
United States Washington, 1998 (Hybritech Hybrid)
800 WG 0.28 8 7 < 0.01, < 0.01
Bussey, 1999 RR 99-050B
Table 102 Azoxystrobin residues in rice grains from supervised trials in the USA
Application RICE Country
Year (variety)
Form g ai/L
kg ai/ha kg ai/hL
Water L/ha
Season Max
kg ai/ha
PHI days
Azoxystrobin residue, mg/kg
Author, Date
Study No.
United States Arkansas, 1995 (Kay Bonnet)
800 WG 0.22(2×)+0.34 0.78 27 1.6, 1.6
Sapiets 1996 RJ2201B
United States Arkansas, 1995 (Lemont)
800 WG 0.22(2×)+0.34 0.78 27 0.81, 0.72
Sapiets 1996 RJ2201B
United States Arkansas, 1995 (Lemont)
800 WG 0.22(2×)+0.34 0.78 28 0.38, 0.43
Sapiets 1996 RJ2201B
United States Louisiana, 1995 (Lemont)
800 WG 0.22(2×)+0.34 0.78 26 0.07, 0.07
Sapiets 1996 RJ2201B
United States Louisiana, 1995 (Cypress)
800 WG 0.22(2×)+0.34 0.78 27 0.41, 0.38
Sapiets 1996 RJ2201B
United States Louisiana, 1995 (Cypress)
800 WG 0.22(2×)+0.34 0.78 28 0.29, 0.25
Sapiets 1996 RJ2201B
United States Louisiana, 1995 (Cypress)
800 WG 0.22(2×)+0.34 0.78 28 0.89, 0.74
Sapiets 1996 RJ2201B
United States Mississippi, 1995 (Lemont)
800 WG 0.22(2×)+0.34 0.78 26 0.28, 0.30
Sapiets 1996 RJ2201B
United States Mississippi, 1995 (Lemont)
800 WG 0.22(2×)+0.34 0.78 27 0.65, 0.74
Sapiets 1996 RJ2201B
United States Mississippi, 1995 (Lemont)
800 WG 0.22(2×)+0.34 0.78 26 2.8, 2.5
Sapiets 1996 RJ2201B
United States Mississippi, 1995 (Lemont)
800 WG 0.22(2×)+0.34 0.78 28 0.30, 0.30
Sapiets 1996 RJ2201B
United States Missouri, 1995 (Allen)
800 WG 0.22(2×)+0.34 0.78 28 0.19, 0.18
Sapiets 1996 RJ2201B
United States Texas, 1995 (Cypress)
800 WG 0.22(2×)+0.34 0.78 26 3.2, 3.3 Sapiets 1996 RJ2201B
United States Texas, 1995 (Cypress)
800 WG 0.22(2×)+0.34 0.78 26 0.41, 0.62
Sapiets 1996 RJ2201B
United States California, 1995 (M-103)
800 WG 0.22(2×)+0.34 0.78 28 2.4, 3.0
Sapiets 1996 RJ2201B

116 Azoxystrobin
Application RICE Country
Year (variety)
Form g ai/L
kg ai/ha kg ai/hL
Water L/ha
Season Max
kg ai/ha
PHI days
Azoxystrobin residue, mg/kg
Author, Date
Study No.
United States California, 1995 (M-202)
800 WG 0.22(2×)+0.34 0.78 28 2.1, 2.3
Sapiets 1996 RJ2201B
Table 103 Azoxystrobin residues in almond nutmeat and hulls from supervised trials in the USA
Application Azoxystrobin residue, mg/kg
ALMONDS Country
Year (variety)
Form g ai/L
kg ai/ha kg ai/hL
Water L/ha
No./ max
PHI days
Nutmeat Hulls
Author, Date
Study No.
800 WG 0.28 0.01 2151 6 29 < 0.01 1.7
44 < 0.01 3.0
800 WG 0.28 0.05 533 6 29 < 0.01 2.3
United States California 1996 (Non Pareil)
44 < 0.01 2.4
Roper 1997 RR 97-001B
800 WG 0.28 0.01 2104 6 29 < 0.01 0.93
44 < 0.01 2.1
800 WG 0.28 0.05 561 6 29 < 0.01 0.67
United States California 1996 (Butte Padre)
44 < 0.01 0.84
Roper 1997 RR 97-001B
800 WG 0.28 0.01 2058 6 29 < 0.01 0.35
43 < 0.01 0.69
800 WG 0.28 0.05 561 6 29 < 0.01 0.25
United States California 1996 (Peerless)
43 < 0.01 0.50
Roper 1997 RR 97-001B
800 WG 0.28 0.01 2151 6 29 < 0.01 0.46
44 < 0.01 1.9
800 WG 0.28 0.05 533 6 29 < 0.01 0.55
United States California, 1996 (Non Pareil)
44 0.01 1.5
Roper 1997 RR 97-001B
800 WG 0.28 0.01 1870 6 28 < 0.01 0.93
43 < 0.01 1.3
800 WG 0.28 0.15 187 6 28 < 0.01 0.99
United States California 1996 (Non Pareil)
43 < 0.01 1.5
Roper 1997 RR 97-001B
Table 104 Azoxystrobin residues in pecans from supervised trials in the USA
Application PECANS Country
Year (variety)
Form g ai/L
kg ai/ha kg ai/hL
Water L/ha
No./ max
PHI days
Azoxystrobin residue, mg/kg
Author, Date
Study No.
800 WG 0.22 0.03 670 6 20 0.01
25 0.01
United States Mississippi, 1995 (Assorted) 800 WG 0.22 0.01 2340 6 23 0.02
Sapiets 1996 RJ2115B
United States Louisiana, 1994 (Cape Fear)
800 WG 0.22 0.03 670 6 42 < 0.01 Sapiets 1995 RJ1950B
United States Georgia, 1994 (Desirable)
800 WG 0.22 0.01 1506 6 24 < 0.01 Sapiets 1995 RJ1950B
United States Mississippi, 1994 (Forker)
800 WG 0.22 0.04 561 6 37 < 0.01 Sapiets 1995 RJ1950B
United States Texas, 1994 (Choctaw)
800 WG 0.22 0.05 430 6 42 < 0.01 Sapiets 1995 RJ1950B

Azoxystrobin 117
Table 105 Azoxystrobin residues in pistachios from supervised trials in the USA
Application PISTACHIOS Country
Year (variety)
Form g ai/L
kg ai/ha kg ai/hL
Water L/ha
No./ max
PHI days
Azoxystrobin residue, mg/kg
Author, Date
Study No.
United States California, 1999 (Kerman)
800 WG 0.28 0.03 840 6 7 0.33, 0.48
Starner IR-4 06830
United States California, 1999 (Kerman)
800 WG 0.28 0.03 840 6 7 0.26, 0.44
Starner IR-4 06830
United States California, 1999 (Kerman)
800 WG 0.28 0.03 840 6 7 0.23, 0.25
Starner IR-4 06830
Table 106 Azoxystrobin residues in cottonseed from supervised trials in the USA
Application COTTONSEED Country
Year (variety)
Form g ai/L
kg ai/ha
kg ai/km row
Water L/ha
No./ max
PHI days
Azoxystrobin residue, mg/kg
Author, Date
Study No.
United States North Carolina 1997 (Delta Pine 20)
800 WG
0.019 1 168 < 0.01, < 0.01
Bussey 1998 RR 98-055B
United States Arkansas, 1997 (Suregrow 501)
800 WG
0.019 1 155 < 0.01, < 0.01
Bussey 1998 RR 98-055B
United States Tennessee, 1997 (PM 1220 BGRR)
800 WG
0.019 1 148 < 0.01, < 0.01
Bussey 1998 RR 98-055B
United States Texas, 1997 (DPL-50)
800 WG
0.019 1 121 < 0.01, < 0.01
Bussey 1998 RR 98-055B
United States New Mexico, 1997 (HS200-Paymaster)
800 WG
0.019 1 168 < 0.01, < 0.01
Bussey 1998 RR 98-055B
United States Oklahoma, 1997 (Paymaster PM 183)
800 WG
0.019 1 159 < 0.01, < 0.01
Bussey 1998 RR 98-055B
United States Texas, 1997 (Paymaster HS 200)
800 WG
0.019 1 176 < 0.01, < 0.01
Bussey 1998 RR 98-055B
United States Texas, 1997 (Paymaster 183)
800 WG
0.019 1 124 < 0.01, < 0.01
Bussey 1998 RR 98-055B
United States California, 1997 (Maxxa)
800 WG
0.019 1 186 < 0.01, < 0.01
Bussey 1998 RR 98-055B
United States Arizona, 1997 (DP5461)
800 WG
0.019 1 163 < 0.01, < 0.01
Bussey 1998 RR 98-055B
United States Mississippi, 1997 (Suregrow 125)
800 WG
0.019 1 173 < 0.01, < 0.01
Bussey 1998 RR 98-055B
United States California, 1997 (Acala Maxxa)
800 WG
0.019 1 174 < 0.01, < 0.01
Bussey 1998 RR 98-055B
United States South Carolina 2005 (Delta Pine 555)
250 SC
0.17 1 + 3a 45 0.01, 0.01
Ediger 2007 T020405-04

118 Azoxystrobin
Application COTTONSEED Country
Year (variety)
Form g ai/L
kg ai/ha
kg ai/km row
Water L/ha
No./ max
PHI days
Azoxystrobin residue, mg/kg
Author, Date
Study No.
1 + 3a 38 0.04, 0.03
45 0.02, 0.03
United States Mississippi, 2005 (DP444 BG/RR
250 SC
0.17
52 0.02, 0.02
Ediger 2007 T020405-04
United States Arkansas, 2005 (DP 555 BR)
250 SC
0.17 1 + 3a 45 0.01, 0.01
Ediger 2007 T020405-04
United States Louisiana, 2005 (DP 555 BG/RR)
250 SC
0.17 1 + 3a 45 < 0.01, < 0.01
Ediger 2007 T020405-04
United States Texas, 2005 (DP 555 RR/BG)
250 SC
0.17 1 + 3a 45 < 0.01, < 0.01
Ediger 2007 T020405-04
1 + 3a 38 < 0.01, < 0.01
45 < 0.01, < 0.01
United States Texas, 2005 (DPL 458BRR)
250 SC
0.17
52 < 0.01, < 0.01
Ediger 2007 T020405-04
United States Texas, 2005 (Paymaster 2326 RR)
250 SC
0.17 1 + 3a 45 0.03, 0.03
Ediger 2007 T020405-04
United States Oklahoma, 2005 (ST3539BR)
250 SC
0.17 1 + 3a 45 < 0.01, < 0.01
Ediger 2007 T020405-04
United States New Mexico, 2005 (Paymaster 2326 RR)
250 SC
0.17 1 + 3a 45 0.01, 0.02
Ediger 2007 T020405-04
United States California, 2005 (Acala Sierra RR)
250 SC
0.17 1 + 3a 45 0.37, 0.54 Ediger 2007 T020405-04
United States California, 2005 (Acala Maxxa)
250 SC
0.17 1 + 3a 45 < 0.01, 0.03
Ediger 2007 T020405-04
United States California, 2005 (Acala Maxxa)
250 SC
0.17 1 + 3a 45 < 0.01, < 0.01
Ediger 2007 T020405-04
a One pre-planting in-furrow treatment at 0.17 kg ai/ha and three foliar treatments at 0.17 kg ai/ha.
Table 107 Azoxystrobin residues in peanuts from supervised trials in the USA
Application Azoxystrobin residue, mg/kg
PEANUTS Country
Year (variety) Form
g ai/L kg
ai/ha kg
ai/hL Water L/ha
No./ max
PHI days
Nutmeat Hay
Author, Date
Study No.
United States Alabama, 1997 (GK-7)
800 WG
0.45 2 14 < 0.01, < 0.01
3.1, 2.4
Bussey, 1999 RR 98-046B
United States Alabama, 1997 (Andrews)
800 WG
0.52 2 14 < 0.01, < 0.01
3.0, 2.4
Bussey, 1999 RR 98-046B
United States Georgia, 1997 (GK-7)
800 WG
0.45 2 13 < 0.01, < 0.01
13, 8.1
Bussey, 1999 RR 98-046B

Azoxystrobin 119
Application Azoxystrobin residue, mg/kg
PEANUTS Country
Year (variety) Form
g ai/L kg
ai/ha kg
ai/hL Water L/ha
No./ max
PHI days
Nutmeat Hay
Author, Date
Study No.
United States Georgia, 1997 (GA Runner)
800 WG
0.45 2 14 0.01, 0.01 2.7, 3.3
Bussey, 1999 RR 98-046B
United States North Carolina, 1997 (VAC 92R)
800 WG
0.45 2 14 0.01, < 0.01 6.7, 8.3
Bussey, 1999 RR 98-046B
United States North Carolina, 1997 (NC-7)
800 WG
0.45 2 14 0.13, 0.11 8.6, 9.3
Bussey, 1999 RR 98-046B
United States South Carolina, 1997 (Birdsong 108)
800 WG
0.45 2 13 < 0.01, < 0.01
4.0, 3.7
Bussey, 1999 RR 98-046B
United States Virginia, 1997 (VAC 92R)
800 WG
0.45 2 14 0.01, 0.01 4.3, 4.3
Bussey, 1999 RR 98-046B
United States Florida, 1997 (Georgia Green)
800 WG
0.45 2 14 < 0.01, < 0.01
1.5, 1.4
Bussey, 1999 RR 98-046B
United States Texas, 1997 (Spanco)
800 WG
0.45 2 20 < 0.01, < 0.01
1.2, 1.1
Bussey, 1999 RR 98-046B
United States Texas, 1997 (GK-7 Florunner)
800 WG
0.45 2 14 0.05, 0.06
4.7, 4.6
Bussey, 1999 RR 98-046B
United States Texas, 1997 (Florunner)
800 WG
0.45 2 14 0.01, < 0.01
8.9, 8.2
Bussey, 1999 RR 98-046B
Table 108 Azoxystrobin residues in sunflower from supervised trials in the USA
Application SUNFLOWER SEEDS Country
Year (variety)
Form g ai/L
kg ai/ha kg ai/hL
Water L/ha
Season Max
kg ai/ha
PHI days
Azoxystrobin residue, mg/kg
Author, Date
Study No.
United States Minnesota, 2000 (Black oil)
800 WG 0.12 0.26 0.12
0.5 29 0.03, 0.01
Judy et al. 2001 RR 00-058B
United States North Dakota, 2000 (Not reported)
800 WG 0.12 0.26 0.12
0.5 29 0.01, < 0.01
Judy et al. 2001 RR 00-058B
United States Nebraska, 2000 (Novartis 231)
800 WG 0.12 0.26 0.12
0.5 30 0.05, 0.05
Judy et al. 2001 RR 00-058B
United States North Dakota, 2000 (Hysun 450)
800 WG 0.12 0.26 0.12
0.5 30 0.03, 0.03
Judy et al. 2001 RR 00-058B
United States South Dakota, 2000 (Croplen CL803)
800 WG 0.12 0.26 0.12
0.5 28 0.13, 0.24
Judy et al. 2001 RR 00-058B
United States Texas, 2000 (Triumph 571)
800 WG 0.12 0.26 0.12
0.5 29 0.08, 0.05
Judy et al. 2001 RR 00-058B

120 Azoxystrobin
Table 109 Azoxystrobin residues in herbs (basil, chives, and parsley) from supervised trials in the USA
Application Azoxystrobin residue, mg/kg
HERBS Country
Year (variety)
Form g ai/L
kg ai/ha kg ai/hL
Water L/ha
No./ max
PHI days
Fresh Dried
Author, Date
Study No.
BASIL
United States Georgia, 1999 (Sweet Thai)
800 WG 0.28 6 0 48, 45
216, 235
Chen 2002 IR-4 07104
800 WG 0.28 5 0 22, 25
7 9.4, 8.9
United States Florida, 1999 (Genovese)
14 0.32, 0.39
Chen 2002 IR-4 07104
United States California, 1999 (Italian, large leaf)
800 WG 0.28 6 0 23, 16
139, 94
Chen 2002 IR-4 07104
CHIVES United States Idaho, 1999 (Purple Large Leaf)
800 WG 0.28 6 0 4.1, 4.2
31, 27
Chen 2004 IR-4 07105
United States Georgia, 2001 (Garlic Chives)
800 WG 0.28 6 0 7.3, 5.8
Chen 2004 IR-4 07105
United States Maryland, 2002 (Fancy)
800 WG 0.28 6 0 1.1, 1.1
27, 25
Chen 2004 IR-4 07105
United States New Jersey, 2002 (Chives, not specified)
800 WG 0.28 6 0 2.3, 2.7
33 45
Chen 2004 IR-4 07105
PARSLEY
United States California, 2001 (Italian Dark Green)
800 WG 0.28 6 0 20, 19
165 Chen 2004 T016998-04
United States California, 2001 (Gilroy Double-cut)
800 WG 0.29 5 0 17, 11
135 Chen 2004 T016998-04
Table 110 Azoxystrobin residues in mint leaves from supervised trials in the USA
Application MINT LEAVES Country
Year (variety)
Form g ai/L
kg ai/ha kg ai/hL
Water L/ha
No./ max
PHI days
Azoxystrobin residue, mg/kg
Author, Date
Study No.
Intended for processing
United States Washington, 1998 (Scotch peppermint)
800 WG 0.28 6 7 9.2, 12
Thompson 2000 RR 00-105B
United States Washington, 1998 (Scotland 770)
800 WG 0.28 6 7 7.7, 8.0
Thompson 2000 RR 00-105B
United States Washington, 1998 (Spearmint)
800 WG 0.28 6 6 15, 17
Thompson 2000 RR 00-105B

Azoxystrobin 121
Application MINT LEAVES Country
Year (variety)
Form g ai/L
kg ai/ha kg ai/hL
Water L/ha
No./ max
PHI days
Azoxystrobin residue, mg/kg
Author, Date
Study No.
United States Wisconsin, 1998 (Spearmint)
800 WG 0.28 6 7 4.1, 4.8
Thompson 2000 RR 00-105B
United States Wisconsin, 1998 (Redefined Murry peppermint)
800 WG 0.28 6 7 5.0, 5.8
Thompson 2000 RR 00-105B
Fresh mint leaves
United States Florida, 1998 (Orange mint)
800 WG 0.28 6 0 25, 20
Thompson 2000 RR 00-106B
United States Florida, 1998 (Apple Mint Bowles)
800 WG 0.28 6 0 21, 21
Thompson 2000 RR 00-106B
Table 111 Azoxystrobin residues in soybean forage and hay from supervised trials in the USA
Application Azoxystrobin residue, mg/kg
SOYBEAN FORAGE AND
HAY Country
Year (variety)
Form g ai/L
kg ai/ha kg ai/hL
Water L/ha
No./ max
PHI days
Forage Hay
Author, Date
Study No.
United States Georgia, 1998 (NKS 75-55)
800 WG 0.28 1 0 3.2, 4.6 6.6, 6.8
Bussey and Lipton 1999 RR 99-049B
United States North Carolina, 1998 (Hyperformer 574)
800 WG 0.28 1 0 7.7, 5.6
19, 22
Bussey and Lipton 1999 RR 99-049B
United States Louisiana, 1998 (Delta Pine 3588)
800 WG 0.28 1 0 16, 20
28, 33
Bussey and Lipton 1999 RR 99-049B
United States Arkansas, 1998 (Asgrow 5901)
800 WG 0.28 1 0 18, 6.8
50, 51
Bussey and Lipton 1999 RR 99-049B
United States Mississippi, 1998 (Pioneer 9492)
800 WG 0.28 1 0 5.6, 7.2
15, 16
Bussey and Lipton 1999 RR 99-049B
United States Iowa, 1998 (L2102cn)
800 WG 0.28 1 0 10, 9.0
26, 27
Bussey and Lipton 1999 RR 99-049B
United States Iowa, 1998 (NK 30-06)
800 WG 0.28 1 0 6.8, 4.9
15, 22
Bussey and Lipton 1999 RR 99-049B

122 Azoxystrobin
Application Azoxystrobin residue, mg/kg
SOYBEAN FORAGE AND
HAY Country
Year (variety)
Form g ai/L
kg ai/ha kg ai/hL
Water L/ha
No./ max
PHI days
Forage Hay
Author, Date
Study No.
United States Illinois, 1998 (Asgrow A3244)
800 WG 0.28 1 0 7.7, 9.4
31, 24
Bussey and Lipton 1999 RR 99-049B
United States Illinois, 1998 (S30-06)
800 WG 0.28 1 0 7.0, 8.3
24, 23
Bussey and Lipton 1999 RR 99-049B
United States Illinois, 1998 (Pioneer 9281)
800 WG 0.28 1 0 8.5, 7.9
27, 21
Bussey and Lipton 1999 RR 99-049B
United States Indiana, 1998 (Pioneer 9333rr)
800 WG 0.28 1 0 12, 9.0
35, 43
Bussey and Lipton 1999 RR 99-049B
United States Indiana, 1998 (Asgrow AG3601)
800 WG 0.28 1 0 9.2, 9.9
28, 38
Bussey and Lipton 1999 RR 99-049B
United States Kansas, 1998 (S30-60)
800 WG 0.28 1 0 5.7, 7.4
8.3, 16
Bussey and Lipton 1999 RR 99-049B
United States Minnesota, 1998 (Novartis S19-90)
800 WG 0.28 1 0 9.5, 8.5
27, 34
Bussey and Lipton 1999 RR 99-049B
United States Minnesota, 1998 (T50598)
800 WG 0.28 1 0 9.0, 12
50, 53
Bussey and Lipton 1999 RR 99-049B
United States Missouri, 1998 (NK3911)
800 WG 0.28 1 0 19, 23
29, 37
Bussey and Lipton 1999 RR 99-049B
United States Nebraska, 1998 (Pioneer 92b52)
800 WG 0.28 1 0 11, 8.7
38, 31
Bussey and Lipton 1999 RR 99-049B
United States Ohio, 1998 (S30-06)
800 WG 0.28 1 0 7.1, 6.7
33, 25
Bussey and Lipton 1999 RR 99-049B
United States South Dakota, 1998 (Novartis S19-90)
800 WG 1x0.17 1x0.28
2 0 7.6, 6.7
22, 28
Bussey and Lipton 1999 RR 99-049B

Azoxystrobin 123
Table 112 Azoxystrobin residues in barley straw and forage from supervised trials in Europe
Application Azoxystrobin residue, mg/kg
BARLEY STRAW, FORAGE Country
Year (variety)
Form g ai/L
kg ai/ha kg ai/hL
Water L/ha
No./ max
PHI days
Straw Whole plant
(forage)
Author, Date
Study No.
0.26 2 0a 0.25
0 5.1
7 4.0
14 1.9
28 0.79
Italy 2003 (Federal)
250 SC
36 2.3
Sole, 2004 03-0301
0.25 2 0a 0.82
0 5.8
7 3.9
14 2.3
28 0.99
Italy 2003 (Nikel)
250 SC
36 2.3
Sole, 2004
0.25 2 0a 0.2
0 5.5
7 3.8
14 0.76
28 0.90
France (south) 2003 (Nevada)
250 SC
37 1.3
Sole 2004 03-0303
0.25 2 0a 0.07
0 4.2
7 1.8
14 0.66
28 0.48
36 0.63
France (south) 2003 (Reine)
250 SC
46 0.65
Sole 2004 03-0304
0.25 2 35 1.6 France 2004 (Nevada)
250 SC
43 2.9
Benazeraf 2005 04-0304
0.26 2 35 0.95 France 2004 (Vanessa)
250 SC
43 4.8
Benazeraf 2005 04-0304
France (south) 2001 (Sonja)
200 SC 0.20 400 2 42 0.82
Pointurier 2002 0112701
France (south) 2001 (Baraka)
200 SC 0.20 400 2 42 3.7
Pointurier 2002 0112702
France (south) 2001 (Baraka)
200 SC 0.20 400 2 40 2.9 Pointurier 2002 0112703
France (south) 2001 (Platine)
200 SC 0.20 400 2 40 1.6 Pointurier 2002 0112704
France (south) 2001 (Sonja)
200 SC 0.20 400 3 42 0.53 Pointurier 2002 0113201

124 Azoxystrobin
Application Azoxystrobin residue, mg/kg
BARLEY STRAW, FORAGE Country
Year (variety)
Form g ai/L
kg ai/ha kg ai/hL
Water L/ha
No./ max
PHI days
Straw Whole plant
(forage)
Author, Date
Study No.
France (south) 2001 (Sonja)
200 SC 0.20 400 3 42 0.67 Pointurier 2002 0113201
France (south) 2001 (Baraka)
200 SC 0.20 2 42 3.6 Pointurier 2002 0113202
France (south) 2001 (Baraka)
200 SC 0.20 400 2 43 1.5 Pointurier 2002 0113203
France (south) 2001 (Platine)
200 SC 0.20 400 2 41 0.84 Pointurier 2002 0113204
250 SC 0.16 3 37 0.53 France 1993 (Express) 250 SC 0.25 3 37 1.3
Renard and Sapiets 1994 RJ1744B
0.18 300 3 21 0.57
1 6.5
10 3.3
19 2.1
27 1.3
250 SC
35 0.91
0.25 300 3 21 0.50
1 8.5
10 2.6
19 1.7
27 1.0
France (south) 1993 (Pastoral)
400 WG
35 0.91
Sapiets 1994 RJ1766B
0.17 3 14 0.59
1 1.2
7 0.59
13 0.31
19 0.44
250 SC
26 0.60
0.25 300 3 14 0.44
1 0.87
7 0.54
13 0.27
19 0.40
France (south) 1993 (Volga)
400 WG
26 0.60
Sapiets 1994 RJ1766B
250 SC 0.16 3 37 0.57 France 1993 (Plaisant) 400
WG 0.25 3 37 0.72
Sapiets et
al. 1995 RJ1775B
250 SC 0.16 3 47 0.60 France 1993 (Plaisant)
400 WG
0.25 3 47 0.92
Sapiets et al.
1995 RJ1775B

Azoxystrobin 125
Application Azoxystrobin residue, mg/kg
BARLEY STRAW, FORAGE Country
Year (variety)
Form g ai/L
kg ai/ha kg ai/hL
Water L/ha
No./ max
PHI days
Straw Whole plant
(forage)
Author, Date
Study No.
0.25 3 BLA 0
1.4 10
10 1.4
20 1.1
28 1.1
France 1994 (Baraka)
250 SC
35 1.2
Sapiets 1995 RJ1918B
0.25 3 BLA 0
0.62 5.1
11 0.87
19 0.70
27 0.72
France 1994 (Labea)
250 SC
35 1.3
Sapiets 1995 RJ1918B
0.25 3 BLA 0
0.91 5.6
11 1.0
19 0.57
27 1.1
France 1994 (Intro)
250 SC
35 1.6
Sapiets 1995 RJ1918B
0.25 2 0a 0.12
0 4.0
7 1.9
14 1.8
28 0.22
Spain 2003 (Astoria)
250 SC
35 1.2
Sole 2004 03-0305
Spain 2004 (Germania)
250 SC 0.26 2 38 5.5 Benazeraf 2005 04-0305
0.25 2 35 0.48 Spain 2004 (Sultane)
250 SC
49 2.5
Benazeraf 2005 04-0305
0.25 2 0a 0.02
0 3.8
7 1.6
14 1.1
28 0.39
Netherlands 2003 (Barke)
250 SC
37 1.5
Benazeraf 2004 03-0407
0.26 309 2 0a 0.51
0 3.9
7 1.1
14 0.39
28 0.25
Switzerland 2003 (Henna)
250 SC
36 49
0.48 0.48
Benazeraf 2004 03-0408
0.26 311 2 0a 0.26
0 3.1
7 0.75
14 0.41
28 0.23
36 0.38
Switzerland 2003 (Landi)
250 SC
47 0.39
Benazeraf 2004 03-0418

126 Azoxystrobin
Application Azoxystrobin residue, mg/kg
BARLEY STRAW, FORAGE Country
Year (variety)
Form g ai/L
kg ai/ha kg ai/hL
Water L/ha
No./ max
PHI days
Straw Whole plant
(forage)
Author, Date
Study No.
United Kingdom 2004 (Carat)
250 SC 0.25 2 GS 51–61b
63 0.50 Benazeraf 2005 04-0403
United Kingdom 2004 (Pearl)
250 SC 0.25 2 GS 55–59b
67 0.91
Benazeraf 2005 04-0403
0.25 2 0a 0.61
GS 55–59b 0 3.1
7 0.73
14 0.30
28 0.62
35 1.3
United Kingdom 2003 (Halcyon)
250 SC
60 0.31
Benazeraf 2004 03-0406
0.16 3 13 1.2
GS 70–71b 1 7.5
10 0.83
18 0.94
29 0.97
250 SC
54 1.0
0.25 3 13 0.87
GS 70–71b 1 8.7
10 1.3
18 1.1
29 1.2
United Kingdom 1993 (Bronze)
250 SC
54 1.6
Hall et al. 1994 RJ1722B
0.25 3 GS 69–71b
BLA 0
10
0.36 4.0 2.7
19 2.1
28 2.6
United Kingdom 1994 (Pastoral)
250 SC
38 4.5
Sapiets 1995 RJ1899B
0.25 3 GS 69–71b
BLA 0
14
0.55 5.0 4.0
28 3.0
38 2.4
United Kingdom 1994 (Pipkin)
250 SC
53 3.4
Sapiets 1995 RJ1899B
0.25 3 GS 65–69b
BLA 0
10
1.3 11 2
19 1.6
28 0.89
United Kingdom 1994 (Fighter C2 Hancock seed)
250 SC
55 2.1
Sapiets 1995 RJ1899B
0.25 3 0 8.6
19 0.82
Germany 1994 (Teo)
250 SC
35 2.2
Tillkes 1995 ZEN-9403
250 SC 0.17 3 59 0.42 Germany 1993 (Hanna) 250 SC 0.26 3 59 0.45
Sapiets 1994 RJ1756B

Azoxystrobin 127
Application Azoxystrobin residue, mg/kg
BARLEY STRAW, FORAGE Country
Year (variety)
Form g ai/L
kg ai/ha kg ai/hL
Water L/ha
No./ max
PHI days
Straw Whole plant
(forage)
Author, Date
Study No.
0.17 3 14 0.24 1 1.2
8 0.43
20 0.20
30 0.12
250 SC
44 0.15
0.26 3 14 0.38 1 1.4
8 0.6
20 0.38
30 0.22
Germany 1993 (Sissy)
250 SC
44 0.22
Burke and Sapiets 1994 RJ1762B
0.25 3 0 11
19 1.8
Germany 1994 (Teo)
250 SC
35 2.9
Sapiets 1995 RJ1870B
Sweden 1994 (Golf)
250 SC 0.25 200 2 42 5.3 Sapiets 1995 RJ1900B
0.20 300 3 0 3.4
22 1.8
Germany 1995 (Hanna)
200 SC
33 2.2
Burke 1996 RJ2070B
0.20 300 2 37 0.58
Germany 2001 (Carreo)
200 SC
49 0.45
Simon 2002 Gba32301
Germany 2001 (Theresa)
200 SC 0.20 300 2 34 1.5
Simon 2002 gba92301
0.20 400 2 35 0.60 Switzerland 2001 (Pleasant)
200 SC
43 0.61
Pointurier 2002 2071/01
0.20 400 2 35 0.64 Switzerland 2001 (Pleasant)
200 SC
43 0.94
Pointurier 2002 2072/01
0.20 400 2 35 0.71 Switzerland 2001 (Pleasant)
200 SC
43 0.51
Pointurier 2002 2073/01
0.20 400 2 35 0.37 Switzerland 2001 (Pleasant)
200 SC
43 0.50
Pointurier 2002 2074/01
a Before final application b Growth stage at the last application.
Table 113 Azoxystrobin residues in oat straw and forage from supervised trials in Germany
Application Azoxystrobin residue, mg/kg
OAT STRAW, FORAGE Country
Year (variety)
Form g ai/L
kg ai/ha
kg ai/hL
Water L/ha
No./ max
PHI days
Straw Whole plant
(forage)
Author, Date
Study No.
200 SC 0.20 300 3 0 6.7
20 1.8
Germany 1995 (Lutz) 33 3.0
Burke 1996 RJ2070B

128 Azoxystrobin
Application Azoxystrobin residue, mg/kg
OAT STRAW, FORAGE Country
Year (variety)
Form g ai/L
kg ai/ha
kg ai/hL
Water L/ha
No./ max
PHI days
Straw Whole plant
(forage)
Author, Date
Study No.
250 SC 0.25 3 0 8.0
21 1.0
Germany 1994 (Salomon)
35 1.0
Sapiets 1995 RJ1870B
250 SC 0.25 3 0 8.1
21 1.5
Germany 1994 (Salomon) 36 1.5
Tillkes 1995 ZEN-9403
Table 114 Azoxystrobin residues in rye straw and forage from supervised trials in Germany
Application PHI days
Azoxystrobin residue, mg/kg
Author, Date
RYE STRAW, FORAGE Country
Year (variety)
Form g ai/L
kg ai/ha kg ai/hL
Water L/ha
No./ max
Straw Whole plant
(forage)
Study No.
0.25 3 0 5.4 21 1.4
Germany 1994
250 SC
35 42
1.7 2.7
Tillkes 1995 ZEN-9403
0.20 300 3 0 4.5
23 0.90
Germany 1995 (Rapid)
200 SC
35 44
1.2 2.0
Burke 1996 RJ2070B
Table 115 Azoxystrobin residues in triticale straw and forage from supervised trials in Germany
Application PHI days
Azoxystrobin residue, mg/kg
TRITICALE STRAW, FORAGE Country
Year (variety)
Form g ai/L
kg ai/ha kg ai/hL
Water L/ha
No./ max
Straw Whole plant (Forage)
Author, Date
Study No.
0.25 3 0 8.1
22 0.64
36 0.99
Germany 1994 (Modus)
250 SC
44 1.5
Sapiets 1995 RJ1870B
0.25 3 0 11
22 0.54
Germany 1994
250 SC
36 44
1.4 0.84
Tillkes 1995 ZEN-9403
Table 116 Azoxystrobin residues in wheat straw and forage from supervised trials in Europe
Application Azoxystrobin residue, mg/kg
WHEAT STRAW, FORAGE Country
Year (variety)
Form g ai/L
kg ai/ha
kg ai/hL
Water L/ha
No./ max
PHI days
Straw Whole plant
(Forage)
Author, Date
Study No.
250 SC 0.25 252 2 0a 2.6
0 6.3
7 5.4
14 1.2
28 1.5
Italy 2003 (Violet)
35 1.6
Benazeraf 2004 03-0306

Azoxystrobin 129
Application Azoxystrobin residue, mg/kg
WHEAT STRAW, FORAGE Country
Year (variety)
Form g ai/L
kg ai/ha
kg ai/hL
Water L/ha
No./ max
PHI days
Straw Whole plant
(Forage)
Author, Date
Study No.
250 SC 0.26 257 2 0a 2.8 0 7.0
7 4.0
14 1.8
28 2.4
Italy 2003 (Soisson)
35 3.8
Benazeraf 2004 03-0307
250 SC 0.26 261 2 0a 0.5
0 3.4
7 1.9
14 1.3
28 1.9
France (south) 2003 (Rapport)
35 3.5
Benazeraf 2004 03-0308
250 SC 0.25 249 2 0a 0.55
0 5.0
7 1.4
14 1.2
28 0.86
34 2.4
France (south) 2003 (Sezanne)
40 3.2
Benazeraf 2004 03-0309
250 SC 0.25 300 2 0a 0.32
0 5.0
7 1.6
14 0.45
28 0.35
35 0.58
France (north) 2003 (Apache)
48 0.75
Sole 2004 03-0403
250 SC 0.25 201 2 38 1.9 France (south) 2004 (Galibie)
47 2.0
Benazeraf 2005 04-0302
France (south) 2004 (Soissons)
250 SC 0.26 207 2 35 6.2 Benazeraf 2005 04-0302
250 SC 0.17 3 70 0.34 France 1993 (Soissons) 250 SC 0.25 3 70 1.1
Renard and Sapiets 1994 RJ1744B
250 SC 0.17 300 3 14 1
0.42 1.1
12 0.26
22 0.23
32 0.12
39 0.24
400 WG 0.25 300 3 14 1
0.61 1.0
12 0.44
22 0.29
32 0.17
France (south) 1993
(Soissons)
39 0.36
Atger et al. 1994 RJ1766B

130 Azoxystrobin
Application Azoxystrobin residue, mg/kg
WHEAT STRAW, FORAGE Country
Year (variety)
Form g ai/L
kg ai/ha
kg ai/hL
Water L/ha
No./ max
PHI days
Straw Whole plant
(Forage)
Author, Date
Study No.
250 SC 0.17 300 3 16 0.37 1 5.0
7 3.2
14 1.9
22 2.5
31 2.3
400 WG 0.25 300 3 16 0.41
1 5.8
7 3.2
14 2.7
22 2.4
France (south) 1993 (Florence-Aurore)
31 2.7
Atger et al. 1994 RJ1766B
250 SC 0.16 3 28 12 France 1993 (Manital) 400 WG 0.25 3 28 15
Sapiets et
al.
1995 RJ1775B
250 SC 0.17 3 35 0.98 France 1993 (Gala) 400 WG 0.25 3 35 2.3
Sapiets et
al.
1995 RJ1775B
250 SC 0.25 3 BLA 0
0.78 7.6
9 4.2
20 3.7
28 3.7
France 1994 (Manital)
35 1.8
Sapiets et
al.
1994 RJ1918B
250 SC 0.25 3 BLA 0
1.9 6.8
12 3.6
22 2.3
30 1.5
France 1994 (Courtot)
40 2.5
Sapiets et
al.
1994 RJ1918B
250 SC 0.25 3 BLA 0
2.0 8.3
12 2.0
22 0.97
30 0.76
France 1994 (Soisson)
40 1.7
Sapiets et
al.
1994 RJ1918B
250 SC 0.25 251 2 0a 0.48
0 8.5 7 1.8 14 1.3 28 1.3 35 1.9
Spain 2003 (Cartaya)
43 1.8
Benazeraf 2004 03-0310
250 SC 0.25 205 2 35 2.4 Spain 2004 (Kilopondio)
41 3.5
Benazeraf 2005 04-0303
Spain 2004 (Lanza)
250 SC 0.25 200 2 35 1.2 Benazeraf 2005 04-0303

Azoxystrobin 131
Application Azoxystrobin residue, mg/kg
WHEAT STRAW, FORAGE Country
Year (variety)
Form g ai/L
kg ai/ha
kg ai/hL
Water L/ha
No./ max
PHI days
Straw Whole plant
(Forage)
Author, Date
Study No.
250 SC 0.25 200 2 0a 0.30 0 3.2
7 0.61
14 0.32
28 0.29
35 0.65
United Kingdom 2003 (Tanker)
GS 67–69b
53 0.03
Sole 2004 03-0401
250 SC 0.25 200 2 0a 0.28
0 3.8
7 2.9
14 0.89
28 0.80
35 1.5
United Kingdom 2003 (Hereward)
GS 69b
58 1.6
Sole 2004 03-0402
250 SC 0.25 202 2 35 0.40 United Kingdom 2004 (Deben) GS 69b 61 1.6
Benazeraf 2005 04-0308
250 SC 0.25 198 2 35 0.51 United Kingdom 2004 (Hereward) GS 69b 50 1.5
Benazeraf 2005 04-0308
250 SC 0.17 3 14 0.94
1 6.4
10 5.0
23 1.4
31 1.0
GS 70–71b
59 2.7
250 SC 0.25 3 14 1.2
1 7.5
10 6.1
23 1.8
31 1.6
United Kingdom 1993 (Spark)
GS 70–71b
59 2.3
Hall et al.
1994 RJ1722B
250 SC 0.25 BLA 0
10
0.23 5.6 3.2
18 1.1
28 0.83
United Kingdom 1994 (Soisson)
3 GS 71b
40 1.6
Sapiets 1995 RJ1899
United Kingdom 1994 (Apollo)
250 SC 0.25 3 GS 65–
71b
48 5.7 Sapiets 1995 RJ1899
250 SC 0.25 BLA 0
10
0.52 5.9 1.7
19 1.5
28 1.3
United Kingdom 1994 (Beaver)
3 GS 69b
39 1.1
Sapiets 1995 RJ1899
250 SC 0.17 3 63 0.23 Germany 1993 (Orestis) 250 SC 0.25 3 63 0.24
Burke and Sapiets 1994 RJ1756B

132 Azoxystrobin
Application Azoxystrobin residue, mg/kg
WHEAT STRAW, FORAGE Country
Year (variety)
Form g ai/L
kg ai/ha
kg ai/hL
Water L/ha
No./ max
PHI days
Straw Whole plant
(Forage)
Author, Date
Study No.
250 SC 0.17 3 17 0.27 1 3.7
10 1.9
21 0.46
30 0.23
53 0.27
250 SC 0.25 3 17 0.56
1 4.8
10 2.5
21 0.90
30 0.50
Germany 1993 (Nandu)
53 0.54
Burke and Sapiets 1994 RJ1762B
250 SC 0.25 3 0 8.4
21 5.0
Germany 1994 (Mieka) 33 15
Sapiets 1995 RJ1870B
250 SC 0.25 0 11
21 2.7
Germany 1994 (Kraka) 35 1.7
Tillkes 1995 ZEN-9403
250 SC 0.27 247 2 0a 0.20
0 6.5
7 1.1
14 0.51
28 0.44
Switzerland 2003 (Levis)
35 0.58
Sole 2004 03-0404
250 SC 0.26 307 2 0a 0.18 0 3.2
7 1.1
14 0.87
Switzerland 2003 (Arina)
28 2.0 1.6
Sole 2004 03-0414
200 SC 0.20 400 2 35 0.41 Switzerland 2001 (Albis)
47 0.21
Pointurier 2002 2075/01
200 SC 0.20 400 2 35 0.46 Switzerland 2001 (Galaxy)
47 0.21
Pointurier 2002 2076/01
200 SC 0.20 400 2 35 0.22 Switzerland 2001 (Albis)
47 0.18
Pointurier 2002 2077/01
200 SC 0.20 400 2 35 0.41 Switzerland 2001 (Galaxy)
47 0.21
Pointurier 2002 2078/01
200 SC 0.20 300 3 0 4.8
21 0.59
Germany 1995 (Monopol) 36 0.50
Burke 1996 RJ2070B
200 SC 0.20 300 2 35 0.20 Germany 2001 (Aristos)
50 0.36
Simon 2002 gwh32401
Germany 2001 (Kornett)
200 SC 0.20 300 2 42 1.2 Simon 2002 gwh92401
France (south) 2001 (Apache)
200 SC 0.20 400 2 42 0.83 Pointurier 2002 0112901

Azoxystrobin 133
Application Azoxystrobin residue, mg/kg
WHEAT STRAW, FORAGE Country
Year (variety)
Form g ai/L
kg ai/ha
kg ai/hL
Water L/ha
No./ max
PHI days
Straw Whole plant
(Forage)
Author, Date
Study No.
France (south) 2001 (Apache)
200 SC 0.20 300 2 42 0.81 Pointurier 2002 0112902
France (south) 2001 (Eureka)
200 SC 0.20 400 2 42 2.4 Pointurier 2002 0113301
France (south) 2001 (Grazia)
200 SC 0.20 400 2 41 0.73 Pointurier 2002 0113302
a Before final application b Growth stage at the last application.
Table 117 Azoxystrobin residues in maize forage and fodder from supervised trials in the USA
Application Azoxystrobin residue, mg/kg
MAIZE FORAGE AND
FODDER Country
Year (variety)
Form g ai/L
kg ai/ha kg ai/hL
Water L/ha
No./ max
PHI days
Fodder Foragea
Author, Date
Study No.
United States New York, 1998 (Agway 257)
800 WG 0.28 8 6
7
4.8, 9.3
0.78, 0.83
Bussey, 1999 RR 99-050B
United States North Carolina 1998 (Pioneer 3167)
800 WG 0.28 8 6 1.8, 5.2
1.2, 1.2
Bussey, 1999 RR 99-050B
United States Florida, 1998 (Pioneer 3140)
800 WG 0.28 8 7 7.2, 7.8
3.6, 2.0
Bussey, 1999 RR 99-050B
United States Iowa, 1998 (N 46-40 BY)
800 WG 0.28 8 7 2.6, 1.9
0.88, 1.1
Bussey, 1999 RR 99-050B
United States Iowa, 1998 (NK 7070 BT)
800 WG 0.28 8 7 4.1, 4.4
0.66, 0.94
Bussey, 1999 RR 99-050B
United States Illinois, 1998 (Pioneer 3394)
800 WG 0.28 8 6
7
2.7, 3.2
0.95, 1.7
Bussey, 1999 RR 99-050B
United States Illinois, 1998 (Pioneer 3394)
800 WG 0.28 8 6
7
6.1, 8.7
0.56, 0.58
Bussey, 1999 RR 99-050B
United States Illinois, 1998 (Pioneer 3394)
800 WG 0.28 8 7 4.0, 3.0
0.46, 1.2
Bussey, 1999 RR 99-050B
United States Indiana, 1998 (Pioneer 33A14 Hybrid)
800 WG 0.28 8 6 4.4, 4.7
1.6, 2.8
Bussey, 1999 RR 99-050B
United States Indiana, 1998 (Pioneer 34G81 Hybrid)
800 WG 0.28 8 6 2.4, 2.5
3.8, 3.5
Bussey, 1999 RR 99-050B
United States Minnesota, 1998 (Pioneer 3568)
800 WG 0.28 8 7 1.1, 0.95
0.13, 0.49
Bussey, 1999 RR 99-050B

134 Azoxystrobin
Application Azoxystrobin residue, mg/kg
MAIZE FORAGE AND
FODDER Country
Year (variety)
Form g ai/L
kg ai/ha kg ai/hL
Water L/ha
No./ max
PHI days
Fodder Foragea
Author, Date
Study No.
United States Minnesota, 1998 (N 2555 Bt))
800 WG 0.28 8 6 2.5, 2.6
2.8, 2.2
Bussey, 1999 RR 99-050B
United States Missouri, 1998 (Pioneer 3568)
800 WG 0.28 8 6 3.1, 2.9
0.74, 1.5
Bussey, 1999 RR 99-050B
United States Nebraska, 1998 (Pioneer 3406)
800 WG 0.28 8 6 2.9, 2.6
1.8, 2.4
Bussey, 1999 RR 99-050B
United States Nebraska, 1998 (Pioneer 34R06)
800 WG 0.28 8 6
7
16, 8.4
2.8, 1.5
Bussey, 1999 RR 99-050B
United States Iowa, 1998 (DK 566)
800 WG 0.28 8 7 0.88, 0.85
0.65, 0.61
Bussey, 1999 RR 99-050B
United States Ohio, 1998 (Pioneer 3394)
800 WG 0.28 8 7 8.7, 5.8
2.5, 2.7
Bussey, 1999 RR 99-050B
United States Wisconsin, 1998 (NK 4242)
800 WG 0.28 8 6
7
5.3, 3.4
0.67, 1.0
Bussey, 1999 RR 99-050B
United States Texas, 1998 (Mycogen 2868)
800 WG 0.28 8 7 20, 21
2.8, 2.9
Bussey, 1999 RR 99-050B
United States Washington, 1998 (Hybritech Hybrid)
800 WG 0.28 8 7 3.5, 1.6
1.7, 7.2
Bussey, 1999 RR 99-050B
a Forage was harvested at the milk stage, 6–7 days after the 6th application of azoxystrobin.
Table 118 Azoxystrobin residues in rice straw from supervised trials in the USA
Application RICE STRAW Country
Year (variety)
Form g ai/L
kg ai/ha kg ai/hL
Water L/ha
Season Max
kg ai/ha
PHI days
Azoxystrobin residue, mg/kg
Author, Date
Study No.
United States Arkansas, 1995 (Kay Bonnet)
800 WG 0.22(2×)+0.34 0.78 27 4.2, 3.8
Sapiets 1996 RJ2201B
United States Arkansas, 1995 (Lemont)
800 WG 0.22(2×)+0.34 0.78 27 6.9, 5.0
Sapiets 1996 RJ2201B
United States Arkansas, 1995 (Lemont)
800 WG 0.22(2×)+0.34 0.78 28 3.2, 2.0
Sapiets 1996 RJ2201B
United States Louisiana, 1995 (Lemont)
800 WG 0.22(2×)+0.34 0.78 26 0.83, 0.84
Sapiets 1996 RJ2201B
United States Louisiana, 1995 (Cypress)
800 WG 0.22(2×)+0.34 0.78 27 0.52, 0.59
Sapiets 1996 RJ2201B
United States Louisiana, 1995 (Cypress)
800 WG 0.22(2×)+0.34 0.78 28 0.81, 0.91
Sapiets 1996 RJ2201B

Azoxystrobin 135
Application RICE STRAW Country
Year (variety)
Form g ai/L
kg ai/ha kg ai/hL
Water L/ha
Season Max
kg ai/ha
PHI days
Azoxystrobin residue, mg/kg
Author, Date
Study No.
United States Louisiana, 1995 (Cypress)
800 WG 0.22(2×)+0.34 0.78 28 3.5, 4.2
Sapiets 1996 RJ2201B
United States Mississippi, 1995 (Lemont)
800 WG 0.22(2×)+0.34 0.78 26 0.62, 0.57
Sapiets 1996 RJ2201B
United States Mississippi, 1995 (Lemont)
800 WG 0.22(2×)+0.34 0.78 27 2.4, 2.6
Sapiets 1996 RJ2201B
United States Mississippi, 1995 (Lemont)
800 WG 0.22(2×)+0.34 0.78 26 3.7, 4.1
Sapiets 1996 RJ2201B
United States Mississippi, 1995 (Lemont)
800 WG 0.22(2×)+0.34 0.78 28 1.5, 2.7
Sapiets 1996 RJ2201B
United States Missouri, 1995 (Allen)
800 WG 0.22(2×)+0.34 0.78 28 0.78, 0.71
Sapiets 1996 RJ2201B
United States Texas, 1995 (Cypress)
800 WG 0.22(2×)+0.34 0.78 26 5.0, 5.0
Sapiets 1996 RJ2201B
United States Texas, 1995 (Cypress)
800 WG 0.22(2×)+0.34 0.78 26 1.9, 1.5
Sapiets 1996 RJ2201B
United States California, 1995 (M-103)
800 WG 0.22(2×)+0.34 0.78 28 7.5, 10
Sapiets 1996 RJ2201B
United States California, 1995 (M-202)
800 WG 0.22(2×)+0.34 0.78 28 6.1, 6.4
Sapiets 1996 RJ2201B
Table 119 Azoxystrobin residues in sugar beet tops from supervised trials in the USA
Application SUGARBEET TOPS
Country Year
(variety)
Form g ai/L
kg ai/ha kg ai/hL
Water L/ha
No./ max
PHI days
Azoxystrobin residue, mg/kg
Author, Date
Study No.
United States Michigan, 1998 (E-4 Monitor Sugar )
800 WG 0.37 6 0 9.5, 7.7
Bussey 1999 RR99-036B
United States Minnesota, 1998 (Crystal 222)
800 WG 0.37 6 0 8.7, 8.3
Bussey 1999 RR99-036B
United States Minnesota, 1998 (Monohikari)
800 WG 0.37 6 0 25, 17
Bussey 1999 RR99-036B
United States Minnesota, 1998 (Beta seed Kw 1880)
800 WG 0.37 6 0 20, 22
Bussey 1999 RR99-036B
United States Montana, 1998 (Ach 192)
800 WG
0.37 6 0 4.6, 5.8
Bussey 1999 RR99-036B

136 Azoxystrobin
Application SUGARBEET TOPS
Country Year
(variety)
Form g ai/L
kg ai/ha kg ai/hL
Water L/ha
No./ max
PHI days
Azoxystrobin residue, mg/kg
Author, Date
Study No.
United States North Dakota 1998 (Monohikari)
800 WG
0.37 6 0 16, 12
Bussey 1999 RR99-036B
United States Colorado, 1998 (Seedex XI)
800 WG
0.37 6 0 11, 9.2
Bussey 1999 RR99-036B
United States California, 1998 (Ss-7B1r)
800 WG
0.37 6 0 16, 13
Bussey 1999 RR99-036B
United States Idaho, 1998 (P-M9 Hilleshog)
800 WG
0.37 6 0 44, 31
Bussey 1999 RR99-036B
Table 120 Azoxystrobin residues in dried hops from supervised trials in Germany and the UK
Application DRIED HOPS Country
Year (variety)
Form g
ai/L
kg ai/ha kg ai/hL
Water L/ha
No./ max
PHI days
Azoxystrobin residue, mg/kg
Author, Date
Study No.
United Kingdom 1998 (Whitbread Golding)
250 SC
0.4 6 28 1.1 Lister 1999 RJ2801B
United Kingdom 1998 (Target)
250 SC
0.4 6 28 1.3 Lister 1999 RJ2801B
United Kingdom 1999 (Whitbread Golding)
250 SC
0.2 (2×)+ 0.3(2×)+ 0.4
(2×)
0.015 1410–2700
6 27 0.83 Gill 2000 RJ2981B
United Kingdom 1999 (Target)
250 SC
0.2 (2×)+ 0.3(2×)+ 0.4
(2×)
0.015 1410–2700
6 28 2.2 Gill 2000 RJ2981B
Germany 1998 (Perle)
250 SC
0.25 (2×)+ 0.30 (2×)+ 0.40 (2×)
0.015 1500– 2700
6 28 5.7 Gill 1999 RJ2841B
Germany 1998 (Hallertauer Magnum)
250 SC
0.23 (2×)+ 0.30 (2×)+ 0.41 (2×)
0.015 1500– 2700
6 26 11 Gill 1999 RJ2841B
Germany 1999 (Perle)
250 SC
0.25 (2×)+ 0.36 (2×)+ 0.45 (2×)
0.015 1500– 2700
6 28 10, 11
Gill 2000 RJ3015B
Germany 1999 (Spalter Select)
250 SC
0.25 (2×)+ 0.36 (2×)+ 0.45 (2×)
0.015 1500– 2700
6 26 12, 12
Gill 2000 RJ3015B
Fate of residues in storage and processing
In storage
No information was received on residues of azoxystrobin during periods of storage representing a normal commercial practice.
In processing
The Meeting received information on the fate of azoxystrobin residues during processing of oranges, grapes, plums, tomato, barley, maize, rice, wheat, soybeans, sunflower, and peanuts and on azoxystrobin fate under hydrolysis conditions simulating commercial food processing.

Azoxystrobin 137
A hydrolysis study was carried out to assess the possible breakdown or reaction products from azoxystrobin residues in the raw products during processing (Grout, 2002; RJ3296B). [14C-Phenylacrylate]azoxystrobin was incubated in aqueous buffer solutions at a nominal concentration of 5 mg/L under three sets of conditions, each designed to simulate an appropriate process: 90 °C (pH 4, 20 min) to simulate pasteurization, 100 °C (pH 5, 60 min), to simulate boiling, baking and brewing, and 120 °C (pH 6, 20 min.) to simulate sterilization. Radioactive components were characterized by fractionation and co-chromatography with authenticated reference compounds using TLC and bio-imaging and/or HPLC. Control samples were prepared for each buffer and maintained at ambient temperature for one hour.
After incubation, total recoveries of applied radioactivity ranged from 98% to 105% for all samples (see Table 121). The recovery for the controls was between 97% and 103% and indicated no degradation of azoxystrobin. Mean values of amounts of azoxystrobin remaining after incubation were 101% at pH 4, 97% at pH 5, and 98% at pH 6. No breakdown or reaction products were formed during hydrolysis of azoxystrobin under representative processing conditions.
Table 121 Azoxystrobin and total radioactivity recovery in a hydrolysis study simulating typical processing conditions
% of applied radioactivity Component pH 4, 90 ºC, 20 min
(pasteurization) pH 5, 100 ºC, 60 min
(boiling, baking, brewing) pH 6, 120 ºC, 120 min
(sterilization) Azoxystrobin 100 102 96 97 96 99 Total radioactivity 102 105 98 100 99 101
Processing of oranges
A processing study was carried out during 1998 from oranges obtained in a trial in the USA (Bussey and Hampton, 1999; RR-99-017B). Six applications of azoxystrobin formulated as a 800 g ai/kg WG was applied to orange trees at the rate of 0.28 kg ai/ha. Applications were made at intervals of 6–8 days, with the last application on the day of harvest (a PHI of 0 days). Oranges were processed to dried pulp, cold-pressed oil, and fresh juice.
Processing followed commercial practices. Oranges were washed with agitation for about 30 seconds and juice was extracted from the washed fruits with a commercial in-line juice extractor. An emulsion consisting of extracted oil, water, and peel frits was collected. The juice stream was passed through a finisher, which screens extra pulp from the juice. The juice was then collected. The oil, water and peel frits emulsion was also passed through another finisher to separate the peel frits from the oil-water emulsion. The peel frits were collected. The oil-water emulsion was further screened and the emulsion allowed to separate for about five hours. After removing water, the emulsion was centrifuged and the cold-pressed oil was further purified by sequential freezing, thawing, filtering, and adding anhydrous sodium sulfate to remove remaining water. The final mass of oil fraction was then removed. The dried pulp, juice, and oil were packed and shipped frozen to the laboratory where they were maintained frozen until analysis for about 285 days. Azoxystrobin residues and processing factors are summarized in Table 122.
Table 122 Azoxystrobin residues in orange and processed fractions
Processed Fractions
Azoxystrobin residues mg/kg
Processing factor Reference
Orange (RAC) 0.11, 0.12 (0.12)
Bussey and Hampton, 1999 RR 99-017B
Dried pulp 0.23, 0.23 (0.23)
1.9
Cold-pressed oil 0.55, 0.59 (0.57)
4.8
Juice < 0.01, < 0.01 (< 0.01)
< 0.08

138 Azoxystrobin
Processing of grapes
In two trials conducted in France in 1993, azoxystrobin was applied eight times using either a 0.025 kg ai/hL spray concentration (500 WG formulation) or a 0.017 kg ai/hL spray concentration (250 SC formulation) (Sapiets, et al., 1995; RJ1815B). Two similar trials were conducted in Italy during the same period (Bonfanti, et al., 1995; RJ1739B). Samples of ripe fruits were taken for processing at harvest, 21 days after the final application. Samples of the raw agricultural commodity (RAC) were frozen and sent to the laboratory where they remained frozen until analysis (ten months for the Italian trials and 12 months for the trials in France). Samples for processing were transported in refrigerated vans to the processing facility. Grapes were processed into wine following commercial practices. Samples of processed fractions were taken and stored frozen for analysis. Azoxystrobin residues and processing factors are summarized in Table 123.
Table 123 Azoxystrobin residues in grapes and processed fractions obtained in trials in France (Sapiets et al., 1995; RJ1815B) and Italy (Bonfanti et al., 1995; RJ1739B)
Azoxystrobin residues (mg/kg) Processing factors
0.017 kg ai/hL 0.025 kg ai/hL 0.017 kg ai/hL 0.025 kg ai/hL
Processed fractions
France Italy France Italy France Italy France Italy
Median
Grapes (RAC) 0.23 0.23 0.37 0.32
Must 0.08 0.16 0.12 0.29 0.35 0.70 0.32 0.91 0.52
Pomace 0.39 0.87 0.92 1.5 1.7 3.8 2.5 4.7 3.1
Wine 0.11 0.2 0.13 0.33 0.48 0.87 0.35 1.0 0.67
Pasteurized wine 0.07 0.13 0.19 0.32 0.30 0.57 0.51 1.0 0.54
Distillate < 0.01 < 0.01 < 0.01 < 0.01 < 0.04 < 0.04 < 0.03 < 0.03 < 0.04
Spirit < 0.01 < 0.01 < 0.01 < 0.01 < 0.04 < 0.04 < 0.03 < 0.03 < 0.04
Stem 1.1 0.97 2.2 1.3 4.8 4.2 5.9 4.1 4.5
Skin 0.53 0.49 0.73 0.57 2.3 2.1 2.0 1.8 2.1
Juice 0.09 0.08 0.14 0.08 0.39 0.35 0.38 0.25 0.36
Dry pomace 1.2 1.3 1.8 1.1 5.2 5.7 4.9 3.4 5.0
The effect of drying on residues of azoxystrobin on grapes has been investigated in the USA in 1994 (Sapiets and Roper, 1995; RJ1863B). Azoxystrobin was applied six times to grape vines at the rate of 0.28 kg ai/ha and samples of mature fruits were taken for analysis 19 days after the final application. A second sample was taken at the same time and dried in the sun to produce raisins. Azoxystrobin residues and processing factors are summarized in Table 124.
Table 124 Azoxystrobin residues in raisins after processing from treated grapes
Processed Fractions
Residues mg/kg
Processing factor Reference
Grapes (RAC) 0.71
Raisin 0.32 0.45
Raisin waste 8.9 13
Sapiet and Roper 1995 RJ1863
Processing of plums
A processing study was carried out in plums during 1997 in the USA (Bussey, 1998; RR 98-015B). Eight applications of azoxystrobin (formulated as an 800 WG formulation) were applied to plum trees at the rate of 0.28 kg ai/ha. Treatments were made at intervals of 7–10 days, with the sixth application made 20 days before harvest. Samples of plums were collected six days after the last application and were processed to prunes, following commercial procedures. Fresh plums were washed in cold water for five minutes. Stems, leaves and other debris were removed. The washed fruit was then placed on

Azoxystrobin 139
trays in an air dryer at 75 ºC and dried for 23 hours to a moisture content of 27% (untreated prunes) or 20% (treated pruned). The commercial standard is 19–29% moisture. After cooling, the dried prunes were frozen for about 72 days until analysis. Azoxystrobin residues and processing factors are summarized in Table 125.
Table 125 Azoxystrobin residues in prunes after processing from treated plums
Processed Fractions
Residues mg/kg
Processing factor Reference
Plums (RAC) 0.31, 0.30 (0.31)
Prunes 0.06, 0.05 (0.06)
0.19
Russey, 1995 RR 98-015B
Processing of tomato
Two processing trials on tomatoes were carried out in Italy during 1997 (Clarke and Bofanti, 1998; RJ2488B). Six to seven applications of a 250 SC formulation of azoxystrobin were applied at 0.025 kg ai/hL. Duplicate samples of fruit were taken three days after the final application and were analysed for azoxystrobin. Additional samples were taken and sent for processing.
Processing was performed following commercial practices. The tomatoes were washed using cold water and a sample was taken and frozen for analysis. Washed tomatoes were dipped four times in boiling water for 20 seconds. After draining the tomatoes were peeled and allowed to cool. Samples of peeled tomato and tomato peel were frozen for analysis. The following processed samples were prepared:
(i) Tomato puree samples were prepared by washing the whole fruit and placing in a cutter/mixer which was warmed to 70 ºC for 20 minutes. The heated crushed tomatoes were then pressed through a sieve and the resulting puree was concentrated at 90–93 ºC and allowed to cool. The puree sample was frozen for analysis.
(ii) Tomato ketchup samples were prepared by washing whole tomatoes, heating in the cutter/mixer, sieving and then adding water, vinegar, sodium chloride, sugar and starch. This mixture was homogenized, concentrated at 90–93 ºC and then allowed to cool. The resulting tomato ketchup was frozen for analysis.
(iii) Tomato juice was produced by extracting washed tomato fruit using a juice extractor. The juice was warmed to 80 ºC for ten minutes. After cooling the juice was frozen for analysis.
(iv) Tomato conserve samples were prepared by dipping washed whole fruits in boiling water (90–95 ºC) for 20 seconds. After peeling, the fruits were placed under water and sterilized for 45 minutes at 90–95 ºC. On cooling, the conserved tomato samples were frozen for analysis.
A trial was also carried out in 1994 in the US (Sapiets and Roper, 1996; RJ2006B). Azoxystrobin was applied eight times at approximately weekly intervals up to harvest, at the rate of 0.12 kg ai/ha. Mature fruits were taken one day after the final application and the fruits were processed into juice, puree, paste, wet and dry pomace, following commercial practices. Residues of azoxystrobin were determined in each processed fraction.
In general, processing procedures were similar to the above, except that the juice went through the canning process. The preparation of tomato puree also differed from that previously described above. A portion of the juice was concentrated to produce puree. The juice was placed in a vacuum evaporator and recirculated until the natural tomato soluble solids had reached the desired value for puree. A portion of the resulting puree was placed in a steam jacket kettle and heated to 190 ºF. The heated puree was placed in cans, the cans sealed, cooled in a water bath and then placed

140 Azoxystrobin
in a freezer. The remaining puree was placed back in the evaporator and condensed further to paste and then canned.
Table 126 Azoxystrobin residues in tomatoes and processed fractions obtained in two trials in Italy (Clarke and Bofanti, 1998; RJ2488) and one trial in the USA (Sapiets and Roper, 1996; RJ2006B)
Azoxystrobin residues (mg/kg) Processing factors Processed fractions Italy Italy USA Italy Italy USA Mediana Tomato (RAC) 0.07 0.11 0.05 Washed tomato 0.05 0.07 0.71 0.64 0.68 Peeled tomato < 0.01 < 0.01 < 0.14 < 0.09 < 0.12 Peel 0.13 0.14 1.9 1.3 1.6 Puree 0.1 0.06 0.04 1.4 0.55 0.80 0.80 Paste 0.13 2.6 2.6 Ketchup 0.04 0.04 0.57 0.36 0.47 Juice 0.02 0.04 0.02 0.29 0.36 0.40 0.36 Conserve < 0.01 < 0.01 < 0.14 < 0.09 < 0.12 Wet pomace 0.46 9.2 9.2 Dry pomace 1.2 24 24
aAverage calculated for two values.
Processing of barley into beer
A processing study was carried out in the UK in 1996 (Sapiets and Hall, 1998; RJ2452B). Azoxystrobin was applied twice as a 250 g ai/L SC formulation at the rate of 0.25 kg ai/ha followed by an application at 0.50 kg ai/ha. Grain samples taken 7–8 weeks after the final application were sent for processing into beer, following commercial practices.
Grain was malted using alternate wet/dry schedule at 15–17.5 ºC, then allowed to germinate for five days at a temperature rising from 15 to 21 ºC. Samples of malt and rootlets, which had been separated from the kilned malt, were taken and frozen. The malted grain was mashed at 64 ºC for an hour, then hops were added and the resulting wort heated to boiling. The mixture was allowed to cool, the accumulated sediment removed, and the wort inoculated with yeast and left to ferment for six days. The spent yeast was removed and a sample taken for analysis. The resulting beer was left to mature for two weeks then filtered and bottled.
Table 127 Azoxystrobin residues in barley grain and processed fractions in beer production
Processed Fractions
Azoxystrobin residues (mg/kg)
Processing factor Reference
Barley grain 0.40 Roots 0.18 0.45 Malt 0.04 0.10 Spent grain 0.06 0.15 Beer 0.01 0.03
Sapiets and Hall 1998 RJ2452B
Processing of maize
A processing study using dry and wet milling was conducted in 1998 on maize grain from a single trial in the US (Bussey and Aston, 1999; RR 99-056B). Azoxystrobin was applied eight times at the rate of 1.4 kg ai/ha and maize grain was harvested six days after the last application. Maize grain samples were processed using both dry milling and wet milling procedures, following commercial practices in the USA. The resulting processed commodities from wet milling were starch and refined oil. Meal, grits, flour, and refined oil were produced from dry milling. Aliquots of unprocessed grain and processed commodities were analysed for residues of azoxystrobin (see Table 128).
In dry milling, the maize grain adjusted to 20–22% moisture was impact milled and the resulting cornstock dried at 54–70 ºC. The dried cornstock was screened to produce hulls, grit, meal, flour and germ. The germ was heated to 71–79 ºC, flaked and then extracted with hexane at 50–60 ºC.

Azoxystrobin 141
Crude oil was recovered from the miscella by heating to 73–90 ºC. Refined oil was produced by adding sodium hydroxide and separating the soapstock.
In wet milling, maize grain was steeped in water containing 0.1–0.2% sulfur dioxide at 50–54 ºC for about 46 hours. The steeped grain was milled and then centrifuged to separate the germ and hulls from the cornstock. The cornstock was screened and centrifuged to produce starch. The germ and hulls were dried and aspirated to remove the hulls. The germ was conditioned to 12% moisture, heated to 88–104 ºC, flaked and then expelled to produce crude oil and presscake. The presscake was extracted with hexane at 50–60 ºC. Crude oil was recovered from the miscella by heating to 73–90 ºC. Refined oil was produced by adding sodium hydroxide and separating the soapstock.
Table 128 Azoxystrobin residues in maize grain and processed fractions in wet and dry milling
Processed Fractions Azoxystrobin residues (mg/kg)
Processing factor Reference
Wet milling: Grain 0.11 Refined oil 0.67 6.1 Starch < 0.01 < 0.09
Bussey and Aston 1999 RR 99-056B
Dry milling: Grain 0.11 Meal 0.06 0.55 Grits 0.03 0.27 Flour 0.08 0.73 Refined oil 0.07 0.64
Bussey and Aston 1999 RR 99-056B
Processing of rice
A processing study was conducted on rice in the USA during 1995 (Sapiets and Roper, 1996; RJ2205B). Azoxystrobin was applied twice as a WG formulation at the rate of 0.22 kg ai/ha and once at full heading at 0.34 kg ai/ha. Samples of grain were taken 28 days after the final application.
Rough rice samples were dried in an oven between 43–60 ºC. The final moisture content after drying was 13%. After aspiration and screening, foreign particles were removed from the rice. The sample was passed through a dehuller to remove and separate the hull from brown rice. A sample of rice hulls was taken and frozen for analysis. The brown rice was then decorticated in an abrasion mill and passed through a screen to separate white milled rice (polished), which remained on top of the screen, from the bran, which passed through the screen. The process was repeated until the total amount of bran was 11–17% of the starting brown rice weight. Samples of polished rice and bran were placed in containers until analysis in about 11 months.
Table 129 Azoxystrobin residues in rice grain and processed fractions
Processed Fractions
Azoxystrobin residues (mg/kg)
Processing factor Reference
Rice grain 0.33 Polished rice 0.03 0.09 Hulls 1.6 4.8 Bran 0.39 1.2
Sapiets and Roper 1996 RJ2205B
Processing of wheat
Two processing studies were conducted on wheat grain in Germany, one in 1995 and the other in 1996 (Sapiets, et al, 1996; RJ2065B; Clarke, et al., 1997 RJ2297B). In the 1995 study, wheat grain samples were taken at harvest from a field treated with three applications of a 250 SC formulation at the rate of 0.25 kg ai/ha. In the 1996 study, wheat grain samples were taken at harvest from a field treated with three applications of azoxystrobin at the rate of 0.50 g ai/ha.
In both studies the grain sample was cleaned by sieving and blowing and the cleaned grain tempered to a moisture content of 16%. The grain was broken three times in a roller mill to produce

142 Azoxystrobin
wholemeal flour. A second sample was ground and separated into bran (> 710 micron particle size), shorts, and flour using a sieve. Samples of each fraction were collected and frozen for analysis. Storage period from processing to analysis was about five months.
In the 1995 trial, azoxystrobin residues in the wheat grain sample before processing was at the LOQ of 0.01 mg/kg. No measurable residues were found in most fractions and processing factors could not be calculated. Results from the 1996 trial conducted at 200% GAP rate are summarized in Table 130.
Table 130 Azoxystrobin residues in wheat grain and processed fractions
Processed Fractions
Residues mg/kg
Processing factor Reference
Grain 0.08 Wholemeal flour 0.02 0.25 Bran 0.03 0.38 Shorts 0.01 0.13 Low grade flour 0.02 0.25 Patent flour 0.02 0.25 Wholemeal bread < 0.01 < 0.13 Flour bread 0.01 0.13
Clarke and Chamier 1997 RJ2297B
Processing of cottonseed
A processing study on cottonseed was carried out in the US during 1997 (Bussey, et al., 1998; RR 98-058B). Cottonseed samples were obtained from a trial in which a single in-furrow application of azoxystrobin was made at 500% GAP rate. The seed was processed to produce hulls, meal, and refined oil, following commercial practices.
No sample of undelinted seed, hulls, meal or refined oil contained residues of azoxystrobin at or above the limit of quantitation of 0.01 mg/kg.
Processing of soya beans
A processing study was carried out on soya beans in the USA during 1998 (Bussey and Lipton, 1999; RR 99-051B). Samples of soya beans harvested 12 days after the final application of a treatment regime consisting of six applications of azoxystrobin at 500% GAP rate (1.4 kg ai/ha) were processed to hulls, meal, and refined oil, following commercial practices.
Soya beans were dried at 54–71 ºC to a moisture content of 7–10%. After removal of foreign particles, the whole soybeans were milled to crack the hull and liberate the kernel. Hulls were separated by aspiration. The kernels were heated to 71–79 °C, flaked, steam expanded and dried at 54–71 °C. The resulting collets were extracted with hexane at 50–54 °C three times, dried, and ground to meal. Crude oil was recovered from the miscella by heating to 73–90 °C and refined oil produced by adding sodium hydroxide followed by separating and removing the soapstock. All processed fractions were frozen for analysis. Samples were stored frozen for 250–260 days between sampling and extraction. The results are summarized in Table 132.
Table 131 Azoxystrobin residues in soya beans and processed fractions
Processed Fractions
Azoxystrobin residues mg/kg
Processing factor Reference
Soya bean seed 0.44 Hulls 0.96, 1.0
(0.98) 2.2 Meal 0.04, 0.04
(0.04) 0.09 Refined oil 0.33, 0.35
(0.34) 0.77
Bussey and Lipton 1999 RR 99-051B

Azoxystrobin 143
Processing of sunflower
A processing study on sunflower seeds was carried out in the US during 2000 (Judy, et al., 2001; RR 00-059B). Sunflower seeds were obtained from a field trial receiving treatments of azoxystrobin at 500% the annual GAP rate (2.5 kg ai/ha). Samples of sunflower seeds were collected at 28–30 days after the final application.
Sunflower seeds were dried at 55–71 °C to a moisture content of 7–10%. After aspiration and screening, large and small foreign particles were removed. The sunflower seeds were then fed into a disc mill to crack the hull and liberate the kernels. The hulls were separated from the kernels by further aspiration and screening. The kernels were conditioned to 12% moisture, heated to 88–105 °C, and pressed in an expeller to liberate a majority of the crude oil. The presscake was submerged in hexane at 49–60 °C and the resulting miscella further extracted with hexane to obtain crude oil. The crude oil was then heated to 75–90 °C to remove the hexane. Crude oil from the expeller and solvent extraction were combined and refined. Samples of sunflower seeds and the processed fractions were stored frozen until analysis. The results are summarized in Table 132.
Table 132 Azoxystrobin residues in sunflower and processed fractions
Processed Fractions
Azoxystrobin residues (mg/kg)
Processing factor Reference
Sunflower seeds 0.14, 0.11 (0.13)
Meal < 0.01, < 0.01 (< 0.01) < 0.08
Oil, refined 0.02, 0.02 (0.02) 0.15
Judy, et al. 2001 RR 00-059B
Processing of peanuts
A processing study on peanuts was carried out in the USA in 1994 (Sapiets and Roper, 1996; RJ1980B). Samples of mature whole peanuts harvested from a field trial, in which azoxystrobin was applied twice at a rate of 2.5 kg ai/ha (550% the US GAP rate), were processed to meal and oil, following commercial practices.
Samples were shelled in a mechanical sheller to remove the hulls from the nutmeats (kernels). The resulting kernels were conditioned to 12% moisture, heated to 93–104 ºC and pressed in an expeller to liberate part of the crude oil. The resulting presscake was flaked and extracted with heated hexane to remove remaining crude oil. The crude oil from the expeller and the solvent extraction were combined and heated to 20–24 ºC and sodium hydroxide was added. The mixture was heated to a final temperature of 63–67 ºC and allowed to stand for 12 hours. The refined oil was decanted from the sediment in the bottom of the container. Samples of each processed fraction were frozen until analysis in about 13 months from the time of sampling. The results are summarized in Table 133.
Table 133 Azoxystrobin residues in peanuts and processed fractions
Processed Fractions
Azoxystrobin residues (mg/kg)
Processing factor Reference
Nutmeat 0.01 Meal 0.01 1.0 Crude oil 0.04 4.0 Refined oil 0.03 3.0
Sapiets and Roper 1996 RJ1980B
RESIDUES IN ANIMAL COMMODITIES
Farm animal feeding studies
The Meeting received information on lactating dairy cow and laying hen feeding studies.

144 Azoxystrobin
Lactating dairy cows.
A feeding study was carried out in the United Kingdom between 1994 and 1995 (Sapiets and Ryan, 1995; RJ1878B) on five groups of three Frisian cows that were fed 0, 5, 25, 75 and 250 mg azoxystrobin/kg diet for up to 30 consecutive days. The doses were administered in corn oil twice daily at milking. Milk samples were taken twice a day and the daily production bulked into one single sample per cow. Milk samples were analysed for azoxystrobin on Days 1, 3, 5, 7, 12, 14, 17, 21, 16, and 30 after start of dosing. Samples of milk collected on Days 21–23 were processed into cream and skimmed milk. Average fat contents in the whole milk and cream were 3.7% and 55%, respectively. At the end of the treatment period, between Days 29 and 31, the cows were sacrificed and samples of muscle (meat), liver, kidney and fat were taken and analysed for residues of azoxystrobin. Residues of azoxystrobin were determined in the tissues and milk by method RAM 255, which had previously been validated with an LOQ of 0.01 mg/kg for animal tissue samples and 0.001 mg/kg for milk.
No effects upon milk yields or general health of the animals were observed throughout the study period. Table 134 summarizes the residues of azoxystrobin obtained in milk fed with diet containing azoxystrobin. Table 135 gives azoxystrobin residues in cream and skimmed milk. Table 136 provides azoxystrobin residues in tissues. No residues above the LOQ were found in the meat (muscle) from any azoxystrobin dose.
Table 134 Azoxystrobin residues (in mg/kg) in milk of cows fed with diet containing azoxystrobin for 30 consecutive days (mean and highest residues from three cows per each dose)
Dose rate 5 mg/kg 25 mg/kg 75 mg/kg 250 mg/kg
Days of dosing
Mean Highest Mean Highest Mean Highest Mean Highest 1 < 0.001 < 0.001 0.004 0.006 0.001 0.001 0.003 0.004 3 0.001 0.001 0.002 0.003 0.003 0.004 0.006 0.009 5 < 0.001 < 0.001 0.003 0.003 0.002 0.003 0.005 0.006 7 0.002 0.003 0.002 0.002 0.002 0.002 0.005 0.007
12 0.001 0.001 0.001 0.001 0.001 0.002 0.003 0.005 14 NA NA 0.003 0.003 0.001 0.002 0.005 0.006 17 < 0.001 < 0.001 0.001 0.001 0.002 0.002 0.004 0.007 21 0.003 0.003 0.001 0.001 0.001 0.002 0.004 0.005 26 0.002 0.003 0.002 0.003 0.002 0.002 0.003 0.005 30 0.002 0.003 0.003 0.003 0.001 0.002 0.003 0.003
NA=not analysis done
Table 135 Azoxystrobin residues (in mg/kg) in skimmed milk and cream obtained from milk collected on Days 21–23
Azoxystrobin dose (mg/kg)
Skimmed milk (mg/kg)
Cream (mg/kg)
5 < 0.001, < 0.001, < 0.001 (< 0.001)
< 0.01, < 0.01, < 0.01 (< 0.01)
25 < 0.001, < 0.001, < 0.001 (< 0.001)
< 0.01, < 0.01, < 0.01 (< 0.01)
75 0.001, < 0.001, < 0.001 (0.001)
0.02, 0.01, 0.01 (0.01)
250 0.001, 0.002, 0.003 (0.002)
0.04, 0.03, 0.02 (0.03)
Table 136 Azoxystrobin residues (in mg/kg) in tissues of cows fed with diet containing azoxystrobin for 30 consecutive days (mean and highest residues from three cows per each dose)
Tissue Dose mg/kg Adductor
muscle (mg/kg) Pectoral muscle (mg/kg)
Liver (mg/kg)
Kidney (mg/kg) Peritoneal fat (mg/kg)
Subcutaneous fat (mg/kg)

Azoxystrobin 145
highest mean highest mean highest mean highest mean highest mean highest mean
5 < 0.01 < 0.01 < 0.01 < 0.01 < 0.01 < 0.01 < 0.01 < 0.01 < 0.01 < 0.01 < 0.01 < 0.01
25 < 0.01 < 0.01 < 0.01 < 0.01 0.01 0.01 < 0.01 < 0.01 < 0.01 < 0.01 < 0.01 < 0.01
75 < 0.01 < 0.01 < 0.01 < 0.01 0.05 0.03 0.01 0.01 0.03 0.02 0.02 0.02
250 < 0.01 < 0.01 < 0.01 < 0.01 0.07 0.05 0.02 0.02 0.03 0.02 0.02 0.01
Laying hens
A feeding study was conducted in the USA in 1996 (Sapiets and Farrelly, 1997; RJ2349B) on four groups of 12 hens (Gallus gallus domesticus) fed for 28 consecutive days on standard layer ration, which had been fortified with azoxystrobin. The birds were divided into three pens holding four birds each. Each group was fed with a nominal dose rate of 6, 18, or 60 mg azoxystrobin/kg diet. An additional 12 birds were fed with untreated ration over the same period as controls.
Eggs were collected twice daily and the total daily production for each group bulked. On Day 21, the eggs were separated into yolk and egg white. At the end of the treatment period, and within seven hours of withdrawal of the test diets, the birds were slaughtered. Samples of liver, fat, muscle (breast and thigh meat) were taken as soon as possible after slaughter and deep frozen prior to analysis. Three samples were collected per treatment group. All samples were maintained frozen for three months prior to analysis. Samples of eggs and tissues were analysed for azoxystrobin residues by method RAM 255, which had previously been validated with an LOQ of 0.01 mg/kg for all matrices.
Tables 137 and 138 give results for the eggs and tissues, respectively, for the highest feeding rate of 60 mg/kg. No measurable residues of azoxystrobin above the LOQ of the method (0.01 mg/kg) were found in any sample from the highest feeding rate of 60 mg/kg. Therefore, no further analyses were carried out on the samples from the lower dose rate groups.
Table 137 Azoxystrobin residues (in mg/kg) in eggs of hens fed with diet containing azoxystrobin at 60 mg/kg for 28 consecutive days
Group 4 receiving 60 mg/kg dose rate Sampling interval (days)
Control Group
Replicate 1 Replicate 2 Replicate 3
1 < 0.01 < 0.01 < 0.01 < 0.01
3 – < 0.01 < 0.01 < 0.01
7 – < 0.01 < 0.01 < 0.01
10 – < 0.01 < 0.01 < 0.01
14 < 0.01 < 0.01 < 0.01 < 0.01
18 < 0.01 < 0.01 < 0.01 < 0.01
25 < 0.01 < 0.01 < 0.01 < 0.01
28 < 0.01 < 0.01 < 0.01 < 0.01
21/ Egg Yolk – < 0.01 < 0.01 < 0.01
21/ Egg White < 0.01 < 0.01 < 0.01 < 0.01
Table 138 Azoxystrobin residues (in mg/kg) in tissues of hens fed with diet containing azoxystrobin at 60 mg/kg for 28 consecutive days
Control Group Group 4 receiving 60 mg/kg dose rate Tissue
Replicate 1 Replicate 2 Replicate 3 Replicate 1 Replicate 2 Replicate 3
Meat < 0.01 < 0.01 < 0.01 < 0.01 < 0.01 < 0.01
Liver < 0.01 < 0.01 < 0.01 < 0.01 < 0.01 < 0.01
Fat < 0.01 < 0.01 < 0.01 < 0.01 < 0.01 < 0.01

146 Azoxystrobin
RESIDUES IN FOOD IN COMMERCE OR AT CONSUMPTION
No information was received on residues of azoxystrobin in food in commerce or at consumption.
APPRAISAL
Azoxystrobin is a broad-spectrum fungicide belonging to the class of methoxyacrylates, which are synthetic analogues from the naturally-occurring strobilurin fungi. It exerts its fungicidal activity by inhibiting mitochondrial respiration in fungi. At the 39th Session2 of the CCPR, azoxystrobin was scheduled for the evaluation as a new compound by the 2008 JMPR.
Chemical name
ISO common name: Azoxystrobin
IUPAC: Methyl (E)-2-{2 [6-(2-cyanophenoxy)pyrimidin-4-yloxy]phenyl}-3-methoxyacrylate
CA: Methyl(E)-2-[[6-(2-cyanophenoxy)-4-pyrimidinyl]oxy]-α-(methoxymethylene)benzeneacetate
O
NN
O
OCH3CN
O
CH3O
Animal metabolism
The Meeting received results of animal metabolism studies in lactating goats and laying hens.
Lactating goats were dosed twice daily at each milking with either cyanophenyl-, pyrimidinyl, or phenylacrylate-[14C]labelled azoxystrobin in gelatine capsules at a nominal rate of 25 ppm in the diet (on a dry weight basis) for seven consecutive days, corresponding to a daily dose of approximately 1 mg/kg bw. The actual dose rate was equivalent to 23–33 mg/kg in the diet. The majority (90–93%) of the administered radiolabelled doses were recovered. The primary route of excretion was via the faeces (62–72% of the administered doses). Excretion via the urine accounted for a further 18–24% of the administered doses, resulting in total of 83–92% of the administered doses being excreted in faeces and urine. The TRR in milk, muscle and fat were very low (0.004–0.025 mg/kg of azoxystrobin equivalents), corresponding to < 0.01% of the administered doses. Characterization of these radioactive residues by fractionation showed that they were unlikely to be attributed to any individual compound at a significant level. Radioactivity in milk reached a plateau of only 0.01 mg/L after 3–4 days of dosing.
In tissues and organs, most of the radioactivity was recovered in the liver (0.58–1.2 mg/kg) and kidney (0.18–0.25 mg/kg), corresponding to 0.2–0.4% and 0.06–0.08%, respectively, of the administered doses, reflecting the role of these organs in metabolism and excretion. In goat kidney, the major metabolites included 2-[6-(2-cyanophenoxy)pyrimidin-4-yloxy]phenylacetic acid (0.01–0.05 mg/kg, 6.9–20% TRR), a glucuronide conjugate of a phenylacrylate ring hydroxy-derivative of azoxystrobin (0.02–0.03 mg/kg, 8.2–16% TRR), and (E)-2-{2-[6-(2-cyano-phenoxy)pyrimidin-4-yloxy]phenyl}-3-methoxy-acrylic acid (0.005–0.02 mg/kg and 2.0–11% TRR). These metabolites
2 Codex Alimentarius Commission. Report of the 40
th Session of the Codex Committee on Pesticides Residues,
14–19 April 2008, Hangzhou, China, (ALINORM 08/31/24)

Azoxystrobin 147
were also present in goat liver but not as major metabolites (only 0.2–0.9, 0.5–1.9, and 0.7–1.9% TRR, respectively). The major metabolite detected in liver of goats dosed with [cyanophenyl-14C] labelled azoxystrobin was ring hydroxyl-derivative of S-(2-cyanophenyl)cysteine (compound L4: 0.35 mg/kg and 29% TRR), whereas 4-(2-cyanophenoxy)-6-hydroxypyrimidine was the major metabolite in liver of goats dosed with [pyrimidinyl-14C] labelled azoxystrobin (0.13 mg/kg and 20% TRR). Compound L4 was not detected in kidney, and 4-(2-cyanophenoxy)-6-hydroxypyrimidine accounted for only 5.0% TRR in kidney of goats dosed with [pyrimidinyl-14C] labelled azoxystrobin. Azoxystrobin parent was present at low levels in both the kidney (0.002–0.008 mg/kg and 0.8 to 2.0% TRR) and the liver 0.007–0.02 mg/kg and 0.6–1.8% TRR). In general, there was no significant difference in metabolism observed using the three different radiolabels.
Laying hens were dosed once daily with either cyanophenyl-, pyrimidinyl-, or phenylacrylate-[14C] labelled azoxystrobin in gelatine capsules at a nominal rate of 1.5 mg/day for ten consecutive days, corresponding to a daily dose of approximately 0.75 mg/kg bw. The dose was equivalent to an intake of approximately 11–12 ppm in the diet.
The recovery of the administered radiolabelled dose was 93–98%. The majority of the administered dose was excreted in faeces (91–97%). The cage washings accounted for no more than 2.0% of the administered dose. Radioactive residues in tissues and eggs accounted for ≤ 0.2% of the dose. Residues in muscle, egg white, skin with underlying fat, and peritoneal fat were in the range of 0.004–0.039 mg/kg. The highest radioactive residues were in egg yolk (0.040–0.14 mg/kg) and liver (0.082–0.11 mg/kg), both of these representing ≤ 0.1% of the administered dose. The fractionation of these residues showed that no single organosoluble fraction exceeded < 0.01 mg/kg and aqueous or unextractable fractions represented < 0.05 mg/kg.
Residues in egg whites reached a plateau of only 0.008–0.011 mg/kg after 3–4 days of dosing. In egg yolks, the residues plateaued at 0.040–0.14 mg/kg after 6–8 days of the dosing. The Meeting noted that it typically takes up to ten days for an egg to form, therefore the egg yolk values can be used as representative of what is happening in the whole egg.
Azoxystrobin (< 0.001–0.006 mg/kg, 0.3–12% TRR) and 4-(2-cyanophenoxy)-6-hydroxypyrimidine (0.002–0.004 mg/kg of azoxystrobin equivalents and 1.8–8.4% TRR), were identified in egg yolk. A significant portion of the radioactivity (0.018 mg/kg and 15% TRR) in egg yolk from the hens dosed with [pyrimidinyl-14C]azoxystrobin was due to the breakdown of azoxystrobin into small components, which were then incorporated through biosynthetic pathways into fatty acids.
Based on the results of the submitted studies, the Meeting concluded that, in goats and hens, azoxystrobin was rapidly metabolized and excreted in faeces and urine, with minimal retention of the parent and its metabolites in the tissues.
Plant metabolism
The Meeting received information on azoxystrobin metabolism, studied in wheat, grapes, peanuts, rice, and cotton.
Wheat was treated with radiolabelled azoxystrobin (labelled separately in each of the three rings) formulated as a suspension concentrate (250 g ai/L) and applied as a foliar spray twice (at BBCH 30–31 and 59–61) at a nominal rate of 0.5 kg ai/ha. The treated plants were harvested either as forage (a PHI of 13 days) or mature crop (a PHI of 61–62 days). The metabolic profile of azoxystrobin in wheat was very complex with at least 23 metabolites detected. Residues were mainly in the forage (TRR of 1.0–2.8 mg/kg) and straw (TRR of 3.1–9.4 mg/kg). The total radioactive residues in the grain were low (0.075–0.077 mg/kg).
In wheat grain, the only significant residue was the parent, azoxystrobin, (17–22% TRR and 0.013–0.017 mg/kg). No other discrete metabolite (12 compounds identified) was present at greater than 3.3% TRR (0.002 mg/kg). Naturally incorporated glucose comprised 9.7–21% TRR.

148 Azoxystrobin
In the wheat straw and forage, 14 and 12 metabolites were identified, respectively. The major residue was azoxystrobin, representing 22–43% TRR (0.67–4.1 mg/kg) and 55–65% TRR (0.56–1.8 mg/kg) in the straw and forage, respectively.
Other significant components included:
4-(2-cyanophenoxy)-6-hydroxypyrimidine (a product of the cleavage of the ether linkage between the phenyacrylate ring and the pyrimidinyl ring), for which sum of free, conjugated and bound forms accounted for 8.2–10% TRR and 3.2–3.7% TRR in the straw and forage, respectively
the Z-isomer of azoxystrobin (2.1–3.5% TRR in straw, 1.9–2.9% TRR in forage), which is the photo-isomerisation product of azoxystrobin
(E)-2-{2-[6-(2-cyano-phenoxy)pyrimidin-4-yloxy]phenyl}-3-methoxy-acrylic acid (3.0–3.4% TRR in straw, 0.7–0.8% in forage), which can be formed from azoxystrobin either by hydrolysis of the ester group or by oxidative de-alkylation.
The Meeting noted that the metabolic profile of the extractable residue of azoxystrobin in wheat was essentially the same in each analysed sample and very similar in each radiolabel, with the parent as the major residue accounting for 19–26%, 24–47%, and 59–68% of the extractable residue in grain, straw, and forage, respectively.
In an additional study, winter wheat was treated with [pyrimidinyl-14C]azoxystrobin applied once as a 250 SC formulation at 250 g ai/ha as a late season treatment at BBCH 71 (a PHI of 28 days). The total radioactive residues in grain and straw were 0.066 and 2.5 mg/kg, respectively. The only relevant radioactive residue was the parent, azoxystrobin, which accounted for 31% TRR (0.020 mg/kg) in grain and 51% TRR (1.3 mg/kg) in straw. Other significant metabolites, including 4-(2-cyanophenoxy)-6-hydroxypyrimidine or the Z-isomer of azoxystrobin, did not account for more than 3.4% TRR each. The Meeting noted that the results of this study were consistent with those from the previous wheat metabolism study. In both studies, azoxystrobin was the major component of the residue in grain and straw, representing 44% and 60% of the extractable residue, respectively.
Grapes were treated with radiolabelled azoxystrobin (labelled separately in each of the three rings), which was applied as a 250 SC formulation to three grape vines (one vine for each radiolabel) as a foliar spray four times with application rates of 0.25, 1.0, 1.0, and 0.25 kg ai/ha. Grapes and leaves were harvested 21 days after the final application. The TRR in grapes were 0.38–1.4 mg/kg of azoxystrobin equivalents. The major residue for each radiolabel was the parent, azoxystrobin (35–65% TRR and 0.13–0.92 mg/kg). A total of nine metabolites were identified and the most significant were 2-hydroxybenzonitrile (5.7% TRR), 4-(2-cyanophenoxy)-6-hydroxypyrimidine (2.6–5.2% TRR), the Z-isomer of azoxystrobin (1.9–4.0% TRR), and methyl 2-{2-[6-(2-cyanophenoxy)pyrimidin-4-yloxy]phenyl}-glycolate (2.5–3.9% TRR). Incorporation of radioactivity into naturally occurring sugars (glucose, fructose, and sucrose) indicated mineralization of [14C]azoxystrobin in soil, with subsequent assimilation of 14CO2 and the formation of 14C-sugars via photosynthesis.
Peanuts were treated with radiolabelled azoxystrobin (labelled separately in each of the three rings), which was formulated as a 250 g ai/L suspension concentrate and applied three times as a foliar spray to peanut vines at 0.85, 0.85, and 0.3 kg ai/ha. Ten days after the last application, a portion of the vines was stored fresh and the remaining vines and pods (nut and hull intact) were dried. The radioactive residues were mainly in the hay (dried vine containing 39–47 mg/kg of azoxystrobin equivalent) and vine (16–21 mg/kg). Nuts and hulls contained only 0.24–0.65 mg/kg and 0.67–0.90 mg/kg, respectively. The most significant residues identified in the nutmeat were the fatty acids, oleic and linoleic, accounting for 28–32% TRR (0.074–0.21 mg/kg) and 11–16% (0.27–0.11 mg/kg), respectively. Natural incorporation of radioactivity into sugars sucrose (1.7–5.6% TRR), glucose (1.5–1.9% TRR), and fructose (1.4–2.2% TRR) indicated mineralization of [14C]azoxystrobin in soil with subsequent assimilation of 14CO2. Parent azoxystrobin was not detected in the nutmeat and no individual metabolite was present at a level greater than 1.0% TRR. In hay and hulls, the major component of the radioactive residue was the parent, azoxystrobin, accounting for 33–44% TRR (13–

Azoxystrobin 149
20 mg/kg) and 13–14% TRR (0.088–0.11 mg/kg), respectively. A total of 10 and 11 metabolites were identified in hay and hull, respectively (residues in the vine were qualitatively similar to those in the hay), the most significant of which were 4-(2-cyanophenoxy)-6-hydroxypyrimidine (3.9% TRR in hay and 2.5–2.6% TRR in hulls) and its glucose conjugate (2.9–5.6% TRR in hay and 1.2-1.9% TRR in hulls).
Rice was treated with radiolabelled azoxystrobin (labelled separately in each of the three rings) in two separate experiments, one with a single foliar spray and the other with two granular paddy applications. For the foliar treatment, azoxystrobin was applied formulated as a suspension concentrate just after heading, at rates equivalent to a total field application of 0.36–0.55 kg ai/ha. For the paddy application, the compound was formulated as a granular product and applied twice to the paddy water to give a total seasonal application rate of 1.73–1.92 kg ai/ha. Crops were harvested at maturity after a PHI of 75–95 days for the foliar-treated plants and a PHI of 95–98 days after the second application for the granular treated rice plants.
The TRR (expressed as azoxystrobin) were 0.32–0.74 mg/kg and 5.7–11 mg/kg in grain and straw, respectively. In rice grain, the only significant residues from the granular application were radiolabelled sugars (43–58% TRR) and the parent compound (3.4–5.3% TRR). Similarly, the foliar application resulted mainly in the residues of the parent (36–72% TRR) and radiolabelled sugars (4.9–17% TRR). In rice straw, the major components from the granular application were the parent (3.3–5.6% TRR), isomers of methyl-2-{2-[6-(2-cyano-4-hydroxyphenoxy)pyrimidin-4-yloxy]phenyl}-3-methoxy acrylate (5.1–8.1%TRR), and (E)-2-{2-[6-(2-cyano-phenoxy)pyrimidin-4-yloxy]phenyl}-3-methoxy-acrylic acid (3.6–6.7% TRR). In foliar application, the parent, azoxystrobin, was the single most abundant component (38–46% TRR), followed by 4-(2-cyanophenoxy)-6-hydroxypyrimidine (5.2–8.5% TRR). Similarly to rice grain, a portion of the radioactivity (up to 3.9% TRR) was identified as radiolabelled sugars.
Cotton grown in the USA was treated with [pyrimidinyl-14C]azoxystrobin formulated as a suspension concentrate and applied at planting, as an in-furrow application, at a rate of 18 g ai/km (0.19 oz ai/1000 ft row), which was close to the US GAP for in-furrow application to cotton (19 g ai/km). The cotton was harvested both immature (forage) and mature (separated into seed, lint, and gin trash). Characterization of the residues was not carried out in seed, lint, and gin trash, in which the TRR were < 0.01 mg/kg. The TRR in forage was 0.085 mg/kg. The most significant residue in the forage was the parent, representing 15% TRR (0.013 mg/kg). At least eight unknowns were detected; not one representing > 0.01 mg/kg of parent equivalent. None of the unknowns co-chromatographed with any of the applied reference substances.
Based on the results of the submitted studies on wheat, grapes, peanut and cotton, the Meeting concluded that qualitatively similar metabolism occurred among these crops, with the parent, azoxystrobin, being the major component of the residue. In peanut meat, fatty acids (oleic and linoleic) accounted for most of the TRR. In cotton, no significant residues were detected in cottonseed after the in-furrow application at planting.
The Meeting noted that, in most of the studies, a significant portion of the radioactivity was identified as radiolabelled natural products such as sugars, starch, fatty acids, and amino acids. The presence of radioactivity in these natural products is believed to result from the mineralization of azoxystrobin in soil and subsequent incorporation of 14CO2 via photosynthesis.
Environmental fate
The Meeting received information on aerobic and anaerobic degradation of azoxystrobin in soil; photolysis on soil surface; mobility in soil; field dissipation studies and azoxystrobin residues in rotational crops.
The aerobic and anaerobic degradation of radiolabelled azoxystrobin was studied in the dark at 20 °C in three soils (silt loam, sandy clay loam, and sandy loam) incubated for 120 days and one soil (sandy loam) incubated for 360 days.

150 Azoxystrobin
Under aerobic conditions, azoxystrobin degraded with DT50 values between 56 and 279 days, depending on the amount of microbial biomass in this soil. No significant degradation was observed in sterile treatments, suggesting that the aerobic degradation was due to microbial activity. The major residue was azoxystrobin (31–55% and 33% of the applied radioactivity after 120 and 360 days, respectively). The only significant metabolite was (E)-2-{2-[6-(2-cyano-phenoxy)pyrimidin-4-yloxy]phenyl}-3-methoxy-acrylic acid, accounting for 10–15% and 18% of the radioactivity after 120 and 360 days, respectively.
Under anaerobic conditions, the degradation was more rapid with DT50 of 49–181 days. Azoxystrobin accounted for 19–21% and 28% of the applied radioactivity after 120 and 360 days of incubation, respectively. (E)-2-{2-[6-(2-cyano-phenoxy)pyrimidin-4-yloxy]phenyl}-3-methoxy-acrylic acid represented 57–59% and 49% of the radioactivity after 120 and 360 days, respectively.
Mineralization to CO2 was significant with up to 27% detected after 120 days under aerobic conditions (only up to 5% under anaerobic conditions). The acid metabolite and other identified metabolites were also finally mineralized into CO2.
Photodegradation of radiolabelled azoxystrobin was studied on the surface of sandy loam soil irradiated under conditions equivalent of up to 30 days Florida summer sunlight. Azoxystrobin underwent rapid degradation with a mean DT50 of 11 days Florida summer sunlight, which is equivalent to 11.5 days summer sunlight at 50 °North. A total of nine photolysis products were identified, of which the Z-isomer of azoxystrobin, 2-[6-(2-cyanophenoxy)pyrimidin-4-yloxy]benzoic acid, and 4-(2-cyanophenoxy)-6-hydroxypyrimidine accounted for up to 9%, 7.5%, and 5.7% of applied radioactivity, respectively. The only significant photodegradation product was 14CO2, reaching up to 29% of the applied radioactivity.
The Meeting concluded that both photolytic and microbial degradation are important routes of degradation under field conditions, with both routes ultimately leading to formation of CO2.
Mobility in soil was evaluated through adsorption/desorption and leaching studies, showing low to medium potential mobility of azoxystrobin in the tested soils.
Field dissipation studies on bare soil were performed in Northern and Southern Europe. The results showed a rapid degradation of azoxystrobin under field conditions (DT50 3–39 days, DT90 87–433 days). No measurable residues of azoxystrobin or its metabolites were determined below 10 cm. No measurable residues of the Z-isomer of azoxystrobin or (E)-2-{2-[6-(2-cyano-phenoxy)pyrimidin-4-yloxy]phenyl}-3-methoxy-acrylic acid were determined in any samples from any trials, with the exception of detection of the acid metabolite in one trial in Northern Europe (0.03 mg/kg) in the 0–10 cm horizon. Residues of 4-(2-cyanophenoxy)-6-hydroxypyrimidine and 2-[6-(2-cyanophenoxy) pyrimidin-4-yloxy] benzoic acid ranged between < 0.01–0.03 and < 0.01–0.05 mg/kg, respectively, in the 0–10 cm horizon and declined to < 0.01 mg/kg by 28–195 days after application.
Water-sediment systems
The hydrolysis rate of [14C]azoxystrobin was determined at 25 °C and 50 °C in buffered aqueous solutions at pH 5, 7 and 9 under sterile conditions in the dark for up to 31 days. At 25 °C, there was no significant hydrolysis (< 10%) at any pH. At 50 °C, there was no significant hydrolysis at pH 5 or 7. At 50 °C and pH 9, analysis showed significant hydrolysis (DT50=12.56 days). The Meeting concluded that no significant hydrolysis of azoxystrobin is likely under realistic environmental conditions.
The aqueous photolysis of [14C]azoxystrobin was studied at 25 °C in buffered aqueous solutions at pH 7 under sterile conditions over a period of approximately 30 days using an artificial light source. The half-life was calculated to be in the range of 11 and 17 days Florida summer sunlight (12–18 days summer sunlight at 50 °North). Azoxystrobin was the major component in all samples, accounting for up to 26% of the applied radioactivity at the final sampling interval. Only one photoproduct, the Z-isomer, was present at levels greater than 10% of the applied radioactivity during the study.

Azoxystrobin 151
Degradation in the sediment/water systems was studied in two natural systems under laboratory conditions in the dark at 20 °C over 152 days. Throughout the incubation period, the majority of the radioactivity (44–75% of applied radioactivity) was found in the sediment layer. In water, azoxystrobin was rapidly dissipated with a half-life of less than seven days. After 152 days of incubation, the parent compound azoxystrobin represented 47–61% of the applied radioactivity in the water-sediment systems. (E)-2-{2-[6-(2-cyano-phenoxy)pyrimidin-4-yloxy]phenyl}-3-methoxy-acrylic acid was the major metabolite, present at up to 20% of the applied activity 152 days after incubation, while up to 6% of the applied radioactivity had been mineralized to CO2. Azoxystrobin reaching water would be quickly adsorbed onto sediment and subsequently degraded, thus unlikely to cause residues in crops.
Residues in Rotational Crops
The Meeting received results of three greenhouse confined rotation studies conducted in the USA. In each study, radiolabelled azoxystrobin (different radiolabel each time) was applied directly to sandy loam soil at 2.2 kg ai/ha, which corresponds to the maximum seasonal application rate for azoxystrobin in the USA (maximum of six applications of a single rate of 0.37 kg ai/ha or maximum of eight applications of a single rate of 0.28 kg ai/ha), thus simulates a worst case scenario. Rotational crops (radish, lettuce, and wheat) were planted 30, 200, and 365 days after the treatment. Radish and lettuce were harvested at maturity while wheat was harvested at an immature stage (forage) and at maturity (grain and straw).
The TRR in the soil declined on average from 0.74–1.0 mg/kg at treatment to 88, 56, and 13% at 30, 200, and 365 days after treatment, respectively. The metabolism of azoxystrobin in rotational crops was complex with a large number of conjugated metabolites formed (mostly glucose or amino acid conjugates of the corresponding primary crop metabolites). The residues declined significantly at longer plant back intervals. Radioactive residues in the 365-day crops were generally in concentrations below 0.01 mg/kg. As in the primary crops, parent azoxystrobin represented the major residue detected in all rotational crops (up to 17–44% TRR); with very low actual residue levels in the tested crops (< 0.01–0.08 mg/kg at 30 days and < 0.01–0.01 mg/kg at 200 days). In wheat forage and wheat straw at 30 days, TRRs were 0.15–0.34 and 1.4–1.9 mg/kg, respectively, which declined significantly at the longer plant back intervals of 200 days (to 0.02–0.05 and 0.06–0.12 mg/kg, respectively) and 365 days (to < 0.01 mg/kg). Azoxystrobin residues in wheat grain were < 0.01 mg/kg even in wheat planted 30 days after the treatment.
In the absence of field rotational studies, it was difficult to assess the uptake of rotational crops (such as cereals), from soil under realistic conditions. The Meeting noted that the greenhouse confined studies were conducted at an exaggerated application rate: the TRR in the soil declined rapidly, and the azoxystrobin residues resulting from direct applications on the rotational crops were significantly higher than those found (even at the shortest plantback interval of 30 days) in the confined rotational studies resulting from the uptake from the treated soil.
Methods of analysis
The Meeting received descriptions and validation data for analytical methods for azoxystrobin in samples of plant and animal origin.
The described methods are mostly based on extraction with an organic solvent (usually acetonitrile or acetone); followed by a partition step, gel permeation chromatography (GPC) clean-up, and often also a silica, C18, alumina or Florisil solid-phase extraction (SPE) clean-up. The determination step employs either capillary GC with nitrogen-phosphorus (GC-NPD) or mass spectrometric (GC-MS) detection or liquid chromatography with tandem MS detection (LC-MS/MS). The typical LOQ is 0.01 mg/kg for most plant and animal matrices, with mean recoveries typically ranging between 70–120%. Multiresidue methods, such as the German DFG S19, are available for azoxystrobin analysis in plant and animal matrices.

152 Azoxystrobin
Adequate multi- and single-residue methods exist for both gathering data in supervised trials and other studies and for monitoring and enforcing azoxystrobin MRLs in samples of plant and animal origin.
Stability of pesticide residues in stored analytical samples
The Meeting received information on the stability of azoxystrobin in samples of plant and animal commodities freezer-stored at ≤ –18 °C. Fortified samples, typically at 0.1 mg/kg, of plant commodities (apples, orange oil, juice and pulp, peaches, grapes, wine, bananas, tomatoes, cucumbers, carrot root, lettuce leaf, oilseed rape, soya bean meal, corn grits, wheat straw, grain, and forage, peanuts, and pecans) were stored for up to 24 months. Fortified samples of processed commodities (peanut oil and meal, wheat bran and tomato juice and paste) were stored up to 12 months. Fortified samples of animal origin (beef muscle, liver, kidney, fat, milk and eggs) were stored up to ten months, which adequately covers the sample storage intervals in the livestock feeding studies.
No significant degradation of azoxystrobin was observed in the samples tested over the reported storage intervals. The uncorrected recoveries of azoxystrobin were > 70% during the storage intervals, except for one sample of orange pulp (56% recovery), for which the concurrent recovery was also low (69%).
Azoxystrobin is stable when stored frozen (≤ –18 °C) over the periods for which crop and animal tissue samples were stored, prior to the analysis in supervised trials, animal feeding and processing studies.
Residue definition
Azoxystrobin is extensively metabolized in animals and plants. Results of plant metabolism studies on wheat, rice, grapes, peanuts, and cottonseed indicate that azoxystrobin is rapidly metabolized and that portions of the molecule becomes associated with sugars and other natural plant constituents. The main residue remaining in the edible plant tissues at harvest is the parent compound, azoxystrobin. Although a number of metabolites were identified, all were at levels below 10% of the total recovered radioactive residue.
In ruminants (goats) and poultry (hen), azoxystrobin was rapidly metabolized with the majority of the administered dose excreted in the faeces and urine. The metabolism was quantitatively similar to rats. The total radioactive residues in goat milk, muscle, and fat were very low and characterization showed that the residues were unlikely to be attributed to any individual compound at a significant level. The residues were higher in kidney and liver, reflecting the role of these organs in metabolism and excretion. The major metabolites in the liver were not detected or found only at low levels in the kidney and vice versa. The parent, azoxystrobin, was present at low levels in both the kidney and liver. The hen metabolism showed very low transfer of radioactivity into tissues and eggs. The parent, azoxystrobin, was identified in the egg yolk (up to 12% TRR).
Based on the above, the Meeting agreed:
Definition of the residue in plant and animal commodities for estimation of dietary intake and for compliance with MRLs: azoxystrobin.
The log Kow of azoxystrobin is 2.5 (at 20 °C, pH 7). In the cattle feeding study, azoxystrobin accumulated in cream when milk was processed to skimmed milk and cream (6.7 to 40-fold higher azoxystrobin concentration in cream vs. skimmed milk), corresponding to 5–7.5 concentration factor for cream vs. whole milk. Also, even at the highest dosing level of 250 ppm, no measurable azoxystrobin residues (< 0.01 mg/kg) were found in cattle muscle, whereas azoxystrobin residues of 0.01–0.03 mg/kg were determined in fat. The Meeting noted that azoxystrobin represents a borderline case of fat solubility and concluded that the azoxystrobin residue is fat-soluble for the purpose of the residue definition.

Azoxystrobin 153
Results of supervised residue trials on crops
The Meeting received supervised trials data for azoxystrobin on citrus fruits (post-harvest and foliar treatments), stone fruits (cherry, peach and plum), berries and small fruit (blackberry, blueberry, cranberry, grapes, raspberry and strawberry), tropical fruits with inedible peel (banana, mango and papaya), bulb vegetables (bulb onion, spring onion and leeks), brassica vegetables (broccoli, Brussels sprouts, cabbage, cauliflower and kohlrabi), fruiting vegetables (cucumber, gherkin, melon, summer squash, pepper and tomato), lettuce, legume vegetables (beans and peas), pulses (soya beans), root and tuber vegetables (beetroot, carrot, chicory, potato, radish and sugar beet), stalk and stem vegetables (artichokes, asparagus, celery, witlof and chicory), cereal grains (barley, oat, rye, triticale, wheat, maize and rice), tree nuts (almonds, pecans and pistachios), oil seeds (cottonseed, peanuts and sunflower), herbs (basil, chives, parsley and mint), peanut hay, soya bean forage and hay, straw, fodder and forages of cereal grains (barley, oat, rye, triticale, wheat, maize and rice), sugar beet tops, dried herbs (basil, chives, parsley and hops), and almond hulls.
Citrus fruit
The Meeting received results from supervised trials with azoxystrobin used as post-harvest and foliar treatments on citrus fruits (grapefruit, orange, lemon, tangerine and mandarin) in the USA.
For the post-harvest treatment on citrus fruits, the GAP of the USA specifies a maximum of two treatments (for maximum decay control, once before storage and once after storage, just prior to marketing) that can be performed as a dip application with 0.12 kg ai/hL or a spray, drench, or flood application with 4 kg ai/ton fruit.
Ten trials were performed according to the GAP using two dip treatments (one with and one without a storage wax) at 0.12 kg ai/hL. Azoxystrobin residues in whole fruit were: 2.7 and 2.9 mg/kg for grapefruit, 2.1 and 2.2 mg/kg for orange, 2.6 and 4.2 mg/kg for tangerine, 3.4 and 6.2 mg/kg for mandarin, and 5.5 and 8.8 mg/kg for lemon. Three trials at the GAP using two spray treatments at 4 kg ai/ton fruit resulted in significantly lower azoxystrobin residues: 0.86 (grapefruit), 0.58 (orange) and 0.88 (lemon) mg/kg.
Eighteen other trials were performed at the GAP rate but only with a single application. Among these trials, the dip treatment with a storage wax resulted in the highest azoxystrobin residues (as compared to dip without wax or spray with or without wax), which were: 2.1 and 5.3 mg/kg for grapefruit, 1.6 and 4.0 mg/kg for orange, and 3.5 and 6.6 mg/kg for lemon.
In one post-harvest orange trial, involving a single dip without a storage wax, azoxystrobin residues in the whole fruit, pulp, and peel were analysed. Azoxystrobin residues were: 2.0 mg/kg in the whole fruit, 0.72 mg/kg in pulp, and 5.4 mg/kg in orange peel.
For the foliar treatment on citrus fruits, the GAP of the USA specifies a rate of 0.28 kg ai/ha with a seasonal total of 1.7 kg ai/ha (six applications at 7–21 day intervals) and a PHI of 0 days. Twenty-two trials were conducted at the GAP, with azoxystrobin residues in grapefruit (n = 6): 0.19, 0.20, 0.21, 0.25, 0.27, and 0.41 mg/kg; in orange (n = 11): 0.23, 0.26, 0.28, 0.30, 0.31, 0.32, 0.34, 0.37, 0.40, 0.41, and 0.53 mg/kg for orange; and for lemon (n = 5): 0.31, 0.52, 0.60, 0.65, and 0.74 mg/kg.
The Meeting noted that azoxystrobin residues from the foliar application were significantly lower as compared to the residues obtained in the post-harvest dip trials. The Meeting agreed to use the post-harvest dip results with one and two applications on the smaller citrus fruits (lemon, tangerine, and mandarin) to support a “citrus fruit” maximum residue level. Azoxystrobin residues in whole citrus fruit, in ranked order, were (n = 8): 2.6, 3.4, 3.5, 4.2, 5.5, 6.2, 6.6 and 8.8 mg/kg.
The Meeting estimated a maximum residue level for azoxystrobin in whole citrus fruit of 15 mg/kg and an STMR value of 4.9 mg/kg.

154 Azoxystrobin
Stone fruit
The Meeting received results from supervised trials with azoxystrobin used as a foliar treatment on stone fruits (cherry, peach, and plum) in the USA.
The GAP of the USA for stone fruit specifies a rate of 0.28 kg ai/ha with a seasonal total of 1.7 kg ai/ha (six applications at 7–14 day intervals) and a PHI of 0 days.
Seven trials on sweet cherry were conducted at the GAP rate with eight applications. Azoxystrobin residues in cherry, in ranked order, were (n = 7): 0.20, 0.42 (2), 0.45, 0.50, 0.98, and 1.0 mg/kg.
Fourteen trials on peach were conducted at the GAP rate with eight applications. Azoxystrobin residues in peach, in ranked order, were (n = 14): 0.28, 0.38, 0.41, 0.60, 0.64, 0.72 (2), 0.73, 0.74, 0.83, 0.84, 0.86, 0.89, 0.94, and 1.4 mg/kg.
Eight trials on plum were conducted at the GAP rate with eight applications. Azoxystrobin residues in plum, in ranked order, were (8): 0.02, 0.09, 0.24 (2), 0.25, 0.30, 0.37, and 0.42 mg/kg.
The Meeting agreed that the data on cherry, peach, and plum complying with the US GAP for stone fruit could be used to support a commodity group maximum residue level. Based on the residues obtained on peach, the Meeting estimated a maximum residue level for azoxystrobin in stone fruit of 2 mg/kg and an STMR value of 0.74 mg/kg.
Berries and other small fruits
The Meeting received results from supervised trials from the USA where azoxystrobin was used as a foliar treatment on berries and other small fruits, i.e., blackberry, blueberry, cranberry, raspberry, grape, and strawberry.
Blackberry, raspberry and blueberry
The GAP of the USA for cane berries (including blackberry and raspberry) specifies a rate of 0.28 kg ai/ha with a seasonal total of 1.7 kg ai/ha (six applications at 7–14 day intervals) and a PHI of 0 days. One trial on blackberry was at the GAP rate with eight applications. Azoxystrobin residue was 3.6 mg/kg. Two trials on raspberry were according to the GAP (six or seven applications). Azoxystrobin residues were 0.71 and 2.4 mg/kg.
The GAP of the USA for bush berries (including blueberries) specifies a rate of 0.28 kg ai/ha with a seasonal total of 0.84 kg ai/ha (three applications at 7–14 day intervals) and a PHI of 0 days. Seven trials on blueberries were conducted at the GAP rate with six applications. Azoxystrobin residues, in ranked order, were (n =7): 0.52, 0.79, 0.86, 0.95, 1.1 (2), and 1.4 mg/kg.
The Meeting decided to use the data on blackberry, raspberry, and blueberry to support a “Berries and other small fruits, except cranberry, grapes, and strawberry” commodity group maximum residue level. Azoxystrobin residues, in ranked order (n = 10): 0.52, 0.71, 0.79, 0.86, 0.95, 1.1 (2), 1.4, 2.4, and 3.6 mg/kg.
The Meeting estimated a maximum residue level for azoxystrobin in Berries and other small fruits, except cranberry, grapes, and strawberry of 5 mg/kg and an STMR value of 1.0 mg/kg.
Cranberry
The GAP of the USA for cranberry specifies a rate of 0.28 kg ai/ha with a seasonal total of 1.7 kg ai/ha (six applications at 7–14 day intervals) and a PHI of three days. Four trials were conducted according to the GAP. Azoxystrobin residues, in ranked order, were: 0.15, 0.19, 0.26, and 0.31 mg/kg.
The Meeting estimated a maximum residue level for azoxystrobin in cranberry of 0.5 mg/kg and an STMR value of 0.23 mg/kg.
Grapes

Azoxystrobin 155
The GAP of the USA for grapes specifies a rate of 0.28 kg ai/ha with a seasonal total of 1.7 kg ai/ha (six applications at 10–14 day intervals) and a PHI of 14 days. Fifteen trials on grapes were conducted according to the GAP with a PHI of 13–14 days. Azoxystrobin residues in grapes, in ranked order, were (n = 15): 0.11, 0.16, 0.24, 0.30, 0.33, 0.47 (2), 0.53 (3), 0.60, 0.62, 0.73, 0.76, and 0.80 mg/kg.
The Meeting estimated a maximum residue level for azoxystrobin in grapes of 2 mg/kg and an STMR value of 0.53 mg/kg.
Strawberry
The GAP of the USA for strawberry specifies a rate of 0.28 kg ai/ha with a maximum seasonal total of 1.1 kg ai/ha (four applications at 7–10 day intervals) and a PHI of 0 days. Seven trials were conducted at the GAP rate with 6–7 applications. Azoxystrobin residues in strawberry in ranked order were (n = 7): 0.26, 0.28, 0.65, 1.3 (2), 4.3, and 4.5 mg/kg.
The Meeting estimated a maximum residue level for azoxystrobin in strawberry of 10 mg/kg and an STMR value of 1.3 mg/kg.
Tropical fruits- inedible peel
Bananas
The Meeting received results from supervised trials with azoxystrobin used as a foliar treatment on bananas in the USA and as a post-harvest treatment in Central America (Costa Rica, Guatemala, and Mexico). The post-harvest trials were carried out according to the GAP of the USA.
For the foliar treatment on bananas and plantains, the GAP of the USA specifies a rate of 0.15 kg ai/ha with a maximum seasonal total of 1.2 kg ai/ha (eight applications at 12–14 day intervals) and a PHI of 0 days. Six trials were conducted according to the GAP. Azoxystrobin residues in whole fruit from bagged bunches were (n = 6): 0.01, 0.02 (2), 0.05 (2), and 0.15 mg/kg. Azoxystrobin residues in whole fruit from unbagged bunches were (n = 6): 0.10, 0.11, 0.17, 0.18, and 0.26 (2) mg/kg. Azoxystrobin residues in banana pulp were < 0.01 (4) and 0.01 (2) mg/kg for bagged bananas and < 0.01 (3), 0.02 (2), and 0.03 mg/kg for unbagged bananas.
For the post-harvest treatment on bananas and plantains, the GAP of the USA specifies a maximum of one application made as a spray, dip, or paint using 0.04 kg ai/hL. Six post-harvest trials on banana were conducted according to the GAP. Azoxystrobin residues in the whole fruit, in ranked order, were (n = 6): 0.58, 0.71, 0.82, 0.85, 0.98, and 1.1 mg/kg. Azoxystrobin residues in the pulp, in ranked order, were (n = 6): < 0.02, 0.02, 0.03 (2), 0.05, and 0.07 mg/kg.
The Meeting noted that the post-harvest trials resulted in higher residues, thus considered only the post-harvest results for maximum residue level and STMR estimations. Also, the Meeting agreed to extrapolate the results from bananas to plantains (the same GAP as bananas).
The Meeting estimated a maximum residue level for azoxystrobin in banana and plantain (whole fruit) of 2 mg/kg. Based on the pulp data, the Meeting estimated an STMR value of 0.03 mg/kg for banana and plantain pulp.
Mango
The Meeting received results from supervised trials on mango in Brazil, South Africa, and the USA.
In Brazil azoxystrobin is approved for use on mangoes at a spray rate of 0.008 kg ai/hL (0.06 kg ai/ha), with a maximum of six applications and a PHI of 2 days. From six trials in Brazil, at the GAP rate with six or eight applications residues of azoxystrobin, in whole fruit, were (n = 6): 0.03, 0.06 (2), 0.07, 0.08, and 0.13 mg/kg.
The GAP of South Africa specifies an application rate of 0.01 kg ai/hL, a maximum of two applications and a PHI of 21 days. Four trials complied with the GAP of South Africa, azoxystrobin residues, in whole fruit (n = 4), were: 0.02, 0.03, and 0.06 (2) mg/kg. The residues in flesh were < 0.01 mg/kg even at 200% GAP or in cases where fruit was harvested within the PHI of 21 days. In

156 Azoxystrobin
two trials at 100 and 200% of the GAP rate and a PHI of 0 days, azoxystrobin residues in flesh were 0.01 and 0.03 mg/kg and in whole fruit were 0.05 and 0.20 mg/kg, respectively, giving an average whole fruit/flesh residue concentration factor of 5.8.
The GAP of the USA (for tropical fruit) specifies a rate of 0.28 kg ai/ha with a maximum of six application (1.7 kg ai/ha seasonal total) and a PHI of 0 days. In three US trials, conducted according to the US GAP, residues of azoxystrobin in mango halves (stone removed) were: 0.09, 0.31, and 0.48 mg/kg. Using the stone/whole fruit weight factors of 0.10 and 0.09, based on the information provided in the South African trials for mango varieties Kent and Tommy Atkins, respectively, calculated residues of azoxystrobin in whole fruit were: (n = 3): 0.08, 0.28, and 0.44 mg/kg.
Based on the results from the US trials, the Meeting estimated a maximum residue level for azoxystrobin in mango (whole fruit) of 0.7 mg/kg. Based on the whole fruit/flesh residue concentration factor of 5.8 and the median value in whole fruit of 0.28 mg/kg, the Meeting estimated an STMR value of 0.05 mg/kg for mango flesh.
Papaya
The Meeting received results from supervised trials with azoxystrobin used as a foliar treatment on papaya in Brazil and Malaysia.
The GAP of Brazil specifies a spray concentration 0.008 kg ai/hL (0.064 kg ai/ha), with a maximum of four applications and a PHI of 3 days. Four trials on papaya in Brazil involved six applications at 125% GAP rate. Azoxystrobin residues in the whole fruit were: 0.06, 0.09, 0.11, and 0.12 mg/kg. In two trials, papaya flesh was analysed, with azoxystrobin residues in flesh being 0.01 and 0.02 mg/kg at a PHI of three days. The whole fruit/flesh distribution data were also obtained for two trials at 250% GAP rate (PHIs of 0–14 days). The average whole fruit/flesh residue concentration factor was 5.8 (n = 18).
The GAP of Malaysia specifies a spray concentration 0.011 kg ai/hL (0.11 kg ai/ha), a maximum of two applications and a PHI of one day. Three trials on papaya in Malaysia were conducted according to the GAP. Azoxystrobin residues in the whole fruit were (n = 3): < 0.05 (2) and 0.15 mg/kg.
The Meeting decided to combine results obtained from supervised trials on papaya in Brazil and Malaysia for mutual support. Azoxystrobin residues in the whole fruit, in ranked order, were (n = 7): < 0.05 (2), 0.06, 0.09, 0.11, 0.12 and 0.15 mg/kg.
The Meeting estimated a maximum residue level for azoxystrobin in papaya (whole fruit) of 0.3 mg/kg. Based on the whole fruit/flesh residue concentration factor of 5.8 and the median value in whole fruit of 0.09 mg/kg, the Meeting estimated an STMR value of 0.02 mg/kg for papaya flesh.
Bulb vegetables
Leeks
The Meeting received results from supervised trials with azoxystrobin on leeks in France (Southern and Northern), Germany, Switzerland, and the UK.
The GAP of France specifies a rate of 0.25 kg ai/ha, with a maximum of three applications and a PHI of 50 days. The GAP of Germany specifies a rate of 0.25 kg ai/ha, a maximum of two applications and a PHI of 42 days. No trials were conducted according the GAP of France or Germany.
The GAP of the UK specifies a rate of 0.25 kg ai/ha, a maximum of four applications and a PHI of 21 days. The GAP of Switzerland specifies a rate of 0.25 kg ai/ha, a maximum of two applications (14-day interval), and a PHI of 14 days. The GAP of Italy specifies a rate of 0.25 kg ai/ha, a maximum of two applications (7–14 day interval) and a PHI of 15 days. Twelve trials in France (Southern and Northern), Germany, Switzerland, and UK were conducted according to the

Azoxystrobin 157
GAP of Switzerland or Italy. Azoxystrobin residues found were (n = 12): 0.06, 0.07, 0.10, 0.11, 0.13, 0.14 (2), 0.17, 0.19, 0.34, 0.64, and 1.2 mg/kg.
Onion bulb, dry
The Meeting received results from supervised trials with azoxystrobin used on bulb onions in the USA. The GAP of the USA (for bulb vegetables) specifies a rate of 0.28 kg ai/ha, a maximum of 6 applications (total seasonal rate of 1.7 kg ai/ha) and a PHI of 0 days.
Eight trials were conducted according to the GAP. Azoxystrobin residues, in ranked order, were (n = 8): < 0.01, 0.07, 0.15, 0.21, 0.31, 0.36, 0.51, and 0.66 mg/kg.
Spring onion
The Meeting received results from supervised trials with azoxystrobin on spring onions in the USA. The GAP of the USA (for bulb vegetables) specifies a rate of 0.28 kg ai/ha, a maximum of 6 applications (total seasonal application rate of 1.7 kg ai/ha) and a PHI of 0 days.
Six trials were conducted according to the GAP with six applications. It was also decided to include one trial that involved 11 applications as the Meeting considered that the last application was more likely to contribute the majority to the residue of azoxystrobin. Also, the resulting residue of 3.3 mg/kg falls within the population of residues from the trials with six applications. Azoxystrobin residues, in ranked order, were (n = 7): 0.67, 1.3, 1.4, 2.2, 2.6, 2.7, 3.3, and 6.3 mg/kg.
The Meeting decided that the data on leeks, onion bulb and spring onion could be used to support a “bulb vegetables” commodity group maximum residue level. Based on the results on spring onions obtained according to the US GAP for bulb vegetables, the Meeting estimated a maximum residue level for azoxystrobin in bulb vegetables of 10 mg/kg and an STMR value of 2.2 mg/kg.
Brassica vegetables
Broccoli
The Meeting received results from supervised trials with azoxystrobin on broccoli in Europe (Germany, the Netherlands, and Spain), Canada and the USA.
In Europe, the GAPs of France, Germany, the Netherlands, and the UK specify a rate of 0.25 kg ai/ha, a maximum of two applications with a PHI of 14 days. Eight trials in Europe were conducted according to GAP. Azoxystrobin residues were (n = 8): < 0.01 (2), 0.01, 0.04 (3), 0.11, and 0.58 mg/kg.
The GAP of the USA (for brassica vegetables, head and stem subgroup) specifies a rate of 0.28 kg ai/ha with a maximum of 6 applications (total seasonal application rate of 1.7 kg ai/ha) and a PHI of 0 days. Two trials in Canada and two trials in the USA were conducted according to the US GAP. Azoxystrobin residues were (n = 4): 0.25, 0.93, 1.5, and 2.3 mg/kg.
The Meeting noted that azoxystrobin residues in broccoli obtained in the trials in the USA and Canada were significantly higher than those obtained in the European trials.
Brussels sprouts
The Meeting received results from supervised trials with azoxystrobin on Brussels sprouts in Europe (Austria, Germany, France, the Netherlands, Spain, and the UK).
In Europe, the GAPs of France, Germany, Italy, the Netherlands, and the UK for Brussels sprouts specifies a rate of 0.25 kg ai/ha, a maximum of two applications (8 to14-day interval) with a PHI of 14 days.
Twelve trials in Europe were conducted according to GAP with either two or four applications. Azoxystrobin residues, in ranked order were, were (n = 12): 0.03, 0.04 (3), 0.05 (3), 0.06, 0.08, 0.14, and 0.18 (2) mg/kg.

158 Azoxystrobin
Cabbage, head
The Meeting received results from supervised trials with azoxystrobin on cabbage in Europe (Austria, Germany, Italy, the Netherlands, and Spain), Canada and the USA.
In Europe, the GAPs of France, Germany, Italy, the Netherlands, and the UK, for Brussels sprouts, specify a rate of 0.25 kg ai/ha, a maximum of two applications (8 to14-day interval), with a 14 day PHI. Twelve trials in Europe were conducted according to GAP with either two or four applications. Azoxystrobin residues, in ranked order were, were (n = 12): < 0.01 (7), 0.01 (2), 0.07, 0.09, and 0.18 mg/kg.
The GAP of the USA (for brassica vegetables, head and stem subgroup) specifies a maximum of six applications at 0.28 kg ai/ha (seasonal total rate of 1.7 kg ai/ha) with a PHI of 0 days. Two trials in Canada and two trials in the USA were conducted according to the US GAP. Azoxystrobin residues were (n = 4): 0.32, 0.90, 1.8 and 2.0 mg/kg.
The Meeting noted that azoxystrobin residues in cabbage obtained in the trials in the USA and Canada were significantly higher than those obtained in the European trials.
Cauliflower
The Meeting received results from supervised trials with azoxystrobin on cauliflower in Europe (Austria, Germany, Spain, and the UK).
The GAP of Germany specifies a maximum of two applications at 0.25 kg ai/ha, (8 to12-day interval) with a PHI of 10 days. Eight trials in Germany, Austria, and the UK were conducted according to the German GAP with either two or four applications. Azoxystrobin residues were (n = 8): < 0.01 (2), 0.04 (2), 0.07, 0.17, 0.42, and 0.46 mg/kg.
The GAP of France and Italy for cauliflower specify a maximum of two applications (12 to14-day interval) at 0.25 kg ai/ha, and a PHI of 14 days. Four trials in Spain were conducted according to the GAP with either two or four applications. Azoxystrobin residues were (n = 4): < 0.01 (2), 0.03, and 0.44 mg/kg.
Kohlrabi
The Meeting received results from supervised trials with azoxystrobin used on kohlrabi in Germany. The GAP of Germany for kohlrabi specifies a maximum of two applications (8 to12-day interval) at 0.25 kg ai/ha, and a PHI of 14 days. Six trials were conducted according to the GAP. Azoxystrobin residues, in ranked order, were (n = 6): < 0.02, 0.03, 0.04, 0.05, 0.06, and 0.09 mg/kg.
The Meeting agreed that the data on broccoli, Brussels sprouts, cabbages (head), cauliflower and kohlrabi could be used to support a “Brassica vegetables” commodity group maximum residue level. The Meeting noted that azoxystrobin residues obtained on broccoli and head cabbage according to the same US GAP for brassica vegetables appear to be from similar populations and decided to combine them. Combined azoxystrobin residues, in ranked order median underlined, were (n = 8): 0.25, 0.32, 0.90, 0.93, 1.5, 1.8, 2.0, and 2.3 mg/kg.
Based on the data on broccoli and head cabbage, the Meeting estimated a maximum residue level for azoxystrobin in brassica vegetables of 5 mg/kg, an STMR value of 1.2 mg/kg and a highest residue value of 2.3 mg/kg.
Fruiting vegetables, Cucurbits
Cucumber
The Meeting received results from supervised trials with azoxystrobin on cucumber both indoors (glasshouse) in Europe (France, Germany, Greece, and the UK) and in the field in Europe (France, Italy, and Spain) and the USA.

Azoxystrobin 159
The indoor and field trials in France, Germany, Greece, and the UK were conducted using a spray concentration of 0.02 kg ai/hL with 4–8 applications and a PHI of three days. The rate and PHI corresponds to the GAP of France (0.02 kg ai/hL, three applications, a PHI of three days), which can cover both southern and northern parts of Europe. The GAPs of Italy and Switzerland specify a maximum of 3 applications at 0.025 kg ai/hL with a PHI of three days, i.e., the trials were conducted at 80% of the GAP rate in these countries. Azoxystrobin residues from the indoor trials were (n = 6), 0.03, 0.13 (2), 0.20, 0.49, and 0.75 mg/kg. Azoxystrobin residues from the outdoors trials in Europe were (n = 5): 0.02, 0.04, 0.06, 0.07, and 0.12 mg/kg.
Only two indoor trials in Germany (listed above with residues of 0.13 and 0.13 mg/kg at a PHI of three days) matched the GAP of the Netherlands, which specifies 0.02 kg ai/hL, 3 applications, and a PHI of one day for indoor use. Azoxystrobin residues were (n = 2): 0.19 and 0.23 mg/kg.
The GAP of the USA for cucurbits specifies a maximum of six applications at 0.28 kg ai/ha (with a total seasonal rate of 1.7 kg ai/ha) and a PHI of one day. Nine trials were conducted outdoors in the USA according to US GAP. Azoxystrobin residues were (n = 9): 0.04, 0.05, 0.06 (2), 0.07, 0.09, 0.11, 0.35, and 0.40 mg/kg.
Gherkin
The Meeting received results from supervised trials with azoxystrobin on gherkins in Germany. The GAP of Germany for cucumber specifies a maximum of two applications at 0.25 kg ai/ha, (8 to12-day interval) and a PHI of three days. Four trials in Germany on gherkins were conducted at the GAP rate with four or six applications. Azoxystrobin residues were (n = 4): 0.04, 0.05, 0.06, and 0.15 mg/kg.
Melons
The Meeting received results from supervised trials with azoxystrobin on indoor melons, i.e., in a glasshouse or a poly-tunnel, in Europe (France, Greece, Italy, the Netherlands, and Spain) and in the field in Europe (France, Greece, Italy, and Spain) and the USA.
Most of the indoor and field trials in Europe were conducted using a spray concentration of 0.02 kg ai/hL with 5–8 applications and a PHI of three days. The rate and PHI corresponds to the GAP of the Netherlands for indoor use (0.02 kg ai/hL, three applications, a PHI of three days) and 80% GAP rate for indoor/field application in Italy and Switzerland (0.025 kg ai/hL, three applications, a PHI of three days). Azoxystrobin residues from the indoor trials were (n = 8): 0.03 (2), 0.08, 0.16, 0.17, 0.18, 0.29, and 0.40 mg/kg. Azoxystrobin residues from the field trials in Europe were (n = 8): 0.01, 0.04 (3), 0.06, 0.07, 0.08, and 0.38 mg/kg.
Two field trials on melons in southern France were conducted at 0.20 kg ai/ha, eight applications, and a PHI of three days, which corresponds to the GAPs of France, Italy and Spain for field treatment (0.20 kg ai/ha, three applications, a PHI of three days). Azoxystrobin residues were: 0.06 and 0.09 mg/kg.
In six of the European trials, melon pulp and skin were analysed, azoxystrobin residues found in pulp (n = 6) were: < 0.01, 0.01 (2), 0.02, 0.05, and 0.06 mg/kg.
The GAP of the USA for cucurbits specifies a maximum of six applications (7–14 day intervals) at 0.28 kg ai/ha (total seasonal rate of 1.7 kg ai/ha) and a PHI of one day. Seven field trials were conducted in the USA according to GAP. Azoxystrobin residues were (n = 7): 0.10 (2), 0.16, 0.17 (2), 0.20, and 0.26 mg/kg.
Summer squash
The Meeting received results from supervised trials with azoxystrobin used on summer squash in the USA.
The GAP of the USA for cucurbits specifies a maximum of six applications at 0.28 kg ai/ha (total seasonal rate of 1.7 kg ai/ha) and a PHI of one day. Five trials on summer squash in the USA

160 Azoxystrobin
were conducted according to the GAP. Azoxystrobin residues, in ranked order, were (n = 5): 0.06, 0.07, 0.09, 0.11, and 0.16 mg/kg.
The Meeting agreed that the results obtained on cucumber, gherkins, melons, and summer squash could be used to support a “Fruiting vegetables, Cucurbits” commodity group maximum residue level. The Meeting noted that the results from indoor trials on cucumber and melon in Europe according to the same GAP gave highest residues. The Meeting also noted that these data sets appear to be from similar populations and decided to combine them. Azoxystrobin residues, in ranked order, were (n = 14): 0.03 (3), 0.08, 0.13 (2), 0.16, 0.17, 0.18, 0.20, 0.29, 0.40, 0.49, and 0.75 mg/kg.
The Meeting estimated a maximum residue level for azoxystrobin in fruiting vegetables, cucurbits of 1 mg/kg and an STMR value of 0.17 mg/kg. Based on the pulp data for melon, the Meeting estimated an STMR value of 0.02 mg/kg for cucurbits with inedible peel.
Fruiting vegetables, other than cucurbits
Peppers, sweet
The Meeting received results from supervised trials with azoxystrobin on sweet pepper grown in an indoor environment, i.e., in a glasshouse or a poly-tunnel, in Europe (France, Italy, and the Netherlands) and in the field (outdoor) in southern Europe (France, Italy, and Spain).
Seven field trials in southern Europe were conducted using a spray concentration of 0.025 kg ai/hL with six applications and a PHI of three days. The rate and PHI corresponds to the GAP of Italy for indoor/field application (0.025 kg ai/hL, three applications and a PHI of three days) and 125% GAP of Spain (0.020 kg ai/h, three applications and a PHI of three days). Azoxystrobin residues from the field trials were (n = 7), 0.04, 0.17, 0.18, 0.44, 0.45, 0.61, and 0.85 mg/kg.
Five indoor trials were conducted using a spray concentration of 0.025 kg ai/hL with six applications and a PHI of three days. These trials were conducted at the GAP rate of Italy. Azoxystrobin residues were (n = 5): 0.27, 0.35 (2), 0.62, and 1.4 mg/kg.
Two indoor trials in France were conducted at 0.25 kg ai/ha with six applications and a PHI of three days. These trials were conducted at the GAP rate of France (0.25 kg ai/ha, three applications and a PHI of 3 days). Azoxystrobin residues were (n = 2): 0.25 and 0.58 mg/kg.
Tomato
The Meeting received results from supervised trials with azoxystrobin on indoor grown tomatoes (in a glasshouse) in Europe (France, Italy, the Netherlands, and Spain) and in the field in southern Europe (France, Greece, Italy, and Spain).
The indoor and field trials on tomatoes were conducted using a rate of 0.23–0.26 kg ai/ha or a spray concentration of 0.025 kg ai/hL with six applications and a PHI of six days. The rate and PHI correspond to the GAP of France for indoor/field use (0.25 kg ai/ha, three applications and a PHI of three days) or the GAP of Italy for indoor/field use (0.025 kg ai/hL, three applications and a PHI of three days) and the GAP of Switzerland for indoor application (0.025 kg ai/hL, three applications and a PHI of three days).
Six field trials on tomatoes were conducted using a spray concentration of 0.025 kg ai/hL with six applications and a PHI of three days. Azoxystrobin residues were (n = 8): 0.08, 0.15, 0.16, 0.19, 0.39, and 0.41 mg/kg.
Two field trials on tomatoes were conducted using a rate of 0.23–0.26 kg ai/ha with six applications and a PHI of three days. Azoxystrobin residues were (n = 2): 0.31 and 0.40 mg/kg.
Six indoor trials on tomatoes were conducted using or a spray concentration of 0.025 kg ai/hL with six applications and a PHI of six days. Azoxystrobin residues were (n = 6): 0.08, 0.20, 0.29, 0.33, 0.54, and 0.86 mg/kg.

Azoxystrobin 161
Five field trials on tomatoes were conducted using 0.24–0.26 kg ai/ha with six applications and a PHI of three days. Azoxystrobin residues were (n = 5): 0.14, 0.20, 0.49, 0.54, and 0.69 mg/kg.
The Meeting agreed that the data on sweet pepper and tomato could be used to support a “Fruiting vegetables, other than Cucurbits, except fungi and sweet corn” commodity group maximum residue level. The Meeting noted that indoor trials on sweet pepper and tomato (conducted according to the same GAP with a spray concentration of 0.025 kg ai/hL) gave the highest residues (as compared to the indoor trials at 0.25 kg ai/ha or the field trials). The Meeting also noted that the data on sweet peppers and tomatoes from these trials appear to be from a similar population and decided to combine them. Azoxystrobin residues, in ranked order, were (n = 11): 0.08, 0.20, 0.27, 0.29, 0.33, 0.35 (2), 0.54, 0.62, 0.86, and 1.4 mg/kg
The Meeting estimated a maximum residue level for fruiting vegetables, other than cucurbits, except fungi and sweet corn of 3 mg/kg and an STMR value of 0.35 mg/kg.
Using a default concentration factor of 10 for extrapolation from sweet peppers to dried chilli peppers, the Meeting estimated a maximum residue level for azoxystrobin in dried chilli pepper of 30 mg/kg and an STMR value of 3.5 mg/kg.
Lettuce
The Meeting received results from supervised trials with azoxystrobin on lettuce in France, Spain and the UK.
The GAPs of France, Germany, and the Netherlands for lettuce specifies a rate of 0.25 kg ai/ha, a maximum of three applications (two applications in Germany), and a PHI of 14 days. The GAP of Italy specifies 0.25 kg ai/ha, a maximum of three applications, and a PHI of seven days.
Twelve trials in northern Europe (northern France and the UK) were conducted at the GAP of France, Germany, or the Netherlands. Azoxystrobin residues from these trials were (n = 12): < 0.01 (5), 0.24, 0.25, 0.39, 0.49, 0.56, 1.2, and 1.6 mg/kg.
Eight trials in southern Europe (southern France and Spain) were conducted at the GAP of Italy. Azoxystrobin residues from these trials were (n = 8): 0.12 (2), 0.14, 0.31, 0.44, 0.85, 1.1, and 1.4 mg/kg.
The Meeting noted that the residues in lettuce from the trials in northern and southern Europe appear to be from a similar population (based on the Mann-Whitney U-test). Combined azoxystrobin residues in lettuce, in ranked order median underlined, were (n = 20): < 0.01 (5), 0.12 (2), 0.14, 0.24, 0.25, 0.31, 0.39, 0.44, 0.49, 0.56, 0.85, 1.1, 1.2, 1.4, and 1.6 mg/kg.
The Meeting estimated a maximum residue level for lettuce (head) and lettuce (leaf) of 3 mg/kg and an STMR value of 0.28 mg/kg.
Legume vegetables
The Meeting received results from supervised trials with azoxystrobin on succulent beans and peas in the USA. The GAP of the USA for legume vegetables specify a maximum of six applications at 0.28 kg ai/ha with total seasonal rate of 1.7 kg ai/ha and a PHI of 0 days.
Beans
Six trials in the USA were conducted on succulent beans according to GAP with 7–8 applications. In three trials, the beans were collected without the pods. Azoxystrobin residues in beans without pods were: 0.02, 0.07, and 0.08 mg/kg. In three trials where beans were collected and analysed with the edible pods, azoxystrobin residues were: 0.11, 0.48, and 1.5 mg/kg.
Peas
Six trials in the USA were conducted on succulent peas according to the GAP of the USA with seven applications. In three trials, the peas were collected without the pods. Azoxystrobin residues in peas

162 Azoxystrobin
without pods were: 0.03, 0.08, and 0.17 mg/kg. In three trials where the peas were collected and analysed with the edible pods azoxystrobin residues were: 0.87, 1.2, and 1.5 mg/kg.
The Meeting agreed that the data on beans and peas obtained from trials according to the same GAP for legume vegetables could be used to estimate a “legume vegetables” commodity group maximum residue level. The Meeting decided to use the higher residues found on beans and peas with pods, for the estimation. Azoxystrobin residues in beans and peas with pods, in ranked order median underlined, were (n = 6): 0.11, 0.48, 0.87, 1.2, and 1.5 (2) mg/kg.
The Meeting estimated a maximum residue level for azoxystrobin in legume vegetables of 3 mg/kg and an STMR value of 1.0 mg/kg.
Soya beans, dry
The Meeting received results from supervised trials with azoxystrobin on soya beans in the USA.
The GAP of the USA for soya beans (seeds) specifies a maximum of 6 applications at 0.28 kg ai/ha with a total sanctioned seasonal total rate of 1.7 kg ai/ha and a PHI of 14 days. Nineteen trials on soya beans in the USA were conducted at the US GAP rate with 5–7 applications and a PHI of 12–16 days. Azoxystrobin residues, in ranked order median underlined, were (n = 19): < 0.01, 0.02 (5), 0.03, 0.05, 0.06 (3), 0.07, 0.09, 0.12, 0.15, 0.18, 0.23, 0.24, and 0.33 mg/kg.
The Meeting estimated a maximum residue level for azoxystrobin in soya beans, dry of 0.5 mg/kg and an STMR value of 0.06 mg/kg.
Root and tuber vegetables
The Meeting received results from supervised trials with azoxystrobin on beetroot, carrot, radish, and sugar beet in the USA, on chicory root in France and on potato in Europe.
The GAP of the USA for root vegetables specifies a maximum of six applications at 0.37 kg ai/ha with a total seasonal rate of 2.2 kg ai/ha (six applications) and a PHI of 0 days.
Beetroot
Four trials on beetroot (garden beet) were conducted in the USA using 0.28 kg ai/ha (76% US GAP rate) with a total seasonal application of 2.2 kg ai/ha (six applications) and a PHI of 0 days. Azoxystrobin residues in beetroot, in ranked order, were (n = 4): 0.18, 0.23, 0.32, and 0.34 mg/kg.
Carrot
Six trials on carrot were conducted in the USA according to the US GAP for root vegetables (one trial with eight applications). Azoxystrobin residues in carrot, in ranked order, were (n = 6): 0.03, 0.13, 0.14, 0.17, 0.26, and 0.30 mg/kg.
Chicory root
Five supervised trials with azoxystrobin used on chicory (endive) in France (see chicory and endive leaves for trial details) were conducted according to the GAP of France, which specifies a PHI of 21 days, maximum of three applications at 2.5 kg ai/ha for chicons (the edible part) production (treatment of plants) and 0.25 kg ai/ha for root production (treatment of parts).
Azoxystrobin residues in chicory roots (harvest of chicory leaves and roots at a PHI of 21 days), were (n = 5) 0.06, 0.07, 0.11, 0.25, and 0.46 mg/kg.
Potato
The Meeting received results from supervised trials with azoxystrobin used on potato as soil treatment (whole field or in-furrow) in France, Italy, the Netherlands, Spain, and the UK or as a foliar treatment in Spain and the UK.

Azoxystrobin 163
For the pre or at planting soil treatment, the GAP of the Netherlands and the UK specify a single application at 1.5 kg ai/ha as an overall or incorporated treatment or a single application at 0.75 kg ai/ha as an in-furrow treatment. The resulting application rates at the actual planting sites of potatoes are comparable (about 1.5 kg ai/ha) because of the reduced field area sprayed in the in-furrow application, i.e., applied as a 50% ‘band’ treatment.
Six trials in the Netherlands and two trials in the UK were performed using 1.5–1.6 kg ai/ha as a single application. Azoxystrobin residues in potatoes from these trials were (n = 8): < 0.01 (4) and 0.01 (4) mg/kg. Twelve trials were conducted using the same rate (1.5–1.6 kg ai/ha) in Southern Europe (southern France, Italy, and Spain), with azoxystrobin residues being (n = 12): < 0.01 (6), 0.02 (2), 0.03 (3), and 0.07 mg/kg. No GAP was available for potatoes in the southern Europe.
Six trials in the Netherlands were conducted using 0.77–0.8 kg ai/ha as a single in-furrow treatment at planting. Azoxystrobin residues in potato from these trials were (n = 6): < 0.01 (3), 0.02 and 0.03 (2) mg/kg. Four trials in southern France were conducted using 0.37–0.39 kg ai/ha (about 50% GAP rate) as a single in-furrow treatment at planting, resulting in azoxystrobin residues of (n = 4): 0.02 and 0.03 (3) mg/kg.
For the foliar application, the GAP of Germany specifies 0.13 kg ai/ha, a maximum three applications, and a PHI of seven days. The GAP of the Netherlands specifies 0.063 kg ai/ha, a maximum of two applications, and a PHI of seven days. Two trials in the UK, two trials in the Netherlands, and four trials in Spain were conducted according to the GAP of Germany. In addition, two trials in the UK and four trials in Spain were conducted at 200% GAP rate and two trials in the Netherlands were conducted at 50% of German GAP (100% of the GAP of the Netherlands). Azoxystrobin residues in potato in all these trials were < 0.01 (16) mg/kg.
Radish
Five trials on radish were conducted in the USA according to the US GAP for root vegetables. Azoxystrobin residues in radish, in ranked order, were (n = 5): 0.13, 0.16, 0.29, 0.38, and 0.45 mg/kg.
Sugar beet
Nine trials on sugar beet were conducted in the USA according to the US GAP for root vegetables. Azoxystrobin residues in sugar beet, in ranked order, were (n = 9): 0.04, 0.05, 0.06 (2), 0.09 (2), 0.10, 0.11, and 0.24 mg/kg.
The Meeting decided to use the data on beetroot, carrot, and radish according to the same US GAP to estimate a “root and tuber vegetables” commodity group maximum residue level. The Meeting noted that the results on beetroot, carrot, and radish appear to be from a similar population and decided to combine them. Azoxystrobin residues, in ranked order median underlined were (n = 5): 0.03, 0.13 (2), 0.14, 0.16, 0.17, 0.18, 0.23, 0.26, 0.29, 0.30, 0.32, 0.34, 0.38, and 0.45 mg/kg.
The Meeting estimated a maximum residue level for azoxystrobin in root and tuber vegetables of 1 mg/kg, an STMR value of 0.23 mg/kg, and a highest residue value of 0.45 mg/kg.
Stalk and stem vegetables
Artichoke, globe
The Meeting received results from supervised trials with azoxystrobin on artichokes in France, Spain, and the USA.
The GAP of France and Spain specify 0.25 kg ai/ha, a maximum three applications, and a PHI of seven days. Five trials in France and one trial in Spain were conducted according to the GAP of France and Spain. Azoxystrobin residues were (n = 6): 0.16, 0.24, 0.30, 0.42, 0.48, and 0.61 mg/kg.
The GAP of the USA for artichokes specifies a maximum of six applications at 0.28 kg ai/ha with total seasonal rate of 1.7 kg ai/ha and a PHI of 0 days. Three trials on artichokes in the USA were conducted according to the US GAP. Azoxystrobin residues were (n = 3): 1.6, 1.8, and 2.4 mg/kg.

164 Azoxystrobin
The Meeting noted that azoxystrobin residues from the US trials according to the US GAP were significantly higher that those from the European trials that were conducted at French GAP, which specifies a lower application rate and a longer PHI. The Meeting considered three trials acceptable for estimation of a maximum residue level for this minor crop.
The Meeting estimated a maximum residue level for azoxystrobin in artichoke, globe of 5 mg/kg and an STMR value of 1.8 mg/kg.
Asparagus
The Meeting received results from supervised trials with azoxystrobin on asparagus in France and the USA.
The GAP of France for asparagus specifies 0.25 kg ai/ha with a maximum of three applications (a PHI is not required). Four trials on asparagus in France were conducted according to the GAP of France with four applications (PHI of 215–259 days). Azoxystrobin residues from these trials were < 0.01 (4) mg/kg.
The GAP of the USA for asparagus specifies six applications at 0.28 kg ai/ha with total seasonal rate of 1.7 kg ai/ha and a PHI of 100 days. Two trials on asparagus in the USA were conducted according to the US GAP with a PHI of 93 or 104 days. Azoxystrobin residues from both these trials were < 0.02 (2) mg/kg.
The Meeting estimated a maximum residue level for asparagus of 0.01 (*) mg/kg and an STMR value of 0.01 mg/kg.
Celery
The Meeting received results from supervised trials with azoxystrobin used on celery in Italy and the UK. Azoxystrobin residues were determined in trimmed and untrimmed celery.
The GAP of Italy for celery specifies a maximum of three applications at 0.25 kg ai/ha, and a PHI of seven days. Six trials in Italy were conducted at the GAP rate of Italy, with four applications and a PHI of 6–7 days. Azoxystrobin residues in trimmed celery were (n = 6): 0.12, 0.16, 0.19, 0.33, 0.41, and 0.73 mg/kg. Azoxystrobin residues in untrimmed celery were (n = 6): 0.19, 1.0, 1.4, 1.8, 2.0, and 2.5 mg/kg.
Eight trials on celery in the UK were conducted according to the GAP of Germany (0.25 kg ai/ha, two applications, a PHI of 14 days) with 4–7 applications. Azoxystrobin residues in trimmed celery were (n = 8): 0.05, 0.08, 0.09, 0.10, 0.11, 0.23, 0.26, and 0.33 mg/kg. Azoxystrobin residues in untrimmed celery were (n = 7): 0.23, 0.25, 0.28, 0.43, 0.96, 2.9 and 3.2 mg/kg.
Based on the data on untrimmed celery in the UK, the Meeting estimated a maximum residue level for azoxystrobin in celery of 5 mg/kg and an STMR value of 0.43 mg/kg.
Witloof chicory (sprouts)
The Meeting received results from supervised trials with azoxystrobin used on witloof chicory in France. The GAP of France specifies a PHI of 21 days, maximum of three applications at 2.5 kg ai/ha for chicons (the edible part) production (treatment of plants) and 0.25 kg ai/ha for root production (treatment of parts).
In five trials, plants were treated twice at the rate of 0.25 kg ai/ha (at intervals of 20–22 days). Fourteen days after the second application mature plants were harvested, the leaves removed, and the roots stored in a climate controlled room.
After 14 days the roots were separated into two batches: the first set of roots were dipped in a solution containing 0.01 kg ai/hL and the second set were sprayed once at a rate of 2.5 kg ai/ha. Following the treatments, hydroponic forcing was performed on both sets of roots in dark climate-controlled rooms. Azoxystrobin residues in chicons from the second set (treatment according to the GAP of France), in ranked order, were (n = 5) 0.03 (2), 0.05, 0.10, and 0.11 mg/kg.

Azoxystrobin 165
The Meeting estimated a maximum residue level for azoxystrobin in witloof chicory (sprouts) of 0.3 mg/kg and an STMR value of 0.05 mg/kg.
Cereal grains
The Meeting received results from supervised trials with azoxystrobin used on barley, oat, rye, triticale and wheat in Europe and on maize and rice in the USA.
Barley
The Meeting received results in barley grain from supervised trials with azoxystrobin in France, Germany, Italy, the Netherlands, Spain, Sweden, Switzerland, and the UK.
The GAP of France for barley specifies a maximum of two applications at 0.25 kg ai/ha, with a 42-day PHI. The GAP of Spain for barley specifies 0.25 kg ai/ha, a maximum two applications, and a PHI of 36 days. The GAPs of Germany, Italy and the Netherlands specify a maximum of two applications at 0.25 kg ai/ha, and a PHI of 35 days. The Meeting decided to consider all trials on barley in continental Europe that were conducted at the GAP rate (± 30%) of 0.25 kg ai/ha, 2–3 applications, and a PHI of 35–42 days.
Nineteen trials in France conducted at 72–104% GAP rate, with 2–3 applications and a PHI of 35–42 days (both the highest and lowest residues were obtained at a PHI of 42 days). Azoxystrobin residues, in ranked order, were (n = 19): 0.01 (3), 0.02 (2), 0.03 (2), 0.04 (2), 0.05, 0.08, 0.09, 0.11 (2), 0.12, 0.13 (3), and 0.19 mg/kg.
Two trials in Germany conducted at 100% GAP rate, with three applications, and a PHI of 35 days, resulted in azoxystrobin residues of 0.10 and 0.11 mg/kg. One trial in Germany carried out at 80% GAP rate, with two applications, and a PHI of 37 days resulted in an azoxystrobin residue of 0.02 mg/kg.
Two trials in Italy conducted at 100–104% GAP rate, with two applications, and a PHI of 36 days resulted in azoxystrobin residues of 0.08 and 0.10 mg/kg.
One trial in Netherlands conducted at 100% GAP rate, with two applications, and a PHI of 37 days resulted in azoxystrobin residues of 0.08 mg/kg.
Two trials in Spain conducted at 100% GAP rate, with two applications, and a PHI of 35 days resulted in azoxystrobin residues of 0.03 and 0.11 mg/kg. One trial in Spain carried out at 104% GAP, with two applications, and a PHI of 38 days resulted in an azoxystrobin residue of 0.28 mg/kg.
One trial in Sweden carried out 100% GAP rate, with two applications, and a PHI of 42 days resulted in an azoxystrobin residue of 0.20 mg/kg.
Two trials in Switzerland conducted at 104% GAP rate, with two applications, and a PHI of 36 days resulted in azoxystrobin residues of 0.02 and 0.04 mg/kg. Four trials in Switzerland carried out at 80% GAP, with two applications, and a PHI of 35 days resulted in azoxystrobin residues of 0.01, 0.02 (2) and 0.03 mg/kg.
The GAP of the UK for barley specifies 0.25 kg ai/ha, a maximum two applications, and the latest time of application up to and including watery ripe stage (BBCH growth stage 71). Three trials in the UK were conducted at 100% GAP rate, with three applications, and the last application including growth stage 71 (PHIs at harvest were 38–54 days). Azoxystrobin residues in barley grain were 0.13, 0.14, and 0.23 mg/kg.
Combined azoxystrobin residues in barley grain from the trials in Europe (n = 38), in ranked order median underlined, were: 0.01 (4), 0.02 (6), 0.03 (4), 0.04 (3), 0.05, 0.08 (3), 0.09, 0.10 (2), 0.11 (4), 0.12, 0.13 (4), 0.14, 0.19, 0.20, 0.23, and 0.28 mg/kg.
Oat, rye, and triticale

166 Azoxystrobin
The Meeting received results in oat, rye, and triticale grain from supervised trials with azoxystrobin in Germany. The GAP of Germany for oat, rye, and triticale specifies a maximum two applications at 0.25 kg ai/ha, and a PHI of 35 days.
Two trials on oat in Germany conducted at 100% GAP rate, with three applications, and a PHI of 35 or 36 days. Azoxystrobin residues were 0.01 and 0.06 mg/kg.
Two trials on rye in Germany conducted at 100% GAP rate, with three applications, and a PHI of 35 days. Azoxystrobin residues were 0.02 and 0.04 mg/kg.
Two trials on triticale in Germany conducted at 100% GAP rate, with three applications, and a PHI of 36 days. Azoxystrobin residues were < 0.01 and 0.02 mg/kg.
Wheat
The Meeting received results in wheat grain from supervised trials with azoxystrobin on wheat in France, Germany, Italy, Spain, Switzerland, and the UK.
The GAP of France for wheat specifies a maximum of two applications at 0.25 kg ai/ha, with a PHI of 42 days. The GAP of Spain for wheat specifies a maximum two applications at 0.25 kg ai/ha, and a PHI of 36 days. The GAPs of Germany, Italy and the Netherlands for barley specify 0.25 kg ai/ha, a maximum two applications, and a PHI of 35 days. The Meeting decided to consider all trials on wheat in continental Europe that were conducted at the GAP rate (± 30%) of 0.25 kg ai/ha, 2–3 applications, and a PHI of 35–42 days.
Fourteen trials on wheat in France were conducted at 80–104% GAP rate, with 2–3 applications and a PHI of 35–42 days (the highest and lowest residues were obtained at a PHI of 38 and 35–42 days, respectively). Azoxystrobin residues, in ranked order, were: < 0.01 (5), 0.01 (4), 0.02, 0.03 (3), and 0.14 mg/kg.
Four trials in Germany were conducted at 80–100% GAP rate, with 2–3 applications, and a PHI of 35–42 days (both the highest and lowest residues were obtained at a PHI of 35 days). Azoxystrobin residues, in ranked order, were: < 0.01, 0.01, 0.02 and 0.04 mg/kg.
Two trials in Italy were conducted at 100–104% GAP rate, with two applications, and a PHI of 35 days. Azoxystrobin residues were: < 0.01 and 0.02 mg/kg.
Three trials in Spain were conducted at 100% GAP rate, with two applications, and a PHI of 35 days. Azoxystrobin residues, in ranked order, were: < 0.01, 0.01, and 0.04 mg/kg.
Five trials in Switzerland were conducted at 80–108% GAP rate, with two applications, and a PHI of 35 days. Azoxystrobin residues were: < 0.01 (5) mg/kg.
The GAP of the UK for wheat specifies 0.25 kg ai/ha, a maximum two applications, and the latest time of application up to and including watery ripe stage (BBCH growth stage 71). Three trials in the UK were conducted at 100% GAP rate, with three applications, and the last application including growth stage 71 (PHIs at harvest were 40–59 days). Azoxystrobin residues in wheat grain were: 0.01, 0.02, and 0.03 mg/kg.
Combined azoxystrobin residues in wheat grain from the trials in Europe (n = 31), in ranked order median underlined, were: < 0.01 (13), 0.01 (7), 0.02 (4), 0.03 (4), 0.04 (2) and 0.14 mg/kg.
The Meeting decided to use the data on barley grain to extrapolate to oat and data on wheat grain to extrapolate to rye and triticale.
The Meeting estimated a maximum residue level for azoxystrobin in barley and oat grain of 0.50 mg/kg and an STMR value of 0.08 mg/kg.
The Meeting estimated a maximum residue level for azoxystrobin in wheat, rye and triticale grain of 0.20 mg/kg and an STMR value of 0.01 mg/kg.
Maize

Azoxystrobin 167
The Meeting received results in maize grain from supervised trials with azoxystrobin in the USA.
The GAP of the USA for maize specifies a maximum of eight applications at 0.28 kg ai/ha with a total seasonal application of 2.2 kg ai/ha and a PHI of seven days. Twenty trials in the USA were conducted on maize according to the US GAP with a PHI of 6–7 days. Azoxystrobin residues in maize grains in these trials were (n = 20): < 0.01 (17), 0.01 (2), and 0.02 mg/kg.
The Meeting estimated a maximum residue level for azoxystrobin in maize grain of 0.02 mg/kg and an STMR value of 0.01 mg/kg.
Rice
The Meeting received results in rice grain from supervised trials with azoxystrobin used on rice in the USA.
The GAP of the USA for rice specifies a rate of 0.34 kg ai/ha with a total seasonal rate of 0.78 kg ai/ha and a PHI of 28 days. Sixteen trials were conducted in the USA on rice, in accordance with the US GAP with a maximal seasonal application of 0.78 kg ai/ha (2×0.22 and 1×0.34 kg ai/ha) and a PHI of 26–28 days. Azoxystrobin residues in rice grain, in ranked order median underlined, were (n = 16): 0.07, 0.19, 0.29, 0.30 (2), 0.41, 0.43, 0.62, 0.74, 0.81, 0.89, 1.6, 2.3, 2.8, 3.0 and 3.3 mg/kg.
The Meeting estimated a maximum residue level for azoxystrobin in rice grain of 5 mg/kg and an STMR value of 0.68 mg/kg.
Tree nuts
The Meeting received results from supervised trials with azoxystrobin used on almonds, pecans, and pistachios in the USA.
Almonds
The GAP of the USA for almonds specifies a maximum of six applications at 0.28 kg ai/ha with a total authorized seasonal rate of 1.7 kg ai/ha and a PHI of 28 days. Five trials in the USA were conducted on almonds according to the US GAP with a PHI of 28–29 days. Azoxystrobin residues in almonds were (n = 5): < 0.01 (4) and 0.01 mg/kg.
Pecans
The GAP of the USA for pecans specifies 0.22 kg ai/ha with total seasonal application of 1.3 kg ai/ha (six applications) and a PHI of 45 days. Six trials in the USA were conducted on pecans at the US GAP rate with six applications. In four trials with a PHI shorter than 45 days (24–42 days), azoxystrobin residues were < 0.01 (4) mg/kg. In two trials with a PHI of 20–25 days, azoxystrobin residues were 0.01 and 0.02 mg/kg.
Based on the data on almonds and pecans, the Meeting estimated a maximum residue level for azoxystrobin in tree nuts, except pistachios of 0.01 mg/kg and an STMR value of 0.01 mg/kg.
Pistachios
The GAP of the USA for pistachios specifies a rate of 0.28 kg ai/ha with a total seasonal rate of 1.7 kg ai/ha (six applications) and a PHI of seven days. Three trials in the USA were conducted on pistachios according to the US GAP. Azoxystrobin residues were 0.25, 0.44, and 0.48 mg/kg. The Meeting considered three trials acceptable for estimation of a maximum residue level for this minor crop.
The Meeting estimated a maximum residue level for azoxystrobin in pistachios of 1 mg/kg and an STMR value of 0.44 mg/kg.

168 Azoxystrobin
Oilseeds
Cotton seed
The Meeting received results from supervised trials with azoxystrobin used on cotton as in-furrow and foliar treatments in the USA.
For in-furrow treatment, the GAP of the USA specifies 0.019 kg ai/km of row (0.20 oz ai/1000 row feet), which corresponds to the maximum of 0.34 kg ai/ha (for 22-inch rows). Twelve trials were conducted in the USA according to the US GAP for in-furrow treatment immediately before planting. In all these trials, azoxystrobin residues in cottonseed, taken at normal harvest, (PHI of 121–186 days) were < 0.01 (12) mg/kg.
For foliar application, the GAP of the USA for cotton specifies 0.17 kg ai/ha with total seasonal application rate of 0.5 kg ai/ha (three applications) as a foliar spray and a PHI of 45 days. Twelve trials in the USA were conducted with a combined in-furrow application at the planting (0.17 kg ai/ha) and three foliar applications at 0.17 kg ai/ha with a PHI of 45 days. Azoxystrobin residues from these trials, in ranked order, were (n = 12): < 0.01 (5), 0.01 (2), 0.02, 0.03 (3), and 0.54 mg/kg.
Based on the trials with combined foliar and in-furrow (at-planting) application, the Meeting estimated a maximum residue level for azoxystrobin in cotton seed of 0.7 mg/kg and an STMR value of 0.01 mg/kg.
Peanuts
The Meeting received results from supervised trials with azoxystrobin used on peanuts in the USA.
The GAP of the USA for peanuts specifies a rate of 0.45 kg ai/ha with a seasonal total of 0.9 kg ai/ha (two applications) with a PHI of 14 days. Eleven trials on peanuts in the USA were conducted according to the US GAP with a PHI of 13–14 days. Azoxystrobin residues, in ranked order, were (n = 11): < 0.01 (5), 0.01 (4), 0.06, and 0.13 mg/kg.
The Meeting estimated a maximum residue level for azoxystrobin in peanut of 0.2 mg/kg and an STMR value of 0.01 mg/kg.
Sunflower seed
The Meeting received results from supervised trials with azoxystrobin used on sunflower in the USA.
The GAP of the USA for sunflower specifies a rate of 0.28 kg ai/ha with a seasonal total of 0.5 kg ai/ha and a PHI of 30 days. Six trials on sunflower in the USA were conducted according to the US GAP with a seasonal application of 0.5 kg ai/ha (three applications of 0.12, 0.26, and 0.12 kg ai/ha) and a PHI of 28–30 days. Azoxystrobin residues, in ranked order, were (n = 6): 0.01, 0.03 (2), 0.05, 0.08, and 0.24 mg/kg.
The Meeting estimated a maximum residue level for sunflower seed of 0.5 mg/kg and an STMR value of 0.04 mg/kg.
Herbs
The Meeting received results from supervised trials with azoxystrobin used on basil, chives, mint, and parsley in the USA.
The GAP of the USA for herbs (including basil, chives, parsley) specifies a rate of 0.28 kg ai/ha with a seasonal total of 1.7 kg ai/ha (six applications) and a PHI of 0 days.
Three trials on basil were conducted according to the GAP of the USA for herbs with 5–6 applications. Azoxystrobin residues in fresh basil were: 23, 25, and 48 mg/kg. Four trials on chives were conducted according to the US GAP. Azoxystrobin residues in fresh chives were 1.1, 2.7, 4.2,

Azoxystrobin 169
and 7.3 mg/kg. Two trials on parsley were conducted according to the US GAP with five or six applications. Azoxystrobin residues in fresh parsley were 17 and 20 mg/kg.
The GAP of the USA for mint specifies 0.28 kg ai/ha with maximal seasonal application of 1.7 kg ai/ha (six applications) and a PHI of 0 days for fresh mint and a PHI of seven days for mint intended for processing. Two trials in the USA were conducted on fresh mint according to the US GAP with a PHI of 0 days. Azoxystrobin residues in fresh mint were 21 and 25 mg/kg. Five trials were conducted on mint intended for processing according to the US GAP with a PHI of seven days (one trial with a PHI of six days). Azoxystrobin residues in the trials with a PHI of seven days were 4.8, 5.48, 8.0, and 12 mg/kg. Azoxystrobin residue from the trial with a PHI of six days was 17 mg/kg.
The Meeting noted that significantly higher residues were obtained in basil, parsley, and mint (with a critical PHI of 0 days) as compared to chives. Also, the residues in basil, mint, and parsley appear to be from a similar population, were obtained using the same US GAP rate and PHI, and could be used to support an “herbs, fresh” commodity maximum residue level. Azoxystrobin residues in fresh herbs, in ranked order, were (n = 7): 17, 20, 21, 23, 25 (2), and 48 mg/kg.
The Meeting estimated a maximum residue level for azoxystrobin in herbs, (fresh) of 70 mg/kg and an STMR value of 23 mg/kg.
Legume animal feeds
Peanut fodder
The Meeting received results in peanut hay from supervised trials with azoxystrobin on peanuts in the USA.
The GAP of the USA for peanuts specifies an application rate of 0.45 kg ai/ha with a seasonal total of 0.9 kg ai/ha (two applications) and a PHI of 14 days. Eleven trials on peanuts in the USA were conducted according to the US GAP with a PHI of 13–14 days. Azoxystrobin residues, in ranked order, were (n = 11): 1.5, 3.0, 3.1, 3.3, 4.0, 4.3, 4.7, 8.3, 8.9, 9.3, and 13 mg/kg. On dry-weight basis (DM=85%), azoxystrobin residues in peanut hay, in ranked order, were (n = 11): 1.8, 3.5, 3.6, 3.9, 4.7, 5.1, 5.5, 9.8, 10, 11, and 15 mg/kg.
The Meeting estimated a maximum residue level for azoxystrobin in peanut fodder of 30 mg/kg, an STMR value of 5.1 mg/kg and a highest residue value of 15 mg/kg.
Soya bean fodder and forage
The Meeting received results in soya bean forage and hay from supervised trials with azoxystrobin used on soya beans in the USA.
The GAP of the USA for soya bean forage and hay specifies 0.28 kg ai/ha, one application and a PHI of 0 days. Nineteen trials on soya beans forage were conducted according to the US GAP. A portion of forage was dried for hay.
Azoxystrobin residues in soya bean forage (n = 19), in ranked order, were: 4.6, 6.8, 7.1, 7.2, 7.4, 7.6, 7.7, 8.3, 8.5, 9.4, 9.5, 9.9, 10, 11, 12 (2), 18, 20, and 23 mg/kg.
Azoxystrobin residues in soya bean hay, in ranked order, were (n = 19): 6.8, 16 (2), 22 (2), 24, 27 (2), 28, 31, 33 (2), 34, 37, 38 (2), 43, 51 and 53 mg/kg. On dry-weight basis (DM=85%), azoxystrobin residues in soya bean hay were (n = 19): 8.0, 19 (2), 26 (2), 28, 32 (2), 33, 36, 39 (2), 40, 44, 45 (2), 51, 60, and 62 mg/kg.
The Meeting estimated an STMR value of 9.4 mg/kg and a highest residue value of 23 mg/kg for azoxystrobin in soya bean forage and a maximum residue level for azoxystrobin in soya bean fodder (dry-weight basis) of 100 mg/kg, an STMR value of 36 mg/kg, and a highest residue value of 62 mg/kg.

170 Azoxystrobin
Straw and fodder (dry) of cereal grains
The Meeting received results in cereal straw from supervised trials with azoxystrobin used on barley, oat, rye, triticale and wheat in Europe and rice in the USA. The Meeting also received results in maize fodder from supervised trials with azoxystrobin used on maize in the USA.
Barley straw
The Meeting received results in barley straw from supervised trials with azoxystrobin used on barley in France, Germany, Italy, the Netherlands, Spain, Sweden, Switzerland, and the UK.
The GAP of France for barley specifies 0.25 kg ai/ha, a maximum two applications, and a PHI of 42 days. The GAP of Spain for barley specifies 0.25 kg ai/ha, a maximum two applications, and a PHI of 36 days. The GAPs of Germany, Italy and the Netherlands for barley specify 0.25 kg ai/ha, a maximum two applications, and a PHI of 35 days. For barley straw, the Meeting decided to consider all trials on barley in continental Europe that were conducted at the GAP rate (± 30%) of 0.25 kg ai/ha, 2–3 applications, and a PHI of 35–42 days.
Seventeen trials in France were conducted at 72–100% GAP rate, with 2–3 applications and a PHI of 35–42 days (both the highest and lowest residues were obtained at a PHI of 42 days). Azoxystrobin residues, in ranked order, were: 0.53, 0.65, 0.67, 0.72, 0.82, 0.84, 0.91 (2), 1.2, 1.3 (3), 1.6 (2), 2.9, 3.6 and 3.7 mg/kg.
Two trials in Germany were conducted at the GAP rate, with three applications, and a PHI of 35 days, resulting in azoxystrobin residues of 2.2 and 2.9 mg/kg. One trial in Germany was carried out at 80% GAP rate, with two applications, and a PHI of 37 days. Azoxystrobin residue was 0.58 mg/kg.
Two trials in Italy were conducted at 100–104% GAP rate, with two applications, and a PHI of 36 days. Azoxystrobin residues were 2.3 (2) mg/kg.
One trial in Netherlands was conducted at the GAP rate, with two applications, and a PHI of 37 days. Azoxystrobin residue was 1.5 mg/kg.
One trial in Spain was conducted at the GAP rate, with two applications, and a PHI of 35 days. Azoxystrobin residue was 1.2 mg/kg. One trial in Spain was carried out at 104% GAP, with two applications, and a PHI of 38 days. Azoxystrobin residue was 5.5 mg/kg.
One trial in Sweden was carried out the GAP rate, with two applications, and a PHI of 42 days. Azoxystrobin residue was 5.3 mg/kg.
Two trials in Switzerland were conducted at 104% GAP rate, with two applications, and a PHI of 36 days. Azoxystrobin residues were 0.39 and 0.48 mg/kg. Four trials in Switzerland were carried out at 80% GAP, with two applications, and a PHI of 35 days. Azoxystrobin residues were 0.50, 0.61, 0.71, and 0.94 mg/kg.
The GAP of the UK for barley specifies 0.25 kg ai/ha, a maximum two applications, and the latest time of application up to and including watery ripe stage (growth stage 71). Three trials in the UK were conducted at the GAP rate, with three applications, and the last application including growth stage 71 (PHIs at harvest were 38–54 days). Azoxystrobin residues in barley straw were 1.6, 3.4, and 4.5 mg/kg.
Combined azoxystrobin residues in barley straw from the trials in Europe (n = 35), in ranked order, were: 0.39, 0.48, 0.50, 0.53, 0.58, 0.61, 0.65, 0.67, 0.71, 0.72, 0.82, 0.84, 0.91 (2), 0.94, 1.2 (2), 1.3 (3), 1.5, 1.6 (3), 2.2, 2.3 (2), 2.9 (2), 3.4, 3.6, 3.7, 4.5, 5.3, and 5.5 mg/kg.
On dry-weight basis (DM=89%), azoxystrobin residues in barley straw were (n = 35): 0.44, 0.54, 0.56, 0.60, 0.65, 0.69, 0.73, 0.75, 0.80, 0.81, 0.92, 0.94, 1.0 (2), 1.1, 1.3 (2), 1.5 (3), 1.7, 1.8 (3), 2.5, 2.6 (2), 3.3 (2), 3.8, 4.0, 4.2, 5.1, 6.0, and 6.2 mg/kg.

Azoxystrobin 171
Maize fodder
The Meeting received results in maize fodder from supervised trials with azoxystrobin used on maize in the USA.
The GAP of the USA for maize specifies 0.28 kg ai/ha with maximal seasonal application of 2.2 kg ai/ha (eight applications) and a PHI of seven days. Twenty trials in the USA were conducted on maize according to the US GAP with a PHI of 6–7 days. Azoxystrobin residues in maize fodder, in ranked order, were (n = 20), 0.88, 1.1, 2.5, 2.6 (2), 2.9, 3.1, 3.2, 3.5, 4.0, 4.4, 4.7, 5.2, 5.3, 7.8, 8.7 (2), 9.3, 16, and 21 mg/kg.
On dry-weight basis (DM=83%), azoxystrobin residues in maize fodder were (n = 20), 1.1, 1.3, 3.0, 3.1 (2), 3.5, 3.7, 3.9, 4.2, 4.8, 5.3, 5.7, 6.3, 6.4, 9.4, 10 (2), 11, 19, and 25 mg/kg.
The Meeting estimated a maximum residue level for azoxystrobin in maize fodder (dry-weight basis) of 40 mg/kg, an STMR value of 5.0 mg/kg, and a highest residue value of 25 mg/kg.
Oat, rye and triticale straw
The Meeting received results in oat, rye, and triticale straw from supervised trials with azoxystrobin in Germany. The GAP of Germany for oat, rye, and triticale specifies 0.25 kg ai/ha, a maximum two applications, and a PHI of 35 days.
Two trials on oat in Germany were conducted at the GAP rate, with three applications, and a PHI of 35 or 36 days. Azoxystrobin residues were 1.0 and 1.5 mg/kg. On dry-weight basis (DM=90%), azoxystrobin residues in oat straw were (n = 2), 1.1 and 1.6 mg/kg.
Two trials on rye in Germany were conducted at the GAP rate, with three applications, and a PHI of 35 days (higher residues were obtained at 42 and 44-day PHIs). Azoxystrobin residues were 2.0 and 2.7 mg/kg. On dry-weight basis (DM=88%), azoxystrobin residues in rye straw were (n = 2) 2.3 and 3.1 mg/kg.
Two trials on triticale in Germany were conducted at the GAP rate, with three applications, and a PHI of 36 days. Azoxystrobin residues were 1.4 and 1.5 mg/kg. On dry-weight basis (DM=90%), azoxystrobin residues in triticale straw were (n = 2), 1.6 and 1.7 mg/kg.
Rice straw
The Meeting received results in rice straw from supervised trials with azoxystrobin used on rice in the USA.
The GAP of the USA for rice specifies 0.34 kg ai/ha with maximal seasonal application of 0.78 kg ai/ha and a PHI of 28 days. Sixteen trials in the USA were conducted on rice according to the US GAP with a maximal seasonal application of 0.78 kg ai/ha (2×0.22 and 1×0.34 kg ai/ha) and a PHI of 26–28 days. Azoxystrobin residues in rice straw (n = 16), in ranked order, were: 0.59, 0.62, 0.78, 0.84, 0.91, 1.9, 2.6, 2.7, 3.2, 4.1, 4.2 (2), 5.0, 6.4, 6.9, and 10 mg/kg.
On dry-weight basis (DM=90%), azoxystrobin residues in rice straw were (n = 16): 0.66, 0.69, 0.87, 0.93, 1.0, 2.1, 2.9, 3.0, 3.6, 4.6, 4.7 (2), 5.6, 7.1, 7.7, and 11 mg/kg.
Wheat straw
The Meeting received results in wheat straw from supervised trials with azoxystrobin used on wheat in France, Germany, Italy, Spain, Switzerland, and the UK.
The GAP of France for wheat specifies 0.25 kg ai/ha, a maximum two applications, and a PHI of 42 days. The GAP of Spain for wheat specifies 0.25 kg ai/ha, a maximum two applications, and a PHI of 36 days. The GAPs of Germany, Italy and the Netherlands for barley specify 0.25 kg ai/ha, a maximum two applications, and a PHI of 35 days. The Meeting decided to consider all trials on wheat in continental Europe that were conducted at the GAP rate (± 30%) of 0.25 kg ai/ha, 2–3 applications, and a PHI of 35–42 days.

172 Azoxystrobin
Thirteen trials on wheat in France were conducted at 80–104% GAP rate, with 2–3 applications and a PHI of 35–42 days. Azoxystrobin residues in wheat straw, in ranked order, were: 0.36, 0.73, 0.75, 0.81, 0.83, 1.7, 1.8, 2.3, 2.4, 2.5, 3.2, 3.5, and 6.2 mg/kg.
Four trials in Germany were conducted at 80–100% GAP rate, with 2–3 applications, and a PHI of 35–42 days (both the highest and lowest residues were obtained at a PHI of 35 days). Azoxystrobin residues, in ranked order, were: 0.36, 0.50, 1.2, and 1.7 mg/kg.
Two trials in Italy were conducted at 100–104% GAP rate, with two applications, and a PHI of 35 days. Azoxystrobin residues were 1.6 and 3.8 mg/kg.
Three trials in Spain were conducted at the GAP rate, with two applications, and a PHI of 35 and 41 days (the 41-day PHI gave the highest residue). Azoxystrobin residues, in ranked order, were: 1.2, 1.9, and 3.5 mg/kg.
Five trials in Switzerland were conducted at 80–108% GAP rate, with two applications, and a PHI of 35 days. Azoxystrobin residues were: 0.22, 0.41 (2), 0.46, and 0.58 mg/kg.
The GAP of the UK for wheat specifies 0.25 kg ai/ha, a maximum two applications, and the latest time of application up to and including watery ripe stage (BBCH growth stage 71). Three trials in the UK were conducted at the GAP rate, with three applications, and the last application including growth stage 71 (PHIs at harvest were 40–59 days). Azoxystrobin residues in wheat straw were 1.6, 2.3, and 5.7 mg/kg.
Combined azoxystrobin residues in wheat straw from the trials in Europe (n = 30), in ranked order, were: 0.22, 0.36 (2), 0.41 (2), 0.46, 0.50, 0.58, 0.73, 0.75, 0.81, 0.83, 1.2 (2), 1.6 (2), 1.7 (2), 1.8, 1.9, 2.3 (2), 2.4, 2.5, 3.2, 3.5 (2), 3.8, 5.7, and 6.2 mg/kg.
On dry-weight basis (DM=88%), azoxystrobin residues in wheat straw were (n = 30): 0.25, 0.41 (2), 0.47 (2), 0.52, 0.57, 0.66, 0.83, 0.85, 0.92, 0.94, 1.4 (2), 1.8 (2), 1.9 (2), 2.0, 2.2, 2.6 (2), 2.7, 2.8, 3.6, 4.0 (2), 4.3, 6.5, and 7.0 mg/kg.
The Meeting agreed that the data on barley, oat, rice, rye, triticale, and wheat straw appear to be from a similar population and could be combined to estimate a “Straw and fodder (dry) of cereal grains, except maize” commodity group maximum residue level. On dry-weight basis, azoxystrobin residues, in ranked order median underlined, were (n = 87): 0.25, 0.41 (2), 0.44, 0.47 (2), 0.52, 0.54, 0.56, 0.57, 0.60, 0.65, 0.66 (2), 0.69 (2), 0.73, 0.75, 0.80, 0.81, 0.83, 0.85, 0.87, 0.92 (2), 0.93, 0.94 (2), 1.0 (3), 1.1 (2), 1.3 (2), 1.4 (2), 1.5 (3), 1.6, 1.7 (3), 1.8 (5), 1.9 (2), 2.0, 2.1, 2.2, 2.3, 2.5, 2.6 (4), 2.7, 2.8, 2.9, 3.0, 3.1, 3.3 (2), 3.6 (2), 3.8, 4.0 (3), 4.2, 4.3, 4.6, 4.7 (2), 5.1, 5.6, 6.0 6.2, 6.5, 7.0, 7.1, 7.7, and 11 mg/kg.
On dry-weight basis, the Meeting estimated a maximum residue level for straw and fodder (dry) of cereal grains, except maize of 15 mg/kg, an STMR value of 1.7 mg/kg, and a highest residue value of 11 mg/kg.
Forage of cereal grains
The Meeting received results in cereal forages from supervised trials with azoxystrobin used on barley, oat, rye, triticale and wheat in Europe and on maize in the USA.
Barley, oat, rye, triticale and wheat forage
The Meeting received results in barley and wheat forage from supervised trials with azoxystrobin applied to barley and wheat in France, Germany, Italy, the Netherlands (barley only), Spain, Switzerland, and the UK. The Meeting also received results in oat, rye, and triticale forage from supervised trials in Germany.
The GAPs in Europe do not specify a PHI for cereal forage. In the case of livestock grazing, it is assumed that animals are unlikely to be foraging within seven days of the application of the fungicide. Therefore, the Meeting decided to consider all trials conducted at ± 30% of the GAP rate

Azoxystrobin 173
available in Europe (0.25 kg ai/ha), with 2–3 applications and with forage data obtained at a PHI of seven days.
Azoxystrobin residues in barley forage (n = 10), in ranked order, were: 0.54, 0.73, 0.75, 1.1, 1.6, 1.8, 1.9, 3.8, 3.9, and 4.0 mg/kg.
Azoxystrobin residues in wheat forage (n = 10), in ranked order, were: 0.61, 1.4, 1.6 (2), 1.8, 1.9, 2.9, 3.2, 4.0, and 5.4 mg/kg.
For oat, rye, and triticale, the Meeting received residue data in forage for days 0 and 20–23 from seven trials.
The Meeting decided to use the data on barley forage to extrapolate to oat forage and data on wheat forage to extrapolate to rye and triticale forage. The Meeting estimated an STMR value of 1.7 mg/kg and a highest value of 4.0 mg/kg for azoxystrobin in barley and oat forage. The Meeting estimated an STMR value of 1.9 mg/kg and a highest residue value of 5.4 mg/kg for azoxystrobin in wheat, rye and triticale forage.
Maize forage
The Meeting received results in maize forage from supervised trials of azoxystrobin applied to maize in the USA.
In the 20 maize trials, harvested for grain and fodder, in the USA (conducted according to the US GAP of 0.28 kg ai/ha with a seasonal total rate of 2.2 kg ai/ha), forage was harvested at the milk stage, 6–7 days after the sixth application (out of eight applications for fodder and grain) of azoxystrobin. Azoxystrobin residues in maize forage (n = 20), in ranked order, were: 0.49, 0.58, 0.65, 0.83, 0.94, 1.0, 1.1, 1.2 (2), 1.5, 1.7, 2.4, 2.7, 2.8 (3), 2.9, 3.6, 3.8, and 7.2 mg/kg.
The Meeting estimated an STMR value of 1.6 mg/kg and a highest residue value of 7.2 mg/kg for azoxystrobin in maize forage.
Sugar beet leaves and tops
The Meeting received results in sugar beet tops from supervised trials with azoxystrobin in the USA. The GAP of the USA for root vegetables (both for leaves and root) specifies a rate of 0.37 kg ai/ha with a seasonal total of 2.2 kg ai/ha (six applications) and a PHI of 0 days.
Nine trials on sugar beet were conducted in the USA according to the US GAP for root vegetables. Azoxystrobin residues in sugar beet tops, in ranked order, were: 5.8, 8.7, 9.5, 11, 16 (2), 22, 25, and 44 mg/kg.
The Meeting estimated an STMR value of 16 mg/kg and a highest residue value of 44 mg/kg for azoxystrobin in sugar beet tops.
Dried herbs
The Meeting received results in dried herbs from supervised trials with azoxystrobin used on basil, chives, and parsley in the USA and on hops in Germany and the UK.
Basil, chives and parsley, dry
The GAP of the USA for herbs (including basil, chives, parsley) specifies a rate of 0.28 kg ai/ha with a seasonal total of 1.7 kg ai/ha (six applications) and a PHI of 0 days.
Two trials on basil were conducted in the USA according to the US GAP. Azoxystrobin residues in dried basil were 139 and 235 mg/kg.
Three trials on chives were conducted in the USA according to the US GAP. Azoxystrobin residues in dried chives were 27, 31, and 45 mg/kg.
Two trials on parsley were conducted in the USA according to the US GAP with five or six applications. Azoxystrobin residues in dried parsley were 135 and 165 mg/kg.

174 Azoxystrobin
The Meeting decided to use the results on dried basil and parsley for the estimation of a maximum residue level for dried herbs, except dry hops. Azoxystrobin residues were (n = 4), 135, 139, 165, and 235 mg/kg.
The Meeting estimated a maximum residue level for azoxystrobin in dried herbs, except dry hops of 300 mg/kg and an STMR value of 152 mg/kg.
Hops, dry
The GAP of Germany for hops specifies a rate of 0.19 kg ai/ha up to BBCH 37, 0.25 kg ai/ha up to BBCH 55, and 0.4 kg ai/ha above BBCH 55, with a total seasonal rate of 0.8 kg ai/ha and a PHI of 28 days.
Four trials on hops in the UK were carried out using six applications of 0.4 kg ai/ha and a PHI of 28 days or two applications at 0.20 kg ai/ha, followed by two applications at 0.30 kg ai/ha and two applications at 0.40 kg ai/ha, with a PHI of 27–28 days. Azoxystrobin residues were (n = 4) 0.83, 1.1, 1.3, and 2.2 mg/kg.
Four trials on hops in Germany were carried out using two applications at 0.23–0.25 kg ai/ha, followed by two applications at 0.30–0.36 kg ai/ha and two applications at 0.40–0.46 kg ai/ha, with a PHI of 26–28 days. Azoxystrobin residues were (n = 4): 5.7, 11 (2), and 12 mg/kg.
Based on the data from the German trials, the Meeting estimated a maximum residue level for azoxystrobin in hops, dry of 30 mg/kg and an STMR value of 11 mg/kg.
Almond hulls
The Meeting received results in almond hulls from supervised trials with azoxystrobin on almonds in the USA.
The GAP of the USA for almonds specifies a rate of 0.28 kg ai/ha with a seasonal total of 1.7 kg ai/ha (six applications) and a PHI of 28 days. Five trials in the USA were conducted on almonds according to the US GAP. Almonds were harvested slightly immature (PHI of 28–29 days) and mature (PHI of 43–44 days). In each trial, azoxystrobin residues in hulls of the mature almonds were higher than those in slightly immature almonds (a PHI specified in the US GAP). Azoxystrobin residues in hulls of mature almonds, in ranked order, were (n = 5): 0.69, 1.5, 1.9, 2.1, and 3.0 mg/kg.
On dry-weight basis (DM=90%), azoxystrobin residues in almond hulls, in ranked order, were (n = 5): 0.77, 1.7, 2.1, 2.3, and 3.3 mg/kg.
On dry-weigh basis, the Meeting estimated a maximum residue level for azoxystrobin almond hulls of 7 mg/kg and an STMR value of 2.1 mg/kg.
Fate of residues during processing
The Meeting received information on the fate of azoxystrobin residues during processing of oranges, grapes, plums, tomato, barley, corn, rice, wheat, soya beans, sunflower, and peanuts and on azoxystrobin fate under hydrolysis conditions simulating commercial food processing.
In a high-temperature hydrolysis study, 97–101% of radiolabelled azoxystrobin remained under conditions simulating industrial processing (temperatures ranging from 90–120 °C; pH 4–6). Therefore, azoxystrobin can be considered stable to simulated pasteurization, baking, brewing, boiling and sterilization.
The processing factors obtained in the processing studies and estimated STMR-P values are summarized in the table below.
Raw agricultural commodity Processed commodity
Name STMR CCN Name Processing STMR-P

Azoxystrobin 175
(mg/kg) factor a (mg/kg)
Orange b 4.9 JF 0004 Orange juice < 0.08 0.39
Orange oil, cold-pressed 4.8 24
AB 0001 Citrus pulp, dry 1.9 9.3
Grapes 0.53 Distillate < 0.04 0.02
DF 0269 Dried grapes (raisins) 0.45 0.24
JF 0269 Grape juice 0.36 0.19
Grape must 0.52 0.28
AB 0269 Grape pomace, dry 5.0 2.7
Grape pomace, wet 3.1 1.6
Pasteurized wine 0.54 0.29
Spirit < 0.04 0.02
Wine 0.67 0.36
Plum c 0.74 DF 0014 Prunes 0.19 0.14
Tomato d 0.44 Tomato conserve < 0.12 0.05
JF 0448 Tomato juice 0.36 0.16
Tomato ketchup 0.47 0.21
VW 0448 Tomato paste 2.6 1.1
Tomato pomace, dry 24 11
Tomato pomace, wet 9.2 4.0
Tomato puree 0.8 0.35
Barley 0.08 Barley malt 0.10 0.01
Barley roots 0.45 0.04
Barley spent grain 0.15 0.01
Beer 0.03 0.002
Maize 0.01 CF 1255 Maize flour 0.73 0.01
Maize grits 0.27 0.003
CF 0645 Maize meal 0.55 0.01
Maize oil, refined OR 0645
(dry milling)
0.64 0.01
Maize oil, refined OR 0645
(wet milling)
6.1 0.06
Maize starch < 0.09 0.001
Rice 0.68 CF 0649 Rice bran, processed 1.2 0.82
CM 1205 Rice grain, polished 0.09 0.06
CM 1207 Rice hulls 4.8 3.3
Wheat 0.01 CF 0654 Wheat bran 0.38 0.004
CP 1211 Wheat bread, white 0.13 0.001
CP 1212 Wheat bread, wholemeal < 0.13 0.001

176 Azoxystrobin
Raw agricultural commodity Processed commodity
STMR Processing STMR-P Name
(mg/kg) CCN Name
factor a (mg/kg)
CF 1210 Wheat flour, low grade 0.25 0.003
CF 1210 Wheat flour, patent 0.25 0.003
CF 1212 Wheat flour, wholemeal 0.25 0.003
Wheat shorts 0.13 0.001
Soya beans 0.06 AB 0541 Soya bean hulls 2.2 0.13
AB 1265 Soya bean meal 0.09 0.01
OR 0541 Soya bean oil, refined 0.77 0.05
Sunflower 0.04 Sunflower meal < 0.08 0.003
OR 0702 Sunflower oil, refined 0.15 0.01
Peanuts 0.01 Peanut meal 1.0 0.01
OC 0697 Peanut oil, crude 4.0 0.04
OR 0697 Peanut oil, refined 3.0 0.03 a Processing factors were mostly obtained in a single study on each crop, except for grapes (4 studies, but a single study
for raisins) and tomato (3 studies), in which case a median processing factor was calculated. b STMR and HR values for citrus fruit commodity group. c STMR and HR values for stone fruit commodity group. d STMR and HR values for fruiting vegetables, other that cucurbits, except fungi and sweet corn commodity group.
Based on the STRM-P value of 0.06 mg/kg, the Meeting estimated a maximum residue level of 0.1 mg/kg for azoxystrobin in maize oil, refined.
Farm animal dietary burden
The Meeting estimated the dietary burden of azoxystrobin in farm animals on the basis of the diets listed in Annex 6 of the 2006 JMPR Report (OECD Feedstuffs Derived from Field Crops). Calculation from the highest residue, STMR (some bulk commodities) and STMR-P values provides the levels in feed suitable for estimating maximum residue levels, while calculation from STMR and STMR-P values for feed is suitable for estimating STMR values for animal commodities.
The table below shows estimated maximum and mean dietary burdens for beef cattle, dairy cattle, broilers, and laying poultry based on the animal diets from the United States/Canada, the European Union, and Australia. The calculations are provided in Annex 6 of the 2008 Report of the JMPR.

Azoxystrobin 177
Azoxystrobin, Animal dietary burden (ppm of dry matter diet)
US-Canada EU Australia
Beef cattle Maximum 34 55 58
Mean 15 19 32 a
Dairy cattle Maximum 33 72 b 39
Mean 16 27 c 20
Poultry - broiler Maximum 0.44 0.62 0.59
Mean 0.44 0.40 0.59
Poultry - layer Maximum 0.44 23 d 0.59
Mean 0.44 9.1e 0.59 a Highest mean beef cattle dietary burden suitable for STMR estimates for mammalian meat. b Highest maximum cattle dietary burden suitable for MRL estimates for milk and mammalian meat. c Highest mean dairy cattle dietary burden suitable for STMR estimates for milk. d Highest maximum poultry dietary burden suitable for MRL estimates for poultry meat and eggs. e Highest mean poultry dietary burden suitable for STMR estimates for poultry meat and eggs.
Farm animal feeding studies
The Meeting received information on lactating dairy cow and laying hen feeding studies.
Fifteen lactating cows were randomly assigned among five dosing groups of three animals each: one control group and four groups dosed at one of three azoxystrobin feeding levels each (5, 25, 75 and 250 ppm based on measured feed intake). All groups were fed for 30 consecutive days. Milk samples were taken twice a day and the daily production bulked into one single sample per cow. Samples of milk collected on days 21–23 were processed into cream and skimmed milk. Average fat contents in the whole milk and cream were 3.7% and 55%, respectively.
Azoxystrobin residues in whole milk, skimmed milk, milk cream and tissues obtained at the 5, 25, 75 and 250 ppm dosing levels in the diet are summarized in the table below.
Matrix Dose (ppm) Highest residue, mg/kg Mean residue, mg/kg
5 0.003 0.002
25 0.006 0.002
75 0.004 0.002
Whole milk
250 0.009 0.004
5 < 0.001 < 0.001
25 < 0.001 < 0.001
75 0.001 0.001
Skimmed milk
250 0.003 0.002
5 < 0.01 < 0.01
25 < 0.01 < 0.01
75 0.02 0.01
Milk cream
250 0.04 0.03
5 < 0.01 < 0.01
25 < 0.01 < 0.01
75 < 0.01 < 0.01
Muscle
250 < 0.01 < 0.01
5 < 0.01 < 0.01
25 0.01 0.01
Liver
75 0.05 0.03

178 Azoxystrobin
Matrix Dose (ppm) Highest residue, mg/kg Mean residue, mg/kg
250 0.07 0.05
5 < 0.01 < 0.01
25 < 0.01 < 0.01
75 0.01 0.01
Kidney
250 0.02 0.02
5 < 0.01 < 0.01
25 < 0.01 < 0.01
75 0.03 0.02
Fata
250 0.03 0.02 a Residues in peritoneal fat, which were higher than residues obtained in subcutaneous fat.
The azoxystrobin residues in muscle were lower than in fat. Also, azoxystrobin accumulated in the cream when whole milk was processed to skimmed milk and cream.
In a hen feeding study, forty eight laying hens were divided into four groups and each group was divided into three pens holding four birds each. Each group was fed for 28 consecutive days with a nominal dose rate of 0, 6, 18, or 60 ppm of azoxystrobin in the diet. Eggs were collected twice daily and the total daily production for each group bulked. On day 21, the eggs were separated into egg yolk and egg white.
At the 60 ppm dosing level in the diet, azoxystrobin residues in eggs (whole egg, egg white, egg yolk) and tissues (muscle, liver, and fat) were < 0.01 mg/kg in all analysed samples. No analyses were carried out on the samples from the lower dose rate groups.
Animal commodity maximum residue levels
The dietary burdens for the estimation of maximum residue levels for azoxystrobin in animal commodities are 72 ppm for cattle and 22 ppm for poultry. The dietary burdens for the estimation of STMR values for animal commodities are 32 ppm for beef cattle, 27 ppm for dairy cattle and 9.1 ppm for poultry.
In the table below, dietary burdens for cattle are shown in round brackets (), feeding levels and resulting residue concentrations in square brackets [], and estimated azoxystrobin concentration related to the dietary burdens are shown without brackets.
Dietary burden (ppm)
Feeding level [mg/kg]
Milk Cream Muscle Liver Kidney Fat
MRL Cattle Mean Mean Highest Highest Highest Highest
(72) 0.002 0.01 < 0.01 0.048 0.01 0.029
[25, 75] [0.002, 0.002]
[< 0.01, 0.01]
[< 0.01,< 0.01] [0.01, 0.05]
[< 0.01, 0.01]
[< 0.01, 0.03]
STMR Beef Cattle Mean Mean Mean Mean
(32) < 0.01 0.013 0.01 0.01
[25, 75] [< 0.01, < 0.01]
[0.01, 0.03] [< 0.01, 0.01]
[< 0.01, 0.02]
STMR Dairy Cattle Mean Mean
(27) 0.002 0.01

Azoxystrobin 179
[25, 75] [0.002, 0.002]
[< 0.01, 0.01]
Maximum dietary burden of 72 ppm for cattle is very close to the 75 ppm dosing level in the cattle feeding study. The residues in muscle were significantly lower (all < 0.01 mg/kg even at the dosing level of 250 ppm) than in fat. Based on the highest residues at the dosing levels of 25 and 75 ppm, the interpolated (estimated) highest residues for the dietary burden of 72 ppm were 0.048 mg/kg in liver, 0.01 mg/kg in kidney, and 0.029 mg/kg in fat.
Based on the mean residues for the dosing levels of 25 and 75 ppm, the interpolated (estimated) mean residues for the beef cattle dietary burden of 32 ppm were 0.013 mg/kg in liver, < 0.01 mg/kg in kidney, and 0.01 mg/kg in fat.
On the fat basis, the Meeting estimated a maximum residue level of 0.05 mg/kg for meat (fat) from mammals (other than marine mammals) and an STMR value of 0.01 mg/kg. Based on the liver results, the Meeting estimated a maximum residue level of 0.07 mg/kg for mammalian edible offal and an STMR value of 0.01 mg/kg.
Based on the mean residues for the dosing levels of 25 and 75 ppm, the interpolated (estimated) mean residues for the dairy cattle dietary burdens of 72 ppm and 27 ppm were in both cases 0.002 mg/kg in milk and 0.01 mg/kg in cream. Based on the average fat content in the cream (55 in the feeding study), the calculated mean residue in milk fats would be 0.018 mg/kg.
The Meeting estimated a maximum residue level for azoxystrobin in whole milk of 0.01 mg/kg and an STMR value of 0.01 mg/kg. The Meeting estimated a maximum residue level for azoxystrobin in milk fats of 0.03 mg/kg and an STMR value of 0.03 mg/kg.
For poultry, the maximum dietary burden of 22 ppm is lower that the dose level of 60 ppm in the hen feeding study, which resulted in azoxystrobin residues < 0.01 mg/kg in eggs and tissues. The Meeting estimated maximum residue levels of 0.01 (*) mg/kg and STMR value of 0 mg/kg for poultry meat (fat), poultry edible offal, and eggs.
RECOMMENDATIONS
On the basis of the data from supervised trials, processing studies, and livestock feeding studies, the Meeting concluded that the residue levels listed below are suitable for establishing maximum residue limits and for IEDI assessment.
Definition of the residue for compliance with MRLs and estimation of dietary intake in plant and livestock commodities: azoxystrobin. Azoxystrobin is fat-soluble.
CCN Commodity MRL (mg/kg) STMR or STMR-P (mg/kg)
AB 0660 Almond hulls 7 dw 2.1 dw
VS 0620 Artichoke, globe 5 1.8
VS 0621 Asparagus 0.01* 0.01
FI 0327 Banana 2 0.03a
Barley forage 1.7
GC 0640 Barley grain 0.5 0.08
Barley malt 0.01
Barley roots 0.04
Barley spent grain 0.01
Beer 0.002
FB 0018 Berries and other small fruits, except cranberry, grapes, and strawberry 5 1.0

180 Azoxystrobin
CCN Commodity MRL (mg/kg) STMR or STMR-P (mg/kg)
VB 0040 Brassica vegetables 5 1.2
VA 0035 Bulb vegetables 10 2.2
VS 0624 Celery 5 0.43
FC 0001 Citrus fruits 15 4.9
AB 0001 Citrus pulp, dry 9.3
SO 0691 Cotton seed 0.7 0.01
FB 0265 Cranberry 0.5 0.23
DF 0269 Dried grapes (= currants, raisins and sultanas) 0.24
DH 0170 Dried herbs, except dry hops 300 152
MO 0105 Edible offal (mammalian) 0.07 0.01
PE 0112 Eggs 0.01* 0
VC 0045 Fruiting vegetables, Cucurbits 1 0.17 (0.02a)
VO 0050 Fruiting vegetables, other than cucurbits, except fungi and sweet corn 3 0.35
JF 0269 Grape juice 0.19
Grape must 0.28
AB 0269 Grape pomace, dry 2.7
Grape pomace, wet 1.6
FB 0269 Grapes 2 0.53
HH 0092 Herbs 70 23
DH 1100 Hops, dry 30 11
VP 0060 Legume vegetables 3 1.0
VL 0482 Lettuce, Head 3 0.28
VL 0483 Lettuce, Leaf 3 0.28
CF 1255 Maize flour 0.01
AS 0654 Maize fodder 40 dw 5.0 dw
Maize forage 1.6
GC 0645 Maize grain 0.02 0.01
Maize grits 0.003
CF 0645 Maize meal 0.01
OR 0645 Maize oil, refined 0.1 0.06
Maize starch 0.001
FI 0345 Mango 0.7 0.05a
MM 0095 Meat from mammals (other than marine mammals) 0.05 (fat) 0.01
FM 0183 Milk fats 0.03 0.03
ML 0106 Milks 0.01 0.01
Oat forage 1.7
GC 0647 Oats 0.5 0.08
JF 0004 Orange juice 0.39
Orange oil, cold-pressed 24
FI 0350 Papaya 0.3 0.02a
SO 0697 Peanut 0.2 0.01
AL 0697 Peanut fodder 30 dw 5.1 dw
Peanut meal 0.01
OC 0697 Peanut oil, crude 0.04

Azoxystrobin 181
CCN Commodity MRL (mg/kg) STMR or STMR-P (mg/kg)
OR 0697 Peanut oil, refined 0.03
HS 0444 Peppers, chilli (dried) 30 3.5
TN 0675 Pistachios 1 0.44
FI 0354 Plantain 2 0.03a
PM 0110 Poultry meat 0.01* 0
PO 0111 Poultry, edible offal of 0.01* 0
DF 0014 Prunes 0.14
GC 0649 Rice 5 0.68
CF 0649 Rice bran, processed 0.82
CM 1205 Rice grain, polished 0.06
CM 1207 Rice hulls 3.3
VR 0075 Root and tuber vegetables 1 0.23
Rye forage 1.9
GC 0650 Rye 0.2 0.01
AL 0541 Soya bean fodder 100 dw 36 dw
AL 1265 Soya bean forage 9.4
AB 0541 Soya bean hulls 0.13
AB 1265 Soya bean meal 0.01
OR 0541 Soya bean oil, refined 0.05
VD 0541 Soya bean (dry) 0.5 0.06
FS 0012 Stone fruits 2 0.74
AS 0081 Straw and fodder (dry) of cereal grains, except maize 15 dw 1.7 dw
FB 0275 Strawberry 10 1.3
AV 0596 Sugar beet leaves or tops 16
Sunflower meal 0.003
OR 0702 Sunflower oil, refined 0.01
SO 0702 Sunflower seed 0.5 0.04
Tomato conserve 0.05
JF 0448 Tomato juice 0.16
Tomato ketchup 0.21
VW 0448 Tomato paste 1.1
Tomato pomace, dry 11
Tomato pomace, wet 4.0
Tomato puree 0.35
TN 0085 Tree nuts, except pistachios 0.01 0.01
Triticale forage 1.9
GC 0653 Triticale 0.2 0.01
CF 0654 Wheat bran 0.004
CP 1211 Wheat bread, white 0.001
CP 1212 Wheat bread, wholemeal 0.001
CF 1210 Wheat flour, low grade 0.003
CF 1210 Wheat flour, patent 0.003
CF 1212 Wheat flour, wholemeal 0.003
Wheat forage 1.9
GC 0654 Wheat 0.2 0.01

182 Azoxystrobin
CCN Commodity MRL (mg/kg) STMR or STMR-P (mg/kg)
Wheat shorts 0.001
Wine 0.36
VS 0469 Witloof chicory (sprouts) 0.3 0.05 a STMR values in edible portion (pulp).
dw=dry-weight basis
DIETARY RISK ASSESSMENT
Long-term intake
The International Estimated Daily Intakes (IEDIs) of azoxystrobin based on STMR and STMR-P values estimated for 82 commodities or commodity groups for the thirteen GEMS/Food regional diets were 2–10% of the maximum ADI (0.2 mg/kg bw). The results are shown in Annex 3 of the 2008 Report of the JMPR. The Meeting concluded that the long-term dietary intake of azoxystrobin residues is unlikely to present a public health concern.
Short-term intake
The 2008 Meeting decided that an ARfD for azoxystrobin is unnecessary and concluded that the short-term dietary intake of azoxystrobin is unlikely to present a public health concern.

Azoxystrobin 183
REFERENCES
Reference Author(s) Year Study Title
07033 Thompson, D 2001 Azoxystrobin: Magnitude of the Residue on Asparagus Syngenta File No. ,Syngenta Report No. 07033, Syngenta File No. ICI5504/3963
07095 Starner, V 2002 Azoxystrobin: Magnitude of the Residue on Cabbage Syngenta File No., Syngenta Report No. 07095, Syngenta File No. ICI5504/3959
07096 Starner, V 2002 Azoxystrobin: Magnitude of the Residue on Broccoli, Syngenta Report No. 07096, Syngenta File No. ICI5504/3958
07364 Starner, V 2002 Azoxystrobin: Magnitude of the Residue on Artichoke Syngenta File No., Syngenta Report No. 07364 , Syngenta File No. ICI5504/3961
0112701 Pointurier, R 2002 Residue Study with Azoxystrobin (ICIA 5504) and Cyproconazole (SAN 619) in or on Barley in France (South) Syngenta File No. SAN619/7229, Syngenta Report No. 0112701
0112702 Pointurier, R 2002 Residue Study with Azoxystrobin (ICIA 5504) and Cyproconazole (SAN 619) in or on Barley in France (South) Syngenta File No. SAN619/7228, Syngenta Report No. 0112702
0112703 Pointurier, R 2002 Residue Study with Azoxystrobin (ICIA 5504) and Cyproconazole (SAN 619) in or on Barley in France (South) Syngenta File No. SAN619/7231, Syngenta Report No. 0112703
0112704 Pointurier, R 2002 Residue Study with Azoxystrobin (ICIA 5504) and Cyproconazole (SAN 619) in or on Barley in France (South) Syngenta File No. SAN619/7230, Syngenta Report No. 0112704
0112901 Pointurier, R 2002 Residue Study with Azoxystrobin (ICIA 5504) and Cyproconazole (SAN 619) in or on Wheat in France (South) Syngenta File No. SAN619/7233, Syngenta Report No. 0112901
0112902 Pointurier, R 2002 Residue Study with Azoxystrobin (ICIA 5504) and Cyproconazole (SAN 619) in or on Wheat in France (South) Syngenta File No. SAN619/7232, Syngenta Report No. 0112902
0113201 Pointurier, R 2002 Residue Study with Azoxystrobin (ICIA 5504) and Cyproconazole (SAN 619) in or on Barley in France (South) Syngenta File No. SAN619/7256, Syngenta Report No. 0113201
0113202 Pointurier, R 2002 Residue Study with Azoxystrobin (ICIA 5504) and Cyproconazole (SAN 619) in or on Barley in France (South) Syngenta File No. SAN619/7255, Syngenta Report No. 0113202
0113203 Pointurier, R 2002 Residue Study with Azoxystrobin (ICIA 5504) and Cyproconazole (SAN 619) in or on Barley in France (South) Syngenta File No. SAN619/7254, Syngenta Report No. 0113203
0113204 Pointurier, R 2002 Residue Study with Azoxystrobin (ICIA 5504) and Cyproconazole (SAN 619) in or on Barley in France (South) Syngenta File No. SAN619/7253, Syngenta Report No. 0113204
0113301 Pointurier, R 2002 Residue Study with Azoxystrobin (ICIA 5504) and Cyproconazole (SAN 619) in or on Wheat in France (South). Syngenta Report No. 0113301
0113302 Pointurier, R 2002 Residue Study with Azoxystrobin (ICIA 5504) and Cyproconazole (SAN 619) in or on Wheat in France (South). Syngenta Report No. 0113302
03-6000 Sole, C 2004 Residue Study with Azoxystrobin (ICI5504) in or on Leek in Southern France Syngenta File No. ICI5504/2618, Syngenta Report No. 03-6000
05-6000 Elliott, A 2005 Azoxystrobin (ICI5504): Residue Analysis of Broccoli from two field trials conducted in Germany (2004) Syngenta File No. ICI5504/3068, Syngenta Report No. 05-6000.

184 Azoxystrobin
Reference Author(s) Year Study Title
02-6033 McGill, C 2004 Residue Study with Azoxystrobin (ICI5504) in or on Papaya in Brazil Syngenta File No. ICI5504/2340, Syngenta Report No. 02-6033
02-6034 McGill, C 2004 Residue Study with Azoxystrobin (ICI5504) in or on Papaya in Brazil Syngenta File No. ICI5504/2366, Syngenta Report No. 02-6034
03-6034 Sole, C 2004 Residue study with Azoxystrobin (ICI5504) in or on Summer Leek in France (South) Syngenta File No. ICI5504/2669, Syngenta Report No. 03-6034
03-6035 Sole, C 2004 Residue Study with Azoxystrobin (ICI5504) in or on Summer Leek in France (South) Syngenta File No. ICI5504/2619, Syngenta Report No. 03-6035
03-6036 Sole, C 2004 Residue Study with Azoxystrobin (ICI5504) in or on Leek in Switzerland Syngenta File No. ICI5504/2616, Syngenta Report No. 03-6036
02-6037 McGill, C 2004 Residue Study with Azoxystrobin (ICI5504) in or on Papaya in Brazil Syngenta File No. ICI5504/2339, Syngenta Report No. 02-6037
03-6037 Sole, C 2004 Residue Study with Azoxystrobin (ICI5504) in or on Leek in Switzerland Syngenta File No. ICI5504/2617, Syngenta Report No. 03-6037
02-6038 McGill, C 2004 Residue Study with Azoxystrobin (ICI5504) in or on Papaya in Brazil Syngenta File No. ICI5504/2367, Syngenta Report No. 02-6038
02-6088 McGill, C 2004 Residue Study with Azoxystrobin (ICI5504) in or on Mangoes in South Africa during 2002, Syngenta Report No. 02-6088. Syngenta File No. ICI5504/2232.
02-6089 McGill, C 2004 Residue Study with Azoxystrobin (ICI5504) in or on Mangoes in South Africa during 2002. Syngenta Report No. 02-6089. Syngenta File No. ICI5504/2233.
02-6090 McGill, C 2004 Residue Study with Azoxystrobin (ICI5504) in or on Mangoes in South Africa during 2002, Syngenta Report No. 02-6090. Syngenta File No. ICI5504/2234.
02-6091 McGill, C 2004 Residue Study with Azoxystrobin (ICI5504) in or on Mangoes in South Africa during 2002, Syngenta Report No. 02-6091. Syngenta File No. ICI5504/2235.
02-6101 McGill, C 2003 Residue Study with Azoxystrobin (ICI5504) in or on Brussels sprouts in Spain Syngenta File No. ICI5504/1903, Syngenta Report No. 02-6101
02-6102 McGill, C 2003 Residue Study with Azoxystrobin (ICI5504) in or on Brussels sprouts in Spain Syngenta File No. ICI5504/1902, Syngenta Report No. 02-6102
03-0301 Sole, C 2004 Residue study with Azoxystrobin (ICI5504) in or on Barley in Italy Syngenta File No. ICI5504/2659, Syngenta Report No. 03-0301
03-0302 Sole, C 2004 Residue study with Azoxystrobin (ICI5504) in or on Barley in Italy Syngenta File No. ICI5504/2660, Syngenta Report No. 03-0302
03-0303 Sole, C 2004 Residue study with Azoxystrobin (ICI5504) in or on Barley in France (South) Syngenta File No. ICI5504/2661, Syngenta Report No. 03-0303
03-0304 Sole, C 2004 Residue Study with Azoxystrobin (ICI5504) in or on Barley in France (South) Syngenta File No. ICI5504/2455, Syngenta Report No. 03-0304
03-0305 Sole, C 2004 Residue Study with Azoxystrobin (ICI5504) in or on Barley in Spain Syngenta File No. ICI5504/2454, Syngenta Report No. 03-0305

Azoxystrobin 185
Reference Author(s) Year Study Title
03-0306 Benazeraf, L 2004 Residue Study with Azoxystrobin (ICI5504) in or on Wheat in Italy Syngenta File No. ICI5504/2632, Syngenta Report No. 03-0306
03-0307 Benazeraf, L 2004 Residue Study with Azoxystrobin (ICI5504) in or on Wheat in Italy Syngenta File No. ICI5504/2633, Syngenta Report No. 03-0307
03-0308 Benazeraf, L 2004 Residue Study with Azoxystrobin (ICI5504) in or on Wheat in France (South) Syngenta File No. ICI5504/2634, Syngenta Report No. 03-0308
03-0309 Benazeraf, L 2004 Residue Study with Azoxystrobin (ICI5504) in or on Wheat in France (South) Syngenta File No. ICI5504/2728, Syngenta Report No. 03-0309
03-0310 Benazeraf, L 2004 Residue Study with Azoxystrobin (ICI5504) in or on Wheat in Spain Syngenta File No. ICI5504/2727, Syngenta Report No. 03-0310
03-0401 Sole, C 2004 Residue Study with Azoxystrobin (ICI5504) in or on Winter Wheat in the UK Syngenta File No. ICI5504/2726, Syngenta Report No. 03-0401
03-0402 Sole, C 2004 Residue Study with Azoxystrobin (ICI5504) in or on Winter Wheat in the UK Syngenta File No. ICI5504/2725, Syngenta Report No. 03-0402
03-0403 Sole, C 2004 Residue Study with Azoxystrobin (ICI5504) in or on Wheat in France (North) Syngenta File No. ICI5504/2449, Syngenta Report No. 03-0403
03-0404 Sole, C 2004 Residue Study with Azoxystrobin (ICI5504) in or on Wheat in Switzerland Syngenta File No. ICI5504/2448, Syngenta Report No. 03-0404
03-0406 Benazeraf, L 2004 Residue Study with Azoxystrobin (ICI5504) in or on Barley in UK Syngenta File No. ICI5504/2453, Syngenta Report No. 03-0406
03-0407 Benazeraf, L 2004 Residue Study with Azoxystrobin (ICI5504) in or on Barley in The Netherlands Syngenta File No. ICI5504/2452, Syngenta Report No. 03-0407
03-0408 Benazeraf, L 2004 Residue Study with Azoxystrobin (ICI5504) in or on Barley in Switzerland Syngenta File No. ICI5504/2724, Syngenta Report No. 03-0408
03-0414 Sole, C 2004 Residue Study with Azoxystrobin (ICI5504) in or on Wheat in Switzerland Syngenta File No. ICI5504/2723, Syngenta Report No. 03-0414
03-0418 Benazeraf, L 2004 Residue Study with Azoxystrobin (ICI5504) in or on Barley in Switzerland. Syngenta Report No. 03-0418
04-0302 Benazeraf, L 2005 Azoxystrobin (ICI5504):Residue Study in or on Winter Wheat in Southern France Syngenta File No. ICI5504/3035, Syngenta Report No. 04-0302
04-0303 Benazeraf, L 2005 Azoxystrobin (ICI5504):Residue Study in or on Winter Wheat in Spain Syngenta File No. ICI5504/3041, Syngenta Report No. 04-0303
04-0304 Benazeraf, L 2005 Azoxystrobin (ICI5504):Residue Study in or on Winter Barley in Southern France Syngenta File No. ICI5504/3000, Syngenta Report No. 04-0304
04-0305 Benazeraf, L 2005 Azoxystrobin (ICI5504):Residue Study in or on Winter Barley in Spain Syngenta File No. ICI5504/3001, Syngenta Report No. 04-0305
04-0308 Benazeraf, L 2005 Azoxystrobin (ICI5504):Residue Study in or on Winter Wheat in United Kingdom Syngenta File No. ICI5504/3003, Syngenta Report No. 04-0308

186 Azoxystrobin
Reference Author(s) Year Study Title
04-0403 Benazeraf, L 2005 Azoxystrobin (ICI5504):Residue Study in or on Winter Barley in the United Kingdom Syngenta File No. ICI5504/3004, Syngenta Report No. 04-0403
04-0407 Benazeraf L 2005 Azoxystrobin (ICI5504):Residue Study in or on Broccoli in the Netherlands Syngenta File No. ICI5504/2995, Syngenta Report No. 04-0407.
04-0604 Benazeraf, L 2005 Azoxystrobin (ICI5504):Residue Study in or on Broccoli in Spain Syngenta File No. ICI5504/3006, Syngenta Report No. 04-0604
05-0302 Bour D 2006 Azoxystrobin (ICI5504):Residue study in or on broccoli in Spain Syngenta File No. ICI5504/3376, Syngenta Report No. 05-0302
05-0309 Bour, D 2006 Azoxystrobin (ICI5504):Residue study in or on potatoes in France (south) Syngenta File No. ICI5504/3380, Syngenta Report No. 05-0309
1983/030-D2149
Unsworth, C 2002 Azoxystrobin:Residue Levels in Brussels sprouts from Field Trials conducted in Southern France during 2001 Syngenta File No. ICI5504/1495, Syngenta Report No. 1983/030-D2149
1983/031-D2149
Unsworth, C 2002 Azoxystrobin:Residue Levels in Brussels sprouts from Field Trials conducted in Germany during 2001 Syngenta File No. ICI5504/1494, Syngenta Report No. 1983/031-D2149
1983/032-D2149
Mills, H 2002 Azoxystrobin:Residue Levels in Brussels sprouts from Field Trials conducted in Austria during 2001 Syngenta File No. ICI5504/1352, Syngenta Report No. 1983/032-D2149
1983/033-D2149
Unsworth, C 2002 Azoxystrobin:Residue Levels in Brussels sprouts from Trials conducted in the UK during 2001 Syngenta File No. ICI5504/1493, Syngenta Report No. 1983/033-D2149
1983/034-D2149
Unsworth, C 2002 Azoxystrobin:Residue Levels in Head Cabbage from Trials conducted in Italy during 2001 Syngenta File No. ICI5504/1359, Syngenta Report No. 1983/034-D2149.
1983/035-D2149
Unsworth, C 2002 Azoxystrobin:Residue Levels in Head Cabbage from Trials conducted in 2001, Syngenta File No. ICI5504/1407, Syngenta Report No. 1983/035-D2149.
1983/036-D21496
Mills, H 2002 Azoxystrobin:Residue Levels in Head Cabbages from Trials conducted in Austria during 2001 Syngenta File No. ICI5504/1348, Syngenta Report No. 1983/036-D2149
1983/037-D2149
Mills, H 2002 Azoxystrobin Residue Levels in Cauliflower from Trials conducted in the United Kingdom during 2001 Syngenta File No. ICI5504/1347, Syngenta Report No. 1983/037-D2149
1983/038-D2149
Mills, H 2002 Azoxystrobin Residue Levels in Cauliflower from Trials conducted in Spain during 2001 Syngenta File No. ICI5504/1350, Syngenta Report No. 1983/038-D2149
1983/039-D2149
Unsworth, C 2002 Azoxystrobin:Residue levels in cauliflower from field trials conducted in Germany during 2001 Syngenta File No. ICI5504/1406, Syngenta Report No. 1983/039-D2149
1983/040-D2149
Mills, H 2002 Azoxystrobin:Residue Levels in Cauliflower from Field Trials conducted in Austria during 2001 Syngenta File No. ICI5504/1351, Syngenta Report No. 1983/040-D2149
2071/01 Pointurier, R 2002 Residue Study with Azoxystrobin (ICI 5504) and Cyproconazole (SAN 619) in or on Barley in Switzerland Syngenta File No. SAN619/7190, Syngenta Report No. 2071/01
2072/01 Pointurier, R 2002 Residue Study with Azoxystrobin (ICI 5504) and Cyproconazole (SAN 619) in or on Barley in Switzerland Syngenta File No. SAN619/7189, Syngenta Report No. 2072/01

Azoxystrobin 187
Reference Author(s) Year Study Title
2073/01 Pointurier, R 2002 Residue Study with Azoxystrobin (ICI 5504) and Cyproconazole (SAN 619) in or on Barley in Switzerland Syngenta File No. SAN619/7188, Syngenta Report No. 2073/01
2074/01 Pointurier, R 2002 Residue Study with Azoxystrobin (ICI 5504) and Cyproconazole (SAN 619) in or on Barley in Switzerland Syngenta File No. SAN619/7187, Syngenta Report No. 2074/01
2075/01 Pointurier, R 2002 Residue Study with Azoxystrobin (ICI 5504) and Cyproconazole (SAN 619) in or on Wheat in Switzerland Syngenta File No. SAN619/7186, Syngenta Report No. 2075/01
2076/01 Pointurier, R 2002 Residue Study with Azoxystrobin (ICI 5504) and Cyproconazole (SAN 619) in or on Wheat in Switzerland Syngenta File No. SAN619/7185, Syngenta Report No. 2076/01
2077/01 Pointurier, R 2002 Residue Study with Azoxystrobin (ICI 5504) and Cyproconazole (SAN 619) in or on Wheat in Switzerland Syngenta File No. SAN619/7184, Syngenta Report No. 2077/01
2078/01 Pointurier, R 2002 Residue Study with Azoxystrobin (ICI 5504) and Cyproconazole (SAN 619) in or on Wheat in Switzerland Syngenta File No. SAN619/7183, Syngenta Report No. 2078/01
39/1986 Timme, G 1986 Pflanzenshutz-nachrichten Bayer 39/1986, 2, 188-204. Statistical interpretation and graphical representation of the degradation behaviour of pesticide residues. Part II. Bayer AgroSciences, Germany. Syngenta File No. CGA64250/2611.
493-01 Ediger, K 2002 Azoxystrobin:Magnitude of the Residues in or on Green Onion Syngenta File No., Syngenta Report No. 493-01, Syngenta File No. ICI5504/3957
495-01 Ediger, K 2002 Azoxystrobin:Magnitude of the Residues in or on Garden Beet Syngenta File No., Syngenta Report No. 495-01, Syngenta File No. ICI5504/3962
BR2301P624, BR2301P625, BR2301P626
Francisco, E 2002 Amistar:Magnitude of Residues of Azoxystrobin in Mango— Brazil 2001 (3 Trials), Syngenta, Brazil. Syngenta File No. ICI5504/1675, Syngetna Report No. BR2301P624, BR2301P625, BR2301P626.
CEMR-1708 Kang, J 2003 Independent Laboratory Validation of Method RAM 305/02 for the Determination of Residues of Azoxystrobin and R230310 in Leafy Crops, Brassicae and Root/Tuber Crops, CEMAS Ltd., UK. Report No. CEMR-1708. Syngenta File No. ICI5504/1411.
CEMR-1732 Kang, J and Fiorini, T 2002 Azoxystrobin:Residue Levels in Celery from Trials Conducted in Italy during 2001. Syngenta Report No. CEMR-1732.
CEMR-1742 Nagra, B 2002 Azoxystrobin:Residue Levels in Potatoes from Trials conducted in Spain during 2001 Syngenta File No. ICI5504/1367, Syngenta Report No. CEMR-1742
CEMR-1743 Kang, J 2002 Azoxystrobin:Residue Levels in Potatoes from Trials conducted in the Netherlands during 2001 Syngenta File No. ICI5504/1366, Syngenta Report No. CEMR-1743
CEMR-1744 Nagra, B 2002 Azoxystrobin:Residue Levels in Potatoes from Trials conducted in the UK during 2001 Syngenta File No. ICI5504/1365, Syngenta Report No. CEMR-1744
CEMR-1907 Atkinson, S 2003 Independent Laboratory Validation of a Method for the Determination of Residues of Azoxystrobin in Animal Tissues, CEM Analytical Services Ltd, Syngenta, UK. Report No. CEMR-1907. Syngenta File No. ICI5504/1921.
CEMR-1962 Kang, J 2003 Residue Study with Azoxystrobin (ICI 5504) in or on Brussels sprouts in The Netherlands Syngenta File No. ICI5504/2175, Syngenta Report No. CEMR-1962

188 Azoxystrobin
Reference Author(s) Year Study Title
CEMR-1963 Kang, J 2003 Residue Study with Azoxystrobin (ICI5504) in or on Brussels sprouts in the Netherlands Syngenta File No. ICI5504/1867, Syngenta Report No. CEMR-1963
CEMR-1964 Kang, J 2004 Residue Study with Azoxystrobin (ICI 5504) in or on Leek in Northern France Syngenta File No. ICI5504/1973, Syngenta Report No. CEMR-1964
CEMR-1965 Kang, J 2004 Residue Study with Azoxystrobin (ICI 5504) in or on Leek in Northern France Syngenta File No. ICI5504/1974, Syngenta Report No. CEMR-1965
CEMR-1966 Kang, J 2004 Residue Study with Azoxystrobin (ICI 5504) in or on Leek in Southern France Syngenta File No. ICI5504/1971, Syngenta Report No. CEMR-1966
CEMR-1969 Kang, J 2004 Residue Study with Azoxystrobin (ICI 5504) in or on Leek in the UK Syngenta File No. ICI5504/1968, Syngenta Report No. CEMR-1969
CEMR-1970 Kang, J 2004 Residue Study with Azoxystrobin (ICI 5504) in or on Leek in Germany Syngenta File No. ICI5504/1969, Syngenta Report No. CEMR-1970
CEMR-1971 Kang, J 2004 Residue Study with Azoxystrobin (ICI 5504) in or on Leek in Germany Syngenta File No. ICI5504/1970, Syngenta Report No. CEMR-1971
CEMR-1995 Kang, J 2003 Independent Laboratory Validation of Residue Analytical Method RAM 305/02 for the Determination of Azoxystrobin and R230310 in Dried Hops, CEM Analytical Services Ltd, UK. Report No. CEMR-1995. Syngenta File No. ICI5504/1976.
CEMR-488 Coombe, N 1995 Independent Laboratory Confirmation of an Analytical Method for the Determination of Residues of ICIA5504 in Pecans, CEM Analytical Service, Ltd., UK. Report No. CEMR-488. Syngenta File No. ICI5504/0272.
CEMR-516 Coombe, N 1996 Independent Laboratory Confirmation of an Analytical Method for the Determination of Residues of ICIA5504 in Animal Tissue, Milk and Eggs, CEM Analytical Service, Ltd., UK. Report No. CEMR-516. Syngenta File No. ICI5504/0273.
CEMR-835 Kennedy, S 1998 Azoxystrobin:Magnitude of the Residue on Bananas. Syngenta File No. ICI5504/0579, Syngenta Report No. CEMR-835.
gba32301 Simon, P 2002 Determination of Residues of Azoxystrobin and Cyproconazole in Winter Barley in Germany. Syngenta Report No. gba32301
gba92301 Simon, P 2002 Determination of Residues of Azoxystrobin and Cyproconazole in Winter Barley in Germany Syngenta File No. SAN619/7261, Syngenta Report No. gba92301
GLP 99/021 Dissemond, A 2001 Erstellung einer Abbaureihe zur Rückstandsbestimmung von Azoxystrobin nach Anwendung von Ortiva gegen falschen Mehltau und Alternaria_Blattflecken and Kohlrabi unter Glas Syngenta File No. ICI5504/1461, Syngenta Report No. GLP 99/021
gwh32401 Simon, P 2002 Determination of Residues of Azoxystrobin and Cyproconazole in Winter Wheat in Germany Syngenta File No. SAN619/7260, Syngenta Report No. gwh32401 (amended)
gwh92401 Simon, P 2002 Determination of Residues of Azoxystrobin and Cyproconazole in Winter Wheat in Germany Syngenta File No. SAN619/7259, Syngenta Report No. gwh92401 (amended)
HVA 13/02 Fuchsbichler, G 2002 Determination of the residues of Azoxystrobin in salad onions, kohlrabi, little radish and celery (leaves, tuber) Syngenta File No. ICI5504/1864, Syngenta Report No. HVA 13/02. Syngenta File No. ICI5504/2766.

Azoxystrobin 189
Reference Author(s) Year Study Title
IF-04/ 00192716
Klimmek, S 2004 Analytical Method Development and Validation of the DFG Method S19 for the Determination of Residues of Azoxystrobin and the Metabolite R230310 in Plant Matrices, Chemische und Biologische Laboratorien AG, Report No. IF-04/00192716.
IR-4 06721 Starner, V 2000 Azoxystrobin:Magnitude of the Residue on Blueberry. Syngenta File No. ICI5504/4024, Syngenta Report No. IR-4 PR 06721
IR-4 06786 Starner, V 2001 Azoxystrobin:Magnitude of the Residue on Caneberry. Syngenta File No. ICI5504/4023, Syngenta Report No. IR-4 PR 06786
IR-4 06830 Starner, V 2001 Azoxystrobin:Magnitude of the Residues on Pistachio, IR-4 Project, Center for Minor Crop Pest Management Technology Center of New Jersey, Rutgers University, NJ, USA. Report No. IR-4 PR 06830, Syngenta File No. ICI5504/3964
IR-4 06867 Thompson, D 2000 Azoxystrobin:Magnitude of the Residue on Mango. Syngenta File No. ICI5504/1422, Syngenta Report No. IR-4 PR 06867
IR-4 07104 Chen, H 2002 Azoxystrobin:Magnitude of the Residue on Basil, Syngenta Report No. IR-4 No. 07104. Syngenta File No. Syngenta File No. ICI5504/3965
IR-4 07105 Chen, H 2004 Azoxystrobin:Magnitude of the Residue on Chives Syngenta File No. ICI5504/2389, Syngenta Report No. 07105
IR-4 07593 Thompson, D 2004 Azoxystrobin:Magnitude of the Residue on Citrus Following Field and Post-Harvest Treatment Syngenta File No. ICI5504/2927, Syngenta Report No. IR4-07593
IR-4 07593 Thompson, D 2004 Azoxystrobin:Magnitude of the Residue on Citrus Following Field and Post-Harvest Treatment Syngenta File No. 435451, Syngenta Report No. IR4-07593, ICI5504/2927
M03059 Casagrande, C 2004 Amistar:Magnitude of Residues of Azoxystrobin and R230310 in Mango, Brazil, 2003-04 (3 Trials). Syngenta, Brazil. Syngenta File No. ICI5504/2487. Report No. M03059.
RAM 243 EPA Method
Burke, S and Sapiets, A - RAM 243: EPA Enforcement Method: Residue Analytical Method for the Analysis of Azoxystrobin and R230310 in Crops. Syngenta File No. ICI5504/0254.
RAM 255/01 Ryan, J and Sapiets, A 1994 Standard Operating Procedure: RAM/255/01:Residue Analytical Method for the Analysis of ICIA5504 and R230310 in Animal Tissues and Milk, Jealott’s Hill Research Station, Zeneca Agrochemicals, UK. SOP RAM 255/01. Syngenta File No. ICI5504/1012.
RAM 255/03, RAM 255/04
Ryan, J 1996 1997
Standard Operating Procedure:RAM 255/03, RAM 255/04:Residue Analytical Method for the Analysis of ICIA5504 and R230310 in Animal Tissue, Egg and Milk, Jealott’s Hill Research Station, Zeneca Agrochemicals, UK. SOP RAM 255/03 and RAM 255/04.
RAM 255: EPA Enforcement Method
Burke, S and Sapiets, A RAM 255:EPA Enforcement Method: Residue Analytical Method for the Analysis of Azoxystrobin in Animal Tissue, Egg and Milk. RAM 255. Syngenta File No. ICI5504/0258.
RAM 260/01 Burke, S and Gentle, W 1995 Standard Operating Procedure: RAM 260/01:Residue Analytical Method for the Analysis of ICIA5504 and R230310 in Peanuts and Pecans, Jealott’s Hill Research Station, Zeneca Agrochemicals, UK. SOP RAM 260/01. Syngenta File No. ICI5504/1008.
RAM 260/02, RAM 260/03
Burke, S 1996 1997
Standard Operating Procedure: RAM 260/02, RAM 260/03: Residue Analytical Method for the Analysis of Azoxystrobin and R230310 in Crops of High lipid Content, Jealott’s Hill Research Station, Zeneca Agrochemicals, UK. SOP RAM 260/02, RAM 260/03.

190 Azoxystrobin
Reference Author(s) Year Study Title
RAM 260: EPA Enforcement Method
Burke, S - RAM 260: EPA Enforcement Method: Residue Analytical Method for the Analysis of Azoxystrobin and R230310 in Peanuts and Pecans. Syngenta File No. ICI5504/0255.
RAM 305/01, RAM 305/02
Robinson, N. 1999 Standard Operating Procedure: RAM 305/01, RAM 305/02: Residue Analytical Method for the Determination of Azoxystrobin and R230310 in Crops, Jealott’s Hill Research Station, Zeneca Agrochemicals, UK. SOP RAM 305/01, RAM 305/02.
RAM 305/03 Chaggar S 2004 Standard Operating Procedure:RAM 305/03:,Residue Analytical Method for the Determination of Residues of Azoxystrobin and R230310 in Crop Samples, Final Determination by LC-MS/MS, Jealott’s Hill International Research Centre, Syngenta. SOP RAM 305/03.
RAM 399/01 Crook, S 2002 Standard Operating Procedure:RAM 399/01: Residue Analytical Method for the Determination of Azoxystrobin and R230310 in Bovine Muscle Tissue, Fat and Milk, Lamb Liver and Kidney and Hen Egg Samples, Final Determination by HPLC-MS-MS. Syngenta. SOP RAM 399/01.
RAM/243/01 Clarke, D and Sapiets, A 1993 Standard Operating Procedure: RAM/243/01:Residue Analytical Method for the Analysis of ICIA5504 and R230310 in Cereals and Vines, Jealott’s Hill Research Station, Zeneca Agrochemicals, UK. SOP RAM 243/01. Syngenta File No. ICI5504/1019.
RAM/243/02 Clarke, D and Sapiets, A 1994 Standard Operating Procedure: RAM/243/02:Residue Analytical Method for the Analysis of ICIA5504 and R230310 in Cereals and Vines, Jealott’s Hill Research Station, Zeneca Agrochemicals, UK. SOP RAM 243/02. Syngenta File No. ICI5504/2392.
RAM/243/03 Clarke, D and Sapiets, A 1994 Standard Operating Procedure: RAM/243/02:Residue Analytical Method for the Analysis of ICIA5504 and R230310 in Cereals and Vines, Jealott’s Hill Research Station, Zeneca Agrochemicals, UK. SOP RAM 243/03. Syngenta File No. ICI5504/1021.
RAM/243/04 Burke, S 1996 Standard Operating Procedure:RAM/243/04:Residue Analytical Method for the Analysis of Azoxystrobin and R230310 in Crops, Jealott’s Hill Research Station, Zeneca Agrochemicals, UK. SOP RAM 243/04. Syngenta File No. ICI5504/2393.
RAM/243/05 Burke, S 1997 Standard Operating Procedure: RAM/243/04:Residue Analytical Method for the Analysis of Azoxystrobin and R230310 in Crops, Jealott’s Hill Research Station, Zeneca Agrochemicals, UK. SOP RAM 243/05. Syngenta File No. ICI5504/1389.
RAM/243/06 Burke, S 2000 Standard Operating Procedure: RAM/243/04:Residue Analytical Method for the Analysis of Azoxystrobin and R230310 in Crops, Jealott’s Hill Research Station, Zeneca Agrochemicals, UK. SOP RAM 243/06. Syngenta File No. ICI5504/0252.
RJ1411B Wollerton, C and Husband, R 1993 ICIA5504: Physico-chemical Study on Technical Grade Active Ingredient, Jealott’s Hill Research Station, Zeneca Agrochemicals, UK. Report No. RJ1411B. Syngenta File No. ICI5504/0027.
RJ1412B Wollerton, C and Husband, R 1993 ICIA5504: Physico-chemical Study on Pure Active Ingredient, Jealott’s Hill Research Station, Zeneca Agrochemicals, UK. Report No. RJ1412B. Syngenta File No. ICI5504/0028.
RJ1541B Rowe, D and Lane, M 1994 ICIA5504:,Adsorption and Desorption in Soil. Jealott’s Hill Research Station, Zeneca Agrochemicals, UK. Report No. RJ1541B. Syngenta File No. ICI5504/0784.

Azoxystrobin 191
Reference Author(s) Year Study Title
RJ1557B Clarke D and Sapiets, A 1994 ICIA5504 and R230310:Validation of a Method for the Determination of Residues in Cereals and Vines, Jealott’s Hill Research Station, Zeneca Agrochemicals, UK. Report No. RJ1557B. Syngenta File No. ICI5504/1024.
RJ1658B Moffat, F 1994 ICIA5504:Quantum yield and environmental half-life for direct phototransformation in aqueous solution. Jealott’s Hill Research Station, Zeneca Agrochemicals, UK. Report No. RJ1658B. Syngenta File No. ICI5504/0822.
RJ1676B Earl, V and Hadfield, S 1994 ICIA5504:Metabolism in Vines, Jealott’s Hill Research Station, Jealott’s Hill Research Station, Zeneca Agrochemicals, UK. Report No. RJ1676B. Syngenta File No. ICI5504/0285.
RJ1679B Warinton, J 1994 ICIA5504:Degradation in Water Sediment Systems under Laboratory Conditions. Jealott’s Hill Research Station, Zeneca Agrochemicals, UK. Report No. RJ1679B. Syngenta File No. ICI5504/0829.
RJ1682B Wilkinson, M 1994 ICIA5504: Metabolism in Winter Wheat, Jealott’s Hill Research Station, Zeneca Agrochemicals, UK. Report No. RJ1682B. Syngenta File No. ICI5504/0286.
RJ1694B Butters, C and Mason, R 1994 ICIA5504:Mobility of ICIA5504 and its Degradation Products in Prepared Soil Columns. Jealott’s Hill Research Station, Zeneca Agrochemicals, UK. Report No. RJ1694B. Syngenta File No. ICI5504/0786.
RJ1705B Kuet, S and Hadfield, S 1994 ICIA5504: Aqueous Photolysis at pH 7, Jealott’s Hill Research Station, Zeneca Agrochemicals, UK. Report 1705B. Syngenta File No. ICI5504/0823.
RJ1716B Winter, L and Joseph, R 1995 ICIA5504:Soil Surface Photolysis, Jealott’s Hill Research Station, Zeneca Agrochemicals, UK. Report No. RJ1716B. Syngenta File No. ICI5504/0779.
RJ1717B Steel, T and Joseph, R 1994 ICIA5504:Hydrolysis at pH 5, 7, and 9 at 25 and 50 ºC. Jealott’s Hill Research Station, Zeneca Agrochemicals, UK. Report No. RJ1717B. Syngenta File No. ICI5504/0824.
RJ1722B Hall, G 1994 ICIA5504:Residue levels in Winter Cereals and Soil from Trials carried out in the United Kingdom during 1993. Jealott's Hill Research Station Report No. RJ1722B. Syngenta File No. ICI5504/0624.
RJ1729B Burke, S and Sapiets, A 1995 ICIA5504 and R230310:Validation of a Method for the Determination of Residues in Cereals and Vines. Final Report. Jealott’s Hill Research Station, Zeneca Agrochemicals, UK. Report No. RJ1729B. Syngenta File No. ICI5504/0260.
RJ1739B Bonfanti, F. 1995 ICIA5504:Residue levels in Grapes, Grape Process Fractions and Soil from a Trial carried out in Italy during 1993. Jealott's Hill Research Station Report No. RJ1739B. Syngenta File No. ICI5504/0711.
RJ1744B Renard, C and Sapiets, A 1994 ICIA5504:Residue levels in Winter Cereals and Soil from Trials carried out in France during 1993. Jealott's Hill Research Station Report No. RJ1744B. Syngenta File No. ICI5504/0625.
RJ1754B Mason, R and Butters, CA 1994 ICIA5504:Degradation in Soil under Aerobic and Anaerobic Conditions. Jealott’s Hill Research Station, Zeneca Agrochemicals, UK. Report No. RJ1754B. Syngenta File No. ICI5504/0772.
RJ1756B Sapiets, A 1994 ICIA5504:Residue Levels in Cereals and Soil from Trials carried out in Germany during 1993. Syngenta File No. ICI5504/0626, Syngenta Report No. RJ1756B
RJ1766B Sapiets, A 1994 ICIA5504:Residue Levels in Cereals and Soil from Trials carried out in France during 1993. Syngenta Report No. RJ1766B

192 Azoxystrobin
Reference Author(s) Year Study Title
RJ1762B Burke, S and Sapiets, A 1994 ICIA5504:Residue Levels in Cereals from Trials carried out in Germany during 1993. Syngenta File No. ICI5504/0627, Syngenta Report No. RJ1762B
RJ1775B Sapiets, A 1995 ICIA5504:Residue Levels in Cereals and Soil from Trials carried out in France during 1993. Syngenta File No. ICI5504/0629, Syngenta Report No. RJ1775B
RJ1787B Burke, S 1995 ICIA5504 and R230310:Validation of a Method for the Determination of Residues in Peanuts and Pecans, Jealott’s Hill Research Station, Zeneca Agrochemicals, UK. Report No. RJ1787B. Syngenta File No. ICI5504/0261.
RJ1801B Warinton, JS 1995 ICIA5504:Degradation of 14C-labelled compound in soil under laboratory conditions, Jealott’s Hill Research Station, Zeneca Agrochemicals, UK. Report No. RJ1801B. Syngenta File No. ICI5504/0777.
RJ1805B Mayes, S. 1995 ICIA5504:Metabolism of Orally Administered Multiple Doses in the Lactating Goat, Jealott’s Hill Research Station, Zeneca Agrochemicals, UK. Report No. RJ1805B (Interim Report). Syngenta File No. ICI5504/0736.
RJ1807B Webb, J 1995 ICIA5504:Metabolism in Peanuts. Jealott’s Hill Research Station, Zeneca Agrochemicals, UK. Report No. RJ1807B. Syngenta File No. ICI5504/1273.
RJ1809B Ryan, J and Sapiets, A 1996 Validation of a Method for the Determination of Residues in Animal Tissue, Eggs and Milk, Jealott’s Hill Research Station, Zeneca Agrochemicals, UK. Report No. RJ1809B. Syngenta File No. ICI5504/0264.
RJ1815B Sapiets, A 1995 ICIA5504:Residue levels in grapes process fractions and soil from a trial carried out in France during 1993. Jealott's Hill Research Station, Zeneca Agrochemicals, UK. Report No. RJ1815B. Syngenta File No. ICI5504/0710.
RJ1819B Tummon, O 1995 ICIA5504:Laboratory Degradation in Three Selected Soil Types. Jealott’s Hill Research Station, Zeneca Agrochemicals, UK. Report No. RJ1819B. Syngenta File No. ICI5504/0781.
RJ1858B Burke, S 1995 ICIA5504 and R230310:Storage Stability in Various Crops Stored Deep Frozen for up to two years. Interim Report 1 (Cereals, Grapes and Wine). Jealott’s Hill Research Station., Zeneca Agrochemicals, UK. Report No. RJ1858B. Syngenta File No. ICI5504/0262.
RJ1860B Sapiets, A and Roper, E 1995 ICIA5504:Residue Levels in Grapes From Trials Carried out in the United States of America during 1994. Syngenta File No. ICI5504/0531, Syngenta Report No. RJ1860B
RJ1861B Joseph, R 1994 ICIA5504:Metabolism in Rice, Jealott’s Hill Research Station., Zeneca Agrochemicals. Syngenta File No. ICI5504/0288, Syngenta Report No. RJ1861B.
RJ1863B Sapiets, A 1995 ICIA5504:Residue Levels in Grapes and Grape Process Fractions From a Trial Carried Out in the USA During 1994. Syngenta File No. ICI5504/0708, Syngenta Report No. RJ1863B
RJ1870B Sapiets, A 1995 ICIA5504 Residue Levels in Cereals from Trials carried out in Germany during 1994. Syngenta File No. ICI5504/0630, Syngenta Report No. RJ1870B.
RJ1878B Sapiets, A and Ryan, J 1995 ICIA5504:Residue Transfer Study in Dairy Cows Fed on a diet containing the fungicide. Jealott's Hill Research Station Report No. RJ1878B. Syngenta File No. ICI5504/0740.
RJ1888B Allin, R 1995 ICIA5504:Metabolism in Winter Wheat, Jealott’s Hill Research Station, Zeneca Agrochemicals, UK. Report No. RJ1888B. Syngenta File No. ICI5504/0287.

Azoxystrobin 193
Reference Author(s) Year Study Title
RJ1899B Sapiets, A 1995 ICIA5504:Residue levels in Cereals and soil from Trials carried out in the United Kingdom during 1994. Jealott's Hill Research Station. Report No. RJ1899B. Syngenta File No. ICI5504/0631.
RJ1900B Sapiets, A and Ryan, J 1995 ICIA5504:Residue levels in Spring Barley from a Trial carried out in Sweden during 1994, Jealott's Hill Research Station. Report No. RJ1900B.
RJ1918B Sapiets, A and Ryan, J 1995 ICIA5504:Residue levels in Cereals and Soil from Trials carried out in France during 1994, Jealott's Hill Research Station. Report No. RJ1918B. Syngenta File No. ICI5504/0635.
RJ1928B Earl, M 1995 ICIA5504:Field Soil Dissipation in a Trial carried out in France during 1993/94. Jealott’s Hill Research Station, Zeneca Agrochemicals, UK. Report No. RJ1928B. Syngenta File No. ICI5504/0802.
RJ1935B Earl, M and Chamier, O 1994 ICIA5504:Field Dissipation in a Trial carried out in Germany during 1993/94. Final Report. Jealott’s Hill Research Station, Zeneca Agrochemicals, UK. Report No. RJ1935B. Syngenta File No. ICI5504/0803.
RJ1938B Earl, M 1995 ICIA5504: Field Soil Dissipation in a trial carried out in France during 1993/94. Final Report. Jealott’s Hill Research Station, Zeneca Agrochemicals, UK. Report No. RJ1938B. Syngenta File No. ICI5504/0804.
RJ1940B Earl, M 1995 ICIA5504:Field Soil Dissipation in a Trial carried out in the United Kingdom during 1993/94. Final Report. Jealott’s Hill Research Station, Zeneca Agrochemicals, UK. Report No. RJ1940B. Syngenta File No. ICI5504/0795.
RJ1941B Earl, M 1995 ICIA5504:Field Soil Dissipation in a trial carried out in France During 1993/94. Jealott’s Hill Research Station, Zeneca Agrochemicals, UK. Report No. RJ1941B. Syngenta File No. ICI5504/0805.
RJ1942B Earl, M 1995 ICIA5504:Field Soil Dissipation in a trial carried out in Italy during 1993/94. Jealott’s Hill Research Station, Zeneca Agrochemicals, UK. Report No. RJ1942B. Syngenta File No. ICI5504/0806.
RJ1943B Earl, M 1995 ICIA5504:Field Dissipation in a trial carried out in France during 1994/95. Jealott’s Hill Research Station, Zeneca Agrochemicals, UK. Report No. RJ1943B. Syngenta File No. ICI5504/0807.
RJ1944B Earl, Ml. 1995 ICIA5504:Field Soil Dissipation in a trial carried out in Italy during 1994/95. Jealott’s Hill Research Station, Zeneca Agrochemicals, UK. Report No. RJ1944B. Syngenta File No. ICI5504/0808.
RJ1945B Earl, M 1995 ICIA5504:Field Dissipation in a trial carried out in the United Kingdom during 1994/95, Jealott’s Hill Research Station, Zeneca Agrochemicals, UK. Report No. RJ1945B. Syngenta File No. ICI5504/0809.
RJ1946B Earl, M and Kappes, E 1995 ICIA5504:Field Soil Dissipation in a trial carried out in Germany During 1994/95. Jealott’s Hill Research Station, Zeneca Agrochemicals, UK. Report No. 1946B. Syngenta File No. ICI5504/0810.
RJ1950B Sapiets, A 1995 Residue Levels in Pecans from Trials Carried Out in the United States of America During 1994. Syngenta File No. ICI5504/0677, Syngenta Report No. RJ1950B. Syngenta File No. ICI5504/0677.
RJ1952B Wollerton, C and Husband, R 1995 ICIA5504: Density, Surface Tension and Hazard Data, Jealott’s Hill Research Station, Zeneca Agrochemicals, UK. Report No. RJ1952B. Syngenta File No. ICI5504/0029.

194 Azoxystrobin
Reference Author(s) Year Study Title
RJ1957B Turner, J and Bramley, Y 1995 ICIA5504:Further Characterisation of Residues in liver following Oral Administration of Multiple Doses to the Lactating Goat, Jealott’s Hill Research Station, Zeneca Agrochemicals, UK. Report No. RJ1957B. Syngenta File No. ICI5504/0741.
RJ1967B Tummon, O 1995 R234886:Aqueous Hydrolysis at pH 4, 7 and 9 at 50 ºC. Jealott’s Hill Research Station, Zeneca Agrochemicals, UK. Report No. RJ1976B. Syngenta File No. ICI5504/0827.
RJ1980B Sapiets, A and Roper ,E 1996 ICIA5504:Residue Levels in Peanuts and Peanut Process Fractions from a Trial carried out in the United States of America during 1994, Jealott’s Hill Research Station, Zeneca Agrochemicals, UK. Report No. RJ1980B. Syngenta File No. ICI5504/0725.
RJ2000B Mason, R 1995 ICIA5504:Fate of Radiolabelled Material Applied to Bare Soil in California, USA in June 1994 Including Data up to One Year. Jealott’s Hill Research Station, Zeneca Agrochemicals, UK. Report No. RJ2000B. Syngenta File No. ICI5504/0797.
RJ2006B Sapiets, A 1996 ICIA5504:Residue Levels in Tomatoes and Tomato Process Fractions from a Trial Carried out in the United States of America During 1994. Syngenta File No. ICI5504/0426, Syngenta Report No. RJ2006B
RJ2056B Burke, S 1996 ICIA5504 + R230310:Storage Stability in Various Crops Stored Deep Frozen for up to Two Years. Interim Report (Peanuts, Pecans, Tomatoes), Jealott’s Hill Research Station, Zeneca Agrochemicals, UK. Report No. RJ2056B. Syngenta File No. ICI5504/0271.
RJ2064B Clarke, DM and Gallardo, E 1996 ICIA5504:Residue Levels in Melons from a Trial carried out in Spain during 1995. Syngenta Report No. RJ2064B
RJ2065B Sapiets, A,. 1996 ICIA5504:Residue Levels in Wheat Grain and Milled Process Fractions from a Trial Carried Out in Germany During 1995, Syngenta Report No. RJ2065B. Syngenta File No. ICI5504/0718.
RJ2070B Burke, SR and Clarke, DM 1996 ICIA5504 and Fenpropimorph:Residue levels in Cereals from Trials carried out in Germany during 1995. Jealott's Hill Research Station Report No. RJ2070B.
RJ2083B Webb, J, 1996 ICIA5504:Metabolism of Orally Administered Multiple Doses in the Lactating Goat, Jealott’s Hill Research Station, Zeneca Agrochemicals, UK. Report RJ2083B (Final Report). Syngenta File No. ICI5504/0739.
RJ2084B Bramley, Y and Turner, J 1996 ICIA5504:Metabolism of Orally Administered Multiple Doses in Laying Hens. Jealott’s Hill Research Station, Zeneca Agrochemicals, UK. Report No. RJ2084B. Syngenta File No. ICI5504/0738.
RJ2093B Clarke, D 1996 ICIA5504:Residue Levels in Melons from a Trial carried out in Greece during 1995. Syngenta File No. ICI5504/0547, Syngenta Report No. RJ2093B
RJ2115B Sapiets, A 1996 ICIA5504:Residue Levels in Pecans from a Trial Carried out in the United States of America During 1995 Syngenta File No. ICI5504/0680, Syngenta Report No. RJ2115B
RJ2118B Sapiets, A 1996 Azoxystrobin Residue Levels in Cucumbers from Trials carried out in France during 1995. Syngenta File No. ICI5504/0438, Syngenta Report No. RJ2118B
RJ2136B Clarke, DM and Gallardo, E 1996 ICIA5504:Residue Levels in Melons from a Trial carried out in Spain during 1995. Syngenta Report No. RJ2136B
RJ2139B Ryan, J 1996 ICIA5504:Residue Levels in Cucumbers from a Trial carried out in Germany during 1995. Syngenta File No. ICI5504/0440, Syngenta Report No. RJ2139B
RJ2143B Clarke, DM and Compagnon, JM
1996 Azoxystrobin:Residue Levels in Melons from Trials carried out in France during 1995. Syngenta Report No. RJ2143B

Azoxystrobin 195
Reference Author(s) Year Study Title
RJ2169B Sapiets, A 1996 Azoxystrobin:Residue Levels in Cucumbers from a Trial Conducted in the United Kingdom during 1996. Syngenta File No. ICI5504/0434, Syngenta Report No. RJ2169B
RJ2190B Clarke, D 1996 Azoxystrobin:Residue Levels in Melons from a Trial carried out in Italy during 1995. Syngenta File No. ICI5504/0447, Syngenta Report No. RJ2190B
RJ2201B Sapiets, A 1996 Azoxystrobin:Residue Levels in Rice From Trials Conducted in the United States of America During 1995. Syngenta File No. ICI5504/0641, Syngenta Report No. RJ2201B
RJ2205B Sapiets, A and Roper, E 1996 Azoxystrobin:Residue Levels in Rice and Rice Process Fractions From a Trial Conducted in the United States of America During 1995. Syngenta File No. ICI5504/0716, Syngenta Report No. RJ2205B
RJ2211B Burke, S 1997 Azoxystrobin:Residue Levels in Glasshouse Cucumbers from a Trial carried out in Germany during 1996 Syngenta File No. ICI5504/0458, Syngenta Report No. RJ2211B
RJ2221B Burke, S 1996 Azoxystrobin and R230310:Storage Stability in Various Processed Crops Stored Deep Frozen for up to One Year. Final Report. Jealott’s Hill Research Station, Zeneca Agrochemicals, UK. Report No. RJ2221B. Syngenta File No. ICI5504/0275.
RJ2223B Burke, S 1997 Azoxystrobin:Residue Levels in Glasshouse Cucumbers from a Trial carried out in the United Kingdom during 1996. Syngenta File No. ICI5504/0456, Syngenta Report No. RJ2223B
RJ2238B Clarke, D 1997 Azoxystrobin:Residue Levels in Melons from a Trial carried out in Spain during 1996. Syngenta File No. ICI5504/0472, Syngenta Report No. RJ2238B
RJ2245B Clarke, DM and Bonfanti, F 1997 Azoxystrobin:Residue Levels in Cucumbers from a Trial carried out in Iatly during 1996. Syngenta Report No. RJ2245B
RJ2246B Clarke, D 1997 Azoxystrobin:Residue Levels in Melons from Trials carried out in Italy during 1996. Syngenta File No. ICI5504/0474, Syngenta Report No. RJ2246B
RJ2247B Clarke, D 1997 Azoxystrobin:Residue Levels in Glasshouse Melons from a Trial carried out in Greece during 1996. Syngenta File No. ICI5504/0476, Syngenta Report No. RJ2247B
RJ2251B Clarke, D 1997 Azoxystrobin:Residue Levels in Glasshouse Cucumbers From a Trial Carried Out in Greece During 1996. Syngenta File No. ICI5504/0494, Syngenta Report No. RJ2251B
RJ2253B Clarke, D 1997 Azoxystrobin:Residue Levels in Glasshouse Melons from a Trial carried out in The Netherlands during 1996. Syngenta File No. ICI5504/0567, Syngenta Report No. RJ2253B
RJ2266B Farrelly, E 1997 Azoxystrobin:Residue Levels in Indoor Cucumbers From a Trial Carried Out in France During 1996. Syngenta File No. ICI5504/0462, Syngenta Report No. RJ2266B
RJ2269B Farrelly, E 1997 Azoxystrobin:Residue Levels in Melons from a Trial carried out in Spain during 1996. Syngenta File No. ICI5504/0529, Syngenta Report No. RJ2269B
RJ2274B Sapiets, A 1997 Azoxystrobin:Residue Levels in Cucumber From a Trial carried out in Spain during 1996. Syngenta File No. ICI5504/0464, Syngenta Report No. RJ2274B
RJ2280B Farrelly, E 1997 Azoxystrobin:Residue Levels in Peppers from a Trial Carried Out in Spain During 1996. Syngenta File No. ICI5504/0466, Syngenta Report No. RJ2280B
RJ2294B Sapiets, A 1997 Azoxystrobin:Residue Levels in Tomatoes from Trials conducted in France during 19 96. Syngenta File No. ICI5504/0468, Syngenta Report No. RJ2294B

196 Azoxystrobin
Reference Author(s) Year Study Title
RJ2297B Clarke, D 1997 Azoxystrobin:Residue Levels in Wheat and Wheat Products from a Trial Carried Out in Germany During 1996 Syngenta File No. ICI5504/0639, Syngenta Report No. RJ2297B
RJ2305B Clarke, D 1997 Azoxystrobin:Residue Levels in Melons from Trials carried out in France during 1996. Syngenta File No. ICI5504/0478, Syngenta Report No. RJ2305B
RJ2336B Sapiets, A 1997 Azoxystrobin:Residue Levels in Glasshouse Melons from Trials conducted in Spain during 1996. Syngenta File No. ICI5504/0470, Syngenta Report No. RJ2336B
RJ2341B Clarke, D 1997 Azoxystrobin:Residue Levels in Tomatoes from a Trial carried out in Greece during 1996. Syngenta File No. ICI5504/0481, Syngenta Report No. RJ2341B
RJ2345B Clarke, D 1997 Azoxystrobin:Residue Levels in Tomatoes from a Trial carried out in Spain during 1996. Syngenta File No. ICI5504/0483, Syngenta Report No. RJ2345B
RJ2352B Sapiets, A 1997 Storage Stability in Animal Products Stored Deep Frozen for up to Ten Months, Jealott’s Hill Research Station, Zeneca Agrochemicals, UK. Report No. RJ2352B. Syngenta File No. ICI5504/0277.
RJ2375B Sapiets, A 1997 Azoxystrobin:Residue Levels in Tomatoes from a Trial conducted in Italy during 1996. Syngenta Report No. RJ2375B. Syngenta File No. ICI5504/0479.
RJ2385B Burke, S 1997 Azoxystrobin and R230310:Verification of SOP RAM 260 for Crops of High Lipid Content, Jealott’s Hill Research Station, Zeneca Agrochemicals, UK. Report No. RJ2385B. Syngenta File No. ICI5504/0278.
RJ2404B Burke, S 1997 Azoxystrobin and R230310:Storage Stability of Various Crops Stored Deep Frozen for up to Two Years. Final Report. Jealott’s Hill Research Station, Zeneca Agrochemicals, UK. Report No. RJ2404B. Syngenta File No. ICI5504/0279.
RJ2452B Sapiets,A 1998 Azoxystrobin and Flutriafol: Residue Levels in Malting Barley and Brewing fractions from a Trial Conducted in the United Kingdom During 1996 Syngenta File No. ICI5504/1125, Syngenta Report No. RJ2452B
RJ2488B Clarke, D 1998 Azoxystrobin:Residue Levels in Tomatoes and Process Fractions from Trials carried out in Italy during 1997. Syngenta File No. ICI5504/0706, Syngenta Report No. RJ2488B
RJ2489B Clarke, D 1998 Azoxystrobin:Residue Levels in Glasshouse Tomatoes from Trials carried out in France during 1997. Syngenta File No. ICI5504/0489, Syngenta Report No. RJ2489B
RJ2490B Clarke, D 1998 Azoxystrobin:Residue Levels in Tomatoes from Trials carried out in Spain during 1997. Syngenta File No. ICI5504/0491, Syngenta Report No. RJ2490B
RJ2552B Clarke, D 1998 Azoxystrobin:Residue Levels in Glasshouse Tomatoes from a Trial Carried out in the Netherlands During 1997. Syngenta File No. ICI5504/0487, Syngenta Report No. RJ2552B
RJ2562B Clarke, D 1998 Azoxystrobin:Residue Levels in Glasshouse Sweet Peppers from Trials carried out in France during 1997. Syngenta File No. ICI5504/0501, Syngenta Report No. RJ2562B
RJ2589B Gill, J 1998 Azoxystrobin:Residue Levels in Gherkins from a Study Carried Out in Germany during 1997. Syngenta File No. ICI5504/0499, Syngenta Report No. RJ2589B
RJ2662B Clarke, D 1998 Azoxystrobin:Residue Levels in Sweet Peppers from Trials carried out in Italy during 1997. Syngenta File No. ICI5504/0504, Syngenta Report No. RJ2662B
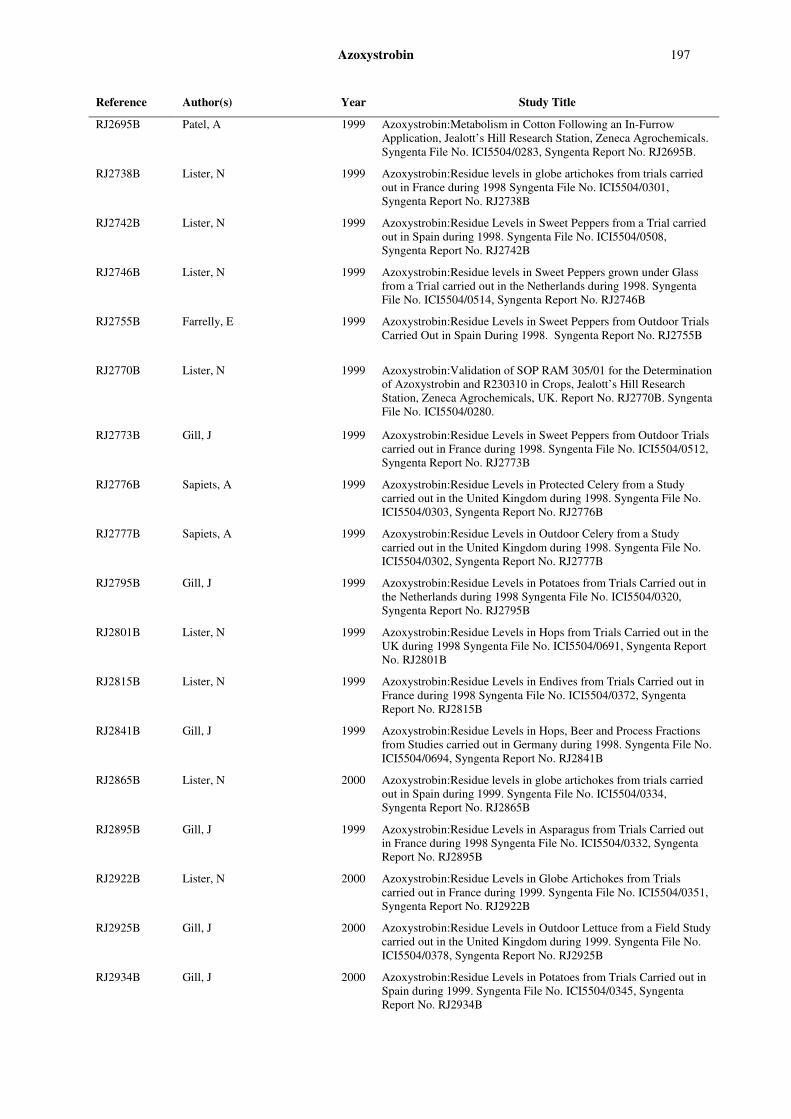
Azoxystrobin 197
Reference Author(s) Year Study Title
RJ2695B Patel, A 1999 Azoxystrobin:Metabolism in Cotton Following an In-Furrow Application, Jealott’s Hill Research Station, Zeneca Agrochemicals. Syngenta File No. ICI5504/0283, Syngenta Report No. RJ2695B.
RJ2738B Lister, N 1999 Azoxystrobin:Residue levels in globe artichokes from trials carried out in France during 1998 Syngenta File No. ICI5504/0301, Syngenta Report No. RJ2738B
RJ2742B Lister, N 1999 Azoxystrobin:Residue Levels in Sweet Peppers from a Trial carried out in Spain during 1998. Syngenta File No. ICI5504/0508, Syngenta Report No. RJ2742B
RJ2746B Lister, N 1999 Azoxystrobin:Residue levels in Sweet Peppers grown under Glass from a Trial carried out in the Netherlands during 1998. Syngenta File No. ICI5504/0514, Syngenta Report No. RJ2746B
RJ2755B Farrelly, E 1999 Azoxystrobin:Residue Levels in Sweet Peppers from Outdoor Trials Carried Out in Spain During 1998. Syngenta Report No. RJ2755B
RJ2770B Lister, N 1999 Azoxystrobin:Validation of SOP RAM 305/01 for the Determination of Azoxystrobin and R230310 in Crops, Jealott’s Hill Research Station, Zeneca Agrochemicals, UK. Report No. RJ2770B. Syngenta File No. ICI5504/0280.
RJ2773B Gill, J 1999 Azoxystrobin:Residue Levels in Sweet Peppers from Outdoor Trials carried out in France during 1998. Syngenta File No. ICI5504/0512, Syngenta Report No. RJ2773B
RJ2776B Sapiets, A 1999 Azoxystrobin:Residue Levels in Protected Celery from a Study carried out in the United Kingdom during 1998. Syngenta File No. ICI5504/0303, Syngenta Report No. RJ2776B
RJ2777B Sapiets, A 1999 Azoxystrobin:Residue Levels in Outdoor Celery from a Study carried out in the United Kingdom during 1998. Syngenta File No. ICI5504/0302, Syngenta Report No. RJ2777B
RJ2795B Gill, J 1999 Azoxystrobin:Residue Levels in Potatoes from Trials Carried out in the Netherlands during 1998 Syngenta File No. ICI5504/0320, Syngenta Report No. RJ2795B
RJ2801B Lister, N 1999 Azoxystrobin:Residue Levels in Hops from Trials Carried out in the UK during 1998 Syngenta File No. ICI5504/0691, Syngenta Report No. RJ2801B
RJ2815B Lister, N 1999 Azoxystrobin:Residue Levels in Endives from Trials Carried out in France during 1998 Syngenta File No. ICI5504/0372, Syngenta Report No. RJ2815B
RJ2841B Gill, J 1999 Azoxystrobin:Residue Levels in Hops, Beer and Process Fractions from Studies carried out in Germany during 1998. Syngenta File No. ICI5504/0694, Syngenta Report No. RJ2841B
RJ2865B Lister, N 2000 Azoxystrobin:Residue levels in globe artichokes from trials carried out in Spain during 1999. Syngenta File No. ICI5504/0334, Syngenta Report No. RJ2865B
RJ2895B Gill, J 1999 Azoxystrobin:Residue Levels in Asparagus from Trials Carried out in France during 1998 Syngenta File No. ICI5504/0332, Syngenta Report No. RJ2895B
RJ2922B Lister, N 2000 Azoxystrobin:Residue Levels in Globe Artichokes from Trials carried out in France during 1999. Syngenta File No. ICI5504/0351, Syngenta Report No. RJ2922B
RJ2925B Gill, J 2000 Azoxystrobin:Residue Levels in Outdoor Lettuce from a Field Study carried out in the United Kingdom during 1999. Syngenta File No. ICI5504/0378, Syngenta Report No. RJ2925B
RJ2934B Gill, J 2000 Azoxystrobin:Residue Levels in Potatoes from Trials Carried out in Spain during 1999. Syngenta File No. ICI5504/0345, Syngenta Report No. RJ2934B

198 Azoxystrobin
Reference Author(s) Year Study Title
RJ2935B Gill, J 2000 Azoxystrobin:Residue Levels in Potatoes from Trials Carried out in Italy during 1999. Syngenta File No. ICI5504/0338, Syngenta Report No. RJ2935B
RJ2939B Gill, J 2000 Azoxystrobin:Residue Levels in Potatoes from a Trial Carried out in the UK During 1999. Syngenta File No. ICI5504/0354, Syngenta Report No. RJ2939B
RJ2947B Gill, J 2000 Azoxystrobin:Residue Levels in Outdoor Celery from a Field Study carried out in the United Kingdom during 1999. Syngenta File No. ICI5504/0352, Syngenta Report No. RJ2947B
RJ2950B Gill, J 2000 Azoxystrobin:Residue Levels in Gherkins from a Study Carried out in Germany During 1999. Syngenta File No. ICI5504/0519, Syngenta Report No. RJ2950B
RJ2981B Gill, J 2000 Azoxystrobin:Residue Levels in Hops from Trials Carried out in the UK During 1999. Syngenta File No. ICI5504/0696, Syngenta Report No. RJ2981B
RJ3015B Gill, J 2000 Residue Levels in Hops, Beer and Process Fractions from Studies carried out in Germany during 1999. Syngenta File No. ICI5504/0698, Syngenta Report No. RJ3015B
RJ3042B Ryan, J 2000 Azoxystrobin:Residue Levels in Endives from Trials Carried Out in Northern France During 1999. Syngenta File No. ICI5504/0382, Syngenta Report No. RJ3042B
RJ3093B White, B 2001 Azoxystrobin:Residue Levels in Outdoor Lettuces from Trials carried out in Spain during 1999. Syngenta File No. ICI5504/1218, Syngenta Report No. RJ3093B
RJ3106B White ,B and Sutra, G 2001 Azoxystrobin:Residue Levels in Outdoor Lettuces from Trials carried out in France during 1999. Syngenta File No.ICI5504/1216, Syngenta Report No. RJ3106BB
RJ3112B Ryan, J and Gallardo, E 2001 Azoxystrobin:Residue Levels in Outdoor Lettuce from a Trial carried out in Spain during 1999. Syngenta File No.ICI5504/0385, Syngenta Report No. RJ3112B
RJ3120B Fillingham, S 2001 Azoxystrobin:Residue Levels in Potatoes from Trials conducted in The Netherlands during 2000 Syngenta File No. ICI5504/1244, Syngenta Report No. RJ3120B
RJ3122B Lister, N 2001 Azoxystrobin Residue Levels in Artichokes from Trials Conducted in Northern France during 2000 Syngenta File No. ICI5504/0367, Syngenta Report No. RJ3122B
RJ3130B Richards, S 2001 Azoxystrobin:Residue Levels in Potatoes from a Trial conducted in Spain during 2000 Syngenta File No. ICI5504/1221, Syngenta Report No. RJ3130B
RJ3131B Fillingham, S and Iniesta, L 2001 Azoxystrobin:Residue Levels in Outdoor Lettuces from Trials conducted in Spain during 2000. Syngenta File No. ICI5504/1226, Syngenta Report No. RJ3131B
RJ3145B Richards, S 2001 Azoxystrobin:Residue Levels in Outdoor Lettuces from Trials conducted in the UK during 2000. Syngenta File No. ICI5504/1239, Syngenta Report No. RJ3145B
RJ3150B Gill, J 2001 Azoxystrobin:Residue Levels in Outdoor Lettuce from a Study carried out in the United Kingdom during 2000. Syngenta File No. ICI5504/1150, Syngenta Report No. RJ3150B
RJ3156B Gill, J 2001 Azoxystrobin:Residue Levels in Potatoes from a Trial conducted in the UK during 2000 Syngenta File No. ICI5504/1155, Syngenta Report No. RJ3156B
RJ3170B Gil,l J 2005 Stability in Crops and Processed Commodities During Frozen Storage (Final Report), Jealott’s Hill International Research Centre, Syngenta, UK. Report No. RJ3170B. Syngenta File No. ICI5504/1975.

Azoxystrobin 199
Reference Author(s) Year Study Title
RJ3178B McGill, C 2001 Azoxystrobin:Residue Levels in Cauliflower from trials Conducted in Spain during 2000. Syngenta File No. ICI5504/1305 Syngenta Report No. RJ3178B.
RJ3179B McGill, C 2001 Azoxystrobin:Residue Levels in Cabbage from Trials conducted in Spain during 2000 Syngenta File No. ICI5504/1322, Syngenta Report No. RJ3179B
RJ3180B McGill, C 2001 Azoxystrobin:Residue Levels in Cabbage from Trials Conducted in Netherlands during 2000, 2000 Syngenta File No. ICI5504/1321, Syngenta Report No. RJ3180B.
RJ3182B Gill, J 2001 Azoxystrobin:Residue Levels in Outdoor Lettuces from Trials Conducted in Northern and Southern France during 2000. Syngenta File No. ICI5504/0007, Syngenta Report No. RJ3182B
RJ3191B Richards, S and Griehl, T 2001 Azoxystrobin:Residue Levels in Cabbage from a Study Conducted in Germany in 2000, Syngenta File No. ICI5504/1233, Syngenta Report No. RJ3191B.
RJ3192B Richards, S and Griehl, T 2001 Residue Levels in Cauliflower from a Study Conducted in Germany in 2000, Syngenta File No.ICI5504/1234, Syngenta Report No. RJ3192B.
RJ3213B McGill, C 2001 Azoxystrobin:Residue Levels in Celery from Trials carried out in Italy during 2000. Syngenta Report No. RJ3213B
RJ3296B Grout, S 2002 [14C]Phenylacrylate Azoxystrobin:Aqueous Hydrolysis at 90, 100 and 120 ºC, Jealott’s Hill International Research Centre, Syngenta, UK. Report No. RJ3296B. Syngenta File No. ICI5504/1393.
RJ3350B Richards, S 2002 Azoxystrobin and R230310:Validation of Analytical Method RAM 399/01 for the Determination of Residues in Bovine Muscle, Fat and Milk, Lamb Kidney and Liver and Hen Eggs, Jealott’s Hill International Research Centre, Syngenta UK. Report No. RJ3350B.
RJ3552B Chaggar, S 2004 Azoxystrobin and R230310:Validation of Residue Analytical Method RAM 305/03 for the Determination of Residues in Crops. Final Determination by LC-MS/MS. Jealott’s Hill International Research Centre, Syngenta Crop Protection Inc., NC. Report No. RJ3552B.
RR 00-051B Spillner, C 2000 Azoxystrobin:Residue Levels on Succulent Shelled Beans from Trials Conducted in the United States in 1999 Syngenta File No. ICI5504/0420, Syngenta Report No. RR 00-051B
RR 00-052B Spillner, C 2000 Azoxystrobin:Residue Levels on Edible Podded Beans from Trials Conducted in the United States in 1999 Syngenta File No. ICI5504/0422, Syngenta Report No. RR 00-052B
RR 00-058B Judy, D, 2001 Azoxystrobin:Final Report:Residue Levels on Sunflowers from Trials Conducted in the United States during 2000. ABC Laboratories, Inc., USA, Syngenta Crop Protection, Inc., Western Research Center, CA, USA. Report No. RR 00-058B.
RR 00-059B Judy, D, 2001 Azoxystrobin:Final Report: Residue Levels on Sunflower Processed Products from Trials Conducted in the United States during 2000. ABC Laboratories, Inc., USA, Syngenta Crop Protection, Inc., Western Research Center, CA, USA. Report No. RR 00-059B.
RR 00-104B Thompson, D 2000 D3.2.5/074:RR 00/104B:Azoxystrobin:Magnitude of the Residue on Strawberry Syngenta File No. ICI5504/0620, Syngenta Report No. RR 00-104B
RR 00-105B Thompson, D 2000 Azoxystrobin:Magnitude of the Residue on Mint Syngenta File No. ICI5504/0701, Syngenta Report No. RR 00-105B
RR 00-106B Thompson, D 2000 Azoxystrobin:Magnitude of the Residue on Mint (Fresh) Syngenta
200 Azoxystrobin
Reference Author(s) Year Study Title
File No. ICI5504/0699, Syngenta Report No. RR 00-106B
RR 95-011B Tambling, D 1995 ICIA5504:Phenylacrylate label. Confined Rotational Crop. Western Research Centre Report No. RR 95-011B Syngenta File No. ICI5504/0729
RR 95-017B Miller, M 1995 ICIA5504:Cyanophenyl label. Confined Rotational Crop. Western Research Centre Report No. RR 95-017B Syngenta File No. ICI5504/0730
RR 95-034B Goldsby, G 1995 ICIA5504:Pyrimidinyl label. Confined Rotational Crop. Western Research Centre Report No. RR 95-034B Syngenta File No. ICI5504/0731
RR 96-012B Francis, P, 1996 ICIA5504:Residue Levels on Grapes from Trials Carried Out in the United States During 1995 (WRC-96-023) Syngenta File No. ICI5504/0542, Syngenta Report No. RR 96-012B
RR 96-050B Roper, E 1996 ICIA5504:Residue Levels on Bananas from Trials Carried Out in Hawaii, Florida and Puerto Rico during 1995–1996. Syngenta File No. ICI5504/0550, Syngenta Report No. RR 96-050B
RR 96-096B Roper, E. 1997 ICIA5504:Residue Levels on Cucurbits from Trials Conducted in the United States during 1996. Syngenta File No. ICI5504/0454, Syngenta Report No. RR96-096B
RR 97-001B Roper, E 1997 Residue Levels on Almonds from Trials Conducted in the United States during 1996 Syngenta File No. ICI5504/0681, Syngenta Report No. RR 97-001B
RR 98-006B Bussey, R 1998 Azoxystrobin:Residue Levels on Sweet Cherries from Trials Conducted in the United States in 1997 Syngenta File No. ICI5504/0570, Syngenta Report No. RR 98-006B
RR 98-009B Bussey, R 1998 Azoxystrobin:Residue Levels on Peaches from Trials Conducted in the United States in 1997 Syngenta File No. ICI5504/0571, Syngenta Report No. RR 98-009B
RR 98-010B Bussey, R 1998 Azoxystrobin:Residue Levels on Plums From Trials Conducted in the United States in 1997 Syngenta File No. ICI5504/0572, Syngenta Report No. RR 98-010B
RR 98-015B Bussey, R 1998 Azoxystrobin:Processing Study on Plums From a Trial Conducted in California in 1997 (WRC-98-035) Syngenta File No. ICI5504/0713, Syngenta Report No. RR 98-015B
RR 98-045B Bussey, R 1998 Azoxystrobin:Residue Levels on Cucurbits from Trials Conducted in the United States in 1997. Syngenta File No. ICI5504/0505, Syngenta Report No. RR98-045B
RR 98-045B Bussey, R 1998 Azoxystrobin:Residue Levels on Cucurbits from Trials Conducted in the United States in 1997. Syngenta File No. ICI5504/0505, Syngenta Report No. RR98-045B
RR 98-046B Bussey, R 1999 Azoxystrobin:Residue Levels on Peanuts from Trials Conducted in the United States in 1997. Zeneca Ag Products Western Research Center, USA. Report No. RR 98-046B, Syngenta File No. ICI5504/0671
RR 98-055B Bussey, R 1998 Azoxystrobin:Residue Levels on Cotton from Trials Conducted in the United States in 1997 Syngenta File No. ICI5504/0689, Syngenta Report No. RR 98-055B
RR 98-058B Bussey, R,. 1998 Azoxystrobin:Processing Study on Cotton from a Trial Conducted in Mississippi during 1997 Syngenta File No. ICI5504/0728, Syngenta Report No. RR 98-058B
RR 98-074B Bussey, R 1999 Azoxystrobin:Residue Levels on Green Onion from Trials Conducted in the United States in 1998 (WRC-98-192)(WINO 30467) Syngenta File No. ICI5504/0318, Syngenta Report No. RR 98-074B

Azoxystrobin 201
Reference Author(s) Year Study Title
RR 99-011B Hampton, R 1999 Azoxystrobin:Residue Levels on Grapefruit from Trials Conducted in the United States in 1997–1998 Syngenta File No. ICI5504/0593, Syngenta Report No. RR 99-011B
RR 99-012B Bussey, R 1999 Azoxystrobin:Residue Levels on Oranges from Trials Conducted in the United States in 1997–1998 (WRC-99-032) Syngenta File No. ICI5504/0599, Syngenta Report No. RR 99-012B
RR 99-016B Bussey, R 1999 Azoxystrobin:Residue Levels on Peaches from Trials Conducted in the United States in 1998 Syngenta File No. ICI5504/0597, Syngenta Report No. RR 99-016B
RR 99-017B Bussey, R 1999 Azoxystrobin:Processing study on Oranges from a Trial Conducted in Florida During 1998 Syngenta File No. ICI5504/0714, Syngenta Report No. RR 99-017B
RR 99-018B Hampton, R 1999 Azoxystrobin:Residue Levels on Lemons from Trials Conducted in the United States in 1998 Syngenta File No. ICI5504/0594, Syngenta Report No. RR 99-018B
RR 99-022B Bussey, R 1999 Azoxystrobin:Residue Levels in Radishes from Trials Conducted in the United States During 1998 Syngenta File No. ICI5504/0322, Syngenta Report No. RR 99-022B
RR 99-036B Bussey, R 1999 Azoxystrobin:Residue Levels on Sugar Beets from Trials Conducted in the United States in 1998 Syngenta File No. ICI5504/0324, Syngenta Report No. RR 99-036B
RR 99-041B Aston, J and Bussey, R 1999 Azoxystrobin:Residue Levels on Carrots from Trials Conducted in The United States During 1998. Syngenta File No. ICI5504/0323, Syngenta Report No. RR 99-041B
RR 99-042B Bussey, R 1999 Azoxystrobin:Residue Levels on Dry Bulb Onions From Trials Conducted in the United States During 1997-1998 (WRC-99-099) (WINO 30506) Syngenta File No. ICI5504/0327, Syngenta Report No. RR 99-042B
RR 99-049B Bussey, R and Lipton, C 1999 Azoxystrobin:Residue Levels on Soybeans from Trials Conducted in the United States in 1998, Zeneca Ag Products Western Research Center, USA. Report No. RR 99-049B. Syngenta File No. ICI5504/0389
RR 99-050B Bussey, R 1999 Azoxystrobin:Residue Levels on Field Corn from Trials Conducted in the United States during 1998 Syngenta File No. ICI5504/0654, Syngenta Report No. RR 99-050B
RR 99-051B Bussey, R and Lipton, C 1999 Azoxystrobin:Processing Study on Soybeans from a Trial Conducted in Mississippi during 1998. Zeneca Ag Products Western Research Center, USA. Report No. RR 99-051B, Syngenta File No. ICI5504/0390
RR 99-056B Bussey, R and Aston, J 1999 Azoxystrobin:Processing Study on Corn from a Trial Conducted in the United States during 1998 Syngenta File No. ICI5504/0722, Syngenta Report No. RR 99-056B
RR 99-094B Bussey, R 2000 Azoxystrobin:Residue Levels on Succulent Shelled Peas from Trials Conducted in the United States During 1999 Syngenta File No. ICI5504/0409, Syngenta Report No. RR 99-094B
RR 99-095B Bussey, R 2000 Azoxystrobin:Residue Levels on Edible Podded Peas from Trials Conducted in the United States During 1999 Syngenta File No. ICI5504/0410, Syngenta Report No. RR 99-095B
SYN-0422V Lakaschus, S 2005 ILV for the Determination of Residues of Azoxystrobin in Lettuce and Wheat Grain by Multi-Residue Method S19 (L 00.00-34) Validated by a Third Party Laboratory, Specht and Partner Chemische Laboratorien GMBH, Syngenta AG, Report No. SYN-0422V.

202 Azoxystrobin
Reference Author(s) Year Study Title
T013959-05 Ediger, K 2006 Azoxystrobin:Magnitude of the Residues in or on Citrus Following Post-Harvest Applications. Syngenta File No. ICI5504/3512, Syngenta Report No.T013959-05
T016998-04 Chen, H 2004 Azoxystrobin:Magnitude of the Residue on Parsley Syngenta File No. ICI5504/2535, Syngenta Report No. T016998-04
T020405-04 Ediger, K 2007 Azoxystrobin:Magnitude of the Residues in or on Cotton (Final Report), Syngenta Crop Protection, Inc., NC, USA. Syngenta Report No. T020405-04. Syngenta File No. ICI5504/3647
ZEN-0002V Weeren, R and Pelz, S 2001 Validation of the DFG Method S19 (Extended Revision) for the Determination of Residues of Azoxystrobin in Plant Materials, Dr. Specht and Partner Chemische Laboratorien GMBH, Syngenta AG, Report No.ZEN-0002V. Syngenta File No. ICI5504/1368.
ZEN-9402V Tillkes, M 1995 Validation of DFG Method S19 for the Determination of the Residues of ICIA5504 and R230310 in Wheat, Rye, Barley, and Grapes, Dr. Specht and Partner Chemische Laboratorien GMBH, Syngenta AG, Report No.ZEN-9402V. Syngenta File No. ICI5504/0263.
ZEN-9403 Tillkes, M 1995 Determination of Residues of ICIA5504, R230310 and Fenpropimorph in Cereals after Application under Field Conditions in Germany 1994. Syngenta Report No. ZEN-9403. Syngenta File No. ICI5504/1083.
ZEN-9505V Tillkes, M 1997 Validation of DFG Method S19 (Modified Extraction) for the Determination of the Residues of ICIA5504 (Azoxystrobin) in Milk, Muscle, Kidney, Liver, and Egg, Dr. Specht and Partner Chemische Laboratorien GMBH, Syngenta AG, Report No. ZEN-9505V.