Embed Size (px)
Citation preview

1
Good afternoon ladies and gentlemanMembers of the juryMembers of the audience
My name is Jose Insua sponsor of the team, it’s a pleasure for us to be here presenting ourprojectCutting Cuts

2
Telefónica Group leads the telecommunications market in Argentina, contributing to thedevelopment of communication services across the country. Currently, it provides a wide rangeof services including, among others:Fixed telephony,Mobile telephony,Data transmission and broadband services,Supplying
residential customers,Small and Medium Sized Companies,corporate companies andother telecommunication operators
3
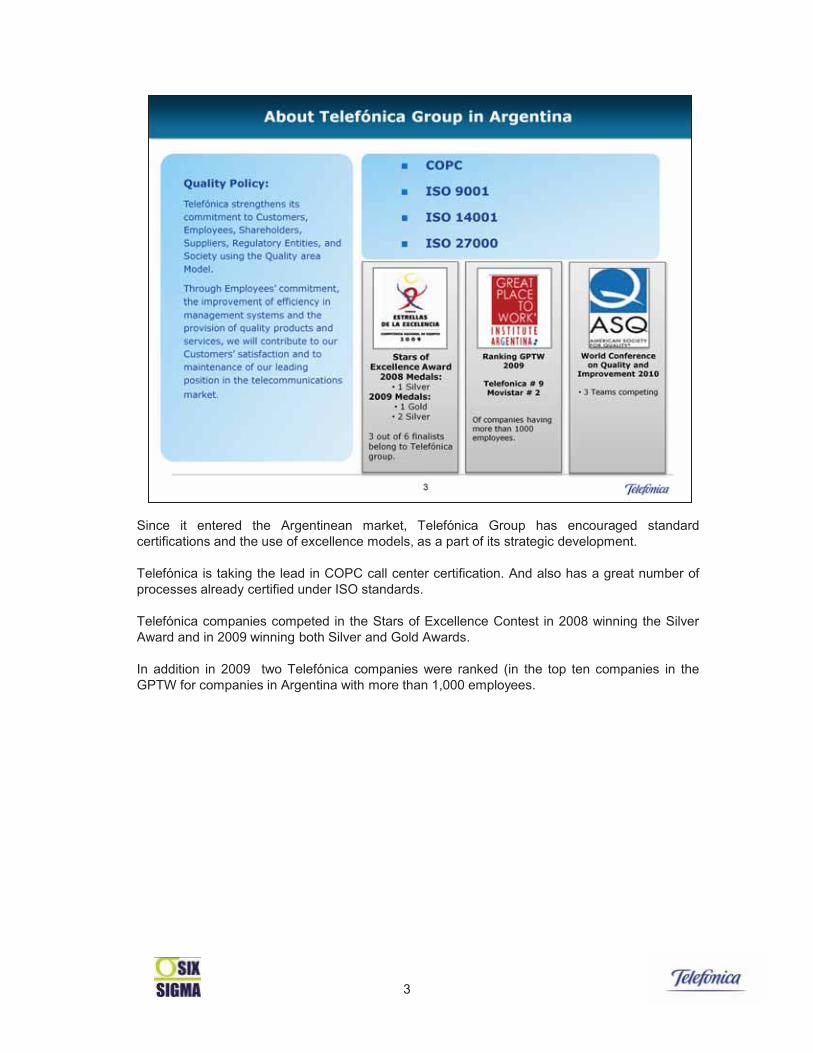
Since it entered the Argentinean market, Telefónica Group has encouraged standardcertifications and the use of excellence models, as a part of its strategic development.
Telefónica is taking the lead in COPC call center certification. And also has a great number ofprocesses already certified under ISO standards.
Telefónica companies competed in the Stars of Excellence Contest in 2008 winning the SilverAward and in 2009 winning both Silver and Gold Awards.
In addition in 2009 two Telefónica companies were ranked (in the top ten companies in theGPTW for companies in Argentina with more than 1,000 employees.

The customers of Movistar , Telefónica Group’s mobile telecommunications operator are able tocommunicate through antennas called Radio Base stations. These stations are connected tomobile switching centers through physical connections which use technologies such as fiberoptic, radio and satellite links.
In this project, the universe of 2,300 (two thousands three hundred) radio base stationsconnected through Telefónica’s network, was analyzed. Any technical failure of theseconnections produces service interruption , and, therefore,
the loss of customers’ communication ,billing opportunities and reputation,as well as operational inefficiency.
This project focused on looking for the root causes and improvement actions in order to reducefailures in connections provided by Telefónica to Movistar, which initially represented 15% oftotal failures of the whole network. The project involved more than 1,200 (one thousand twohundred) telecommunications technicians and professionals nationwide.Due to the wide scope of the project and the high expectations created, the improvementmethodology adopted was Six Sigma – DMAIC .

Now, Daniel, Champion of the Project ,is going to present next section:SELECTION OF THE PROJECT AND PURPOSE
Thank you Jose,

6
Telefónica selects its improvement projects evaluating the impact on strategic objectives.These objectives are prioritized through
the analysis of strategic and operational indicators,customer satisfaction surveysand internal and external audits.
Their final validation is made with the Board of Directors and the organization’s Master BlackBelt.
The methodology adopted is set out in Telefónica´s standard improvement system.
7
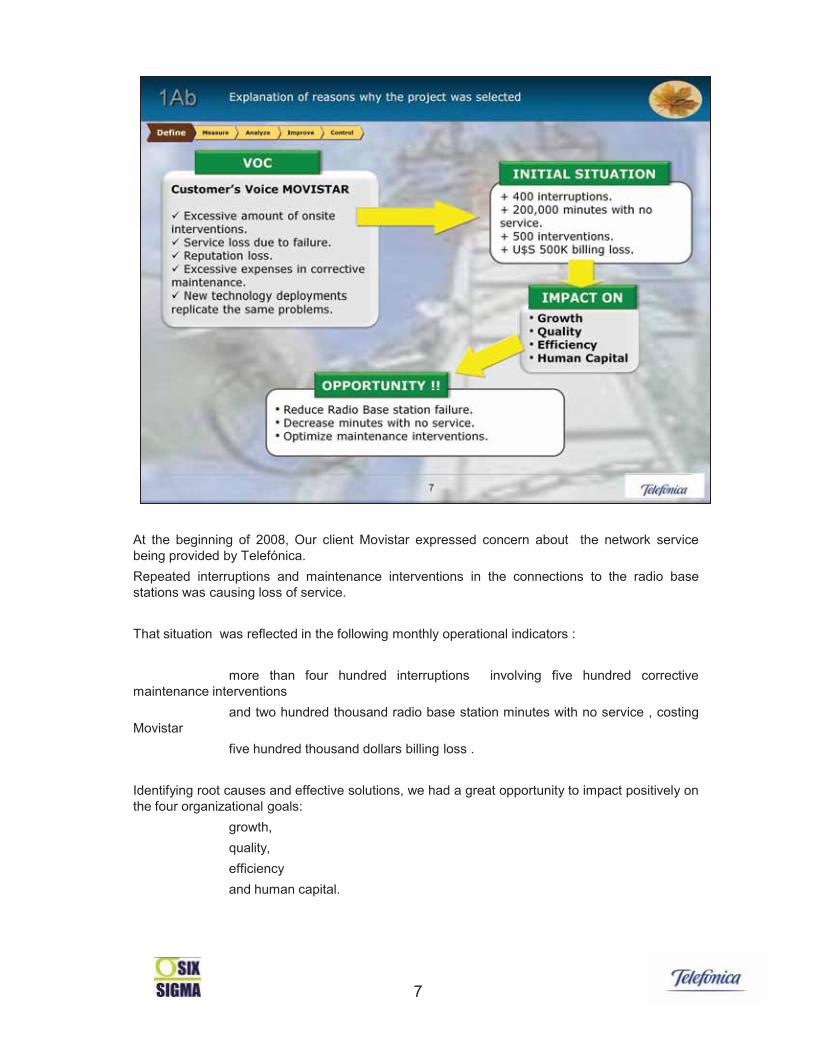
At the beginning of 2008, Our client Movistar expressed concern about the network servicebeing provided by Telefónica.Repeated interruptions and maintenance interventions in the connections to the radio basestations was causing loss of service.
That situation was reflected in the following monthly operational indicators :
more than four hundred interruptions involving five hundred correctivemaintenance interventions
and two hundred thousand radio base station minutes with no service , costingMovistar
five hundred thousand dollars billing loss .
Identifying root causes and effective solutions, we had a great opportunity to impact positively onthe four organizational goals:
growth,quality,efficiencyand human capital.

8
In this phase the stakeholders were represented by their Management levels, who interactedwith the aim of Defining and Approving the Project selection.
For Example,The Quality area provided experience in prioritization and generated interfaces betweendepartments involved .The Maintenance department put together the initial project team and participated inmanagement meetings .
As we will see in chapter 3bc other stakeholders were incorporated in other phases of theproject as they were identified.Due to the complexity of the project all of stakeholder were involved in it.The methodology adopted is set out in Telefónica´s standard improvement system.

9
The organizational strategic indicators impacted by the project were:
Customer Satisfaction,Earnings before income taxesthe position in GPTW,and growth of the customer base.
All of them had an impact in organizational goals.

Reduction of service interruptions and increase in network availability both generatedoperational impacts which had a positive effect on Organizational Goals.
11
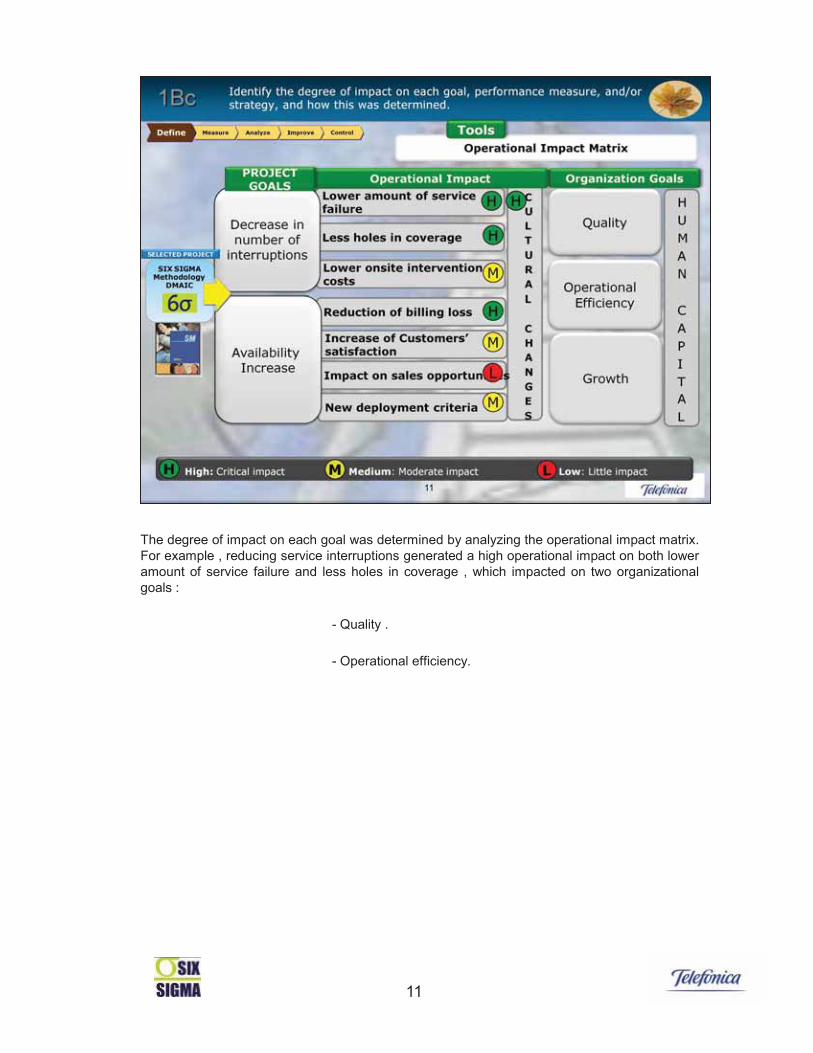
The degree of impact on each goal was determined by analyzing the operational impact matrix.For example , reducing service interruptions generated a high operational impact on both loweramount of service failure and less holes in coverage , which impacted on two organizationalgoals :
- Quality .
- Operational efficiency.
12
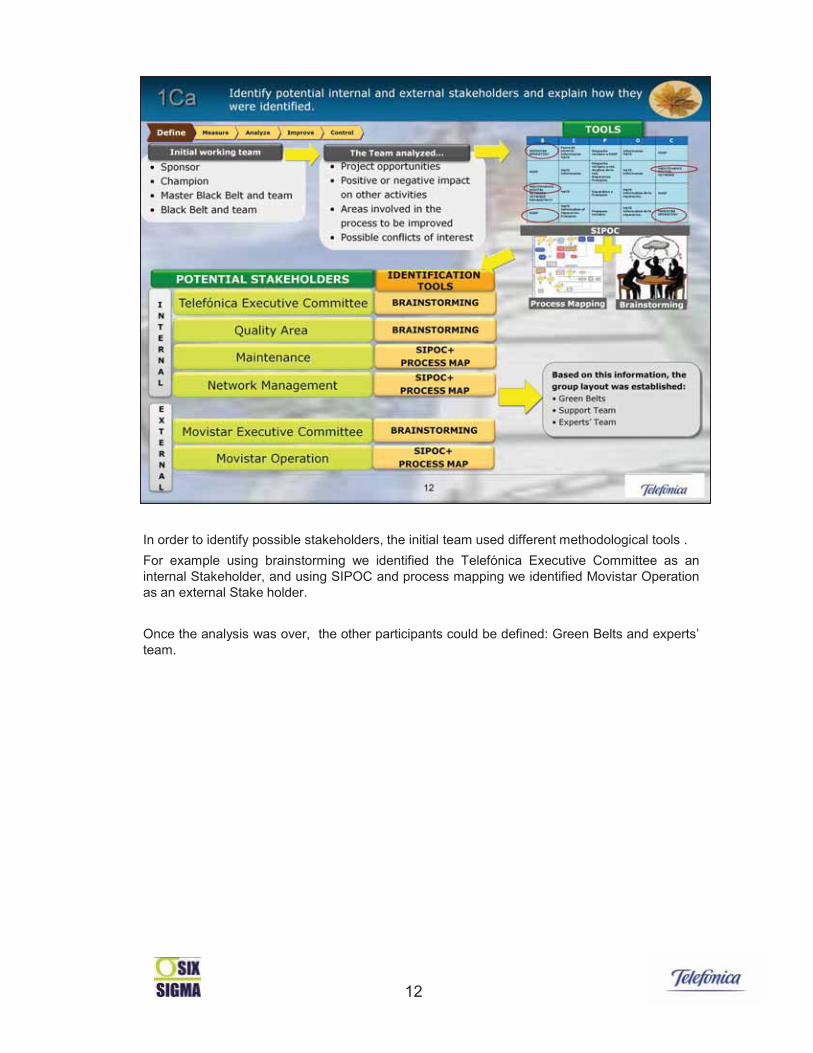
In order to identify possible stakeholders, the initial team used different methodological tools .For example using brainstorming we identified the Telefónica Executive Committee as aninternal Stakeholder, and using SIPOC and process mapping we identified Movistar Operationas an external Stake holder.
Once the analysis was over, the other participants could be defined: Green Belts and experts’team.

13
A Stakeholder Analysis Impact Matrix was generated which defined what strengths (or positiveimpacts) and weaknesses (or negative impacts) the project would have on each stakeholder .For example the impact on Quality Area was a great opportunity to introduce improvementmethodologies in technical areas.
14
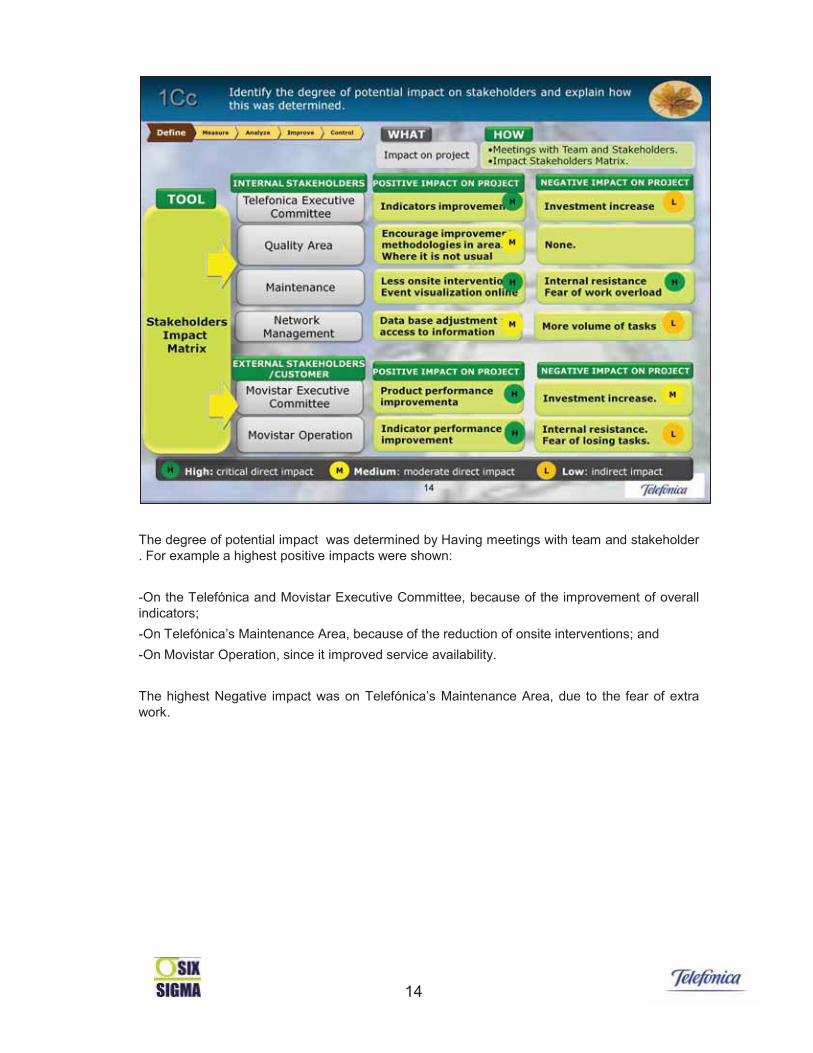
The degree of potential impact was determined by Having meetings with team and stakeholder. For example a highest positive impacts were shown:
-On the Telefónica and Movistar Executive Committee, because of the improvement of overallindicators;-On Telefónica’s Maintenance Area, because of the reduction of onsite interventions; and-On Movistar Operation, since it improved service availability.
The highest Negative impact was on Telefónica’s Maintenance Area, due to the fear of extrawork.

Now, Hugo, Green Belts of the project, is going to present next section:CURRENT SITUATION ANALYSIS
Thank you Daniel,
1616
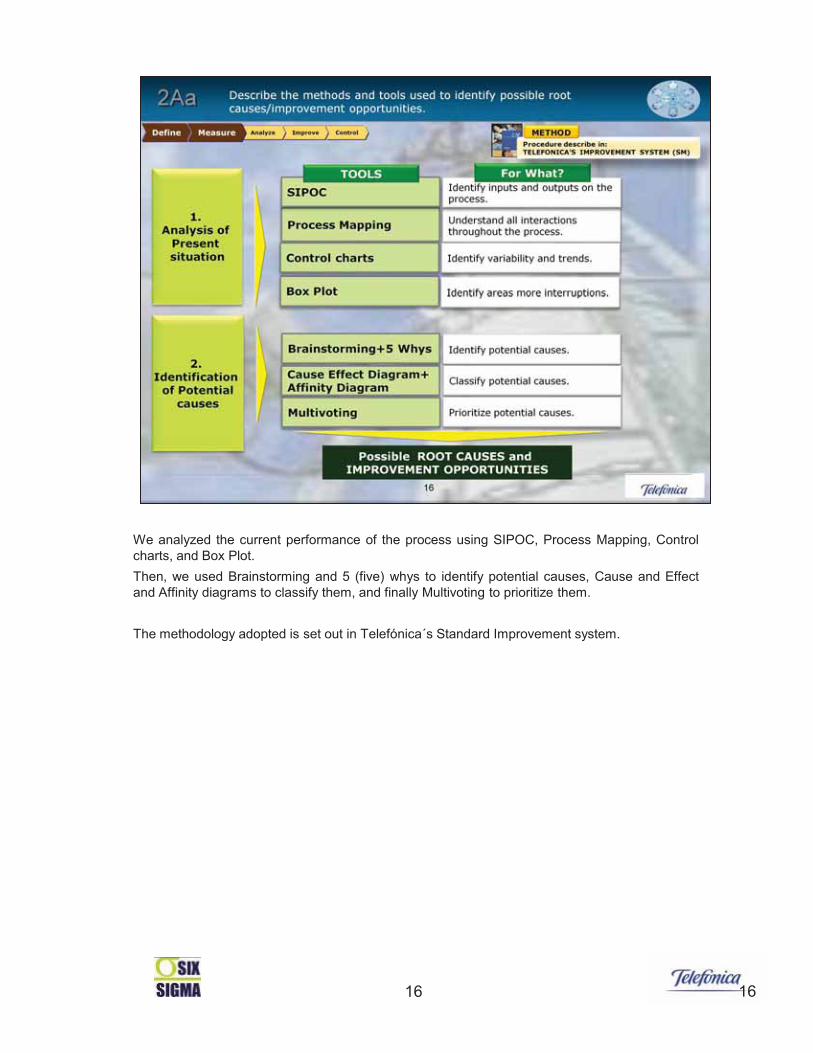
We analyzed the current performance of the process using SIPOC, Process Mapping, Controlcharts, and Box Plot.Then, we used Brainstorming and 5 (five) whys to identify potential causes, Cause and Effectand Affinity diagrams to classify them, and finally Multivoting to prioritize them.
The methodology adopted is set out in Telefónica´s Standard Improvement system.
17
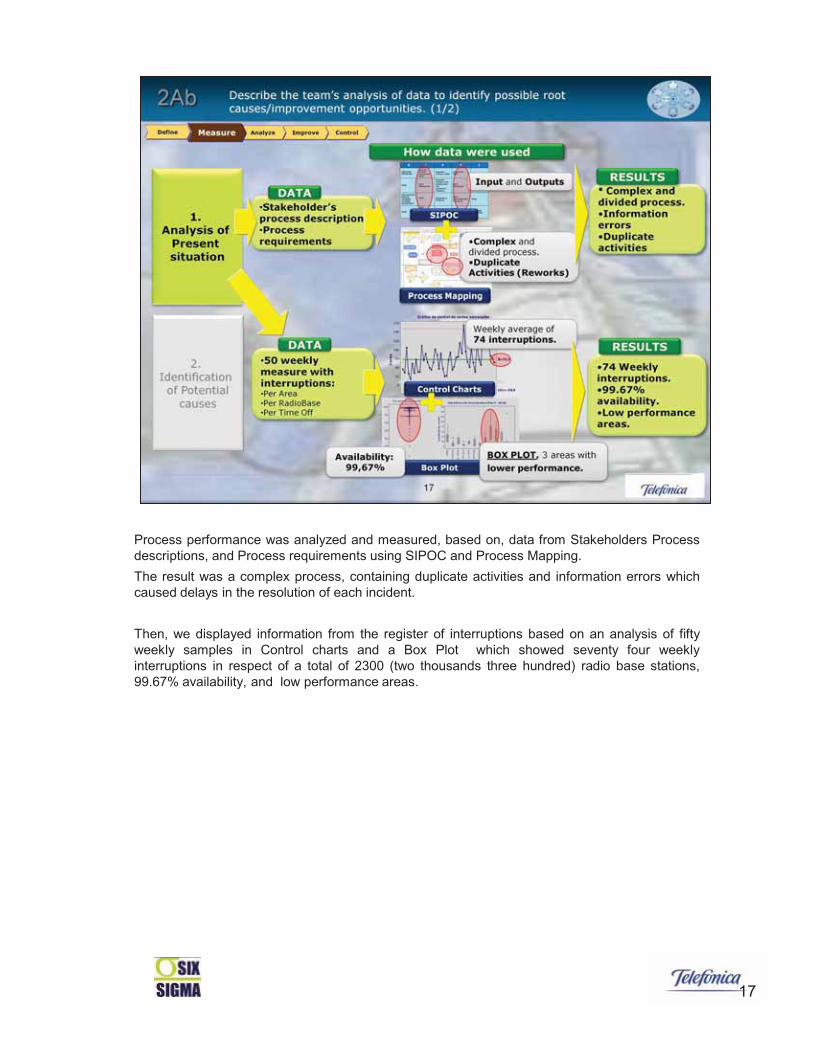
Process performance was analyzed and measured, based on, data from Stakeholders Processdescriptions, and Process requirements using SIPOC and Process Mapping.The result was a complex process, containing duplicate activities and information errors whichcaused delays in the resolution of each incident.
Then, we displayed information from the register of interruptions based on an analysis of fiftyweekly samples in Control charts and a Box Plot which showed seventy four weeklyinterruptions in respect of a total of 2300 (two thousands three hundred) radio base stations,99.67% availability, and low performance areas.
18
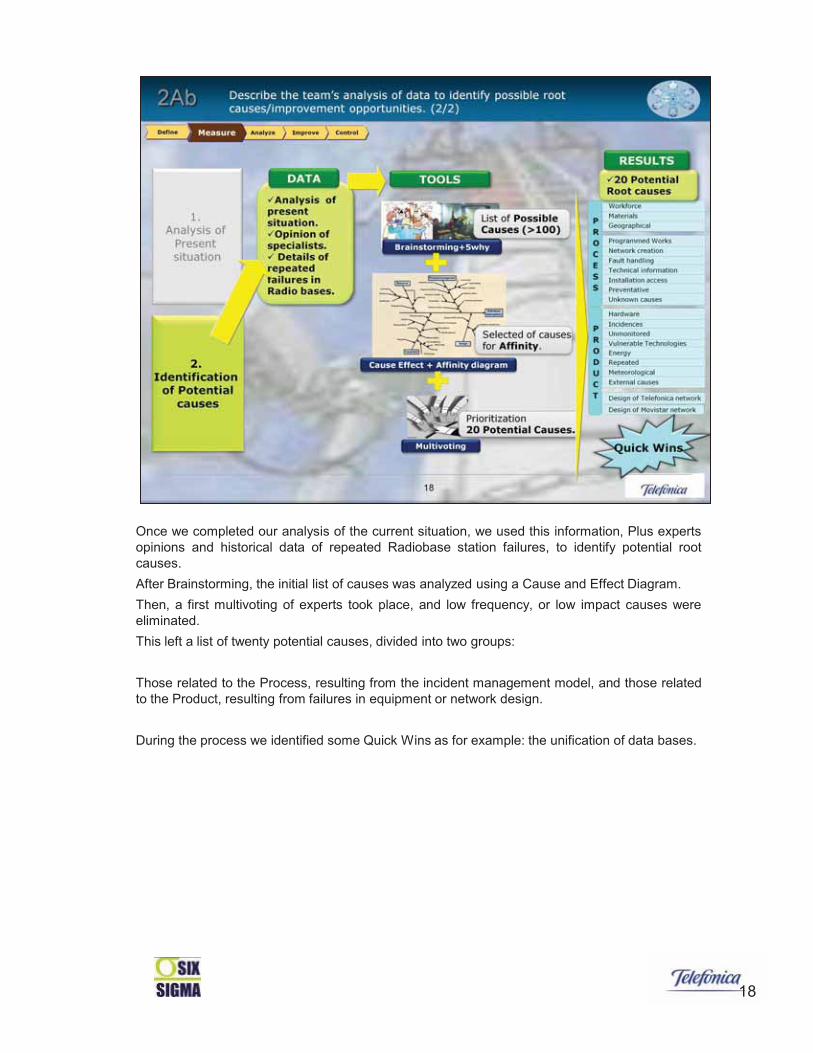
Once we completed our analysis of the current situation, we used this information, Plus expertsopinions and historical data of repeated Radiobase station failures, to identify potential rootcauses.After Brainstorming, the initial list of causes was analyzed using a Cause and Effect Diagram.Then, a first multivoting of experts took place, and low frequency, or low impact causes wereeliminated.This left a list of twenty potential causes, divided into two groups:
Those related to the Process, resulting from the incident management model, and those relatedto the Product, resulting from failures in equipment or network design.
During the process we identified some Quick Wins as for example: the unification of data bases.

19
All the stakeholders contributed to the team’s process analysis in a number of ways.
For example:The executive committee provided validation of the Potential root causes at the tollgate, andTelefonica’s maintenance department contributed their technical knowledge and overview ofthe entire process, helping the identification of Potential root causes.
20
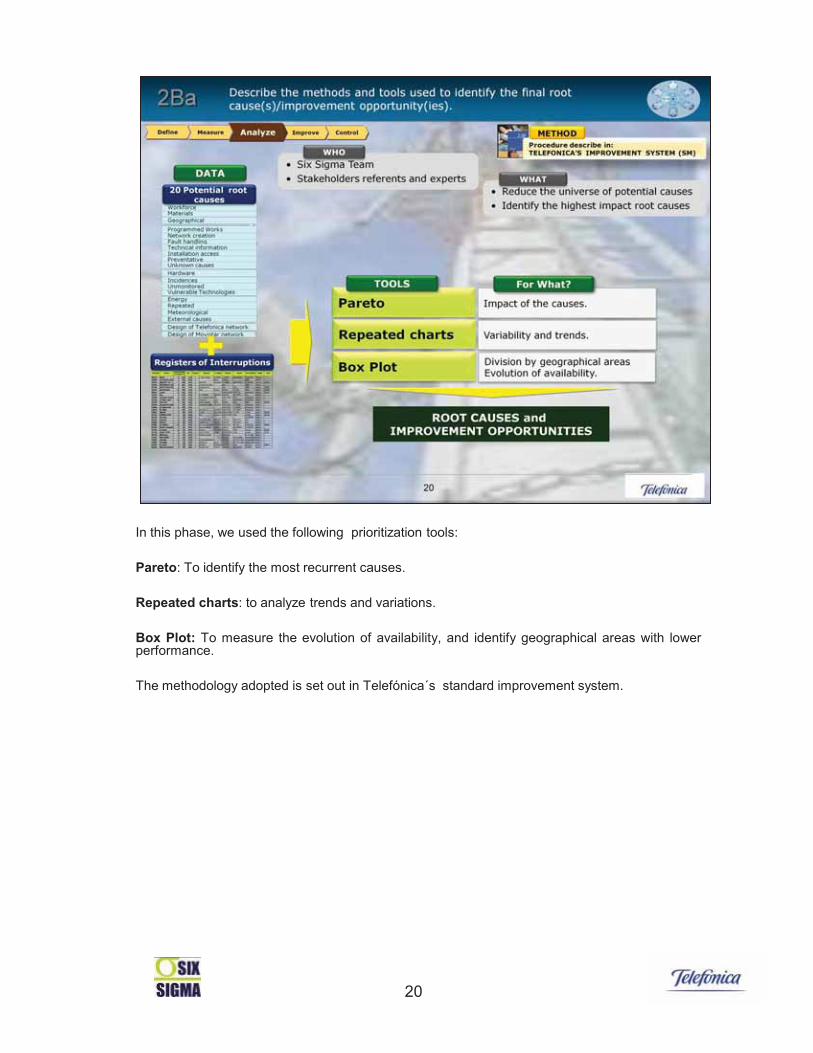
In this phase, we used the following prioritization tools:
Pareto: To identify the most recurrent causes.
Repeated charts: to analyze trends and variations.
Box Plot: To measure the evolution of availability, and identify geographical areas with lowerperformance.
The methodology adopted is set out in Telefónica´s standard improvement system.
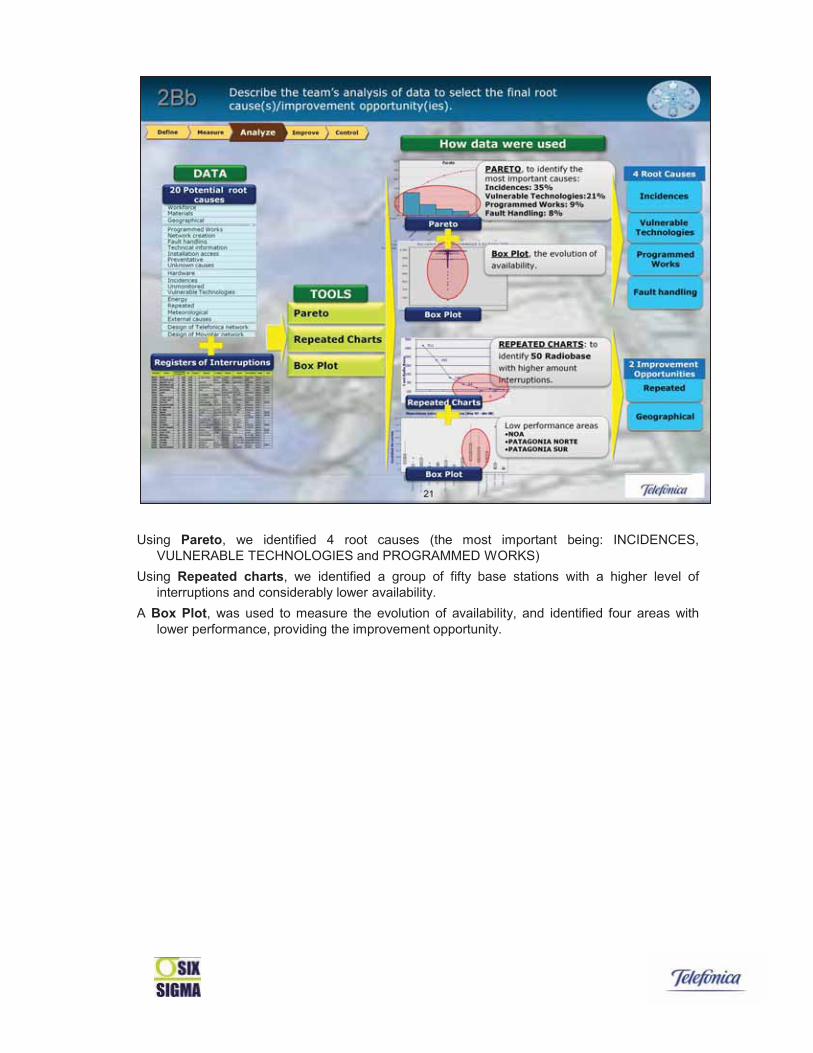
Using Pareto, we identified 4 root causes (the most important being: INCIDENCES,VULNERABLE TECHNOLOGIES and PROGRAMMED WORKS)
Using Repeated charts, we identified a group of fifty base stations with a higher level ofinterruptions and considerably lower availability.
A Box Plot, was used to measure the evolution of availability, and identified four areas withlower performance, providing the improvement opportunity.
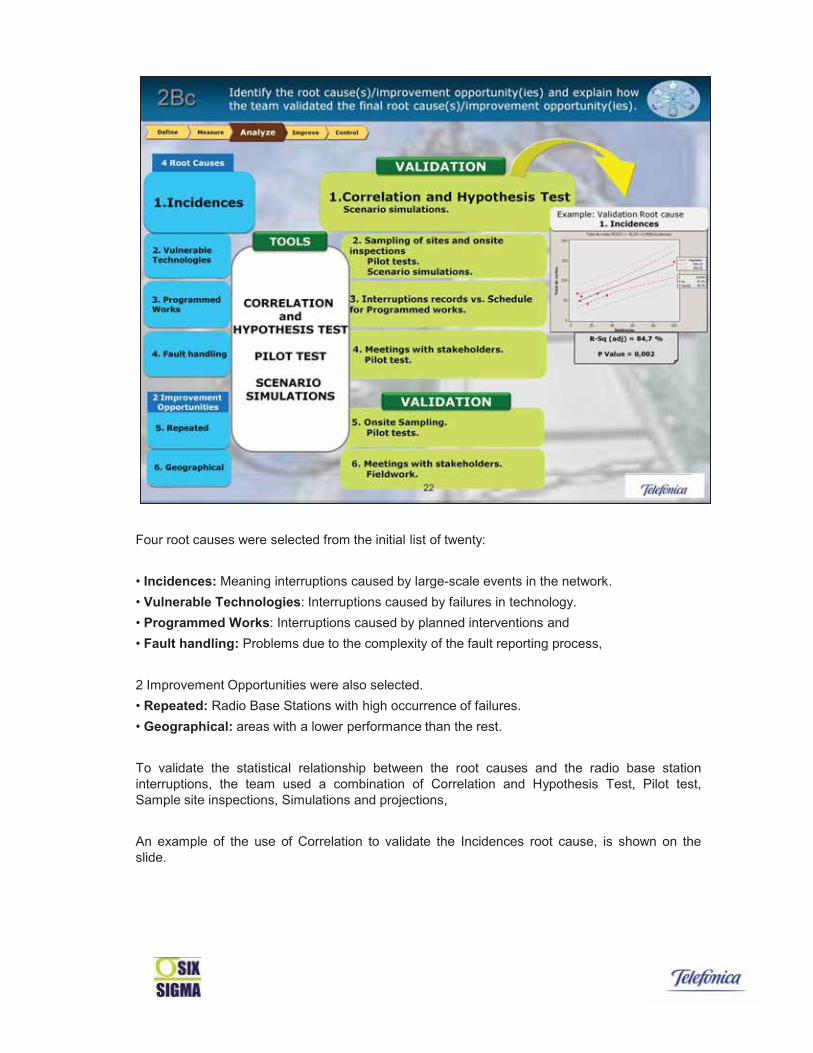
Four root causes were selected from the initial list of twenty:
• Incidences: Meaning interruptions caused by large-scale events in the network.• Vulnerable Technologies: Interruptions caused by failures in technology.• Programmed Works: Interruptions caused by planned interventions and• Fault handling: Problems due to the complexity of the fault reporting process,
2 Improvement Opportunities were also selected.• Repeated: Radio Base Stations with high occurrence of failures.• Geographical: areas with a lower performance than the rest.
To validate the statistical relationship between the root causes and the radio base stationinterruptions, the team used a combination of Correlation and Hypothesis Test, Pilot test,Sample site inspections, Simulations and projections,
An example of the use of Correlation to validate the Incidences root cause, is shown on theslide.
Now, Marcos, Black Belt of the project, is going to present next section:SOLUTION DEVELOPMENT
Thank you Hugo,

24
Once the root causes were identified, we wanted to generate the greatest number of possiblesolutions for each cause.
We used certain tools to generate solutions and others to validate and select them.
These tools were:•brainstorming,•affinity diagram•and creative thinking to generate the possible solutions
•and Multivoting and Pilot Test to validate and select them.
By using these tools, we aimed to select possible solutions.The methodology adopted is set out in Telefónica´s standard improvement system.
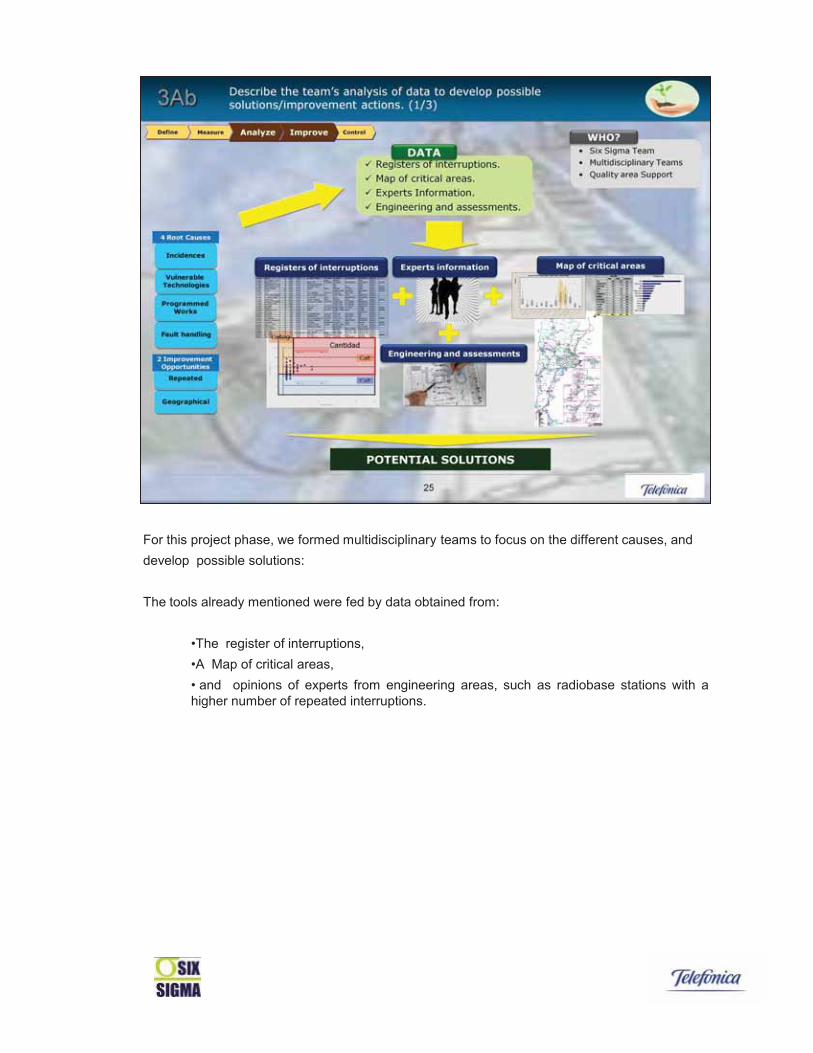
For this project phase, we formed multidisciplinary teams to focus on the different causes, anddevelop possible solutions:
The tools already mentioned were fed by data obtained from:
•The register of interruptions,•A Map of critical areas,• and opinions of experts from engineering areas, such as radiobase stations with ahigher number of repeated interruptions.

Once the root causes were identified, and using the information already mentioned , theteams carried out brainstorming sessions in order to generate possible solutions.
The result was grouped in an affinity diagram to order the ideas.
In order to generate both radical and innovative ideas, we resorted to creative thinking.
The result was a wide range of solutions.

This set of solutions was grouped into categories and then analyzed by specialists using:•multivoting, as well as•verification of pilot test results•and result projections in different scenarios.
The initial set was reduced to a total of 50 proposed solutions, such as:• traffic protection•preventive maintenance of equipment•and a uniform system for documenting maintenance history.

28
In order to choose and prioritize the most suitable solutions, the team used the informationarising from the record of interruptions, the map of critical areas and the experts’ opinions todefine the following selection criteria:
IMPACT on the reduction of interruptions.CRITICALITY in terms of client urgencySCALE taking into account replication of the solution in other similar cases.COST of required investment.Technical DIFFICULTY of implementation.
These criteria were aligned with the organization goals; for example cost is aligned with Operational Efficiency.The methodology adopted is set out in Telefónica´s standard improvement system.
29
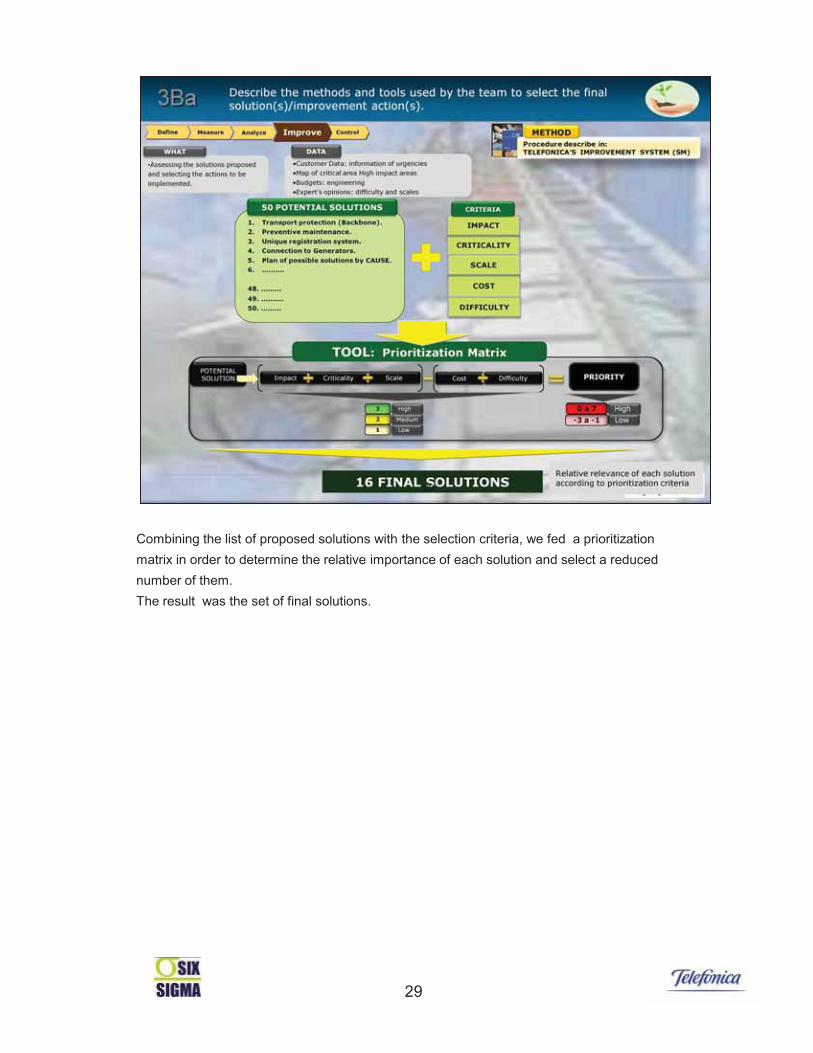
Combining the list of proposed solutions with the selection criteria, we fed a prioritizationmatrix in order to determine the relative importance of each solution and select a reducednumber of them.The result was the set of final solutions.
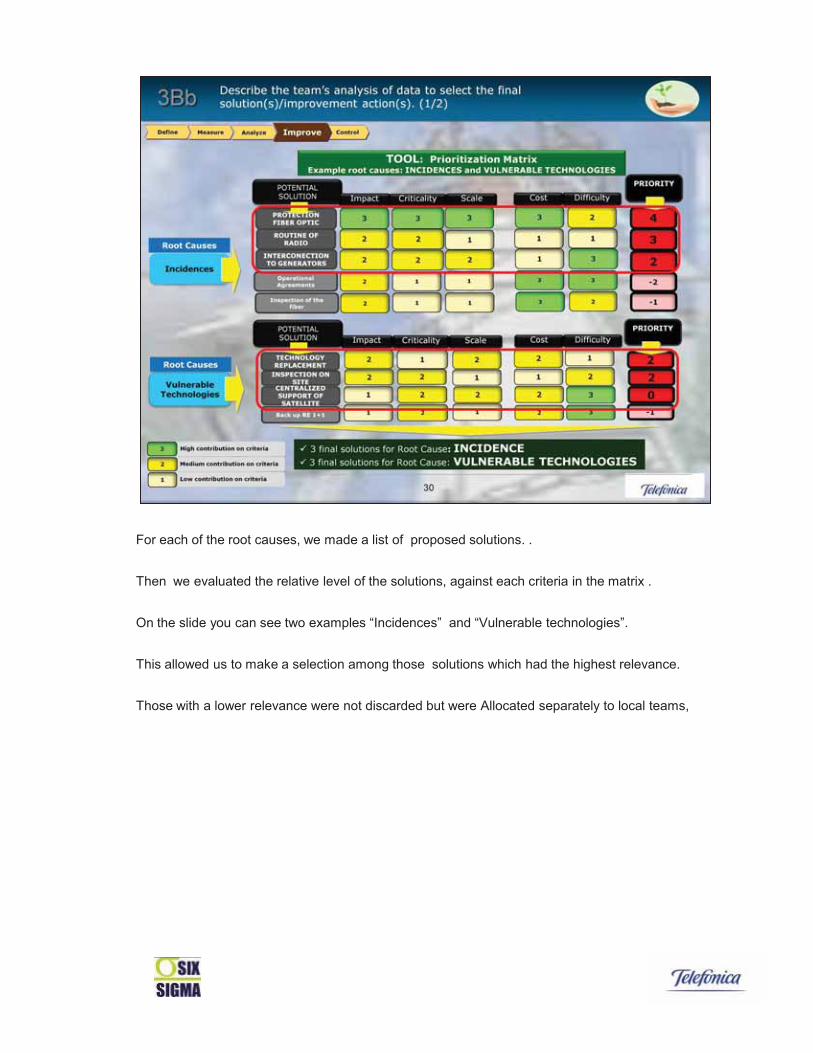
For each of the root causes, we made a list of proposed solutions. .
Then we evaluated the relative level of the solutions, against each criteria in the matrix .
On the slide you can see two examples “Incidences” and “Vulnerable technologies”.
This allowed us to make a selection among those solutions which had the highest relevance.
Those with a lower relevance were not discarded but were Allocated separately to local teams,

The same methodology was carried out with the other proposed solutions.To Sum up, by using root causes as starting points, we determined possible solutions.These solutions were weight using selection criteria, resulting in a set of 16 final solutions.
32
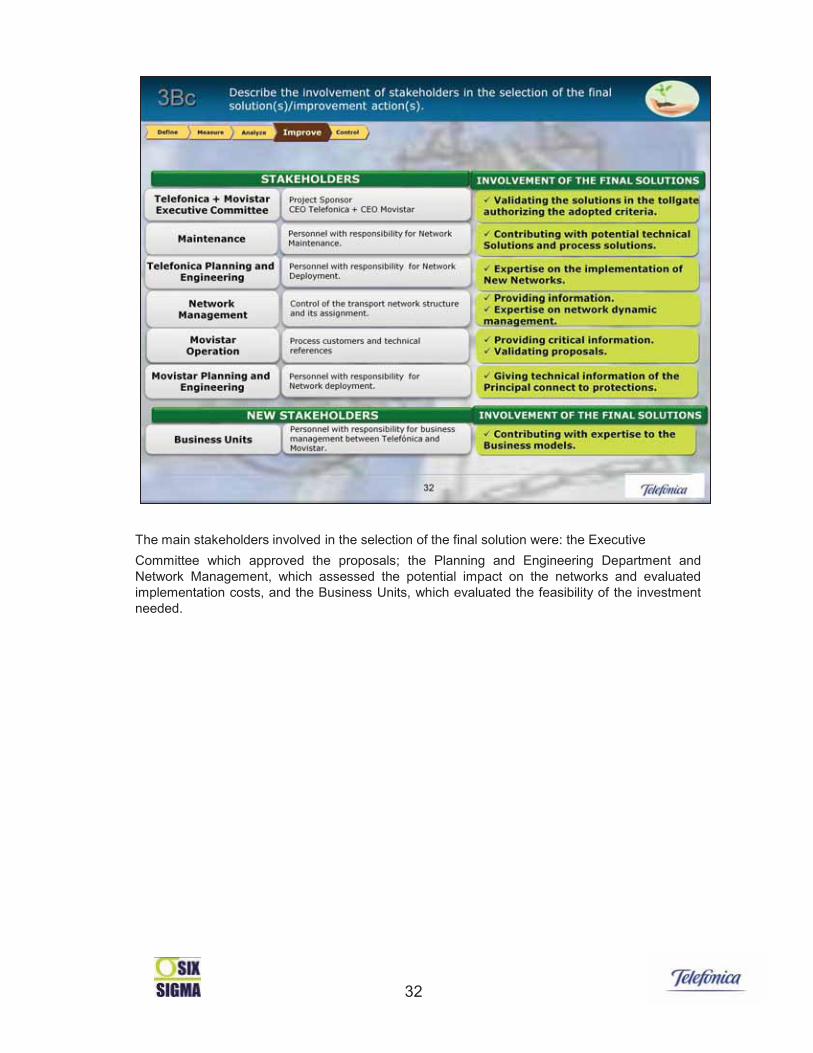
The main stakeholders involved in the selection of the final solution were: the ExecutiveCommittee which approved the proposals; the Planning and Engineering Department andNetwork Management, which assessed the potential impact on the networks and evaluatedimplementation costs, and the Business Units, which evaluated the feasibility of the investmentneeded.
33
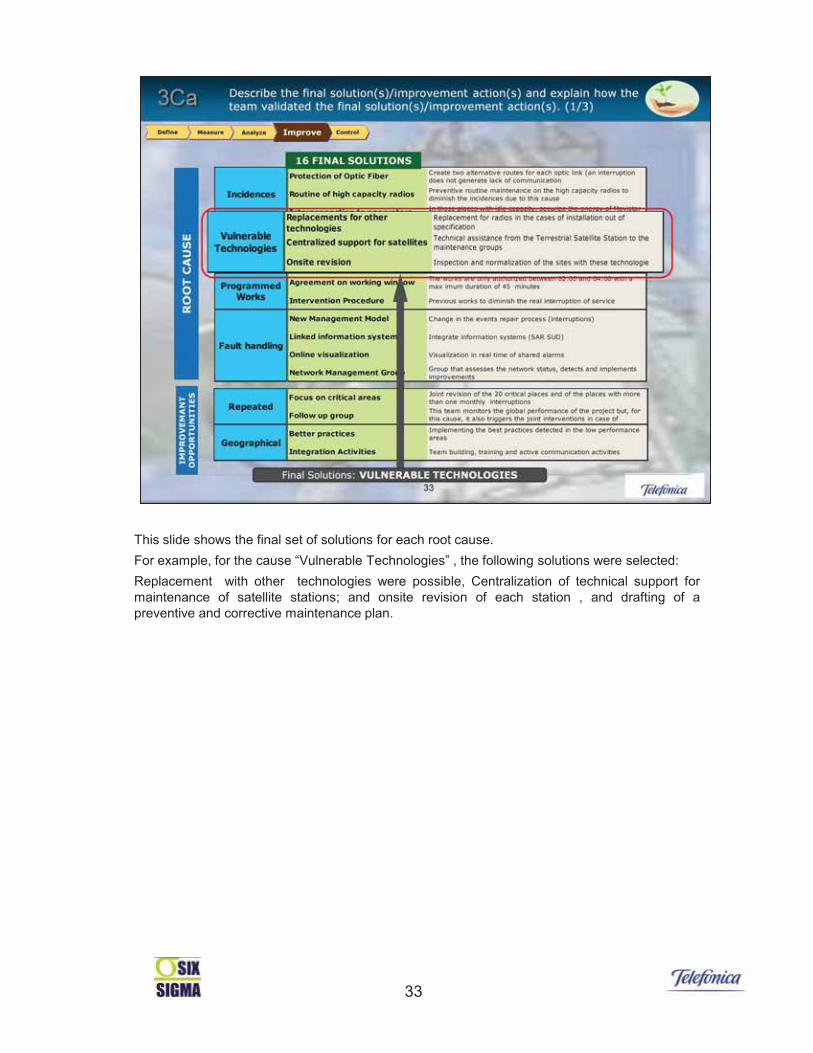
This slide shows the final set of solutions for each root cause.For example, for the cause “Vulnerable Technologies” , the following solutions were selected:Replacement with other technologies were possible, Centralization of technical support formaintenance of satellite stations; and onsite revision of each station , and drafting of apreventive and corrective maintenance plan.
34
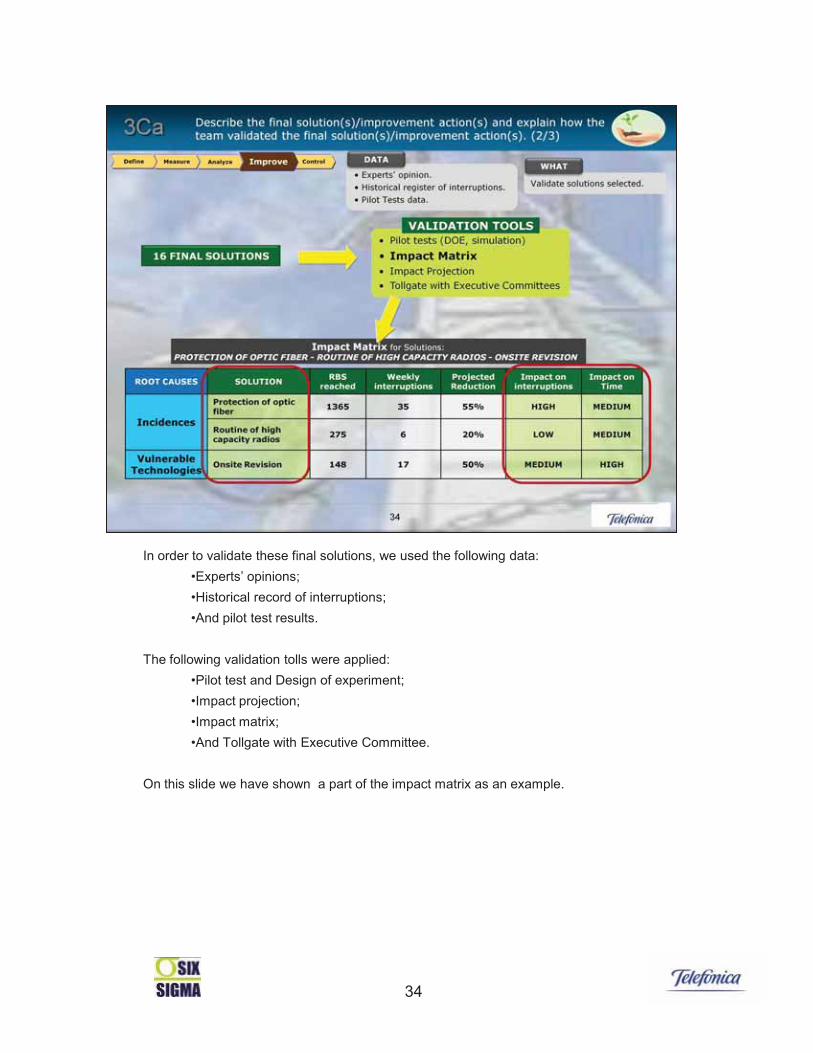
In order to validate these final solutions, we used the following data:•Experts’ opinions;•Historical record of interruptions;•And pilot test results.
The following validation tolls were applied:•Pilot test and Design of experiment;•Impact projection;•Impact matrix;•And Tollgate with Executive Committee.
On this slide we have shown a part of the impact matrix as an example.

35
Here we have shown an example of projections in which we compared interruptions caused byfiber optic damage with interruptions which would have occurred if we had had fiber linkprotection.This tool was used specifically for those solutions that required a very high investment.

The main tangible expected benefits were:• Reduction of 70 % in interruptions due to incidences.• Reduction of 60% in interruptions due to vulnerable technologies.• Reduction of 75% in interruptions due to programmed interventions.• Reduction of >100,000 monthly minutes of lack of communication.• Reduction of repeated interruptions in radio base stations.
The intangible benefits identified were:• Integration of the operating groups.• New collaboration culture and synergy between both operators.• Change of internal paradigms.
36
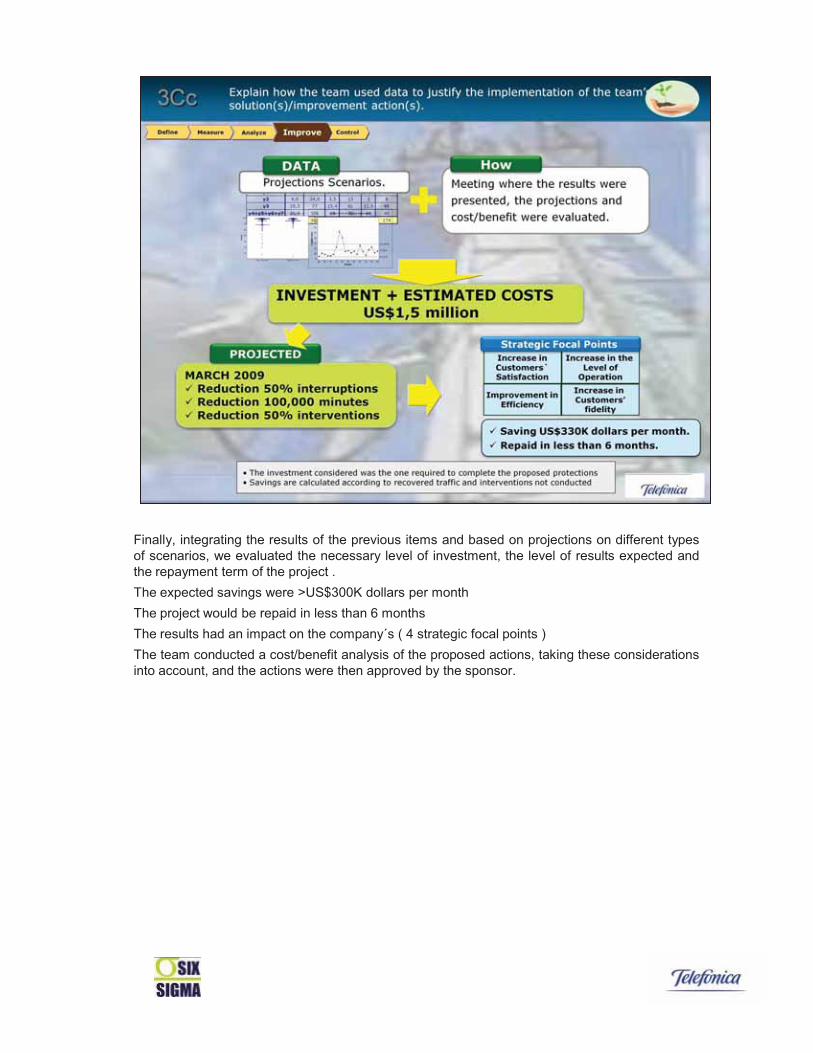
Finally, integrating the results of the previous items and based on projections on different typesof scenarios, we evaluated the necessary level of investment, the level of results expected andthe repayment term of the project .The expected savings were >US$300K dollars per monthThe project would be repaid in less than 6 monthsThe results had an impact on the company´s ( 4 strategic focal points )The team conducted a cost/benefit analysis of the proposed actions, taking these considerationsinto account, and the actions were then approved by the sponsor.

Now, Alejandro, Green Belt of the project, is going to present next section:IMPLEMENTATION AND RESULTS
Thank you Marcos,

39
In this stage various stakeholders had particular involvement: for example Maintenance, byimplementing the proposed solutions, Network Management, Planning and Engineeringand Business Units who together analyzed and implemented backup protection of 30% of allconnections, and Movistar Operation, by providing relevant information.
Changes were facilitated, and actions encouraged, by relevant Management and the ExecutiveCommittee.
40
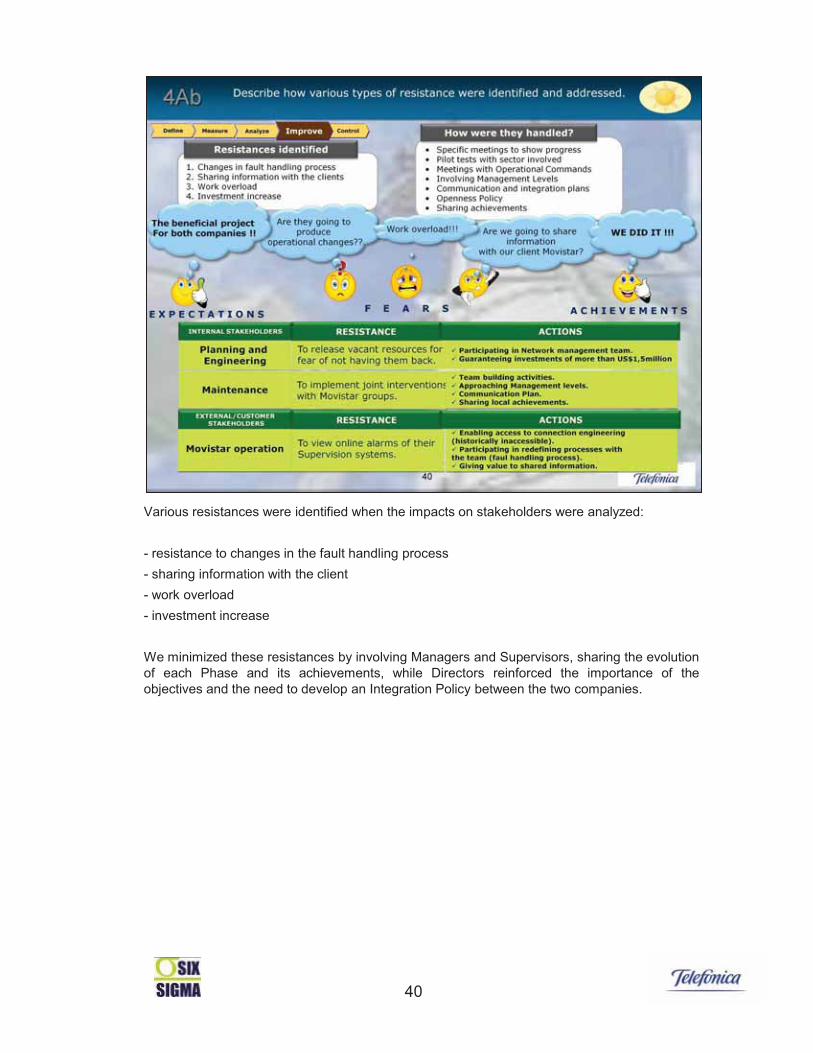
Various resistances were identified when the impacts on stakeholders were analyzed:
- resistance to changes in the fault handling process- sharing information with the client- work overload- investment increase
We minimized these resistances by involving Managers and Supervisors, sharing the evolutionof each Phase and its achievements, while Directors reinforced the importance of theobjectives and the need to develop an Integration Policy between the two companies.
41
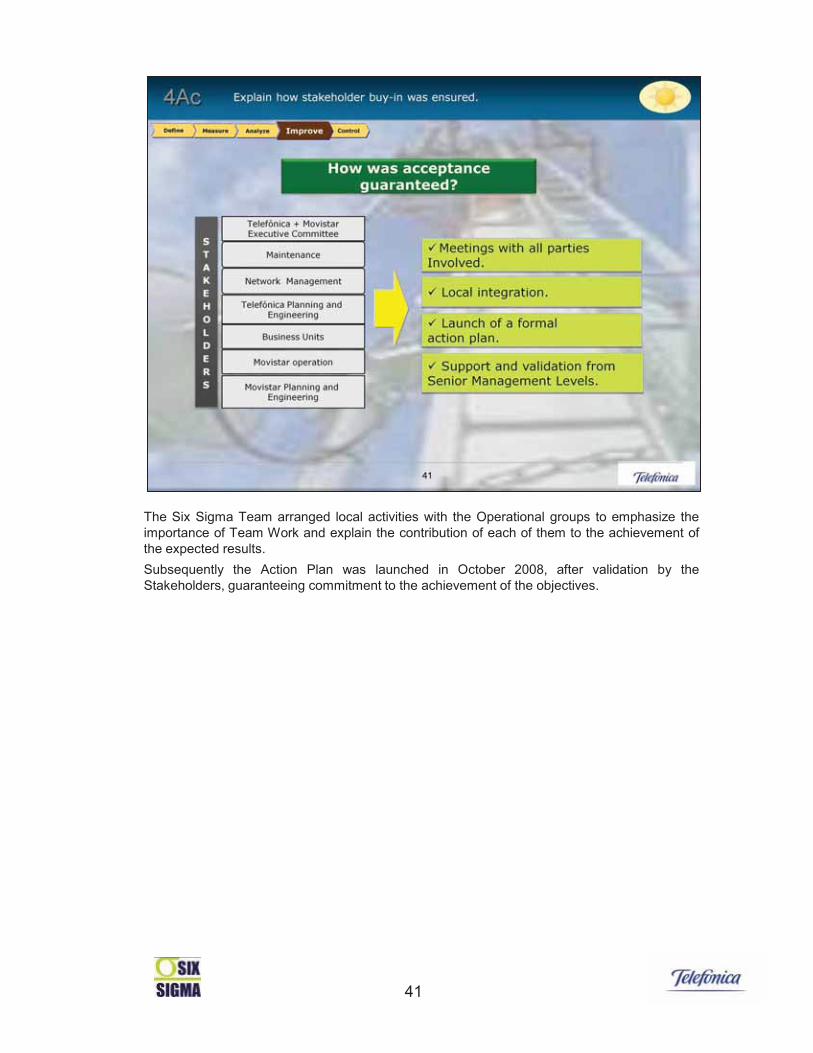
The Six Sigma Team arranged local activities with the Operational groups to emphasize theimportance of Team Work and explain the contribution of each of them to the achievement ofthe expected results.Subsequently the Action Plan was launched in October 2008, after validation by theStakeholders, guaranteeing commitment to the achievement of the objectives.
42
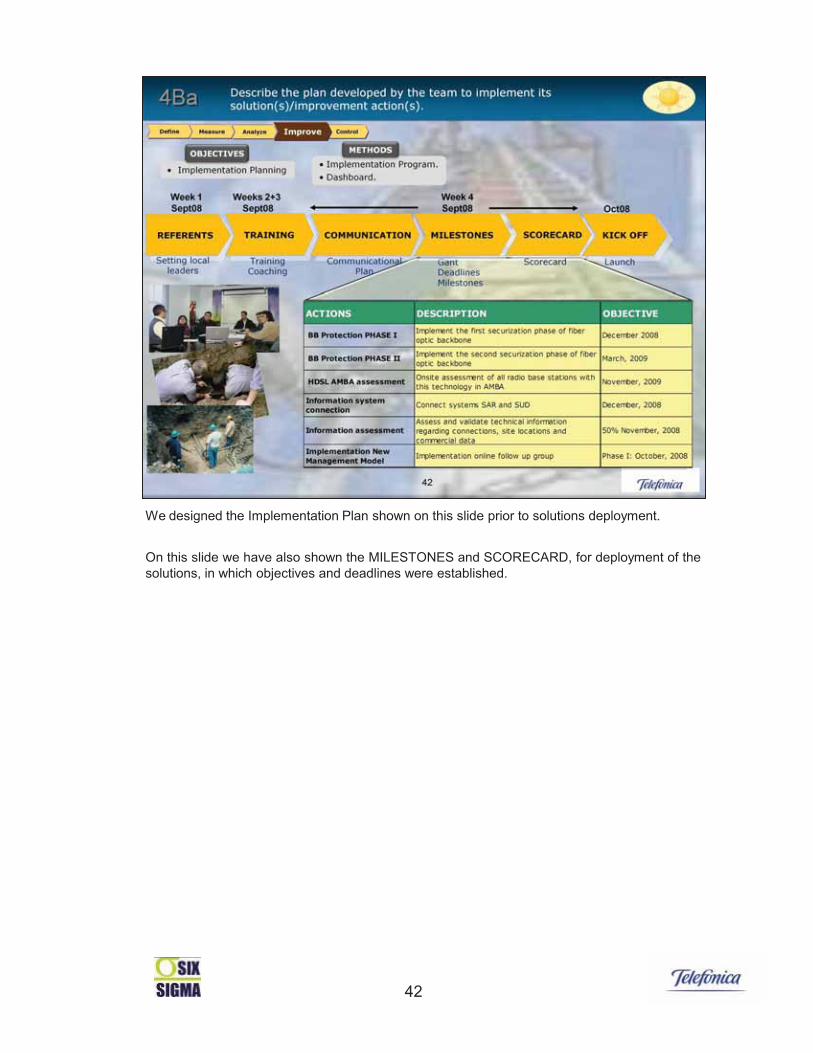
We designed the Implementation Plan shown on this slide prior to solutions deployment.
On this slide we have also shown the MILESTONES and SCORECARD, for deployment of thesolutions, in which objectives and deadlines were established.
43
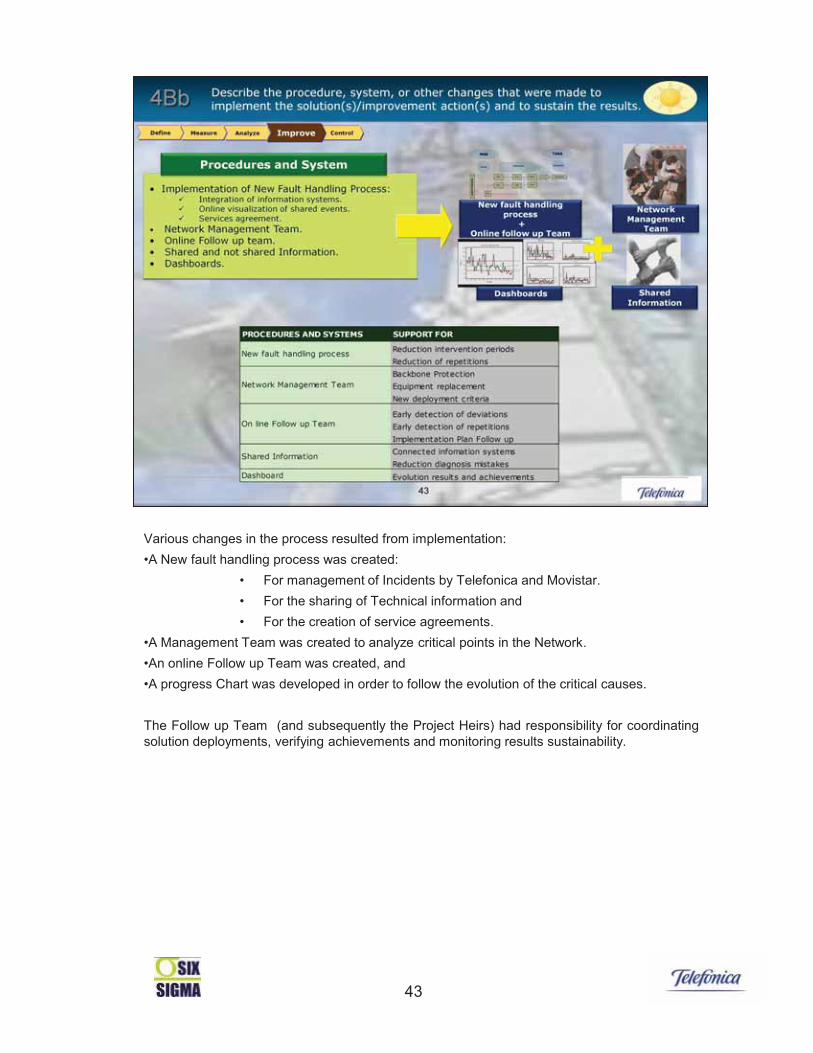
Various changes in the process resulted from implementation:•A New fault handling process was created:
• For management of Incidents by Telefonica and Movistar.• For the sharing of Technical information and• For the creation of service agreements.
•A Management Team was created to analyze critical points in the Network.•An online Follow up Team was created, and•A progress Chart was developed in order to follow the evolution of the critical causes.
The Follow up Team (and subsequently the Project Heirs) had responsibility for coordinatingsolution deployments, verifying achievements and monitoring results sustainability.

A SCORECARD was implemented in order to track the progress of solutions which includedCONTROL CHARTS of the main variables to control the weekly evolution of interruptions.
These tools were used both as a control element and to support internal communication, resultsand achievements.

We obtained the following tangible results :
•118 monthly interruptions (66% reduction)•Average monthly availability increased to: 99.87%•Onsite interventions: reduced by 50%•Saving of 150,000 minutes in monthly interruptions representing more than US$300K dollarsper month
These results were better than the results projected during the solution development phase.
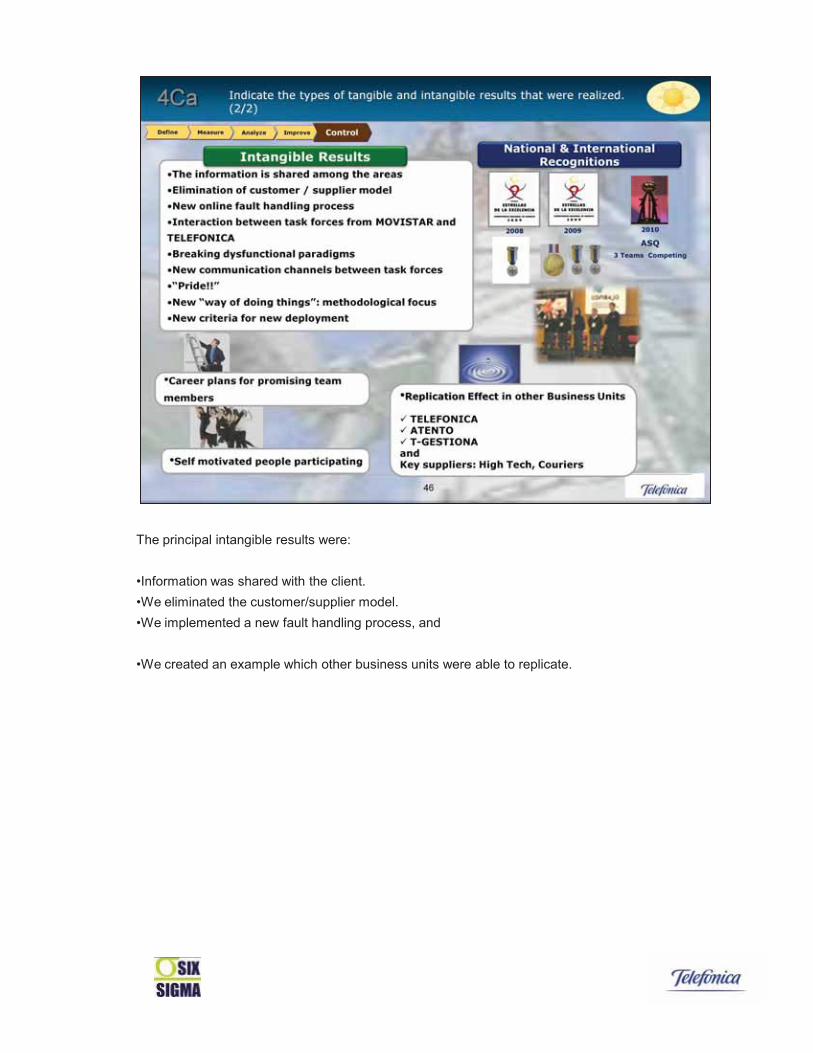
The principal intangible results were:
•Information was shared with the client.•We eliminated the customer/supplier model.•We implemented a new fault handling process, and
•We created an example which other business units were able to replicate.

The main project results had a direct impact on the Organizational Goals:For example:They impacted on Operational Efficiency and Quality by saving US$300K dollars per month andreducing the number of man hours spent on interventions and the amount of rework.
By generating an improvement in the relationship between the companies’ task forces, theproject also had an impact on Human Capital.
48
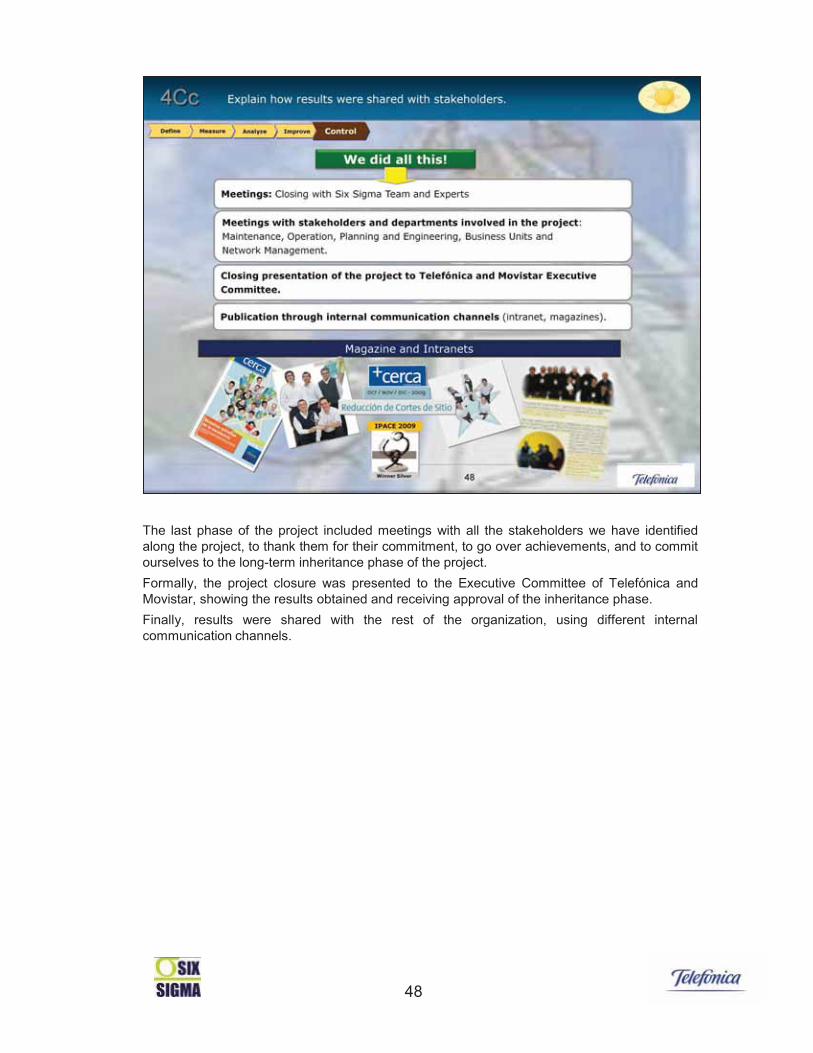
The last phase of the project included meetings with all the stakeholders we have identifiedalong the project, to thank them for their commitment, to go over achievements, and to commitourselves to the long-term inheritance phase of the project.Formally, the project closure was presented to the Executive Committee of Telefónica andMovistar, showing the results obtained and receiving approval of the inheritance phase.Finally, results were shared with the rest of the organization, using different internalcommunication channels.

Now, Jose, Sponsor of the project, is going to present next section:
TEAM MANAGEMENT AND PROJECT PRESENTATION
Thank you Alejandro
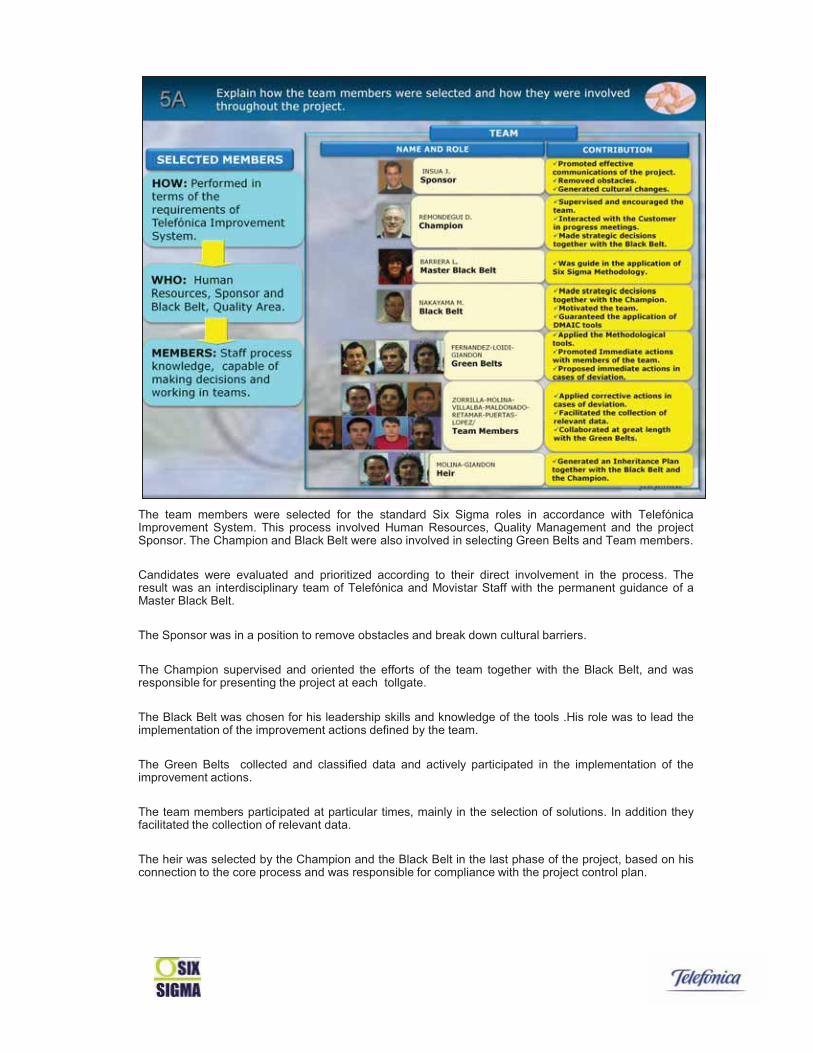
The team members were selected for the standard Six Sigma roles in accordance with TelefónicaImprovement System. This process involved Human Resources, Quality Management and the projectSponsor. The Champion and Black Belt were also involved in selecting Green Belts and Team members.
Candidates were evaluated and prioritized according to their direct involvement in the process. Theresult was an interdisciplinary team of Telefónica and Movistar Staff with the permanent guidance of aMaster Black Belt.
The Sponsor was in a position to remove obstacles and break down cultural barriers.
The Champion supervised and oriented the efforts of the team together with the Black Belt, and wasresponsible for presenting the project at each tollgate.
The Black Belt was chosen for his leadership skills and knowledge of the tools .His role was to lead theimplementation of the improvement actions defined by the team.
The Green Belts collected and classified data and actively participated in the implementation of theimprovement actions.
The team members participated at particular times, mainly in the selection of solutions. In addition theyfacilitated the collection of relevant data.
The heir was selected by the Champion and the Black Belt in the last phase of the project, based on hisconnection to the core process and was responsible for compliance with the project control plan.

51
The team was trained in Six Sigma DMAIC methodology, as detailed in Telefónica’sImprovement System. The training was carried out by internal and external providers, and wasdivided into four modules, covering the methodology phases.
This training provided the tools and skills needed for each team member to fulfill their role, andwas followed by a theory and practice exam.
Six Sigma Certification was completed by a general performance evaluation to ensure that theproject objectives had been achieved to the relevant established standard.
Additionally, the Improvement Team of Quality Management provided methodological supportto all members of the team during the project execution.

52
The Sponsor, the Champion and the Black belt explained the importance of the Project to allinvolved persons throughout the organization and presented the progress of each phase tothem on a regular basis.
An effective communication channel between Telefónica and Movistar was achieved throughan interdisciplinary team, who continued supporting each other during the Inheritance phase.At the same time, sharing data bases was of great help by informing each other of theevolution of critical causes and other key indicators on a weekly basis.
In tollgates of each methodology phase, results were confirmed, and progress and proposedsolutions for each aspect of the process were presented. This achieved visibility and reinforcedthe importance of the project for the Management Committees of both organizations.