Embed Size (px)
Citation preview

© 2008 Ipsos Public Affairs Privileged and confidential
2010 Canadian Water Attitudes Study
This study is made available to NGOs and other interested parties, courtesy of RBC and Unilever Canada.
We encourage the broad dissemination of the data and findings of this study, and hope the information helps contribute to a healthy conversation about the value and vulnerability of water in Canada. You are
welcome to refer to, reprint or redistribute this information, and we ask that you attribute the source as the “2010 Canadian Water Attitudes Study, commissioned by RBC and Unilever Canada.”

2© 2009 Ipsos Reid
About The Canadian Water Attitudes Study
RBC RBC is one of North America’s leading diversified financial services companies and among the largest banks in the world, as measured by market capitalization. It employs approximately 80,000 full- and part-time employees who serve more than 18 million personal, business, public sector and institutional clients through offices in Canada, the U.S. and 53 other countries.. RBC is recognized among the world's financial, social and environmental leaders and is listed on the 2009-2010 Dow Jones Sustainability World Index and the DJSI North American Index. RBC has been named one of Canada's Greenest Employers, one of Canada's Best Diversity Employers, one of Canada's 50 Most Socially Responsible Corporations and one of the Best Workplaces in Canada. RBC is also listed on the Jantzi Social Index, the FTSE4Good Index, and the Canadian Carbon Disclosure Project Leadership Index. As one of Canada's largest corporate donors, RBC supports a broad range of community initiatives, through donations, sponsorships and employee volunteer activities. In 2009, RBC contributed more than $105 million to community causes worldwide, through donations of more than $52.6 million, and an additional $52.5 million in sponsorship of community events and national organizations. The RBC Blue Water Project is a 10-year, $50 million philanthropic commitment to supporting organizations that protect watersheds and ensure access to clean drinking water. Since 2007, RBC has committed more than $20.48 million to more than 200 organizations worldwide working in this area. For more information, visit www.rbc.com/bluewater.
The 2010 Canadian Water Attitudes Study was commissioned by RBC and Unilever Canada, and administered online by Ipsos Reid from February 17-23, 2010. It included a sample of 2,022 adult Canadians across Canada. The results are considered accurate to within +/-2.2%, 19 times out of 20. The data were weighted by region, age and sex according to 2006 Census data.

3© 2009 Ipsos Reid
Unilever CanadaUnilever works to create a better future every day. We help people feel good, look good and get more out of life with brands that are good for them and good for others. Each day, around the world, consumers make 160 million decisions to purchase Unilever products. In Canada the portfolio includes brand icons such as: Axe, Becel, Ben & Jerry’s, Breyers, Degree, Dove personal care products, Hellmann’s, Klondike, Knorr, Lipton, Skippy, Slim-Fast,Sunsilk and Vaseline. All of the preceding brand names are registered trademarks of the Unilever Group of Companies. Dedicated to serving consumers and the communities where we live, work and play, Unilever employs more than 13,000 people across North America –generating nearly $10 billion in sales in 2009. With a steadfast commitment to water sustainability, Unilever strives to lead by example and remains committed to further reducing its water footprint. For eleven years running, Unilever has been acknowledged as the food industry category leader on the Dow Jones Sustainability Index for their environmental policies. For the fifth year running, Unilever was also named amongst the ‘Global 100 Most Sustainable Corporations in the World’ by Corporate Knights and Innovest, an international finance and investment advisory firm. Unilever is also an active participant in several water sustainability programs across Canada including EcoVoyageurs, a national school-based education program in which students are encouraged to reduce their own ‘environmental footprint’. In 2008, Unilever Canada launched Go Blue, a national awareness program which to educate consumers about steps they can take to conserve water in their daily lives. For more information, visit www.unilever.com
About The Canadian Water Attitudes Study

4© 2009 Ipsos Reid
Executive Summary
• Quality of Water• More Canadians now (79%) than a year ago (72%) have confidence in the safety of Canada’s
water supply in general. Further, more Canadians are confident in the water that comes out of their taps – more Canadians are now drinking tap water than a year ago.
• Most (83%) Canadians are concerned about the quality of water in the lakes where they swim. Moreover, two in three (68%) perceive that the problem of lake water quality is getting worse, while few (10%) think it’s improving.
• One quarter (25%) of Canadians have no idea where their water comes from.
• While awareness of the water quality problem on reserves is low, once informed of the problem most (74%) become concerned about the situation. Given the opportunity to support either an organization that works to rectify this problem at home on native reserves or an organization that serves international locations of humanitarian disaster, Canadians would choose to support the local organization to a 2:1 margin.
• 15% of Canadians didn’t know that toilet water and tap water are the same. Given the choice, most (66%) say toilet water is too clean, not that faucet water is too dirty (34%).
5© 2009 Ipsos Reid
Executive Summary
• Supply of Water• Canadians are more confident (75%) than last year (70%) that Canada has enough
freshwater supply for the long term. With the exception of Alberta, Canadians are more confident of the water supply in their region than in Canada at large.
• Most Canadians overestimate the abundance of water in Canada and underestimate the degree to which water is lost from our municipal water pipes.
• Canadians still believe that run-off pollutants are the biggest threat to the water supply in Canada, but twice as many now believe that waste from individual consumers is the biggest threat, and households now tie businesses as the biggest water consumers in the eyes of Canadians.

6© 2009 Ipsos Reid
Executive Summary
• Water Conservation Habits• More Canadians admit to trying reasonably hard to conserve electricity than
water, despite the fact that they say they’re making reasonable efforts to conserve. And while they give themselves good grades, governments, businesses and other Canadians are apparently doing a lousy job.
• While all sorts of water-wasting activities upset Canadians when they others engaging in such activities, most (80%) admit to committing some sort of wasteful activity.
• Canadians are generally not getting better when it comes to performing water conservation activities, such as installing low-flow toilets, showerheads, rain barrels, etc.

7© 2009 Ipsos Reid
Executive Summary
• Corporate Actions• Not much has changed since last year on this front. A similar proportion of Canadians report
having boycotted a company for misusing water, and the same is true regarding Canadians who begin doing business with a company because they learned they use water responsibly.
• Unilever has gained some directional momentum with regards to its raising of awareness of water conservation. Roughly one in three could be inspired to buy a product that they perceive to save water. They are equally as enticed by hearing that a product is made using less water as they are to hear that a company supports an organization that conserves water.
8© 2009 Ipsos Reid
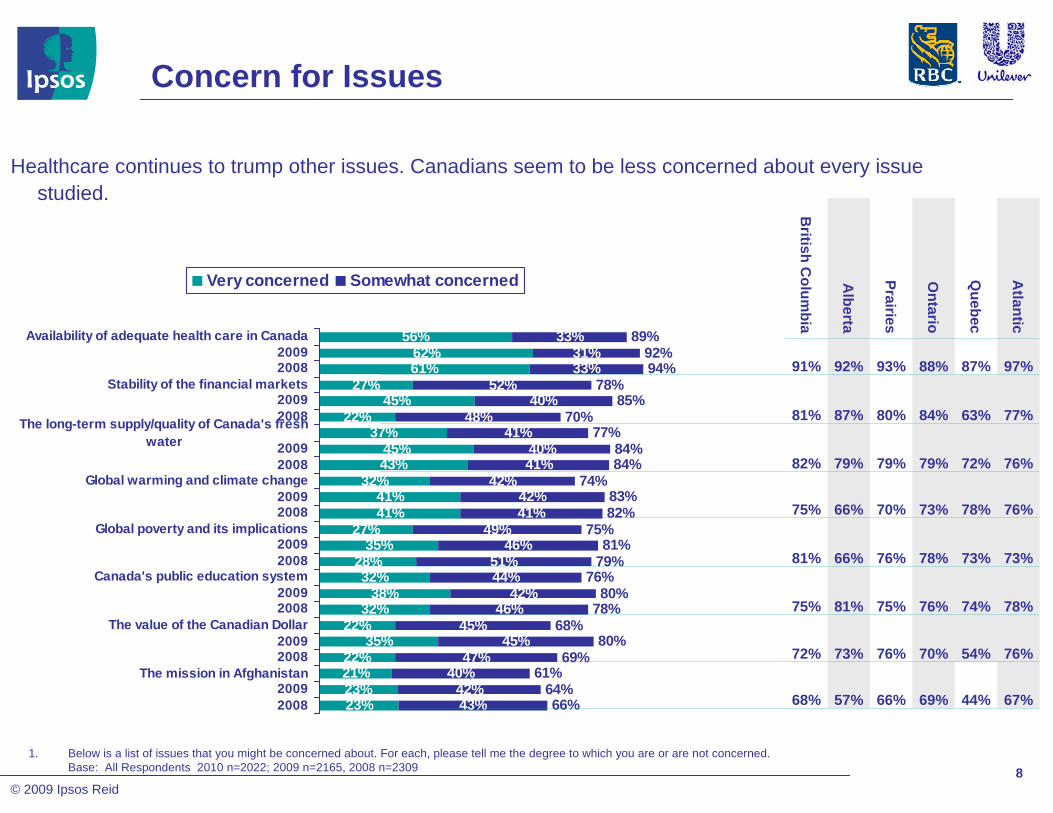
Concern for Issues
Healthcare continues to trump other issues. Canadians seem to be less concerned about every issue studied.
1. Below is a list of issues that you might be concerned about. For each, please tell me the degree to which you are or are not concerned.Base: All Respondents 2010 n=2022; 2009 n=2165, 2008 n=2309
56%62%61%
27%45%
22%37%
45%43%
32%41%41%
27%35%
28%32%
38%32%
22%35%
22%21%23%23%
33%31%33%
52%40%
48%41%
40%41%
42%42%41%
49%46%
51%44%
42%46%
45%45%
47%40%
42%43%
89%92%94%
78%85%
70%77%
84%84%
74%83%82%
75%81%
79%76%
80%78%
68%80%
69%61%
64%66%
Availability of adequate health care in Canada20092008
Stability of the financial markets20092008The long-term supply/quality of Canada's fresh
water 20092008
Global warming and climate change20092008
Global poverty and its implications20092008
Canada's public education system20092008
The value of the Canadian Dollar20092008
The mission in Afghanistan20092008
Very concerned Somewhat concerned
67%44%69%66%57%68%
76%54%70%76%73%72%
78%74%76%75%81%75%
73%73%78%76%66%81%
76%78%73%70%66%75%
76%72%79%79%79%82%
77%63%84%80%87%81%
97%87%88%93%92%91%
Atlantic
Quebec
Ontario
Prairies
Alberta
British C
olumbia

9© 2009 Ipsos Reid
Most Concerning Environmental Issues (aided)
2. Focusing on the list below, please select the two issues below that you’re most concerned aboutBase: All Respondents 2010 n=2022; 2009 n = 2165
34%
24%
25%
20%
32%
20%
23%
7%
8%
46%
40%
24%
22%
21%
18%
16%
9%
2%
Global warming and climate change
Pollution of the air
The long-term supply of fresh water in Canada
The quality of drinking water in Canada
Depleting Canada's supply of non-renewable naturalresources
The effects of humans on animals and their habitat
The actions of government on protecting the environment
The state of sensitive eco-systems
None of these issues concern me
2010 2009
7%7%9%8%10%7%
4%6%8%7%7%10%
20%28%22%27%16%20%
19%21%19%16%24%23%
42%23%31%28%37%41%
14%23%19%23%21%16%
25%16%26%27%35%28%
25%24%27%26%16%16%
37%45%30%30%27%32%
Atlantic
Quebec
Ontario
Prairies
Alberta
British C
olumbia
While still in first position, global warming and climate change are mentioned by fewer Canadians. The largest increase occurs in the depletion of Canada’s supply of non-renewable resources.

10© 2009 Ipsos Reid
Consider Canada’s Most ImportantNatural Resource
3. Which of the following would you consider to be Canada’s most important natural resource?Base: All Respondents 2010 n=2022; 2009 n = 2165
TOTAL
49%
20%
17%
9%
3%
1%
0%
53%
20%
14%
8%
2%
2%
0%
Fresh water
Forests
Agricultural/farm land
Oil
Fisheries
Base metals
Coal
2010 2009
0%
1%
3%
9%
22%
17%
46%
Rural
0%
1%
3%
9%
16%
20%
50%
Urban
1%
0%
3%
9%
17%
23%
47%
Female
0%
2%
4%
10%
17%
16%
51%
Male
0%
2%
3%
10%
21%
15%
50%
> 55 years old
0%
1%
4%
8%
19%
19%
49%
35 to 55 years old
1%
1%
3%
10%
11%
27%
47%
18 to 34 years old
-0%1%-1%-
3%1%1%2%-2%
14%2%2%-1%6%
9%4%10%5%29%6%
19%13%20%21%19%13%
21%24%16%15%11%30%
34%56%50%57%39%44%
Atlantic
Quebec
Ontario
Prairies
Alberta
British C
olumbia
Canadians continue to believe that fresh water is Canada’s most important natural resource.

11© 2009 Ipsos Reid
46%61%
41%49%
44%57%
35%
32%35%
14%18%
5%8%
5%6%
38%32%
46%43%
39%33%
47%46%
47%48%
45%44%
37%38%
30%33%
85%93%
86%92%
83%91%
82%86%
79%83%
59%61%
42%46%
34%39%
41%
Quality Canada's fresh water2009
Canada's forests2009
Availability Canada's fresh water2009
Canada's agricultural land/farm land2009
Canada's fisheries/fish stock2009
Canada's oil reserves2009
Canada's metals - copper and nickel2009
Canada's coal resources2009
Very Concerned Somewhat Concerned
Concern for Natural Resources
4. How concerned are you about the declining state of following?Base: All Respondents 2010 n=2022; 2009 n = 2165
31%35%40%28%31%39%31%34%19%40%43%39%38%
36%44%44%40%46%43%37%38%26%51%44%44%46%
57%
75%
80%
83%
87%
86%
Rural
59%
80%
82%
83%
86%
85%
Urban
64%
79%
84%
87%
91%
90%
Female
53%
79%
79%
79%
82%
80%
Male
60%
85%
87%
86%
89%
88%
> 55 years old
61%
80%
84%
84%
86%
86%
35 to 55 years old
55%
70%
72%
79%
84%
80%
18 to 34 years old
61%41%67%60%65%63%
85%71%81%81%74%86%
83%75%85%85%80%86%
84%82%84%83%86%83%
87%87%84%85%86%92%
83%85%84%87%86%86%
Atlantic
Quebec
Ontario
Prairies
Alberta
British C
olumbia
The quality of freshwater and forests are statistically tied when it comes to the worry Canadians have towards the declining state of various resources.

12© 2009 Ipsos Reid
23%
26%
19%
15%
6%
7%
4%
0%
1%
29%
28%
18%
12%
6%
4%
2%
0%
0%
Quality of Canada's fresh water
Availability of Canada's freshwater
Canada's forests
Canada's agricultural land/farmland
Canada's oil reserves
Canada's fisheries
None of these issues concernme
Canada's coal resources
Canada's metals - copper andnickel
2010 2009
Most Concerned About…
4b. And, which are you most concerned about? Base: All Respondents 2010 n=2022; 2009 n = 2165
1%1%0%1%1%0%1%1%0%1%3%-1%
-1%0%1%0%1%0%1%0%1%---
3%4%4%4%3%4%6%3%2%5%2%5%4%
6%
4%
19%
19%
25%
24%
Rural
7%
6%
14%
18%
27%
22%
Urban
5%
4%
14%
20%
28%
24%
Female
9%
8%
15%
17%
24%
22%
Male
8%
5%
19%
12%
27%
25%
> 55 years old
6%
5%
16%
17%
26%
25%
35 to 55 years old
5%
9%
7%
28%
28%
16%
18 to 34 years old
20%4%5%4%2%13%
5%4%6%5%16%4%
13%9%18%15%20%12%
19%26%15%13%14%22%
23%27%26%31%22%29%
15%27%24%26%20%15%
Atlantic
Quebec
Ontario
Prairies
Alberta
British C
olumbia
But when forced to choose which one they’re most concerned about, water is clearly in first position.
49%

13© 2009 Ipsos Reid
Level of Confidence That Canada Has Enough Fresh Water to Meet Long-Term Goals
5. Now, thinking specifically about Canada’s supply of fresh water, how confident are you that Canada as a whole has enough freshwater to meet our long-term needs?Base: All Respondents 2010 n=2022; 2009 n = 2165, 2008 n = 2309
Confidence that Canada has enough freshwater supply for the long-term has increasedQuebecers are disproportionately less confident in Canada’s long-term supply of fresh water and women are less confident than men.
17%
25%
18%18%17%17%
13%
13%
19%
10%
58%55%
56%
65%65%
63%62%
43%64%
59%57%
59%
58%59%
75%
70%
81%
83%
80%
79%
59%77%
71%
75%
78%
81%
69%23%
17%
16%
15%
83%
Total 201020092008
British ColumbiaAlbertaPrairiesOntarioQuebecAtlantic
18 to 34 years old35 to 55 years old
Older than 55 years old
MaleFemale
Very confident Somewhat confident

14© 2009 Ipsos Reid
26%
32%
33%21%
32%26%
29%
23%
29%
19%
53%52%
52%
53%57%
53%53%
48%57%
52%52%
54%
49%56%
78%74%
84%
86%79%
85%79%
70%86%
75%77%
83%
82%75%
22%
22%
26%
34%
Total 201020092008
British ColumbiaAlbertaPrairiesOntarioQuebecAtlantic
18 to 34 years old35 to 55 years old
Older than 55 years old
MaleFemale
Very confident Somewhat confident
Regional Concerns
6. And focusing specifically on your region of Canada, how confident are you that it has enough freshwater to meet your region’s long-term needs?Base: All Respondents 2010 n=2022; 2009 n = 2165, 2008 n = 2309
Canadian’s confidence in their region’s available water has also increased over the past year. Canadians tend to be more confident that their region has enough fresh-water to meet their needs than other parts of Canada, with the exception of Alberta.

15© 2009 Ipsos Reid
21%
25%
29%28%
24%21%
22%
23%
21%
17%
58%55%
56%
58%60%
58%59%
54%59%
54%58%
61%
56%59%
72%81%
87%89%
81%81%
68%80%
78%78%
82%
82%77%
26%
20%
14%
17%79%Total 2010
20092008
British ColumbiaAlbertaPrairiesOntarioQuebecAtlantic
18 to 34 years old35 to 55 years old
Older than 55 years old
MaleFemale
Very confident Somewhat confident
Confidence in the Safety of Water
7. Overall, How confident are you about the safety and quality of Canada’s drinking water?Base: All Respondents 2010 n=2022; 2009 n = 2165, 2008 n = 2309
Confidence in the safety of Canada’s water supply has also increased over the past year. Quebecers are less confident in the safety of their water than other regions.

16© 2009 Ipsos Reid
Confidence in Safety of Water at Home
8. And personally how confident are you about the safety and quality of the water in your home?Base: All Respondents 2010 n=2022; 2009n = 2165
Canadians are slightly more confident in the safety of the water in their home than water in other parts of Canada.
• Those who drink tap water are most confident (91%), while those who drink individual bottled water are least confident (76%).
• Those whose source of tap water is a lake (88%) or a well (88%) are most confident, while those who have no idea (79%) or get their water from one of the great lakes (82%) are less confident.
38%
32%
45%
48%
49%
40%
22%
46%
34%
36%
43%
42%
35%
47%
49%
48%
43%
42%
45%
54%
40%
49%
46%
46%
46%
47%
85%
81%
93%
91%
91%
85%
75%
86%
83%
82%
89%
88%
82%
Total 2010
2009
British Columbia
Alberta
Prairies
Ontario
Quebec
Atlantic
18 to 34 years old
35 to 55 years old
Older than 55 years old
Male
Female
Very confident Somewhat confident

17© 2009 Ipsos Reid
Drinking Water in the Home
9. In your home, what source of water do you typically drink?Base: All Respondents 2010 n=2022; 2009 n = 2165
More Canadians are drinking their tap water as one half (49%) say they typically drink water out of the faucet up from 41% last year. This is likely a function of rising confidence in the safety of water in general.
49%
32%
16%
16%
1%
41%
27%
17%
12%
5%
Tap water (directly from the tap)
Filtered water (from the tap, butthrough another filtering system)
Water from a large-jug cooler
Individually-sized bottled water
Some other source (PLEASESPECIFY)
2010 2009
-
14%
20%
24%
47%
Rural
0%
17%
15%
34%
50%
Urban
1%
18%
18%
33%
44%
Female
1%
14%
13%
31%
54%
Male
1%
12%
13%
28%
50%
> 55 years old
1%
17%
20%
32%
45%
35 to 55 years old
-
19%
13%
36%
55%
18 to 34 years old
-1%1%---
10%20%19%9%13%10%
20%17%13%19%18%16%
29%19%39%44%34%30%
47%55%44%41%51%57%
Atlantic
Quebec
Ontario
Prairies
Alberta
British C
olumbia

18© 2009 Ipsos Reid
True or False Quiz
10. Please indicate whether you believe the following to be true or false: Base: All Respondents n = 2022
85%
78%
73%
68%
57%
50%
46%
39%
18%
15%
T R UE - T he water that co mes o ut o f yo ur taps isas clean as the water that f lo ws into yo ur to ilet .
T R UE - C anada has so me o f the lo west waterco sts in the industria lized wo rld
F A LSE - Yo u save mo re water taking a bath thana sho wer.
F A LSE - C limate change will increase the amo unto f freshwater in C anada.
T R UE - C anada will have a fresh water sho rtagein the future.
T R UE - It takes less water to run a fully lo adeddishwasher than it do es to hand wash all o f
tho se dishes
F A LSE - M o st o f C anada's freshwater reso urcesf lo w so uth
F A LSE - T he o il sands cause mo re waterpo llut io n than farming/ agricultural pract ices.
F A LSE - C anada has mo re fresh water than anyo ther co untry in the wo rld.
F A LSE - A bo ut 4% o f the water c leaned andtreated by yo ur city o r to wn is lo st because o f
leaky pipes and sewers.
48%51%51%49%51%48%52%50%43%54%53%49%53%
55%57%64%49%52%55%64%55%55%55%59%62%59%
72%67%65%72%73%64%69%66%73%66%76%63%65%
76%72%69%78%78%71%71%72%76%70%71%75%76%
17%19%21%15%13%18%25%22%17%20%12%18%19%
18%
39%
47%
77%
84%
Rural
14%
39%
46%
78%
86%
Urban
15%
39%
44%
75%
83%
Female
14%
40%
48%
81%
88%
Male
14%
40%
48%
85%
88%
> 55 years old
15%
39%
46%
74%
85%
35 to 55 years old
16%
37%
43%
76%
83%
18 to 34 years old
14%14%13%11%17%22%
38%31%42%44%47%38%
45%45%46%51%53%41%
77%83%73%85%72%83%
84%84%86%85%80%88%
Atlantic
Quebec
Ontario
Prairies
Alberta
British
Colum
bia
Canadians performed reasonably well in only 4 of the 10 questions asked.
% Correct Response

19© 2009 Ipsos Reid
True or False Quiz
10. Please indicate whether you believe the following to be true or false: Base: All Respondents n = 2022
Three in ten (28%) Canadians failed the quiz, failing to get at least 5 out of 10 questions correct.
% Correct Response
72%
28%
Pass
Fail
2010
28%28%30%26%22%33%29%30%31%29%22%25%26%
72%
Rural
72%
Urban
70%
Female
74%
Male
78%
> 55 years old
67%
35 to 55 years old
71%
18 to 34 years old
70%69%71%78%75%74%
Atlantic
Quebec
Ontario
Prairies
Alberta
British C
olumbia
20© 2009 Ipsos Reid
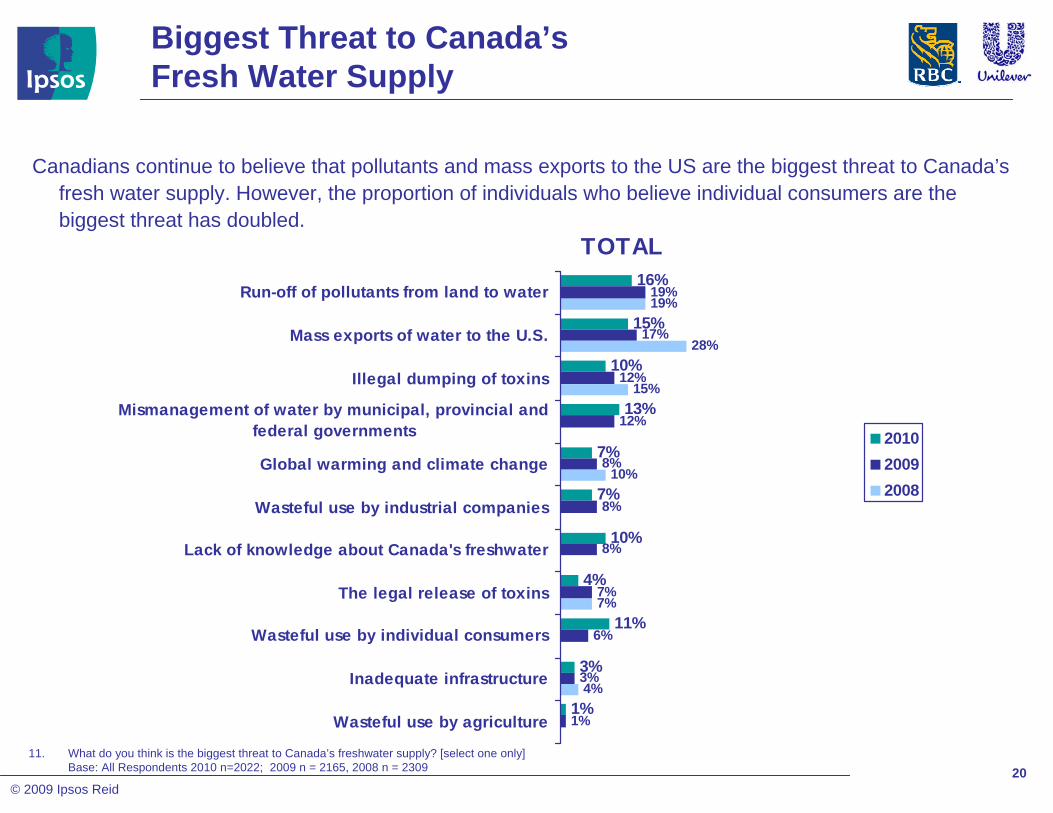
Biggest Threat to Canada’sFresh Water Supply
11. What do you think is the biggest threat to Canada’s freshwater supply? [select one only]Base: All Respondents 2010 n=2022; 2009 n = 2165, 2008 n = 2309
TOTAL16%
15%
10%
13%
7%
7%
10%
4%
11%
3%
1%
19%
17%
12%
12%
8%
8%
8%
7%
6%
3%
1%
19%
28%
15%
10%
7%
4%
Run-off of pollutants from land to water
Mass exports of water to the U.S.
Illegal dumping of toxins
Mismanagement of water by municipal, provincial andfederal governments
Global warming and climate change
Wasteful use by industrial companies
Lack of knowledge about Canada's freshwater
The legal release of toxins
Wasteful use by individual consumers
Inadequate infrastructure
Wasteful use by agriculture
201020092008
Canadians continue to believe that pollutants and mass exports to the US are the biggest threat to Canada’s fresh water supply. However, the proportion of individuals who believe individual consumers are the biggest threat has doubled.
21© 2009 Ipsos Reid
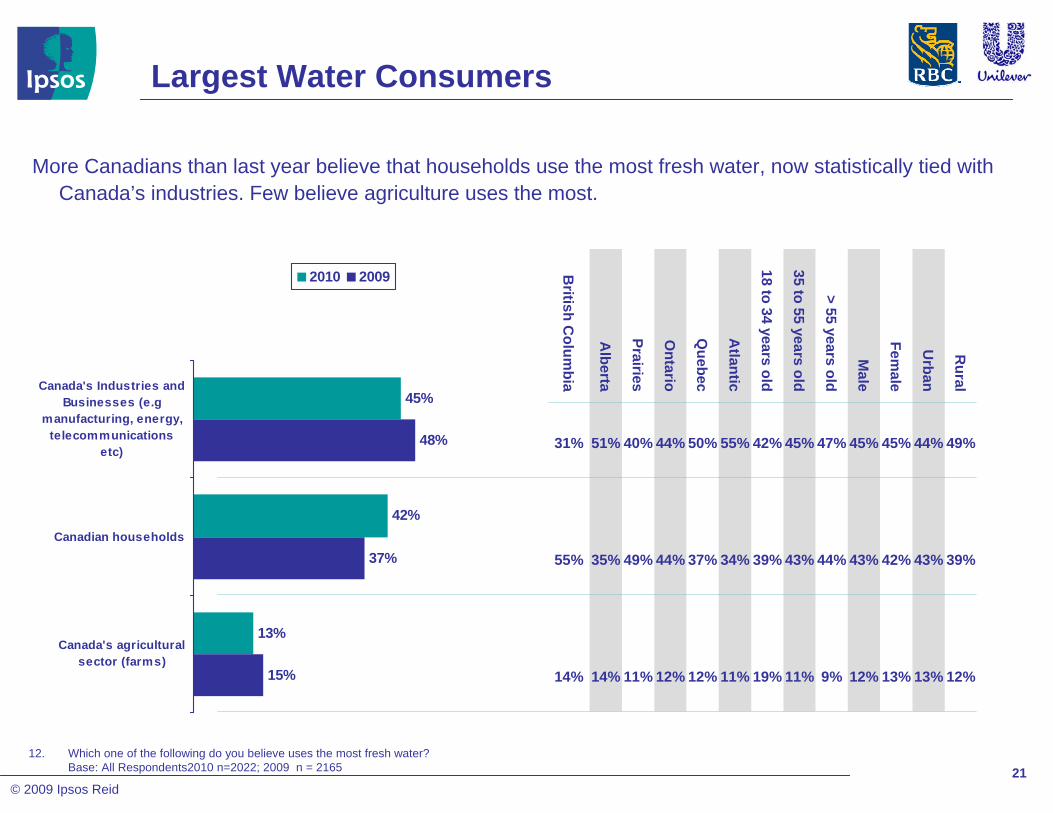
Largest Water Consumers
12. Which one of the following do you believe uses the most fresh water?Base: All Respondents2010 n=2022; 2009 n = 2165
45%
42%
13%
48%
37%
15%
Canada's Industries andBusinesses (e.g
manufacturing, energy,telecommunications
etc)
Canadian households
Canada's agriculturalsector (farms)
2010 2009
12%13%13%12%9%11%19%11%12%12%11%14%14%
39%
49%
Rural
43%
44%
Urban
42%
45%
Female
43%
45%
Male
44%
47%
> 55 years old
43%
45%
35 to 55 years old
39%
42%
18 to 34 years old
34%37%44%49%35%55%
55%50%44%40%51%31%
Atlantic
Quebec
Ontario
Prairies
Alberta
British C
olumbia
More Canadians than last year believe that households use the most fresh water, now statistically tied with Canada’s industries. Few believe agriculture uses the most.

22© 2009 Ipsos Reid
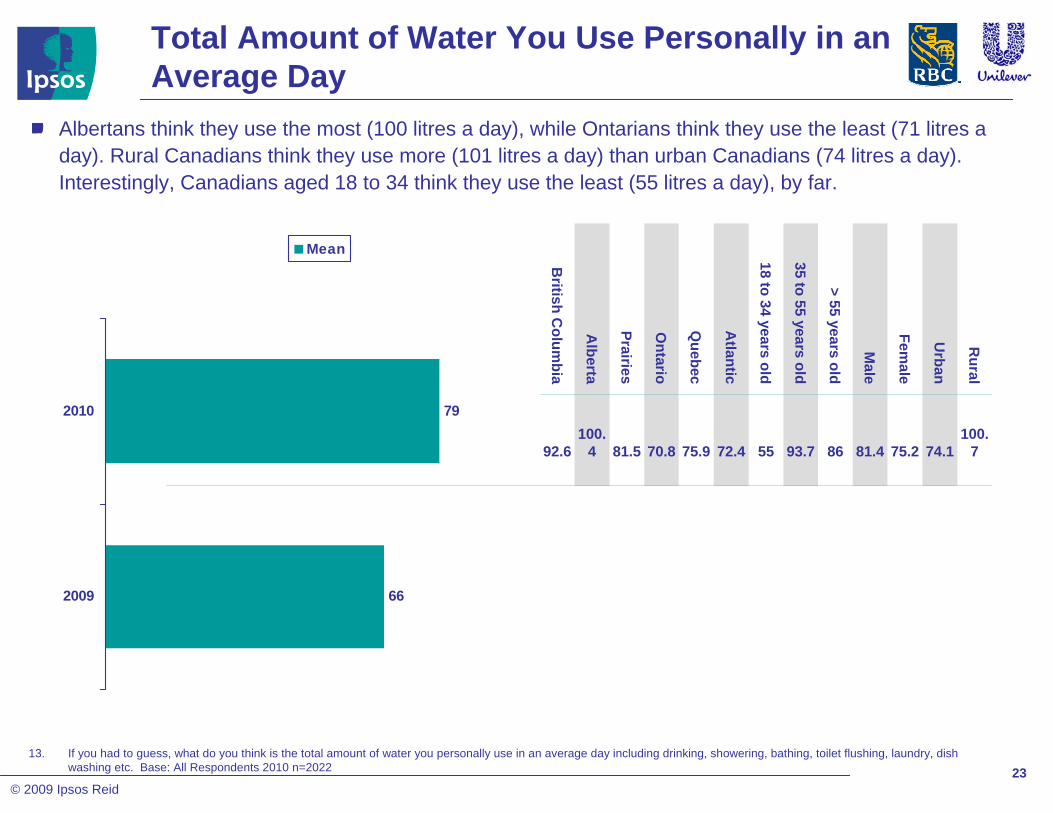
Total Amount of Water You Use Personally in an Average Day
13. If you had to guess, what do you think is the total amount of water you personally use in an average day including drinking, showering, bathing, toilet flushing, laundry, dish washing etc. Base: All Respondents 2010 n=2022
Last year Canadians thought they consumed about 66 litres a day. This year they think they consume 79 litres a day, on average.
17%
11%
9%
2%
17%
43%
1-24 litres
25-49 litres
50-74 litres
75-99 litres
100 litres ormore
Don't know
2010
49%42%55%30%45%47%35%32%49%44%30%45%39%
19%16%11%23%18%19%13%16%14%15%20%21%21%
2%3%1%3%3%2%2%1%2%3%4%3%3%
8%10%8%11%9%8%13%13%8%8%15%9%10%
10%
13%
Rural
11%
19%
Urban
8%
15%
Female
14%
20%
Male
11%
14%
> 55 years old
10%
14%
35 to 55 years old
12%
26%
18 to 34 years old
14%11%11%14%7%10%
25%15%18%17%15%17%A
tlantic
Quebec
Ontario
Prairies
Alberta
British
Colum
bia
2010: 79 litres a day 2009: 66 litres a day
23© 2009 Ipsos Reid
Total Amount of Water You Use Personally in an Average Day
13. If you had to guess, what do you think is the total amount of water you personally use in an average day including drinking, showering, bathing, toilet flushing, laundry, dish washing etc. Base: All Respondents 2010 n=2022
Albertans think they use the most (100 litres a day), while Ontarians think they use the least (71 litres a day). Rural Canadians think they use more (101 litres a day) than urban Canadians (74 litres a day). Interestingly, Canadians aged 18 to 34 think they use the least (55 litres a day), by far.
79
66
2010
2009
Mean
100.7
Rural
74.1
Urban
75.2
Female
81.4
Male
86
> 55 years old
93.7
35 to 55 years old
55
18 to 34 years old
72.475.970.881.5100.
492.6
Atlantic
Quebec
Ontario
Prairies
Alberta
British C
olumbia

24© 2009 Ipsos Reid
Level of Concern About Canadian’s Water Usage
14. In fact, Canadians on average use 329 liters of water per person, each day. This is twice the amount used by Europeans who enjoy a similar standard of living. How concerned are you about Canadians’ water usage? Base: All Respondents 2010 n=2022; 2009 n = 2165
39%
41%
50%
49%
89%
90%
2010
2009
Very concerned Somewhat concerned
87%89%93%85%89%87%91%89%89%90%87%88%88%
89%
Rural
92%
Urban
93%
Female
86%
Male
88%
> 55 years old
90%
35 to 55 years old
91%
18 to 34 years old
87%89%90%89%90%93%
Atlantic
Quebec
Ontario
Prairies
Alberta
British C
olumbia
After hearing about the average Canadian’s use of water (329 litres), most are concerned about Canadians’water usage. Interestingly, there is no correlation between amount of water they think they use and their level of concern upon learning what the actual average is.

25© 2009 Ipsos Reid
Water and electricity bills
15. Do you know how much you pay for the following each month?Base: All Respondents 2010 n=2022; 2009n = 2165
74%
10%
16%
73%
14%
13%
Yes
No
The fee isincludedin myrental/condo
fees
2010 2009
Only four in ten (40%) know what they pay for their water, much less than the proportion (74%) that knows what they pay for electricity.
Electricity Bill
40%
29%
31%
40%
34%
26%
Yes
No
The fee isincludedin my
rental/condo fees
2010 2009
Water Bill
15%
35%
30%
32%
26%
27%
41%
23%
27%
36%
20%
24%
39%
36%
48%
Rural
28%
38%
Urban
32%
38%
Female
26%
42%
Male
27%
46%
> 55 years old
26%
46%
35 to 55 years old
36%
23%
18 to 34 years old
30%
54%
17%
20%
23%
29%
47%
20%
47%
60%
53%
32%
Atlantic
Quebec
Ontario
Prairies
Alberta
British C
olumbia
7%18%
15%
17%
13%
14%
22%6%
13%
23%9%
12%
11%
9%
85%
Rural
11%
71%
Urban
11%
74%
Female
10%
73%
Male
6%
81%
> 55 years old
8%
78%
35 to 55 years old
19%
59%
18 to 34 years old
7%7%12%
16%
14%8%
87%
80%
65%
75%
74%
81%
Atlantic
Quebec
Ontario
Prairies
Alberta
British C
olumbia

26© 2009 Ipsos Reid
Efforts to Conserve Electricty
16. To what extent do you, personally, try to conserve electricity in the course of your daily activities involving electricity?Base: All Respondents n = 2022
Eight in ten (87%) say they try at least reasonably hard to conserve electricity in their daily activities, higher than the 78% who say they try at least reasonably hard to conserve water in their daily activities.
30%
57%
12%
1%
Try very hard
Try reasonablyhard
Try a little
Don’t try at all
2010
1%1%0%2%1%1%2%1%1%1%3%-1%
10%13%11%13%7%11%20%13%9%13%9%13%14%
57%
32%
Rural
57%
29%
Urban
57%
32%
Female
57%
28%
Male
61%
31%
> 55 years old
53%
35%
35 to 55 years old
58%
21%
18 to 34 years old
52%66%51%58%60%57%
34%24%35%30%26%28%
Atlantic
Quebec
Ontario
Prairies
Alberta
British C
olumbia

27© 2009 Ipsos Reid
The Energy Game
17. Which do you think uses more energyBase: All Respondents n = 2022
More believe leaving a light on for 14 hours takes more energy than running a water faucet for 5 minutes. However four in ten (42%) were not stumped and knew they’re both the same in terms of energy use.
22%
36%
42%
Running awater faucet for
5 minutes
Leaving a 60watt light bulbilluminated for
14 hours
Neither -- Theyboth use the
same
2010
44%41%45%39%41%43%42%37%45%43%38%41%40%
39%
17%
Rural
35%
23%
Urban
33%
22%
Female
39%
22%
Male
36%
23%
> 55 years old
38%
19%
35 to 55 years old
34%
25%
18 to 34 years old
41%29%36%46%40%38%
22%27%21%16%19%22%
Atlantic
Quebec
Ontario
Prairies
Alberta
British C
olumbia

28© 2009 Ipsos Reid
Attitudes Towards Conservation
18. Do you agree or disagree with following statements.Base: All Respondents 2010 n=2022; 2009 n = 2165
% Agree
89%
47%
32%
86%
46%
30%
82%
53%
I, personally, am makingreasonable efforts to conserve
freshwater.
Canadians, in general, aremaking reasonable efforts to
conserve freshwater.
Corporations, businesses andindustry are making reasonable
efforts to conserve Canada's freshwater supplies.
2010 2009 2008
Canadians are passing the buck when it comes to water conservation. They think they’re doing a decent job, but that others are not.
33%32%33%31%31%34%30%36%22%35%36%37%34%
50%
92%
Rural
47%
88%
Urban
49%
90%
Female
46%
88%
Male
46%
92%
> 55 years old
52%
91%
35 to 55 years old
41%
82%
18 to 34 years old
46%41%52%49%46%47%
89%89%88%92%91%89%
Atlantic
Quebec
Ontario
Prairies
Alberta
British C
olumbia

29© 2009 Ipsos Reid
Attitudes Towards Conservation
18. Do you agree or disagree with following statements.Base: All Respondents 2010 n=2022
% Agree
89%
47%
32%
40%
60%
I, personally, am makingreasonable efforts to conserve
freshwater.
Canadians, in general, aremaking reasonable efforts to
conserve freshwater.Corporations, businesses and
industry are making reasonableefforts to conserve Canada's fresh
water supplies.Governments are making
reasonable efforts to conservefreshwater
The price for water in Canada ishigh enough to ensure it is treated
as a valuable resource
2010
Most people think that they’re doing an adequate job of conserving freshwater, but don’t believe the same applies to Canadians in general, corporations, or governments. Just six in ten (60%) believe the price for water is high enough to ensure it isn’t wasted. Conversely, four in ten likely believe waste occurs because the price for water isn’t high enough.
61%60%62%58%62%63%53%69%54%63%65%56%58%
39%41%41%40%39%42%38%46%29%43%45%44%44%
33%32%33%31%31%34%30%36%22%35%36%37%34%
50%
92%
Rural
47%
88%
Urban
49%
90%
Female
46%
88%
Male
46%
92%
> 55 years old
52%
91%
35 to 55 years old
41%
82%
18 to 34 years old
46%41%52%49%46%47%
89%89%88%92%91%89%
Atlantic
Quebec
Ontario
Prairies
Alberta
British
Colum
bia

30© 2009 Ipsos Reid
Awareness of Local Government Initiatives
19. Are you aware of any initiatives that your local government is undertaking in order to encourage its citizens to conserve water?Base: All Respondents n = 2022
Awareness of local government initiatives to conserve water are low, although awareness is higher in some regions such as British Columbia (10%) and Ontario (7%).
6%
26%
38%
30%
Very aware
Somewhataware
Not very aware
Not at all aware
2010
37%28%32%28%25%33%32%40%27%28%36%40%25%
34%38%39%36%38%34%42%39%51%37%27%28%27%
22%
6%
Rural
27%
6%
Urban
23%
5%
Female
29%
7%
Male
30%
7%
> 55 years old
26%
6%
35 to 55 years old
22%
4%
18 to 34 years old
16%19%28%32%28%37%
6%3%7%5%5%10%
Atlantic
Quebec
Ontario
Prairies
Alberta
British C
olumbia

31© 2009 Ipsos Reid
21%
20%
15%
57%
54%
58%
78%
74%
73%
2010
2009
2008
Try very hard Try reasonably hard
82%77%80%75%82%80%69%75%84%77%76%76%73%
80%
Rural
73%
Urban
76%
Female
72%
Male
79%
> 55 years old
77%
35 to 55 years old
64%
18 to 34 years old
65%84%70%67%77%72%
Atlantic
Quebec
Ontario
Prairies
Alberta
British C
olumbia
Personal Water Conservation Efforts
20. To what extent do you, personally, try to conserve freshwater in the course of your daily activities involving water use?Base: All Respondents 2010 n=2022; 2009 n = 2165
Most believe they try at least reasonably hard to conserve water, slightly more than last year. Interestingly, the likelihood of believing this increases with age. Interestingly, those who know how much their water bill is are more likely (83%) to say they make reasonable efforts to conserve water.

32© 2009 Ipsos Reid
72%74%76%
47%53%
48%
69%70%69%
64%61%
58%
63%52%
50%
46%48%49%
47%50%51%
57%57%61%
38%45%
43%48%50%
18%25%25%
1%5%3%
20%18%
18%
41%37%
41%
20%20%22%
23%27%
30%
29%35%
37%
38%36%37%
33%32%34%
20%22%
21%
31%29%
20%22%22%
15%20%18%
6%9%
7%
92%94%
88%90%89%89%90%91%
87%88%88%
93%88%87%
83%84%86%
80%82%
85%77%79%
82%69%
74%64%
71%72%
33%45%
43%7%
14%10%
92%Avoid unnecessary water use20092008
Take shorter showers20092008
Check your toilet for leaks/ leaky faucets20092008
Turn-off the water while brushing your teeth20092008
Use concentrated household products 20092008
Avoid watering your lawn in the summer20092008
Purchase water-efficient appliances20092008
Install low-flow shower heads20092008
Washing your car with a bucket instead of a hose2009
Install low-flow toilets that use less water per20092008
Use rain barrels to collect water for use in your20092008
Donate to a registered water charity20092008
Always Sometimes
Actions Speak Louder Than Words
21. Now, thinking about this same list, what do you do to help conserve freshwater?Base: All Respondents 2010 n=2022; 2009 n = 2165, 2008 n=2309
Conservation habits have not changed much over the past year.Slightly more now use concentrated household products at least sometimes.Fewer are using low-flow toilets and rain barrels. Donations to registered water charities are down to 7% from 14%.

33© 2009 Ipsos Reid
23%
11%
12%
8%
8%
10%
5%
4%
0
14%
4%
1%
0%
30%
15%
11%
11%
9%
9%
8%
7%
1%
33%
20%
10%
13%
8%
More education about ways to conservewater
Rebates from companies
A water shortage
By-laws to control usage/ Enforced waterquotas
More information about how much water isused to make products I purchase
Higher charges for water
Government standards for products thatuse water
Companies leading by example
Celebrity endorsement
Knowing the equivalency
Trying to follow the good examples ofothers
My children pressuring me
Peer pressure from neighbours
201020092008
Encouraging Conservation
22. Which of the following would be the most likely to encourage you to conserve more freshwater?Base: All Respondents 2010 n=2022; 2009 n = 2165, 2008 n = 2309
More Canadians say that education, not necessarily rebates, would encourage them to conserve more fresh water – unchanged from last year. One in ten (14%) say that knowing the equivalency of what they’re saving in water usage would help them conserve more freshwater (new addition this year).

34© 2009 Ipsos Reid
The Hypocrisy of Secret Pleasures
23. Which of the following two activities upset you the most? When you see people…24. And which of the following have you knowingly done?…
Base: All Respondents n=2022
Canadians are angered to see others doing many of these things, but many do them themselves. The most newsworthy are those that are most upsetting to see but many people still do: hosing down their driveways appears to be the biggest secret pleasure, along with running water in the kitchen and when brushing teeth.
64%
37%
29%
22%
15%
10%
9%
6%
4%
Upsetting to See…
2%
19%
1%
2%
16%
44%
46%
21%
20%
Admit to Having Done…
None of these
Allowing soapy water to run down a storm drain (e.g. while washing a car, etc)
Leave the water on while brushing their teeth
Leave the water running in the kitchen when washing and rinsing dishes
Use soap or shampoo to bathe in a lake
Leave a faucet running in a public place like in a restaurant or coffee shop
Using the hose to melt snow in the spring
Hosing down their driveways
Watering their lawns when it has just rained, is raining, or about to rain

35© 2009 Ipsos Reid
So Clean you can Drink from It…
25. The water the fills your toilet bowl is the same quality as the water that comes out of your sink tap…Which is closer to your point of view?Base: All Respondents n = 2022
65%66%60%73%71%63%65%59%79%59%64%66%68%
35%
Rural
34%
Urban
40%
Female
27%
Male
29%
> 55 years old
37%
35 to 55 years old
35%
18 to 34 years old
41%21%41%36%34%32%
Atlantic
Quebec
Ontario
Prairies
Alberta
British C
olumbia
After learning that toilet water and tap water is the same water, two in three think toilet water is too clean, while one in three believe faucet water is too dirty.
66%
34%
Toilet water istoo clean
Faucet water istoo dirty
2010

36© 2009 Ipsos Reid
Quality of Lakes
26. How concerned are you about the quality of water in the lakes in which you swim?Base: All Respondents n = 2022
Eight in ten (83%) are concerned about the quality of water in lakes where they swim. Quebecers and Ontarians are the most likely to be concerned.
39%
44%
13%
5%
Very concerned
Somewhatconcerned
Not veryconcerned
Not at allconcerned
2010
6%5%4%5%5%5%4%8%2%5%6%6%6%
13%13%11%14%11%11%17%21%11%8%15%14%22%
44%
37%
Rural
44%
39%
Urban
42%
42%
Female
46%
35%
Male
43%
40%
> 55 years old
42%
41%
35 to 55 years old
46%
33%
18 to 34 years old
45%41%46%39%47%41%
25%46%41%39%33%31%
Atlantic
Quebec
Ontario
Prairies
Alberta
British C
olumbia

37© 2009 Ipsos Reid
Quality of Lakes (cont)
27. Do you think that the quality of the water in these lakes is getting:?Base: All Respondents n = 2022
Most (68%) believe that the quality of these lakes is actually getting worse, not better (10%).
10%
68%
22%
Better
Worse
No change
2010
24%21%20%23%21%23%19%32%12%25%19%17%28%
67%
9%
Rural
69%
10%
Urban
72%
8%
Female
64%
13%
Male
64%
14%
> 55 years old
68%
8%
35 to 55 years old
73%
8%
18 to 34 years old
62%74%63%76%75%67%
6%13%12%5%7%4%
Atlantic
Quebec
Ontario
Prairies
Alberta
British C
olumbia

38© 2009 Ipsos Reid
Original Source of Tap Water
28. What is the original source of the drinking water for where you live?Base: All Respondents n = 2022
One quarter of Canadians have no idea from where the water that flows out of their taps comes. Quebecers are the most likely to admit that they don’t know.
23%
21%
15%
16%
25%
A nearby fresh-water river
A nearby fresh-water lake
One of thegreat lakes
A well
I have no idea
2010
13%28%32%16%13%23%40%21%32%22%15%21%27%
47%8%15%17%20%19%8%37%14%14%20%16%13%
3%18%13%17%18%15%12%-5%35%4%-1%
16%
22%
Rural
23%
24%
Urban
19%
21%
Female
23%
26%
Male
23%
26%
> 55 years old
21%
23%
35 to 55 years old
19%
21%
18 to 34 years old
34%15%16%42%9%40%
7%34%14%18%55%19%
Atlantic
Quebec
Ontario
Prairies
Alberta
British
Colum
bia

39© 2009 Ipsos Reid
Awareness of Water Quality on Reserves
29. Which best describes your level of awareness regarding the quality of water on First Nation reserves?Base: All Respondents n = 2022
Very few say they’re aware of the water quality on First Nation reserves, but awareness is significantly higher in the Prairies, very low in Quebec.
5%
18%
31%
46%
Very aware
Somewhataware
Not very aware
Not at allaware
2010
45%46%51%40%40%45%54%48%55%43%30%50%43%
31%30%30%32%35%29%28%28%34%31%25%27%30%
18%
5%
Rural
18%
5%
Urban
16%
3%
Female
21%
6%
Male
20%
5%
> 55 years old
21%
5%
35 to 55 years old
13%
4%
18 to 34 years old
19%9%21%33%21%21%
5%3%6%12%2%6%
Atlantic
Quebec
Ontario
Prairies
Alberta
British C
olumbia

40© 2009 Ipsos Reid
Level of Concern with Water on Reserves
30. In Canada, almost 100 aboriginal reserves must boil their water before it is safe to drink. Some reserves have been under boil-water advisories for yearsHow concerned are you about the water conditions on aboriginal reserves? Base: All Respondents n = 2022
Most Canadians (74%) are concerned with the water condition on aboriginal reserves, with four in ten (36%) being very concerned.
36%
38%
17%
10%
Very concerned
Somewhatconcerned
Not veryconcerned
Not at allconcerned
2010
11%9%8%11%8%9%12%10%9%8%12%12%11%
19%16%15%19%15%15%21%24%23%12%16%15%16%
34%
36%
Rural
39%
36%
Urban
36%
41%
Female
40%
30%
Male
39%
38%
> 55 years old
34%
41%
35 to 55 years old
42%
26%
18 to 34 years old
35%41%34%42%43%39%
31%26%47%30%30%34%
Atlantic
Quebec
Ontario
Prairies
Alberta
British C
olumbia
41© 2009 Ipsos Reid
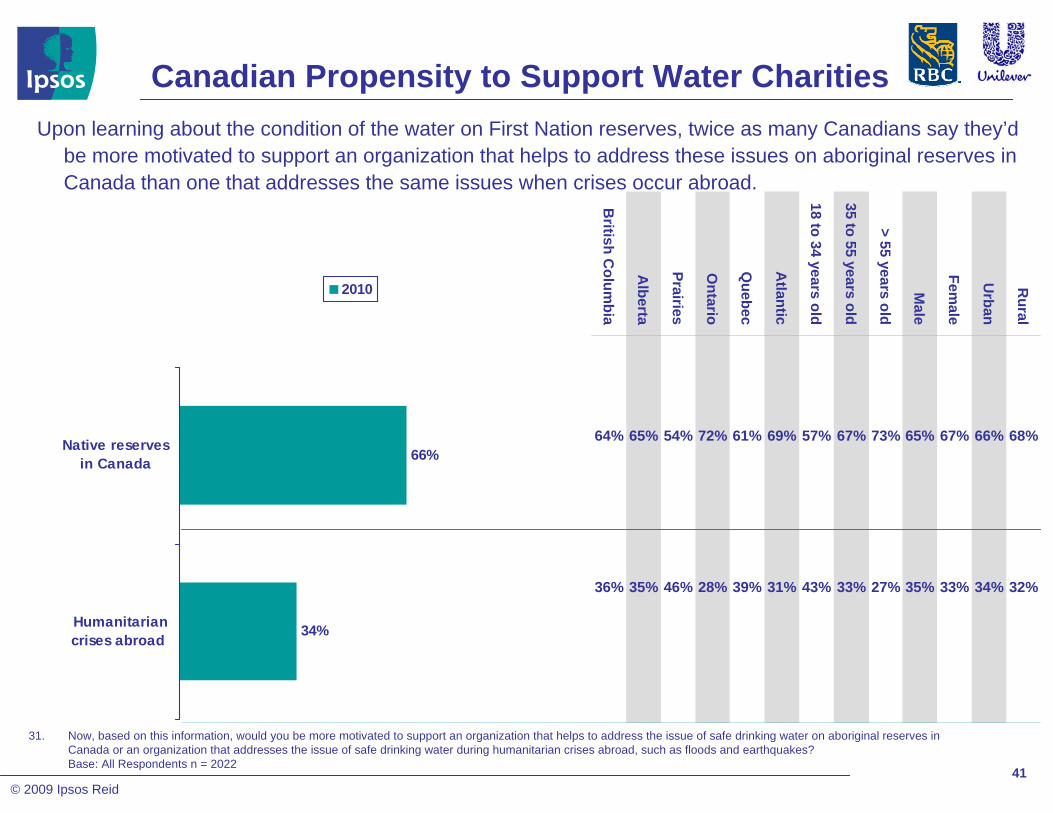
Canadian Propensity to Support Water Charities
31. Now, based on this information, would you be more motivated to support an organization that helps to address the issue of safe drinking water on aboriginal reserves in Canada or an organization that addresses the issue of safe drinking water during humanitarian crises abroad, such as floods and earthquakes?Base: All Respondents n = 2022
68%66%67%65%73%67%57%69%61%72%54%65%64%
32%
Rural
34%
Urban
33%
Female
35%
Male
27%
> 55 years old
33%
35 to 55 years old
43%
18 to 34 years old
31%39%28%46%35%36%
Atlantic
Quebec
Ontario
Prairies
Alberta
British C
olumbia
Upon learning about the condition of the water on First Nation reserves, twice as many Canadians say they’d be more motivated to support an organization that helps to address these issues on aboriginal reserves in Canada than one that addresses the same issues when crises occur abroad.
66%
34%
Native reservesin Canada
Humanitariancrises abroad
2010

42© 2009 Ipsos Reid
TOTAL
90%
10%
88%
12%
No
Yes
2010 2009
92%90%9%11%8%9%12%8%12%8%11%10%11%
8%10%91%89%92%91%88%92%88%92%89%90%89%
Rural
Urban
Female
Male
> 55 years old
35 to 55 years old
18 to 34 years old
Atlantic
Quebec
Ontario
Prairies
Alberta
British C
olumbia
Boycotts
34. Have you ever stopped doing business with a corporation because you learned that they used water in an irresponsible manner?Base: All Respondents n = 2022
One in ten Canadians have stopped doing business with a corporation because they learned that company used water irresponsibly, unchanged from last year.

43© 2009 Ipsos Reid
TOTAL
85%
15%
82%
18%
No
Yes
2010 2009
88%84%15%16%13%13%20%13%20%13%18%13%14%
12%16%85%84%87%87%80%87%80%87%82%87%86%
Rural
Urban
Female
Male
> 55 years old
35 to 55 years old
18 to 34 years old
Atlantic
Quebec
Ontario
Prairies
Alberta
British C
olumbia
Supporting Companies That Use Water Responsibly
35. And have you ever decided to do business with a corporation because you learned they used water in a responsible manner?Base: All Respondents n = 2022
Nearly two in ten say they’ve started doing business with a corporation that they learned used water responsibly, basically unchanged form last year.