Embed Size (px)
Citation preview

1 1
2016
RBC Canadian
Water Attitudes
Study
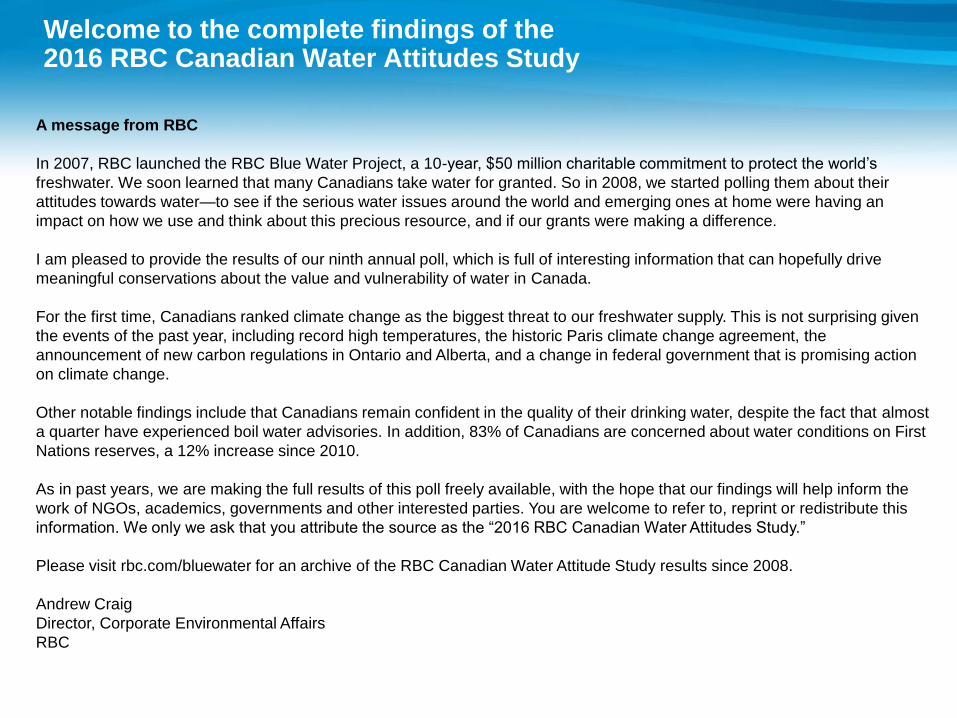
Welcome to the complete findings of the 2016 RBC Canadian Water Attitudes Study
A message from RBC
In 2007, RBC launched the RBC Blue Water Project, a 10-year, $50 million charitable commitment to protect the world’s
freshwater. We soon learned that many Canadians take water for granted. So in 2008, we started polling them about their
attitudes towards water—to see if the serious water issues around the world and emerging ones at home were having an
impact on how we use and think about this precious resource, and if our grants were making a difference.
I am pleased to provide the results of our ninth annual poll, which is full of interesting information that can hopefully drive
meaningful conservations about the value and vulnerability of water in Canada.
For the first time, Canadians ranked climate change as the biggest threat to our freshwater supply. This is not surprising given
the events of the past year, including record high temperatures, the historic Paris climate change agreement, the
announcement of new carbon regulations in Ontario and Alberta, and a change in federal government that is promising action
on climate change.
Other notable findings include that Canadians remain confident in the quality of their drinking water, despite the fact that almost
a quarter have experienced boil water advisories. In addition, 83% of Canadians are concerned about water conditions on First
Nations reserves, a 12% increase since 2010.
As in past years, we are making the full results of this poll freely available, with the hope that our findings will help inform the
work of NGOs, academics, governments and other interested parties. You are welcome to refer to, reprint or redistribute this
information. We only we ask that you attribute the source as the “2016 RBC Canadian Water Attitudes Study.”
Please visit rbc.com/bluewater for an archive of the RBC Canadian Water Attitude Study results since 2008.
Andrew Craig
Director, Corporate Environmental Affairs
RBC

Table of Contents
Key Findings.……………………………………………………………. 4
Detailed Results………………………………………………………… 7
General Context.………………………………………………….. 7
Water Quality………………………………………………………. 22
Infrastructure……………………………………………………..... 39
Extreme Weather……………………...…………………………... 51
Fun Facts.………………………………………………………….. 71
Communicating on Water.………………………………………...
Methodology……………………………………………………………..
88
93
4
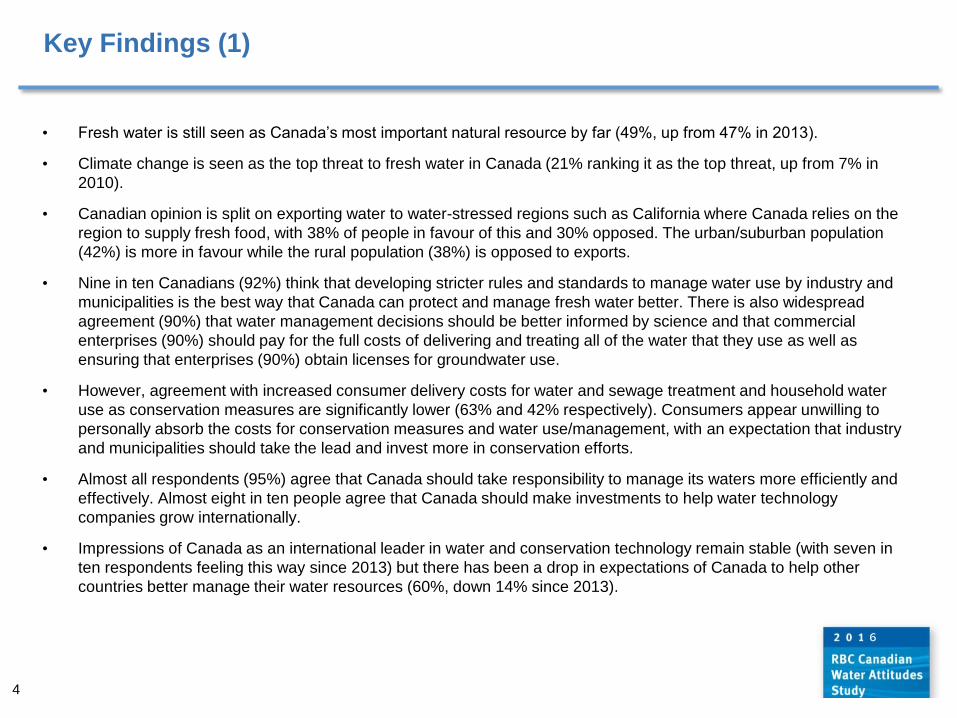
Key Findings (1)
• Fresh water is still seen as Canada’s most important natural resource by far (49%, up from 47% in 2013).
• Climate change is seen as the top threat to fresh water in Canada (21% ranking it as the top threat, up from 7% in
2010).
• Canadian opinion is split on exporting water to water-stressed regions such as California where Canada relies on the
region to supply fresh food, with 38% of people in favour of this and 30% opposed. The urban/suburban population
(42%) is more in favour while the rural population (38%) is opposed to exports.
• Nine in ten Canadians (92%) think that developing stricter rules and standards to manage water use by industry and
municipalities is the best way that Canada can protect and manage fresh water better. There is also widespread
agreement (90%) that water management decisions should be better informed by science and that commercial
enterprises (90%) should pay for the full costs of delivering and treating all of the water that they use as well as
ensuring that enterprises (90%) obtain licenses for groundwater use.
• However, agreement with increased consumer delivery costs for water and sewage treatment and household water
use as conservation measures are significantly lower (63% and 42% respectively). Consumers appear unwilling to
personally absorb the costs for conservation measures and water use/management, with an expectation that industry
and municipalities should take the lead and invest more in conservation efforts.
• Almost all respondents (95%) agree that Canada should take responsibility to manage its waters more efficiently and
effectively. Almost eight in ten people agree that Canada should make investments to help water technology
companies grow internationally.
• Impressions of Canada as an international leader in water and conservation technology remain stable (with seven in
ten respondents feeling this way since 2013) but there has been a drop in expectations of Canada to help other
countries better manage their water resources (60%, down 14% since 2013).

5
Key Findings (2)
• A majority of Canadians (84%) are “very” and “somewhat” confident in the quality of the tap water in their homes.
There has been an increase in participants (four in ten) who say that they are “very confident” in the water quality,
with over eight in ten people expressing confidence nationally.
• Almost a quarter of Canadians (24%) have experienced living in an area under a boil water advisory.
• Almost half of respondents are very concerned about the water conditions on First Nations Reserves and there has
been a general overall increase in concern since 2015 which has continued upwards since 2010. Over three-quarters
of Canadians believe that we should support organizations that address the issue of safe drinking water on First
Nations reserves. There has been a continuing decline for support for organizations addressing water in the context
of humanitarian concerns abroad.
• A majority of Canadians have never heard information about pharmaceuticals or ingredients from personal care
products being found in water systems while four in ten people report hearing about these issues.
• The health of fish and other animals is the greatest concern where pharmaceuticals, ingredients from personal care
products or microbeads are found the water system. This is closely followed by the quality of drinking water. There is
also a high level of concern for personal health and that of family.
• A majority of Canadians say they would not use or purchase personal care products containing microbeads and take
their expired medications back to the pharmacy, and that they are willing to pay more for natural/organic products. An
overwhelming majority (around nine in ten) say they would not flush medications down the toilet.
• Water treatment systems to reduce pollution and facilities that maintain the quality of drinking water rank as the
highest priorities for government funding, with storm water management and infrastructure to protect against extreme
weather and flooding being the lowest priorities.
• Although there has been a slight increase in willingness to pay more tax for infrastructure improvements compared
with 2015, slightly less than a third of respondents remain neutral about the issue while a quarter disagree.

6
Key Findings (3)
• Just over half of Canadians have noticed more stories in the news about flooding and drought and there has been a
significant increase (50%, up from 28% in 2015) in respondents who have noticed more water quality stories in the
news.
• Three-quarters of Canadians do not feel that they live in an area that is vulnerable to flooding and drought.
• Nine in ten Canadians strongly agree that property sellers living in high-risk flood areas should be legally required to
fully disclose the risk when selling the property.
• In general, more Canadians claimed to have taken action to prevent water damage outside of their homes compared
to 2015, especially for landscaping such as grading (increase of 18%) and replacing paved surfaces with water-
permeable materials (increase of 16%). There are also increases in the number of people claiming that they have
installed caulking around windows (increase of 15% since 2015) and installing/repairing a sump pump (increase of
12% since 2015).
• Swimming is the most-mentioned activity that Canadians like to do which involves water, followed by spending time
on the beach and fishing. Nearly two-thirds of Canadians swim in lakes or rivers at least once per year. Two-thirds of
Canadians express concern about the quality of the water in rivers and lakes used for swimming.
• Non-governmental organizations (78%) and conservation authorities (79%) are the most trusted to provide
information about water quality and safety in Canada. Government and media are among the least trusted. Municipal
websites and information posted near the water are the most-mentioned places where Canadians look to find out
about the quality of water in beaches, lakes and rivers.
• Canadians are responsible when it comes to water use when gardening, with almost all respondents (90%) stating
that they do not water their garden during a water ban or drought.

7
General Context

8
Economy, healthcare and unemployment are top issues facing Canada
Three Most Important Issues Facing Canada, Total Mentions, 2016
Base: All respondents 2016 n=2,194
Q. What do you think are the three most important issues facing Canada?
51
43
36
29
25
22
19
16
16
15
10
5
3
4
The economy
Healthcare
Unemployment
Cost of food
The environment
Cost/availability of housing
Poverty
Education
Climate Change
Energy prices
Crime / public safety
Water quality and/or availability
Public transportation
Other
Water quality is a higher concern for those
who say they live in rural communities
(7%) versus those who say they live in
urban/suburban communities.

9 9
Most Important Issues Facing Canada, Total Mentions, Demographics, 2016
Base: All respondents 2016 n=2,194
Q. (modified in 2016) What do you think are the three most important issues facing Canada?
British
Colu
mbia
Alb
ert
a
Pra
irie
s
Onta
rio
Quebec
Atlantic
Vancouver
Calg
ary
Win
nip
eg
Toro
nto
Montr
eal
Halif
ax
18-3
4
years
35-5
5
years
>55 y
ears
Male
Fem
ale
Urb
an
(>100,0
00)
Mid
-siz
e
tow
ns/c
itie
s
Rura
l (<
1,0
00)
The environment 35 18 23 24 22 29 35 18 28 23 24 29 33 21 21 26 23 25 24 24
Unemployment 28 63 30 36 29 38 28 62 28 39 33 40 41 37 32 35 38 37 35 36
The cost and/or availability of housing 42 16 19 26 12 14 49 19 18 36 16 15 27 22 18 17 27 28 16 11
Crime and public safety 12 12 18 9 8 12 12 11 20 9 9 12 8 11 11 10 10 11 9 8
Education 11 15 17 12 24 20 12 15 15 12 26 26 21 17 11 16 17 16 18 13
The economy 47 68 56 49 48 46 47 69 56 52 47 49 48 50 54 56 46 54 51 42
Healthcare 34 27 51 42 56 41 32 28 47 36 54 40 29 46 53 41 46 39 50 50
Energy prices 9 20 7 21 10 12 8 19 4 14 10 14 12 18 16 18 13 12 17 23
Public transportation 3 2 2 5 2 2 4 3 2 9 3 4 4 3 3 4 3 4 4 1
Water quality and/or availability 5 4 6 6 5 4 2 4 5 5 5 3 6 5 4 6 4 4 4 9
Poverty 19 11 15 18 28 20 18 9 21 17 25 18 21 19 18 19 20 19 20 20
The cost of food 28 26 32 29 30 34 22 26 30 26 24 27 23 32 32 26 32 25 31 40
Climate change 19 14 16 16 15 18 20 12 20 17 19 15 22 12 16 16 16 17 15 14
Other 4 3 5 3 4 5 4 3 6 2 3 6 2 4 5 5 2 4 4 2
DK/NA 1 0 0 0 1 1 1 0 0 0 0 0 0 0 1 0 0 0 0 1
REGION CITY AGE GENDERCOMMUNITY
SIZE

10
Healthcare remains top concern, but poverty in Canada is viewed as a higher concern than quality of water in lakes, rivers and streams
Degree of Concern for Issues Facing Canada, “Very Concerned,” 2008–2016
Base: All respondents 2016 n=2,194; 2015 n=2,242; 2014 n=2,074; 2013 n=2,282; 2012 n=2,428; 2011 n=2066;
2010 n=2,022; 2009 n=2,165; 2008 n=2,309
*Modified in 2016 from “the long-term quality of drinking water in communities” to “the long-term quality of drinking
water”
**New in 2016, “poverty and its implications”
Q. (modified in 2016) Below is a list of issues facing Canada that you might be concerned about. For each, please
indicate the degree to which you are concerned or not concerned.
53
50 50 52
36
30
33 32
28
35
27 26
29 30
27
30
26 28
28
24 25
23
29
23 22
31
20
30
40
50
60
70 The availability of adequate health care
The quality of water in lakes, rivers andstreams
Global poverty and its implications
Public education system
The long-term supply of fresh water
Stability of the financial markets
Extreme weather causing droughts orflooding
The long-term quality of drinking water*
Poverty and its implications**
Concern for many of these issues has remained relatively stable, but concern for the long-term quality of
drinking water, and financial stability of markets has slightly increased.

11 11
REGION CITY AGE GENDER COMMUNITY
SIZE
British
Colu
mbia
Alb
ert
a
Pra
irie
s
On
tario
Qu
eb
ec
Atla
ntic
Va
nco
uve
r
Ca
lga
ry
Win
nip
eg
To
ron
to
Mo
ntr
ea
l
Ha
lifa
x
18
to
34
ye
ars
35
to
55
ye
ars
>5
5 y
ea
rs
Ma
le
Fe
ma
le
Urb
an
(>1
00
00
0)
Mid
-siz
e
tow
ns/c
itie
s
Ru
ral (<
10
00
)
Availability of adequate
health care 89 84 85 90 92 91 88 83 82 92 92 91 86 90 92 88 91 89 90 91
Public education systems 73 67 73 73 74 74 76 62 74 75 76 78 79 73 67 70 76 73 73 70
Long-term supply of fresh
water 72 70 74 75 70 77 72 69 73 76 67 75 77 74 68 67 79 72 73 76
Poverty and its implications 82 85 87 83 87 86 80 84 88 84 88 81 88 84 82 80 89 85 85 84
Stability of the financial
markets 77 90 79 80 62 70 81 91 76 84 64 71 82 73 73 71 81 78 74 71
Quality of water in lakes,
rivers and streams 81 68 82 83 78 79 76 65 81 84 77 75 80 76 83 77 82 79 80 82
Extreme weather causing
droughts or flooding 65 60 64 66 64 60 60 60 67 70 65 62 65 64 63 58 70 63 66 64
Long-term quality of
drinking water 76 63 72 77 75 76 74 61 68 80 76 74 75 74 74 71 78 74 74 77
Base: All respondents 2016 n=2,194
Q. (modified in 2016) Below is a list of issues facing Canada that you might be concerned about. For each,
please indicate the degree to which you are concerned or not concerned.
Degree of Concern for Various National Issues
“Very Concerned” and “Somewhat Concerned,” Demographics, 2016

12
Canadians continue to consider fresh water to be Canada’s most important natural resource
*Modified from “oil” in 2013 to “oil & gas” in 2016
Base: All respondents 2016 n=2,194, 2013 n=2282; 2012 n=2428; 2011 n=2066; 2010 n=2022; 2009 n=2165
Q. Which of the following do you consider to be Canada’s most important natural resource?
Canada’s Most Important Natural Resource, 2009–2016
49
47 49
24
15
20
12
12
11
16
15
3
1 0
10
20
30
40
50
60
2009 2010 2011 2012 2013 2016
Fresh water
Oil & gas*
Forests
Agricultural land
Base metals
Fisheries
↑ 2013–2016

13 13
Base: All respondents 2016 n=2,194
Q. Which of the following do you consider to be Canada’s most important natural resource? Please select only
one.
Canada’s Most Important Natural Resource, Demographics, 2016
British
Colu
mbia
Alb
ert
a
Pra
irie
s
Onta
rio
Quebec
Atlantic
Vancouver
Calg
ary
Win
nip
eg
Toro
nto
Montr
eal
Halif
ax
18-3
4
years
35-5
5
years
>55 y
ears
Male
Fem
ale
Urb
an
(>100,0
00)
Mid
-siz
e
tow
ns/c
itie
s
Rura
l (<
1,0
00)
Fresh water 46 29 53 50 59 47 43 28 62 49 56 48 47 50 50 52 46 50 49 48
Oil & gas 18 52 15 18 11 16 22 55 11 21 14 19 22 20 18 19 21 23 17 13
Forests 20 5 9 10 16 14 23 6 10 9 13 14 15 13 9 12 12 12 13 13
Coal 0 0 0 1 0 0 0 0 0 2 1 0 1 1 0 0 1 1 0 1
Agricultural land / farm land 13 12 21 17 10 14 10 9 15 13 12 15 11 13 19 12 17 12 17 21
Base metals (e.g., copper, nickel) 1 0 1 2 2 0 2 0 0 4 3 0 3 2 1 2 1 2 3 1
Fisheries 0 0 1 1 1 8 0 0 1 1 1 4 1 2 1 1 1 1 2 2
DK/NA 1 1 1 1 0 0 1 2 1 0 0 0 1 0 1 1 0 1 0 1
REGION CITY AGE GENDERCOMMUNITY
SIZE

14
Climate change and illegal dumping of toxins are perceived as the biggest threats to fresh water supplies
Biggest Threats to Canada’s Fresh Water Supply, Top Mentions, 2016
Base, All respondents n=2,194
Q. (new in 2016) What do you think are the biggest threats to Canada’s fresh water supply?
33
31
26
20
19
18
17
15
14
10
7
6
Global warming and climate change
Illegal dumping of toxins
Run-off of pollutants from land to water
Wasteful use by industrial companies
Mass exports of water to the United States
Mismanagement of water by municipal, provincial andfederal governments
Wasteful use by individual consumers
The legal release of toxins
Inadequate infrastructure (leaking pipes etc.)
Lack of knowledge about Canada’s fresh water
Oil sands in Alberta
Wasteful use by agriculture

15 15
One in five Canadians now say climate change is the top threat to fresh water compared to 2010 when it was considered a lower threat
21
11
8
8
6
5
5
4
3
3
3
2
Global warming and climate change
Illegal dumping of toxins
Run-off of pollutants
Mass exports of water to the UnitedStates
Wasteful use by industrial companies
Mismanagement by municipal,provincial & federal governments
Wasteful use by individual consumers
Inadequate infrastructure (leakingpipes, etc.)
The legal release of toxins
Lack of knowledge about Canada’s fresh water
Oil sands in Alberta
Wasteful use by agriculture
2016
Biggest Threats to Canada’s Fresh Water Supply, Rank 1, 2010–2016
Base: All respondents 2016 n=2,194, 2010 n=2,022
Q. (modified in 2016) What do you think are the biggest threats to Canada’s fresh water supply?
.
16
15
13
11
10
10
7
7
4
3
1
Run-off of pollutants from land towater
Mass exports of water to the UnitedStates
Mismanagement by municipal,provincial & federal governments
Wasteful use by individual consumers
Illegal dumping of toxins
Lack of knowledge about Canada’s fresh water
Global warming and climate change
Wasteful use by industrial companies
The legal release of toxins
Inadequate infrastructure (leakingpipes, etc.)
Wasteful use by agriculture
2010

16 16 Base: All respondents 2016 n=2,194
Q. (modified in 2016) What do you think are the biggest threats to Canada’s fresh water supply?
Biggest Threats to Canada’s Water Supply, Total Mentions
Demographics, 2016
British
Colu
mbia
Alb
ert
a
Pra
irie
s
Onta
rio
Quebec
Atlantic
Vancouver
Calg
ary
Win
nip
eg
Toro
nto
Montr
eal
Halif
ax
18-3
4
years
35-5
5
years
>55 y
ears
Male
Fem
ale
Urb
an
(>100,0
00)
Mid
-siz
e
tow
ns/c
itie
s
Rura
l (<
1,0
00)
Global warming and climate change 42 30 28 32 34 32 44 28 29 34 34 32 40 31 29 32 34 35 33 27
Inadequate infrastructure (leaking pipes
etc.)13 14 13 13 17 16 13 15 11 12 19 15 11 15 16 15 13 15 13 12
Mass exports of water to the United
States29 21 16 20 13 19 27 18 13 15 11 19 16 17 24 19 19 18 22 20
Wasteful use by individual consumers 17 19 17 18 15 13 18 21 15 20 16 18 21 16 14 14 19 18 14 16
Wasteful use by agriculture 6 5 7 6 8 7 5 6 7 7 6 6 8 6 5 8 5 7 7 4
Wasteful use by industrial companies 21 22 17 20 18 24 20 22 16 22 18 30 25 16 20 19 21 21 23 15
Illegal dumping of toxins 28 34 37 34 24 35 27 33 36 33 21 36 32 29 33 28 35 31 28 33
The legal release of toxins 14 16 18 18 9 14 14 18 19 15 8 15 14 15 16 15 15 14 14 18
Run-off of pollutants from land to water 27 24 37 26 24 28 27 23 35 23 19 25 23 27 29 25 28 25 27 30
Mismanagement of water by municipal,
provincial and federal governments19 24 19 19 13 15 15 20 19 15 13 19 16 14 24 19 17 18 18 20
Lack of knowledge about Canada’s fresh
water11 10 17 11 5 11 11 10 15 9 6 15 11 10 10 10 10 9 11 12
Oil sands in Alberta 7 10 5 5 10 10 6 11 6 7 10 10 11 6 5 7 8 9 7 4
No rank 16 20 17 20 28 18 19 23 21 23 30 14 20 24 17 22 19 21 22 21
REGION CITY AGE GENDERCOMMUNITY
SIZE

17
4
9
7
26
33
31
21
18
19
17
9
11
Rural
Urban/suburban
Total
Stronglyfavour
Somewhatfavour
Somewhatoppose
Stronglyoppose
Canadian opinion is split on exporting water to regions experiencing shortages, with the urban/suburban population favouring this more than the rural population
Base: All respondents 2016 n=2,194
Q. (new in 2016) Canada relies on some water stressed regions such as California to supply fresh food year
round. Would you favour or oppose Canada diverting or exporting water to regions that are experiencing water
shortages?
People who say they live
in urban/suburban
communities (42%) are
more in favour of
exporting water to water-
stressed regions, while
those in rural
communities are more
opposed to exporting
water (38%).
REGION CITY AGE GENDER COMMUNITY
SIZE
British
Colu
mbia
Alb
ert
a
Pra
irie
s
On
tario
Qu
eb
ec
Atla
ntic
Vancouver
Calg
ary
Win
nip
eg
Toro
nto
Montr
eal
Ha
lifa
x
18
to
34
ye
ars
35
to
55
ye
ars
>5
5 y
ea
rs
Ma
le
Fe
ma
le
Urb
an
(>1
00
00
0)
Mid
-siz
e
tow
ns/c
itie
s
Ru
ral (<
10
00
)
“Strongly favour” +
“Somewhat favour” 42 41 42 38 35 40 45 43 41 48 42 47 49 36 32 39 38 43 33 31
The white space in this chart represents “Neither favour nor oppose” and “DK/NA.”
Favourability toward Exporting Water, 2016

18
9
17
40
40
48
48
47
33
46
48
50
42
42
45
42
63
88
90
90
90
92
We should charge more for household water use to encourageconservation
Water costs for consumers should include the full costs ofwater delivery, sewage and treatment
We should require industry and municipalities to monitor andreport all water use
Water management decisions should be better informed byscience
Commercial enterprises should have to obtain licenses forgroundwater use
Commercial enterprises should pay for the full costs ofdelivering and treating all of the water they use
We should develop stricter rules and standards to managewater use by industry and municipalities
Strongly Agree Somewhat agree
Nine in ten Canadians think that developing stricter rules and standards to manage fresh water use by industry is the best method of protection
How Canada could Protect and Manage Fresh Water Better,
“Strongly agree” and “Somewhat agree,” 2016
Base: All respondents 2016 n=2,194
Q. The following are ideas for how Canada could protect and manage fresh water better. Please indicate
whether you agree or disagree with each of the following ideas:

19 19
Base: All respondents 2016 n=2,194
Q. The following are ideas for how Canada could protect and manage fresh water better. Please indicate
whether you agree or disagree with each of the following ideas:
British
Colu
mbia
Alb
ert
a
Pra
irie
s
Onta
rio
Quebec
Atlantic
Vancouver
Calg
ary
Win
nip
eg
Toro
nto
Montr
eal
Halif
ax
18-3
4
years
35-5
5
years
>55 y
ears
Male
Fem
ale
Urb
an
(>100,0
00)
Mid
-siz
e
tow
ns/c
itie
s
Rura
l (<
1,0
00)
We should require industry and
municipalities to monitor and report all
water use
91 87 85 88 90 86 91 84 85 87 89 85 85 89 90 88 89 88 87 90
Commercial enterprises should have to
obtain licenses for groundwater use92 85 89 90 90 90 92 84 90 93 86 90 90 88 92 90 90 91 90 86
We should develop stricter rules and
standards to manage water use by
industry and municipalities
95 88 88 93 91 91 93 87 88 92 93 87 89 91 95 92 92 92 91 93
Water management decisions should be
better informed by science89 85 90 91 88 88 88 86 94 94 88 87 90 89 89 91 88 90 87 88
We should charge more for household
water use to encourage conservation50 42 43 40 43 45 54 44 44 42 45 42 43 44 40 46 39 43 44 39
Commercial enterprises should pay for
the full costs of delivering and treating all
of the water they use
93 86 90 90 88 92 93 85 89 89 86 89 87 88 93 90 89 89 91 89
Water costs for consumers should
include the full costs of water delivery,
sewage and treatment
68 67 60 61 63 68 70 70 59 61 59 59 60 66 63 65 61 63 66 62
COMMUNITY
SIZEGENDERAGECITYREGION
Methods of Protecting and Managing Fresh Water, Demographics, 2016

20
Almost all respondents agree that Canada should take responsibility to manage its waters more efficiently and effectively Extent of Agreement with Canada’s Roles and Responsibilities toward Water,
“Strongly Agree” and “Somewhat Agree,” 2013–2016
Base: All respondents 2016 n=2,194, 2013 n=2,282
Q. To what extent do you agree or disagree with each of the following statements?
74
68
60
71
65
74
Canada is aninternational leader in
supplying the besttechnology for urbanwater management
Canada is aninternational leader in
water conservationtechnology and
techniques
Canada has aresponsibility to helpother countries bettermanage their water
resources
2016
2013
95
78
Canada has aresponsibility manage its
own waters moreefficiently and effectively
Canada should makeinvestments to helpwater technologycompanies growinternationally
Almost all respondents (95%) agree that
Canada should take responsibility to manage its
waters more efficiently and effectively. There is a
drop in expectations of Canada to help other
countries better manage their water resources
(decrease of 14% since 2013).

21 21 Base: All respondents 2016 n=2,194
Q. To what extent do you agree or disagree with each of the following statements?
Canada’s Leadership in Water Management, Demographics, 2016
British
Colu
mbia
Alb
ert
a
Pra
irie
s
Onta
rio
Quebec
Atlantic
Vancouver
Calg
ary
Win
nip
eg
Toro
nto
Montr
eal
Halif
ax
18-3
4
years
35-5
5
years
>55 y
ears
Male
Fem
ale
Urb
an
(>100,0
00)
Mid
-siz
e
tow
ns/c
itie
s
Rura
l (<
1,0
00)
Canada has a responsibility to help other
countries better manage their water
resources
60 50 59 60 61 66 64 46 61 65 63 69 58 60 61 61 58 61 57 58
Canada is an international leader in
supplying the best technology for urban
water management
71 72 73 74 77 74 72 69 73 77 80 73 73 76 73 72 75 76 70 72
Canada is an international leader in
water conservation technology and
techniques
62 66 69 68 74 65 63 66 70 72 74 65 68 70 67 66 70 69 68 67
Canada should make investments to
help water technology companies grow
internationally
79 78 77 80 76 77 80 76 78 86 78 81 80 78 77 78 78 81 75 73
Canada has a responsibility manage its
own waters more efficiently and
effectively
96 93 93 96 95 94 96 92 94 97 96 94 92 95 97 95 95 96 95 94
REGION CITY AGE GENDERCOMMUNITY
SIZE

22
Water Quality
23
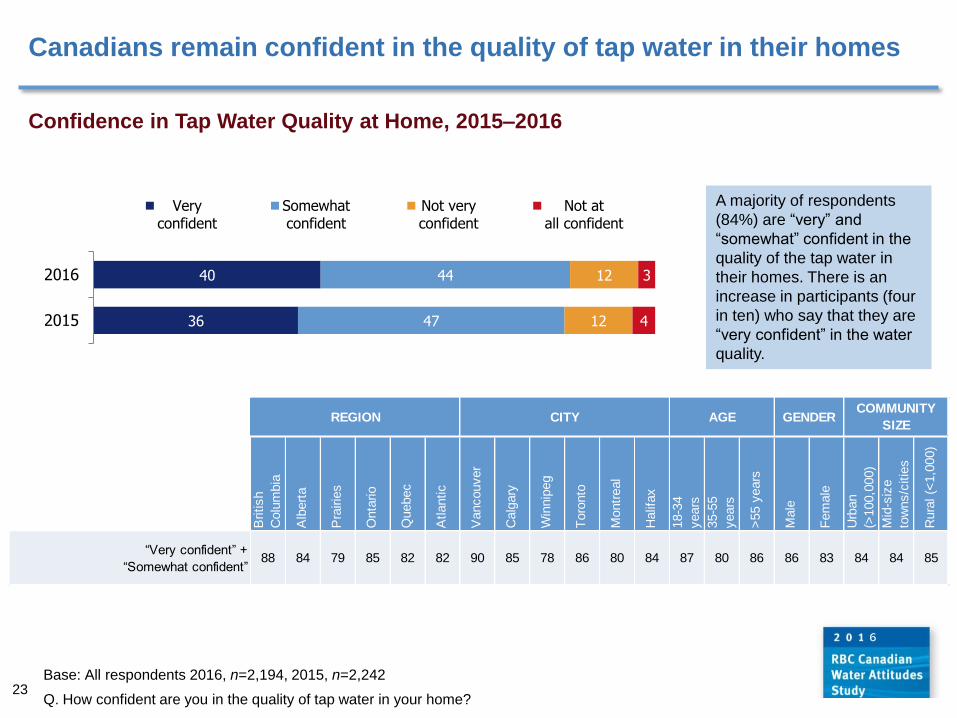
Canadians remain confident in the quality of tap water in their homes
Base: All respondents 2016, n=2,194, 2015, n=2,242
Q. How confident are you in the quality of tap water in your home?
36
40
47
44
12
12
4
3
2015
2016
Veryconfident
Somewhatconfident
Not veryconfident
Not atall confident
A majority of respondents
(84%) are “very” and
“somewhat” confident in the
quality of the tap water in
their homes. There is an
increase in participants (four
in ten) who say that they are
“very confident” in the water
quality.
Confidence in Tap Water Quality at Home, 2015–2016
British
Colu
mbia
Alb
ert
a
Pra
irie
s
Onta
rio
Quebec
Atlantic
Vancouver
Calg
ary
Win
nip
eg
Toro
nto
Montr
eal
Halif
ax
18-3
4
years
35-5
5
years
>55 y
ears
Male
Fem
ale
Urb
an
(>100,0
00)
Mid
-siz
e
tow
ns/c
itie
s
Rura
l (<
1,0
00)
“Very confident” +
“Somewhat confident”88 84 79 85 82 82 90 85 78 86 80 84 87 80 86 86 83 84 84 85
REGION CITY AGE GENDERCOMMUNITY
SIZE

24
Canadians mostly cite a distrust of the system and bad smell or taste as reasons for a lack of confidence in tap water; older buildings and infrastructure are less of an issue
Reasons for Lack of Confidence in Tap Water Quality at Home, Unprompted, 2016
Base: 2016 n=344
Q. Why do you say you are “not very” or “not at all” confident about the quality of tap water in your home? -
Coded
19
17
14
12
9
9
3
11
6
Distrust of system
Bad smell or taste, high iron
Contaminants/pollutants (lead, arsenic, bacteria, etc.)
Additives (chlorine, fluoride)
Poor quality (cloudy, particulate)
Well water
Old building/infrastructure
Other
DK/NA

25
Three-quarters of Canadians report that tap water is their most typical source of drinking water
Typical Source of Drinking Water at Home, 2016
Base: All respondents 2016 n=2,194
Q. In your home, what is the source of water you typically drink?
Tap water 44
Filtered tap water
25
Water from a large jug-
cooler 8
Individually sized bottled
water 11
Filtered water through my refrigerator
7
Other source 5 Over seven in ten Canadians
report tap water as the
typical source of drinking
water in their homes

26 26 Base: All respondents 2016 n=2,194
Q. In your home, what is the source of water you typically drink?
Typical Source of Drinking Water at Home, Demographics, 2016
British
Colu
mbia
Alb
ert
a
Pra
irie
s
Onta
rio
Quebec
Atlantic
Vancouver
Calg
ary
Win
nip
eg
Toro
nto
Montr
eal
Halif
ax
18-3
4
years
35-5
5
years
>55 y
ears
Male
Fem
ale
Urb
an
(>100,0
00)
Mid
-siz
e
tow
ns/c
itie
s
Rura
l (<
1,0
00)
Tap water (directly from the tap) 52 45 39 35 54 45 54 43 36 38 47 43 45 41 45 47 41 45 46 37
Filtered tap water (from the tap, but
through another filtering system)25 28 33 28 14 29 27 31 33 32 16 35 26 24 24 22 28 28 19 21
Individually-sized bottled water 4 5 7 15 13 10 5 7 7 14 14 10 11 13 10 10 12 10 10 15
Water from a large-jug cooler purchased
from a vendor8 10 14 7 9 8 6 8 13 4 14 8 7 9 8 9 8 7 11 10
Filtered water through my refrigerator 7 9 5 8 5 4 6 9 7 9 6 2 8 8 4 7 7 7 8 5
Some other source (please specify) 4 3 2 7 5 4 1 1 1 3 3 2 2 4 9 6 5 2 6 12
REGION CITY AGE GENDERCOMMUNITY
SIZE

27
Almost a quarter of Canadians have experienced living in an area under a boil water advisory
Experience of Living under a Boil Water Advisory, All Respondents, 2016
Base: All respondents 2016 n=2,194
Q. (new in 2016) Have you ever experienced living in an area under a boil water advisory in Canada?
Yes 24
No 72
Don't know 4
British
Colu
mbia
Alb
ert
a
Pra
irie
s
Onta
rio
Quebec
Atlantic
Vancouver
Calg
ary
Win
nip
eg
Toro
nto
Montr
eal
Halif
ax
18-3
4
years
35-5
5
years
>55 y
ears
Male
Fem
ale
Urb
an
(>100,0
00)
Mid
-siz
e
tow
ns/c
itie
s
Rura
l (<
1,0
00)
Yes 30 23 40 15 33 26 22 23 41 10 35 25 19 28 23 24 24 22 24 29
No 64 74 57 82 61 70 73 74 55 86 58 72 74 69 73 73 71 73 72 68
Don't know 6 3 3 3 5 4 5 4 5 5 7 3 7 3 4 3 5 5 4 3
REGION CITY AGE GENDERCOMMUNITY
SIZE
The highest rate of living under a boil water
advisory is for the Prairies, where four in ten
respondents (40%) have experienced this.

28
Almost half of all respondents are very concerned about water conditions on First Nations reserves
Base: All respondents 2016 n=2,194; 2012 n=2428; 2011 n=2066; 2010 n=2022
Q. (modified in 2016) In Canada, people on more than 100 First Nations reserves must boil their water before
it is safe to drink. Some reserves have been under boil water advisories for years. How concerned are you
about the water conditions on First Nations reserves?
Concern about Water Conditions on First Nations Reserves, 2010–2016
36
31
37
45
38
41
39
38
17
17
15
11
10
11
9
6
2010
2011
2012
2016
Veryconcerned
Somewhatconcerned
Not veryconcerned
Not at allconcerned

29 29
Base: All respondents 2016 n=2,194
Q. (modified in 2016) In Canada, people on more than 100 First Nations reserves must boil their water before
it is safe to drink. Some reserves have been under boil water advisories for years. How concerned are you
about the water conditions on First Nations reserves?
Concern about Water Conditions on First Nations Reserves
“Very Concerned” and “Somewhat Concerned,” Demographics, 2016
British
Colu
mbia
Alb
ert
a
Pra
irie
s
Onta
rio
Quebec
Atlantic
Vancouver
Calg
ary
Win
nip
eg
Toro
nto
Montr
eal
Halif
ax
18-3
4
years
35-5
5
years
>55 y
ears
Male
Fem
ale
Urb
an
(>100,0
00)
Mid
-siz
e
tow
ns/c
itie
s
Rura
l (<
1,0
00)
"Very concerned" + "Somewhat
concerned"84 79 81 85 78 84 82 81 84 87 80 84 84 79 85 78 87 83 81 81
REGION CITY AGE GENDERCOMMUNITY
SIZE
How concerned are you about the water conditions on First Nations reserves?

30
Almost eight in ten Canadians believe that we should support organizations that address the issue of safe drinking water on First Nations reserves
Preferred Focus of Support for Safe Drinking Water Programs, 2010–2016
Base: All respondents 2016 n=2,194
Q. (modified in 2016) Now, based on this information, would you be more motivated to support an
organization that helps to address the issue of safe drinking water on First Nations reserves in Canada or an
organization that addresses the issue of safe drinking water during humanitarian crises abroad, such as floods
and earthquakes?
Almost half of respondents are “very concerned” about water conditions on First Nations reserves. There is a continued
decline for support for organizations addressing water in the context of humanitarian concerns abroad.
66
67
71
78
34
33
28
22
2010
2011
2012
2016
First Nations reserves in Canada Humanitarian crises abroad

31 31
Base: All respondents 2016 n=2,194
Q. (modified in 2016) Now, based on this information, would you be more motivated to support an
organization that helps to address the issue of safe drinking water on First Nations reserves in Canada or an
organization that addresses the issue of safe drinking water during humanitarian crises abroad, such as floods
and earthquakes?
Preferred Focus of Support for Safe Drinking Water Programs,
Demographics, 2016
British
Colu
mbia
Alb
ert
a
Pra
irie
s
Onta
rio
Quebec
Atlantic
Vancouver
Calg
ary
Win
nip
eg
Toro
nto
Montr
eal
Halif
ax
18-3
4
years
35-5
5
years
>55 y
ears
Male
Fem
ale
Urb
an
(>100,0
00)
Mid
-siz
e
tow
ns/c
itie
s
Rura
l (<
1,0
00)
First Nations reserves in Canada 71 78 73 81 78 75 68 78 73 77 77 74 71 77 85 77 79 76 73 88
Humanitarian crises abroad 29 21 25 19 22 23 32 20 24 23 23 25 29 22 14 22 21 23 26 12
Would you be more motivated to support an organization that helps to address the issue of safe drinking water on First Nations reserves in Canada or addresses
REGION CITY AGE GENDERCOMMUNITY
SIZE

32
A majority of Canadians have never heard information about pharmaceuticals or ingredients from personal care products being found in water systems
Awareness of Pharmaceuticals and Product Ingredients in Water Systems, 2016
Base: All respondents 2016 n=2,194
Q. (new in 2016) Have you heard or seen any information or news about pharmaceuticals such as
antidepressants, antibiotics, pain killers and birth control being found in water systems in Canada and around
the world?
Q. (new in 2016) Have you heard or seen any information or news about ingredients in personal care products
such as shampoos, toothpastes, makeup and soaps being found in water systems in Canada and around the
world?
Yes 44
No 55
Don't know
1
Yes 39
No 59
Don't know 2
Have you heard information
about pharmaceuticals being
found in water systems?
Have you heard or seen any
information or news about ingredients
in personal care products being found
in water systems?

33 33
Base: All respondents 2016 n=2,194
Q. (new in 2016) Have you heard or seen any information or news about pharmaceuticals such as
antidepressants, antibiotics, pain killers and birth control being found in water systems in Canada and around
the world?
Q. (new in 2016) Have you heard or seen any information or news about ingredients in personal care
products such as shampoos, toothpastes, makeup and soaps being found in water systems in Canada and
around the world?
Awareness of Pharmaceuticals and Personal Care Products Being Found
In Water Systems,” Demographics, 2016
British
Colu
mbia
Alb
ert
a
Pra
irie
s
Onta
rio
Quebec
Atlantic
Vancouver
Calg
ary
Win
nip
eg
Toro
nto
Montr
eal
Halif
ax
18-3
4
years
35-5
5
years
>55 y
ears
Male
Fem
ale
Urb
an
(>100,0
00)
Mid
-siz
e
tow
ns/c
itie
s
Rura
l (<
1,0
00)
Have you heard or seen any
information or news about
pharmaceuticals such as
antidepressants, antibiotics, pain
killers and birth control being found in
water systems in Canada and around
the world?
44 43 40 46 44 44 42 40 37 45 46 44 36 43 54 47 42 43 49 43
Have you heard or seen any
information or news about ingredients
in personal care products such as
shampoos, toothpastes, makeup and
soaps being found in water systems
in Canada and around the world?
43 38 37 40 39 36 41 36 37 40 41 39 40 35 45 40 39 39 42 39
REGION CITY AGE GENDERCOMMUNITY
SIZE

34
51
52
55
48
50
52
52
54
58
35
37
36
36
36
37
33
33
32
11
9
6
12
11
8
11
10
7
2
2
2
3
2
2
3
2
2
1
0
1
1
1
1
1
1
1
Your health and your family’s health
Drinking water quality
The health of fish and other animals
Your health and your family’s health
Drinking water quality
The health of fish and other animals
Your health and your family’s health
Drinking water quality
The health of fish and other animals
Veryconcerned
Somewhatconcerned
Not veryconcerned
Not at allconcerned
DK/NA
Health of fish and other animals is the most important concern
Concern for Pharmaceuticals, Ingredients and Products found in Water Bodies, 2016
Base: All respondents 2016 n=2,194
Q. (new in 2016) How concerned, if at all, are you that pharmaceuticals found in water bodies might be adversely
affecting […]?
Q. (new in 2016) How concerned, if at all, are you that ingredients from personal care products found in water
bodies might be adversely affecting […]?
Q. (new in 2016) How concerned, if at all, are you that these products containing microbeads might be adversely
affecting […]?
Pharmaceuticals
Ingredients from
personal care
Microbeads

35 35
Base: All respondents 2016 n=2,194
Q. (new in 2016) How concerned, if at all, are you that pharmaceuticals found in water bodies might be adversely
affecting…
Q. (new in 2016) How concerned, if at all, are you that ingredients from personal care products found in water
bodies might be adversely affecting…
Degree of Concern that Pharmaceuticals and Personal Care Products
Being Found In Canadian Water System
“Very Concerned” and “Somewhat Concerned,” Demographics, 2016
Pharmaceuticals British
Colu
mbia
Alb
ert
a
Pra
irie
s
Onta
rio
Quebec
Atlantic
Vancouver
Calg
ary
Win
nip
eg
Toro
nto
Montr
eal
Halif
ax
18-3
4
years
35-5
5
years
>55 y
ears
Male
Fem
ale
Urb
an
(>100,0
00)
Mid
-siz
e
tow
ns/c
itie
s
Rura
l (<
1,0
00)
Your health and your family’s health 86 81 81 87 86 85 85 83 82 87 87 86 85 87 85 82 89 86 87 83
The health of fish and other animals 92 89 89 93 89 88 90 88 89 91 89 89 89 91 92 87 94 90 93 91
Drinking water quality 85 83 84 91 90 87 82 82 84 89 90 87 86 88 90 85 91 87 92 89
Personal care products
Your health and your family’s health 82 79 84 85 86 85 81 80 83 88 87 83 83 85 84 81 88 85 85 82
The health of fish and other animals 90 85 89 90 87 88 89 84 89 89 86 86 88 88 89 85 92 89 88 88
Drinking water quality 81 79 82 88 89 86 78 81 83 88 89 84 84 85 88 83 89 85 88 85
REGION CITY AGE GENDERCOMMUNITY
SIZE

36 36
Base: All respondents 2016 n=2,194
Q. (new in 2016) Some personal care products being sold in stores contain something called “microbeads.” These
are tiny plastic beads that can pass through waste water treatment facilities and enter lakes, rivers and streams.
How concerned, if at all, are you that these products containing microbeads might be adversely affecting…
Degree of Concern that Microbeads Can Enter the Water System
“Very Concerned” and “Somewhat Concerned,” Demographics, 2016
British
Colu
mbia
Alb
ert
a
Pra
irie
s
Onta
rio
Quebec
Atlantic
Vancouver
Calg
ary
Win
nip
eg
Toro
nto
Montr
eal
Halif
ax
18-3
4
years
35-5
5
years
>55 y
ears
Male
Fem
ale
Urb
an
(>100,0
00)
Mid
-siz
e
tow
ns/c
itie
s
Rura
l (<
1,0
00)
Micro-beads
Your health and your family’s health 86 83 84 88 83 83 85 82 84 90 85 83 84 86 88 82 89 86 86 84
The health of fish and other animals 90 86 88 93 87 88 89 85 87 92 87 88 89 89 92 87 92 89 90 91
Drinking water quality 86 84 83 89 86 86 83 83 84 88 86 86 86 86 89 85 89 88 86 85
REGION CITY AGE GENDERCOMMUNITY
SIZE

37
A majority say that they would not use or purchase personal care products containing microbeads; almost 9 in 10 do not flush medications down the toilet
Behaviours toward Product Use, 2016
Base: All respondents 2016 n=2,194
Q. (new in 2016) To what extent do you agree or disagree with the following statements?
3
20
44
41
8
42
24
41
11
25
18
15
77
12
13
3
1
1
1
I sometimes flush medications down the toilet
I would be willing to pay more for personal care productsthat are labelled as natural and/or organic
I take expired and unused medications back topharmacies for disposal
I would not use or purchase personal care productscontaining microbeads because of the effects on the
environment
Stronglyagree
Somewhatagree
Somewhatdisagree
Stronglydisagree
Don'tknow

38 38
Base: All respondents 2016 n=2,194
Q. (new in 2016) To what extent do you agree or disagree with the following statements?
Behaviours toward Product Use
“Strongly Agree” and “Somewhat Agree,” Demographics, 2016
British
Colu
mbia
Alb
ert
a
Pra
irie
s
Onta
rio
Quebec
Atlantic
Vancouver
Calg
ary
Win
nip
eg
Toro
nto
Montr
eal
Halif
ax
18-3
4
years
35-5
5
years
>55 y
ears
Male
Fem
ale
Urb
an
(>100,0
00)
Mid
-siz
e
tow
ns/c
itie
s
Rura
l (<
1,0
00)
I would be willing to pay more for
personal care products that are labelled
as natural and/or organic
61 60 57 63 64 59 62 62 59 69 68 61 71 59 58 59 65 65 61 54
I sometimes flush medications down the
toilet12 7 13 10 10 11 16 9 12 16 13 15 14 13 4 12 8 11 9 9
I take expired and unused medications
back to pharmacies for disposal 66 68 59 67 75 70 62 65 62 62 72 69 55 70 79 69 69 66 72 73
I would not use or purchase personal
care products containing microbeads
because of the effects on the
environment.
80 77 74 85 82 76 79 77 73 84 84 73 79 80 86 79 84 81 79 84
REGION CITY AGE GENDERCOMMUNITY
SIZE

39
Infrastructure

40
Hospitals are highest priority, followed by water infrastructure
Highest Priorities for Government Funding, 2016
Base: All respondents 2016 n=2,194
Q. (new in 2016) Which one, if any, of the following infrastructure areas should be the highest priority for
government funding?
41
14
14
12
8
3
Hospitals
Water infrastructure
Transportation infrastructure
Schools
Urban/suburban public transit
Communications infrastructure
Hospitals are the highest
priority for infrastructure
funding. This is similar to past
findings.

41
Water infrastructure is a higher priority for government funding for people living in urban areas compared to rural
Priority Infrastructure Areas for Government Funding, Urban vs Rural Communities,
2016
Base: All respondents 2016, Urban n=1,713, Rural n=481)
Q. (new in 2016) Which one, if any, of the following infrastructure areas should be the highest priority for
government funding?
47
16
11
11
4
2
Hospitals
Transportation infrastructure
Water infrastructure
Schools
Communications infrastructure
Urban/suburban transit
The highest priority
Rural
38
16
13
13
11
2
Hospitals
Water infrastructure
Schools
Transportation infrastructure
Urban/suburban transit
Communications infrastructure
The highest priority
Urban

42
REGION CITY AGE GENDER COMMUNITY
SIZE
British
Colu
mbia
Alb
ert
a
Pra
irie
s
On
tario
Qu
eb
ec
Atla
ntic
Va
nco
uve
r
Ca
lga
ry
Win
nip
eg
To
ron
to
Mo
ntr
ea
l
Ha
lifa
x
18
to
34
ye
ars
35
to
55
ye
ars
>5
5 y
ea
rs
Ma
le
Fe
ma
le
Urb
an
(>1
00
00
0)
Mid
-siz
e
tow
ns/c
itie
s
Ru
ral (<
10
00
)
Water infrastructure such
as underground pipes and
treatment facilities
20 14 19 15 10 10 16 16 19 19 12 12 13 14 16 15 14 16 13 11
Urban and suburban public
transit 9 7 2 11 6 2 12 9 2 19 8 4 12 8 5 9 7 10 8 3
Transportation
infrastructure such as
roads and bridges
10 14 25 11 18 14 10 12 27 10 18 10 8 14 19 17 11 14 13 16
Schools 13 14 17 9 17 13 13 14 14 11 17 14 22 12 5 12 13 14 11 9
Hospitals 37 37 28 43 43 49 35 33 26 33 40 53 35 42 45 36 46 37 45 48
Communications
infrastructure such as
telephone and internet
1 1 2 4 3 2 2 2 2 4 2 1 3 3 2 4 2 2 3 5
Base: All respondents 2016 n=2,194
Q. (new in 2016) Which one, if any, of the following infrastructure areas should be the highest priority for
government funding? Please select one.
Highest Priority Infrastructure Area for Government Funding,
Demographics, 2016

43
Water treatment systems to reduce pollution and facilities that maintain the quality of drinking water rank as the highest priorities for government funding
Top Three Priorities for Government Funding in Water Infrastructure,
Total Mentions, 2016
Base: All respondents 2016 n=2,194
Q20 (new in 2016) Of the following water infrastructure areas, please rank the top three that should be the
highest priority for government funding.
45
41
33
28
20
10
9
6
5
1
Water treatment systems
Drinking water supply
Sewage collection and treatment
Upgrading/repairing infrastructure toeliminate boil water advisories
Green water infrastructure
Repairing leaky water mains
Storm water management
Infrastructure to protect against extremeweather and flooding
None of these
Other
Repairing leaky water mains
is a higher provincial concern
in Quebec than in other
provinces.

44 44
Base: All respondents 2016 n=2,194
Q20 (new in 2016) Of the following water infrastructure areas, please rank the top three that should be the
highest priority for government funding?
Highest Priority Infrastructure Area for Government Funding, Demographics, 2016
British
Colu
mbia
Alb
ert
a
Pra
irie
s
Onta
rio
Quebec
Atlantic
Vancouver
Calg
ary
Win
nip
eg
Toro
nto
Montr
eal
Halif
ax
18-3
4
years
35-5
5
years
>55 y
ears
Male
Fem
ale
Urb
an
(>100,0
00)
Mid
-siz
e
tow
ns/c
itie
s
Rura
l (<
1,0
00)
Water treatment systems to reduce
pollution in lakes, rivers and streams47 48 48 44 46 42 45 46 45 41 48 42 47 42 47 46 45 46 46 44
Sewage collection and treatment 34 36 35 33 33 30 33 36 36 32 31 27 31 30 39 36 30 35 30 32
Stormwater management 10 6 3 8 12 5 11 6 3 8 10 7 8 9 8 10 7 9 8 9
Drinking water supply 44 47 47 41 32 45 41 47 43 38 36 43 37 39 46 40 41 42 39 39
Upgrading/repairing infrastructure to
eliminate boil water advisories26 31 35 29 23 30 25 31 36 24 21 28 23 27 34 28 28 28 23 34
Infrastructure to protect against extreme
weather and flooding6 8 4 6 5 6 7 7 5 7 4 6 7 6 4 6 5 7 6 3
Repairing leaky water mains 7 7 6 8 17 6 5 7 5 7 14 7 7 11 9 12 7 9 10 10
Green water infrastructure 24 15 18 22 19 20 20 15 16 20 14 18 25 18 20 20 21 20 20 22
None of these 3 2 8 5 7 4 4 2 8 7 8 2 6 6 3 6 4 5 5 5
Other 1 0 0 1 0 1 1 0 0 0 1 0 0 1 0 0 1 0 1 2
REGION CITY AGE GENDERCOMMUNITY
SIZE
45
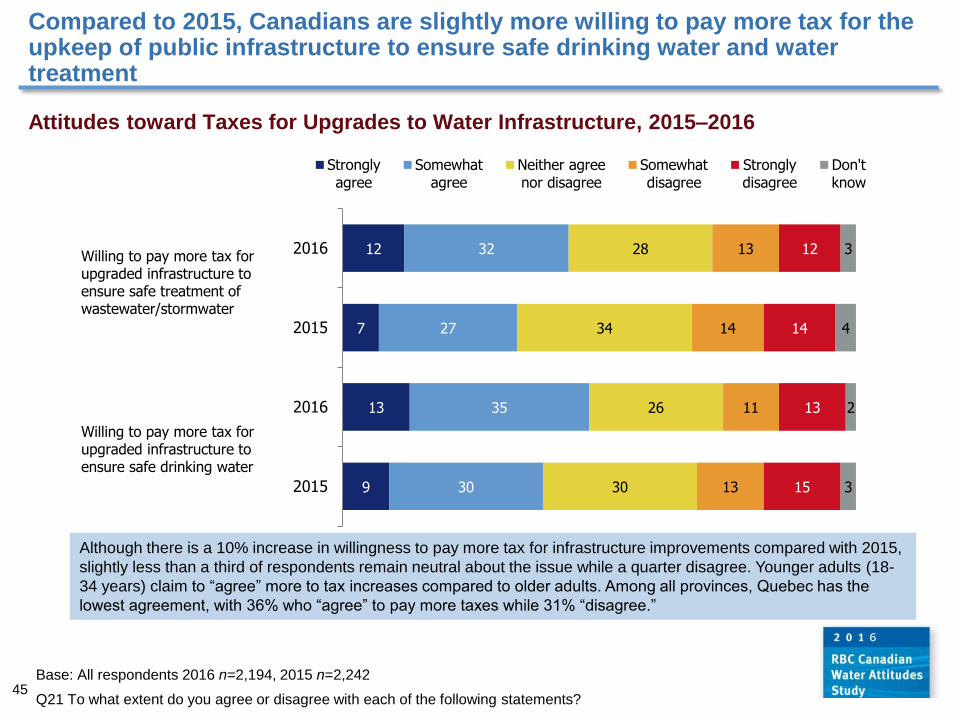
Compared to 2015, Canadians are slightly more willing to pay more tax for the upkeep of public infrastructure to ensure safe drinking water and water treatment
Attitudes toward Taxes for Upgrades to Water Infrastructure, 2015–2016
Base: All respondents 2016 n=2,194, 2015 n=2,242
Q21 To what extent do you agree or disagree with each of the following statements?
9
13
7
12
30
35
27
32
30
26
34
28
13
11
14
13
15
13
14
12
3
2
4
3
2015
2016
2015
2016
Stronglyagree
Somewhatagree
Neither agreenor disagree
Somewhatdisagree
Stronglydisagree
Don'tknow
Willing to pay more tax for upgraded infrastructure to ensure safe treatment of wastewater/stormwater Willing to pay more tax for upgraded infrastructure to ensure safe drinking water
Although there is a 10% increase in willingness to pay more tax for infrastructure improvements compared with 2015,
slightly less than a third of respondents remain neutral about the issue while a quarter disagree. Younger adults (18-
34 years) claim to “agree” more to tax increases compared to older adults. Among all provinces, Quebec has the
lowest agreement, with 36% who “agree” to pay more taxes while 31% “disagree.”

46 46
Base: All respondents 2016 n=2,194
Q21 Many types of aging public infrastructure in Canada are now in need of repair or replacement. To what
extent do you agree or disagree with each of the following statements?
Attitudes toward Replacement/Repair of Aging Public Infrastructure “Strongly agree” and “Somewhat agree,” Demographics, 2016
British
Colu
mbia
Alb
ert
a
Pra
irie
s
Onta
rio
Quebec
Atlantic
Vancouver
Calg
ary
Win
nip
eg
Toro
nto
Montr
eal
Halif
ax
18-3
4
years
35-5
5
years
>55 y
ears
Male
Fem
ale
Urb
an
(>100,0
00)
Mid
-siz
e
tow
ns/c
itie
s
Rura
l (<
1,0
00)
Willing to pay more tax for upgraded
infrastructure to ensure safe drinking
water
57 52 53 50 36 45 57 53 56 55 41 48 57 43 45 46 49 51 41 43
Willing to pay more tax for upgraded
infrastructure to ensure the safe
treatment of wastewater and
stormwater
54 49 47 47 34 42 55 52 50 47 37 47 50 41 44 45 44 47 39 43
REGION CITY AGE GENDERCOMMUNITY
SIZE

47
The majority of Canadian households continue to rely on municipal water supplies, with a slight increase in those who rely on private wells
Main Source of Household Water, All Respondents, 2012–2016
The white space in this chart represents “Don’t know”
Base: All respondents 2016 n=2,194; 2015: n=2,242
Q22 What is your main source of household water?
Q23 Do you have a household water meter?
22
17
18
15
20
78
83
82
85
77
2012
2013
2014
2015
2016
Private well Municipal water supply
Do you have a household water meter?
A majority of rural
respondents (57%) have a
private well and only 21%
have a water meter. However,
92% of urban respondents
rely on the municipal water
supply, and 40% of them have
a water meter.
Yes 35
No 52
Don't know 14

48 48
Base: All respondents 2016 n=2,194
Q22 What is your main source of household water?
Main Source of Household Water and Awareness of Household Water Meter, Demographics, 2016
British
Colu
mbia
Alb
ert
a
Pra
irie
s
Onta
rio
Quebec
Atlantic
Vancouver
Calg
ary
Win
nip
eg
Toro
nto
Montr
eal
Halif
ax
18-3
4
years
35-5
5
years
>55 y
ears
Male
Fem
ale
Urb
an
(>100,0
00)
Mid
-siz
e
tow
ns/c
itie
s
Rura
l (<
1,0
00)
Municipal water supply 83 88 85 72 82 56 89 94 89 93 91 75 84 79 69 79 75 92 69 37
Private well 12 9 11 25 16 43 5 3 7 5 5 24 11 18 31 19 21 4 30 60
REGION CITY AGE GENDERCOMMUNITY
SIZE
British
Colu
mbia
Alb
ert
a
Pra
irie
s
Onta
rio
Quebec
Atlantic
Vancouver
Calg
ary
Win
nip
eg
Toro
nto
Montr
eal
Halif
ax
18-3
4
years
35-5
5
years
>55 y
ears
Male
Fem
ale
Urb
an
(>100,0
00)
Mid
-siz
e
tow
ns/c
itie
s
Rura
l (<
1,0
00)
Yes 23 58 61 42 13 23 19 63 60 49 17 38 32 38 32 33 36 41 30 20
No 57 24 30 46 77 60 57 16 31 35 71 40 42 51 62 56 48 43 57 75
Don’t Know 20 19 9 12 10 17 24 21 9 16 12 22 26 10 6 11 16 17 12 4
REGION CITY AGE GENDERCOMMUNITY
SIZE
Main source of household water
Do you have a household water meter?

49
Slightly more than half of respondents now feel that water treatment and delivery systems are in good condition; Canadians are split on knowledge of condition of storm water systems
Base: respondents who use municipal water supply 2016 n=1787
Q25 Please indicate which one of the following is closest to your own opinion about:
42
54
37
42
10
10
11
11
36
32
50
44
12
4
2
3
2015
2016
2015
2016
In good condition; we need minorregular investments for upkeep
In poor condition; we needmajor investments now
I have no idea whatcondition they are in
DK/NA
The water treatment and delivery
systems in your community
The storm water management
systems in your community
Few Canadians think that storm water management systems and water treatment and delivery
systems require immediate major investment. The number of people who think that the system is in
a good condition both for water treatment and storm water management has increased since 2015.
Opinions about State of Water Treatment, Delivery and Storm Water Management
Systems, 2015–2016

50 50 Base: All respondents 2016 n=1,787
Q25 Please indicate which one of the following is closest to your own opinion about:
Opinions about State of Water Treatment, Delivery and Storm Water Management Systems, Demographics, 2016
British
Colu
mbia
Alb
ert
a
Pra
irie
s
Onta
rio
Quebec
Atlantic
Vancouver
Calg
ary
Win
nip
eg
Toro
nto
Montr
eal
Halif
ax
18-3
4
years
35-5
5
years
>55 y
ears
Male
Fem
ale
Urb
an
(>100,0
00)
Mid
-siz
e
tow
ns/c
itie
s
Rura
l (<
1,0
00)
The water treatment and delivery systems in your community
In good condition—we need minor
regular investments for upkeep56 63 53 54 50 47 57 63 51 55 43 51 56 50 58 61 48 54 55 56
In poor condition—we need major
investments now7 5 16 10 14 11 6 5 15 10 20 10 5 13 13 11 10 11 12 7
I have no idea what condition they are in 34 29 28 32 33 36 34 30 33 33 32 35 36 33 26 24 40 34 29 28
The storm water management systems in your community
In good condition—we need minor
regular investments for upkeep46 52 34 43 35 40 48 51 31 43 31 44 44 39 42 47 36 40 45 47
In poor condition—we need major
investments now9 7 21 11 13 12 9 8 21 12 19 13 6 13 15 15 8 13 9 5
I have no idea what condition they are in 42 40 42 43 50 44 39 40 43 41 48 40 48 45 39 34 54 44 43 48
REGION CITY AGE GENDERCOMMUNITY
SIZE

51
Extreme Weather

52
15
13
10
8
10
7
4
39
37
29
30
17
19
13
26
29
32
27
28
22
30
9
10
12
12
18
21
27
5
5
9
7
21
26
21
6
6
8
16
6
5
5
Have noticed more stories aboutflooding/drought in news recently
Have noticed more stories about water quality in news
Municipalities should levy a storm water surcharge onproperty owners with large paved surfaces
Municipality/region can cope with a water crisissuch as drought / dangerous pollution
Have made more effort to protect home from burglarythan from flooding
It is okay to shovel snow from adriveway onto a public roadway
Do not care where storm water goesafter it runs off of property
Stronglyagree
Somewhatagree
Neither agreenor disagree
Somewhatdisagree
Stronglydisagree
Don'tknow
Just over half of Canadians have noticed more stories recently about flooding/drought in the news and less than two in ten do not care where water goes when it runs off property
Base: All respondents 2016 n=2,194
Q. Please indicate how much you agree or disagree with each of the following statements.
Attitudes About Local Water Issues, 2016

53
Just over half of Canadians have recently noticed more stories in the news about flooding and drought; significant increase in respondents who have noticed more water quality stories in the news
54
50
38
37
27
26
17
47
28
27
32
28
23
19
Have noticed more stories aboutflooding/drought in news recently
Have noticed more stories about water quality in news
Municipalities should levy a storm water surcharge onproperty owners with large paved surfaces
Municipality/region can cope with a water crisissuch as drought / dangerous pollution
Have made more effort to protect home from burglarythan from flooding
It is okay to shovel snow from adriveway onto a public roadway
Do not care where storm water goesafter it runs off of property
2016
2015
Attitudes About Local Water Issues, “Strongly Agree” and “Somewhat Agree,”
2015–2016
Base All respondents 2016 n=2,194, 2015 n=2,242
Q. Please indicate how much you agree or disagree with each of the following statements.

54 Base: All respondents 2016 n=2,194
Q. Please indicate how much you agree or disagree with each of the following statements.
Attitudes About Local Water Issues “Strongly Agree” and “Agree,” Demographics, 2016
British
Colu
mbia
Alb
ert
a
Pra
irie
s
Onta
rio
Quebec
Atlantic
Vancouver
Calg
ary
Win
nip
eg
Toro
nto
Montr
eal
Halif
ax
18-3
4
years
35-5
5
years
>55 y
ears
Male
Fem
ale
Urb
an
(>100,0
00)
Mid
-siz
e
tow
ns/c
itie
s
Rura
l (<
1,0
00)
Don’t care where storm water goes after
it runs off of my property17 15 15 16 21 17 22 17 17 18 23 19 21 19 11 20 15 18 17 13
Have noticed more stories about water
quality in the news 56 45 51 53 45 50 50 42 50 46 51 50 46 47 57 49 52 49 50 56
Have noticed more stories about flooding
and/or drought in the news recently63 53 54 56 46 53 59 50 51 51 50 46 49 51 61 52 56 53 56 56
The municipality or region I live in can
cope with a water crisis such as drought
or dangerous pollution
41 39 35 36 36 32 42 45 43 40 42 35 36 36 37 42 31 40 32 29
Municipalities should levy a storm water
surcharge for large paved surfaces 40 33 31 40 37 41 43 35 28 46 43 46 39 37 38 39 37 41 36 33
Have made more effort to protect my
home from burglary han to protect it from
flooding
36 32 30 23 27 22 39 32 33 31 34 25 33 28 19 29 25 31 24 16
I think it is okay to shovel snow from a
driveway onto a public roadway28 36 30 24 24 14 32 40 32 26 28 19 28 26 22 31 21 28 25 19
REGION CITY AGE GENDERCOMMUNITY
SIZE

55
Three-quarters of Canadians do not feel that they live in an area that is vulnerable to flooding and drought
Yes 15
No 76
DK/NA 9
Live in an area that you think is
vulnerable to flooding?
Base: All respondents 2016 n=2,194, 2015 n=2,242
Q. Do you currently live in an area that you think is vulnerable to flooding?
Q. Do you currently live in an area that you think is vulnerable to drought?
Yes 12
No 74
DK/NA 14
Live in an area that you think is
vulnerable to drought?
21
15
72
76
7
9
2015
2016
Yes No Don't know
10
12
81
74
10
14
2015
2016
Yes No Don't know

56 56
Base: All respondents 2016 n=2,194
Q. Do you live in an area that you think is vulnerable to …
Perceived Vulnerability to Flooding and Drought, Demographics, 2016
British
Colu
mbia
Alb
ert
a
Pra
irie
s
Onta
rio
Quebec
Atlantic
Vancouver
Calg
ary
Win
nip
eg
Toro
nto
Montr
eal
Halif
ax
18-3
4
years
35-5
5
years
>55 y
ears
Male
Fem
ale
Urb
an
(>100,0
00)
Mid
-siz
e
tow
ns/c
itie
s
Rura
l (<
1,0
00)
Live in an area that you think is
vulnerable to flooding 17 22 24 14 10 19 16 26 25 10 9 25 23 15 9 14 17 15 15 16
Live in an area that you think is
vulnerable to drought27 31 20 8 3 7 19 25 9 5 3 8 12 11 14 10 14 11 11 19
REGION CITY AGE GENDERCOMMUNITY
SIZE

57
Yes 90
No 6
DK/NA 4
Nine in ten Canadians strongly agree that sellers living in a high-risk flood area should be legally required to fully disclose the risk when selling the property
Attitudes toward Disclosure of Flood Risk to Home/Property, 2016
Base: All respondents 2016 n=2,194
Q. (new in 2016) If a home is known to be at high risk from flooding, should sellers be legally required to fully
disclose the risk to buyers when selling the property?
British
Colu
mbia
Alb
ert
a
Pra
irie
s
Onta
rio
Quebec
Atlantic
Vancouver
Calg
ary
Win
nip
eg
Toro
nto
Montr
eal
Halif
ax
18-3
4
years
35-5
5
years
>55 y
ears
Male
Fem
ale
Urb
an
(>100,0
00)
Mid
-siz
e
tow
ns/c
itie
s
Rura
l (<
1,0
00)
Yes 91 90 88 89 91 91 90 92 88 83 87 92 87 88 94 88 92 89 89 95
No 5 4 7 6 6 6 7 3 9 9 9 4 6 7 4 7 4 6 7 4
REGION CITY AGE GENDERCOMMUNITY
SIZE
Nine in ten Canadians strongly agree
that sellers living in a high-risk flood
areas should be legally required to
fully disclose the risk when selling
their property. However, three
quarters of Canadians do not feel that
they live in an area that is vulnerable
to flooding.

58
Snow and ice storms are top extreme weather worries—Canadians less prepared for ice storms
Base: All respondents 2016 n=2,194
Q. Please answer the following questions about how likely the following types of events could adversely affect
you or your family, how worried you may be about them, and how prepared you are to cope with them.
74
72
71
33
28
28
18
47
48
41
27
24
25
16
57
69
57
37
32
26
23
Ice/hail storms
Severe snowstorms
Severe thunderstorms
Floods
Droughts
Tornadoes
Hurricanes
"Very likely" +"Somewhat likely"
"Very worried" +"Somewhat worried"
"Very prepared" +"Somewhat prepared"
Canadians feel more prepared to deal with severe snowstorms than other types of
extreme weather events. Only 3 in 10 Canadians are worried about flooding.
Likelihood/Worry/Preparedness for Adverse Weather Events,
“Very” and “Somewhat” Likely/Worried/Prepared, 2016

59 59
Base: All respondents 2016 n=2,194
Q. Please answer the following questions about how likely the following types of events could adversely affect
you or your family, how worried you may be about them, and how prepared you are to cope with them.
Likelihood/Worry/Preparedness for Adverse Weather Events
“Very” and “Somewhat” Likely/Worried/Prepared, Demographics, 2016 (1 of 2)
British
Colu
mbia
Alb
ert
a
Pra
irie
s
Onta
rio
Quebec
Atlantic
Vancouver
Calg
ary
Win
nip
eg
Toro
nto
Montr
eal
Halif
ax
18-3
4
years
35-5
5
years
>55 y
ears
Male
Fem
ale
Urb
an
(>100,0
00)
Mid
-siz
e
tow
ns/c
itie
s
Rura
l (<
1,0
00)
How likely?
Severe snowstorms 30 85 89 85 57 88 23 84 92 82 62 91 76 70 71 66 78 70 73 81
Floods 32 40 55 32 25 36 33 50 66 34 29 42 46 32 22 29 37 36 32 24
Tornadoes 7 40 39 34 26 12 11 36 32 27 23 10 27 28 29 26 31 24 29 41
Severe thunderstorms 56 80 84 84 49 64 54 79 83 82 53 66 73 70 69 65 77 68 71 78
Hurricanes 13 9 8 16 20 58 16 9 8 20 17 71 22 16 17 19 17 16 23 18
Droughts 42 51 40 22 23 18 37 43 29 22 21 20 28 29 28 24 32 27 27 35
Ice/hail storms 39 84 83 87 58 79 37 84 85 83 64 79 77 73 72 68 79 71 74 80
How worried?
Severe snowstorms 25 52 54 54 41 55 21 51 48 55 46 58 51 46 46 41 54 45 49 53
Floods 29 30 36 28 20 29 32 35 37 35 26 28 36 29 18 24 30 30 25 21
Tornadoes 10 36 33 30 22 16 13 33 29 28 20 11 25 26 25 23 28 24 27 29
Severe thunderstorms 35 42 42 46 37 36 35 43 44 48 35 34 40 42 42 37 45 39 46 44
Hurricanes 12 10 8 15 18 41 15 10 7 23 18 48 18 17 14 15 17 17 18 12
Droughts 36 38 26 20 20 15 34 32 19 26 20 13 25 25 22 21 27 25 21 25
Ice/hail storms 22 53 47 53 46 48 18 55 47 56 52 45 45 49 47 42 52 46 51 46
REGION CITY AGE GENDERCOMMUNITY
SIZE

60 60
Base: All respondents 2016 n=2,194
Q. Please answer the following questions about how likely the following types of events could adversely affect
you or your family, how worried you may be about them, and how prepared you are to cope with them.
Likelihood/Worry/Preparedness for Adverse Weather Events
“Very” and “Somewhat” Likely/Worried/Prepared, Demographics, 2016 (2 of 2)
British
Colu
mbia
Alb
ert
a
Pra
irie
s
Onta
rio
Quebec
Atlantic
Vancouver
Calg
ary
Win
nip
eg
Toro
nto
Montr
eal
Halif
ax
18-3
4
years
35-5
5
years
>55 y
ears
Male
Fem
ale
Urb
an
(>100,0
00)
Mid
-siz
e
tow
ns/c
itie
s
Rura
l (<
1,0
00)
How prepared?
Severe snowstorms 41 73 78 76 63 78 29 70 79 67 59 73 64 66 76 67 70 63 71 84
Ice/hail storms 38 57 57 64 50 68 30 55 56 58 53 66 54 57 60 56 58 52 62 67
Droughts 35 34 39 34 26 29 27 32 35 33 28 23 25 33 38 36 28 28 33 43
Hurricanes 18 16 16 25 17 52 15 15 17 24 19 58 18 23 26 25 21 20 22 32
Severe thunderstorms 39 62 63 66 46 63 30 60 64 62 50 59 53 58 61 55 60 52 62 70
Tornadoes 16 33 36 32 19 18 13 29 38 26 20 16 22 26 30 27 26 23 24 39
Floods 32 41 53 40 28 42 26 44 58 38 31 39 35 37 40 40 35 36 37 41
REGION CITY AGE GENDERCOMMUNITY
SIZE

61
Canadians feel more prepared to deal with the safety/emotional impacts of flooding than with the financial aspects
12
13
26
21
23
36
46
44
52
54
30
29
18
20
17
21
11
10
6
5
1
1
2
1
1
Ability to pay costs not covered byinsurance
Physical damage to home
Having adequate insurance coverage
Ability to manage personal stress
Safety and security of family
Veryprepared
Somewhatprepared
Not veryprepared
Not at allprepared
DK/NA
Base: All respondents 2016 n=2,194
Q. How prepared do you feel you are to deal with each of the following potential impacts of flooding?
Around five in ten respondents feel “very” and “somewhat” prepared to pay costs not covered
by insurance if impacted by flooding.
Preparedness for Potential Impacts of Flooding, 2016

62 62
Preparedness for Potential Impacts of Flooding “Very Prepared” and “Somewhat Prepared,” Demographics, 2016
Base: All respondents 2016 n=2,194
Q. How prepared do you feel you are to deal with each of the following potential impacts of flooding?
British
Colu
mbia
Alb
ert
a
Pra
irie
s
Onta
rio
Quebec
Atlantic
Vancouver
Calg
ary
Win
nip
eg
Toro
nto
Montr
eal
Halif
ax
18-3
4
years
35-5
5
years
>55 y
ears
Male
Fem
ale
Urb
an
(>100,0
00)
Mid
-siz
e
tow
ns/c
itie
s
Rura
l (<
1,0
00)
Physical damage to your home 52 60 62 57 60 57 49 58 61 54 61 63 55 59 59 62 54 54 61 65
Having adequate insurance coverage 66 70 76 72 70 69 63 68 73 68 68 74 65 69 78 73 68 67 74 78
Ability to pay any costs not covered by
insurance48 46 51 50 44 49 48 47 50 50 48 54 44 47 52 52 44 46 50 52
Safety and security of your family 74 79 80 79 72 78 72 78 82 75 68 76 74 76 79 80 74 74 77 84
Ability to manage personal stress 73 74 79 71 72 76 71 72 79 71 72 78 69 72 76 79 67 71 75 74
REGION CITY AGE GENDERCOMMUNITY
SIZE
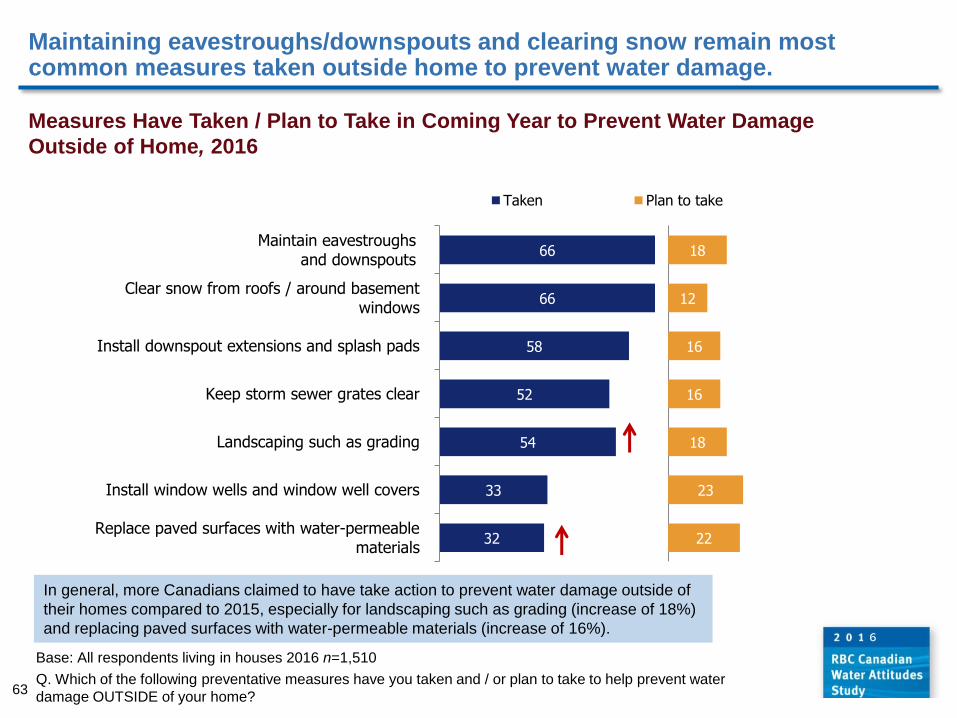
63 63
Maintaining eavestroughs/downspouts and clearing snow remain most common measures taken outside home to prevent water damage.
Base: All respondents living in houses 2016 n=1,510
Q. Which of the following preventative measures have you taken and / or plan to take to help prevent water
damage OUTSIDE of your home?
66
66
58
52
54
33
32
18
12
16
16
18
23
22
Maintain eavestroughs and downspouts
Clear snow from roofs / around basementwindows
Install downspout extensions and splash pads
Keep storm sewer grates clear
Landscaping such as grading
Install window wells and window well covers
Replace paved surfaces with water-permeablematerials
Taken Plan to take
Measures Have Taken / Plan to Take in Coming Year to Prevent Water Damage
Outside of Home, 2016
In general, more Canadians claimed to have take action to prevent water damage outside of
their homes compared to 2015, especially for landscaping such as grading (increase of 18%)
and replacing paved surfaces with water-permeable materials (increase of 16%).

64 64
Base: All respondents 2016 n=1,510
Q. Which of the following preventative measures have you taken and / or plan to take to help prevent water
damage OUTSIDE of your home? Please select all that apply.
Preventative Measures Taken to Prevent Water Damage Outside of Home, Demographics, 2016
British
Colu
mbia
Alb
ert
a
Pra
irie
s
Onta
rio
Quebec
Atlantic
Vancouver
Calg
ary
Win
nip
eg
Toro
nto
Montr
eal
Halif
ax
18-3
4
years
35-5
5
years
>55 y
ears
Male
Fem
ale
Urb
an
(>100,0
00)
Mid
-siz
e
tow
ns/c
itie
s
Rura
l (<
1,0
00)
Maintain eavestroughs and downspouts 61 67 82 68 59 65 49 67 83 59 51 70 50 67 78 65 67 61 69 74
Install downspout extensions and splash
pads42 60 73 61 56 54 31 63 73 48 49 51 43 58 71 59 57 55 60 63
Add landscaping features such as
graded or sloping surfaces to help drain
water more efficiently
45 55 64 56 50 54 29 54 59 47 45 55 38 52 69 53 55 47 57 64
Install window wells and window well
covers24 44 44 32 30 30 19 43 44 33 31 29 30 31 38 34 31 33 36 29
Replace paved surfaces with water-
permeable materials such as interlocking
stone to reduce runoff
30 35 30 35 28 23 18 34 28 36 30 26 30 29 37 34 30 31 37 29
Keep storm sewer grates clear 53 58 57 52 49 45 49 57 60 55 47 54 43 55 55 53 51 55 53 44
Clear snow from around basement
windows or from roofs41 72 78 67 69 67 27 69 78 66 64 66 57 66 73 65 67 64 67 70
REGION CITY AGE GENDERCOMMUNITY
SIZE

65 65
Base: All respondents 2016 n=1,510
Q. Which of the following preventative measures have you taken and / or plan to take to help prevent water
damage OUTSIDE of your home? Please select all that apply.
Measures Plan to Take in Coming Year to Prevent Water Damage Outside of Home, Demographics, 2016
British
Colu
mbia
Alb
ert
a
Pra
irie
s
Onta
rio
Quebec
Atlantic
Vancouver
Calg
ary
Win
nip
eg
Toro
nto
Montr
eal
Halif
ax
18-3
4
years
35-5
5
years
>55 y
ears
Male
Fem
ale
Urb
an
(>100,0
00)
Mid
-siz
e
tow
ns/c
itie
s
Rura
l (<
1,0
00)
Maintain eavestroughs and downspouts 16 18 20 17 20 18 19 15 18 24 25 16 23 19 12 18 17 21 14 14
Install downspout extensions and splash
pads17 19 10 16 16 17 16 16 9 28 25 24 21 17 12 15 18 20 16 9
Add landscaping features such as
graded or sloping surfaces to help drain
water more efficiently
17 21 15 16 21 18 20 23 20 26 30 21 23 20 11 18 18 23 13 10
Install window wells and window well
covers22 22 23 25 24 18 23 20 24 34 28 20 26 25 19 22 25 26 21 19
Replace paved surfaces with water-
permeable materials such as interlocking
stone to reduce runoff
18 25 22 20 26 23 20 26 21 29 34 24 22 26 18 22 22 25 19 19
Keep storm sewer grates clear 17 15 11 15 19 15 21 18 14 23 30 16 24 16 9 15 17 19 15 12
Clear snow from around basement
windows or from roofs18 10 16 9 13 10 21 9 12 14 17 13 15 13 7 11 12 14 10 8
REGION CITY AGE GENDERCOMMUNITY
SIZE
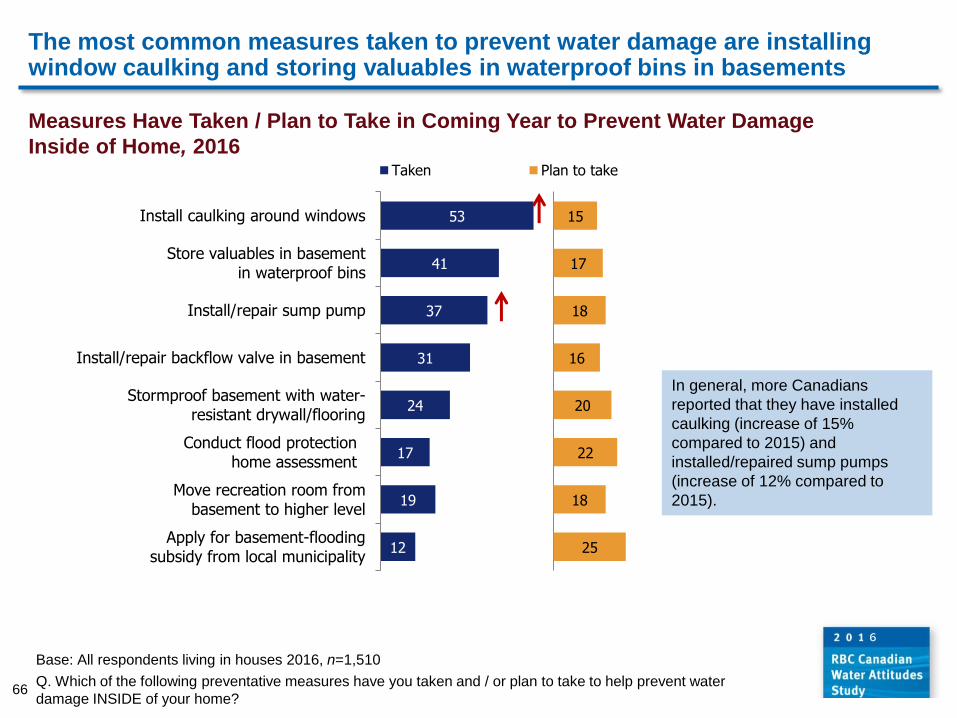
66 66
The most common measures taken to prevent water damage are installing window caulking and storing valuables in waterproof bins in basements
Base: All respondents living in houses 2016, n=1,510
Q. Which of the following preventative measures have you taken and / or plan to take to help prevent water
damage INSIDE of your home?
53
41
37
31
24
17
19
12
7
19
23
29
36
43
41
48
15
17
18
16
20
22
18
25
Install caulking around windows
Store valuables in basementin waterproof bins
Install/repair sump pump
Install/repair backflow valve in basement
Stormproof basement with water-resistant drywall/flooring
Conduct flood protectionhome assessment
Move recreation room frombasement to higher level
Apply for basement-floodingsubsidy from local municipality
Taken Plan to take
Measures Have Taken / Plan to Take in Coming Year to Prevent Water Damage
Inside of Home, 2016
In general, more Canadians
reported that they have installed
caulking (increase of 15%
compared to 2015) and
installed/repaired sump pumps
(increase of 12% compared to
2015).

67 67
Base: All respondents 2016 n=1,510
Q. Which of the following preventative measures have you taken and / or plan to take to help prevent water
damage INSIDE of your home? Please select all that apply.
Preventative Measures Taken to Prevent Water Damage Inside of Home, Demographics, 2016
British
Colu
mbia
Alb
ert
a
Pra
irie
s
Onta
rio
Quebec
Atlantic
Vancouver
Calg
ary
Win
nip
eg
Toro
nto
Montr
eal
Halif
ax
18-3
4
years
35-5
5
years
>55 y
ears
Male
Fem
ale
Urb
an
(>100,0
00)
Mid
-siz
e
tow
ns/c
itie
s
Rura
l (<
1,0
00)
Store valuables in basement in plastic or
waterproof bins31 40 49 43 40 45 24 42 47 44 41 50 33 42 47 40 42 40 42 43
Install or repair a backflow valve in my
basement23 31 48 27 38 29 22 29 54 26 37 30 27 34 29 32 30 30 34 28
Install caulking around windows 41 48 56 57 53 52 35 49 57 49 61 54 44 52 62 54 52 52 50 57
Install or repair a sump pump 22 26 51 44 33 33 21 22 57 26 32 26 30 38 42 38 36 28 38 56
Stormproof my basement with water-
resistant drywall and special sub-flooring20 20 26 23 31 26 21 21 25 23 35 28 22 25 26 27 22 23 29 22
Move my recreation room from the
basement to a higher level14 21 16 19 21 21 10 22 17 21 20 19 20 18 20 20 18 18 22 19
Apply for a basement-flooding subsidy
from my local municipality15 10 12 11 15 14 16 12 13 15 16 13 15 13 9 16 9 13 13 10
Conduct a flood protection home
assessment with a drainage specialist14 16 16 15 22 17 11 14 16 17 20 17 17 17 17 19 14 16 20 15
DK/NA 41 33 17 21 24 26 44 35 13 25 19 24 34 25 18 23 27 27 26 19
REGION CITY AGE GENDERCOMMUNITY
SIZE

68 68
Base: All respondents 2016 n=1,510
Q. Which of the following preventative measures have you taken and / or plan to take to help prevent water
damage INSIDE of your home? Please select all that apply.
Measures Plan to Take in Coming Year to Prevent Water Damage Inside of Home, Demographics, 2016
British
Colu
mbia
Alb
ert
a
Pra
irie
s
Onta
rio
Quebec
Atlantic
Vancouver
Calg
ary
Win
nip
eg
Toro
nto
Montr
eal
Halif
ax
18-3
4
years
35-5
5
years
>55 y
ears
Male
Fem
ale
Urb
an
(>100,0
00)
Mid
-siz
e
tow
ns/c
itie
s
Rura
l (<
1,0
00)
Store valuables in basement in plastic or
waterproof bins13 19 16 18 16 13 16 20 18 24 17 14 21 19 11 18 15 18 19 11
Install or repair a backflow valve in my
basement15 20 16 16 16 13 15 22 17 21 23 14 17 17 13 17 15 19 14 12
Install caulking around windows 15 18 14 15 14 13 16 18 16 24 13 13 20 15 11 15 14 16 18 9
Install or repair a sump pump 18 24 13 17 20 13 17 22 12 27 30 19 21 19 15 18 18 22 19 9
Stormproof my basement with water-
resistant drywall and special sub-flooring16 25 25 21 19 15 17 23 24 27 25 17 21 24 16 20 20 22 18 19
Move my recreation room from the
basement to a higher level15 20 24 18 20 12 18 19 22 23 31 14 19 20 15 18 18 22 15 14
Apply for a basement-flooding subsidy
from my local municipality16 32 24 26 26 18 16 30 24 33 33 22 25 26 23 25 24 27 26 20
Conduct a flood protection home
assessment with a drainage specialist19 28 20 23 22 20 18 29 20 27 30 23 23 25 19 22 23 24 23 18
DK/NA 66 56 59 58 57 66 64 57 61 47 48 60 56 58 64 57 62 56 60 64
REGION CITY AGE GENDERCOMMUNITY
SIZE

69
17
13
10
10
8
6
5
17
Backflow valve was installedin home when it was built
Do not know if there isbackflow valve in house
Home does not have backflowvalve and do not plan to install one
Have not heard of backflow valve before
Installed backflow valve in home
Previous owner of home installed backflow valve in home after it was built
Home does not have a backflowvalve but do plan to install one
Don't know
Only a third of Canadians have / plan to install a backflow valve; two in five respondents living in houses do not know if their homes have a backflow valve
Base: All respondents living in houses 2016, n=1,510
Q. Backflow valves help to prevent sewer drains from backing up and overflowing, and this eliminates sewer
backflow as a potential source of basement flooding. From the list below, please select the statement that best
applies to you.
Status of Backflow Valve in Home, 2016
40 percent do not
know if they have a
backflow valve, do
not know what it is,
or answered “Don’t
know.”

70 70
Base: All respondents 2016 n=1,510
Q. Backflow valves help to prevent sewer drains from backing up and overflowing, and this eliminates sewer
backflow as a potential source of basement flooding. From the list below, please select the statement that best
applies to you.
British
Colu
mbia
Alb
ert
a
Pra
irie
s
Onta
rio
Quebec
Atlantic
Vancouver
Calg
ary
Win
nip
eg
Toro
nto
Montr
eal
Halif
ax
18-3
4
years
35-5
5
years
>55 y
ears
Male
Fem
ale
Urb
an
(>100,0
00)
Mid
-siz
e
tow
ns/c
itie
s
Rura
l (<
1,0
00)
A backflow valve was installed in my
home when it was built16 23 23 11 25 17 13 22 24 10 24 21 13 20 16 18 16 17 21 12
The previous owner of my home installed
a backflow valve in my home after it was
built
3 3 9 4 10 7 4 4 6 7 10 8 7 5 5 5 6 6 6 3
I installed a backflow valve in my home 2 5 16 7 11 6 3 5 19 9 14 5 7 8 8 9 7 9 8 6
My home doesn’t have a backflow valve
and I don’t plan to install one9 11 7 10 11 14 7 10 6 8 9 17 7 9 15 15 6 8 12 13
My home doesn’t have a backflow valve,
but I do plan to install one3 4 8 6 4 4 4 4 8 9 5 1 4 6 4 7 3 6 4 4
I do not know if there is a backflow valve
in my house12 13 11 15 11 13 12 13 12 17 12 9 12 15 12 12 15 15 11 12
I have never heard of a backflow valve
before today15 9 5 13 4 6 21 10 2 12 4 5 18 6 7 7 12 11 8 8
REGION CITY AGE GENDERCOMMUNITY
SIZE
Status of Backflow Valve in Home, Demographics, 2016

71
Fun Facts

72
Activities that Canadians like to do outdoors during the May Long Weekend
Favourite Outdoor Activities, Unprompted, Total Mentions, 2016
Base: 2016 n=2,108
Q. (new in 2016) Now we would like to ask you a few other questions. Thinking about Victoria Day long
weekend in May, what is your favourite thing to do outdoors during the May long weekend?
17
13
11
11
9
6
5
4
4
4
2
2
1
5
7
Enjoy food/drinks/bbq
Gardening /yardwork/ chores
Go camping / fishing / have a bonfire
Walking/hiking
Nothing / relax / stay home
Spend time outdoors (in general)
Go to the beach/lake/cottage/canoe/kayak
Spending time with family/friends
Go to a concert/festival/local attraction/fireworks
Outdoor sports (non-water sports)
Bike riding
Stay inside
Work
Other
DK/NA

73
Two thirds of Canadians are “very likely” or “somewhat likely” to spend time outdoors near or on the water on Victoria Day
Likelihood to Spend Time Outdoors Near or On the Water, 2016
Base: All respondents 2016 n=2,194
Q. (new in 2016) The Victoria Day long weekend in May marks the unofficial beginning of summer for many
Canadians. Assuming that the weather is nice, how likely are you to spend time outdoors near or on the water
this Victoria Day?
British
Colu
mbia
Alb
ert
a
Pra
irie
s
Onta
rio
Quebec
Atlantic
Vancouver
Calg
ary
Win
nip
eg
Toro
nto
Montr
eal
Halif
ax
18-3
4
years
35-5
5
years
>55 y
ears
Male
Fem
ale
Urb
an
(>100,0
00)
Mid
-siz
e
tow
ns/c
itie
s
Rura
l (<
1,0
00)
"Very likely" + "Somewhat likely" 73 64 64 71 55 75 75 67 58 71 59 81 74 67 59 66 67 66 68 67
REGION CITY AGE GENDERCOMMUNITY
SIZE
34 32 19 14 1 How likely are you to spend time outdoors near or on the
water this Victoria Day?
Verylikely
Somewhatlikely
Somewhatunlikely
Veryunlikely
DK/NA

74
Swimming is the most-mentioned activity that Canadians like to do which involves water
Base: All respondents 2016 n=2,194
Q. Thinking about your fondest experiences in the Canadian outdoors, which, if any, of the following did they
involve? Please select up to three.
Fondest Experiences in the Canadian Outdoors, Total Mentions, 2016
33
33
32
25
19
12
9
9
9
9
7
5
4
4
3
3
1
15
Hiking
Swimming
Spending time on the beach
Fishing
Cycling
Playing outdoor team sports
Skating
Skiing
Canoeing
Bird watching
Power boating
Hunting
Kayaking
Snowshoeing
Sailing
Climbing
Flying
Other
Experiences
involving water

75 75
Base: All respondents 2016 n=2,194
Q. Thinking about your fondest experiences in the Canadian outdoors, which, if any, of the following did they
involve?
Fondest Experiences of the Canadian Outdoors Demographics, 2016
British
Colu
mbia
Alb
ert
a
Pra
irie
s
Onta
rio
Quebec
Atlantic
Vancouver
Calg
ary
Win
nip
eg
Toro
nto
Montr
eal
Halif
ax
18-3
4
years
35-5
5
years
>55 y
ears
Male
Fem
ale
Urb
an
(>100,0
00)
Mid
-siz
e
tow
ns/c
itie
s
Rura
l (<
1,0
00)
Skating 5 11 6 11 9 11 7 12 6 12 11 11 9 9 9 9 10 10 9 9
Swimming 33 26 34 38 24 38 30 27 37 35 28 41 37 31 30 25 40 32 30 36
Sailing 2 3 0 2 4 4 3 2 0 3 4 4 3 3 3 3 3 4 1 2
Power boating 8 6 11 9 3 5 7 4 8 8 3 3 6 7 7 8 6 5 8 11
Canoeing 8 7 8 13 5 10 9 8 7 10 5 12 8 9 11 10 9 9 7 14
Kayaking 7 4 3 4 4 6 8 3 4 3 2 8 6 4 3 4 5 4 5 3
Bird watching 10 6 7 9 12 8 7 4 5 8 8 4 5 8 14 7 11 7 10 16
Fishing 24 22 35 25 25 26 18 21 30 15 19 22 19 24 32 30 20 20 28 38
Hunting 4 4 5 5 6 7 2 4 4 2 5 8 3 4 8 8 2 3 7 9
Spending time on the beach 41 21 36 33 27 42 41 21 40 36 27 40 37 31 28 24 39 33 33 25
Skiing 10 13 4 9 11 5 11 15 2 12 11 6 11 10 7 10 8 11 10 4
Flying 2 1 0 1 0 1 2 1 0 2 0 3 2 0 1 1 1 1 0 0
Hiking 39 43 24 27 39 29 41 45 23 24 35 30 36 33 29 29 36 34 35 27
Climbing 3 4 2 2 2 3 5 5 2 4 2 3 4 3 1 3 2 3 2 1
Snowshoeing 3 2 2 2 8 3 3 2 2 2 6 1 3 4 4 4 4 3 5 5
Cycling 13 19 19 18 28 11 12 20 20 25 31 11 19 20 18 22 16 22 17 12
Playing outdoor team sports 11 13 17 12 9 13 11 11 18 15 10 20 17 9 9 15 8 14 12 5
Other 16 17 14 17 11 14 15 16 11 12 9 14 10 14 21 14 16 13 14 24
DK/NA 2 3 3 1 2 1 3 2 4 2 4 0 2 2 2 2 1 3 1 1
REGION CITY AGE GENDERCOMMUNITY
SIZE

76
Water-related activities are among Canadians fondest memories of the outdoors across all regions
Fondest Experiences of the Canadian Outdoors, Total Mentions, by Region, 2016
Base: All respondents 2016 n=2194
Q. Thinking about your fondest experiences in the Canadian outdoors, which, if any, of the following did they
involve?
Bri
tish
Co
lum
bia
Alb
ert
a
Pra
irie
s
On
tari
o
Qu
eb
ec
Atl
an
tic
Hiking 42 40 26 31 50 34
Swimming 33 30 35 40 20 38
Spending time on the beach 32 29 40 35 28 47
Fishing 24 32 40 27 26 30
Cycling 19 17 11 17 25 12
Playing outdoor team sports 21 15 16 14 10 12
Skating 6 15 12 15 16 16
Skiing 15 17 12 10 14 9
Canoeing 7 7 9 16 7 12
Bird watching 9 7 10 10 12 7
Power boating 9 10 15 10 2 10
Hunting 7 5 11 5 6 10
Snowshoeing 5 4 3 2 12 3
Kayaking 7 2 1 4 7 6
Sailing 5 2 1 5 2 5
Climbing 5 4 1 3 2 1
Flying 2 1 1 2 1 1
None 1 1 1 0 2 0
Other 1 6 3 3 2 3
Don’t know 0 2 2 1 1 1
Top ranking
outdoor experience
Second ranking
outdoor experience

77 Base: All respondents 2016 n=2,194
Q. How frequently in a year, if at all, do you swim or bathe in lakes or rivers in Canada?
Nearly two-thirds of Canadians swim in lakes or rivers at least once per year
Frequency of Swimming in Canadian Lakes or Rivers, 2016
Ten times or more per year
8 Between three and ten times per year
15
Once or twice per year 37
Never 40

78 78 Base: All respondents 2016 n=2,194
Q. How frequently in a year, if at all, do you swim or bathe in lakes or rivers in Canada?
Frequency of Swimming in Canadian Lakes or Rivers Demographics, 2016
British
Colu
mbia
Alb
ert
a
Pra
irie
s
Onta
rio
Quebec
Atlantic
Vancouver
Calg
ary
Win
nip
eg
Toro
nto
Montr
eal
Halif
ax
18-3
4
years
35-5
5
years
>55 y
ears
Male
Fem
ale
Urb
an
(>100,0
00)
Mid
-siz
e
tow
ns/c
itie
s
Rura
l (<
1,0
00)
Never 44 52 41 36 42 33 46 51 42 39 45 23 31 40 50 39 42 42 35 41
Once or twice per year 32 35 35 39 36 40 30 33 33 40 34 43 41 34 36 39 34 35 42 35
Between three and nine times per year 14 10 15 16 14 16 14 13 13 13 13 18 18 16 10 13 16 15 15 15
Ten times or more 10 4 9 9 8 11 10 3 12 8 8 17 10 10 5 9 8 8 8 9
REGION CITY AGE GENDERCOMMUNITY
SIZE

79
Two-thirds of Canadians express concern about the quality of the water in rivers and lakes used for swimming
Base: All respondents who swim/bathe in lakes or rivers at least once per year 2016 n=1,254
Q. How concerned are you about the quality of water in the lakes or rivers in which you swim?
Concern about Water Quality in Rivers and Lakes Used for Swimming, 2016
Very concerned 22
Somewhat concerned
44
Not very concerned 27
Not at all concerned
6
Don't know 1

80 80 Base: All respondents 2016 n=1,254
Q. How concerned are you about the quality of water in the lakes or rivers in which you swim?
Concern about Water Quality in Rivers and Lakes Used for Swimming Demographics, 2016
British
Colu
mbia
Alb
ert
a
Pra
irie
s
Onta
rio
Quebec
Atlantic
Vancouver
Calg
ary
Win
nip
eg
Toro
nto
Montr
eal
Halif
ax
18-3
4
years
35-5
5
years
>55 y
ears
Male
Fem
ale
Urb
an
(>100,0
00)
Mid
-siz
e
tow
ns/c
itie
s
Rura
l (<
1,0
00)
"Very concerned" + "Somewhat
concerned"62 65 70 64 71 65 59 62 76 67 72 64 63 70 64 67 65 67 70 59
REGION CITY AGE GENDERCOMMUNITY
SIZE

81
More than two-thirds of Canadians like to garden often, with vegetables and perennials being the most-favourite things they like to plant in the spring time
Base: All respondents 2016 n=2,194
Q. (new in 2016) Some people like to garden in the Spring time. Which of the following best describes how often
you garden?
2016 n=1,503
Q. (new in 2016) What is your favourite type of plant or flower to plant in the spring?
Frequently 29
Sometimes 41
Never 31
12
12
10
10
8
6
6
4
3
3
3
2
2
2
19
Vegetables/legumes
Perennials
Tulips
Flowers (general)
Fruits/berries
Annuals
Roses
Herbs/spices/edible flowers
Lilies
Trees/shrubs/bushes/grasses
Geraniums
Hostas
Petunias
Pansies
DK/NA
How often do you garden?
Favourite Type of Plant or Flower to Plant in Spring, Total Mentions, 2016

82 82
Base: All respondents 2016 n=2,194
Q. (new in 2016) Some people like to garden in the Spring time. Which of the following best describes how
often you garden?
Frequency of Spring Time Gardening, Demographics, 2016
British
Colu
mbia
Alb
ert
a
Pra
irie
s
Onta
rio
Quebec
Atlantic
Vancouver
Calg
ary
Win
nip
eg
Toro
nto
Montr
eal
Halif
ax
18-3
4
years
35-5
5
years
>55 y
ears
Male
Fem
ale
Urb
an
(>100,0
00)
Mid
-siz
e
tow
ns/c
itie
s
Rura
l (<
1,0
00)
Frequently 24 30 29 29 30 32 19 28 24 21 24 27 15 30 40 28 30 25 32 39
Sometimes 40 34 34 46 37 39 41 32 36 49 42 40 49 40 34 38 43 39 42 44
Never 36 36 37 26 33 30 40 40 40 30 34 33 36 30 27 34 27 37 26 17
REGION CITY AGE GENDERCOMMUNITY
SIZE

83
29
22
25
33
20
38
65
24
41
47
42
55
42
25
23
24
22
18
20
14
7
22
8
4
5
3
3
2
2
5
2
2
2
3
1
I collect water in a rain barrel to water my garden
I use phosphorous-free fertilizer in my garden
I water my plants infrequently to save water
I use mulches like bark chips, wood shavings, grassclippings or pine needles to conserve moisture
I select plants and flowers for my garden that do notneed to be watered frequently
I try to water early in the morning to minimizeevaporation
I do not water my garden when it has just rained, israining or about to rain or during a water
ban/drought
Stronglyagree
Somewhatagree
Somewhatdisagree
Stronglydisagree
Don'tknow
Canadians garden responsibly when it comes to water use with almost all respondents stating that they do not water their garden during a water ban or drought
Gardening Practices, Respondents who Garden Frequently/Sometimes, 2016
Base: 2016 n=1,503
Q. (new in 2016) To what extent do you agree or disagree with the following statements about your garden:

84 84
Base: All respondents 2016 n=1,503
Q. (new in 2016) To what extent do you agree or disagree with the following statements about your garden:
Agreement with Gardening Statements “Strongly Agree” and “Somewhat Agree,” Demographics, 2016
British
Colu
mbia
Alb
ert
a
Pra
irie
s
Onta
rio
Quebec
Atlantic
Vancouver
Calg
ary
Win
nip
eg
Toro
nto
Montr
eal
Halif
ax
18-3
4
years
35-5
5
years
>55 y
ears
Male
Fem
ale
Urb
an
(>100,0
00)
Mid
-siz
e
tow
ns/c
itie
s
Rura
l (<
1,0
00)
I select plants and flowers for my garden
that do not need to be watered frequently72 77 74 76 76 73 75 78 76 75 77 72 68 80 76 72 78 73 76 80
I use mulches like bark chips, wood
shavings, grass clippings or pine needles
to conserve moisture
63 73 57 77 77 77 58 75 57 73 80 79 69 77 74 77 72 72 75 78
I try to water early in the morning to
minimize evaporation 85 82 80 81 75 77 82 86 83 81 78 74 71 83 83 79 81 81 75 83
I water my plants infrequently to save
water 75 68 64 69 77 70 76 68 62 68 76 72 68 73 72 67 75 71 69 75
I use phosphorous-free fertilizer in my
garden58 62 60 62 70 64 54 62 60 61 70 65 60 68 61 63 64 63 63 64
I don’t water my garden when it has just
rained, is raining or about to rain or
during a water ban or drought
90 90 92 89 91 95 88 89 89 86 91 95 86 89 95 86 94 88 92 95
I collect water in a rain barrel to water
my garden48 60 57 51 54 58 47 54 51 48 51 54 54 54 50 53 53 48 51 65
REGION CITY AGE GENDERCOMMUNITY
SIZE

85 85
Canadians feel most guilty about leaving the water running when brushing their teeth or washing dishes
46
25
21
20
18
10
3
29
14
35
39
40
42
50
57
31
39
6
11
10
7
10
2
38
Leaving the water running when brushing your teeth orwashing dishes
Shoveling snow from your property or sidewalk onto thestreet
Taking multiple showers per day
Allowing soapy water to run down a storm drain
Hosing down your driveway or sidewalk
Flushing things down the toilet that should be disposed ofin another manner
Watering your lawn when it has just rained, is raining, orabout to rain, or during a water ban or drought
None of these
Activities done Feel guilty
*None of these makes me feel guilty
Base: All respondents 2016; activities done n=2,194, feel guilty n=1,537 (feel guilty only)
Q. (new in 2016) Which of the following activities, if any, have you done in the past?
Q. (new in 2016) Which of the following activities, if any, do you feel guilty about doing?
Activities Done and Guilt About Wasting Water, Total Mentions, 2016
*

86
Base: All respondents 2016 n=2,194
Q. (new in 2016) Which of the following activities, if any, have you done in the past?
British
Colu
mbia
Alb
ert
a
Pra
irie
s
Onta
rio
Quebec
Atlantic
Vancouver
Calg
ary
Win
nip
eg
Toro
nto
Montr
eal
Halif
ax
18-3
4
years
35-5
5
years
>55 y
ears
Male
Fem
ale
Urb
an
(>100,0
00)
Mid
-siz
e
tow
ns/c
itie
s
Rura
l (<
1,0
00)
Hosing down your driveway or sidewalk 21 24 18 20 13 16 20 25 18 22 13 16 17 17 22 21 16 20 19 14
Allowing soapy water to run down a
storm drain25 14 15 19 22 19 28 13 16 20 19 25 23 20 17 20 19 23 17 14
Watering your lawn when it has just
rained / is raining / about to rain / during
a water ban/drought
2 3 0 3 3 5 3 3 0 4 5 5 4 3 1 3 3 3 3 3
Leaving the water running when brushing
your teeth or washing dishes40 48 40 48 47 46 40 50 39 47 47 45 50 48 40 41 51 46 45 45
Taking multiple showers per day 21 21 17 21 21 21 28 24 17 24 20 25 35 21 7 22 20 24 17 16
Flushing things down the toilet that
should be disposed of in another manner13 8 11 11 5 11 15 9 7 12 7 16 14 10 6 9 10 11 6 10
Shoveling snow from your property or
sidewalk onto the street20 40 31 23 25 13 20 45 31 26 28 18 27 26 20 26 23 28 20 18
None of these 28 26 32 28 32 35 24 21 31 23 30 29 18 28 41 31 28 26 32 38
REGION CITY AGE GENDERCOMMUNITY
SIZE
Activities done by Canadians (water-wasting), Demographics, 2016

87
Base: Respondents who have done these activities in the past, 2016 n=1,537
Q. (new in 2016) Which of the following activities, if any, do you feel guilty about doing? Please select all that
apply.
British
Colu
mbia
Alb
ert
a
Pra
irie
s
Onta
rio
Quebec
Atlantic
Vancouver
Calg
ary
Win
nip
eg
Toro
nto
Montr
eal
Halif
ax
18-3
4
years
35-5
5
years
>55 y
ears
Male
Fem
ale
Urb
an
(>100,0
00)
Mid
-siz
e
tow
ns/c
itie
s
Rura
l (<
1,0
00)
Hosing down your driveway or sidewalk 9 8 5 6 8 10 10 8 5 7 6 12 7 5 11 9 6 7 9 6
Allowing soapy water to run down a
storm drain12 10 9 10 9 12 12 7 9 11 6 17 11 9 12 11 10 11 10 9
Watering your lawn when it has just
rained / is raining / about to rain / during
a water ban/drought
3 3 0 1 3 2 3 3 0 1 6 2 2 3 1 2 2 2 1 1
Leaving the water running when brushing
your teeth or washing dishes31 40 32 38 45 42 29 40 33 38 43 43 40 43 31 29 48 39 39 38
Taking multiple showers per day 14 10 7 10 11 10 18 10 10 8 14 14 19 9 2 10 11 11 10 9
Flushing things down the toilet that
should be disposed of in another manner14 7 10 12 5 14 14 7 6 11 7 18 12 10 8 9 11 11 6 12
Shoveling snow from your property or
sidewalk onto the street4 10 10 4 9 5 4 11 9 4 9 6 6 7 4 6 6 7 5 5
None of these 38 39 47 40 33 36 36 40 45 40 32 30 32 36 51 46 31 36 40 46
REGION CITY AGE GENDERCOMMUNITY
SIZE
Feelings of guilt about activities done by Canadians (water-wasting), Demographics, 2016

88
Communicating on Water

89
Non-governmental organizations and conservation authorities are the most trusted to provide information about water quality and safety in Canada; government and media are among the least trusted
Trust in Information Provided about Water Quality and Safety in Canada, 2016
Base: All respondents 2016 n=2,194
Q. (new in 2016) How much do you trust each of the following to provide you with information about water
quality and safety in Canada?
35
39
38
39
44
48
52
51
32
30
31
32
31
28
26
28
25
24
24
18
18
13
15
9
8
7
7
11
7
11
7
12
Press and media
Federal government
Provincial government
Local utility
Municipal government
Third-party water quality testers
Non-governmental organizations such asenvironmental and social advocacy groups
Regional Watershed/ConservationAuthority
Trust (4+5) Middle (3) No trust (1+2) Not Applicable

90
Base: All respondents 2016 n=2,194
Q. (new in 2016) How much do you trust each of the following to provide you with information about water
quality and safety in Canada?
Level of Trust in Information Sources about Water Quality in Canada Demographics, 2016
British
Colu
mbia
Alb
ert
a
Pra
irie
s
Onta
rio
Quebec
Atlantic
Vancouver
Calg
ary
Win
nip
eg
Toro
nto
Montr
eal
Halif
ax
18-3
4
years
35-5
5
years
>55 y
ears
Male
Fem
ale
Urb
an
(>100,0
00)
Mid
-siz
e
tow
ns/c
itie
s
Rura
l (<
1,0
00)
Press and media 36 25 27 34 42 34 39 24 30 37 42 38 28 39 35 36 33 36 35 31
Non-governmental organizations such as
environmental and social advocacy
groups
50 40 45 53 56 56 51 35 45 58 55 57 52 51 52 51 52 51 57 46
Federal government 42 34 32 36 43 38 44 30 32 42 44 40 40 40 35 40 36 41 39 30
Provincial government 40 39 40 34 40 43 42 35 38 37 40 48 40 36 38 41 34 38 44 31
Municipal government 44 43 37 41 49 47 42 39 36 45 43 50 44 43 45 47 41 43 51 39
Third-party water quality testers 47 43 45 42 61 49 44 40 44 43 53 49 45 50 48 51 44 46 56 44
Local utility 43 38 35 35 48 41 45 37 34 39 44 42 38 39 42 41 38 40 45 33
Regional Watershed/Conservation
Authority54 42 49 52 54 48 52 40 48 50 49 51 45 51 56 52 50 49 55 52
REGION CITY AGE GENDERCOMMUNITY
SIZE

91
Municipality websites and information near the water are most-mentioned places where Canadians look to find information on the quality of water in beaches, lakes and rivers
Sources of Information about Water Quality, Total Mentions, 2016
Base: All respondents 2016 n=2,194
Q. (new in 2016) Where would you look to find information about water quality for beaches, lakes, or rivers?
36
29
25
24
19
18
17
15
5
10
Municipality website
At the beach/lake/river
Local television news
I don’t check recreational water quality in my area
Local newspapers
Regional Watershed/Conservation Authority
Environmental non-government organization(NGO) website
Local radio
Mobile application
Don't know

92 Base: All respondents 2016 n=2,194
Q. (new in 2016) Where would you look to find information about water quality for beaches, lakes, or rivers?
Where to Find Information About Water Quality, Demographics, 2016
British
Colu
mbia
Alb
ert
a
Pra
irie
s
Onta
rio
Quebec
Atlantic
Vancouver
Calg
ary
Win
nip
eg
Toro
nto
Montr
eal
Halif
ax
18-3
4
years
35-5
5
years
>55 y
ears
Male
Fem
ale
Urb
an
(>100,0
00)
Mid
-siz
e
tow
ns/c
itie
s
Rura
l (<
1,0
00)
Municipality website 37 37 29 37 37 35 36 40 30 35 36 43 41 36 32 34 39 38 36 33
Local television news 25 19 23 27 24 23 23 18 29 28 28 29 23 27 23 26 24 26 21 24
Local newspapers 21 16 19 19 20 17 18 16 22 16 21 22 21 16 20 18 20 19 19 20
Local radio 14 12 14 17 14 17 13 12 17 16 15 19 13 15 18 17 14 14 18 16
At the beach/lake/river (e.g., signal flags) 25 25 22 34 27 27 27 25 21 30 26 27 32 27 29 26 32 30 29 28
Regional Watershed/Conservation
Authority22 16 20 22 11 13 20 18 18 15 10 15 18 16 21 17 19 17 17 22
Environmental non-government
organization (NGO) website21 22 18 15 13 17 22 24 17 17 14 17 19 17 13 15 18 18 14 13
Mobile application 5 9 5 5 4 6 6 11 5 4 6 8 9 5 3 5 6 6 5 4
I don’t check recreational water quality in
my area26 29 27 22 22 26 26 30 24 19 17 20 21 21 30 24 24 23 21 28
Don’t know 11 10 9 8 12 10 11 7 11 11 14 6 8 12 9 10 10 10 11 8
REGION CITY AGE GENDERCOMMUNITY
SIZE

93
Methodology
• Sample of 2,194 Canadian adults from GMI’s consumer panel participated in an online survey between March 24 th
2016 – April 11th, 2016.
• Weighting was employed to balance demographics, to ensure that the sample’s composition reflects the adult
population according to Canadian census data, and to provide results intended to approximate the sample universe.
Results were weighted by gender, age, region, and community size. The sample includes a minimum of 200
respondents in each of Calgary, Montreal, Vancouver, and Winnipeg, and a minimum of 300 in Toronto. 178
interviews were completed in Halifax.
• Respondents for this survey were selected from among those who have volunteered to participate in GMI’s online
surveys and polls. The data have been weighted to reflect the demographic composition of the Canadian population.
Because the sample is based on those who initially self-selected for participation rather than a probability sample,
sampling error cannot be calculated. All sample surveys and polls may be subject to multiple sources of error,
including, but not limited to, sampling error, coverage error, and measurement error. The margin of error for a strict
probability sample for a sample of this size (n=2,194) would be plus or minus 2.2 percent 19 times out of 20.
Note to readers
• All figures in the charts and tables in this report are expressed in percentages, unless otherwise indicated. Total
percentages may not add to 100 because of rounding.
• “DK/NA” means that the respondent did not know the answer or that no answer was provided (Don’t know / No
answer).
• Question wording is provided at the bottom of each page.
• Where data are available, we provide tracking information from previous years using trend charts and tables.
Differences of +/- 5 percentage points between years are considered to be significant differences.

94
The survey questions and results reported herein are provided
on a confidential basis to RBC. RBC is free to use the findings
in whatever manner it chooses, including releasing them to the
public or media.
GlobeScan Incorporated subscribes to the standards of the
World Association of Opinion and Marketing Research
Professionals (ESOMAR). ESOMAR sets minimum disclosure
standards for studies that are released to the public or the
media. The purpose is to maintain the integrity of market
research by avoiding misleading interpretations. If you are
considering the dissemination of the findings, please consult
with us regarding the form and content of publication. ESOMAR
standards require us to correct any misinterpretation.
Project: 2860, GlobeScan®
May 2016
For more information, contact:
Eric Whan, Director, Sustainability
tel:416.969.3087
Gayle Chong, Senior Project Manager
tel: 647.831.6616
www.GlobeScan.com


![FIS for the RBC/RBC Handover...4.2.1.1 The RBC/RBC communication shall be established according to the rules of the underlying RBC-RBC Safe Communication Interface [Subset-098]. Further](https://img.dokumen.tips/doc/110x75/5e331307d520b57b5677b3fa/fis-for-the-rbcrbc-handover-4211-the-rbcrbc-communication-shall-be-established.jpg)