Embed Size (px)
Citation preview

2009Student Satisfaction Survey
(formerly the Fall Registration Survey)
Office of Institutional Analysis & Planning Kwantlen Polytechnic University
December 2009
http://www.kwantlen.ca/iap.html


page Executive Summary 7
Methodology 7Students' Background 7Choice of a postsecondary institution 7Factors influencing the decision to come to Kwantlen 8Predictors of satisfaction 10
Section 1: Responding Students' Background Information 11Domestic and International Status 11Primary campus 11Gender 11Age Group 12Hours per week students work at a paid job 12Course level 2009 academic year 12Program or major students are enrolled in 13Students' Ethnicity 14Age students learned to speak English 15Students' educational level 15Parents' educational level 15
Section 2: Enrollment 171. Choosing a postsecondary institution 17
First semester at Kwantlen 17Kwantlen as the first choice 17First choice postsecondary institution for students not choosing Kwantlen as their first choice 17
2. Factors influencing students' decision to come to Kwantlen 18Factors of MAJOR influence in the decision to come to Kwantlen 18Factors of MINOR influence in the decision to come to Kwantlen 18Factors of NO influence in the decision to come to Kwantlen 18Factors influencing students' decision to come to Kwantlen - detailed information 19
3. Educational plans at Kwantlen 20Credentials students are enrolled in 21Students' plans to complete credential at Kwantlen 21
Section 3: Course Registration Process 234. Courses students wanted to take but were unable to register for (fall 2009) 23
5. Reasons students could not register for the courses they wanted 24Reasons students could not register for the courses they wanted - by subject matter 25
6. Transfer credit process 30Attempted to transfer credits from other institutions 30
30Satisfaction with the transfer credit process 30Reasons for dissatisfaction with the transfer credit process 31
7. Preferred course delivery method 32
8. Preferred summer semester scheduling 32
Table of Contents
Time elapsed from when transfer credit process was applied for to receiving a response
Kwantlen Polytechnic University: Institutional Analysis Planning
2009 Student Satisfaction Survey (formerly Fall Registration Survey)
December 2009Table of Contents
3 of 59
page 9. Preferred campus 33
10. Preferred course scheduling times 33Preferred course scheduling times - detailed information 34
35
35
36Access to Educational Advisors is timely 36Educational Advisors are helpful 36Admissions staff are helpful in person 36Admissions staff are helpful on the phone 37Enrollment Services staff are helpful in person 37Enrollment Services staff are helpful on the phone 37Personnel in the Financial Awards office are helpful 38There is a good variety of courses 38All desired courses can be scheduled without timetable conflicts 38Class change (add/drop) polices are reasonable 39Tuition payment policies are reasonable 39Online course registration guide is easy to use 39Web registration process is easy to use 40Course registration information is readily available 40Course description in the online calendar are clear and accurate 40Program descriptions in the online calendar are clear and accurate 41Fee payment process is efficient 41Overall satisfaction with the course registration process at Kwantlen 41
Reasons for dissatisfaction with the course registration process at Kwantlen 42
43
Admissions staff as an information source 43Counsellors as an information source 43Educational Advisors as an information source 44Program faculty or staff as an information source 44Kwantlen website as an information source 44Kwantlen online calendar as an information source 44
Table of Contents
Ratings of sources of information available to students for the course registration process - detailed information
Ratings of aspects of student support available for the course registration process - detailed information
11. Ratings of aspects of student support services available for the course registration process
12. Ratings of sources of information available to students for the course registration process
Summary: Ratings of aspects of student support services available for the course registration process
Kwantlen Polytechnic University: Institutional Analysis Planning
2009 Student Satisfaction Survey (formerly Fall Registration Survey)
December 2009Table of Contents
4 of 59
page Section 4A: Students' Educational Experiences 45
13. Ratings of aspects of students' educational experiences at Kwantlen 4545
Ratings of aspects of students' educational experiences at Kwantlen - detailed information 45Courses have a good variety of assignments and projects 45Course materials are up-to-date and relevant 46Culturally diverse viewpoints are provided in courses 46Faculty are available after class and during office hours 46Faculty demonstrate care about my success as a student 47Faculty provide timely feedback about course work 47Kwantlen provides support to help students succeed 47Opportunities exist for expressing student concerns 48Opportunities exist to create social connections at Kwantlen 48Opportunities exist to talk to classmates about course materials 48Opportunities exist to study in another country 49Overall satisfaction with educational experiences at Kwantlen 49
Section 4B: Student Support Services 5114. Ratings of aspects of student support services at Kwantlen 51
51Rating of aspects of student support services at Kwantlen - detailed information 52
Start-up sessions held before course registration 52Student orientations held before classes start 52Convenience of student services hours 52Counselling Services 53Educational Advising Services 53Student Employment Services 53Tutoring help available in the Learning Centres 54Accessibility of computer labs 54Usefulness of myKwantlen web portal 54Computer technical assistance 55Adequacy of Library resources 55Adequacy of Library services 55Space available to meet or study with other students 56Space available to study on your own 56Learning materials in bookstores 56Recreational activities on campus 57Cafeteria operating hours (not Grassroots) 57Price of food in the cafeteria (not Grassroots) 57Quality of food provided by the cafeteria (not Grassroots) 58Overall satisfaction with student support services at Kwantlen 58
Reasons for dissatisfaction with student support services at Kwantlen 59
Table of Contents
Summary: Ratings of aspects of students' educaion experiences at Kwantlen
Summary: Ratings of aspects of student support services at Kwantlen
Kwantlen Polytechnic University: Institutional Analysis Planning
2009 Student Satisfaction Survey (formerly Fall Registration Survey)
December 2009Table of Contents
5 of 59

Kwantlen Polytechnic University: Institutional Analysis Planning
2009 Student Satisfaction Survey (formerly Fall Registration Survey)
December 2009Table of Contents
6 of 59

Fall�2009 64%Fall�2008 78%
Fall 75%
Executive Summary
Methodology
The eleventh annual Fall Student Satisfaction Survey (formerly the Fall Registration Survey) was conducted in October of 2009 and asked students various questions related to their selection of a postsecondary institution, their educational plans at Kwantlen, their course registration process, their educational experiences at Kwantlen, their experiences with student support services at Kwantlen, and their background/ demographic information.
As in previous years, there were two versions of the survey. One version collected information on the educational experiences of students at Kwantlen, while the other collected information on students’ experiences with student support services at Kwantlen. A total of 2,759 students completed the survey: 1,382 respondents for the version asking about students’ educational experiences and 1,377 respondents for the version asking about student support services.
Considerable revisions were made to the survey instrument this year. This process involved consultation with various areas throughout the university to ensure the questions being asked were relevant and appropriate. Another significant change was that the survey went from being a paper survey that students filled out in class to an online survey. However, trades students (with the exception of a few programs) were surveyed in class using a paper survey
Choice of a postsecondary institution
Sixty-four percent of Kwantlen survey respondents indicated Kwantlen was their first choice institution. This is 14 percentage points lower than the 2008 survey and 8 percentage points lower than the average for the last 3 years (72%).
The same proportion of new students (i.e., for whom fall 2009 was their first semester at Kwantlen) and returning
64%
78% 75%
Fall2009
Fall2008
Fall2007
Students indicating Kwantlen was their first choice postsecondary institution
(3 year trend)
Kwantlen Polytechnic University: Institutional Analysis Planning
2009 Student Satisfaction Survey (formerly Fall Registration Survey)
December 2009Exxecutive Summary
7 of 59
SFU 30%UBC 29%BCIT 10%SFU 30%UBC 29%BCIT 10%
few programs) were surveyed in class using a paper survey, since in the past trades students have been prone to not respond to online surveys.
The data in this report separated international and domestic students. For most sections or subsections, a summary data table or graph is presented at the beginning and is followed by the corresponding information presented in greater detail.
Students' Background
Kwantlen continues to have a student body that is representative of the ethnic composition of its community and that is primarily under the age of 25 (76%). The majority of students come from homes where the parents have at least some postsecondary education (61%) and either English is their first language (40%) or they learned English by the age of 5 (25%). Sixty-three percent of respondents were female and 37% were male, an over representation of females in the student body by 7%.
students (64%) stated that Kwantlen was their first choice postsecondary institution.
The top three postsecondary institutions identified by students not choosing Kwantlen as their first choice postsecondary institution were: SFU (30%), UBC (29%), and BCIT (10%). In previous years surveys, these were also the top 3 institutions identified by respondents.
64%
78% 75%
Fall2009
Fall2008
Fall2007
Students indicating Kwantlen was their first choice postsecondary institution
(3 year trend)
30% 29%
10%
SFU UBC BCIT
First choice postsecondary for students for whom Kwantlen was not their first choice
(fall 2009)
Kwantlen Polytechnic University: Institutional Analysis Planning
2009 Student Satisfaction Survey (formerly Fall Registration Survey)
December 2009Exxecutive Summary
7 of 59

Location 75%
Offers program 72%
Class size 57%
The majority of respondents (94%) indicated that if they had to do it again, they would enroll at Kwantlen, with virtually no difference between domestic and international students.
Of the students who indicated fall 2009 was their first semester at Kwantlen, 95% (n=815) indicated if they had to do it over again, they would enroll at Kwantlen, compared to 94% (n=1,740) who had been at Kwantlen more than one semester.
Of the students who indicated Kwantlen was their first choice postsecondary institution, 97% (n=1,637) stated that if they had to do it all over again, they would enroll at Kwantlen, compared to 90% (n=916) who indicated another institution was their first choice.
Students whose primary campus was Langley had the highest proportion indicating that if they had to do it over again, they would enroll at Kwantlen (96%, n=244). The figures for the other campuses were: 94% of Surrey students (n=1,348), 94% of Cloverdale students (n=79), and 95% of Richmond students (n=884).
Ninety-five percent of students indicating they plan to complete their credential at Kwantlen stated that if they had to do it over again, they would enroll at Kwantlen (n=2,089),
Executive Summary
Factors influencing the decision to come to Kwantlen
The top three factors all survey respondents identified as being a major influence in their decision to come to Kwantlen were: location (75%), offers program I want (72%) and class size (57%). These are the same top three factors for students choosing Kwantlen as their first choice postsecondary.
If you had to do it over again, would you enroll at Kwantlen?
75%72%
57%
Location Offers programI want
Class size
Top three factors influencing the decision of students to come to Kwantlen
Kwantlen Polytechnic University: Institutional Analysis Planning
2009 Student Satisfaction Survey (formerly Fall Registration Survey)
December 2009Exxecutive Summary
8 of 59
yes 94%
no 6%
If you had to do it over again, would
enroll at Kwantlen?
All students
International students
Domestic students
Yes 94.2% 94.8% 94.3%No 5.8% 5.2% 5.7%
Total respondents 2563 134 2408
to do it over again, they would enroll at Kwantlen (n=2,089), compared to 91% (n=426) of those who indicated they do not plan to complete their credential at Kwantlen.
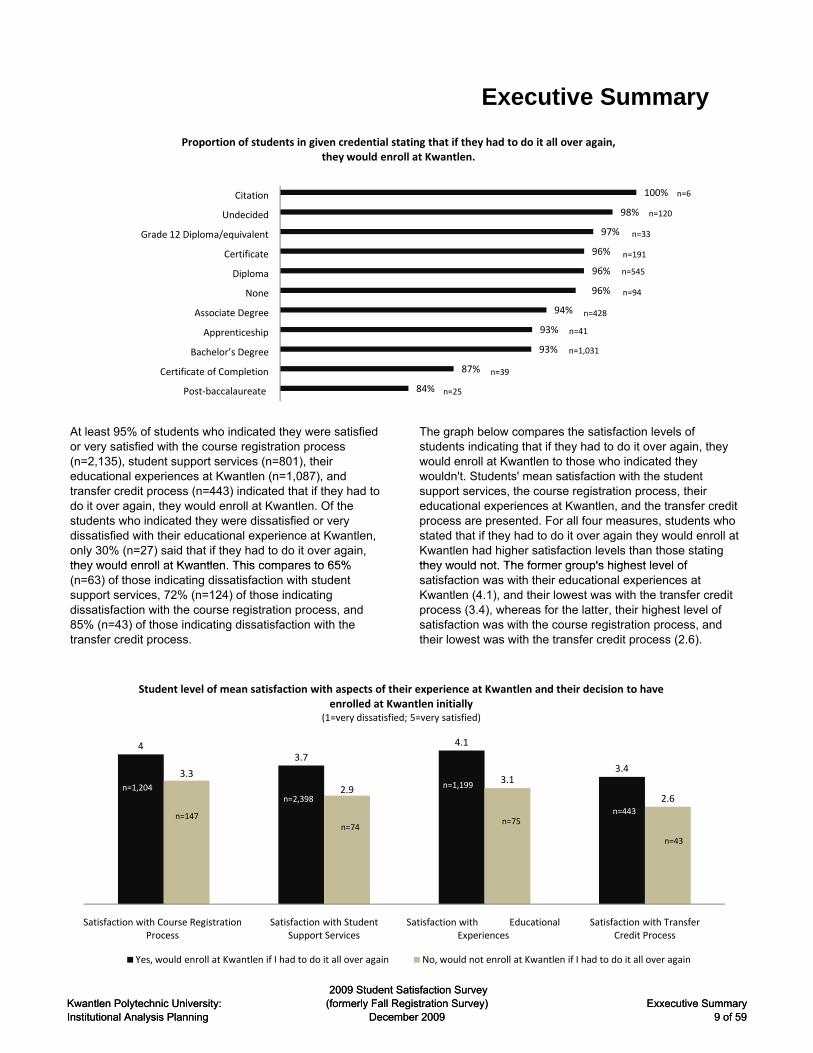
The graph that follows shows the full list of credentials students were enrolled in for fall 2009, and the proportion of those in a specific credential stating that if they had to do it all over again, they would enroll at Kwantlen. Of the students who indicated they were enrolled in a bachelor's degree, 93% (n=1,031) if they had to do it over again, they would enroll at Kwantlen. This compares to 96% in a diploma (n=545), 94% in an associate degree (n=428), and 93% in an apprenticeship program (n=41).
75%72%
57%
Location Offers programI want
Class size
Top three factors influencing the decision of students to come to Kwantlen
94%
6%
yes no
Kwantlen Polytechnic University: Institutional Analysis Planning
2009 Student Satisfaction Survey (formerly Fall Registration Survey)
December 2009Exxecutive Summary
8 of 59
n84% 2587% 3993% 103193% 4194% 42896% 9496% 54596% 19197% 3398% 120
100% 6
Executive Summary
CitationUndecided
Grade 12 Diploma/equivalentCertificateDiploma
NoneAssociate Degree
ApprenticeshipBachelor’s Degree
Certificate of CompletionPost-baccalaureate
The graph below compares the satisfaction levels of students indicating that if they had to do it over again, they would enroll at Kwantlen to those who indicated they wouldn't. Students' mean satisfaction with the student support services, the course registration process, their educational experiences at Kwantlen, and the transfer credit process are presented. For all four measures, students who stated that if they had to do it over again they would enroll at Kwantlen had higher satisfaction levels than those stating they would not The former group's highest level of
At least 95% of students who indicated they were satisfied or very satisfied with the course registration process (n=2,135), student support services (n=801), their educational experiences at Kwantlen (n=1,087), and transfer credit process (n=443) indicated that if they had to do it over again, they would enroll at Kwantlen. Of the students who indicated they were dissatisfied or very dissatisfied with their educational experience at Kwantlen, only 30% (n=27) said that if they had to do it over again, they would enroll at Kwantlen This compares to 65%
84%
87%
93%
93%
94%
96%
96%
96%
97%
98%
100%
Post‐baccalaureate
Certificate of Completion
Bachelor’s Degree
Apprenticeship
Associate Degree
None
Diploma
Certificate
Grade 12 Diploma/equivalent
Undecided
Citation
Proportion of students in given credential stating that if they had to do it all over again, they would enroll at Kwantlen.
n=6
n=120
n=428
n=33
n=191
n=545
n=94
n=41
n=1,031
n=39
n=25
Kwantlen Polytechnic University: Institutional Analysis Planning
2009 Student Satisfaction Survey (formerly Fall Registration Survey)
December 2009Exxecutive Summary
9 of 59
would not enroll
Satisfaction with Course Registration Process
4 3.3Satisfaction with Student Support Services 3.7 2.9Satisfaction with Educational Experiences 4.1 3.1Satisfaction with Transfer Credit Process 3.4 2.6
they would not. The former group's highest level of satisfaction was with their educational experiences at Kwantlen (4.1), and their lowest was with the transfer credit process (3.4), whereas for the latter, their highest level of satisfaction was with the course registration process, and their lowest was with the transfer credit process (2.6).
they would enroll at Kwantlen. This compares to 65% (n=63) of those indicating dissatisfaction with student support services, 72% (n=124) of those indicating dissatisfaction with the course registration process, and 85% (n=43) of those indicating dissatisfaction with the transfer credit process.
84%
87%
93%
93%
94%
96%
96%
96%
97%
98%
100%
Post‐baccalaureate
Certificate of Completion
Bachelor’s Degree
Apprenticeship
Associate Degree
None
Diploma
Certificate
Grade 12 Diploma/equivalent
Undecided
Citation
Proportion of students in given credential stating that if they had to do it all over again, they would enroll at Kwantlen.
n=6
n=120
n=428
n=33
n=191
n=545
n=94
n=41
n=1,031
n=39
n=25
43.7
4.1
3.43.3
2.93.1
2.6
Satisfaction with Course Registration Process
Satisfaction with Student Support Services
Satisfaction with Educational Experiences
Satisfaction with Transfer Credit Process
Student level of mean satisfaction with aspects of their experience at Kwantlen and their decision to have enrolled at Kwantlen initially
(1=very dissatisfied; 5=very satisfied)
Yes, would enroll at Kwantlen if I had to do it all over again No, would not enroll at Kwantlen if I had to do it all over again
n=1,204
n=74
n=2,398
n=147
n=1,199
n=75n=443
n=43
Kwantlen Polytechnic University: Institutional Analysis Planning
2009 Student Satisfaction Survey (formerly Fall Registration Survey)
December 2009Exxecutive Summary
9 of 59
The factors that were the best predictors of overall dissatisfaction with the transfer credit process were: the length of time it took to find out what credits transferred; the appropriate credit not being granted; not being informed of the transfer credit evaluation; receiving inaccurate or inconsistent information; errors being made in the evaluation; staff not being helpful; and, information about transfer credits not being readily available. Please note that no mean level of satisfaction is available for each of these factors.
Students identified in the open-ended comments several reasons why they would not enroll at Kwantlen again if they had to do it over again. Poor availability of courses across campuses and semester to semester and a burdensome process of transferring credits to and from Kwantlen were stated. Several respondents stated Kwantlen felt more like a high school than a university due to the quality or level of service received and the facilities not being conducive to creating a welcoming feeling for students. It was difficult to study on campus or hang around to make social connections. Furthermore, several comments were made regarding incorrect/inconsistent information and inadequate guidance being given to students related to academic matters as well as difficulty accessing Educational Advisors
Predictors of Satisfaction*
The factors that were the best predictors of overall satisfaction with the course registration process (with their corresponding mean value for all respondents) were: the ease of use of the web registration process (4.0); the ease of use of the online registration guide (3.9); the course information being readily available (3.9); the availability of a good variety of courses (3.8); the reasonableness of the tuition payment policies (3.7); the helpfulness of Educational Advisors (3.7); having timely access to Educational Advisors (3.5); and, the reasonableness of class change (add/drop) policies (3.5).
The factors that were the best predictors of overall satisfaction with students' educational experiences (with their corresponding mean value for all respondents) were: course materials are up-to-date and relevant (4.1); faculty demonstrate care about my success as a student (4.0); Kwantlen provides support to help students succeed (4.0); my courses have a good variety of assignments and projects (4.0); and, opportunities exist to create social connections at Kwantlen (3.6). The reasons stated in the open-ended comments for dissatisfaction with the educational experiences at Kwantlen primarily centred around lack of consistency in the quality of instructors and i d t il bilit
Executive Summary
Kwantlen Polytechnic University: Institutional Analysis Planning
2009 Student Satisfaction Survey (formerly Fall Registration Survey)
December 2009Exxecutive Summary
10 of 59
matters as well as difficulty accessing Educational Advisors.
*For the details of the statistical analysis conducted in this section, please contact the Office of Institutional Analysis and Planning.
inadequate course availability.
The factors that were the best predictors of overall satisfaction with student support services (with their corresponding mean value for all respondents) were: tutoring help available in the Learning Centres (3.8); Start-up sessions held before course registration (3.6); convenience of student services hours (3.6); and, Educational Advising Services (3.6).
Kwantlen Polytechnic University: Institutional Analysis Planning
2009 Student Satisfaction Survey (formerly Fall Registration Survey)
December 2009Exxecutive Summary
10 of 59

Domestic and International Status
All students
Survey Respond
ActualFall
International 5.2% International 5% 6%
Domestic 94.8% Domestic 95% 94%
Total respondents 2,564
Primary campusAll
studentsInt
studentsDom
studentsSurvey Respond
ActualFall
Responding Students' Background Information
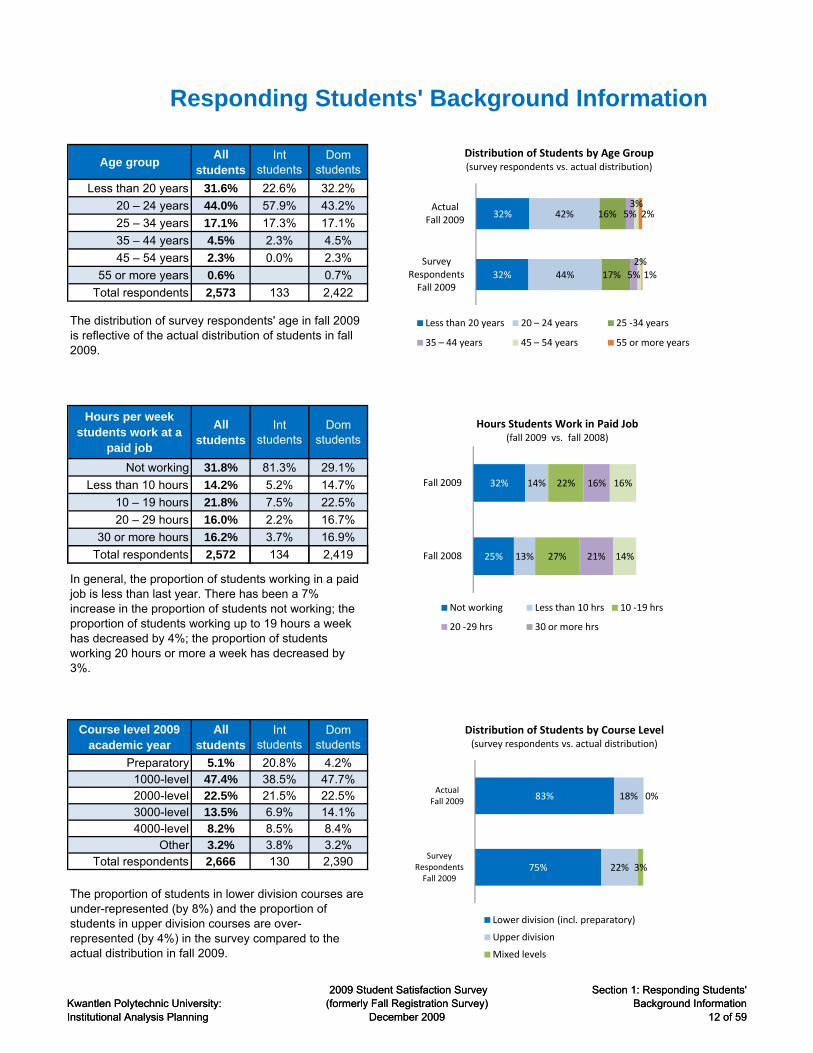
The proportion of domestic and international students who filled out the 2009 Fall Student Satisfaction Survey is representative of the actual distribution in fall 2009.
Students were asked several questions related to their background in order to obtain a profile of the student body. To ensure the representativeness of the survey respondents, students' international/domestic status, primary campus, gender, age, and course level in fall 2009 were compared to the data in Kwantlen's student database. The sample was congruent to the actual distribution of the students' international/domestic status and primary campus. However, female students were over-represented by 7 percentage points and lower division students were over-represented by 8 percentage points.
Additional information presented in this section includes: the number of hours a week that students work at a paid job, students' ethnicity, major/program of study, the age students learned to speak English, students' educational level and their parents' educational levels.
5%
6%
95%
94%
Survey RespondentsFall 2009
ActualFall 2009
Proportion of International &Domestic Students
(survey respondents vs. actual distribution)
International Domestic
Students by Campus(survey respondents vs. actual distribution)
Kwantlen Polytechnic University: Institutional Analysis Planning
2009 Student Satisfaction Survey (formerly Fall Registration Survey)
December 2009
Section 1: Responding Students'Background Information
11 of 59
pCloverdale 3.5% 2.2% 3.4% Cloverdale 4% 3%
Langley 9.5% 3.7% 9.8% Langley 10% 12%Richmond 34.7% 60.4% 33.1% Richmond 35% 33%
Surrey 52.3% 33.6% 53.7% Surrey 52% 52%Total respondents 2,635 134 2,421
Gender All
studentsInt
studentsDom
students Gender Survey Respond
Actual Fall
Male 37.4% 46.2% 36.8% Male 37% 44%
Female 62.6% 53.8% 63.2% Female 63% 56%
Total respondents 2,538 132 2,389
In general, the distribution of survey respondents by campus is representative of the actual distribution of students by campus in fall 2009.
Female students are over-represented and male students are under-represented by 7% in this survey. 37%
44%
63%
56%
Survey RespondentsFall 2009
Actual Fall 2009
Proportion of Male and Female Students(survey respondents vs. actual distribution)
Male Female
5%
6%
95%
94%
Survey RespondentsFall 2009
ActualFall 2009
Proportion of International &Domestic Students
(survey respondents vs. actual distribution)
International Domestic
4%
3%
10%
12%
35%
33%
52%
52%
Survey RespondentsFall 2009
ActualFall 2009
Students by Campus(survey respondents vs. actual distribution)
Cloverdale Langley Richmond Surrey
Kwantlen Polytechnic University: Institutional Analysis Planning
2009 Student Satisfaction Survey (formerly Fall Registration Survey)
December 2009
Section 1: Responding Students'Background Information
11 of 59
Age groupAll
studentsInt
studentsDom
studentsSurvey Respond
Actual Fall
Less than 20 years 31.6% 22.6% 32.2% Less than 20 years 32% 32%20 – 24 years 44.0% 57.9% 43.2% 20 – 24 44% 42%25 – 34 years 17.1% 17.3% 17.1% 25 -34 17% 16%35 – 44 years 4.5% 2.3% 4.5% 35 – 44 5% 5%45 – 54 years 2.3% 0.0% 2.3% 45 – 54 years 2% 3%
55 or more years 0.6% 0.7% 55 or more years 1% 2%Total respondents 2,573 133 2,422
Hours per week students work at a
paid job
All students
Int students
Dom students
Fall 2008
Fall 2009
Not working 31.8% 81.3% 29.1% Not working 25% 32%Less than 10 hours 14.2% 5.2% 14.7% Less than 10 hrs 13% 14%
10 – 19 hours 21.8% 7.5% 22.5% 10 -19 hrs 27% 22%20 – 29 hours 16.0% 2.2% 16.7% 20 -29 hrs 21% 16%
30 or more hours 16.2% 3.7% 16.9% 30 or more hrs 14% 16%Total respondents 2,572 134 2,419
The distribution of survey respondents' age in fall 2009 is reflective of the actual distribution of students in fall 2009.
Responding Students' Background Information
32%
32%
44%
42%
17%
16%
5%
5%
2%
3%
1%
2%
Survey RespondentsFall 2009
Actual Fall 2009
Distribution of Students by Age Group(survey respondents vs. actual distribution)
Less than 20 years 20 – 24 years 25 ‐34 years
35 – 44 years 45 – 54 years 55 or more years
25%
32%
13%
14%
27%
22%
21%
16%
14%
16%
Fall 2008
Fall 2009
Hours Students Work in Paid Job(fall 2009 vs. fall 2008)
Kwantlen Polytechnic University: Institutional Analysis Planning
2009 Student Satisfaction Survey (formerly Fall Registration Survey)
December 2009
Section 1: Responding Students'Background Information
12 of 59
Course level 2009 academic year
All students
Int students
Dom students
Survey Respond
ActualFall
Preparatory 5.1% 20.8% 4.2% Lower division (incl. p 75% 83%1000-level 47.4% 38.5% 47.7% Upper division 22% 18%2000-level 22.5% 21.5% 22.5% Mixed levels 3% 0%3000-level 13.5% 6.9% 14.1%4000-level 8.2% 8.5% 8.4%
Other 3.2% 3.8% 3.2%Total respondents 2,666 130 2,390
The proportion of students in lower division courses are under-represented (by 8%) and the proportion of students in upper division courses are over-represented (by 4%) in the survey compared to the actual distribution in fall 2009.
In general, the proportion of students working in a paid job is less than last year. There has been a 7% increase in the proportion of students not working; the proportion of students working up to 19 hours a week has decreased by 4%; the proportion of students working 20 hours or more a week has decreased by 3%.
75%
83%
22%
18%
3%
0%
Survey RespondentsFall 2009
ActualFall 2009
Distribution of Students by Course Level(survey respondents vs. actual distribution)
Lower division (incl. preparatory)
Upper division
Mixed levels
32%
32%
44%
42%
17%
16%
5%
5%
2%
3%
1%
2%
Survey RespondentsFall 2009
Actual Fall 2009
Distribution of Students by Age Group(survey respondents vs. actual distribution)
Less than 20 years 20 – 24 years 25 ‐34 years
35 – 44 years 45 – 54 years 55 or more years
25%
32%
13%
14%
27%
22%
21%
16%
14%
16%
Fall 2008
Fall 2009
Hours Students Work in Paid Job(fall 2009 vs. fall 2008)
Not working Less than 10 hrs 10 ‐19 hrs
20 ‐29 hrs 30 or more hrs
Kwantlen Polytechnic University: Institutional Analysis Planning
2009 Student Satisfaction Survey (formerly Fall Registration Survey)
December 2009
Section 1: Responding Students'Background Information
12 of 59

Program or major students are enrolled in
All students
Int students
Dom students
Program or major students are enrolled in
All students
Int students
Dom students
ABE/Qualifying Studies
0.7% 0.0% 0.6% Geography 0.5% 0.0% 0.5%
Accounting 11.7% 15.0% 11.6%Graphic Design for
Marketing0.8% 2.3% 0.7%
Anthropology 0.7% 0.0% 0.8%Health Unit
Coordinator0.3% 0.0% 0.2%
Applied Business Technology
0.1% 0.0% 0.1% History 1.6% 0.0% 1.7%
Applied Science/ Engineering
1.7% 1.5% 1.6%Home Support Resident Care
0.3% 0.0% 0.3%
Asian Studies 0.1% 0.0% 0.1% Horticulture 1.1% 1.5% 1.1%Bachelor of Technology
0.7% 3.0% 0.5%Integrated Pest
Management0.0% 0.0% 0.0%
Business Admin. 6.9% 15.0% 6.5%Interdisciplinary Design Studies
0.1% 0.0% 0.1%
Bus. Entrep. Leadership
0.3% 0.0% 0.3% Interior Design 0.9% 0.0% 1.0%
Business General 2.3% 3.8% 2.1% Journalism 1.0% 0.8% 1.0%Business HR 4.0% 4.5% 4.0% Legal Admin 0.3% 0.0% 0.3%
Business Mgmt. 4.0% 5.3% 4.0% Marketing 2.8% 3.0% 2.8%CADD 0.2% 0.0% 0.2% Math 0.4% 0.8% 0.3%
Canadian Studies 0.1% 0.0% 0.1% Modern Languages 0.2% 0.0% 0.2%Career Choices & Life
Success0.0% 0.0% 0.0% Music 0.7% 0.0% 0.8%
Responding Students' Background Information
Kwantlen Polytechnic University: Institutional Analysis Planning
2009 Student Satisfaction Survey (formerly Fall Registration Survey)
December 2009
Section 1: Responding Students'Background Information
13 of 59
Computer Information Systems
2.0% 6.8% 1.8%Nursing (includes
Psyc. Nursing)5.0% 1.5% 5.3%
Creative Writing 0.6% 0.0% 0.6% Philosophy 0.4% 0.0% 0.4%CRIM/Comm. Crim.
Justice7.2% 3.8% 7.3% Political Science 0.6% 0.0% 0.7%
Double Major – Arts 0.6% 0.0% 0.6%Psychology/Applied
Psyc.6.5% 2.3% 6.7%
Economics 0.4% 1.5% 0.3% Public Relations 0.7% 0.8% 0.7%
English 2.4% 0.8% 2.6%Public Safety
Communications0.1% 0.0% 0.1%
English Language Studies (ESL)
1.3% 12.8% 0.6% Sciences 5.8% 4.5% 6.0%
Environmental Protection Tech
0.5% 0.0% 0.5% SETA 2.3% 0.0% 2.5%
Farrier 0.1% 0.0% 0.1% Sociology 0.4% 0.0% 0.5%Fashion 2.8% 0.8% 2.9% Trades – Apprentice 1.8% 1.5% 1.9%
Fine Arts 1.2% 3.0% 1.0%Trades –
Entry level0.7% 0.0% 0.7%
GBTR 0.2% 0.0% 0.2% Trades - unspecified 0.3% 0.0% 0.2%General Arts 2.7% 0.0% 2.8% Other 0.4% 0.0% 0.4%
General Studies 8.5% 3.8% 8.8% Total respondents 2,711 133 2,421
Kwantlen Polytechnic University: Institutional Analysis Planning
2009 Student Satisfaction Survey (formerly Fall Registration Survey)
December 2009
Section 1: Responding Students'Background Information
13 of 59

Fall Fall Caucasian 45% 47%East Asian 19% 19%South Asian 17% 18%Other/Mixed ethnic 15% 9%Canadian Aboriginal 3% 1%Southeast Asian 2% 6%
Students' Race and Ethnicity
All students
Int students
Dom students
Caucasian 44.6% 5.2% 46.6%
Chinese/Taiwanese 17.9% 59.0% 15.7%
South Asian* 16.6% 14.2% 16.9%
Mixed ethnic origins 4.8% 2.2% 5.0%
Filipino 4.2% 0.7% 4.4%
Canadian Aboriginal 2.5% 0.0% 2.6%
Southeast Asian** 2 1% 5 2% 1 9%
Fall 2009
This table presents a detailed account of survey respondents' ethnicity. The largest proportion of respondents indicated they are Caucasian (45%) followed by Chinese/Taiwanese (18%) and South Asian* (17%). These results are very similar to last year's survey.
The majority of international students indicated they
Responding Students' Background Information
45%
19%17% 15%
3% 2%
47%
19% 18%
9%
1%6%
Caucasian East Asian South Asian Other/Mixed ethnic origins
Canadian Aboriginal Southeast Asian
Students' Ethnicity(fall 2009 vs. fall 2008)
Fall 2009 Fall 2008
Kwantlen Polytechnic University: Institutional Analysis Planning
2009 Student Satisfaction Survey (formerly Fall Registration Survey)
December 2009
Section 1: Responding Students'Background Information
14 of 59
Southeast Asian 2.1% 5.2% 1.9%
Latin American 1.4% 2.2% 1.3%West Central 1.3% 3.0% 1.2%
European 1.1% 0.0% 1.2%
African/Caribbean 1.0% 3.7% 0.9%
Korean 1.0% 3.0% 0.9%
Pacific Islander 0.4% 0.0% 0.5%
Japanese 0.4% 0.7% 0.4%
Other 0.7% 0.7% 0.7% *South Asian: Indian, Pakistani, Sri Lankan
Total Respondents 2,559 134 2,407 **Southeast Asian: Cambodian, Indonesian, Laotian, Vietnamese
Canadian Census catergories are used
The majority of international students indicated they are from China/Taiwan (59%) followed by South Asia* (14%).
Kwantlen Polytechnic University: Institutional Analysis Planning
2009 Student Satisfaction Survey (formerly Fall Registration Survey)
December 2009
Section 1: Responding Students'Background Information
14 of 59

Age students learned to speak
English
All students
Int students
Dom students
English is the only language learned
40.0% 7.5% 41.6%
Learned another language and English
by age of 524.5% 20.1% 24.8%
Learned another language first and
then English between ages 5-10
10.9% 17.9% 10.6%
Learned another language first, then
learned English between ages 11-15
6.9% 31.3% 5.5%
Learned another language first, then
learned English after age 15
3.9% 21.6% 3.0%
Learned English first, then another
13 9% 1 5% 14 5%
Responding Students' Background Information
The majority of Kwantlen students (78.4%) in fall 2009 spoke only English or English and another language by the age of five.
Nearly 53% of Kwantlen international students learned English after the age of 10, whereas 38% learned English by the age of 10.
Kwantlen Polytechnic University: Institutional Analysis Planning
2009 Student Satisfaction Survey (formerly Fall Registration Survey)
December 2009
Section 1: Responding Students'Background Information
15 of 59
language after the age of 5
13.9% 1.5% 14.5%
Total Respondents 2,578 134 2,425
Students' Educational Level
All students
Int students
Dom students
Parents' Educational Level for all Mother Father
Less than gr. 10 0.4% 1.5% 0.4% Less than gr. 10 6.9% 6.8%
Completed gr. 10 0.3% 0.0% 0.3% Completed gr. 10 3.6% 4.2%
Completed gr. 11 0.6% 0.0% 0.7% Completed gr. 11 2.5% 2.7%
Completed gr. 12 33.0% 42.9% 32.4% Completed gr. 12 25.3% 20.4%Some college/ university level 38.4% 27.8% 39.1%
Some college/ university level 14.6% 11.4%
College level (cert. or dip.)
18.3% 15.0% 18.5%College level (cert. or dip.)
18.6% 12.2%
Trades Certification 1.2% 0.8% 1.2% Trades Certification 1.5% 8.9%
Bachelors Degree 5.9% 10.5% 5.7% Bachelors Degree 17.1% 16.7%
Post-grad Degree (Master or Ph.D.)
0.5% 0.8% 0.5%Post-grad Degree (Master or Ph.D.)
5.1% 8.8%
Professional Degree (MD, LLB, P.Eng.)
0.2% 0.0% 0.2%Professional Degree
(MD, LLB, P.Eng.)2.1% 4.2%
Other 1.0% 0.8% 1.0% Other 2.7% 3.6%
Total Respondents 2,558 133 2,407 Total Respondents 2,526 2,519
Kwantlen Polytechnic University: Institutional Analysis Planning
2009 Student Satisfaction Survey (formerly Fall Registration Survey)
December 2009
Section 1: Responding Students'Background Information
15 of 59

Kwantlen Polytechnic University: Institutional Analysis Planning
2009 Student Satisfaction Survey (formerly Fall Registration Survey)
December 2009
Section 1: Responding Students'Background Information
16 of 59Kwantlen Polytechnic University: Institutional Analysis Planning
2009 Student Satisfaction Survey (formerly Fall Registration Survey)
December 2009
Section 1: Responding Students'Background Information
16 of 59

1. Choosing a postsecondary institution
First semester at Kwantlen
All students
Int students
Dom students
Yes 32.5% 39.6% 31.6%
No 67.5% 60.4% 68.4%
Total respondents 2,745 134 2,422
Kwantlen was the first choice
t d
All students
Int students
Dom students
Yes 64.2% 57.5% 64.6%No 35.8% 42.5% 35.4%
Total respondents 2,742 134 2,418
First choice postsecondary institution for students not
choosing Kwantlen as their first choice
All students
Int students
Dom students
SFU 30 3% 40 4% 29 7%
Enrollment
Nearly one-third of respondents indicated it was their first semester at Kwantlen, unchanged from the previous year's survey. However, there is an increase in the proportion of international students indicating it's their first semester at Kwantlen, 30% in 2008 compared to 39.6% increase in 2009.
The proportion of students indicating Kwantlen was their first choice postsecondary institution dropped from 78% in 2008 to 64% in 2009. This number also dropped for international students, from 73% in 2008 to 58% in 2009.
F t d t i di ti th t K tl t th i fi t
In this section information regarding students choosing Kwantlen, factors influencing their decision to come to Kwantlen, credentials they are enrolled in, and their intent on completing their credential at Kwantlen are presented.
Kwantlen Polytechnic University: Institutional Analysis Planning
2009 Student Satisfaction Survey (formerly Fall Registration Survey)
December 2009Section 2: Enrollment
17 of 59
SFU 30.3% 40.4% 29.7%
UBC 29.3% 28.1% 28.9%
BCIT 9.9% 3.5% 10.6%
Other 8.5% 12.3% 8.3%
Langara College 4.6% 0.0% 5.1%
UVIC 3.8% 7.0% 3.5%
University of the Fraser Valley
3.3% 0.0% 3.5%
Douglas College 3.3% 3.5% 3.2%
Capilano University 1.3% 1.8% 1.3%
Emily Carr University 1.2% 1.8% 1.3%
Private Institution 1.1% 0.0% 1.3%
Vancouver Community College
1.0% 0.0% 1.1%
TRU 0.7% 1.8% 0.7%
Trinity Western 0.6% 0.0% 0.6%
Ryerson 0.6% 0.0% 0.7%
Art Institute 0.2% 0.0% 0.2%
Total respondents 965 57 848
For students indicating that Kwantlen was not their first choice postsecondary institution, the top three choices were: SFU (20%), UBC (29%), and BCIT (10%). The top three choices for international students in 2009 were UBC (40%), SFU (28%), and other (12%).
In last year's survey, the top three choices identified by respondents were UBC (26%), SFU (24%), and BCIT (13%). International students' top three choices were UBC (33%), SFU (24%), and other (19%) in 2008.
(In 2008, only 457 students answered this question compared to 965 students in 2009).
Kwantlen Polytechnic University: Institutional Analysis Planning
2009 Student Satisfaction Survey (formerly Fall Registration Survey)
December 2009Section 2: Enrollment
17 of 59

2. Factors influencing students' decision to come to Kwantlen
75.1% 2,72072.1% 2,70656.8% 2,71250.5% 2,697
48.2% 2,697
31.8% 2,695
30.6% 2,698
28.3% 1,343
28.3% 2,695
23.3% 2,694
20.0% 2,684
18.5% 2,677
17.0% 2,685
10.0% 2,687
9.1% 2,675
3.1% 2,686
The factors that more than 50% of students identified as being a major influence in their decision to come to Kwantlen were: location (75%), desired program being offered (72%), class size (57%), and easy to get accepted (51%).
The factors that more than 50% of students identified as having no influence in their decision to come to Kwantlen were: reputation of athletics programs (86%), not accepted by first choice institution (79%), friends are attending Kwantlen (56%), and co-op option available (54%).
In the previous year's survey, the top three factors identified as being important factors in the decision to enroll at Kwantlen were: selection of programs, affordable tuition fees, and close to home. (Note the rating method used changed in 2009, and response options were added or slightly modified.)
The following page provides a detailed break out of each factor influencing students' decision to come to Kwantlen.
"n" represents the number of students who identified whether a specific factor was of major, minor or no influence in their decision to come to Kwantlen.
Factors of MAJOR influence in the decision to come to Kwantlen
n
Factors of MINOR influence in the Factors of NO influence in the decision to
Reputation of institution
Encouraged by family, friends or employer
Stepping stone to another university
Helpfulness of student services staff
Program I want difficult to get into elsewhere
Co-op option available
Location
Tuition fees
Offers the program I wantClass size
Easy to get accepted
Reputation of athletics program
Friends are attending Kwantlen
Availability of scholarships/bursaries
Not accepted by first choice institution
Reputation of program
Enrollment
Kwantlen Polytechnic University: Institutional Analysis Planning
2009 Student Satisfaction Survey (formerly Fall Registration Survey)
December 2009Section 2: Enrollment
18 of 59
42.0% 1,343 85.7% 2,686
42.0% 2,695 79.4% 2,675
35.8% 2,698 60.0% 2,687
34.0% 2,694 55.5% 2,685
33.7% 2,697 53.8% 2,677
32.6% 2,697 49.0% 2,684
32.6% 2,695 42.8% 2,694
31.0% 2,684 35.5% 2,695
30.4% 2,687 33.6% 2,698
28.5% 2,712 29.7% 1,343
27.8% 2,677 29.7% 2,695
27.5% 2,685 18.1% 2,697
20.9% 2,706 17.0% 2,697
14.7% 2,720 14.7% 2,712
11.5% 2,675 10.1% 2,720
11.2% 2,686 7.0% 2,706
Availability of scholarships/bursaries
nFactors of MINOR influence in the
decision to come to Kwantlen Factors of NO influence in the decision to
come to Kwantlenn
Helpfulness of student services staff
Reputation of program
Encouraged by family, friends or employer
Offers the program I want
Location
Stepping stone to another university
Friends are attending Kwantlen
Reputation of athletics Offers the program I want
Tuition fees
Easy to get accepted
Class size
Location
Not accepted by first choice institution
Reputation of institution Reputation of athletics program
Friends are attending Kwantlen
Co-op option availableProgram I want difficult to get into
elsewhere
Stepping stone to another university
Encouraged by family, friends or employer
Helpfulness of student services staff
Tuition fees
Easy to get accepted
Not accepted by first choice institution
Reputation of program
Program I want difficult to get into elsewhere
Availability of scholarships and bursaries
Class size
Co-op option available
Reputation of institution
Kwantlen Polytechnic University: Institutional Analysis Planning
2009 Student Satisfaction Survey (formerly Fall Registration Survey)
December 2009Section 2: Enrollment
18 of 59
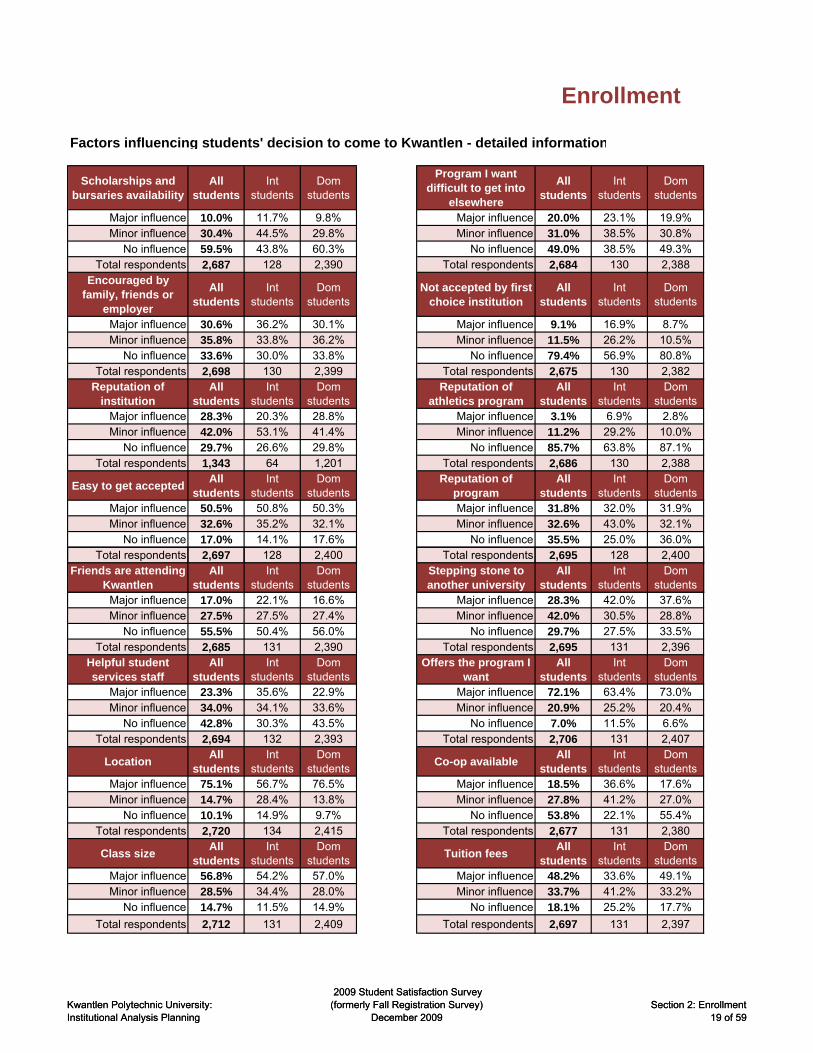
Factors influencing students' decision to come to Kwantlen - detailed information
Scholarships and bursaries availability
All students
Int students
Dom students
Program I want difficult to get into
elsewhere
All students
Int students
Dom students
Major influence 10.0% 11.7% 9.8% Major influence 20.0% 23.1% 19.9%Minor influence 30.4% 44.5% 29.8% Minor influence 31.0% 38.5% 30.8%
No influence 59.5% 43.8% 60.3% No influence 49.0% 38.5% 49.3%Total respondents 2,687 128 2,390 Total respondents 2,684 130 2,388
Encouraged by family, friends or
employer
All students
Int students
Dom students
Not accepted by first choice institution
All students
Int students
Dom students
Major influence 30.6% 36.2% 30.1% Major influence 9.1% 16.9% 8.7%Minor influence 35.8% 33.8% 36.2% Minor influence 11.5% 26.2% 10.5%
No influence 33.6% 30.0% 33.8% No influence 79.4% 56.9% 80.8%Total respondents 2,698 130 2,399 Total respondents 2,675 130 2,382
Reputation of institution
All students
Int students
Dom students
Reputation of athletics program
All students
Int students
Dom students
Major influence 28.3% 20.3% 28.8% Major influence 3.1% 6.9% 2.8%Minor influence 42.0% 53.1% 41.4% Minor influence 11.2% 29.2% 10.0%
No influence 29.7% 26.6% 29.8% No influence 85.7% 63.8% 87.1%Total respondents 1,343 64 1,201 Total respondents 2,686 130 2,388
Easy to get acceptedAll
studentsInt
studentsDom
studentsReputation of
programAll
studentsInt
studentsDom
studentsMajor influence 50.5% 50.8% 50.3% Major influence 31.8% 32.0% 31.9%Minor influence 32.6% 35.2% 32.1% Minor influence 32.6% 43.0% 32.1%
No influence 17.0% 14.1% 17.6% No influence 35.5% 25.0% 36.0%Total respondents 2,697 128 2,400 Total respondents 2,695 128 2,400
Enrollment
Kwantlen Polytechnic University: Institutional Analysis Planning
2009 Student Satisfaction Survey (formerly Fall Registration Survey)
December 2009Section 2: Enrollment
19 of 59
Friends are attending Kwantlen
All students
Int students
Dom students
Stepping stone to another university
All students
Int students
Dom students
Major influence 17.0% 22.1% 16.6% Major influence 28.3% 42.0% 37.6%Minor influence 27.5% 27.5% 27.4% Minor influence 42.0% 30.5% 28.8%
No influence 55.5% 50.4% 56.0% No influence 29.7% 27.5% 33.5%Total respondents 2,685 131 2,390 Total respondents 2,695 131 2,396
Helpful student services staff
All students
Int students
Dom students
Offers the program I want
All students
Int students
Dom students
Major influence 23.3% 35.6% 22.9% Major influence 72.1% 63.4% 73.0%Minor influence 34.0% 34.1% 33.6% Minor influence 20.9% 25.2% 20.4%
No influence 42.8% 30.3% 43.5% No influence 7.0% 11.5% 6.6%Total respondents 2,694 132 2,393 Total respondents 2,706 131 2,407
LocationAll
studentsInt
studentsDom
studentsCo-op available
All students
Int students
Dom students
Major influence 75.1% 56.7% 76.5% Major influence 18.5% 36.6% 17.6%Minor influence 14.7% 28.4% 13.8% Minor influence 27.8% 41.2% 27.0%
No influence 10.1% 14.9% 9.7% No influence 53.8% 22.1% 55.4%Total respondents 2,720 134 2,415 Total respondents 2,677 131 2,380
Class sizeAll
studentsInt
studentsDom
studentsTuition fees
All students
Int students
Dom students
Major influence 56.8% 54.2% 57.0% Major influence 48.2% 33.6% 49.1%Minor influence 28.5% 34.4% 28.0% Minor influence 33.7% 41.2% 33.2%
No influence 14.7% 11.5% 14.9% No influence 18.1% 25.2% 17.7%
Total respondents 2,712 131 2,409 Total respondents 2,697 131 2,397
Kwantlen Polytechnic University: Institutional Analysis Planning
2009 Student Satisfaction Survey (formerly Fall Registration Survey)
December 2009Section 2: Enrollment
19 of 59

3. Educational plans at Kwantlen
Educational plans at Kwantlen
All students
Int students
Dom students
Plan to complete a full program at Kwantlen
to prepare for specific occupation or job
53.8% 47.4% 54.6%
Plan to complete only some courses (or a partial program) at
Kwantlen to prepare to transfer to another
institution
26.7% 26.3% 26.7%
Plan to complete a full program at Kwantlen
to get a general academic education (e.g., general arts or
sciences)
10.6% 12.8% 10.3%
Plan to complete specific courses (or a
partial program) at Kwantlen for
continuing professional 4.5% 7.5% 4.3%
Enrollment
The majority of respondents (54%) indicated they plan to complete a full program at Kwantlen to prepare them for a specific occupation or job. The proportion of respondents selecting this as their main educational goal at Kwantlen has increased in the last few years from 22% in 2007 to 51% in 2008.
The second most selected option by respondents was that they plan to complete some courses or a partial program at Kwantlen to transfer to another institution. This was the second most selected option in 2008 as well. However, the proportion of respondents selecting this option has steadily decreased from 42% in 2007, 31% in 2008, to 27% in 2009.
Together the above indicates that an increasing proportion of students are choosing to stay at Kwantlen to complete their studies.
Furthermore, in 2009, nearly 80% of the 1,076 students indicating they intend on completing a bachelor's degree stated they plan to complete their full program at Kwantlen.
(Note: Response options were slightly modified in the 2009 survey )
Kwantlen Polytechnic University: Institutional Analysis Planning
2009 Student Satisfaction Survey (formerly Fall Registration Survey)
December 2009Section 2: Enrollment
20 of 59
co t u g p o ess o adevelopment in my
field (i.e., to improve my job related skills)
Plan to complete courses at Kwantlen
only for personal enjoyment or improvement
2.7% 4.5% 2.5%
*Complete program and attend grad school
0.4% 0.0% 0.5%
*Complete full program (Cert, Dip, Degree,
etc.)0.3% 0.0% 0.2%
*Complete full program, then transfer
0.2% 0.0% 0.2%
*Exchange student at Kwn for a short time
0.1% 1.5% 0.0%
Other 0.6% 0.0% 0.5%Total respondents 2,726 133 2,423
*Categories generated from open-ended student responses.
2009 survey.)
Kwantlen Polytechnic University: Institutional Analysis Planning
2009 Student Satisfaction Survey (formerly Fall Registration Survey)
December 2009Section 2: Enrollment
20 of 59

Credentials students are enrolled in
All students
Int students
Dom students
Citation 0%Bachelor’s Degree 39.9% 27.1% 40.9% Post-bac Certificate/Dip 1%
Diploma 21.3% 38.3% 20.6% Grade 12 Diploma/equi 1%Associate Degree 16.7% 8.3% 17.1% Certificate of Completio 2%
Certificate 7.7% 4.5% 7.8% Apprenticeship 2%Undecided 4.8% 6.8% 4.6% None 4%
None 3.8% 4.5% 3.6% Undecided 5%Apprenticeship 1.8% 1.5% 1.8% Certificate 8%
Certificate of Completion
1.5% 2.3% 1.4%Associate Degree 17%
Grade 12 Diploma/equivalent
1.3% 3.0% 1.1%Diploma 21%
Post-bac Certificate/Diploma
1.0% 3.8% 0.8%Bachelor's Degree 40%
Citation 0.2% 0.0% 0.2%Total respondents 2,705 133 2,421
Planning to complete credential at
Kwantlen
All students
Int students
Dom students Fall
2008Fall 2009
Yes 82.9% 79.4% 83.5% Yes 81% 83%No 17.1% 20.6% 16.5% No 19% 17%
Total respondents 2,662 131 2,381
Enrollment
0%
1%
1%
2%
2%
4%
5%
8%
17%
21%
40%
Citation
Post‐bac Certificate/Diploma
Grade 12 Diploma/equivalent
Certificate of Completion
Apprenticeship
None
Undecided
Certificate
Associate Degree
Diploma
Bachelor's Degree
Credentials Students are Enrolled In
83% 17%Fall 2009
Planning to Complete Credential at Kwantlen
Kwantlen Polytechnic University: Institutional Analysis Planning
2009 Student Satisfaction Survey (formerly Fall Registration Survey)
December 2009Section 2: Enrollment
21 of 59
p ,
The proportion of respondents indicating they intend on completing their credential at Kwantlen increased by 2% from last year to 83%.
Eighty-three percent of students indicating they are enrolled in a bachelor's degree stated they intend on completing this credential at Kwantlen (a 3% increase from 2008). This compares to 80% of students enrolled in an associate degree, 95% enrolled in a certificate, and 92% enrolled in a diploma in 2009.
0%
1%
1%
2%
2%
4%
5%
8%
17%
21%
40%
Citation
Post‐bac Certificate/Diploma
Grade 12 Diploma/equivalent
Certificate of Completion
Apprenticeship
None
Undecided
Certificate
Associate Degree
Diploma
Bachelor's Degree
Credentials Students are Enrolled In
81%
83%
19%
17%
Fall 2008
Fall 2009
Planning to Complete Credential at Kwantlen
Yes No
Kwantlen Polytechnic University: Institutional Analysis Planning
2009 Student Satisfaction Survey (formerly Fall Registration Survey)
December 2009Section 2: Enrollment
21 of 59

Kwantlen Polytechnic University: Institutional Analysis Planning
2009 Student Satisfaction Survey (formerly Fall Registration Survey)
December 2009Section 2: Enrollment
22 of 59Kwantlen Polytechnic University: Institutional Analysis Planning
2009 Student Satisfaction Survey (formerly Fall Registration Survey)
December 2009Section 2: Enrollment
22 of 59

4. Courses students wanted to take but were unable to register for (fall 2009)
Accounting(Choose all that apply)
All students
Int students
Dom students
All students
Dom students
Preparatory 10.4% 22.2% 8.5% 11.7% 25.0% 11.1%1000-level 33.2% 44.4% 31.6% 55.8% 31.3% 58.5%2000-level 17.6% 11.1% 18.4% 34.5% 31.3% 34.5%3000-level 33.6% 14.8% 36.3% 12.7% 12.5%4000-level 21.2% 7.4% 23.6% 9.1% 6.3% 9.9%
Total respondents 250 27 212 196 16 171
Biology(Choose all that apply)
All students
Int students
Dom students
All students
Int students
Dom students
Preparatory 13.6% 31.3% 12.7% 31.0% 35.7% 30.0%1000-level 64.7% 31.3% 66.9% 55.8% 35.7% 58.9%2000-level 23 4% 25 0% 23 6% 15 9% 21 4% 13 3%
For various subject matters, students were asked to identify the course level(s) they were not able to register for and the reasons why they were unable to register for a particular subject. The greatest proportion of respondents indicated they were unable to register in 1000 level courses. The course levels with the highest proportion of students indicating they were unable to register are highlighted for each subject matter in the tables in this section.
In this section, information is presented regarding: students' ability to register for desired courses and the reasons why they were unable to register for a desired course; their experience with the transfer credit process; their preferred course delivery format and scheduling; campus of preference; and ratings of the various forms of student support and information sources available to them during the course registration process.
Chemistry(Choose all that apply)
Preparatory1000-level2000-level
Course Registration Process
Total respondents4000-level3000-level2000-level1000-level
Preparatory
Criminology(Choose all that apply)
Kwantlen Polytechnic University: Institutional Analysis Planning
2009 Student Satisfaction Survey (formerly Fall Registration Survey)
December 2009
Section 3:Course Registration Process
23 of 59
2000-level 23.4% 25.0% 23.6% 15.9% 21.4% 13.3%3000-level 2.2% 6.3% 1.9% 0.9% 0.0% 0.0%4000-level 2.2% 6.3% 1.9% 2.7% 7.1% 1.1%
Total respondents 184 16 157 113 14 90
Business(Choose all that apply)
All students
Int students
Dom students
All students
Int students
Dom students
Preparatory 5.9% 16.7% 5.0% 16.6% 22.5% 16.6%1000-level 29.7% 30.0% 32.2% 68.8% 57.5% 69.7%2000-level 32.4% 36.7% 35.6% 12.7% 12.4%3000-level 25.8% 13.3% 29.7% 5.8% 10.0% 4.9%4000-level 16.0% 13.3% 18.4% 2.8% 2.5% 2.9%
Total respondents 306 30 239 362 40 307
Math(Choose all that apply)
All students
Int students
Dom students
All students
Int students
Dom students
Preparatory 22.2% 20.7% 22.4% 8.8% 15.8% 8.3%1000-level 61.6% 51.7% 62.7% 49.5% 47.4% 49.4%2000-level 16.3% 24.1% 14.9% 27.1% 21.1% 27.2%3000-level 3.4% 2.5% 19.3% 15.8% 20.4%4000-level 2.5% 3.4% 1.9% 10.5% 5.3% 11.3%
Total respondents 228 29 161 295 19 265
2000-level3000-level4000-level
Total respondents
English(Choose all that apply)
Preparatory1000-level2000-level3000-level4000-level
Total respondents
Psychology(Choose all that apply)
Preparatory1000-level2000-level3000-level4000-level
Total respondents
Kwantlen Polytechnic University: Institutional Analysis Planning
2009 Student Satisfaction Survey (formerly Fall Registration Survey)
December 2009
Section 3:Course Registration Process
23 of 59
Physics(Choose all that apply)
All students
Int students
Dom students
All students
Int students
Dom students
Preparatory 27.7% 26.3% 27.1% 12.4% 25.0% 11.6%1000-level 61.7% 52.6% 62.9% 56.4% 50.0% 57.4%2000-level 9.6% 15.8% 7.1% 25.8% 8.3% 27.5%3000-level 4.3% 10.5% 1.4% 16.7% 16.7% 15.9%4000-level 3.2% 5.3% 1.4% 12.4% 8.3% 12.7%
Total respondents 94 19 70 275 12 251
5. Reasons students could not register for the courses they wanted
Other 636Bus 522English 439Accoun 437Psych 395Crim 329
Biology 219Math 202Physics 122Chem 118
Course Registration Process
2000-level1000-level
Preparatory
Other(Choose all that apply)
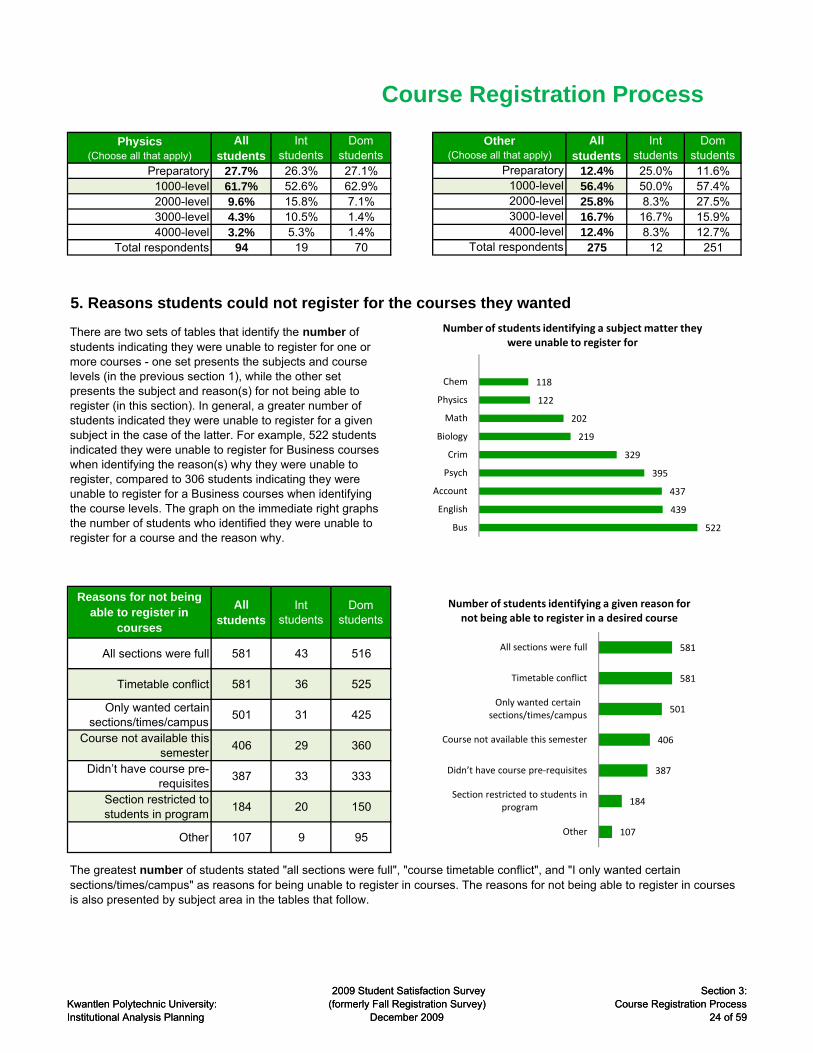
There are two sets of tables that identify the number of students indicating they were unable to register for one or more courses - one set presents the subjects and course levels (in the previous section 1), while the other set presents the subject and reason(s) for not being able to register (in this section). In general, a greater number of students indicated they were unable to register for a given subject in the case of the latter. For example, 522 students indicated they were unable to register for Business courses when identifying the reason(s) why they were unable to register, compared to 306 students indicating they were unable to register for a Business courses when identifying the course levels. The graph on the immediate right graphs the number of students who identified they were unable to register for a course and the reason why.
3000-level
Total respondents4000-level
522
439
437
395
329
219
202
122
118
Bus
English
Account
Psych
Crim
Biology
Math
Physics
Chem
Number of students identifying a subject matter they were unable to register for
Kwantlen Polytechnic University: Institutional Analysis Planning
2009 Student Satisfaction Survey (formerly Fall Registration Survey)
December 2009
Section 3:Course Registration Process
24 of 59
Reasons for not being able to register in
courses
All students
Int students
Dom students
All sections were full 581 43 516
Timetable conflict 581 36 525
Only wanted certain sections/times/campus
501 31 425
Course not available this semester
406 29 360
Didn’t have course pre-requisites
387 33 333
Section restricted to students in program
184 20 150
Other 107 9 95
The greatest number of students stated "all sections were full", "course timetable conflict", and "I only wanted certain sections/times/campus" as reasons for being unable to register in courses. The reasons for not being able to register in courses is also presented by subject area in the tables that follow.
581
581
501
406
387
184
107
All sections were full
Timetable conflict
Only wanted certain sections/times/campus
Course not available this semester
Didn’t have course pre‐requisites
Section restricted to students in program
Other
Number of students identifying a given reason for not being able to register in a desired course
522
439
437
395
329
219
202
122
118
Bus
English
Account
Psych
Crim
Biology
Math
Physics
Chem
Number of students identifying a subject matter they were unable to register for
Kwantlen Polytechnic University: Institutional Analysis Planning
2009 Student Satisfaction Survey (formerly Fall Registration Survey)
December 2009
Section 3:Course Registration Process
24 of 59

Reasons students could not register for the courses they wanted - by subject matter
Accounting(choose all that apply)
All students
Int students
Dom students
Course timetable conflict 20.3% 19.4% 20.2%
All sections were full 19.3% 23.3% 18.8%
I wanted only certain sections/times/campus
16.0% 16.1% 17.2%
Course not available this semester
15.5% 20.7% 15.0%
Other 10.3% 22.2% 9.5%
Didn’t have course pre-requisites
10.1% 15.2% 9.6%
Section restricted to students in program
7.6% 20.0% 6.7%
Total respondents 437 n/a n/a
Biology(choose all that apply)
All students
Int students
Dom students
Section restricted to students in program
22.3% 5.0% 26.0%
All sections were full 9.8% 7.0% 9.7%
Course Registration Process
Course timetable conflict (20%) and all sections being full (19%) were the top two reasons identified by students for not being able to register in Accounting classes. A total of 437 students indentified one or more reasons for not being able to register in an Accounting class. This number is greater than the 250 who indicated they were unable to register in an Accounting class by level (prepatory to 4000 level) on page 23 of this section.
Section restricted to students in a specific program (22%) and all sections being full (10%) were the top two reasons identified by students for not being able to register in Biology classes. A total of 219 students identified one or
f b i bl i i Bi l
Kwantlen Polytechnic University: Institutional Analysis Planning
2009 Student Satisfaction Survey (formerly Fall Registration Survey)
December 2009
Section 3:Course Registration Process
25 of 59
Didn’t have course pre-requisites
8.0% 15.2% 7.2%
Course not available this semester
7.6% 10.3% 7.8%
Course timetable conflict 5.3% 5.6% 5.3%
Other 4.7% 11.1% 4.2%
Only wanted certain sections/times/ campus
4.6% 6.5% 4.7%
Total respondents 219 n/a n/a
more reasons for not being able to register in a Biology class. This number is greater than the 184 who indicated they were unable to register in a Biology class by level (prepatory to 4000 level) on page 23 of this section.
Kwantlen Polytechnic University: Institutional Analysis Planning
2009 Student Satisfaction Survey (formerly Fall Registration Survey)
December 2009
Section 3:Course Registration Process
25 of 59
Business(choose all that apply)
All students
Int students
Dom students
Only wanted certain sections/times/campus
23.0% 29.0% 24.5%
Course timetable conflict 22.4% 36.1% 21.9%
All sections were full 18.8% 25.6% 18.2%
Course not available this semester
18.4% 24.1% 18.1%
Section restricted to students in program
14.7% 30.0% 12.7%
Didn’t have course pre-requisites
13.4% 18.2% 12.9%
Other 13.1% 22.2% 11.6%
Total respondents 522 n/a n/a
Chemistry(choose all that apply)
All students
Int students
Dom students
Didn’t have course pre-requisites
9.8% 6.1% 10.2%
Other 5.6% 22.2% 4.2%
Only wanted certain sections/times/campus
4.2% 3.2% 4.7%
Course not available this semester
3.4% 10.3% 2.5%
Course Registration Process
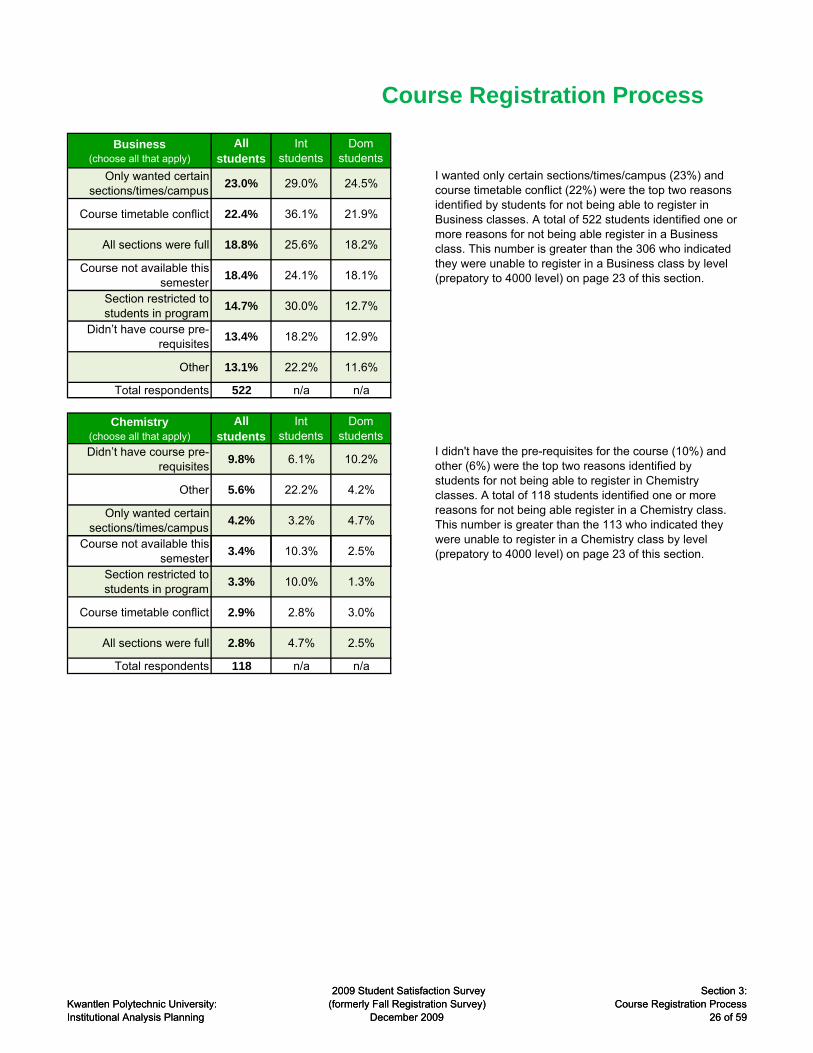
I wanted only certain sections/times/campus (23%) and course timetable conflict (22%) were the top two reasons identified by students for not being able to register in Business classes. A total of 522 students identified one or more reasons for not being able register in a Business class. This number is greater than the 306 who indicated they were unable to register in a Business class by level (prepatory to 4000 level) on page 23 of this section.
I didn't have the pre-requisites for the course (10%) and other (6%) were the top two reasons identified by students for not being able to register in Chemistry classes. A total of 118 students identified one or more reasons for not being able register in a Chemistry class. This number is greater than the 113 who indicated they were unable to register in a Chemistry class by level (prepatory to 4000 level) on page 23 of this section.
Kwantlen Polytechnic University: Institutional Analysis Planning
2009 Student Satisfaction Survey (formerly Fall Registration Survey)
December 2009
Section 3:Course Registration Process
26 of 59
se esteSection restricted to students in program
3.3% 10.0% 1.3%
Course timetable conflict 2.9% 2.8% 3.0%
All sections were full 2.8% 4.7% 2.5%
Total respondents 118 n/a n/a
Kwantlen Polytechnic University: Institutional Analysis Planning
2009 Student Satisfaction Survey (formerly Fall Registration Survey)
December 2009
Section 3:Course Registration Process
26 of 59
Criminology(choose all that apply)
All students
Int students
Dom students
All sections were full 14.8% 2.3% 15.9%
Course not available this semester
13.5% 13.8% 13.3%
Course timetable conflict 12.6% 5.6% 12.8%
Only wanted certain sections/times/campus
12.0% 6.5% 12.9%
Didn’t have course pre-requisites
9.3% 3.0% 9.6%
Section restricted to students in program
7.1% 5.0% 5.3%
Other 5.6% 22.2% 3.2%
Total respondents 329 n/a n/a
English(choose all that apply)
All students
Int students
Dom students
Didn’t have course pre-requisites
36.7% 33.3% 36.3%
All sections were full 17.9% 20.9% 18.0%
Other 15.0% 33.3% 13.7%
Course Registration Process
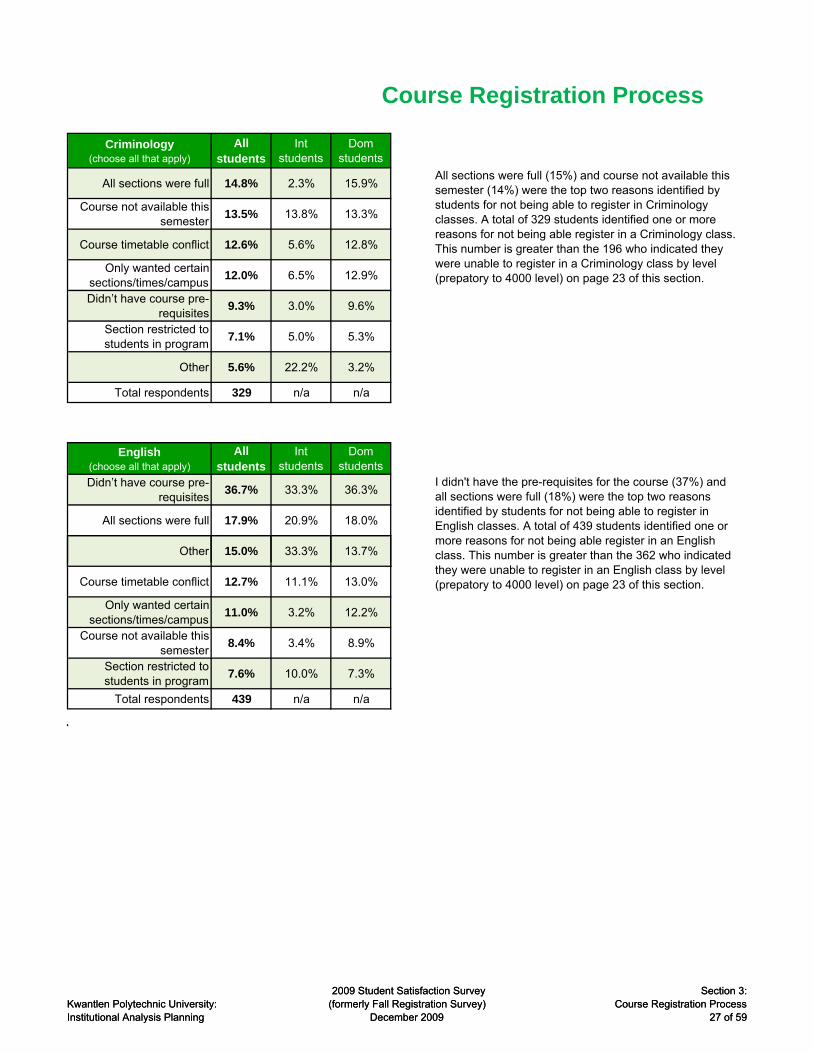
I didn't have the pre-requisites for the course (37%) and all sections were full (18%) were the top two reasons identified by students for not being able to register in English classes. A total of 439 students identified one or more reasons for not being able register in an English class. This number is greater than the 362 who indicated
All sections were full (15%) and course not available this semester (14%) were the top two reasons identified by students for not being able to register in Criminology classes. A total of 329 students identified one or more reasons for not being able register in a Criminology class. This number is greater than the 196 who indicated they were unable to register in a Criminology class by level (prepatory to 4000 level) on page 23 of this section.
Kwantlen Polytechnic University: Institutional Analysis Planning
2009 Student Satisfaction Survey (formerly Fall Registration Survey)
December 2009
Section 3:Course Registration Process
27 of 59
Course timetable conflict 12.7% 11.1% 13.0%
Only wanted certain sections/times/campus
11.0% 3.2% 12.2%
Course not available this semester
8.4% 3.4% 8.9%
Section restricted to students in program
7.6% 10.0% 7.3%
Total respondents 439 n/a n/a
they were unable to register in an English class by level (prepatory to 4000 level) on page 23 of this section.
Kwantlen Polytechnic University: Institutional Analysis Planning
2009 Student Satisfaction Survey (formerly Fall Registration Survey)
December 2009
Section 3:Course Registration Process
27 of 59
Math(choose all that apply)
All students
Int students
Dom students
Didn’t have course pre-requisites
14.2% 15.2% 14.1%
Other 9.3% 11.1% 9.5%
All sections were full 6.5% 16.3% 5.4%
Course timetable conflict 6.5% 16.7% 5.1%
Course not available this semester
6.4% 17.2% 5.3%
Only wanted certain sections/times/campus
5.8% 9.7% 5.9%
Section restricted to students in program
3.3% 15.0% 2.0%
Total respondents 202 n/a n/a
Physics(choose all that apply)
All students
Int students
Dom students
Didn’t have course pre-requisites
8.3% 12.1% 8.1%
Section restricted to students in program
6.5% 0.0% 6.0%
Course timetable conflict 4.8% 8.3% 4.8%
Course not available this 4 2% 10 3% 3 9%
Course Registration Process
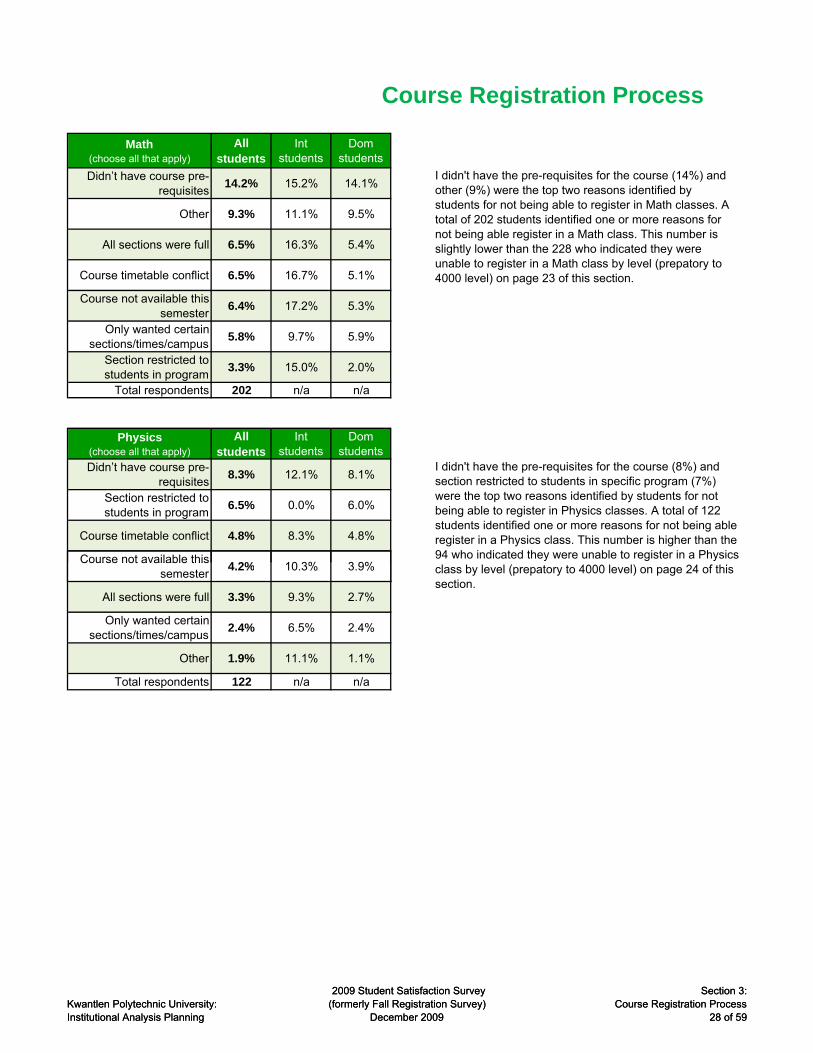
I didn't have the pre-requisites for the course (14%) and other (9%) were the top two reasons identified by students for not being able to register in Math classes. A total of 202 students identified one or more reasons for not being able register in a Math class. This number is slightly lower than the 228 who indicated they were unable to register in a Math class by level (prepatory to 4000 level) on page 23 of this section.
I didn't have the pre-requisites for the course (8%) and section restricted to students in specific program (7%) were the top two reasons identified by students for not being able to register in Physics classes. A total of 122 students identified one or more reasons for not being able register in a Physics class. This number is higher than the 94 who indicated they were unable to register in a Physics l b l l ( 4000 l l) 24 f hi
Kwantlen Polytechnic University: Institutional Analysis Planning
2009 Student Satisfaction Survey (formerly Fall Registration Survey)
December 2009
Section 3:Course Registration Process
28 of 59
Course not available this semester
4.2% 10.3% 3.9%
All sections were full 3.3% 9.3% 2.7%
Only wanted certain sections/times/campus
2.4% 6.5% 2.4%
Other 1.9% 11.1% 1.1%
Total respondents 122 n/a n/a
class by level (prepatory to 4000 level) on page 24 of this section.
Kwantlen Polytechnic University: Institutional Analysis Planning
2009 Student Satisfaction Survey (formerly Fall Registration Survey)
December 2009
Section 3:Course Registration Process
28 of 59
Psychology(choose all that apply)
All students
Int students
Dom students
Section restricted to students in program
21.2% 5.0% 24.0%
All sections were full 16.9% 14.0% 17.4%
Course timetable conflict 15.5% 5.6% 16.8%
Only wanted certain sections/times/campus
14.6% 12.9% 15.8%
Course not available this semester
14.3% 17.2% 14.4%
Didn’t have course pre-requisites
8.0% 3.0% 8.7%
Other 5.6% 22.2% 4.2%
Total respondents 395 n/a n/a
Other(choose all that apply)
All students
Int students
Dom students
Section restricted to students in program
46.7% 33.3% 48.4%
Course not available this semester
28.7% 34.5% 28.3%
Other 26.1% 35.0% 25.3%
Only wanted certain 24 0% 35 5% 25 2%
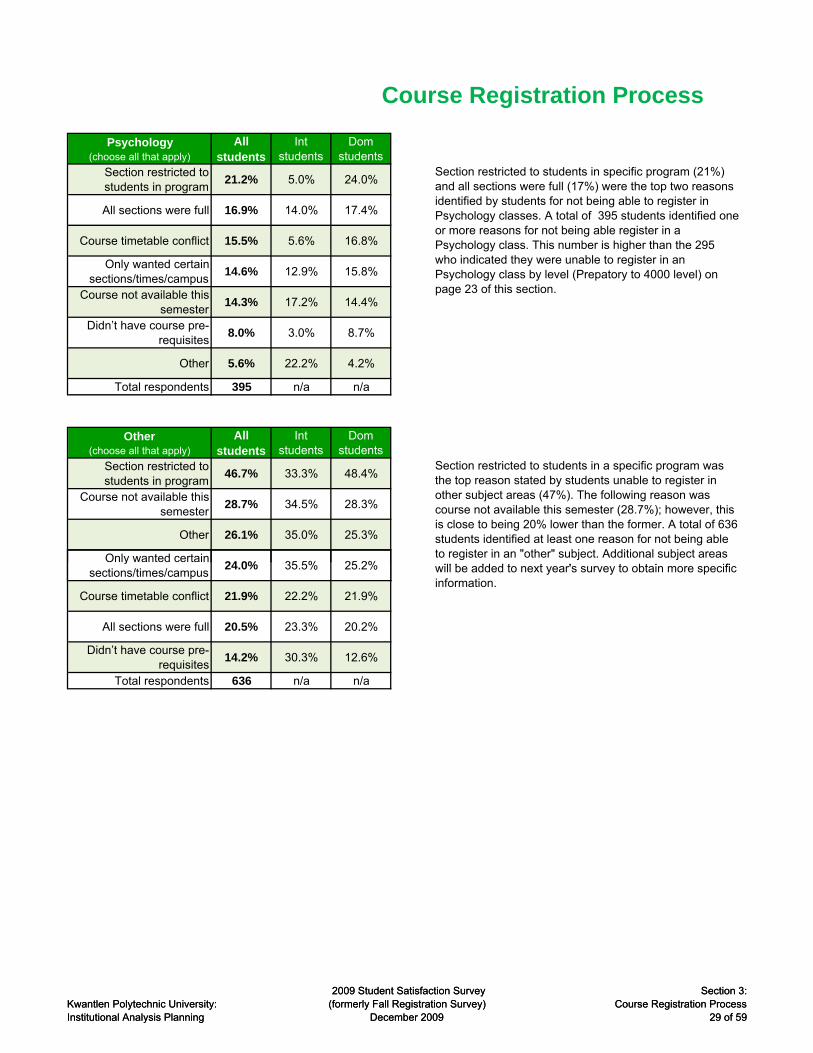
Section restricted to students in specific program (21%) and all sections were full (17%) were the top two reasons identified by students for not being able to register in Psychology classes. A total of 395 students identified one or more reasons for not being able register in a Psychology class. This number is higher than the 295 who indicated they were unable to register in an Psychology class by level (Prepatory to 4000 level) on page 23 of this section.
Section restricted to students in a specific program was the top reason stated by students unable to register in other subject areas (47%). The following reason was course not available this semester (28.7%); however, this is close to being 20% lower than the former. A total of 636 students identified at least one reason for not being able to register in an "other" subject. Additional subject areas
ill b dd d t t ' t bt i ifi
Course Registration Process
Kwantlen Polytechnic University: Institutional Analysis Planning
2009 Student Satisfaction Survey (formerly Fall Registration Survey)
December 2009
Section 3:Course Registration Process
29 of 59
ysections/times/campus
24.0% 35.5% 25.2%
Course timetable conflict 21.9% 22.2% 21.9%
All sections were full 20.5% 23.3% 20.2%
Didn’t have course pre-requisites
14.2% 30.3% 12.6%
Total respondents 636 n/a n/a
will be added to next year's survey to obtain more specific information.
Kwantlen Polytechnic University: Institutional Analysis Planning
2009 Student Satisfaction Survey (formerly Fall Registration Survey)
December 2009
Section 3:Course Registration Process
29 of 59
6. Transfer credit process
Attempted to transfer credits from other
institutions
All students
Int students
Dom students
Yes 20.0% 36.6% 18.8%No 71.9% 42.3% 73.8%
Not sure 8.0% 21.1% 7.3%Total respondents 2,436 123 2,220
Time elapsed from when transfer credit was
applied for to receiving a response
All students
Int students
Dom students
Less than 3 weeks 16.1% 18.8% 15.7%3-6 weeks 27.8% 29.2% 26.9%
More than 6 weeks 25.5% 25.0% 26.4%Don't know 30.6% 27.1% 31.0%
Total respondents 510 48 439
Satisfaction with the transfer credit process
All students
Int students
Dom students
Very satisfied 18.3% 18.8% 18.0%Satisfied 29 6% 33 3% 28 9%
Course Registration Process
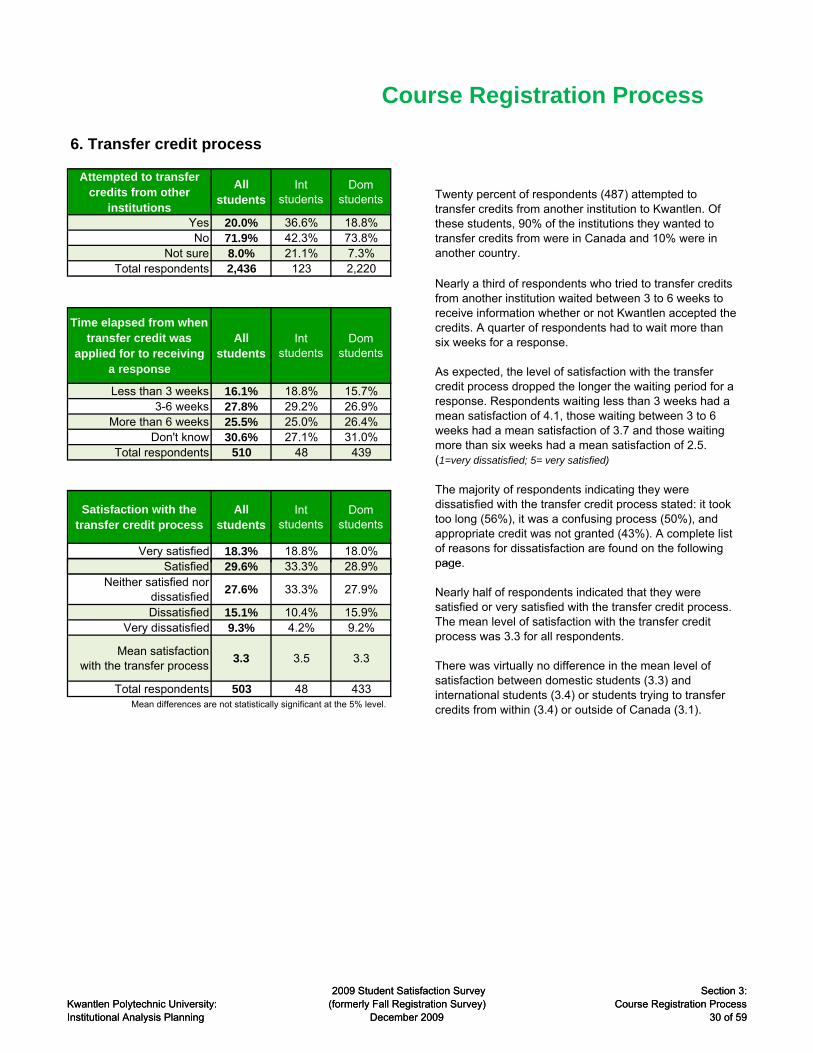
Nearly a third of respondents who tried to transfer credits from another institution waited between 3 to 6 weeks to receive information whether or not Kwantlen accepted the credits. A quarter of respondents had to wait more than six weeks for a response.
As expected, the level of satisfaction with the transfer credit process dropped the longer the waiting period for a response. Respondents waiting less than 3 weeks had a mean satisfaction of 4.1, those waiting between 3 to 6 weeks had a mean satisfaction of 3.7 and those waiting more than six weeks had a mean satisfaction of 2.5. (1=very dissatisfied; 5= very satisfied)
The majority of respondents indicating they were dissatisfied with the transfer credit process stated: it took too long (56%), it was a confusing process (50%), and appropriate credit was not granted (43%). A complete list of reasons for dissatisfaction are found on the following page
Twenty percent of respondents (487) attempted to transfer credits from another institution to Kwantlen. Of these students, 90% of the institutions they wanted to transfer credits from were in Canada and 10% were in another country.
Kwantlen Polytechnic University: Institutional Analysis Planning
2009 Student Satisfaction Survey (formerly Fall Registration Survey)
December 2009
Section 3:Course Registration Process
30 of 59
Satisfied 29.6% 33.3% 28.9%Neither satisfied nor
dissatisfied27.6% 33.3% 27.9%
Dissatisfied 15.1% 10.4% 15.9%Very dissatisfied 9.3% 4.2% 9.2%
Mean satisfaction with the transfer process
3.3 3.5 3.3
Total respondents 503 48 433Mean differences are not statistically significant at the 5% level.
page.
Nearly half of respondents indicated that they were satisfied or very satisfied with the transfer credit process. The mean level of satisfaction with the transfer credit process was 3.3 for all respondents.
There was virtually no difference in the mean level of satisfaction between domestic students (3.3) and international students (3.4) or students trying to transfer credits from within (3.4) or outside of Canada (3.1).
Kwantlen Polytechnic University: Institutional Analysis Planning
2009 Student Satisfaction Survey (formerly Fall Registration Survey)
December 2009
Section 3:Course Registration Process
30 of 59
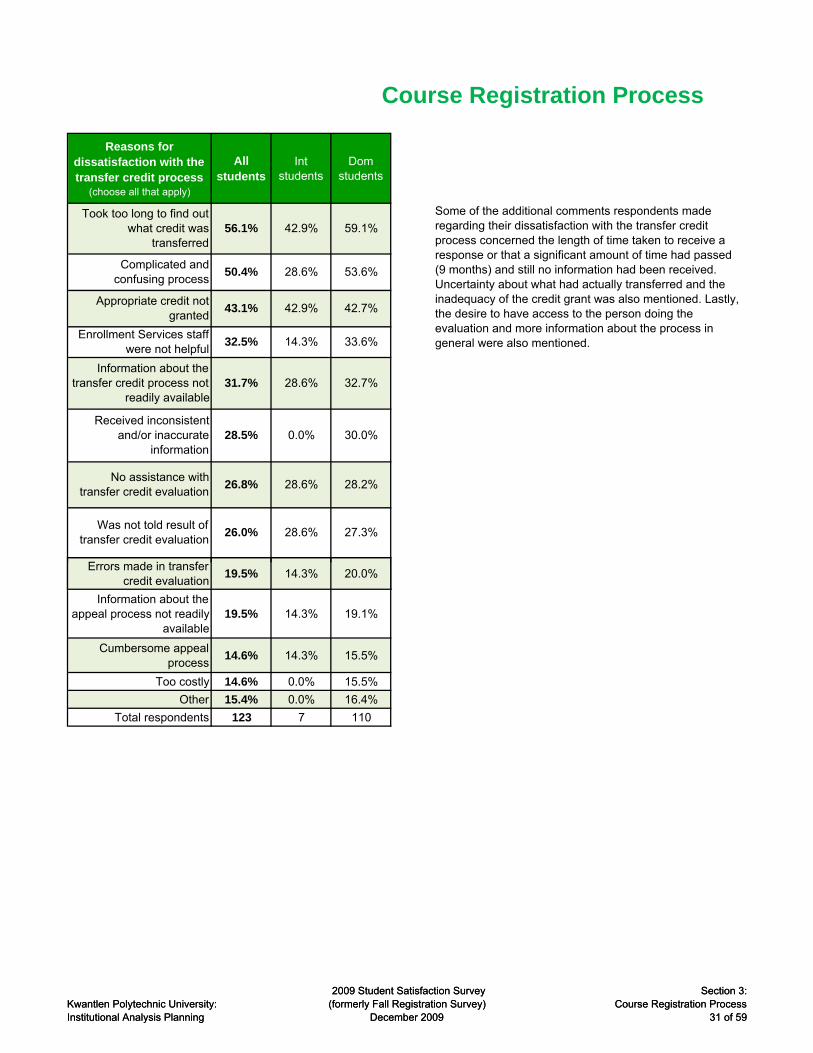
Reasons for dissatisfaction with the transfer credit process
(choose all that apply)
All students
Int students
Dom students
Errors made in transfer
Appropriate credit not granted
33.6%14.3%32.5%Enrollment Services staff
were not helpful
28.2%28.6%26.8%No assistance with
transfer credit evaluation
0.0%
27.3%28.6%26.0%Was not told result of
transfer credit evaluation
30.0%
Course Registration Process
Complicated and confusing process
50.4% 53.6%28.6%
Some of the additional comments respondents made regarding their dissatisfaction with the transfer credit process concerned the length of time taken to receive a response or that a significant amount of time had passed (9 months) and still no information had been received. Uncertainty about what had actually transferred and the inadequacy of the credit grant was also mentioned. Lastly, the desire to have access to the person doing the evaluation and more information about the process in general were also mentioned.
28.5%Received inconsistent
and/or inaccurate information
56.1%Took too long to find out
what credit was transferred
42.7%42.9%
31.7% 32.7%28.6%
59.1%42.9%
43.1%
Information about the transfer credit process not
readily available
Kwantlen Polytechnic University: Institutional Analysis Planning
2009 Student Satisfaction Survey (formerly Fall Registration Survey)
December 2009
Section 3:Course Registration Process
31 of 59
Errors made in transfer credit evaluation
19.5% 14.3% 20.0%
Information about the appeal process not readily
available19.5% 14.3% 19.1%
Cumbersome appeal process
14.6% 14.3% 15.5%
Too costly 14.6% 0.0% 15.5%
Other 15.4% 0.0% 16.4%
Total respondents 123 7 110
Kwantlen Polytechnic University: Institutional Analysis Planning
2009 Student Satisfaction Survey (formerly Fall Registration Survey)
December 2009
Section 3:Course Registration Process
31 of 59

7. Preferred course delivery method
Preferred courses delivery method
All students
Int students
Dom students
In class 65.2% 70.8% 65.0% In 65%Online 5.2% 4.6% 5.2% Online 5%
A combination of both 29.6% 24.6% 29.8% Combiti
30%
Total respondents 2,607 130 2,399
8. Preferred summer semester scheduling
Likelihood of taking courses May to August
All students
Int students
Dom students
Very Likely 34.3% 29.7% 34.6%Likely 23.2% 29.7% 22.9% May to August 3.5
Neither likely/unlikely 13.4% 16.9% 13.4% May to 3.8Unlikely 13.0% 11.9% 13.0% July to 3.1
Very Unlikely 16.1% 11.9% 16.2%Mean likelihood of taking
courses May to August
3.5 3.5 3.5
Total respondents 2,409 118 2,221Test for statistical significance of mean differences is inconclusive.
Likelihood of taking All Int Dom
Course Registration Process
The majority of students prefer courses delivered in class (65%). International student's preference for this mode of delivery is slightly higher (71%).
65%
5%
30%
In class Online Combination of both
Preferred course delivery method for all students responding to survey
3.53.8
3.1
May to August May to Juneintersession
July to Augustintersession
Mean likelihood of taking course during summer sessions for all students
responding to survey(1=very unlikely; 5=very likely)
Kwantlen Polytechnic University: Institutional Analysis Planning
2009 Student Satisfaction Survey (formerly Fall Registration Survey)
December 2009
Section 3:Course Registration Process
32 of 59
courses May to June intersession
All students
Int students
Dom students
Very Likely 41.0% 40.0% 40.9%Likely 25.7% 25.8% 25.9%
Neither likely/unlikely 15.3% 16.7% 15.4%Unlikely 7.3% 9.2% 7.2%
Very Unlikely 10.6% 8.3% 10.7%Mean likelihood of taking
courses May to June
3.8 3.8 3.8
Total respondents 2,383 120 2,192
Likelihood of taking courses July to August
intersession
All students
Int students
Dom students
Very Likely 22.1% 12.7% 22.3%Likely 20.7% 22.7% 20.7%
Neither likely/unlikely 19.4% 24.5% 19.2%Unlikely 17.3% 20.0% 17.3%
Very Unlikely 20.5% 20.0% 20.3%Mean likelihood of taking
courses July to August
3.1 2.9 3.1
Total respondents 2,276 110 2,099
Mean differences are not statistically significant at the 5% level.
Mean differences are not statistically significant at the 5% level.
Survey respondents were presented with three alternatives for taking courses in the summer - May to August, May to June intersession, and July to August intersession - and were asked to rate how likely they were to take each one. The option receiving the highest mean likelihood was the May to June intersession with a mean value of 3.8, followed by the May to August summer session with a mean likelihood value of 3.5. The July to August intersession option received the lowest mean likelihood value of 3.1.
There is virtually no difference between international and domestic students regarding these three options. The only exception is that international students were slightly less likely to take the July to August intersession than domestic students.
65%
5%
30%
In class Online Combination of both
Preferred course delivery method for all students responding to survey
3.53.8
3.1
May to August May to Juneintersession
July to Augustintersession
Mean likelihood of taking course during summer sessions for all students
responding to survey(1=very unlikely; 5=very likely)
Kwantlen Polytechnic University: Institutional Analysis Planning
2009 Student Satisfaction Survey (formerly Fall Registration Survey)
December 2009
Section 3:Course Registration Process
32 of 59

9. Preferred campus
Campus of preferenceAll
studentsInt
studentsDom
students
Cloverdale 3.8% 1.5% 3.9%Langley 15.2% 3.7% 15.8%
Richmond 34.5% 59.7% 33.0%Surrey 46.4% 35.1% 47.2%
Total respondents 2,627 134 2,413
Cloverdale
LangleyRichmond
Surrey
Cloverdale 79.8% 2.8% 0.4% 1.3%Langley 3.4% 85.9% 3.1% 11.4%
Richmond 5.6% 4.4% 85.7% 7.9%Surrey 11.2% 6.9% 10.8% 79.4%
Total respondents 89 248 911 1,374
10. Preferred course scheduling times
Course Registration Process
Campus of preferencePrimary Campus
Forty-six percent of survey respondents indicated they prefer the Surrey campus, followed by Richmond (35%), Langley (15%), and Cloverdale (4%).
The majority of respondents indicated their primary campus was their campus of preference - Cloverdale (80%), Langley (86%), Richmond (86%), and Surrey (79%).
The second highest proportion of Cloverdale students identified Langley as their preferred campus (3%). For Langley and Richmond students it was Surrey campus, at (11%) and (8%) respectively. Lastly, for Surrey students it was Cloverdale and Richmond campuses (both at 11%).
Kwantlen Polytechnic University: Institutional Analysis Planning
2009 Student Satisfaction Survey (formerly Fall Registration Survey)
December 2009
Section 3:Course Registration Process
33 of 59
evening & all day Sat. 1.8Sat. morn2.1Fri. 2.3Mon.-Thurs. 4:00-3.3Mon.-Fri. 8:00a.m3.6Mon.-Fri. 12:00-44Once a month on Fri. 1.8
Survey respondents were asked to rate the likelihood of taking a course (any given semester) during various time slots. The Monday to Friday between noon and 4 p.m. had the highest mean (4.0) followed by the Monday to Friday option 8:00 a.m.-12:00 p.m. The lowest rating was once a month on Friday evening and all day Saturday. The tables with detailed information immediately follow.
1.82.12.3
3.33.6
4
Once a month on Fri. evening & all day Sat.
Sat. morning
Fri. 4:00‐10:00p.m.
Mon.‐Thurs. 4:00‐10:00p.m.
Mon.‐Fri. 8:00a.m.‐12:00p.m.
Mon.‐Fri. 12:00‐4:00p.m.
Mean level of likelihood of taking courses at the proposed times
Kwantlen Polytechnic University: Institutional Analysis Planning
2009 Student Satisfaction Survey (formerly Fall Registration Survey)
December 2009
Section 3:Course Registration Process
33 of 59
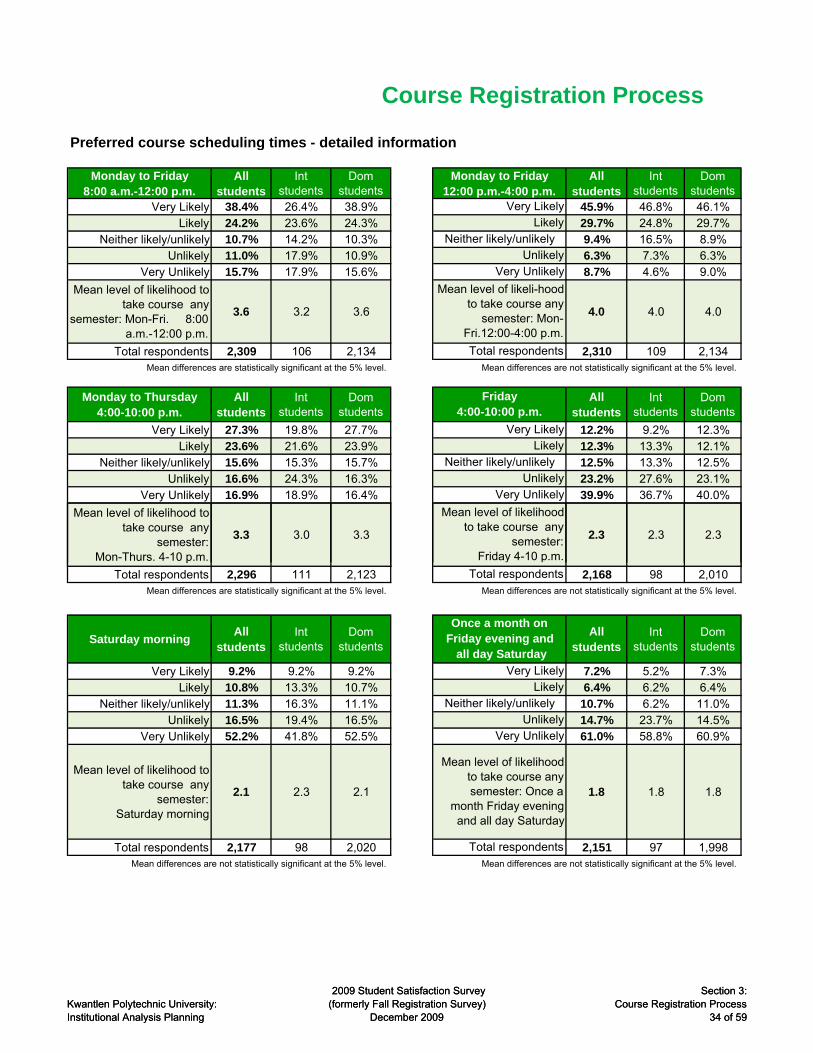
Preferred course scheduling times - detailed information
Monday to Friday 8:00 a.m.-12:00 p.m.
All students
Int students
Dom students
All students
Int students
Dom students
Very Likely 38.4% 26.4% 38.9% 45.9% 46.8% 46.1%Likely 24.2% 23.6% 24.3% 29.7% 24.8% 29.7%
Neither likely/unlikely 10.7% 14.2% 10.3% 9.4% 16.5% 8.9%Unlikely 11.0% 17.9% 10.9% 6.3% 7.3% 6.3%
Very Unlikely 15.7% 17.9% 15.6% 8.7% 4.6% 9.0%
Mean level of likelihood to take course any
semester: Mon-Fri. 8:00 a.m.-12:00 p.m.
3.6 3.2 3.6 4.0 4.0 4.0
Total respondents 2,309 106 2,134 2,310 109 2,134Mean differences are statistically significant at the 5% level. Mean differences are not statistically significant at the 5% level.
Monday to Thursday 4:00-10:00 p.m.
All students
Int students
Dom students
All students
Int students
Dom students
Very Likely 27.3% 19.8% 27.7% 12.2% 9.2% 12.3%Likely 23.6% 21.6% 23.9% 12.3% 13.3% 12.1%
Neither likely/unlikely 15.6% 15.3% 15.7% 12.5% 13.3% 12.5%Unlikely 16.6% 24.3% 16.3% 23.2% 27.6% 23.1%
Very Unlikely 16.9% 18.9% 16.4% 39.9% 36.7% 40.0%
Mean level of likelihood to take course any
semester: Mon-Thurs. 4-10 p.m.
3.3 3.0 3.3 2.3 2.3 2.3
Likely
Total respondents
Monday to Friday 12:00 p.m.-4:00 p.m.
Very Likely
Course Registration Process
Neither likely/unlikelyUnlikely
Very Unlikely
LikelyNeither likely/unlikely
UnlikelyVery Unlikely
Mean level of likeli-hood to take course any
semester: Mon-Fri.12:00-4:00 p.m.
Mean level of likelihood to take course any
semester: Friday 4-10 p.m.
Friday 4:00-10:00 p.m.
Very Likely
Kwantlen Polytechnic University: Institutional Analysis Planning
2009 Student Satisfaction Survey (formerly Fall Registration Survey)
December 2009
Section 3:Course Registration Process
34 of 59
p
Total respondents 2,296 111 2,123 2,168 98 2,010Mean differences are statistically significant at the 5% level. Mean differences are not statistically significant at the 5% level.
Saturday morningAll
studentsInt
studentsDom
studentsAll
studentsInt
studentsDom
students
Very Likely 9.2% 9.2% 9.2% 7.2% 5.2% 7.3%Likely 10.8% 13.3% 10.7% 6.4% 6.2% 6.4%
Neither likely/unlikely 11.3% 16.3% 11.1% 10.7% 6.2% 11.0%Unlikely 16.5% 19.4% 16.5% 14.7% 23.7% 14.5%
Very Unlikely 52.2% 41.8% 52.5% 61.0% 58.8% 60.9%
Mean level of likelihood to take course any
semester: Saturday morning
2.1 2.3 2.1 1.8 1.8 1.8
Total respondents 2,177 98 2,020 2,151 97 1,998Mean differences are not statistically significant at the 5% level. Mean differences are not statistically significant at the 5% level.
Neither likely/unlikely
Total respondents
UnlikelyVery Unlikely
Mean level of likelihood to take course any semester: Once a
month Friday evening and all day Saturday
Very LikelyLikely
y p
Total respondents
Once a month on Friday evening and
all day Saturday
Kwantlen Polytechnic University: Institutional Analysis Planning
2009 Student Satisfaction Survey (formerly Fall Registration Survey)
December 2009
Section 3:Course Registration Process
34 of 59

Mean n
4.0 2,507
4.0 2,540
4.0 80
3.9 2,418
3.9 1,152
3.9 2,540
3.8 2,537
3.8 2,432
3.7 2,492
3.7 81
3.7 2,527
3 7 2 168
Course registration information is readily available
There is a good variety of courses
Program descriptions in the online calendar are clear and accurate
Course descriptions in the online calendar are clear and accurate
Enrollment Services staff are helpful on the phone
Tuition payment policies are reasonable
Educational Advisors are helpful
Web registration process is easy to use
Fee payment process is efficient
Enrollment Services staff are helpful in person
Online course registration guide is easy to use
11. Ratings of aspects of student support services available for the course registration process
Overall, students were satisfied with their course registration process rating it 4 out of 5. The factors that received the highest ratings (4 out of 5) related to ease of use of the web registration process and efficiency of the fee payment process.
Students gave the lowest rating to "all desired courses can be scheduled without timetable conflicts" (3.1), the reasonableness of the course add and drop policies (3.5) and accessibility to Educational Advisors in a timely manner (3.5).
Only about 80 students answered the questions related to the helpfulness of the Enrolment Services staff which seems to suggest the terminology was unclear or they simply had little contact with Enrolment Services staff.
The table to the left provides a summary of the mean values for each aspect of the course
Summary: Ratings of aspects of student support services available for the course
registration process
Admissions staff are helpful in person
Course Registration Process
Kwantlen Polytechnic University: Institutional Analysis Planning
2009 Student Satisfaction Survey (formerly Fall Registration Survey)
December 2009
Section 3:Course Registration Process
35 of 59
3.7 2,168
3.6 1,698
3.6 1,042
3.5 2,227
3.5 2,424
3.1 2,490
4.0 2,591
Educational Advisors are helpful
Class change (add/drop) policies are reasonable
All desired courses can be scheduled without timetable conflicts
Overall satisfaction with the course registration process
Personnel in the Financial Awards office are helpful
Admissions staff are helpful on the phone
Access to Educational Advisors is timely
ea a ues o eac aspect o t e cou seregistration process. Detailed information for each aspect of the course registration process is presented in the pages that follow.
Kwantlen Polytechnic University: Institutional Analysis Planning
2009 Student Satisfaction Survey (formerly Fall Registration Survey)
December 2009
Section 3:Course Registration Process
35 of 59

Access to Educational Advisors is timely
All students
Int students
Dom students
Strongly Agree 13.3% 18.8% 13.2%Agree 36.8% 42.2% 36.8% onal 3.7
Neither agree/disagree 23.8% 26.6% 23.5% c 3.5Disagree 8.5% 5.5% 8.5%
Strongly disagree 4.2% 3.1% 4.2%Not used, N/A 13.3% 3.9% 13.8%
Mean level of agreement regarding access to
Educational Advisors is timely
3.5 3.7 3.5
Total respondents 2,570 128 2,396Mean differences are not statistically significant at the 5% level.
Educational Advisors are helpful
All students
Int students
Dom students
Strongly Agree 16.6% 21.9% 16.5%Agree 37.3% 42.2% 37.1%
Neither agree/disagree 20.1% 21.9% 19.9% Internatio 3.8Disagree 6.9% 4.7% 6.9% Domestic 3.7
Strongly disagree 3 5% 3 9% 3 4%
Ratings of aspects of student support services available for the course registration process - detailed information
Course Registration Process
3.73.5
International Students
Domestic Students
Mean level of agreement with statement "Access to Educational Advisors is timely"
(1=strongly disagree; 5=strongly agree)
3.8 3.7
Mean level of agreement with statement "Educational Advisors are helpful"
(1=strongly disagree; 5=strongly agree)
Kwantlen Polytechnic University: Institutional Analysis Planning
2009 Student Satisfaction Survey (formerly Fall Registration Survey)
December 2009
Section 3:Course Registration Process
36 of 59
Strongly disagree 3.5% 3.9% 3.4%Not used, N/A 15.6% 5.5% 16.1%
Mean level of agreement regarding Educational
Advisors are helpful3.7 3.8 3.7
Total respondents 2,569 128 2,396Mean differences are not statistically significant at the 5% level.
Admissions staff are helpful in person
All students
Int students
Dom students
Strongly Agree 22.1% 25.4% 22.0%Agree 47.8% 50.8% 47.6% onal 4.0
Neither agree/disagree 15.8% 17.5% 15.8% c 3.9Disagree 4.5% 1.6% 4.6%
Strongly disagree 2.3% 3.2% 2.3%Not used, N/A 7.5% 1.6% 7.7%
Mean level of agreement regarding Admissions
staff are helpful in person3.9 4.0 3.9
Total respondents 1,246 63 1,170Mean differences are not statistically significant at the 5% level.
3.73.5
International Students
Domestic Students
Mean level of agreement with statement "Access to Educational Advisors is timely"
(1=strongly disagree; 5=strongly agree)
4.0 3.9
International Students
Domestic Students
Mean level of agreement with statement "Admissions staff are helpful in person"
(1=strongly disagree; 5=strongly agree)
3.8 3.7
International Students
Domestic Students
Mean level of agreement with statement "Educational Advisors are helpful"
(1=strongly disagree; 5=strongly agree)
Kwantlen Polytechnic University: Institutional Analysis Planning
2009 Student Satisfaction Survey (formerly Fall Registration Survey)
December 2009
Section 3:Course Registration Process
36 of 59
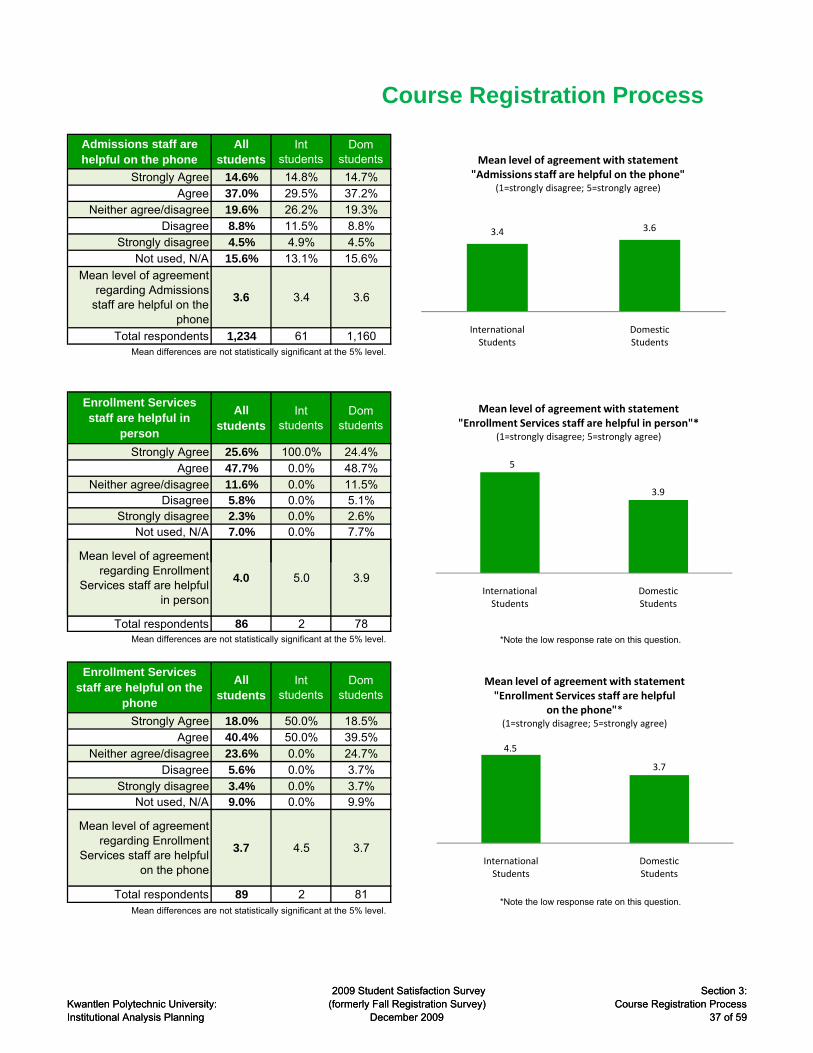
Admissions staff are helpful on the phone
All students
Int students
Dom students
Strongly Agree 14.6% 14.8% 14.7%Agree 37.0% 29.5% 37.2%
Neither agree/disagree 19.6% 26.2% 19.3% Internatio 3.4Disagree 8.8% 11.5% 8.8% Domestic 3.6
Strongly disagree 4.5% 4.9% 4.5%Not used, N/A 15.6% 13.1% 15.6%
Mean level of agreement regarding Admissions
staff are helpful on the phone
3.6 3.4 3.6
Total respondents 1,234 61 1,160Mean differences are not statistically significant at the 5% level.
Enrollment Services staff are helpful in
person
All students
Int students
Dom students
Strongly Agree 25.6% 100.0% 24.4%Agree 47.7% 0.0% 48.7%
Neither agree/disagree 11.6% 0.0% 11.5% Internatio 5Disagree 5.8% 0.0% 5.1% Domestic 3.9
Strongly disagree 2.3% 0.0% 2.6%Not used, N/A 7.0% 0.0% 7.7%
Mean level of agreement
Course Registration Process
3.4 3.6
International Students
Domestic Students
Mean level of agreement with statement "Admissions staff are helpful on the phone"
(1=strongly disagree; 5=strongly agree)
5
3.9
International Students
Domestic Students
Mean level of agreement with statement "Enrollment Services staff are helpful in person"*
(1=strongly disagree; 5=strongly agree)
Kwantlen Polytechnic University: Institutional Analysis Planning
2009 Student Satisfaction Survey (formerly Fall Registration Survey)
December 2009
Section 3:Course Registration Process
37 of 59
regarding Enrollment Services staff are helpful
in person
4.0 5.0 3.9
Total respondents 86 2 78Mean differences are not statistically significant at the 5% level.
Enrollment Services staff are helpful on the
phone
All students
Int students
Dom students
Strongly Agree 18.0% 50.0% 18.5%Agree 40.4% 50.0% 39.5%
Neither agree/disagree 23.6% 0.0% 24.7%Disagree 5.6% 0.0% 3.7% Internatio 4.5
Strongly disagree 3.4% 0.0% 3.7% Domestic 3.7Not used, N/A 9.0% 0.0% 9.9%
Mean level of agreement regarding Enrollment
Services staff are helpful on the phone
3.7 4.5 3.7
Total respondents 89 2 81Mean differences are not statistically significant at the 5% level.
*Note the low response rate on this question.
*Note the low response rate on this question.
3.4 3.6
International Students
Domestic Students
Mean level of agreement with statement "Admissions staff are helpful on the phone"
(1=strongly disagree; 5=strongly agree)
5
3.9
International Students
Domestic Students
Mean level of agreement with statement "Enrollment Services staff are helpful in person"*
(1=strongly disagree; 5=strongly agree)
4.5
3.7
International Students
Domestic Students
Mean level of agreement with statement "Enrollment Services staff are helpful
on the phone"*(1=strongly disagree; 5=strongly agree)
Kwantlen Polytechnic University: Institutional Analysis Planning
2009 Student Satisfaction Survey (formerly Fall Registration Survey)
December 2009
Section 3:Course Registration Process
37 of 59

Personnel in the Financial Awards office
are helpful
All students
Int students
Dom students
Strongly Agree 12.6% 17.3% 16.8%Agree 23.4% 42.5% 50.2%
Neither agree/disagree 24.9% 28.3% 20.4% Internatio 3.5Disagree 3.4% 6.3% 6.4% Domestic 3.6
Strongly disagree 1.9% 0.8% 1.3%Not used, N/A 33.8% 4.7% 4.8%
Mean level of agreement regarding personnel in the
Financial Awards office are helpful
3.6 3.5 3.6
Total respondents 2,565 127 2,383Mean differences are not statistically significant at the 5% level.
There is a good variety of courses
All students
Int students
Dom students
Strongly Agree 19.4% 16.3% 19.4%Agree 52.5% 57.4% 52.3%
Neither agree/disagree 17.3% 19.4% 17.2% Internatio 3.8Disagree 7.7% 3.9% 7.8% Domestic 3.8
Strongly disagree 1.9% 2.3% 1.8%
Not used, N/A 1.3% 0.8% 1.4%
Course Registration Process
3.53.6
International Students
Domestic Students
Mean level of agreement with statement "Personnel in Financial Awards are helpful"
(1=strongly disagree; 5=strongly agree)
3.8 3.8
International Students
Domestic Students
Mean level of agreement with statement "There is a good variety of courses"(1=strongly disagree; 5=strongly agree)
Kwantlen Polytechnic University: Institutional Analysis Planning
2009 Student Satisfaction Survey (formerly Fall Registration Survey)
December 2009
Section 3:Course Registration Process
38 of 59
Mean level of agreement regarding there is a good
variety of courses3.8 3.8 3.8
Total respondents 2,571 129 2,396Mean differences are not statistically significant at the 5% level.
All desired courses can be scheduled without
timetable conflicts
All students
Int students
Dom students
Strongly Agree 10.5% 15.6% 10.3%Agree 29.7% 28.1% 29.6% Internatio 3.2
Neither agree/disagree 23.9% 24.2% 23.9% Domestic 3.1Disagree 24.4% 23.4% 24.6%
Strongly disagree 8.4% 7.0% 8.5%Not used, N/A 3.1% 1.6% 3.1%
Mean level of agreement regarding all desired
courses can be scheduled without time table conflicts
3.1 3.2 3.1
Total respondents 2,569 128 2,394Mean differences are not statistically significant at the 5% level.
3.2 3.1
International Students
Domestic Students
Mean level of agreement with statement "All desired courses can be scheduled
without timetable conflicts"(1=strongly disagree; 5=strongly agree)
3.53.6
International Students
Domestic Students
Mean level of agreement with statement "Personnel in Financial Awards are helpful"
(1=strongly disagree; 5=strongly agree)
3.8 3.8
International Students
Domestic Students
Mean level of agreement with statement "There is a good variety of courses"(1=strongly disagree; 5=strongly agree)
Kwantlen Polytechnic University: Institutional Analysis Planning
2009 Student Satisfaction Survey (formerly Fall Registration Survey)
December 2009
Section 3:Course Registration Process
38 of 59

Class change (add/drop) policies are reasonable
All students
Int students
Dom students
Strongly Agree 12.8% 10.9% 12.9%Agree 43.5% 34.1% 44.2%
Neither agree/disagree 20.8% 24.8% 20.5% Internatio 3.2Disagree 10.1% 18.6% 9.6% Domestic 3.5
Strongly disagree 7.1% 7.0% 7.1%Not used, N/A 5.6% 4.7% 5.7%
Mean agreement with class change (add/drop) policies are reasonable
3.5 3.2 3.5
Total respondents 2,569 129 2,394Mean differences are statistically significant at the 5% level.
Tuition payment policies are reasonable
All students
Int students
Dom students
Strongly Agree 17.1% 12.4% 17.4%Agree 50.8% 24.0% 52.3%
Neither agree/disagree 17.9% 28.7% 17.2% Internatio 3Disagree 7.9% 16.3% 7.5% Domestic 3.7
Strongly disagree 4.8% 14.7% 4.2%Not used, N/A 1.6% 3.9% 1.4%
Mean level of agreement
Course Registration Process
3.23.5
International Students
Domestic Students
Mean level of agreement with statement "Class change (add/drop) policies
are reasonable"(1=strongly disagree; 5=strongly agree)
3
3.7
International Students
Domestic Students
Mean level of agreement with statement "Tuition payment policies are reasonable"
(1=strongly disagree; 5=strongly agree)
Kwantlen Polytechnic University: Institutional Analysis Planning
2009 Student Satisfaction Survey (formerly Fall Registration Survey)
December 2009
Section 3:Course Registration Process
39 of 59
Mean level of agreement regarding tuition payment
policies are reasonable3.7 3.0 3.7
Total respondents 2,567 129 2,392Test for statistical significance of mean differences is inconclusive.
Online course registration guide is
easy to use
All students
Int students
Dom students
Strongly Agree 25.7% 24.0% 26.0%Agree 45.7% 39.5% 46.0%
Neither agree/disagree 14.7% 20.2% 14.2% Internatio 3.9Disagree 5.9% 3.9% 6.1% Domestic 3.9
Strongly disagree 2.0% 2.3% 2.0%Not used, N/A 6.0% 10.1% 5.7%
Mean level of agreement regarding online course
registration guide is easy to use
3.9 3.9 3.9
Total respondents 2,572 129 2,397Mean differences are not statistically significant at the 5% level.
3.23.5
International Students
Domestic Students
Mean level of agreement with statement "Class change (add/drop) policies
are reasonable"(1=strongly disagree; 5=strongly agree)
3
3.7
International Students
Domestic Students
Mean level of agreement with statement "Tuition payment policies are reasonable"
(1=strongly disagree; 5=strongly agree)
3.9 3.9
International Students
Domestic Students
Mean level of agreement with statement "Online course registration guide is easy to use"
(1=strongly disagree; 5=strongly agree)
Kwantlen Polytechnic University: Institutional Analysis Planning
2009 Student Satisfaction Survey (formerly Fall Registration Survey)
December 2009
Section 3:Course Registration Process
39 of 59

Web registration process is easy to use
All students
Int students
Dom students
Strongly Agree 29.8% 27.9% 30.2%Agree 50.9% 48.8% 51.1%
Neither agree/disagree 10.9% 14.7% 10.5% Internatio 4Disagree 4.4% 3.1% 4.5% Domestic 4.1
Strongly disagree 1.8% 1.6% 1.8%Not used, N/A 2.2% 3.9% 2.0%
Mean level of agreement regarding web registration
process is easy to use4.0 4.0 4.1
Total respondents 2,563 129 2,388Mean differences are not statistically significant at the 5% level.
Course registration information is readily
available
All students
Int students
Dom students
Strongly Agree 20.5% 22.5% 20.6%Agree 55.5% 47.3% 56.0%
Neither agree/disagree 15.5% 21.7% 14.8% Internatio 3.9Disagree 5.5% 6.2% 5.5% Domestic 3.9
Strongly disagree 1.8% 0.8% 1.9%Not used, N/A 1.3% 1.6% 1.3%
Mean level of agreement regarding course
Course Registration Process
4 4.1
International Students
Domestic Students
Mean level of agreement with statement "Web registration process is easy to use"
(1=strongly disagree; 5=strongly agree)
3.9 3.9
International Students
Domestic Students
Mean level of agreement with statement "Course registration information
is readily available"(1=strongly disagree; 5=strongly agree)
Kwantlen Polytechnic University: Institutional Analysis Planning
2009 Student Satisfaction Survey (formerly Fall Registration Survey)
December 2009
Section 3:Course Registration Process
40 of 59
regarding course registration information is
readily available
3.9 3.9 3.9
Total respondents 2,573 129 2,398Mean differences are not statistically significant at the 5% level.
Course descriptions in the online calendar are
clear and accurate
All students
Int students
Dom students
Strongly Agree 16.4% 13.3% 16.7%Agree 49.5% 50.8% 49.6%
Neither agree/disagree 20.0% 25.0% 19.6% Internatio 3.7Disagree 8.9% 6.3% 9.0% Domestic 3.7
Strongly disagree 2.2% 1.6% 2.2%Not used, N/A 2.9% 3.1% 2.9%
Mean agreement with course descriptions in the online calendar are clear
and accurate
3.7 3.7 3.7
Total respondents 2,567 128 2,394Mean differences are not statistically significant at the 5% level.
3.7 3.7
International Students
Domestic Students
Mean level of agreement with statement "Course descriptions in the online calendar
are clear and accurate"(1=strongly disagree; 5=strongly agree)
4 4.1
International Students
Domestic Students
Mean level of agreement with statement "Web registration process is easy to use"
(1=strongly disagree; 5=strongly agree)
3.9 3.9
International Students
Domestic Students
Mean level of agreement with statement "Course registration information
is readily available"(1=strongly disagree; 5=strongly agree)
Kwantlen Polytechnic University: Institutional Analysis Planning
2009 Student Satisfaction Survey (formerly Fall Registration Survey)
December 2009
Section 3:Course Registration Process
40 of 59
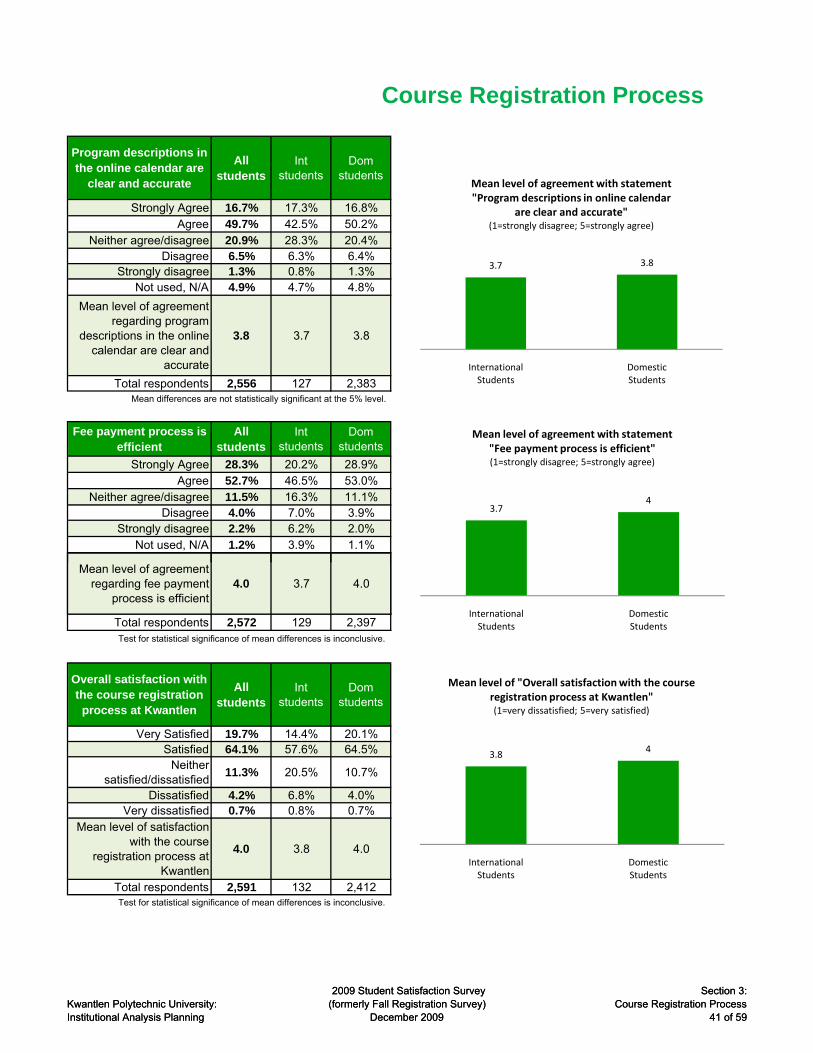
Program descriptions in the online calendar are
clear and accurate
All students
Int students
Dom students
Strongly Agree 16.7% 17.3% 16.8%Agree 49.7% 42.5% 50.2%
Neither agree/disagree 20.9% 28.3% 20.4%Disagree 6.5% 6.3% 6.4% Internatio 3.7
Strongly disagree 1.3% 0.8% 1.3% Domestic 3.8Not used, N/A 4.9% 4.7% 4.8%
Mean level of agreement regarding program
descriptions in the online calendar are clear and
accurate
3.8 3.7 3.8
Total respondents 2,556 127 2,383Mean differences are not statistically significant at the 5% level.
Fee payment process is efficient
All students
Int students
Dom students
Strongly Agree 28.3% 20.2% 28.9%Agree 52.7% 46.5% 53.0%
Neither agree/disagree 11.5% 16.3% 11.1% Internatio 3.7Disagree 4.0% 7.0% 3.9% Domestic 4
Strongly disagree 2.2% 6.2% 2.0%Not used, N/A 1.2% 3.9% 1.1%
M l l f t
Course Registration Process
3.74
International Domestic
Mean level of agreement with statement "Fee payment process is efficient"(1=strongly disagree; 5=strongly agree)
3.7 3.8
International Students
Domestic Students
Mean level of agreement with statement "Program descriptions in online calendar
are clear and accurate"(1=strongly disagree; 5=strongly agree)
Kwantlen Polytechnic University: Institutional Analysis Planning
2009 Student Satisfaction Survey (formerly Fall Registration Survey)
December 2009
Section 3:Course Registration Process
41 of 59
Mean level of agreement regarding fee payment
process is efficient4.0 3.7 4.0
Total respondents 2,572 129 2,397Test for statistical significance of mean differences is inconclusive.
Overall satisfaction with the course registration process at Kwantlen
All students
Int students
Dom students
Very Satisfied 19.7% 14.4% 20.1%Satisfied 64.1% 57.6% 64.5%
Neither satisfied/dissatisfied
11.3% 20.5% 10.7%Internatio 3.8
Dissatisfied 4.2% 6.8% 4.0% Domestic 4Very dissatisfied 0.7% 0.8% 0.7%
Mean level of satisfaction with the course
registration process at Kwantlen
4.0 3.8 4.0
Total respondents 2,591 132 2,412Test for statistical significance of mean differences is inconclusive.
3.74
International Students
Domestic Students
Mean level of agreement with statement "Fee payment process is efficient"(1=strongly disagree; 5=strongly agree)
3.84
International Students
Domestic Students
Mean level of "Overall satisfaction with the course registration process at Kwantlen"(1=very dissatisfied; 5=very satisfied)
3.7 3.8
International Students
Domestic Students
Mean level of agreement with statement "Program descriptions in online calendar
are clear and accurate"(1=strongly disagree; 5=strongly agree)
Kwantlen Polytechnic University: Institutional Analysis Planning
2009 Student Satisfaction Survey (formerly Fall Registration Survey)
December 2009
Section 3:Course Registration Process
41 of 59
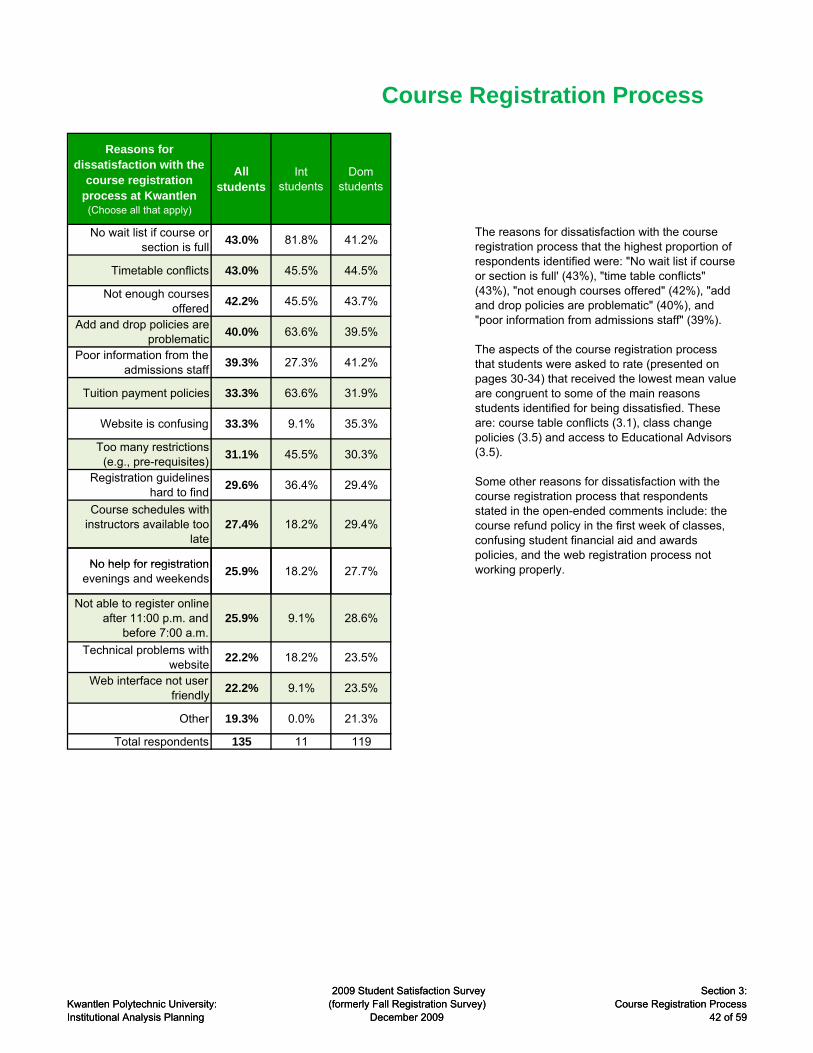
Reasons for dissatisfaction with the
course registration process at Kwantlen
(Choose all that apply)
All students
Int students
Dom students
No wait list if course or section is full
43.0% 81.8% 41.2%
Timetable conflicts 43.0% 45.5% 44.5%
Not enough courses offered
42.2% 45.5% 43.7%
Add and drop policies are problematic
40.0% 63.6% 39.5%
Poor information from the admissions staff
39.3% 27.3% 41.2%
Tuition payment policies 33.3% 63.6% 31.9%
Website is confusing 33.3% 9.1% 35.3%
Too many restrictions (e.g., pre-requisites)
31.1% 45.5% 30.3%
Registration guidelines hard to find
29.6% 36.4% 29.4%
Course schedules with instructors available too
late27.4% 18.2% 29.4%
No help for registration
The reasons for dissatisfaction with the course registration process that the highest proportion of respondents identified were: "No wait list if course or section is full' (43%), "time table conflicts" (43%), "not enough courses offered" (42%), "add and drop policies are problematic" (40%), and "poor information from admissions staff" (39%).
The aspects of the course registration process that students were asked to rate (presented on pages 30-34) that received the lowest mean value are congruent to some of the main reasons students identified for being dissatisfied. These are: course table conflicts (3.1), class change policies (3.5) and access to Educational Advisors (3.5).
Some other reasons for dissatisfaction with the course registration process that respondents stated in the open-ended comments include: the course refund policy in the first week of classes, confusing student financial aid and awards policies, and the web registration process not
Course Registration Process
Kwantlen Polytechnic University: Institutional Analysis Planning
2009 Student Satisfaction Survey (formerly Fall Registration Survey)
December 2009
Section 3:Course Registration Process
42 of 59
No help for registration evenings and weekends
25.9% 18.2% 27.7%
Not able to register online after 11:00 p.m. and
before 7:00 a.m.25.9% 9.1% 28.6%
Technical problems with website
22.2% 18.2% 23.5%
Web interface not user friendly
22.2% 9.1% 23.5%
Other 19.3% 0.0% 21.3%
Total respondents 135 11 119
working properly.
Kwantlen Polytechnic University: Institutional Analysis Planning
2009 Student Satisfaction Survey (formerly Fall Registration Survey)
December 2009
Section 3:Course Registration Process
42 of 59
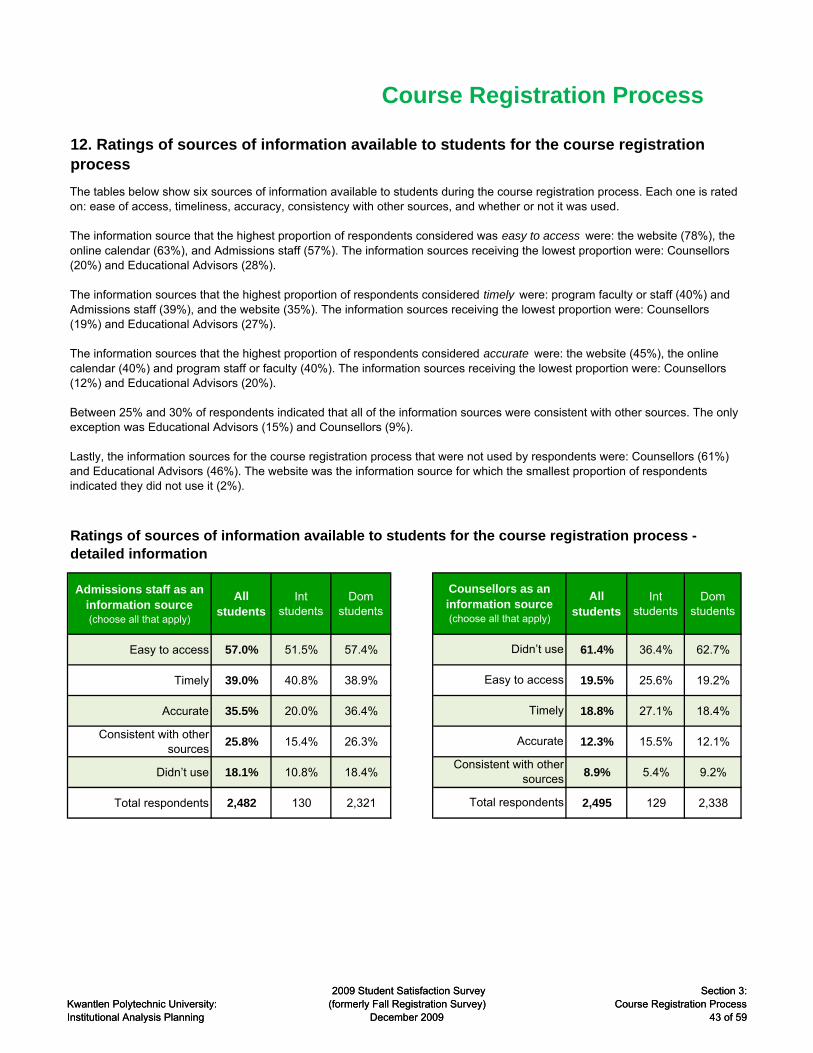
Course Registration Process
12. Ratings of sources of information available to students for the course registration process
The tables below show six sources of information available to students during the course registration process. Each one is rated on: ease of access, timeliness, accuracy, consistency with other sources, and whether or not it was used.
The information source that the highest proportion of respondents considered was easy to access were: the website (78%), the online calendar (63%), and Admissions staff (57%). The information sources receiving the lowest proportion were: Counsellors (20%) and Educational Advisors (28%).
The information sources that the highest proportion of respondents considered timely were: program faculty or staff (40%) and Admissions staff (39%), and the website (35%). The information sources receiving the lowest proportion were: Counsellors (19%) and Educational Advisors (27%).
The information sources that the highest proportion of respondents considered accurate were: the website (45%), the online calendar (40%) and program staff or faculty (40%). The information sources receiving the lowest proportion were: Counsellors (12%) and Educational Advisors (20%).
Between 25% and 30% of respondents indicated that all of the information sources were consistent with other sources. The only exception was Educational Advisors (15%) and Counsellors (9%).
Lastly, the information sources for the course registration process that were not used by respondents were: Counsellors (61%) and Educational Advisors (46%). The website was the information source for which the smallest proportion of respondents indicated they did not use it (2%).
Ratings of sources of information available to students for the course registration process - detailed information
Kwantlen Polytechnic University: Institutional Analysis Planning
2009 Student Satisfaction Survey (formerly Fall Registration Survey)
December 2009
Section 3:Course Registration Process
43 of 59
Admissions staff as an information source(choose all that apply)
All students
Int students
Dom students
All students
Int students
Dom students
Easy to access 57.0% 51.5% 57.4% 61.4% 36.4% 62.7%
Timely 39.0% 40.8% 38.9% 19.5% 25.6% 19.2%
Accurate 35.5% 20.0% 36.4% 18.8% 27.1% 18.4%
Consistent with other sources
25.8% 15.4% 26.3% 12.3% 15.5% 12.1%
Didn’t use 18.1% 10.8% 18.4% 8.9% 5.4% 9.2%
Total respondents 2,482 130 2,321 2,495 129 2,338
Counsellors as an information source(choose all that apply)
Total respondents
Consistent with other sources
Accurate
Timely
Easy to access
Didn’t use
Kwantlen Polytechnic University: Institutional Analysis Planning
2009 Student Satisfaction Survey (formerly Fall Registration Survey)
December 2009
Section 3:Course Registration Process
43 of 59
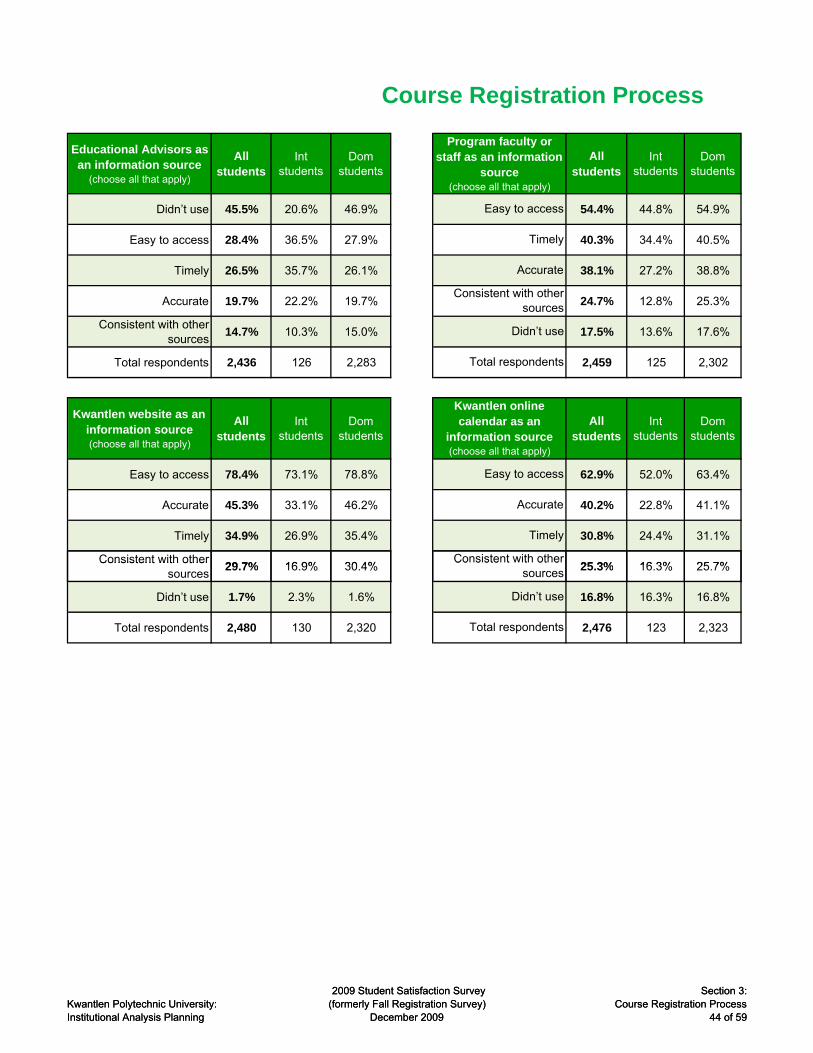
Educational Advisors as an information source
(choose all that apply)
All students
Int students
Dom students
All students
Int students
Dom students
Didn’t use 45.5% 20.6% 46.9% 54.4% 44.8% 54.9%
Easy to access 28.4% 36.5% 27.9% 40.3% 34.4% 40.5%
Timely 26.5% 35.7% 26.1% 38.1% 27.2% 38.8%
Accurate 19.7% 22.2% 19.7% 24.7% 12.8% 25.3%
Consistent with other sources
14.7% 10.3% 15.0% 17.5% 13.6% 17.6%
Total respondents 2,436 126 2,283 2,459 125 2,302
Kwantlen website as an information source(choose all that apply)
All students
Int students
Dom students
All students
Int students
Dom students
Easy to access 78.4% 73.1% 78.8% 62.9% 52.0% 63.4%
Accurate 45.3% 33.1% 46.2% 40.2% 22.8% 41.1%
Timely 34.9% 26.9% 35.4% 30.8% 24.4% 31.1%
Consistent with other 29 7% 16 9% 30 4% 25 3% 16 3% 25 7%
Total respondents
Program faculty or staff as an information
source (choose all that apply)
Easy to access
Kwantlen online calendar as an
information source(choose all that apply)
Easy to access
Accurate
Timely
Consistent with other
Timely
Accurate
Consistent with other sources
Didn’t use
Course Registration Process
Kwantlen Polytechnic University: Institutional Analysis Planning
2009 Student Satisfaction Survey (formerly Fall Registration Survey)
December 2009
Section 3:Course Registration Process
44 of 59
Consistent with other sources
29.7% 16.9% 30.4% 25.3% 16.3% 25.7%
Didn’t use 1.7% 2.3% 1.6% 16.8% 16.3% 16.8%
Total respondents 2,480 130 2,320 2,476 123 2,323Total respondents
Co s ste t t ot esources
Didn’t use
Kwantlen Polytechnic University: Institutional Analysis Planning
2009 Student Satisfaction Survey (formerly Fall Registration Survey)
December 2009
Section 3:Course Registration Process
44 of 59
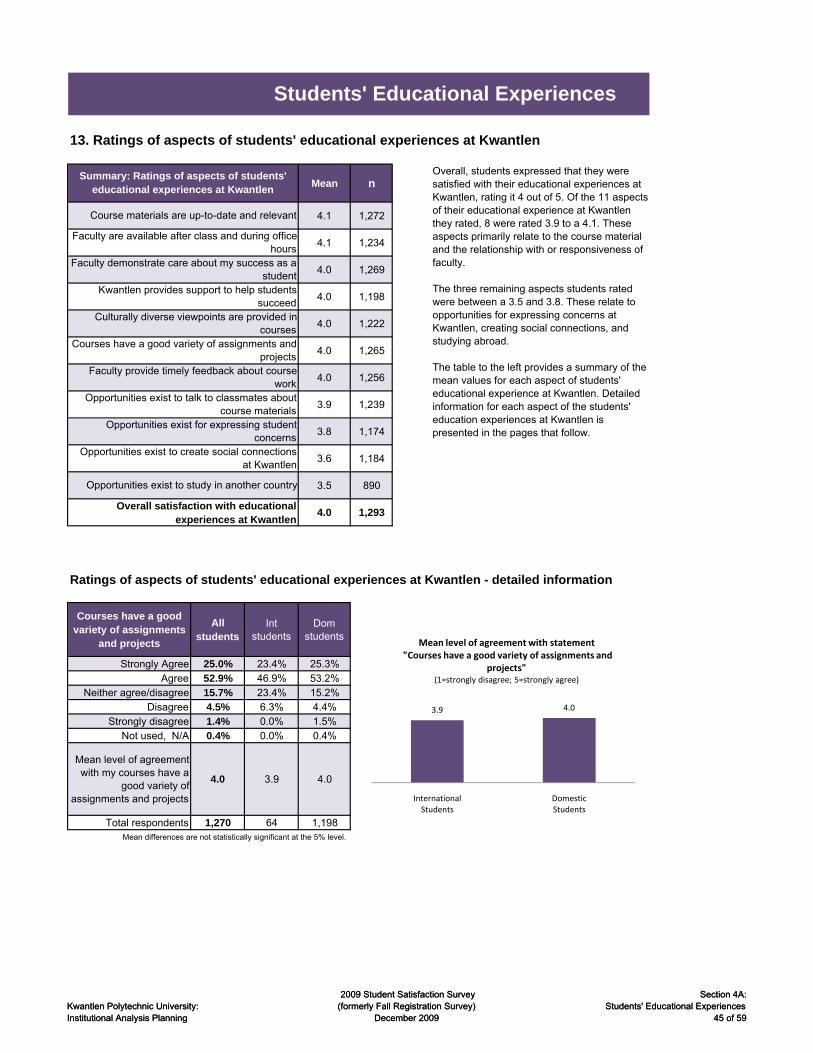
13. Ratings of aspects of students' educational experiences at Kwantlen
Mean n
4.1 1,272
4.1 1,234
4.0 1,269
4.0 1,198
4.0 1,222
4.0 1,265
4.0 1,256
3.9 1,239
3.8 1,174
3.6 1,184
3.5 890
4.0 1,293
Students' Educational Experiences
Overall, students expressed that they were satisfied with their educational experiences at Kwantlen, rating it 4 out of 5. Of the 11 aspects of their educational experience at Kwantlen they rated, 8 were rated 3.9 to a 4.1. These aspects primarily relate to the course material and the relationship with or responsiveness of faculty.
The three remaining aspects students rated were between a 3.5 and 3.8. These relate to opportunities for expressing concerns at Kwantlen, creating social connections, and studying abroad.
The table to the left provides a summary of the mean values for each aspect of students' educational experience at Kwantlen. Detailed information for each aspect of the students' education experiences at Kwantlen is presented in the pages that follow.
Opportunities exist for expressing student concerns
Opportunities exist to create social connections at Kwantlen
Opportunities exist to study in another country
Overall satisfaction with educational experiences at Kwantlen
Summary: Ratings of aspects of students' educational experiences at Kwantlen
Course materials are up-to-date and relevant
Faculty are available after class and during office hours
Faculty demonstrate care about my success as a student
Kwantlen provides support to help students succeed
Culturally diverse viewpoints are provided in courses
Courses have a good variety of assignments and projects
Faculty provide timely feedback about course work
Opportunities exist to talk to classmates about course materials
Kwantlen Polytechnic University: Institutional Analysis Planning
2009 Student Satisfaction Survey (formerly Fall Registration Survey)
December 2009
Section 4A:Students' Educational Experiences
45 of 59
Ratings of aspects of students' educational experiences at Kwantlen - detailed information
Courses have a good variety of assignments
and projects
All students
Int students
Dom students
Strongly Agree 25.0% 23.4% 25.3% Intern 3.9Agree 52.9% 46.9% 53.2% Dome 4.0
Neither agree/disagree 15.7% 23.4% 15.2%Disagree 4.5% 6.3% 4.4%
Strongly disagree 1.4% 0.0% 1.5%Not used, N/A 0.4% 0.0% 0.4%
Mean level of agreement with my courses have a
good variety of assignments and projects
4.0 3.9 4.0
Total respondents 1,270 64 1,198Mean differences are not statistically significant at the 5% level.
3.9 4.0
International Students
Domestic Students
Mean level of agreement with statement"Courses have a good variety of assignments and
projects"(1=strongly disagree; 5=strongly agree)
Kwantlen Polytechnic University: Institutional Analysis Planning
2009 Student Satisfaction Survey (formerly Fall Registration Survey)
December 2009
Section 4A:Students' Educational Experiences
45 of 59

Course materials are up-to-date and relevant
All students
Int students
Dom students
Strongly Agree 28.9% 23.1% 29.2% Intern 4.0Agree 58.1% 53.8% 58.4% Dome 4.1
Neither agree/disagree 9.2% 15.4% 8.7%Disagree 3.1% 6.2% 2.9%
Strongly disagree 0.4% 0.0% 0.3%Not used, N/A 0.5% 1.5% 0.4%
Mean level of agreement with course materials are
up-to-date and relevant4.1 4.0 4.1
Total respondents 1,278 65 1,205
Mean differences are statistically significant at the 5% level.
Culturally diverse viewpoints are provided
in courses
All students
Int students
Dom students
Strongly Agree 24.3% 25.4% 24.3% International 3.9Agree 48.3% 47.6% 48.5% Domestic 4.0
Neither agree/disagree 20.9% 15.9% 21.0%Disagree 2.1% 7.9% 1.8%
Strongly disagree 0.6% 1.6% 0.6%Not used, N/A 3.7% 1.6% 3.8%
Mean level of agreement with culturally diverse
viewpoints are provided in courses
4.0 3.9 4.0
Students' Educational Experiences
4.0 4.1
International Students
Domestic Students
Mean level of agreement with statement"Course materials are up‐to‐date and relevant"
(1=strongly disagree; 5=strongly agree)
3.9 4.0
International Students
Domestic Students
Mean level of agreement with statement"Culturally diverse viewpoints are
provided in courses"(1=strongly disagree; 5=strongly agree)
Kwantlen Polytechnic University: Institutional Analysis Planning
2009 Student Satisfaction Survey (formerly Fall Registration Survey)
December 2009
Section 4A:Students' Educational Experiences
46 of 59
in courses
Total respondents 1,269 63 1,198Test for statistical significance of mean differences is inconclusive.
Faculty are available after class and during
office hours
All students
Int students
Dom students
Strongly Agree 28.2% 18.5% 28.8% International 3.9Agree 53.6% 56.9% 53.4% Domestic 4.1
Neither agree/disagree 11.7% 21.5% 11.3%Disagree 3.1% 1.5% 3.2%
Strongly disagree 0.3% 0.0% 0.3%Not used, N/A 3.0% 1.5% 3.1%
Mean level of agreement with faculty are available
after class and during office hours
4.1 3.9 4.1
Total respondents 1,272 65 1,199Mean differences are not statistically significant at the 5% level.
4.0 4.1
International Students
Domestic Students
Mean level of agreement with statement"Course materials are up‐to‐date and relevant"
(1=strongly disagree; 5=strongly agree)
3.9 4.0
International Students
Domestic Students
Mean level of agreement with statement"Culturally diverse viewpoints are
provided in courses"(1=strongly disagree; 5=strongly agree)
3.9 4.1
International Students
Domestic Students
Mean level of agreement with statement"Faculty are available after class and
during office hours"(1=strongly disagree; 5=strongly agree)
Kwantlen Polytechnic University: Institutional Analysis Planning
2009 Student Satisfaction Survey (formerly Fall Registration Survey)
December 2009
Section 4A:Students' Educational Experiences
46 of 59
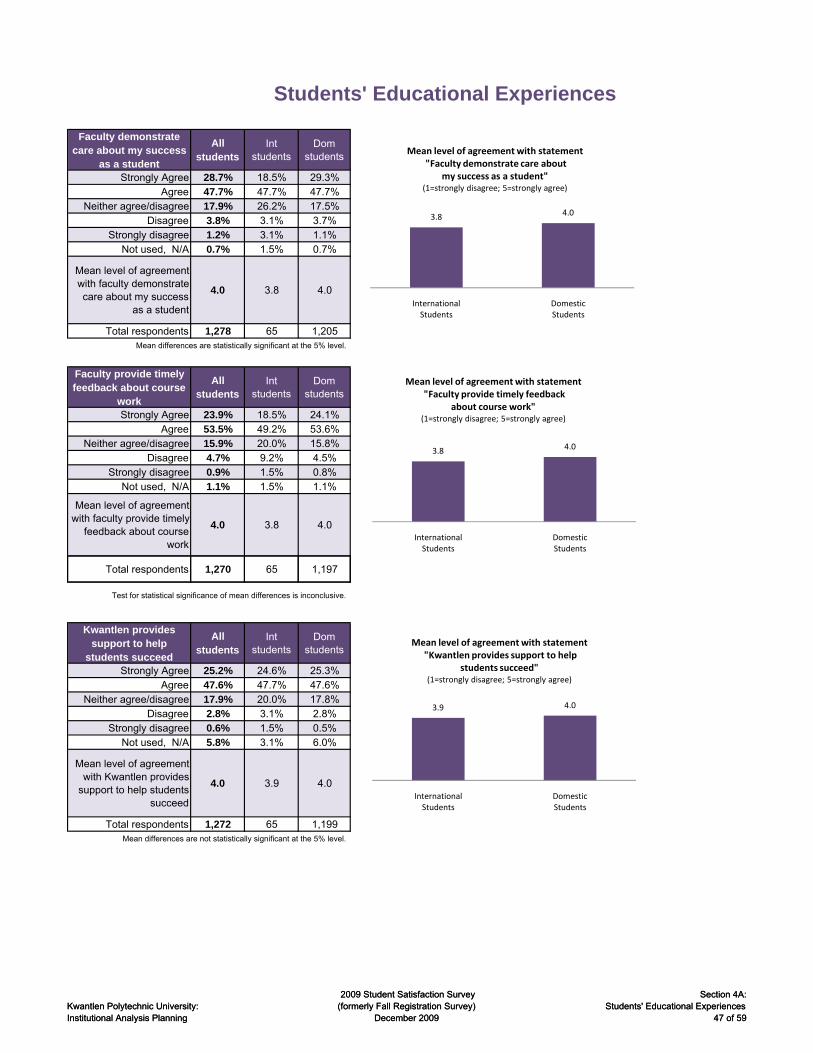
Faculty demonstrate care about my success
as a student
All students
Int students
Dom students
Strongly Agree 28.7% 18.5% 29.3% International 3.8Agree 47.7% 47.7% 47.7% Domestic 4.0
Neither agree/disagree 17.9% 26.2% 17.5%Disagree 3.8% 3.1% 3.7%
Strongly disagree 1.2% 3.1% 1.1%Not used, N/A 0.7% 1.5% 0.7%
Mean level of agreement with faculty demonstrate care about my success
as a student
4.0 3.8 4.0
Total respondents 1,278 65 1,205Mean differences are statistically significant at the 5% level.
Faculty provide timely feedback about course
work
All students
Int students
Dom students
Strongly Agree 23.9% 18.5% 24.1% International 3.8Agree 53.5% 49.2% 53.6% Domestic 4.0
Neither agree/disagree 15.9% 20.0% 15.8%Disagree 4.7% 9.2% 4.5%
Strongly disagree 0.9% 1.5% 0.8%Not used, N/A 1.1% 1.5% 1.1%
Mean level of agreement with faculty provide timely
feedback about course work
4.0 3.8 4.0
Students' Educational Experiences
3.8 4.0
International Students
Domestic Students
Mean level of agreement with statement"Faculty demonstrate care about
my success as a student"(1=strongly disagree; 5=strongly agree)
3.8 4.0
International Students
Domestic Students
Mean level of agreement with statement"Faculty provide timely feedback
about course work"(1=strongly disagree; 5=strongly agree)
Kwantlen Polytechnic University: Institutional Analysis Planning
2009 Student Satisfaction Survey (formerly Fall Registration Survey)
December 2009
Section 4A:Students' Educational Experiences
47 of 59
Total respondents 1,270 65 1,197
Test for statistical significance of mean differences is inconclusive.
Kwantlen provides support to help
students succeed
All students
Int students
Dom students
Strongly Agree 25.2% 24.6% 25.3% International 3.9Agree 47.6% 47.7% 47.6% Domestic 4.0
Neither agree/disagree 17.9% 20.0% 17.8%Disagree 2.8% 3.1% 2.8%
Strongly disagree 0.6% 1.5% 0.5%Not used, N/A 5.8% 3.1% 6.0%
Mean level of agreement with Kwantlen provides
support to help students succeed
4.0 3.9 4.0
Total respondents 1,272 65 1,199Mean differences are not statistically significant at the 5% level.
3.8 4.0
International Students
Domestic Students
Mean level of agreement with statement"Faculty demonstrate care about
my success as a student"(1=strongly disagree; 5=strongly agree)
3.8 4.0
International Students
Domestic Students
Mean level of agreement with statement"Faculty provide timely feedback
about course work"(1=strongly disagree; 5=strongly agree)
3.9 4.0
International Students
Domestic Students
Mean level of agreement with statement"Kwantlen provides support to help
students succeed"(1=strongly disagree; 5=strongly agree)
Kwantlen Polytechnic University: Institutional Analysis Planning
2009 Student Satisfaction Survey (formerly Fall Registration Survey)
December 2009
Section 4A:Students' Educational Experiences
47 of 59

Opportunities exist for expressing student
concerns
All students
Int students
Dom students
Strongly Agree 19.3% 15.4% 19.6% International 3.8Agree 45.0% 49.2% 44.6% Students 3.8
Neither agree/disagree 18.9% 26.2% 18.6%Disagree 7.3% 3.1% 7.4%
Strongly disagree 2.0% 1.5% 1.9%Not used, N/A 7.6% 4.6% 7.8%
Mean level of agreement with opportunities exist for expressing student
concerns
3.8 3.8 3.8
Total respondents 1,270 65 1,197ean differences are not statistically significant at the 5% level.
Opportunities exist to create social
connections at Kwantlen
All students
Int students
Dom students
Strongly Agree 16.9% 18.5% 16.9% International 3.7Agree 39.7% 41.5% 39.6% Students 3.6
Neither agree/disagree 23.4% 23.1% 23.4%Disagree 9.9% 7.7% 9.9%
Strongly disagree 3.2% 1.5% 3.3%Not used, N/A 6.8% 7.7% 6.8%
Mean level of agreement with opportunities exist to create social connections
3.6 3.7 3.6
Students' Educational Experiences
3.8 3.8
International Students
Domestic Students
Mean level of agreement with statement"Opportunities exist for expressing
student concerns"(1=strongly disagree; 5=strongly agree)
3.7 3.6
International Domestic
Mean level of agreement with statement"Opportunities exist to create social
connections at Kwantlen"(1=strongly disagree; 5=strongly agree)
Kwantlen Polytechnic University: Institutional Analysis Planning
2009 Student Satisfaction Survey (formerly Fall Registration Survey)
December 2009
Section 4A:Students' Educational Experiences
48 of 59
Total respondents 1,271 65 1,198Mean differences are not statistically significant at the 5% level.
Opportunities exist to talk to classmates
about course materials
All students
Int students
Dom students
Strongly Agree 24.6% 23.8% 24.8% International 3.8Agree 51.4% 42.9% 51.8% Domestic 4.0
Neither agree/disagree 15.3% 22.2% 14.8%Disagree 5.4% 7.9% 5.3%
Strongly disagree 1.2% 1.6% 1.2%Not used, N/A 2.1% 1.6% 2.2%
Mean level of agreement with opportunities exist to talk to classmates about
course materials
3.9 3.8 4.0
Total respondents 1,266 63 1,195Test for statistical significance of mean differences is inconclusive.
3.8 3.8
International Students
Domestic Students
Mean level of agreement with statement"Opportunities exist for expressing
student concerns"(1=strongly disagree; 5=strongly agree)
3.7 3.6
International Students
Domestic Students
Mean level of agreement with statement"Opportunities exist to create social
connections at Kwantlen"(1=strongly disagree; 5=strongly agree)
3.8 4.0
International Students
Domestic Students
Mean level of agreement with statement"Opportunities exist to talk to classmates
about course materials"(1=strongly disagree; 5=strongly agree)
Kwantlen Polytechnic University: Institutional Analysis Planning
2009 Student Satisfaction Survey (formerly Fall Registration Survey)
December 2009
Section 4A:Students' Educational Experiences
48 of 59
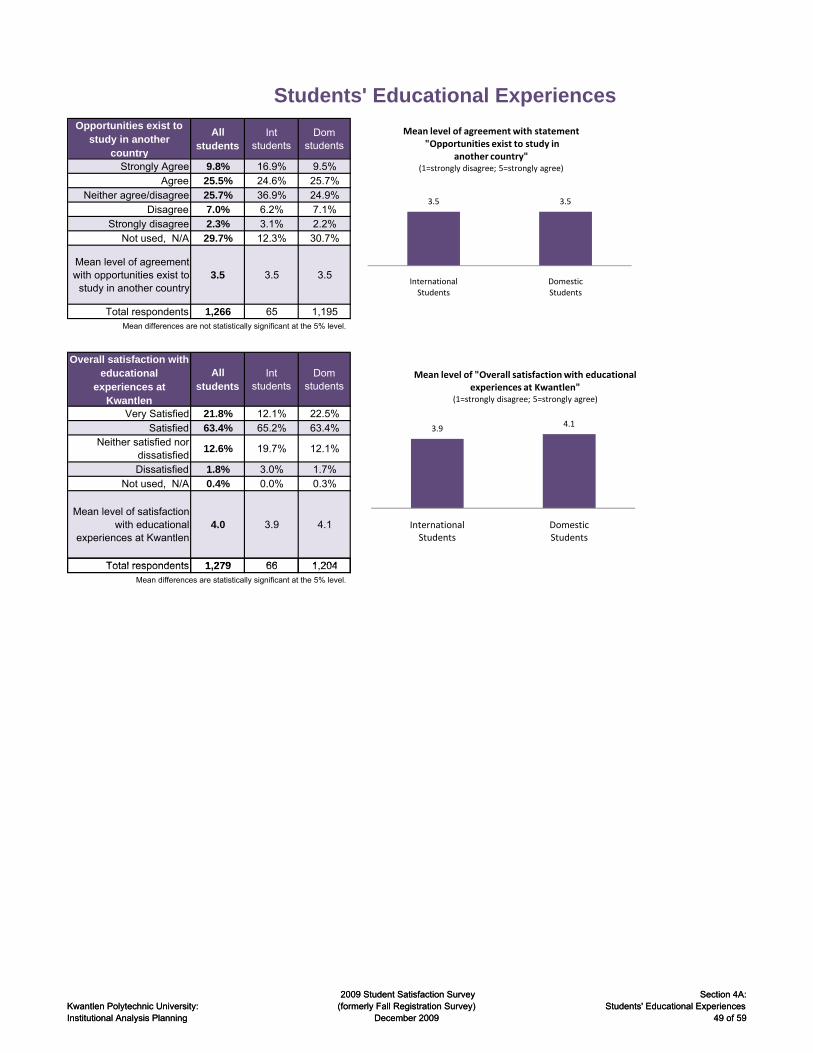
Opportunities exist to study in another
country
All students
Int students
Dom students
Strongly Agree 9.8% 16.9% 9.5% International 3.5Agree 25.5% 24.6% 25.7% Domestic 3.5
Neither agree/disagree 25.7% 36.9% 24.9%Disagree 7.0% 6.2% 7.1%
Strongly disagree 2.3% 3.1% 2.2%Not used, N/A 29.7% 12.3% 30.7%
Mean level of agreement with opportunities exist to
study in another country3.5 3.5 3.5
Total respondents 1,266 65 1,195Mean differences are not statistically significant at the 5% level.
Overall satisfaction with educational
experiences at Kwantlen
All students
Int students
Dom students
Very Satisfied 21.8% 12.1% 22.5% International 3.9Satisfied 63.4% 65.2% 63.4% Domestic 4.1
Neither satisfied nor dissatisfied
12.6% 19.7% 12.1%
Dissatisfied 1.8% 3.0% 1.7%Not used, N/A 0.4% 0.0% 0.3%
Mean level of satisfaction with educational
experiences at Kwantlen4.0 3.9 4.1
Total respondents 1 279 66 1 204
Students' Educational Experiences
3.5 3.5
International Students
Domestic Students
Mean level of agreement with statement"Opportunities exist to study in
another country"(1=strongly disagree; 5=strongly agree)
3.94.1
International Students
Domestic Students
Mean level of "Overall satisfaction with educational experiences at Kwantlen"
(1=strongly disagree; 5=strongly agree)
Kwantlen Polytechnic University: Institutional Analysis Planning
2009 Student Satisfaction Survey (formerly Fall Registration Survey)
December 2009
Section 4A:Students' Educational Experiences
49 of 59
Total respondents 1,279 66 1,204Mean differences are statistically significant at the 5% level.
Kwantlen Polytechnic University: Institutional Analysis Planning
2009 Student Satisfaction Survey (formerly Fall Registration Survey)
December 2009
Section 4A:Students' Educational Experiences
49 of 59

Kwantlen Polytechnic University: Institutional Analysis Planning
2009 Student Satisfaction Survey (formerly Fall Registration Survey)
December 2009
Section 4A:Students' Educational Experiences
50 of 59Kwantlen Polytechnic University: Institutional Analysis Planning
2009 Student Satisfaction Survey (formerly Fall Registration Survey)
December 2009
Section 4A:Students' Educational Experiences
50 of 59

14. Ratings of aspects of student support services at Kwantlen
Mean n
4.3 10
4.2 9
4.1 1,092
4.0 1,278
3.8 1,156
3.8 691
3.7 584
3.7 628
3.6 529
3.6 571
3.6 875
3.6 1,019
3.6 822
3.5 1,171
3.5 1,037
Student Support Services
Start-up sessions held before course registration
Counselling Services (i.e., help with personal problems, career advice)
Convenience of Student Services hours
Learning materials in bookstores
Educational Advising Services (i.e., help with program planning and course selection)
Space available to meet or study with otherstudents
Cafeteria operating hours (not Grassroots)
Summary: Ratings of aspects of student support services at Kwantlen
Students rated their overall satisfaction with student support services a 3.7 out of 5. Of the various aspects of student support services students were asked to rate, accessibility to computer labs, adequacy of library resources, adequacy of library services, and usefulness of the myKwantlen web portal received a 4.0 or higher. Thirteen of the twenty aspects of student support services that students rated had a mean of a 3.4 to 3.8. The factors that received the lowest rating related to the cafeteria and recreational services on campus, with mean values ranging from 2.4 to 2.9.
The table to the left provides a summary of the mean values for each aspect of student support services at Kwantlen. Detailed information for each aspect of student support services at Kwantlen is presented in the pages that follow.
(Please note: Accessibility to the computer labs and adequacy of library resources received the highest rating, 4.3 and 4.2, respectively. However, only about 10 students rated these two aspects of student support services. )
Tutoring help available in the Learning Centres
Computer technical assistance (i.e., service desk)
Student orientations held before classes start
Space available to study on your own
Accessibility of computer labs
Adequacy of library resources (e.g., books, journals)
Adequacy of library services (e.g., orientation, reference)
Usefulness of myKwantlen web portal
Kwantlen Polytechnic University: Institutional Analysis Planning
2009 Student Satisfaction Survey (formerly Fall Registration Survey)
December 2009
Section 4b:Student Support Services
51 of 59
,
3.4 677
2.9 1,124
2.8 655
2.4 1,062
3.7 1,293Overall satisfaction with student support
services at Kwantlen
Quality of food provided by the cafeteria (not Grassroots)
Price of food in the cafeteria (not Grassroots)
(not Grassroots)
Student Employment Services
Recreational activities on campus
Kwantlen Polytechnic University: Institutional Analysis Planning
2009 Student Satisfaction Survey (formerly Fall Registration Survey)
December 2009
Section 4b:Student Support Services
51 of 59

Ratings of aspects of student support services at Kwantlen - detailed information
Start-up sessions held before course registration
All students
Int students
Dom students
Very Satisfied 8.0% 14.1% 7.6% Internat 3.8Satisfied 19.1% 35.9% 18.2% Domest 3.6
Neither satisfied nor dissatisfied
20.2% 23.4% 19.9%
Dissatisfied 2.4% 3.1% 2.3%Very dissatisfied 0.6% 0.0% 0.6%
Didn't know about it 18.3% 10.9% 18.7%Knew about it but have
not used31.5% 12.5% 32.6%
Mean satisfaction Start-up sessions
3.6 3.8 3.6
Total respondents 1,268 64 1,190Mean differences are not statistically significant at the 5% level.
Student orientations held before classes
start
All students
Int students
Dom students
Very Satisfied 10.7% 22.6% 10.0% Inte 3.9Satisfied 22.0% 32.3% 21.6% Do 3.7
Neither satisfied nor dissatisfied
17.7% 21.0% 17.3%
Dissatisfied 2.8% 1.6% 2.9%Very dissatisfied 1.0% 1.6% 1.0%
Didn't know about it 8.3% 6.5% 8.3%Knew about it but have
not used37.5% 14.5% 39.0%
Mean satisfaction student orientations
3.7 3.9 3.7
Total respondents 1,268 62 1 192
Student Support Services
3.83.6
International Students
Domestic Students
Mean level of satisfaction with"Start‐Up sessions held before
course registration"(1=very dissatisfied; 5=very satisfied)
3.93.7
International Students
Domestic Students
Mean level of satisfaction with "Student orientations held
before classes start"(1=very dissatisfied; 5=very satisfied)
Kwantlen Polytechnic University: Institutional Analysis Planning
2009 Student Satisfaction Survey (formerly Fall Registration Survey)
December 2009
Section 4b:Student Support Services
52 of 59
Total respondents 1,268 62 1,192
Mean differences are not statistically significant at the 5% level.
Convenience of student services hours
All students
Int students
Dom students
Very Satisfied 10.4% 10.2% Internat 3.8Satisfied 30.3% 35.9% 29.8% Domest 3.6
Neither satisfied nor dissatisfied
21.5% 23.4% 21.5%
Dissatisfied 6.1% 4.7% 6.1%Very dissatisfied 1.5% 0.0% 1.6%
Didn't know about it 7.5% 3.1% 7.7%Knew about it but have
not used22.7% 15.6% 23.1%
Mean satisfaction student services hours
3.6 3.8 3.6
Total respondents 1,267 64 1,189Mean differences are not statistically significant at the 5% level.
3.83.6
International Students
Domestic Students
Mean level of satisfaction with"Start‐Up sessions held before
course registration"(1=very dissatisfied; 5=very satisfied)
3.93.7
International Students
Domestic Students
Mean level of satisfaction with "Student orientations held
before classes start"(1=very dissatisfied; 5=very satisfied)
3.83.6
International Students
Domestic Students
Mean level of satisfaction with "Convenience of student services hours"
(1=very dissatisfied; 5=very satisfied)
Kwantlen Polytechnic University: Institutional Analysis Planning
2009 Student Satisfaction Survey (formerly Fall Registration Survey)
December 2009
Section 4b:Student Support Services
52 of 59

Counselling Services All
studentsInt
studentsDom
studentsVery Satisfied 8.1% 15.9% 7.7% Internat 3.8
Satisfied 18.0% 28.6% 17.5% Domest 3.6Neither satisfied nor
dissatisfied14.8% 19.0% 14.6%
Dissatisfied 3.3% 4.8% 3.3%Very dissatisfied 1.3% 1.6% 1.3%
Didn't know about it 3.9% 1.6% 4.0%Knew about it but have
not used50.6% 28.6% 51.7%
Mean satisfaction Counselling Services
3.6 3.8 3.6
Total respondents 1,266 63 1,189Mean differences are not statistically significant at the 5% level.
Educational Advising Services
All students
Int students
Dom students
Very Satisfied 11.4% 23.4% 10.8% Internat 3.8Satisfied 26.9% 34.4% 26.6% Domest 3.5
Neither satisfied nor dissatisfied
17.4% 17.2% 17.4%
Dissatisfied 6.6% 4.7% 6.6%
Very dissatisfied 3.3% 4.7% 3.2%
Didn't know about it 3.9% 3.1% 3.9%Knew about it but have
not used30.6% 12.5% 31.5%
Mean satisfaction Educational Advising
Services3.6 3.8 3.5
Total respondents 1,266 64 1,188Mean differences are not statistically significant at the 5% level.
Student Support Services
3.83.6
International Students
Domestic Students
Mean level of satisfaction with "Counselling Services"
(1=very dissatisfied; 5=very satisfied)
3.83.5
International Students
Domestic Students
Mean level of satisfaction with "Educational Advising Services"(1=very dissatisfied; 5=very satisfied)
Kwantlen Polytechnic University: Institutional Analysis Planning
2009 Student Satisfaction Survey (formerly Fall Registration Survey)
December 2009
Section 4b:Student Support Services
53 of 59
Student Employment Services
All students
Int students
Dom students
Very Satisfied 5.3% 9.2% 5.0% Internat 3.6Satisfied 13.4% 27.7% 12.5% Domest 3.3
Neither satisfied nor dissatisfied
16.6% 21.5% 16.3%
Dissatisfied 5.0% 4.6% 5.0%Very dissatisfied 2.0% 1.5% 2.0%
Didn't know about it 13.4% 10.8% 13.5%Knew about it but have
not used44.4% 24.6% 45.6%
Mean satisfaction Student Employment
Services3.4 3.6 3.3
Total respondents 1,270 65 1,191Mean differences are not statistically significant at the 5% level.
3.83.6
International Students
Domestic Students
Mean level of satisfaction with "Counselling Services"
(1=very dissatisfied; 5=very satisfied)
3.83.5
International Students
Domestic Students
Mean level of satisfaction with "Educational Advising Services"(1=very dissatisfied; 5=very satisfied)
3.63.3
International Students
Domestic Students
Mean level of satisfaction with "Student Employment Services"(1=very dissatisfied; 5=very satisfied)
Kwantlen Polytechnic University: Institutional Analysis Planning
2009 Student Satisfaction Survey (formerly Fall Registration Survey)
December 2009
Section 4b:Student Support Services
53 of 59
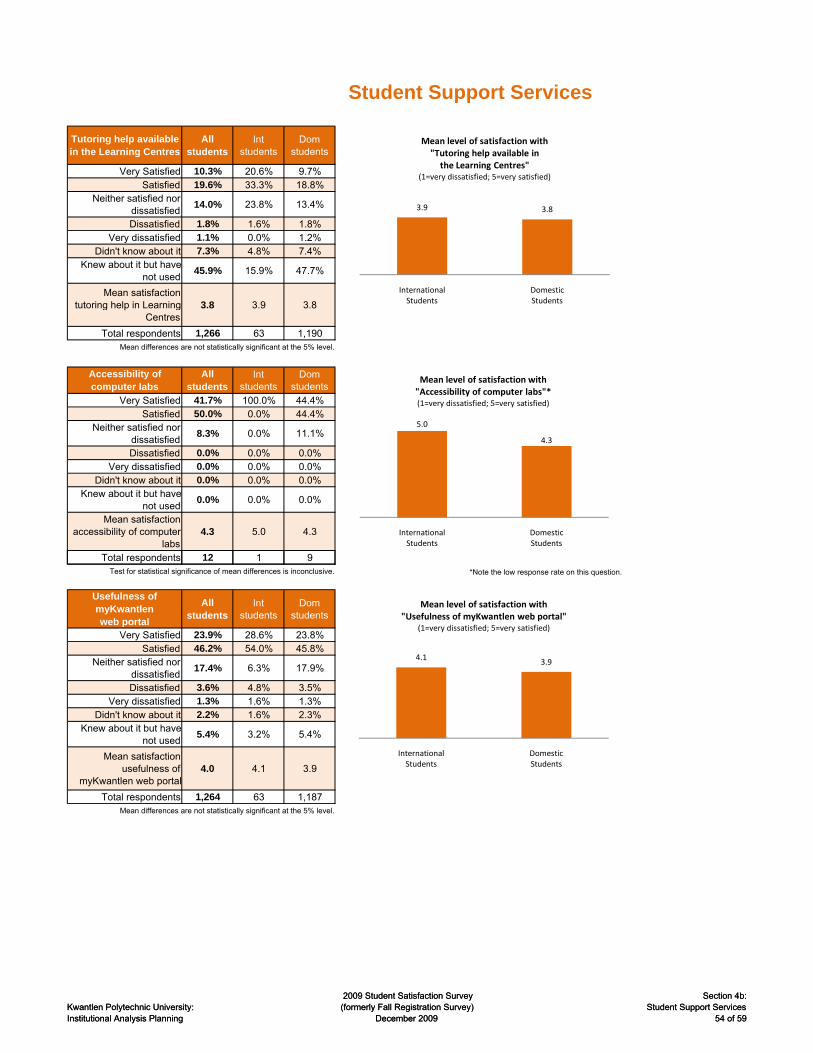
Tutoring help available in the Learning Centres
All students
Int students
Dom students
Very Satisfied 10.3% 20.6% 9.7% Internati 3.9Satisfied 19.6% 33.3% 18.8% c 3.8
Neither satisfied nor dissatisfied
14.0% 23.8% 13.4%
Dissatisfied 1.8% 1.6% 1.8%Very dissatisfied 1.1% 0.0% 1.2%
Didn't know about it 7.3% 4.8% 7.4%Knew about it but have
not used45.9% 15.9% 47.7%
Mean satisfaction tutoring help in Learning
Centres3.8 3.9 3.8
Total respondents 1,266 63 1,190Mean differences are not statistically significant at the 5% level.
Accessibility of computer labs
All students
Int students
Dom students
Very Satisfied 41.7% 100.0% 44.4% Internati 5.0Satisfied 50.0% 0.0% 44.4% c 4.3
Neither satisfied nor dissatisfied
8.3% 0.0% 11.1%
Dissatisfied 0.0% 0.0% 0.0%Very dissatisfied 0.0% 0.0% 0.0%
Didn't know about it 0.0% 0.0% 0.0%Knew about it but have
not used0.0% 0.0% 0.0%
Mean satisfaction accessibility of computer
labs4.3 5.0 4.3
Total respondents 12 1 9
Student Support Services
5.0
4.3
International Students
Domestic Students
Mean level of satisfaction with "Accessibility of computer labs"*(1=very dissatisfied; 5=very satisfied)
3.9 3.8
International Students
Domestic Students
Mean level of satisfaction with "Tutoring help available in the Learning Centres"
(1=very dissatisfied; 5=very satisfied)
Kwantlen Polytechnic University: Institutional Analysis Planning
2009 Student Satisfaction Survey (formerly Fall Registration Survey)
December 2009
Section 4b:Student Support Services
54 of 59
pTest for statistical significance of mean differences is inconclusive. *Note the low response rate on this question.
Usefulness of myKwantlen web portal
All students
Int students
Dom students
Very Satisfied 23.9% 28.6% 23.8% Internat 4.1Satisfied 46.2% 54.0% 45.8% Domest 3.9
Neither satisfied nor dissatisfied
17.4% 6.3% 17.9%
Dissatisfied 3.6% 4.8% 3.5%Very dissatisfied 1.3% 1.6% 1.3%
Didn't know about it 2.2% 1.6% 2.3%Knew about it but have
not used5.4% 3.2% 5.4%
Mean satisfaction usefulness of
myKwantlen web portal4.0 4.1 3.9
Total respondents 1,264 63 1,187Mean differences are not statistically significant at the 5% level.
5.0
4.3
International Students
Domestic Students
Mean level of satisfaction with "Accessibility of computer labs"*(1=very dissatisfied; 5=very satisfied)
3.9 3.8
International Students
Domestic Students
Mean level of satisfaction with "Tutoring help available in the Learning Centres"
(1=very dissatisfied; 5=very satisfied)
4.13.9
International Students
Domestic Students
Mean level of satisfaction with "Usefulness of myKwantlen web portal"
(1=very dissatisfied; 5=very satisfied)
Kwantlen Polytechnic University: Institutional Analysis Planning
2009 Student Satisfaction Survey (formerly Fall Registration Survey)
December 2009
Section 4b:Student Support Services
54 of 59

Computer technical assistance
All students
Int students
Dom students
Very Satisfied 11.4% 18.8% 11.2% Internat 4.0Satisfied 24.4% 45.3% 23.2% Domest 3.8
Neither satisfied nor dissatisfied
15.3% 14.1% 15.4%
Dissatisfied 2.9% 1.6% 3.0%Very dissatisfied 0.9% 0.0% 1.0%
Didn't know about it 10.9% 7.8% 11.2%Knew about it but have
not used34.1% 12.5% 35.2%
Mean satisfaction computer technical
assistance3.8 4.0 3.8
Total respondents 1,270 64 1,192Mean differences are statistically significant at the 5% level.
Adequacy of Library resources
All students
Int students
Dom students
Very Satisfied 45.5% 100.0% 37.5% Internat 5.0Satisfied 27.3% 0.0% 25.0% Domest 4.0
Neither satisfied nor dissatisfied
27.3% 0.0% 37.5%
Dissatisfied 0.0% 0.0% 0.0%Very dissatisfied 0.0% 0.0% 0.0%
Didn't know about it 0.0% 0.0% 0.0%Knew about it but have
not used0.0% 0.0% 0.0%
Mean satisfaction adequacy of Library
resources4.2 5.0 4.0
Total respondents 11 1 8Test for statistical significance of mean differences is inconclusive. *Note the low response rate on this question.
Student Support Services
4.03.8
International Students
Domestic Students
Mean level of satisfaction with "Computer technical assistance"(1=very dissatisfied; 5=very satisfied)
5.0
4.0
International Students
Domestic Students
Mean level of satisfaction with "Adequacy of Library resources"(1=very dissatisfied; 5=very satisfied)
Kwantlen Polytechnic University: Institutional Analysis Planning
2009 Student Satisfaction Survey (formerly Fall Registration Survey)
December 2009
Section 4b:Student Support Services
55 of 59
Adequacy of Library services
All students
Int students
Dom students
Very Satisfied 27.1% 18.8% 27.4% Internat 4.0Satisfied 45.4% 53.1% 45.0% Domest 4.1
Neither satisfied nor dissatisfied
11.6% 14.1% 11.5%
Dissatisfied 2.2% 3.1% 2.2%Very dissatisfied 0.5% 0.0% 0.5%
Didn't know about it 1.8% 3.1% 1.8%Knew about it but have
not used11.4% 7.8% 11.6%
Mean satisfaction adequacy of Library
services4.1 4.0 4.1
Total respondents 1,273 64 1,195Mean differences are not statistically significant at the 5% level.
4.03.8
International Students
Domestic Students
Mean level of satisfaction with "Computer technical assistance"(1=very dissatisfied; 5=very satisfied)
5.0
4.0
International Students
Domestic Students
Mean level of satisfaction with "Adequacy of Library resources"(1=very dissatisfied; 5=very satisfied)
4.0 4.1
International Students
Domestic Students
Mean level of satisfaction with "Adequacy of Library services"(1=very dissatisfied; 5=very satisfied)
Kwantlen Polytechnic University: Institutional Analysis Planning
2009 Student Satisfaction Survey (formerly Fall Registration Survey)
December 2009
Section 4b:Student Support Services
55 of 59

Space available to meet or study with other
students
All students
Int students
Dom students
Very Satisfied 16.1% 17.5% 15.9% Internat 3.6Satisfied 37.6% 39.7% 37.4% Domest 3.5
Neither satisfied nor dissatisfied
18.2% 20.6% 18.2%
Dissatisfied 12.8% 7.9% 13.2%Very dissatisfied 4.9% 4.8% 4.8%
Didn't know about it 2.4% 3.2% 2.3%Knew about it but have
not used8.1% 6.3% 8.2%
Mean satisfaction space available to meet or
study with other students3.5 3.6 3.5
Total respondents 1,270 63 1,193Mean differences are not statistically significant at the 5% level.
Space available to study on your own
All students
Int students
Dom students
Very Satisfied 18.6% 21.9% 18.4% Internat 3.8Satisfied 43.7% 42.2% 43.8% Domest 3.7
Neither satisfied nor dissatisfied
17.0% 25.0% 16.6%
Dissatisfied 9.0% 4.7% 9.3%Very dissatisfied 4.5% 3.1% 4.5%
Didn't know about it 1.6% 1.6% 1.6%Knew about it but have
not used5.6% 1.6% 5.8%
Mean satisfaction space available to study on your
own3.7 3.8 3.7
Total respondents 1 276 64 1 198
Student Support Services
3.6 3.5
International Students
Domestic Students
Mean level of satisfaction with "Space available to meet or study
with other students"(1=very dissatisfied; 5=very satisfied)
3.8 3.7
International Students
Domestic Students
Mean level of satisfaction with "Space available to study on your own"
(1=very dissatisfied; 5=very satisfied)
Kwantlen Polytechnic University: Institutional Analysis Planning
2009 Student Satisfaction Survey (formerly Fall Registration Survey)
December 2009
Section 4b:Student Support Services
56 of 59
Total respondents 1,276 64 1,198Mean differences are not statistically significant at the 5% level.
Learning materials in bookstores
All students
Int students
Dom students
Very Satisfied 12.0% 11.1% 11.8% Internat 3.6Satisfied 35.0% 42.9% 34.8% Domest 3.6
Neither satisfied nor dissatisfied
24.2% 20.6% 24.5%
Dissatisfied 7.5% 9.5% 7.4%Very dissatisfied 2.4% 1.6% 2.4%
Didn't know about it 4.6% 4.8% 4.5%Knew about it but have
not used14.4% 9.5% 14.7%
Mean satisfaction learning materials in
bookstores3.6 3.6 3.6
Total respondents 1,270 63 1,194Mean differences are not statistically significant at the 5% level.
3.6 3.5
International Students
Domestic Students
Mean level of satisfaction with "Space available to meet or study
with other students"(1=very dissatisfied; 5=very satisfied)
3.8 3.7
International Students
Domestic Students
Mean level of satisfaction with "Space available to study on your own"
(1=very dissatisfied; 5=very satisfied)
3.6 3.6
International Students
Domestic Students
Mean level of satisfaction with"Learning materials in bookstores"(1=very dissatisfied; 5=very satisfied)
Kwantlen Polytechnic University: Institutional Analysis Planning
2009 Student Satisfaction Survey (formerly Fall Registration Survey)
December 2009
Section 4b:Student Support Services
56 of 59

Recreational activities on campus
All students
Int students
Dom students
Very Satisfied 4.7% 9.2% 4.4% Internat 3.3Satisfied 10.8% 26.2% 9.9% Domest 2.9
Neither satisfied nor dissatisfied
18.9% 20.0% 18.9%
Dissatisfied 11.3% 15.4% 11.0%Very dissatisfied 6.4% 4.6% 6.4%
Didn't know about it 13.6% 7.7% 14.1%Knew about it but have
not used34.2% 16.9% 35.2%
Mean satisfaction recreational activities on
campus2.9 3.3 2.9
Total respondents 1,273 65 1,195Mean differences are statistically significant at the 5% level.
Cafeteria operating hours
(not Grassroots)
All students
Int students
Dom students
Very Satisfied 13.3% 9.2% 13.5% Internat 3.6Satisfied 35.8% 49.2% 35.0% Domest 3.5
Neither satisfied nor dissatisfied
18.6% 16.9% 18.7%
Dissatisfied 9.8% 12.3% 9.8%Very dissatisfied 4.9% 1.5% 4.9%
Didn't know about it 3.9% 4.6% 3.9%Knew about it but have
not used13.6% 6.2% 14.1%
Mean satisfaction cafeteria hours
3.5 3.6 3.5
Total respondents 1,274 65 1,195Mean differences are not statistically significant at the 5% level.
Student Support Services
3.32.9
International Students
Domestic Students
Mean level of satisfaction with"Recreational activities on campus"(1=very dissatisfied; 5=very satisfied)
3.6 3.5
International Students
Domestic Students
Mean level of satisfaction with "Cafeteria operating hours
(not Grassroots)"(1=very dissatisfied; 5=very satisfied)
Kwantlen Polytechnic University: Institutional Analysis Planning
2009 Student Satisfaction Survey (formerly Fall Registration Survey)
December 2009
Section 4b:Student Support Services
57 of 59
Price of food in the cafeteria
(not Grassroots)
All students
Int students
Dom students
Very Satisfied 4.3% 6.3% 4.2% Internat 2.8Satisfied 13.4% 18.8% 13.0% Domest 2.4
Neither satisfied nor dissatisfied
17.7% 28.1% 17.1%
Dissatisfied 27.9% 21.9% 28.4%
Very dissatisfied 21.5% 14.1% 21.8%
Didn't know about it 3.9% 4.7% 3.9%Knew about it but have
not used11.3% 6.3% 11.7%
Mean satisfaction price of food in the cafeteria
2.4 2.8 2.4
Total respondents 1,268 64 1,190Mean differences are statistically significant at the 5% level.
3.32.9
International Students
Domestic Students
Mean level of satisfaction with"Recreational activities on campus"(1=very dissatisfied; 5=very satisfied)
3.6 3.5
International Students
Domestic Students
Mean level of satisfaction with "Cafeteria operating hours
(not Grassroots)"(1=very dissatisfied; 5=very satisfied)
2.82.4
International Students
Domestic Students
Mean level of satisfaction with "Price of food in the cafeteria
(not Grassroots)"(1=very dissatisfied; 5=very satisfied)
Kwantlen Polytechnic University: Institutional Analysis Planning
2009 Student Satisfaction Survey (formerly Fall Registration Survey)
December 2009
Section 4b:Student Support Services
57 of 59
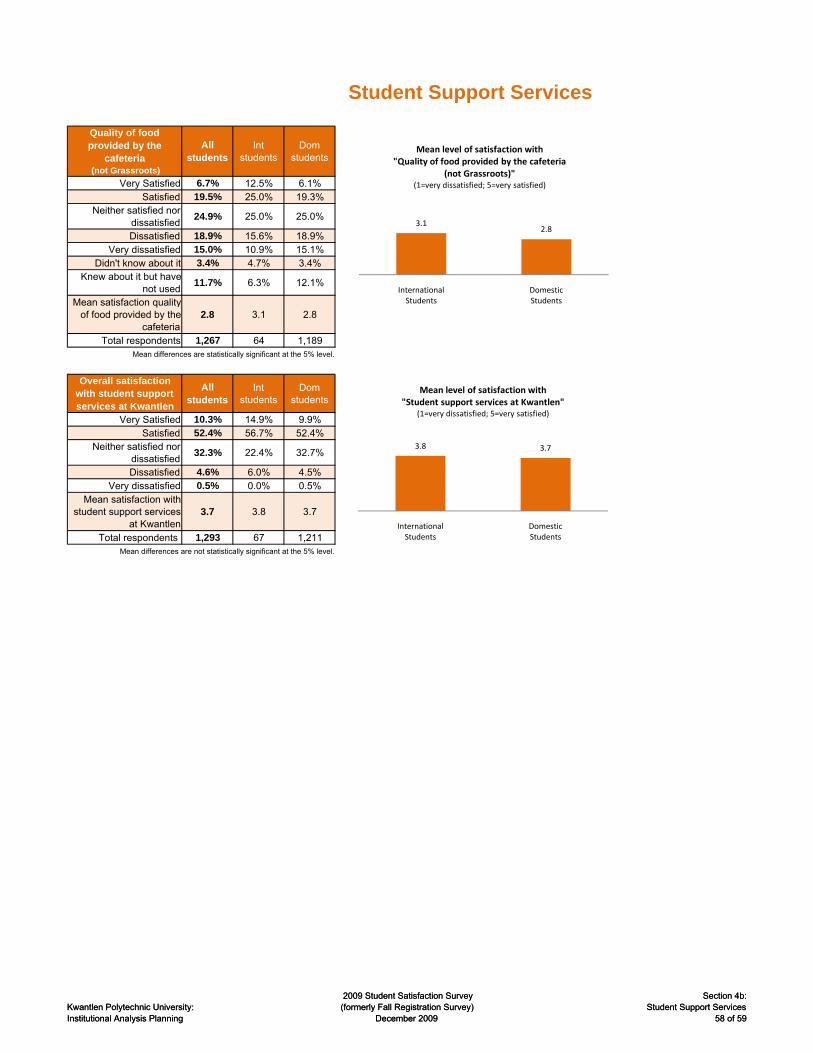
Quality of food provided by the
cafeteria (not Grassroots)
All students
Int students
Dom students
Very Satisfied 6.7% 12.5% 6.1% Internat 3.1Satisfied 19.5% 25.0% 19.3% Domest 2.8
Neither satisfied nor dissatisfied
24.9% 25.0% 25.0%
Dissatisfied 18.9% 15.6% 18.9%Very dissatisfied 15.0% 10.9% 15.1%
Didn't know about it 3.4% 4.7% 3.4%Knew about it but have
not used11.7% 6.3% 12.1%
Mean satisfaction quality of food provided by the
cafeteria2.8 3.1 2.8
Total respondents 1,267 64 1,189Mean differences are statistically significant at the 5% level.
Overall satisfaction with student support services at Kwantlen
All students
Int students
Dom students
Very Satisfied 10.3% 14.9% 9.9% Internat 3.8Satisfied 52.4% 56.7% 52.4% Domest 3.7
Neither satisfied nor dissatisfied
32.3% 22.4% 32.7%
Dissatisfied 4.6% 6.0% 4.5%Very dissatisfied 0.5% 0.0% 0.5%
Mean satisfaction with student support services
at Kwantlen3.7 3.8 3.7
Total respondents 1,293 67 1,211Mean differences are not statistically significant at the 5% level.
Student Support Services
3.12.8
International Students
Domestic Students
Mean level of satisfaction with "Quality of food provided by the cafeteria
(not Grassroots)"(1=very dissatisfied; 5=very satisfied)
3.8 3.7
International Students
Domestic Students
Mean level of satisfaction with "Student support services at Kwantlen"
(1=very dissatisfied; 5=very satisfied)
Kwantlen Polytechnic University: Institutional Analysis Planning
2009 Student Satisfaction Survey (formerly Fall Registration Survey)
December 2009
Section 4b:Student Support Services
58 of 59Kwantlen Polytechnic University: Institutional Analysis Planning
2009 Student Satisfaction Survey (formerly Fall Registration Survey)
December 2009
Section 4b:Student Support Services
58 of 59
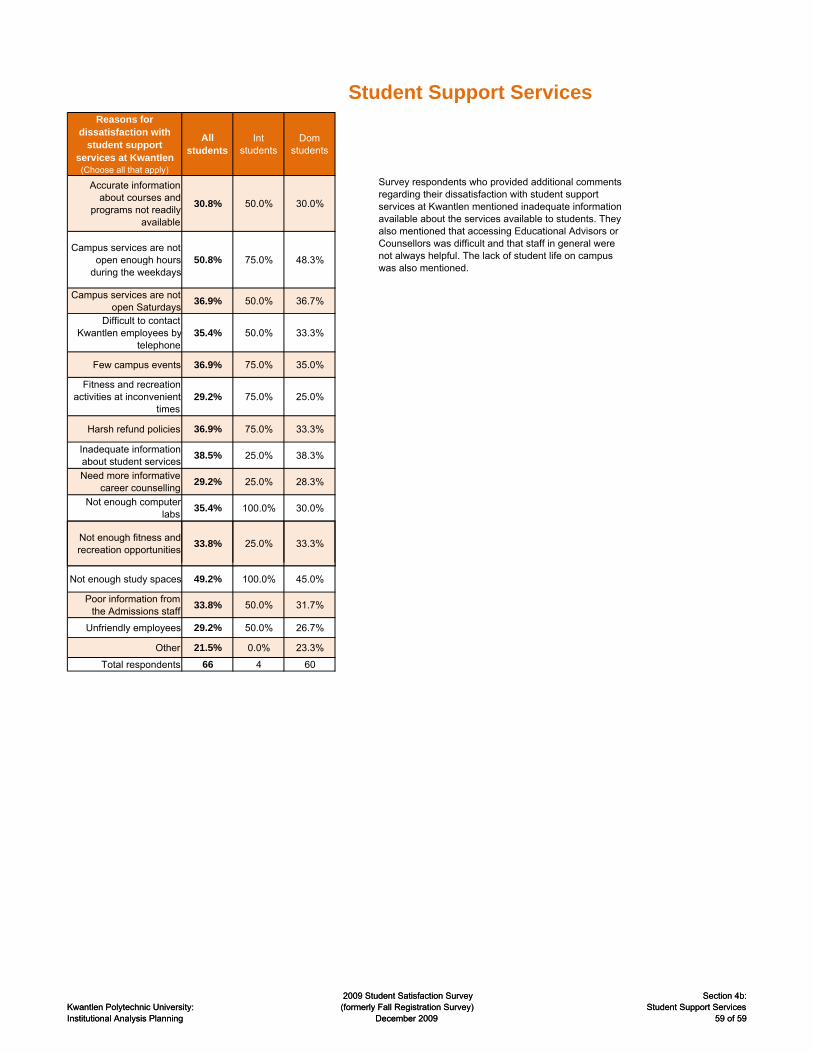
Reasons for dissatisfaction with
student support services at Kwantlen(Choose all that apply)
All students
Int students
Dom students
Accurate information about courses and
programs not readily available
30.8% 50.0% 30.0%
Campus services are not open enough hours
during the weekdays50.8% 75.0% 48.3%
Campus services are not open Saturdays
36.9% 50.0% 36.7%
Difficult to contact Kwantlen employees by
telephone35.4% 50.0% 33.3%
Few campus events 36.9% 75.0% 35.0%
Fitness and recreation activities at inconvenient
times29.2% 75.0% 25.0%
Harsh refund policies 36.9% 75.0% 33.3%
Inadequate information about student services
38.5% 25.0% 38.3%
Need more informative career counselling
29.2% 25.0% 28.3%
Not enough computer labs
35.4% 100.0% 30.0%
Not enough fitness and recreation opportunities
33.8% 25.0% 33.3%
Survey respondents who provided additional comments regarding their dissatisfaction with student support services at Kwantlen mentioned inadequate information available about the services available to students. They also mentioned that accessing Educational Advisors or Counsellors was difficult and that staff in general were not always helpful. The lack of student life on campus was also mentioned.
Student Support Services
Kwantlen Polytechnic University: Institutional Analysis Planning
2009 Student Satisfaction Survey (formerly Fall Registration Survey)
December 2009
Section 4b:Student Support Services
59 of 59
Not enough study spaces 49.2% 100.0% 45.0%
Poor information from the Admissions staff
33.8% 50.0% 31.7%
Unfriendly employees 29.2% 50.0% 26.7%
Other 21.5% 0.0% 23.3%
Total respondents 66 4 60
Kwantlen Polytechnic University: Institutional Analysis Planning
2009 Student Satisfaction Survey (formerly Fall Registration Survey)
December 2009
Section 4b:Student Support Services
59 of 59