Embed Size (px)
Citation preview

2008 Western Australian State Election
Analysis of Results
Election Papers SeriesNo. 1 / March 2009
PARLIAMENT OF WESTERN AUSTRALIA
Election Analysis (Cover).indd 1 16/04/2009 2:14:04 PM

WESTERN AUSTRALIAN STATE ELECTION 2008
ANALYSIS OF RESULTS
by Antony Green
for the Western Australian Parliamentary Library
Western Australian Parliamentary Library Election Papers Series No. 1/2009
March 2009
© 2009
Except to the extent of the uses permitted under the Copyright Act 1968, no part of this document may be reproduced or transmitted in any form or by any means including information storage and retrieval systems, without the prior written consent from the Librarian, Western Australian Parliamentary Library, other than by Members of the Western Australian Parliament in the course of their official duties. The views expressed in this paper are those of the author and do not necessarily reflect those of the Western Australian Parliamentary Library. Western Australian Parliamentary Library Parliament House Harvest Terrace Perth WA 6000
ISBN 978-1-921243-84-4 March 2009
2008 WESTERN AUSTRALIAN ELECTION 6 September 2008
Analysis of Results
CONTENTS Introduction 1 Legislative Assembly Results Summary of First Preference Votes 5 First Preference Votes by Electoral Division 8 Summary of Two-Party Preferred Results 22 Regional Summaries 28 Summary of Preference Distributions 30 Legislative Council Results Summary of First Preference Votes and Region Totals 33 Detail of Result by Region 36 Upper and Lower House Vote Comparisons 44 New and Departing Members 48 Summary of Redistribution 50 Legislative Assembly By-elections 2005-2008 52 Legislative Council Casual Vacancies 2005-2008 53

Symbols .. Nil or rounded to zero * Sitting MPs .… ‘Ghost’ candidate, where a party contesting the previous election did not
nominate for the current election Party Abbreviations (blank) Non-affiliated candidates ALP Australian Labor Party CDP Christian Democratic Party CEC Citizens Electoral Council DSP Daylight Saving Party FFP Family First GRN The Greens (WA) IND Independents LIB Liberal Party NAT The Nationals NCP New Country Party ONP One Nation OTH Others Important Dates Issue of Writs 7 August 2008 Close of Rolls 15 August 2008 Close of Nominations 15 August 2008 Lodgement of Council Ticket Votes 18 August 2008 Polling Day 6 September 2008 Close of Receipt for Postal Votes 11 September 2008 Last day for Return of Writs 27 October 2008

2008 Western Australian Election
1
INTRODUCTION This paper provides a summary of the 2008 Western Australian election. It contains details of voting for all Legislative Assembly districts and summaries of voting for the Legislative Council. The 2008 election was the first held following the introduction of one-vote one-value electoral boundaries for Legislative Assembly elections. There was also a change to the number of members elected for each Legislative Council Region. The Legislative Assembly was increased in size from 57 to 59 seats and a single state wide enrolment quota adopted for drawing electoral boundaries. A large district allowance was introduced that permitted electorates above 100,000 square kilometres in area to qualify for a lower enrolment. The new boundaries saw the number of non-metropolitan electorates fall from 23 to 17, while the number of Perth electorates rose from 34 to 42. In the Legislative Council, equal representation between Perth and non-metropolitan areas was retained. The size of the Legislative Council was increased from 34 to 36, with 18 representing Perth regions and 18 non-metropolitan regions. The number of members elected from each region was equalised at six, replacing the previous system of electing five or seven members per region. A summary of changes to Legislative Assembly districts can be found on page 50 of this publication. This includes some notes on the new seats contested by sitting members. It should be noted that following the release of polling booths for the 2008 election, there were some minor adjustments made to the estimated margins in seats. These may differ slightly from those published previously in the publication “2007 Redistribution Western Australia: Analysis of Final Electoral Boundaries”, Western Australia Parliamentary Library Election Papers Series No. 2/2007. Sitting Members and Holding Parties In all comparisons of results, seats are classified as being notionally held by parties based on 2005 results adjusted for the redistribution. In the seats of Albany, Bunbury, Darling Range and Geraldton, sitting MPs contested seats notionally held by an opposing party. In Nedlands, Kalgoorlie and Morley, MPs who had resigned from their former party re-contested as Independents. Appropriate footnoting has been used to highlight seats where there may be confusion over defining which party held a seat. There were two contests between sitting MPs. Liberal MP for Capel Steve Thomas and Labor MP for Collie-Wellington Mick Murray contested the new notionally Labor seat of Collie-Preston. National MP for the abolished electorate of Greenough Grant Woodhams contested Moore against sitting Liberal MP Gary Snook. An asterisk "*" is used to indicate any candidate who was a sitting member in the old parliament, even where the MP is contesting a different district. This includes the cases listed in the previous paragraph where a seat is classed as being notionally held by a different party. Details of members who contested a different electorate can be found in the redistribution summary on page 50. Four members nominated for election to a different chamber to the one they represented in the old parliament. MLAs Max Trenorden and Dan Sullivan contested the Legislative Council, with Trenorden elected for Agricultural Region. Labor MLCs Vincent Catania and Graham Giffard contested the Legislative Assembly, with Catania winning election as MLA for North West. Two-Candidate Preferred versus Two-Party Preferred Results The two-candidate preferred count for an electorate is defined as the final tally after the exclusion and distribution as preferences of votes from all other candidates. At each stage of the count, the candidate with the fewest votes is excluded, and his or her votes are distributed to candidates remaining in the count based on the voter's preferences as filled in on the ballot paper. To achieve victory, a candidate must receive more than 50% of the vote remaining in the count, though in electorates where a candidate achieves victory either on the primary vote or before the final

2008 Western Australian Election
2
distribution of preferences, the two-candidate preferred count is carried out in full for information purposes only. The two-party preferred count represents a distribution of preferences between candidates representing the Labor Party and the Liberal-National Party Coalition. Candidates are again excluded based on lowest progressive vote, though at some point the second lowest candidate is excluded to retain candidates representing Labor and the Coalition. In most cases, the two-party preferred count will be the same as the two-candidate preferred count. At the 2008 election, eight districts (Alfred Cove, Blackwood-Stirling, Central Wheatbelt, Eyre, Kalgoorlie, Kwinana, Moore, Wagin) did not finish as two-party preferred contests. In these districts the Western Australian Electoral Commission conducted separate two-party preferred counts between Labor and Liberal candidates. In Churchlands, there was no Liberal candidate and the final two-party preferred count between Labor and the Independent MP has been used as the two-party preferred count. Pilbara was the only electorate at the 2008 election where the two-party preferred count used the two-candidate preferred count between Labor and National candidates. Format for Legislative Assembly Results. For each Legislative Assembly district, details of the total primary and two-candidate preferred vote are provided. Where appropriate, a two-party preferred count is also included. The format for the results is as follows: First Count: For each candidate, the total primary vote received is shown. Percentage votes are calculated as a percentage of the formal vote for each electorate. Swing is calculated by subtracting the percentage vote received by a party at the 2005 election from the percentage received at the 2008 election. Where the parties contesting the district differ from the 2005 election, ‘ghost’ candidates (indicated by “….”) have been included representing candidates not contesting the current election. As a result, all primary swings add to zero, subject to rounding errors. All votes from 2005 have been adjusted to take account of the redistribution. Final Count: Represents the two-candidate preferred count after the final distribution of preferences in an electorate. All formal votes that did not indicate a preference for the final two candidates are included in the total listed as exhausted. Two-candidate preferred percentages are calculated by dividing the two-candidate preferred vote for a candidate by the total votes remaining in the count, that is the formal votes minus the total of exhausted votes. Two-candidate preferred swings are shown compared to the results of the 2005 election. Where the party composition of the final two candidates differs from the 2005 election (eg Kalgoorlie), ghost candidates appear, and three or four swing figures are shown. 2-Party Preferred: This appears in seats that did not finish as contests between Labor and Liberal or National candidates. It shows the change in vote on an alternate two-party preferred basis since the last election. Exhausted Votes Under the WA Electoral Act, ballot papers with a valid first preference vote, but with duplicate or broken sequences of preferences remain in the count as formal votes. This category of vote is often termed a ‘Langer’ vote, after the political activist who advocated voting in this manner when the same formality rules applied for Commonwealth elections. The small number of exhausted ballots is indicated in the result for each electorate. Discrepancies in Two Party Preferred Count In Blackwood-Stirling, Central Wheatbelt, Eyre, Kalgoorlie, Moore and Wagin, the WA Electoral Commission chose to conduct a two-party preferred count between Labor and Liberal candidates. The Commission could have chosen to conduct the count between Labor and National candidates.

2008 Western Australian Election
3
Past elections have shown that a higher non-Labor two-party preferred count is recorded in contests between National and Labor candidates than between Liberal and Labor candidates. For this reason, the tables of two-party preferred counts provided in this publication may slightly underestimate the state wide two-party preferred total for the Liberal/National parties. This discrepancy is more evident in the regional totals for Agricultural Region (see regional totals on page 28), and also shows up in the table of swings based on the party status of seats. Most estimated margins based on 2005 results in Agricultural Region, and in National held seats, were based on National-Labor contests. The 2008 contests are all Liberal-Labor counts. This difference in the method used to calculate two-party preferred may be the cause and swing to Labor in National held seats and in Agricultural Region. The same comment may apply to the electorate of Churchlands, where a notional Labor-Independent count has been used as the 2005 two-party preferred estimate rather than the previously estimated Labor-Liberal margin. Summary of Redistribution As noted above, a summary of the redistribution is provided beginning on page 50. This includes old and new margins for all seats, along with notes on abolished and newly created seats. Note is also made of members contesting different seats, or contesting seats now notionally held by a different party. The redistribution also produced minor changes to the boundaries of the Legislative Council regions. These changes have been reflected in the calculation of swing in each region. However, no estimate has been made of the number of members that would have been elected to the expanded Legislative Council based on 2005 results. By-elections and Resignations Details of the Victoria Park, Peel and Murdoch by-elections can be found on page 52. Details of Legislative Council casual vacancies can be found on the same page. Note that all calculations of swing are based on comparisons of percentage votes with those recorded at the 2005 state election. Note that the old electoral boundaries were used for the by-elections. At the 2005 election, the district of Nedlands was won by Sue Walker for the Liberal Party. She left the Liberal Party in early 2008 and contested the 2008 election as an Independent. Liberal MP for Leschenault Dan Sullivan had also resigned from the Liberal Party since the 2005 election and finished his term as an Independent. At the 2008 election he unsuccessfully contested South West Region as a Family First candidate. Liberal MLC Anthony Fels resigned from the Liberal Party shortly before the 2008 election and was defeated contesting Agricultural Region as a Family First candidate. The Warren-Blackwood seat of Liberal MLA Paul Omodei was abolished in the redistribution and he chose to retire after disputed pre-selection ballots failed to deliver him a satisfactory position on the Liberal Party’s South West Region ticket. Three Labor MLAs and one MLC parted company with the Labor Party between 2005 and 2008. The seat of Yokine held by MLA Bob Kucera was abolished in the redistribution and disputes over pre-selection saw him resign from the Labor Party and finish his term as an Independent. Ballajura MLA John D’Orazio was defeated contesting the new seat of Morley as an Independent. Murchison-Eyre MLA John Bowler contested and won Kalgoorlie as an Independent. Mining and Pastoral MLC Shelley Archer also parted company with the Labor Party and did not contest the 2008 election.
2008 Western Australian Election
4
A Comment on the Advantage of Incumbency The 2008 election was conducted after a major redistribution that abolished six electorates outside of Perth and created eight entirely new electorates in the Perth metropolitan area. This created an unusual feature where many seats notionally held by the Labor government were not defended by sitting Labor MPs. Of Labor’s 13 most marginal seats going into the election, only five (Kingsley, Collie-Preston, Riverton, Joondalup, Southern River) were defended by a sitting Labor MP, while two sitting Labor MPs contested notional Liberal seats (Albany, Geraldton). Two of Labor’s notionally marginal seats (Bunbury, Darling Range) were contested by sitting Liberal MPs, while Collie-Preston was contested by both a sitting Labor and a sitting Liberal MP. This created the unusual situation where the Labor Party on paper lost 11 seats, but only four of those seats had sitting Labor MPs. A fifth Labor MP was defeated in notionally Liberal-held Geraldton, while a sitting Labor MP was re-elected in the notionally Liberal-held seat of Albany. Two of the biggest swings against Labor occurred in the neighbouring inner-northern electorates of Mount Lawley and Ballajura. Both were lost by Labor, both were without sitting Labor MPs, and both had seen disputes over the non-endorsement of former Labor MPs. While the Labor Party had the advantage of being an incumbent government, the nature of the redistribution meant that the advantage an incumbent government would normally have had in key marginal electorates was greatly weakened. In the re-drawing of Perth electoral boundaries, MPs of both parties understandably gravitated to electorates encompassing the safer territory of their former electorate, leaving new candidates to contest the more marginal seats. Given the extremely close nature of the final election outcome, it is likely that changes to electoral boundaries and problems in pre-selecting candidates had a role to play in the eventual defeat of the government. Acknowledgement and Disclaimer I would like to express my thanks to the staff of the Western Australian Electoral Commission for their assistance in preparing this publication. All results have been taken from the WAEC's web site (http://www.waec.wa.gov.au) and drafts of the official Statistical Returns. All calculations of percentages and swings are the responsibility of the author, who also takes full responsibility for errors and omissions. Antony Green March 2009 Comments to: [email protected]

2008 Western Australian Election
5
SUMMARY OF FIRST PREFERENCE VOTES STATE-WIDE TOTALS ROLL 1,330,399
Candi Seats Party dates Won Change Votes % Votes Swing Liberal Party 58 24 +8 418,208 38.39 +2.76 Labor Party 59 28 -10 390,339 35.84 -6.05 Greens 59 .. .. 129,827 11.92 +4.35 National Party 12 4 +1 53,086 4.87 +1.18 Independent 25 3 +1 47,353 4.35 +0.19 Christian Democratic Party 46 .. .. 28,079 2.58 -0.36 Family First 34 .. .. 21,204 1.95 -0.08 Citizens Electoral Council 9 .. .. 1,161 0.11 +0.02 One Nation .. .. .. .. .. -1.64 Others .. .. .. .. .. -0.38 Formal 302 59 .. 1,089,257 94.68 -0.08 Informal 61,240 5.32 +0.08 Total Votes 1,150,497 86.48 -3.34 Note: Change column based on 2005 results adjusted for new electoral boundaries. Compared to 2005 results, there were four fewer Labor MPs, six more Liberal MPs, one less National MP and one more Independent, the size of the Legislative Assembly increasing by two seats. Seats Changing Party Labor gains from Liberal (1) Albany (Labor MP re-elected) Liberal gain from Labor (11) Bunbury (Liberal MP re-elected)
Darling Range (Liberal MP re-elected) Jandakot Kingsley Morley Mount Lawley Ocean Reef Riverton Southern River Swan Hills Wanneroo
Independent gain from Liberal (1) Kalgoorlie National gain from Liberal (1) Moore Note: On the new electoral boundaries, Albany had become a notional Liberal seat while Bunbury and Darling Range became notional Labor seats. Geraldton also became a notional Liberal seat so the defeat of the sitting Labor MP is not shown as a Liberal gain. There were also contests between sitting MPs in the seats of Collie-Preston and Moore. Details of defeated, retiring and newly elected members can be found on page 48. In addition, three MPs contested seats after leaving the party for which they were elected at the 2005 election. Former Liberal MP Sue Walker was defeated contesting her seat of Nedlands as an Independent. Former Labor MP John D’Orazio was defeated contesting the new seat of Morley as an Independent. Former Labor MP John Bowler was elected contesting Kalgoorlie as an Independent.

2008 Western Australian Election
6
LEGISLATIVE ASSEMBLY: SUMMARY OF FIRST PREFERENCE VOTE BY ELECTORATE
Electoral First Preference Votes Informal Total District ALP LIB NAT GRN OTH Votes Votes Turnout Albany 7709 6486 2628 1492 1381 590 20286 22506 Alfred Cove 4059 8628 .. 1907 5408 843 20845 23583 Armadale 10899 5050 .. 2107 1422 1235 20713 24116 Balcatta 7897 7682 .. 2110 1069 1402 20160 23365 Bassendean 8973 5751 .. 2999 1049 1535 20307 23098 Bateman 5538 10541 .. 2562 1100 893 20634 23031 Belmont 7650 5953 .. 2143 1823 1325 18894 22109 Blackwood-Stirling 2527 4518 8003 1837 935 715 18535 20723 Bunbury 5192 9400 .. 1591 1360 856 18399 20917 Cannington 8475 6105 .. 3045 1028 1399 20052 23198 Carine 4383 8733 .. 2246 4563 890 20815 23392 Central Wheatbelt 2909 4471 8334 996 728 724 18162 20491 Churchlands 3545 .. .. 2931 13326 676 20478 23397 Cockburn 9620 6188 .. 2531 1416 1617 21372 24439 Collie-Preston 8439 8260 .. 1802 2082 979 21562 23869 Cottesloe 3470 12552 .. 3366 393 880 20661 24035 Darling Range 6893 9513 .. 2913 1010 1173 21502 24072 Dawesville 5832 9836 .. 1191 786 874 18519 21661 Eyre 2745 6515 3754 1019 104 757 14894 17798 Forrestfield 7884 8153 .. 2488 1419 1394 21338 24248 Fremantle 7286 5689 .. 5191 668 1132 19966 23658 Geraldton 5213 6616 3460 1030 1587 812 18718 21399 Girrawheen 9155 6109 .. 2658 .. 1587 19509 22854 Gosnells 7874 6453 .. 2251 1769 1183 19530 22511 Hillarys 5633 10471 .. 2610 1094 1071 20879 23676 Jandakot 7630 9176 .. 2418 1393 1040 21657 24177 Joondalup 7788 7083 .. 2431 1311 1101 19714 22945 Kalamunda 6121 9257 .. 2871 1207 1158 20614 23516 Kalgoorlie 1790 2540 1942 461 3466 605 10804 14138 Kimberley 4066 2566 1809 1320 100 463 10324 16658 Kingsley 7230 9710 .. 2289 1116 1052 21397 23642 Kwinana 7990 3590 .. 2030 5401 1149 20160 23491 Mandurah 9188 5922 .. 1067 1192 995 18364 21101 Maylands 8065 6270 .. 3524 614 1241 19714 23265 Midland 8968 6645 .. 2869 687 1304 20473 23549 Mindarie 9288 6839 .. 1949 1045 1052 20173 23613 Moore 3105 7556 6025 1157 800 918 19561 22277 Morley 7010 6797 .. 1687 4117 1340 20951 23480 Mount Lawley 6487 8607 .. 2639 821 1049 19603 22868 Murray-Wellington 5824 8713 1643 1374 2091 1234 20879 23775 Nedlands 3098 8889 .. 2754 4813 656 20210 23636 Nollamara 9427 5678 .. 2459 863 1587 20014 23570 North West 4161 3071 2609 840 828 520 12029 15962 Ocean Reef 7056 9163 .. 2001 981 1020 20221 23045 Perth 7723 6907 .. 3631 576 1013 19850 24381 Pilbara 3336 1321 1724 724 412 409 7926 11449 Riverton 7722 8002 .. 2037 1603 1004 20368 22737 Rockingham 9559 6371 .. 2432 318 1097 19777 22903 Scarborough 5622 8374 .. 2338 2330 972 19636 23420 South Perth 4594 10136 .. 2016 2424 858 20028 23522 Southern River 8119 9382 .. 2149 1182 1299 22131 24632 Swan Hills 7183 9589 .. 3009 1274 1158 22213 24779 Vasse 4427 11306 .. 3653 967 947 21300 24249 Victoria Park 9137 6723 .. 2726 958 979 20523 24201 Wagin 1839 3254 11155 615 840 593 18296 20386 Wanneroo 8990 9849 .. 1974 1735 1223 23771 26745 Warnbro 9666 6412 .. 2414 1457 1066 21015 24358 West Swan 8612 7017 .. 1676 1355 1246 19906 22369 Willagee 9718 5820 .. 3277 .. 1350 20165 23414 TOTAL 390339 418208 53086 129827 97797 61240 1150497 1330399

2008 Western Australian Election
7
LEGISLATIVE ASSEMBLY: SUMMARY OF PERCENTAGE VOTE BY ELECTORATE Electoral Percentage of First Preference Votes Informal District ALP LIB NAT GRN OTH Votes Turnout Albany 39.1 32.9 13.3 7.6 7.0 2.9 90.1 Alfred Cove 20.3 43.1 .. 9.5 27.0 4.0 88.4 Armadale 56.0 25.9 .. 10.8 7.3 6.0 85.9 Balcatta 42.1 41.0 .. 11.2 5.7 7.0 86.3 Bassendean 47.8 30.6 .. 16.0 5.6 7.6 87.9 Bateman 28.1 53.4 .. 13.0 5.6 4.3 89.6 Belmont 43.5 33.9 .. 12.2 10.4 7.0 85.5 Blackwood-Stirling 14.2 25.4 44.9 10.3 5.2 3.9 89.4 Bunbury 29.6 53.6 .. 9.1 7.8 4.7 88.0 Cannington 45.4 32.7 .. 16.3 5.5 7.0 86.4 Carine 22.0 43.8 .. 11.3 22.9 4.3 89.0 Central Wheatbelt 16.7 25.6 47.8 5.7 4.2 4.0 88.6 Churchlands 17.9 .. .. 14.8 67.3 3.3 87.5 Cockburn 48.7 31.3 .. 12.8 7.2 7.6 87.5 Collie-Preston 41.0 40.1 .. 8.8 10.1 4.5 90.3 Cottesloe 17.5 63.5 .. 17.0 2.0 4.3 86.0 Darling Range 33.9 46.8 .. 14.3 5.0 5.5 89.3 Dawesville 33.1 55.7 .. 6.7 4.5 4.7 85.5 Eyre 19.4 46.1 26.6 7.2 0.7 5.1 83.7 Forrestfield 39.5 40.9 .. 12.5 7.1 6.5 88.0 Fremantle 38.7 30.2 .. 27.6 3.5 5.7 84.4 Geraldton 29.1 36.9 19.3 5.8 8.9 4.3 87.5 Girrawheen 51.1 34.1 .. 14.8 .. 8.1 85.4 Gosnells 42.9 35.2 .. 12.3 9.6 6.1 86.8 Hillarys 28.4 52.9 .. 13.2 5.5 5.1 88.2 Jandakot 37.0 44.5 .. 11.7 6.8 4.8 89.6 Joondalup 41.8 38.1 .. 13.1 7.0 5.6 85.9 Kalamunda 31.5 47.6 .. 14.8 6.2 5.6 87.7 Kalgoorlie 17.6 24.9 19.0 4.5 34.0 5.6 76.4 Kimberley 41.2 26.0 18.3 13.4 1.0 4.5 62.0 Kingsley 35.5 47.7 .. 11.3 5.5 4.9 90.5 Kwinana 42.0 18.9 .. 10.7 28.4 5.7 85.8 Mandurah 52.9 34.1 .. 6.1 6.9 5.4 87.0 Maylands 43.7 33.9 .. 19.1 3.3 6.3 84.7 Midland 46.8 34.7 .. 15.0 3.6 6.4 86.9 Mindarie 48.6 35.8 .. 10.2 5.5 5.2 85.4 Moore 16.7 40.5 32.3 6.2 4.3 4.7 87.8 Morley 35.7 34.7 .. 8.6 21.0 6.4 89.2 Mount Lawley 35.0 46.4 .. 14.2 4.4 5.4 85.7 Murray-Wellington 29.6 44.4 8.4 7.0 10.6 5.9 87.8 Nedlands 15.8 45.5 .. 14.1 24.6 3.2 85.5 Nollamara 51.2 30.8 .. 13.3 4.7 7.9 84.9 North West 36.2 26.7 22.7 7.3 7.2 4.3 75.4 Ocean Reef 36.7 47.7 .. 10.4 5.1 5.0 87.7 Perth 41.0 36.7 .. 19.3 3.1 5.1 81.4 Pilbara 44.4 17.6 22.9 9.6 5.5 5.2 69.2 Riverton 39.9 41.3 .. 10.5 8.3 4.9 89.6 Rockingham 51.2 34.1 .. 13.0 1.7 5.5 86.4 Scarborough 30.1 44.9 .. 12.5 12.5 5.0 83.8 South Perth 24.0 52.9 .. 10.5 12.6 4.3 85.1 Southern River 39.0 45.0 .. 10.3 5.7 5.9 89.8 Swan Hills 34.1 45.5 .. 14.3 6.1 5.2 89.6 Vasse 21.8 55.5 .. 17.9 4.8 4.4 87.8 Victoria Park 46.8 34.4 .. 13.9 4.9 4.8 84.8 Wagin 10.4 18.4 63.0 3.5 4.7 3.2 89.7 Wanneroo 39.9 43.7 .. 8.8 7.7 5.1 88.9 Warnbro 48.5 32.1 .. 12.1 7.3 5.1 86.3 West Swan 46.2 37.6 .. 9.0 7.3 6.3 89.0 Willagee 51.7 30.9 .. 17.4 .. 6.7 86.1 TOTAL 35.8 38.4 4.9 11.9 9.0 5.3 86.5
2008 Western Australian Election
8
LEGISLATIVE ASSEMBLY ELECTORATE RESULTS
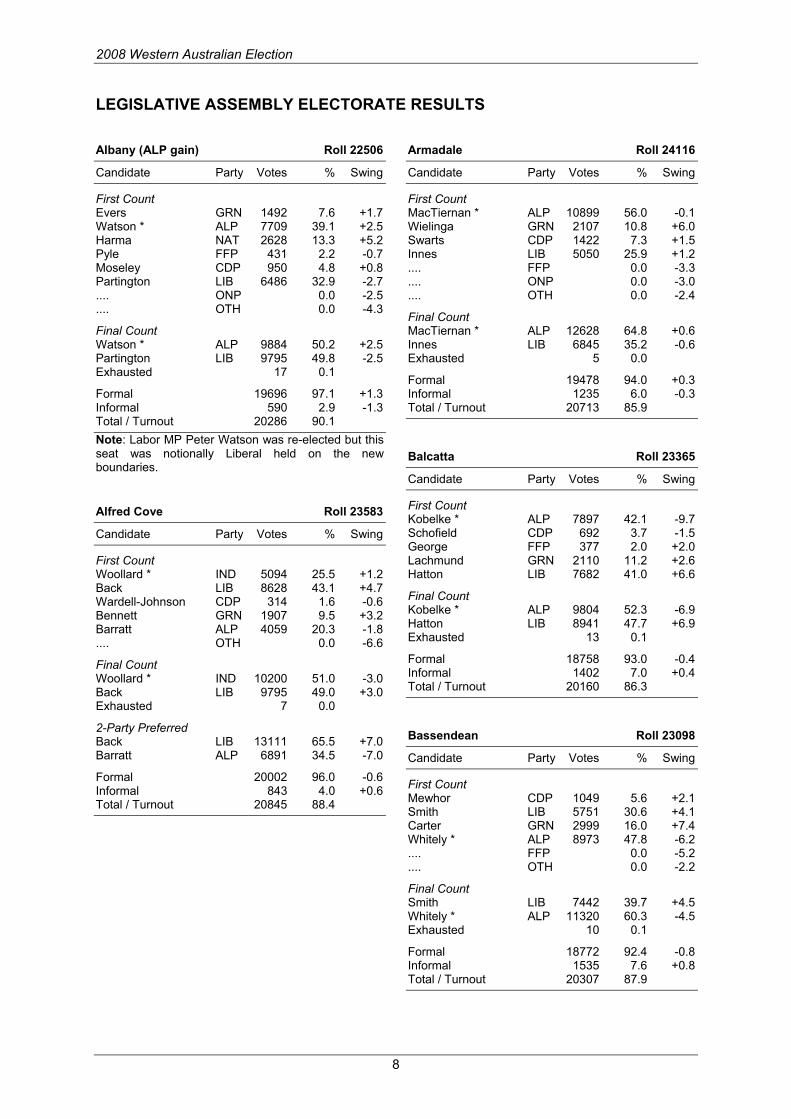
Albany (ALP gain) Roll 22506
Candidate Party Votes % Swing
First Count Evers GRN 1492 7.6 +1.7 Watson * ALP 7709 39.1 +2.5 Harma NAT 2628 13.3 +5.2 Pyle FFP 431 2.2 -0.7 Moseley CDP 950 4.8 +0.8 Partington LIB 6486 32.9 -2.7 .... ONP 0.0 -2.5 .... OTH 0.0 -4.3
Final Count Watson * ALP 9884 50.2 +2.5 Partington LIB 9795 49.8 -2.5 Exhausted 17 0.1
Formal 19696 97.1 +1.3 Informal 590 2.9 -1.3 Total / Turnout 20286 90.1 Note: Labor MP Peter Watson was re-elected but this seat was notionally Liberal held on the new boundaries. Alfred Cove Roll 23583
Candidate Party Votes % Swing
First Count Woollard * IND 5094 25.5 +1.2 Back LIB 8628 43.1 +4.7 Wardell-Johnson CDP 314 1.6 -0.6 Bennett GRN 1907 9.5 +3.2 Barratt ALP 4059 20.3 -1.8 .... OTH 0.0 -6.6
Final Count Woollard * IND 10200 51.0 -3.0 Back LIB 9795 49.0 +3.0 Exhausted 7 0.0
2-Party Preferred Back LIB 13111 65.5 +7.0 Barratt ALP 6891 34.5 -7.0
Formal 20002 96.0 -0.6 Informal 843 4.0 +0.6 Total / Turnout 20845 88.4
Armadale Roll 24116
Candidate Party Votes % Swing
First Count MacTiernan * ALP 10899 56.0 -0.1 Wielinga GRN 2107 10.8 +6.0 Swarts CDP 1422 7.3 +1.5 Innes LIB 5050 25.9 +1.2 .... FFP 0.0 -3.3 .... ONP 0.0 -3.0 .... OTH 0.0 -2.4
Final Count MacTiernan * ALP 12628 64.8 +0.6 Innes LIB 6845 35.2 -0.6 Exhausted 5 0.0
Formal 19478 94.0 +0.3 Informal 1235 6.0 -0.3 Total / Turnout 20713 85.9 Balcatta Roll 23365
Candidate Party Votes % Swing
First Count Kobelke * ALP 7897 42.1 -9.7 Schofield CDP 692 3.7 -1.5 George FFP 377 2.0 +2.0 Lachmund GRN 2110 11.2 +2.6 Hatton LIB 7682 41.0 +6.6
Final Count Kobelke * ALP 9804 52.3 -6.9 Hatton LIB 8941 47.7 +6.9 Exhausted 13 0.1
Formal 18758 93.0 -0.4 Informal 1402 7.0 +0.4 Total / Turnout 20160 86.3 Bassendean Roll 23098
Candidate Party Votes % Swing
First Count Mewhor CDP 1049 5.6 +2.1 Smith LIB 5751 30.6 +4.1 Carter GRN 2999 16.0 +7.4 Whitely * ALP 8973 47.8 -6.2 .... FFP 0.0 -5.2 .... OTH 0.0 -2.2
Final Count Smith LIB 7442 39.7 +4.5 Whitely * ALP 11320 60.3 -4.5 Exhausted 10 0.1
Formal 18772 92.4 -0.8 Informal 1535 7.6 +0.8 Total / Turnout 20307 87.9

2008 Western Australian Election
9
Bateman Roll 23031
Candidate Party Votes % Swing
First Count Callaghan GRN 2562 13.0 +6.0 Choi IND 350 1.8 +1.8 Chew CDP 750 3.8 +0.3 Stokes ALP 5538 28.1 -5.8 Porter * LIB 10541 53.4 +5.1 .... FFP 0.0 -2.3 .... ONP 0.0 -0.9 .... OTH 0.0 -4.2
Final Count Stokes ALP 7620 38.6 -4.5 Porter * LIB 12116 61.4 +4.5 Exhausted 5 0.0
Formal 19741 95.7 +0.2 Informal 893 4.3 -0.2 Total / Turnout 20634 89.6 Note: Christian Porter was sitting MP for the abolished seat of Murdoch. Belmont Roll 22109
Candidate Party Votes % Swing
First Count Gilbert CDP 543 3.1 -1.0 Gleeson IND 603 3.4 +3.4 Judge GRN 2143 12.2 +4.5 Ripper * ALP 7650 43.5 -10.5 Richards LIB 5953 33.9 +2.9 Yarrow FFP 677 3.9 +3.9 .... ONP 0.0 -3.2
Final Count Ripper * ALP 9962 56.7 -4.9 Richards LIB 7596 43.3 +4.9 Exhausted 11 0.1
Formal 17569 93.0 -1.4 Informal 1325 7.0 +1.4 Total / Turnout 18894 85.5
Blackwood-Stirling Roll 20723
Candidate Party Votes % Swing
First Count Redman * NAT 8003 44.9 +28.1 Petersen GRN 1837 10.3 +1.3 Phillips ALP 2527 14.2 -4.6 Smith IND 145 0.8 +0.8 Carson FFP 264 1.5 -1.0 Gunson IND 176 1.0 +1.0 Lawn CDP 350 2.0 +0.4 Decampo LIB 4518 25.4 -15.7 .... ONP 0.0 -2.9 .... OTH 0.0 -7.4
Final Count Redman * NAT 11992 67.3 -2.0 Phillips ALP 0 0.0 -30.7 Decampo LIB 5816 32.7 +32.7 Exhausted 12 0.1
2-Party Preferred Redman * NAT 0 0.0 -69.3 Phillips ALP 6411 36.0 +5.3 Decampo LIB 11409 64.0 +64.0
Formal 17820 96.1 +1.1 Informal 715 3.9 -1.1 Total / Turnout 18535 89.4 Note: Terry Redman was sitting MP for the abolished seat of Stirling. The sitting Liberal MP for the abolished seat of Warren-Blackwood Paul Omodei retired. Bunbury (LIB gain) Roll 20917
Candidate Party Votes % Swing
First Count Castrilli * LIB 9400 53.6 +12.2 Macfarlane ALP 5192 29.6 -12.7 Roberts FFP 1009 5.8 +1.9 Eckersley GRN 1591 9.1 +3.0 Dabrowski CDP 351 2.0 +0.7 .... NAT 0.0 -0.6 .... ONP 0.0 -2.7 .... OTH 0.0 -1.7
Final Count Castrilli * LIB 10825 61.7 +12.6 Macfarlane ALP 6711 38.3 -12.6 Exhausted 7 0.0
Formal 17543 95.3 +0.9 Informal 856 4.7 -0.9 Total / Turnout 18399 88.0 Note: Liberal MP John Castrilli was re-elected but this seat was notionally Labor held on the new boundaries.

2008 Western Australian Election
10
Cannington Roll 23198
Candidate Party Votes % Swing
First Count Cunningham GRN 3045 16.3 +9.3 Johnston ALP 8475 45.4 -9.0 Staer CDP 1028 5.5 +1.6 Chorley LIB 6105 32.7 +4.4 .... FFP 0.0 -2.3 .... ONP 0.0 -3.0 .... OTH 0.0 -1.0
Final Count Johnston ALP 11003 59.0 -4.3 Chorley LIB 7633 41.0 +4.3 Exhausted 17 0.1
Formal 18653 93.0 -1.0 Informal 1399 7.0 +1.0 Total / Turnout 20052 86.4 Note: New seat with no sitting MP. Carine Roll 23392
Candidate Party Votes % Swing
First Count Thompson IND 316 1.6 +1.6 Stewart IND 3572 17.9 +17.9 Krsticevic LIB 8733 43.8 -7.5 Benson-Lidholm ALP 4383 22.0 -11.3 Chew CDP 380 1.9 -2.1 Copeland GRN 2246 11.3 +1.0 Rose FFP 295 1.5 +1.0 .... OTH 0.0 -0.5
Final Count Krsticevic LIB 12832 64.5 +6.8 Benson-Lidholm ALP 7070 35.5 -6.8 Exhausted 23 0.1
Formal 19925 95.7 -0.2 Informal 890 4.3 +0.2 Total / Turnout 20815 89.0 Note: Sitting Liberal MP Katie Hodson-Thomas retired.
Central Wheatbelt Roll 20491
Candidate Party Votes % Swing
First Count Patterson CDP 573 3.3 +0.9 Dols GRN 996 5.7 +1.5 Strange LIB 4471 25.6 +11.9 Sturman ALP 2909 16.7 -1.7 Grylls * NAT 8334 47.8 -7.1 Sudholz CEC 155 0.9 +0.3 .... ONP 0.0 -3.2 .... OTH 0.0 -2.6
Final Count Strange LIB 5577 32.1 +32.1 Sturman ALP 0 0.0 -24.0 Grylls * NAT 11806 67.9 -8.1 Exhausted 55 0.3
2-Party Preferred Strange LIB 12294 70.5 +70.5 Sturman ALP 5134 29.5 +5.5 Grylls * NAT 0 0.0 -76.0 Exhausted 10 0.1
Formal 17438 96.0 +0.4 Informal 724 4.0 -0.4 Total / Turnout 18162 88.6 Note: Brendon Grylls was sitting MP for the abolished seat of Merredin. Sitting National MP for the abolished seat of Avon Max Trenorden was elected to the Legislative Council. Churchlands Roll 23397
Candidate Party Votes % Swing
First Count Krstic ALP 3545 17.9 -4.9 Crisp GRN 2931 14.8 +5.0 Constable * IND 13326 67.3 +36.2 .... LIB 0.0 -32.7 .... CDP 0.0 -3.2 .... OTH 0.0 -0.4
Final Count Krstic ALP 5253 26.5 -4.7 Constable * IND 14549 73.5 +4.7
Formal 19802 96.7 -0.4 Informal 676 3.3 +0.4 Total / Turnout 20478 87.5 Note: Two-candidate preferred result between Labor and Independent candidates used as two-party preferred result. Estimated Labor-Independent result for 2005 used as historic two-party preferred result.
2008 Western Australian Election
11
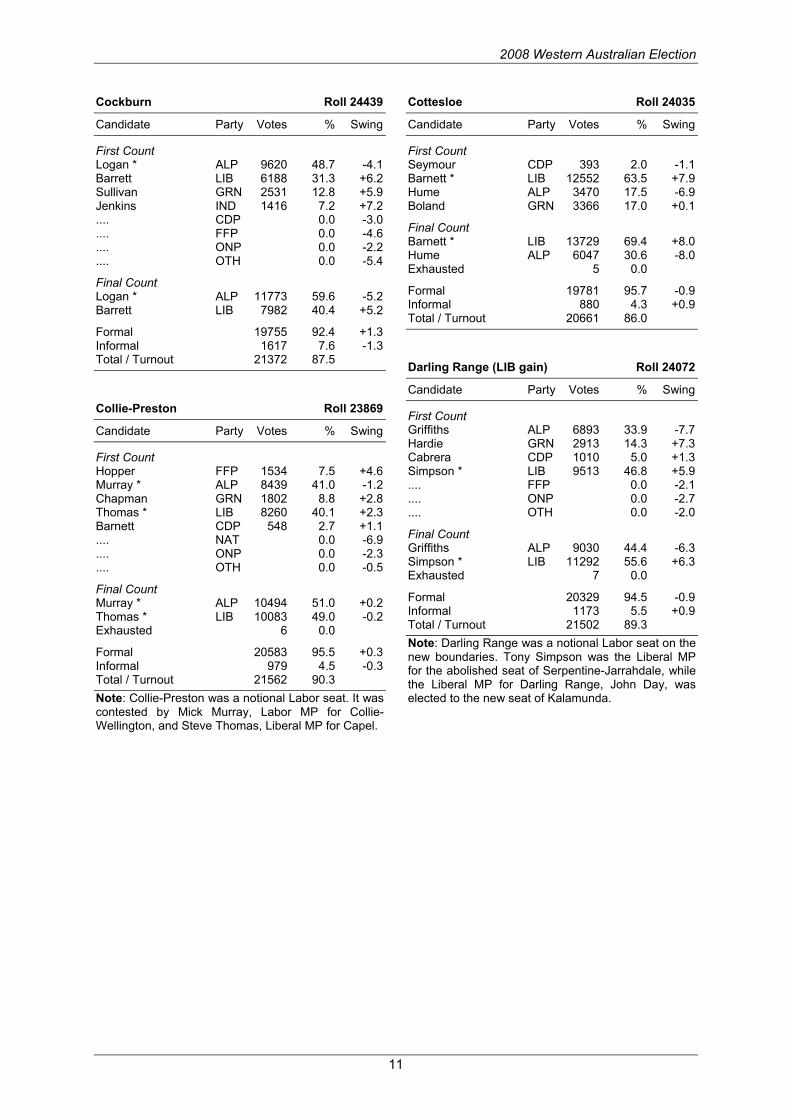
Cockburn Roll 24439
Candidate Party Votes % Swing
First Count Logan * ALP 9620 48.7 -4.1 Barrett LIB 6188 31.3 +6.2 Sullivan GRN 2531 12.8 +5.9 Jenkins IND 1416 7.2 +7.2 .... CDP 0.0 -3.0 .... FFP 0.0 -4.6 .... ONP 0.0 -2.2 .... OTH 0.0 -5.4
Final Count Logan * ALP 11773 59.6 -5.2 Barrett LIB 7982 40.4 +5.2
Formal 19755 92.4 +1.3 Informal 1617 7.6 -1.3 Total / Turnout 21372 87.5 Collie-Preston Roll 23869
Candidate Party Votes % Swing
First Count Hopper FFP 1534 7.5 +4.6 Murray * ALP 8439 41.0 -1.2 Chapman GRN 1802 8.8 +2.8 Thomas * LIB 8260 40.1 +2.3 Barnett CDP 548 2.7 +1.1 .... NAT 0.0 -6.9 .... ONP 0.0 -2.3 .... OTH 0.0 -0.5
Final Count Murray * ALP 10494 51.0 +0.2 Thomas * LIB 10083 49.0 -0.2 Exhausted 6 0.0
Formal 20583 95.5 +0.3 Informal 979 4.5 -0.3 Total / Turnout 21562 90.3 Note: Collie-Preston was a notional Labor seat. It was contested by Mick Murray, Labor MP for Collie-Wellington, and Steve Thomas, Liberal MP for Capel.
Cottesloe Roll 24035
Candidate Party Votes % Swing
First Count Seymour CDP 393 2.0 -1.1 Barnett * LIB 12552 63.5 +7.9 Hume ALP 3470 17.5 -6.9 Boland GRN 3366 17.0 +0.1
Final Count Barnett * LIB 13729 69.4 +8.0 Hume ALP 6047 30.6 -8.0 Exhausted 5 0.0
Formal 19781 95.7 -0.9 Informal 880 4.3 +0.9 Total / Turnout 20661 86.0 Darling Range (LIB gain) Roll 24072
Candidate Party Votes % Swing
First Count Griffiths ALP 6893 33.9 -7.7 Hardie GRN 2913 14.3 +7.3 Cabrera CDP 1010 5.0 +1.3 Simpson * LIB 9513 46.8 +5.9 .... FFP 0.0 -2.1 .... ONP 0.0 -2.7 .... OTH 0.0 -2.0
Final Count Griffiths ALP 9030 44.4 -6.3 Simpson * LIB 11292 55.6 +6.3 Exhausted 7 0.0
Formal 20329 94.5 -0.9 Informal 1173 5.5 +0.9 Total / Turnout 21502 89.3 Note: Darling Range was a notional Labor seat on the new boundaries. Tony Simpson was the Liberal MP for the abolished seat of Serpentine-Jarrahdale, while the Liberal MP for Darling Range, John Day, was elected to the new seat of Kalamunda.

2008 Western Australian Election
12
Dawesville Roll 21661
Candidate Party Votes % Swing
First Count Hames * LIB 9836 55.7 +12.8 Blakeway CEC 93 0.5 +0.3 Sutton-Smith CDP 233 1.3 +0.3 Brown GRN 1191 6.7 +2.7 Newhouse FFP 460 2.6 -0.1 Blair ALP 5832 33.1 -9.0 .... NAT 0.0 -5.5 .... ONP 0.0 -1.5
Final Count Hames * LIB 10776 61.1 +9.4 Blair ALP 6857 38.9 -9.4 Exhausted 12 0.1
Formal 17645 95.3 +0.1 Informal 874 4.7 -0.1 Total / Turnout 18519 85.5 Eyre Roll 17798
Candidate Party Votes % Swing
First Count Jacobs * LIB 6515 46.1 +0.5 Parker GRN 1019 7.2 +3.6 Harvey CEC 104 0.7 +0.7 Keogh ALP 2745 19.4 -9.0 Williams NAT 3754 26.6 +9.9 .... CDP 0.0 -1.9 .... ONP 0.0 -2.9 .... OTH 0.0 -1.1
Final Count Jacobs * LIB 7578 53.6 -11.2 Keogh ALP 0 0.0 -35.1 Williams NAT 6550 46.4 +46.4 Exhausted 9 0.1
2-Party Preferred Jacobs * LIB 9777 69.2 +4.3 Keogh ALP 4354 30.8 -4.3 Exhausted 6 0.0
Formal 14137 94.9 -0.9 Informal 757 5.1 +0.9 Total / Turnout 14894 83.7 Note: Graham Jacobs was Liberal MP for the abolished seat of Roe.
Forrestfield Roll 24248
Candidate Party Votes % Swing
First Count Davies GRN 2488 12.5 +5.8 Morton LIB 8153 40.9 +3.4 Waddell ALP 7884 39.5 -6.1 Hammen CDP 672 3.4 -0.6 Saladine FFP 747 3.7 +1.1 .... ONP 0.0 -3.6
Final Count Morton LIB 9919 49.8 +4.3 Waddell ALP 10017 50.2 -4.3 Exhausted 8 0.0
Formal 19944 93.5 -0.9 Informal 1394 6.5 +0.9 Total / Turnout 21338 88.0 Note: New seat with no sitting MP. Fremantle Roll 23658
Candidate Party Votes % Swing
First Count Carles GRN 5191 27.6 +10.5 McGinty * ALP 7286 38.7 -5.1 Du plessis FFP 318 1.7 -0.1 Christie LIB 5689 30.2 +3.4 Hollett CDP 350 1.9 +0.2 .... ONP 0.0 -1.0 .... OTH 0.0 -8.0
Final Count McGinty * ALP 11667 62.0 -2.1 Christie LIB 7147 38.0 +2.1 Exhausted 20 0.1
Formal 18834 94.3 +1.9 Informal 1132 5.7 -1.9 Total / Turnout 19966 84.4
2008 Western Australian Election
13
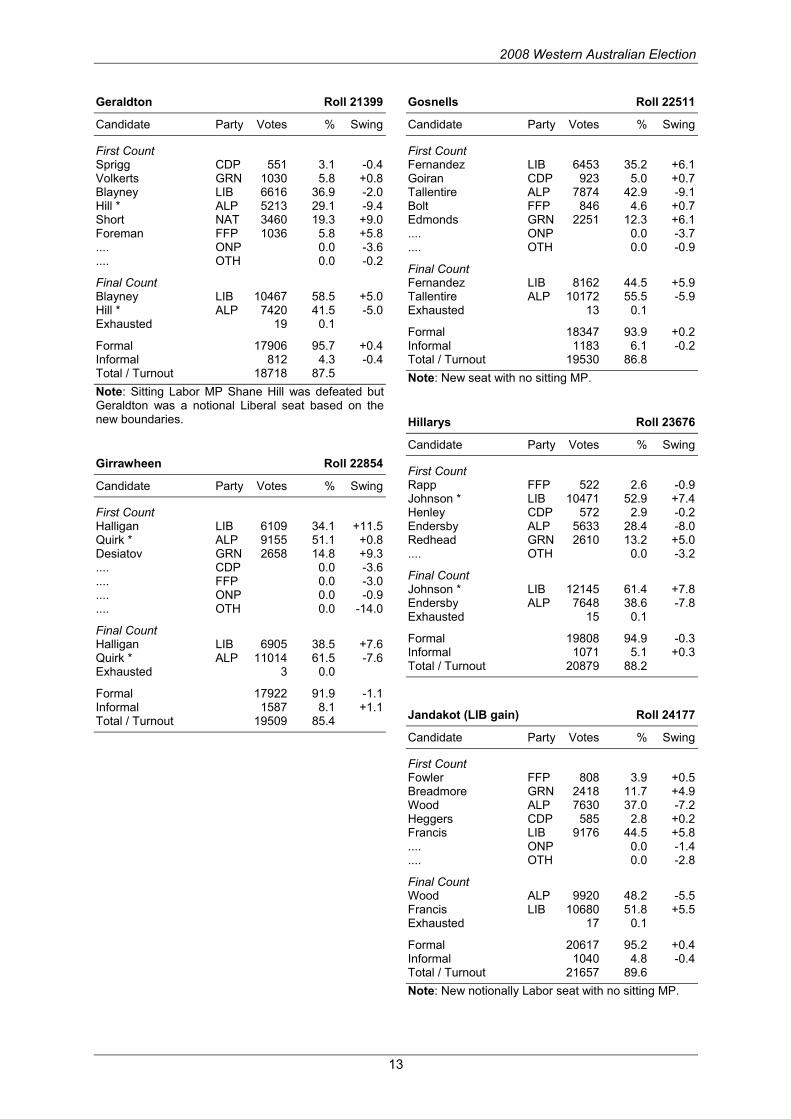
Geraldton Roll 21399
Candidate Party Votes % Swing
First Count Sprigg CDP 551 3.1 -0.4 Volkerts GRN 1030 5.8 +0.8 Blayney LIB 6616 36.9 -2.0 Hill * ALP 5213 29.1 -9.4 Short NAT 3460 19.3 +9.0 Foreman FFP 1036 5.8 +5.8 .... ONP 0.0 -3.6 .... OTH 0.0 -0.2
Final Count Blayney LIB 10467 58.5 +5.0 Hill * ALP 7420 41.5 -5.0 Exhausted 19 0.1
Formal 17906 95.7 +0.4 Informal 812 4.3 -0.4 Total / Turnout 18718 87.5 Note: Sitting Labor MP Shane Hill was defeated but Geraldton was a notional Liberal seat based on the new boundaries. Girrawheen Roll 22854
Candidate Party Votes % Swing
First Count Halligan LIB 6109 34.1 +11.5 Quirk * ALP 9155 51.1 +0.8 Desiatov GRN 2658 14.8 +9.3 .... CDP 0.0 -3.6 .... FFP 0.0 -3.0 .... ONP 0.0 -0.9 .... OTH 0.0 -14.0
Final Count Halligan LIB 6905 38.5 +7.6 Quirk * ALP 11014 61.5 -7.6 Exhausted 3 0.0
Formal 17922 91.9 -1.1 Informal 1587 8.1 +1.1 Total / Turnout 19509 85.4
Gosnells Roll 22511
Candidate Party Votes % Swing
First Count Fernandez LIB 6453 35.2 +6.1 Goiran CDP 923 5.0 +0.7 Tallentire ALP 7874 42.9 -9.1 Bolt FFP 846 4.6 +0.7 Edmonds GRN 2251 12.3 +6.1 .... ONP 0.0 -3.7 .... OTH 0.0 -0.9
Final Count Fernandez LIB 8162 44.5 +5.9 Tallentire ALP 10172 55.5 -5.9 Exhausted 13 0.1
Formal 18347 93.9 +0.2 Informal 1183 6.1 -0.2 Total / Turnout 19530 86.8 Note: New seat with no sitting MP. Hillarys Roll 23676
Candidate Party Votes % Swing
First Count Rapp FFP 522 2.6 -0.9 Johnson * LIB 10471 52.9 +7.4 Henley CDP 572 2.9 -0.2 Endersby ALP 5633 28.4 -8.0 Redhead GRN 2610 13.2 +5.0 .... OTH 0.0 -3.2
Final Count Johnson * LIB 12145 61.4 +7.8 Endersby ALP 7648 38.6 -7.8 Exhausted 15 0.1
Formal 19808 94.9 -0.3 Informal 1071 5.1 +0.3 Total / Turnout 20879 88.2 Jandakot (LIB gain) Roll 24177
Candidate Party Votes % Swing
First Count Fowler FFP 808 3.9 +0.5 Breadmore GRN 2418 11.7 +4.9 Wood ALP 7630 37.0 -7.2 Heggers CDP 585 2.8 +0.2 Francis LIB 9176 44.5 +5.8 .... ONP 0.0 -1.4 .... OTH 0.0 -2.8
Final Count Wood ALP 9920 48.2 -5.5 Francis LIB 10680 51.8 +5.5 Exhausted 17 0.1
Formal 20617 95.2 +0.4 Informal 1040 4.8 -0.4 Total / Turnout 21657 89.6 Note: New notionally Labor seat with no sitting MP.

2008 Western Australian Election
14
Joondalup Roll 22945
Candidate Party Votes % Swing
First Count Clifford FFP 711 3.8 +0.6 Zuvela LIB 7083 38.1 +1.0 Laundy CDP 600 3.2 +0.8 Desierto GRN 2431 13.1 +5.8 O'Gorman * ALP 7788 41.8 -3.8 .... OTH 0.0 -4.3
Final Count Zuvela LIB 8655 46.5 +0.8 O'Gorman * ALP 9950 53.5 -0.8 Exhausted 8 0.0
Formal 18613 94.4 -0.6 Informal 1101 5.6 +0.6 Total / Turnout 19714 85.9 Kalamunda Roll 23516
Candidate Party Votes % Swing
First Count Merrells CDP 806 4.1 +0.5 Hopkinson FFP 401 2.1 -0.3 Day * LIB 9257 47.6 +4.5 Plummer ALP 6121 31.5 -8.3 Warden GRN 2871 14.8 +6.0 .... ONP 0.0 -2.3 .... OTH 0.0 -0.1
Final Count Day * LIB 10939 56.3 +6.1 Plummer ALP 8508 43.7 -6.1 Exhausted 9 0.0
Formal 19456 94.4 -0.8 Informal 1158 5.6 +0.8 Total / Turnout 20614 87.7 Note: John Day was the sitting MP for Darling Range.
Kalgoorlie (IND gain) Roll 14138
Candidate Party Votes % Swing
First Count James LIB 2540 24.9 -26.0 Bowler * IND 3466 34.0 +34.0 Crook NAT 1942 19.0 +19.0 Huntley GRN 461 4.5 +0.2 Cuomo ALP 1790 17.6 -19.6 .... CDP 0.0 -2.2 .... ONP 0.0 -2.2 .... OTH 0.0 -3.3
Final Count James LIB 0 0.0 -57.1 Bowler * IND 5462 53.6 +53.6 Crook NAT 4731 46.4 +46.4 Cuomo ALP 0 0.0 -42.9 Exhausted 6 0.1
2-Party Preferred James LIB 6093 59.8 +2.7 Cuomo ALP 4092 40.2 -2.7 Exhausted 14 0.1
Formal 10199 94.4 -1.5 Informal 605 5.6 +1.5 Total / Turnout 10804 76.4 Note: Sitting Liberal MP Matt Birney retired. John Bowler was the Independent and former Labor MP for the abolished seat of Murchison-Eyre. Kimberley Roll 16658
Candidate Party Votes % Swing
First Count Sandes GRN 1320 13.4 +0.1 Ockerby CEC 100 1.0 +1.0 McCourt NAT 1809 18.3 +18.3 Martin * ALP 4066 41.2 -1.0 Webb-Smith LIB 2566 26.0 -8.9 .... CDP 0.0 -1.2 .... ONP 0.0 -1.2 .... OTH 0.0 -7.2
Final Count Martin * ALP 5587 56.8 -0.1 Webb-Smith LIB 4257 43.2 +0.1 Exhausted 17 0.2
Formal 9861 95.5 .. Informal 463 4.5 .. Total / Turnout 10324 62.0
2008 Western Australian Election
15
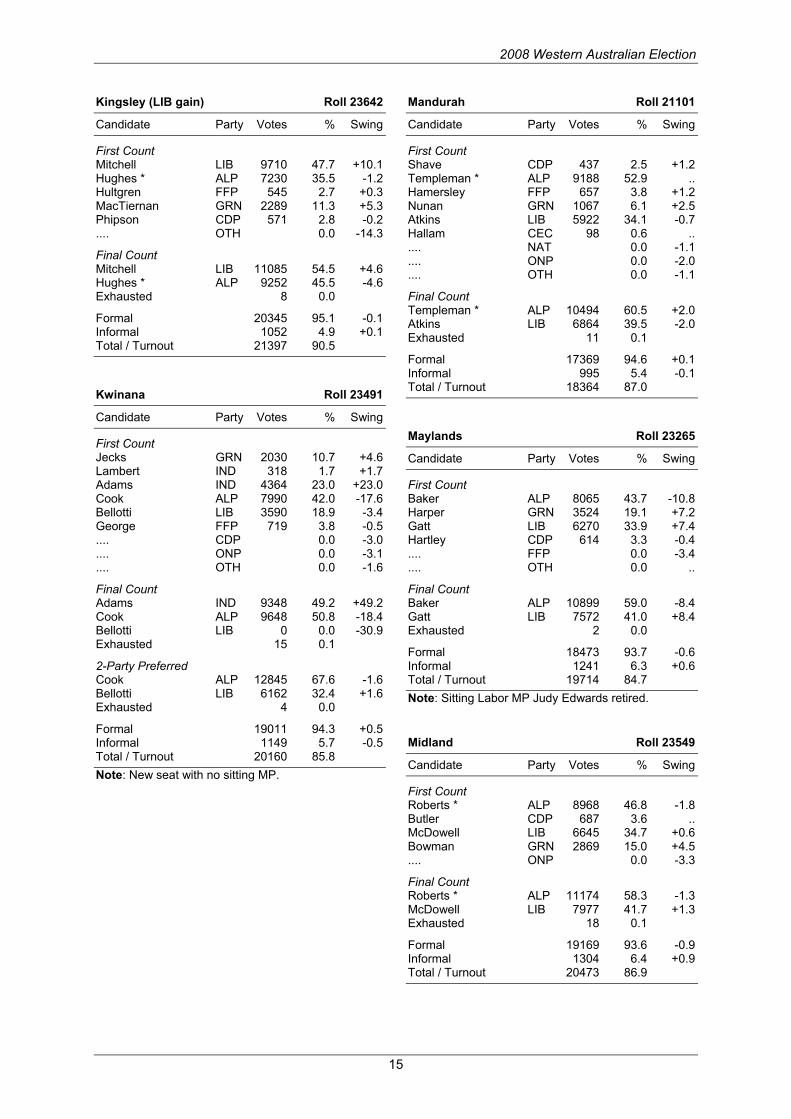
Kingsley (LIB gain) Roll 23642
Candidate Party Votes % Swing
First Count Mitchell LIB 9710 47.7 +10.1 Hughes * ALP 7230 35.5 -1.2 Hultgren FFP 545 2.7 +0.3 MacTiernan GRN 2289 11.3 +5.3 Phipson CDP 571 2.8 -0.2 .... OTH 0.0 -14.3
Final Count Mitchell LIB 11085 54.5 +4.6 Hughes * ALP 9252 45.5 -4.6 Exhausted 8 0.0
Formal 20345 95.1 -0.1 Informal 1052 4.9 +0.1 Total / Turnout 21397 90.5 Kwinana Roll 23491
Candidate Party Votes % Swing
First Count Jecks GRN 2030 10.7 +4.6 Lambert IND 318 1.7 +1.7 Adams IND 4364 23.0 +23.0 Cook ALP 7990 42.0 -17.6 Bellotti LIB 3590 18.9 -3.4 George FFP 719 3.8 -0.5 .... CDP 0.0 -3.0 .... ONP 0.0 -3.1 .... OTH 0.0 -1.6
Final Count Adams IND 9348 49.2 +49.2 Cook ALP 9648 50.8 -18.4 Bellotti LIB 0 0.0 -30.9 Exhausted 15 0.1
2-Party Preferred Cook ALP 12845 67.6 -1.6 Bellotti LIB 6162 32.4 +1.6 Exhausted 4 0.0
Formal 19011 94.3 +0.5 Informal 1149 5.7 -0.5 Total / Turnout 20160 85.8 Note: New seat with no sitting MP.
Mandurah Roll 21101
Candidate Party Votes % Swing
First Count Shave CDP 437 2.5 +1.2 Templeman * ALP 9188 52.9 .. Hamersley FFP 657 3.8 +1.2 Nunan GRN 1067 6.1 +2.5 Atkins LIB 5922 34.1 -0.7 Hallam CEC 98 0.6 .. .... NAT 0.0 -1.1 .... ONP 0.0 -2.0 .... OTH 0.0 -1.1
Final Count Templeman * ALP 10494 60.5 +2.0 Atkins LIB 6864 39.5 -2.0 Exhausted 11 0.1
Formal 17369 94.6 +0.1 Informal 995 5.4 -0.1 Total / Turnout 18364 87.0 Maylands Roll 23265
Candidate Party Votes % Swing
First Count Baker ALP 8065 43.7 -10.8 Harper GRN 3524 19.1 +7.2 Gatt LIB 6270 33.9 +7.4 Hartley CDP 614 3.3 -0.4 .... FFP 0.0 -3.4 .... OTH 0.0 ..
Final Count Baker ALP 10899 59.0 -8.4 Gatt LIB 7572 41.0 +8.4 Exhausted 2 0.0
Formal 18473 93.7 -0.6 Informal 1241 6.3 +0.6 Total / Turnout 19714 84.7 Note: Sitting Labor MP Judy Edwards retired. Midland Roll 23549
Candidate Party Votes % Swing
First Count Roberts * ALP 8968 46.8 -1.8 Butler CDP 687 3.6 .. McDowell LIB 6645 34.7 +0.6 Bowman GRN 2869 15.0 +4.5 .... ONP 0.0 -3.3
Final Count Roberts * ALP 11174 58.3 -1.3 McDowell LIB 7977 41.7 +1.3 Exhausted 18 0.1
Formal 19169 93.6 -0.9 Informal 1304 6.4 +0.9 Total / Turnout 20473 86.9
2008 Western Australian Election
16
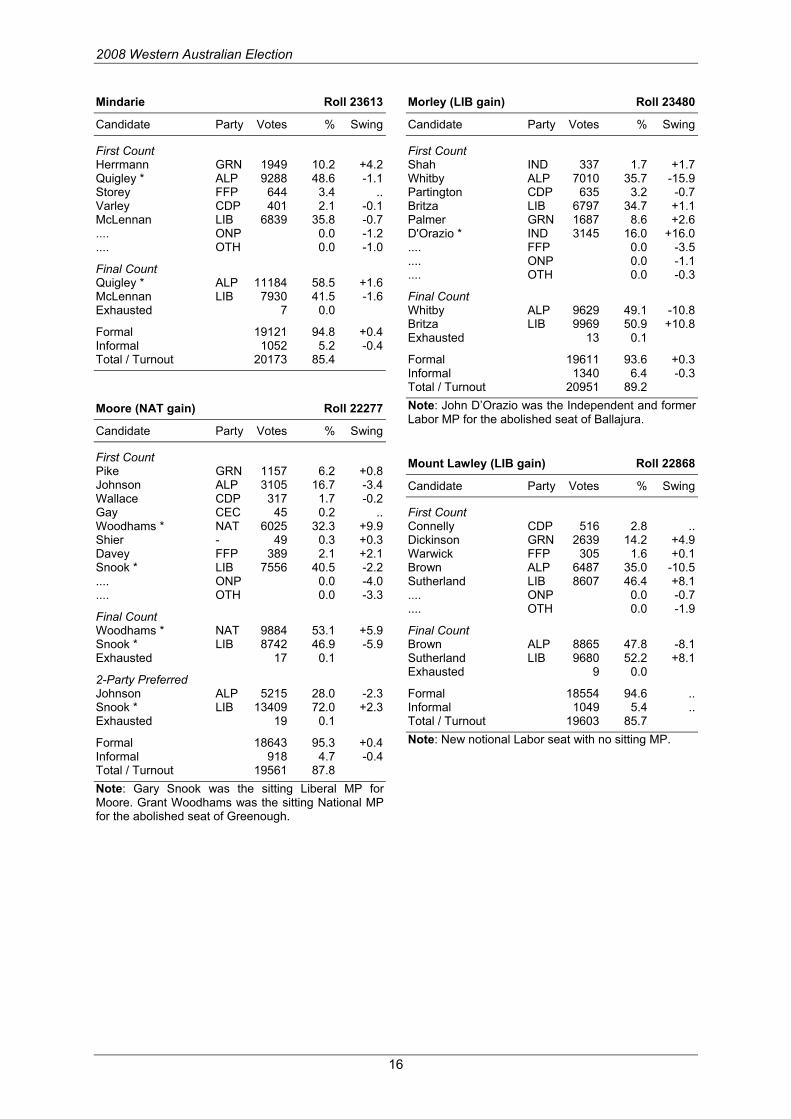
Mindarie Roll 23613
Candidate Party Votes % Swing
First Count Herrmann GRN 1949 10.2 +4.2 Quigley * ALP 9288 48.6 -1.1 Storey FFP 644 3.4 .. Varley CDP 401 2.1 -0.1 McLennan LIB 6839 35.8 -0.7 .... ONP 0.0 -1.2 .... OTH 0.0 -1.0
Final Count Quigley * ALP 11184 58.5 +1.6 McLennan LIB 7930 41.5 -1.6 Exhausted 7 0.0
Formal 19121 94.8 +0.4 Informal 1052 5.2 -0.4 Total / Turnout 20173 85.4 Moore (NAT gain) Roll 22277
Candidate Party Votes % Swing
First Count Pike GRN 1157 6.2 +0.8 Johnson ALP 3105 16.7 -3.4 Wallace CDP 317 1.7 -0.2 Gay CEC 45 0.2 .. Woodhams * NAT 6025 32.3 +9.9 Shier - 49 0.3 +0.3 Davey FFP 389 2.1 +2.1 Snook * LIB 7556 40.5 -2.2 .... ONP 0.0 -4.0 .... OTH 0.0 -3.3
Final Count Woodhams * NAT 9884 53.1 +5.9 Snook * LIB 8742 46.9 -5.9 Exhausted 17 0.1
2-Party Preferred Johnson ALP 5215 28.0 -2.3 Snook * LIB 13409 72.0 +2.3 Exhausted 19 0.1
Formal 18643 95.3 +0.4 Informal 918 4.7 -0.4 Total / Turnout 19561 87.8 Note: Gary Snook was the sitting Liberal MP for Moore. Grant Woodhams was the sitting National MP for the abolished seat of Greenough.
Morley (LIB gain) Roll 23480
Candidate Party Votes % Swing
First Count Shah IND 337 1.7 +1.7 Whitby ALP 7010 35.7 -15.9 Partington CDP 635 3.2 -0.7 Britza LIB 6797 34.7 +1.1 Palmer GRN 1687 8.6 +2.6 D'Orazio * IND 3145 16.0 +16.0 .... FFP 0.0 -3.5 .... ONP 0.0 -1.1 .... OTH 0.0 -0.3
Final Count Whitby ALP 9629 49.1 -10.8 Britza LIB 9969 50.9 +10.8 Exhausted 13 0.1
Formal 19611 93.6 +0.3 Informal 1340 6.4 -0.3 Total / Turnout 20951 89.2 Note: John D’Orazio was the Independent and former Labor MP for the abolished seat of Ballajura. Mount Lawley (LIB gain) Roll 22868
Candidate Party Votes % Swing
First Count Connelly CDP 516 2.8 .. Dickinson GRN 2639 14.2 +4.9 Warwick FFP 305 1.6 +0.1 Brown ALP 6487 35.0 -10.5 Sutherland LIB 8607 46.4 +8.1 .... ONP 0.0 -0.7 .... OTH 0.0 -1.9
Final Count Brown ALP 8865 47.8 -8.1 Sutherland LIB 9680 52.2 +8.1 Exhausted 9 0.0
Formal 18554 94.6 .. Informal 1049 5.4 .. Total / Turnout 19603 85.7 Note: New notional Labor seat with no sitting MP.
2008 Western Australian Election
17
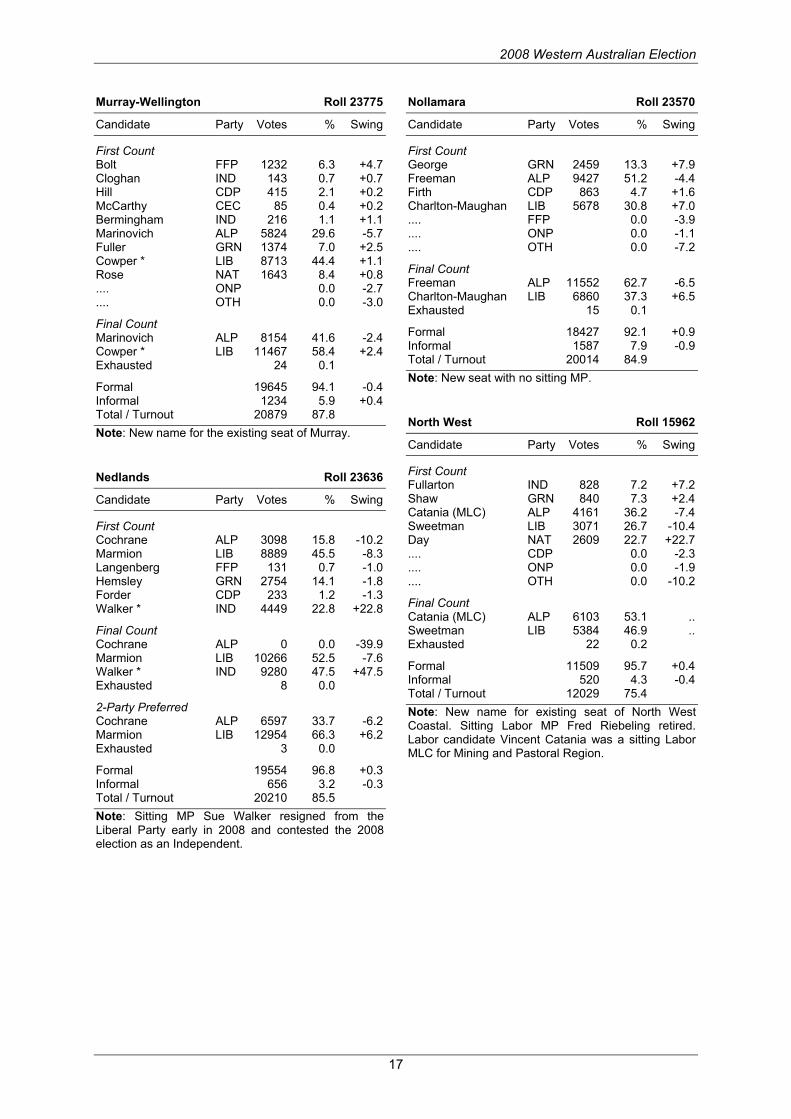
Murray-Wellington Roll 23775
Candidate Party Votes % Swing
First Count Bolt FFP 1232 6.3 +4.7 Cloghan IND 143 0.7 +0.7 Hill CDP 415 2.1 +0.2 McCarthy CEC 85 0.4 +0.2 Bermingham IND 216 1.1 +1.1 Marinovich ALP 5824 29.6 -5.7 Fuller GRN 1374 7.0 +2.5 Cowper * LIB 8713 44.4 +1.1 Rose NAT 1643 8.4 +0.8 .... ONP 0.0 -2.7 .... OTH 0.0 -3.0
Final Count Marinovich ALP 8154 41.6 -2.4 Cowper * LIB 11467 58.4 +2.4 Exhausted 24 0.1
Formal 19645 94.1 -0.4 Informal 1234 5.9 +0.4 Total / Turnout 20879 87.8 Note: New name for the existing seat of Murray. Nedlands Roll 23636
Candidate Party Votes % Swing
First Count Cochrane ALP 3098 15.8 -10.2 Marmion LIB 8889 45.5 -8.3 Langenberg FFP 131 0.7 -1.0 Hemsley GRN 2754 14.1 -1.8 Forder CDP 233 1.2 -1.3 Walker * IND 4449 22.8 +22.8
Final Count Cochrane ALP 0 0.0 -39.9 Marmion LIB 10266 52.5 -7.6 Walker * IND 9280 47.5 +47.5 Exhausted 8 0.0
2-Party Preferred Cochrane ALP 6597 33.7 -6.2 Marmion LIB 12954 66.3 +6.2 Exhausted 3 0.0
Formal 19554 96.8 +0.3 Informal 656 3.2 -0.3 Total / Turnout 20210 85.5 Note: Sitting MP Sue Walker resigned from the Liberal Party early in 2008 and contested the 2008 election as an Independent.
Nollamara Roll 23570
Candidate Party Votes % Swing
First Count George GRN 2459 13.3 +7.9 Freeman ALP 9427 51.2 -4.4 Firth CDP 863 4.7 +1.6 Charlton-Maughan LIB 5678 30.8 +7.0 .... FFP 0.0 -3.9 .... ONP 0.0 -1.1 .... OTH 0.0 -7.2
Final Count Freeman ALP 11552 62.7 -6.5 Charlton-Maughan LIB 6860 37.3 +6.5 Exhausted 15 0.1
Formal 18427 92.1 +0.9 Informal 1587 7.9 -0.9 Total / Turnout 20014 84.9 Note: New seat with no sitting MP. North West Roll 15962
Candidate Party Votes % Swing
First Count Fullarton IND 828 7.2 +7.2 Shaw GRN 840 7.3 +2.4 Catania (MLC) ALP 4161 36.2 -7.4 Sweetman LIB 3071 26.7 -10.4 Day NAT 2609 22.7 +22.7 .... CDP 0.0 -2.3 .... ONP 0.0 -1.9 .... OTH 0.0 -10.2
Final Count Catania (MLC) ALP 6103 53.1 .. Sweetman LIB 5384 46.9 .. Exhausted 22 0.2
Formal 11509 95.7 +0.4 Informal 520 4.3 -0.4 Total / Turnout 12029 75.4 Note: New name for existing seat of North West Coastal. Sitting Labor MP Fred Riebeling retired. Labor candidate Vincent Catania was a sitting Labor MLC for Mining and Pastoral Region.
2008 Western Australian Election
18
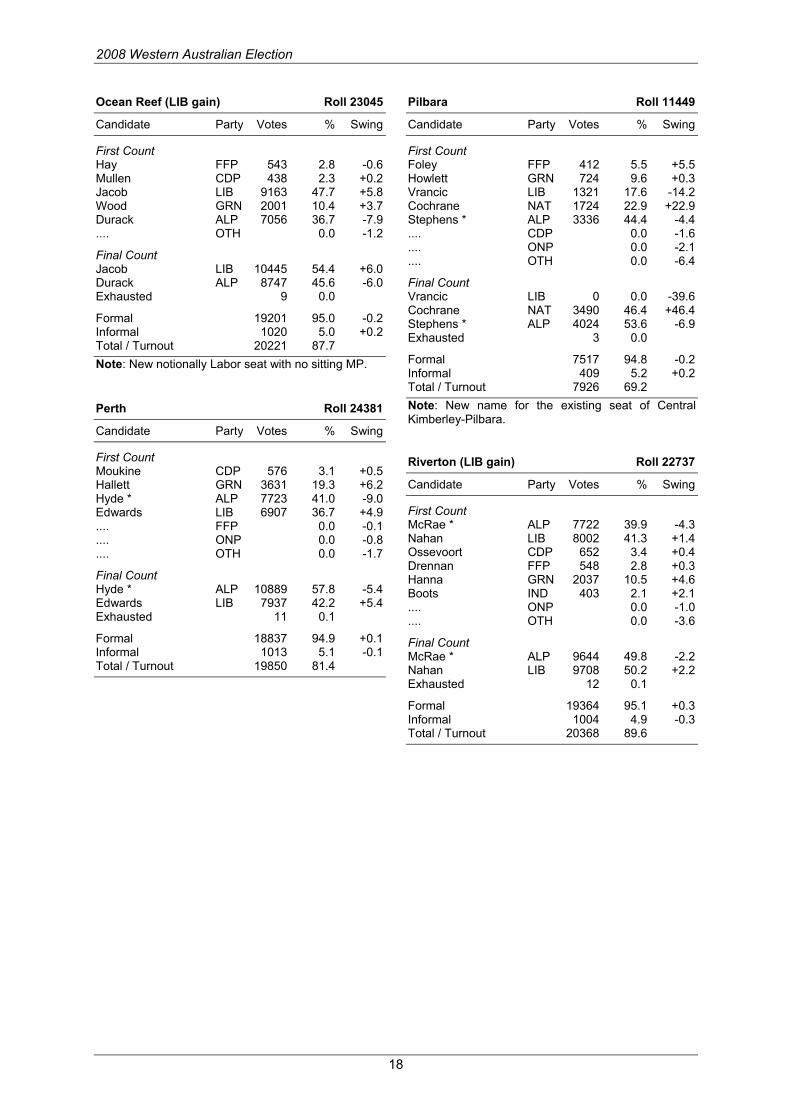
Ocean Reef (LIB gain) Roll 23045
Candidate Party Votes % Swing
First Count Hay FFP 543 2.8 -0.6 Mullen CDP 438 2.3 +0.2 Jacob LIB 9163 47.7 +5.8 Wood GRN 2001 10.4 +3.7 Durack ALP 7056 36.7 -7.9 .... OTH 0.0 -1.2
Final Count Jacob LIB 10445 54.4 +6.0 Durack ALP 8747 45.6 -6.0 Exhausted 9 0.0
Formal 19201 95.0 -0.2 Informal 1020 5.0 +0.2 Total / Turnout 20221 87.7 Note: New notionally Labor seat with no sitting MP. Perth Roll 24381
Candidate Party Votes % Swing
First Count Moukine CDP 576 3.1 +0.5 Hallett GRN 3631 19.3 +6.2 Hyde * ALP 7723 41.0 -9.0 Edwards LIB 6907 36.7 +4.9 .... FFP 0.0 -0.1 .... ONP 0.0 -0.8 .... OTH 0.0 -1.7
Final Count Hyde * ALP 10889 57.8 -5.4 Edwards LIB 7937 42.2 +5.4 Exhausted 11 0.1
Formal 18837 94.9 +0.1 Informal 1013 5.1 -0.1 Total / Turnout 19850 81.4
Pilbara Roll 11449
Candidate Party Votes % Swing
First Count Foley FFP 412 5.5 +5.5 Howlett GRN 724 9.6 +0.3 Vrancic LIB 1321 17.6 -14.2 Cochrane NAT 1724 22.9 +22.9 Stephens * ALP 3336 44.4 -4.4 .... CDP 0.0 -1.6 .... ONP 0.0 -2.1 .... OTH 0.0 -6.4
Final Count Vrancic LIB 0 0.0 -39.6 Cochrane NAT 3490 46.4 +46.4 Stephens * ALP 4024 53.6 -6.9 Exhausted 3 0.0
Formal 7517 94.8 -0.2 Informal 409 5.2 +0.2 Total / Turnout 7926 69.2 Note: New name for the existing seat of Central Kimberley-Pilbara. Riverton (LIB gain) Roll 22737
Candidate Party Votes % Swing
First Count McRae * ALP 7722 39.9 -4.3 Nahan LIB 8002 41.3 +1.4 Ossevoort CDP 652 3.4 +0.4 Drennan FFP 548 2.8 +0.3 Hanna GRN 2037 10.5 +4.6 Boots IND 403 2.1 +2.1 .... ONP 0.0 -1.0 .... OTH 0.0 -3.6
Final Count McRae * ALP 9644 49.8 -2.2 Nahan LIB 9708 50.2 +2.2 Exhausted 12 0.1
Formal 19364 95.1 +0.3 Informal 1004 4.9 -0.3 Total / Turnout 20368 89.6

2008 Western Australian Election
19
Rockingham Roll 22903
Candidate Party Votes % Swing
First Count McGowan * ALP 9559 51.2 -4.1 Simpson LIB 6371 34.1 +1.3 Totten CEC 318 1.7 +1.3 Mumme GRN 2432 13.0 +8.3 .... CDP 0.0 -2.5 .... FFP 0.0 -1.8 .... ONP 0.0 -2.4
Final Count McGowan * ALP 11321 60.6 -0.7 Simpson LIB 7355 39.4 +0.7 Exhausted 4 0.0
Formal 18680 94.5 -0.1 Informal 1097 5.5 +0.1 Total / Turnout 19777 86.4 Scarborough Roll 23420
Candidate Party Votes % Swing
First Count Re IND 1707 9.1 +9.1 McCourt FFP 223 1.2 +1.2 Harvey LIB 8374 44.9 +14.2 Lundie-Jenkins GRN 2338 12.5 +1.9 Whately CDP 400 2.1 -1.4 Blackwell ALP 5622 30.1 -2.3 .... OTH 0.0 -22.7
Final Count Harvey LIB 10290 55.2 +2.6 Blackwell ALP 8360 44.8 -2.6 Exhausted 14 0.1
Formal 18664 95.0 -0.6 Informal 972 5.0 +0.6 Total / Turnout 19636 83.8 Note: New seat with no sitting MP.
South Perth Roll 23522
Candidate Party Votes % Swing
First Count Grayden IND 1767 9.2 +9.2 McGrath * LIB 10136 52.9 +7.5 Michael ALP 4594 24.0 -8.5 McDonald FFP 473 2.5 +2.5 Hough IND 184 1.0 +1.0 Harman GRN 2016 10.5 +2.1 .... CDP 0.0 -2.9 .... OTH 0.0 -10.9
Final Count McGrath * LIB 12310 64.3 +6.9 Michael ALP 6845 35.7 -6.9 Exhausted 15 0.1
Formal 19170 95.7 -0.9 Informal 858 4.3 +0.9 Total / Turnout 20028 85.1 Southern River (LIB gain) Roll 24632
Candidate Party Votes % Swing
First Count Wiseman GRN 2149 10.3 +5.5 Kuipers CDP 534 2.6 -0.4 Andrews * ALP 8119 39.0 -8.4 Abetz LIB 9382 45.0 +7.4 Judge FFP 648 3.1 -0.7 .... ONP 0.0 -1.5 .... OTH 0.0 -1.9
Final Count Andrews * ALP 10073 48.4 -6.8 Abetz LIB 10759 51.6 +6.8
Formal 20832 94.1 -0.7 Informal 1299 5.9 +0.7 Total / Turnout 22131 89.8

2008 Western Australian Election
20
Swan Hills (LIB gain) Roll 24779
Candidate Party Votes % Swing
First Count Watson FFP 734 3.5 +1.9 Giffard (MLC) ALP 7183 34.1 -11.1 Alban LIB 9589 45.5 +6.3 Bowman GRN 3009 14.3 +7.3 Blok CDP 540 2.6 +0.1 .... ONP 0.0 -1.3 .... OTH 0.0 -3.2
Final Count Giffard (MLC) ALP 9777 46.5 -7.1 Alban LIB 11268 53.5 +7.1 Exhausted 10 0.0
Formal 21055 94.8 -0.6 Informal 1158 5.2 +0.6 Total / Turnout 22213 89.6 Note: Sitting Labor MP Jaye Radisich retired. Labor candidate Graham Giffard was an MLC for North Metropolitan Region. Vasse Roll 24249
Candidate Party Votes % Swing
First Count Hutchins GRN 3653 17.9 +8.3 Elson ALP 4427 21.8 -0.8 Gifford CDP 967 4.8 +3.6 Buswell * LIB 11306 55.5 +14.9 .... NAT 0.0 -7.8 .... ONP 0.0 -1.4 .... FFP 0.0 -2.5 .... OTH 0.0 -14.2
Final Count Elson ALP 7423 36.5 -3.9 Buswell * LIB 12913 63.5 +3.9 Exhausted 17 0.1
Formal 20353 95.6 +0.1 Informal 947 4.4 -0.1 Total / Turnout 21300 87.8
Victoria Park Roll 24201
Candidate Party Votes % Swing
First Count Wyatt * ALP 9137 46.8 -7.3 Olsen FFP 468 2.4 +2.4 Matthews CDP 490 2.5 -0.4 Lisson GRN 2726 13.9 +4.6 Travia LIB 6723 34.4 +4.6 .... ONP 0.0 -1.9 .... OTH 0.0 -1.9
Final Count Wyatt * ALP 11523 59.0 -4.7 Travia LIB 8012 41.0 +4.7 Exhausted 9 0.0
Formal 19544 95.2 +0.1 Informal 979 4.8 -0.1 Total / Turnout 20523 84.8 Wagin Roll 20386
Candidate Party Votes % Swing
First Count Waldron * NAT 11155 63.0 -1.0 Robinson CEC 163 0.9 -0.7 Price GRN 615 3.5 -0.1 Martin LIB 3254 18.4 +9.8 Melville ALP 1839 10.4 -4.2 Young CDP 677 3.8 +0.4 .... ONP 0.0 -3.5 .... OTH 0.0 -0.8
Final Count Waldron * NAT 13640 77.1 -2.6 Martin LIB 4045 22.9 +22.9 Melville ALP 0 0.0 -20.3 Exhausted 18 0.1
2-Party Preferred Waldron * NAT 0 0.0 -79.7 Martin LIB 13665 77.4 +77.4 Melville ALP 3998 22.6 +2.3 Exhausted 40 0.2
Formal 17703 96.8 +1.1 Informal 593 3.2 -1.1 Total / Turnout 18296 89.7

2008 Western Australian Election
21
Wanneroo (LIB gain) Roll 26745
Candidate Party Votes % Swing
First Count Miles LIB 9849 43.7 +7.7 Birch CDP 599 2.7 +0.4 Grasso FFP 640 2.8 -1.2 Guise * ALP 8990 39.9 -9.7 Aquilina GRN 1974 8.8 +4.1 Sewell IND 496 2.2 +2.2 .... ONP 0.0 -1.6 .... OTH 0.0 -2.0
Final Count Miles LIB 11429 50.7 +6.9 Guise * ALP 11108 49.3 -6.9 Exhausted 11 0.0
Formal 22548 94.9 +0.2 Informal 1223 5.1 -0.2 Total / Turnout 23771 88.9 Warnbro Roll 24358
Candidate Party Votes % Swing
First Count Papalia * ALP 9666 48.5 -4.4 Booth GRN 2414 12.1 +5.7 Pollock FFP 1457 7.3 +4.3 Bathgate LIB 6412 32.1 +0.7 .... CDP 0.0 -3.8 .... ONP 0.0 -2.1 .... OTH 0.0 -0.4
Final Count Papalia * ALP 11907 59.7 -1.5 Bathgate LIB 8039 40.3 +1.5 Exhausted 3 0.0
Formal 19949 94.9 -0.1 Informal 1066 5.1 +0.1 Total / Turnout 21015 86.3 Note: New seat with no sitting MP.
West Swan Roll 22369
Candidate Party Votes % Swing
First Count Butler CDP 872 4.7 +0.9 Henderson LIB 7017 37.6 +5.9 Fayle IND 483 2.6 +2.6 Boswell GRN 1676 9.0 +3.9 Saffioti ALP 8612 46.2 -7.1 .... FFP 0.0 -3.9 .... ONP 0.0 -2.0 .... OTH 0.0 -0.4
Final Count Henderson LIB 8497 45.6 +6.2 Saffioti ALP 10156 54.4 -6.2 Exhausted 7 0.0
Formal 18660 93.7 -0.7 Informal 1246 6.3 +0.7 Total / Turnout 19906 89.0 Note: New seat with no sitting MP. Willagee Roll 23414
Candidate Party Votes % Swing
First Count Carpenter * ALP 9718 51.7 +3.6 Delves GRN 3277 17.4 +8.4 Taylor LIB 5820 30.9 +5.6 .... CDP 0.0 -2.5 .... FFP 0.0 -2.4 .... ONP 0.0 -1.2 .... OTH 0.0 -11.6
Final Count Carpenter * ALP 12150 64.6 +0.9 Taylor LIB 6664 35.4 -0.9 Exhausted 1 0.0
Formal 18815 93.3 +0.6 Informal 1350 6.7 -0.6 Total / Turnout 20165 86.1

2008 Western Australian Election
22
SUMMARY OF TWO-PARTY PREFERRED RESULTS BY ELECTORATE LEGISLATIVE ASSEMBLY: SUMMARY OF TWO-PARTY RESULTS BY ELECTORATE Electoral 2PP Votes 2PP Percent District Labor Lib/Nat Labor Lib/Nat Swing Albany 9884 9795 50.2 49.8 2.5 to Labor Alfred Cove ** 6891 13111 34.5 65.5 7.0 to Lib/Nat Armadale 12628 6845 64.8 35.2 0.6 to Labor Balcatta 9804 8941 52.3 47.7 6.9 to Lib/Nat Bassendean 11320 7442 60.3 39.7 4.5 to Lib/Nat Bateman 7620 12116 38.6 61.4 4.5 to Lib/Nat Belmont 9962 7596 56.7 43.3 4.9 to Lib/Nat Blackwood-Stirling ** 6411 11409 36.0 64.0 5.3 to Labor Bunbury 6711 10825 38.3 61.7 12.6 to Lib/Nat Cannington 11003 7633 59.0 41.0 4.3 to Lib/Nat Carine 7070 12832 35.5 64.5 6.8 to Lib/Nat Central Wheatbelt ** 5134 12294 29.5 70.5 5.5 to Labor Churchlands ** 5253 14549 26.5 73.5 4.7 to Lib/Nat Cockburn 11773 7982 59.6 40.4 5.2 to Lib/Nat Collie-Preston 10494 10083 51.0 49.0 0.2 to Labor Cottesloe 6047 13729 30.6 69.4 8.0 to Lib/Nat Darling Range 9030 11292 44.4 55.6 6.3 to Lib/Nat Dawesville 6857 10776 38.9 61.1 9.4 to Lib/Nat Eyre ** 4354 9777 30.8 69.2 4.3 to Lib/Nat Forrestfield 10017 9919 50.2 49.8 4.3 to Lib/Nat Fremantle 11667 7147 62.0 38.0 2.1 to Lib/Nat Geraldton 7420 10467 41.5 58.5 5.0 to Lib/Nat Girrawheen 11014 6905 61.5 38.5 7.6 to Lib/Nat Gosnells 10172 8162 55.5 44.5 5.9 to Lib/Nat Hillarys 7648 12145 38.6 61.4 7.8 to Lib/Nat Jandakot 9920 10680 48.2 51.8 5.5 to Lib/Nat Joondalup 9950 8655 53.5 46.5 0.8 to Lib/Nat Kalamunda 8508 10939 43.7 56.3 6.1 to Lib/Nat Kalgoorlie ** 4092 6093 40.2 59.8 2.7 to Lib/Nat Kimberley 5587 4257 56.8 43.2 0.1 to Lib/Nat Kingsley 9252 11085 45.5 54.5 4.6 to Lib/Nat Kwinana ** 12845 6162 67.6 32.4 1.6 to Lib/Nat Mandurah 10494 6864 60.5 39.5 2.0 to Labor Maylands 10899 7572 59.0 41.0 8.4 to Lib/Nat Midland 11174 7977 58.3 41.7 1.3 to Lib/Nat Mindarie 11184 7930 58.5 41.5 1.6 to Labor Moore ** 5215 13409 28.0 72.0 2.3 to Lib/Nat Morley 9629 9969 49.1 50.9 10.8 to Lib/Nat Mount Lawley 8865 9680 47.8 52.2 8.1 to Lib/Nat Murray-Wellington 8154 11467 41.6 58.4 2.4 to Lib/Nat Nedlands 6597 12954 33.7 66.3 6.2 to Lib/Nat Nollamara 11552 6860 62.7 37.3 6.5 to Lib/Nat North West 6103 5384 53.1 46.9 (No swing) Ocean Reef 8747 10445 45.6 54.4 6.0 to Lib/Nat Perth 10889 7937 57.8 42.2 5.4 to Lib/Nat Pilbara 4024 3490 53.6 46.4 6.9 to Lib/Nat Riverton 9644 9708 49.9 50.2 2.2 to Lib/Nat Rockingham 11321 7355 60.6 39.4 0.7 to Lib/Nat Scarborough 8360 10290 44.8 55.2 2.6 to Lib/Nat South Perth 6845 12310 35.7 64.3 6.9 to Lib/Nat Southern River 10073 10759 48.4 51.6 6.8 to Lib/Nat Swan Hills 9777 11268 46.5 53.5 7.1 to Lib/Nat Vasse 7423 12913 36.5 63.5 3.9 to Lib/Nat Victoria Park 11523 8012 59.0 41.0 4.7 to Lib/Nat Wagin ** 3998 13665 22.6 77.4 2.3 to Labor
2008 Western Australian Election
23
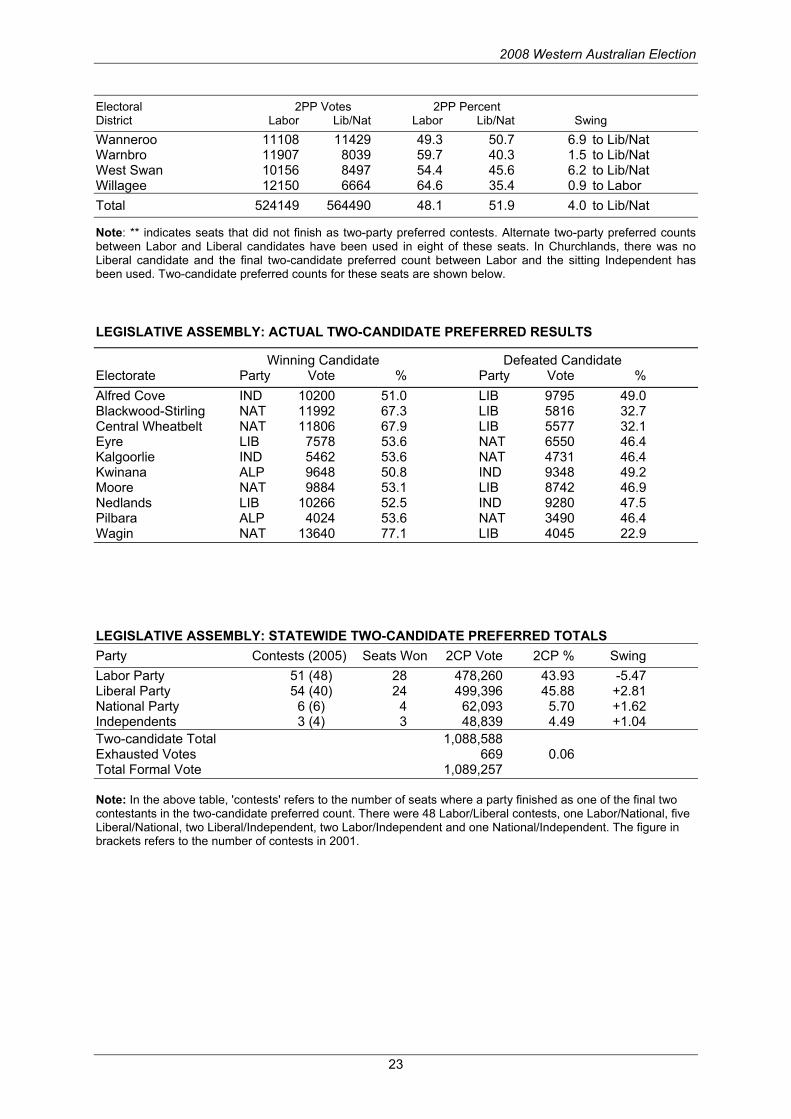
Electoral 2PP Votes 2PP Percent District Labor Lib/Nat Labor Lib/Nat Swing Wanneroo 11108 11429 49.3 50.7 6.9 to Lib/Nat Warnbro 11907 8039 59.7 40.3 1.5 to Lib/Nat West Swan 10156 8497 54.4 45.6 6.2 to Lib/Nat Willagee 12150 6664 64.6 35.4 0.9 to Labor Total 524149 564490 48.1 51.9 4.0 to Lib/Nat
Note: ** indicates seats that did not finish as two-party preferred contests. Alternate two-party preferred counts between Labor and Liberal candidates have been used in eight of these seats. In Churchlands, there was no Liberal candidate and the final two-candidate preferred count between Labor and the sitting Independent has been used. Two-candidate preferred counts for these seats are shown below.
LEGISLATIVE ASSEMBLY: ACTUAL TWO-CANDIDATE PREFERRED RESULTS
Winning Candidate Defeated Candidate Electorate Party Vote % Party Vote % Alfred Cove IND 10200 51.0 LIB 9795 49.0 Blackwood-Stirling NAT 11992 67.3 LIB 5816 32.7 Central Wheatbelt NAT 11806 67.9 LIB 5577 32.1 Eyre LIB 7578 53.6 NAT 6550 46.4 Kalgoorlie IND 5462 53.6 NAT 4731 46.4 Kwinana ALP 9648 50.8 IND 9348 49.2 Moore NAT 9884 53.1 LIB 8742 46.9 Nedlands LIB 10266 52.5 IND 9280 47.5 Pilbara ALP 4024 53.6 NAT 3490 46.4 Wagin NAT 13640 77.1 LIB 4045 22.9
LEGISLATIVE ASSEMBLY: STATEWIDE TWO-CANDIDATE PREFERRED TOTALS Party Contests (2005) Seats Won 2CP Vote 2CP % Swing Labor Party 51 (48) 28 478,260 43.93 -5.47 Liberal Party 54 (40) 24 499,396 45.88 +2.81 National Party 6 (6) 4 62,093 5.70 +1.62 Independents 3 (4) 3 48,839 4.49 +1.04 Two-candidate Total 1,088,588 Exhausted Votes 669 0.06 Total Formal Vote 1,089,257 Note: In the above table, 'contests' refers to the number of seats where a party finished as one of the final two contestants in the two-candidate preferred count. There were 48 Labor/Liberal contests, one Labor/National, five Liberal/National, two Liberal/Independent, two Labor/Independent and one National/Independent. The figure in brackets refers to the number of contests in 2001.

2008 Western Australian Election
24
LEGISLATIVE ASSEMBLY: ELECTORATES RANKED BY NEW MARGINS
Electoral Margin Electorate Margin Liberal (24) / National (4) Wagin (NAT 27.1 v LIB) 27.4 Moore (NAT 3.1 v LIB) 22.0 Central Wheatbelt (NAT 17.9 v LIB) 20.5 Cottesloe 19.4 Eyre (LIB 3.6 v NAT) 19.2 Nedlands (LIB 2.5 v IND) 16.3 Carine 14.5 South Perth 14.3 Blackwood-Stirling (NAT 17.3 v LIB) 14.0 Vasse 13.5 Bunbury 11.7 Bateman 11.4 Hillarys 11.4 Dawesville 11.1 Geraldton 8.5 Murray-Wellington 8.4 Kalamunda 6.3 Darling Range 5.6 Scarborough 5.2 Kingsley 4.5 Ocean Reef 4.4 Swan Hills 3.5 Mount Lawley 2.2 Jandakot 1.8 Southern River 1.6 Morley 0.9 Wanneroo 0.7 Riverton 0.2 Independents (3) Alfred Cove (v LIB) 1.0 Kalgoorlie (v NAT) 3.6 Churchlands (v ALP) 23.5
Labor (28) Kwinana (ALP 0.8 v IND) 17.6 Armadale 14.8 Willagee 14.6 Nollamara 12.7 Fremantle 12.0 Girrawheen 11.5 Rockingham 10.6 Mandurah 10.5 Bassendean 10.3 Warnbro 9.7 Cockburn 9.6 Cannington 9.0 Maylands 9.0 Victoria Park 9.0 Mindarie 8.5 Midland 8.3 Perth 7.8 Kimberley 6.8 Belmont 6.7 Gosnells 5.5 West Swan 4.4 Pilbara (v NAT) 3.6 Joondalup 3.5 North West 3.1 Balcatta 2.3 Collie-Preston 1.0 Forrestfield 0.2 Albany 0.2
Alternate two-party preferred counts conducted between Labor and Liberal candidates have been used for Blackwood-Stirling, Central Wheatbelt, Eyre, Kwinana, Moore, Nedlands and Wagin. All three Independent seats would appear in the Liberal/National column using two-party preferred counts. The Liberal margin versus Labor was 15.5% in Alfred Cove and 9.8% in Kalgoorlie. There was no Liberal candidate in Alfred Cove and the Independent margin versus Labor has been used. Underlining indicates seats that changed party. This change in party is compared to the notional party status for each seat derived from adjusting the 2005 election results to match the new electoral boundaries. See notes on seat changes on page 5 for further explanation.
2008 Western Australian Election
25
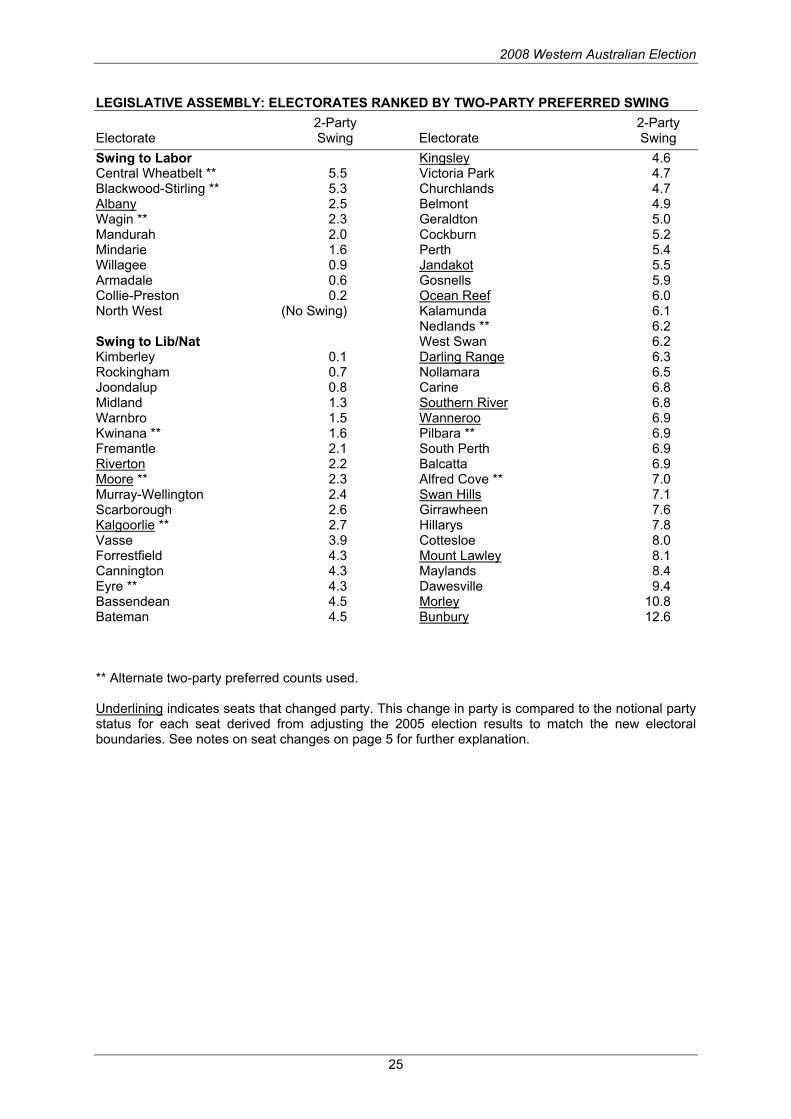
LEGISLATIVE ASSEMBLY: ELECTORATES RANKED BY TWO-PARTY PREFERRED SWING 2-Party 2-Party Electorate Swing Electorate SwingSwing to Labor Central Wheatbelt ** 5.5 Blackwood-Stirling ** 5.3 Albany 2.5 Wagin ** 2.3 Mandurah 2.0 Mindarie 1.6 Willagee 0.9 Armadale 0.6 Collie-Preston 0.2 North West (No Swing) Swing to Lib/Nat Kimberley 0.1 Rockingham 0.7 Joondalup 0.8 Midland 1.3 Warnbro 1.5 Kwinana ** 1.6 Fremantle 2.1 Riverton 2.2 Moore ** 2.3 Murray-Wellington 2.4 Scarborough 2.6 Kalgoorlie ** 2.7 Vasse 3.9 Forrestfield 4.3 Cannington 4.3 Eyre ** 4.3 Bassendean 4.5 Bateman 4.5
Kingsley 4.6 Victoria Park 4.7 Churchlands 4.7 Belmont 4.9 Geraldton 5.0 Cockburn 5.2 Perth 5.4 Jandakot 5.5 Gosnells 5.9 Ocean Reef 6.0 Kalamunda 6.1 Nedlands ** 6.2 West Swan 6.2 Darling Range 6.3 Nollamara 6.5 Carine 6.8 Southern River 6.8 Wanneroo 6.9 Pilbara ** 6.9 South Perth 6.9 Balcatta 6.9 Alfred Cove ** 7.0 Swan Hills 7.1 Girrawheen 7.6 Hillarys 7.8 Cottesloe 8.0 Mount Lawley 8.1 Maylands 8.4 Dawesville 9.4 Morley 10.8 Bunbury 12.6
** Alternate two-party preferred counts used. Underlining indicates seats that changed party. This change in party is compared to the notional party status for each seat derived from adjusting the 2005 election results to match the new electoral boundaries. See notes on seat changes on page 5 for further explanation.

2008 Western Australian Election
26
LEGISLATIVE ASSEMBLY: ELECTORATES RANKED BY PRE-ELECTION PARTY AND MARGIN Electorate 2-Party Electorate 2-Party (2005 Party and Margin) Swing (2005 Party and Margin) SwingNollamara (ALP 19.3%) -6.5 Kwinana (ALP 19.1%) ** -1.6 Girrawheen (ALP 19.1%) -7.6 Maylands (ALP 17.4%) -8.4 Cockburn (ALP 14.8%) -5.2 Bassendean (ALP 14.8%) -4.5 Armadale (ALP 14.2%) +0.6 Fremantle (ALP 14.1%) -2.1 Willagee (ALP 13.7%) +0.9 Victoria Park (ALP 13.6%) -4.7 Cannington (ALP 13.3%) -4.3 Perth (ALP 13.2%) -5.4 Belmont (ALP 11.7%) -4.9 Rockingham (ALP 11.4%) -0.7 Gosnells (ALP 11.3%) -5.9 Warnbro (ALP 11.2%) -1.5 West Swan (ALP 10.7%) -6.2 Pilbara (ALP 10.4%) -6.9 Morley (ALP 9.9%) -10.8 Midland (ALP 9.7%) -1.3 Balcatta (ALP 9.2%) -6.9 Mandurah (ALP 8.5%) +2.0 Mindarie (ALP 6.9%) +1.6 Kimberley (ALP 6.8%) -0.1 Wanneroo (ALP 6.1%) -6.9 Mount Lawley (ALP 5.9%) -8.1 Southern River (ALP 5.1%) -6.8 Forrestfield (ALP 4.5%) -4.3 Joondalup (ALP 4.3%) -0.8 Jandakot (ALP 3.6%) -5.5 Swan Hills (ALP 3.6%) -7.1 North West (ALP 3.1%) ...
Riverton (ALP 2.1%) -2.2 Ocean Reef (ALP 1.6%) -6.0 Bunbury (ALP 0.9%) -12.6 Collie-Preston (ALP 0.8%) +0.2 Darling Range (ALP 0.8%) -6.3 Kingsley (ALP 0.1%) -4.6 Kalamunda (LIB 0.2%) -6.1 Dawesville (LIB 1.7%) -9.4 Albany (LIB 2.3%) +2.5 Scarborough (LIB 2.6%) -2.6 Geraldton (LIB 3.5%) -5.0 Hillarys (LIB 3.5%) -7.8 Murray-Wellington (LIB 6.0%) -2.4 Bateman (LIB 6.9%) -4.5 Kalgoorlie (LIB 7.1%) ** -2.7 South Perth (LIB 7.4%) -6.9 Carine (LIB 7.7%) -6.8 Alfred Cove (IND 8.5%) ** -7.0 Vasse (LIB 9.6%) -3.9 Nedlands (LIB 10.1%) ** -6.2 Cottesloe (LIB 11.5%) -8.0 Eyre (LIB 14.9%) ** -4.3 Churchlands (IND 18.8%) ** -4.7 Blackwood-Stirling (NAT 19.3%) ** +5.3 Moore (LIB 19.7%) ** -2.3 Central Wheatbelt (NAT 26.0%) ** +5.5 Wagin (NAT 29.7%) ** +2.3
** Alternate two-party preferred counts used. Underlining indicates seats that changed party. This change in party is compared to the notional party status for each seat derived from adjusting the 2005 election results to match the new electoral boundaries. See notes on seat changes on page 5 for further explanation.

2008 Western Australian Election
27
LEGISLATIVE ASSEMBLY: ELECTORATES RANKED BY PRE-ELECTION MARGIN Electoral 2PP Votes 2PP Percent District Labor Lib/Nat Labor Lib/Nat Swing Marginal Labor (13) 118583 129783 47.7 52.3 5.0 to Lib/Nat Safe Labor (13) 126522 100506 55.7 44.3 3.9 to Lib/Nat Very Safe Labor (12) 139263 87161 61.5 38.5 4.0 to Lib/Nat Total Labor (38) 384368 317450 54.8 45.2 4.4 to Lib/Nat
Marginal Liberal (6) 48677 64412 43.0 57.0 4.7 to Lib/Nat Safe Liberal (8) 53848 94414 36.3 63.7 5.3 to Lib/Nat Very Safe Liberal (2) 9569 23186 29.2 70.8 3.2 to Lib/Nat Total Liberal (16) 112094 182012 38.1 61.9 4.8 to Lib/Nat
Very Safe National (3) 15543 37368 29.4 70.6 4.4 to Labor Total National (3) 15543 37368 29.4 70.6 4.4 to Labor
Marginal Others (1) 6891 13111 34.5 65.5 7.0 to Lib/Nat Very Safe Others (1) 5253 14549 26.5 73.5 4.7 to Lib/Nat Total Others (2) 12144 27660 30.5 69.5 5.8 to Lib/Nat Marginal seats are defined as those with margins of 6% or under. Safe seats are defined as margins of 6-12%, and Very Safe seats are those with margins above 12%. The three electorates notionally held by the National Party, Central Wheatbelt, Moore and Wagin, all finished as contests between the National and Liberal Parties. In conducting 2-party preferred counts, the WA Electoral Commission re-counted the ballots between Liberal and Labor candidates. Had the count been conducted between National and Labor candidates, it is likely the Liberal/National 2-party preferred vote would have been higher. Estimates based on 2005 results used two-party preferred counts based on National/Labor contests. The swing to Labor in National-held seats may be entirely caused by the different method used in calculating 2-party preferred counts at the two elections.
2008 Western Australian Election
28
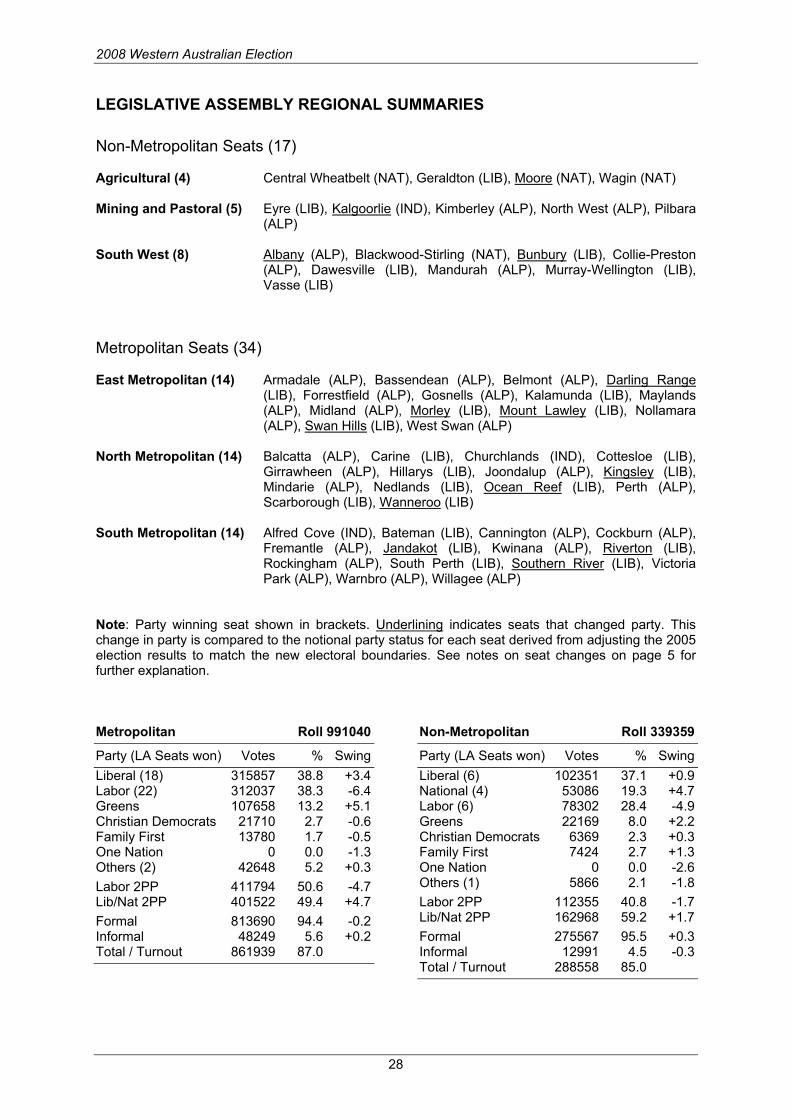
LEGISLATIVE ASSEMBLY REGIONAL SUMMARIES Non-Metropolitan Seats (17) Agricultural (4) Central Wheatbelt (NAT), Geraldton (LIB), Moore (NAT), Wagin (NAT) Mining and Pastoral (5) Eyre (LIB), Kalgoorlie (IND), Kimberley (ALP), North West (ALP), Pilbara
(ALP) South West (8) Albany (ALP), Blackwood-Stirling (NAT), Bunbury (LIB), Collie-Preston
(ALP), Dawesville (LIB), Mandurah (ALP), Murray-Wellington (LIB), Vasse (LIB)
Metropolitan Seats (34) East Metropolitan (14) Armadale (ALP), Bassendean (ALP), Belmont (ALP), Darling Range
(LIB), Forrestfield (ALP), Gosnells (ALP), Kalamunda (LIB), Maylands (ALP), Midland (ALP), Morley (LIB), Mount Lawley (LIB), Nollamara (ALP), Swan Hills (LIB), West Swan (ALP)
North Metropolitan (14) Balcatta (ALP), Carine (LIB), Churchlands (IND), Cottesloe (LIB),
Girrawheen (ALP), Hillarys (LIB), Joondalup (ALP), Kingsley (LIB), Mindarie (ALP), Nedlands (LIB), Ocean Reef (LIB), Perth (ALP), Scarborough (LIB), Wanneroo (LIB)
South Metropolitan (14) Alfred Cove (IND), Bateman (LIB), Cannington (ALP), Cockburn (ALP),
Fremantle (ALP), Jandakot (LIB), Kwinana (ALP), Riverton (LIB), Rockingham (ALP), South Perth (LIB), Southern River (LIB), Victoria Park (ALP), Warnbro (ALP), Willagee (ALP)
Note: Party winning seat shown in brackets. Underlining indicates seats that changed party. This change in party is compared to the notional party status for each seat derived from adjusting the 2005 election results to match the new electoral boundaries. See notes on seat changes on page 5 for further explanation. Metropolitan Roll 991040
Party (LA Seats won) Votes % Swing Liberal (18) 315857 38.8 +3.4 Labor (22) 312037 38.3 -6.4 Greens 107658 13.2 +5.1 Christian Democrats 21710 2.7 -0.6 Family First 13780 1.7 -0.5 One Nation 0 0.0 -1.3 Others (2) 42648 5.2 +0.3 Labor 2PP 411794 50.6 -4.7 Lib/Nat 2PP 401522 49.4 +4.7 Formal 813690 94.4 -0.2 Informal 48249 5.6 +0.2 Total / Turnout 861939 87.0
Non-Metropolitan Roll 339359
Party (LA Seats won) Votes % Swing Liberal (6) 102351 37.1 +0.9 National (4) 53086 19.3 +4.7 Labor (6) 78302 28.4 -4.9 Greens 22169 8.0 +2.2 Christian Democrats 6369 2.3 +0.3 Family First 7424 2.7 +1.3 One Nation 0 0.0 -2.6 Others (1) 5866 2.1 -1.8 Labor 2PP 112355 40.8 -1.7 Lib/Nat 2PP 162968 59.2 +1.7 Formal 275567 95.5 +0.3 Informal 12991 4.5 -0.3 Total / Turnout 288558 85.0

2008 Western Australian Election
29
East Metropolitan Roll 327550
Party (LA Seats won) Votes % Swing Liberal (5) 100733 37.6 +4.7 Labor (9) 112046 41.8 -7.9 Greens 35635 13.3 +5.8 Christian Democrats 11152 4.2 +0.4 Family First 3710 1.4 -1.3 One Nation 0 0.0 -2.0 Others 4568 1.7 +0.2 Labor 2PP 143689 53.7 -5.8 Lib/Nat 2PP 124018 46.3 +5.8 Formal 267844 93.7 -0.4 Informal 17928 6.3 +0.4 Total / Turnout 285772 87.2 North Metropolitan Roll 332146
Party (LA Seats won) Votes % Swing Liberal (8) 112361 41.2 +1.8 Labor (5) 90878 33.3 -5.7 Greens 35288 12.9 +3.6 Christian Democrats 5855 2.1 -0.9 Family First 4631 1.7 -0.1 One Nation 0 0.0 -0.3 Others (1) 23866 8.7 +1.7 Labor 2PP 122923 45.1 -4.9 Lib/Nat 2PP 149826 54.9 +4.9 Formal 272879 94.9 -0.3 Informal 14595 5.1 +0.3 Total / Turnout 287474 86.6 South Metropolitan Roll 331344
Party (LA Seats won) Votes % Swing Liberal (5) 102763 37.6 +3.7 Labor (8) 109113 40.0 -5.7 Greens 36735 13.5 +5.9 Christian Democrats 4703 1.7 -1.2 Family First 5439 2.0 -0.3 One Nation 0 0.0 -1.5 Others (1) 14214 5.2 -1.0 Labor 2PP 145182 53.2 -3.5 Lib/Nat 2PP 127678 46.8 +3.5 Formal 272967 94.6 +0.1 Informal 15726 5.4 -0.1 Total / Turnout 288693 87.1
Agricultural Roll 84553
Party (LA Seats won) Votes % Swing Liberal (1) 21897 30.5 +4.6 National (3) 28974 40.4 +2.4 Labor 13066 18.2 -4.5 Greens 3798 5.3 +0.7 Christian Democrats 2118 3.0 +0.2 Family First 1425 2.0 +2.0 One Nation 0 0.0 -3.6 Others 412 0.6 -1.8 Labor 2PP 21767 30.4 +0.3 Lib/Nat 2PP 49835 69.6 -0.3 Formal 71690 95.9 +0.5 Informal 3047 4.1 -0.5 Total / Turnout 74737 88.4 Mining and Pastoral Roll 76005
Party (LA Seats won) Votes % Swing Liberal (1) 16013 30.1 -10.7 National 11838 22.2 +18.0 Labor (3) 16098 30.2 -8.8 Greens 4364 8.2 +1.5 Christian Democrats 0 0.0 -1.9 Family First 412 0.8 +0.8 One Nation 0 0.0 -2.1 Others (1) 4498 8.5 +3.1 Labor 2PP 24160 45.4 -2.8 Lib/Nat 2PP 29001 54.6 +2.8 Formal 53223 95.1 -0.5 Informal 2754 4.9 +0.5 Total / Turnout 55977 73.6 South West Roll 178801
Party (LA Seats won) Votes % Swing Liberal (4) 64441 42.8 +3.1 National (1) 12274 8.1 +1.3 Labor (3) 49138 32.6 -3.8 Greens 14007 9.3 +3.1 Christian Democrats 4251 2.8 +1.1 Family First 5587 3.7 +1.0 One Nation 0 0.0 -2.3 Others 956 0.6 -3.6 Labor 2PP 66428 44.1 -2.2 Lib/Nat 2PP 84132 55.9 +2.2 Formal 150654 95.4 +0.4 Informal 7190 4.6 -0.4 Total / Turnout 157844 88.3
2008 Western Australian Election
30
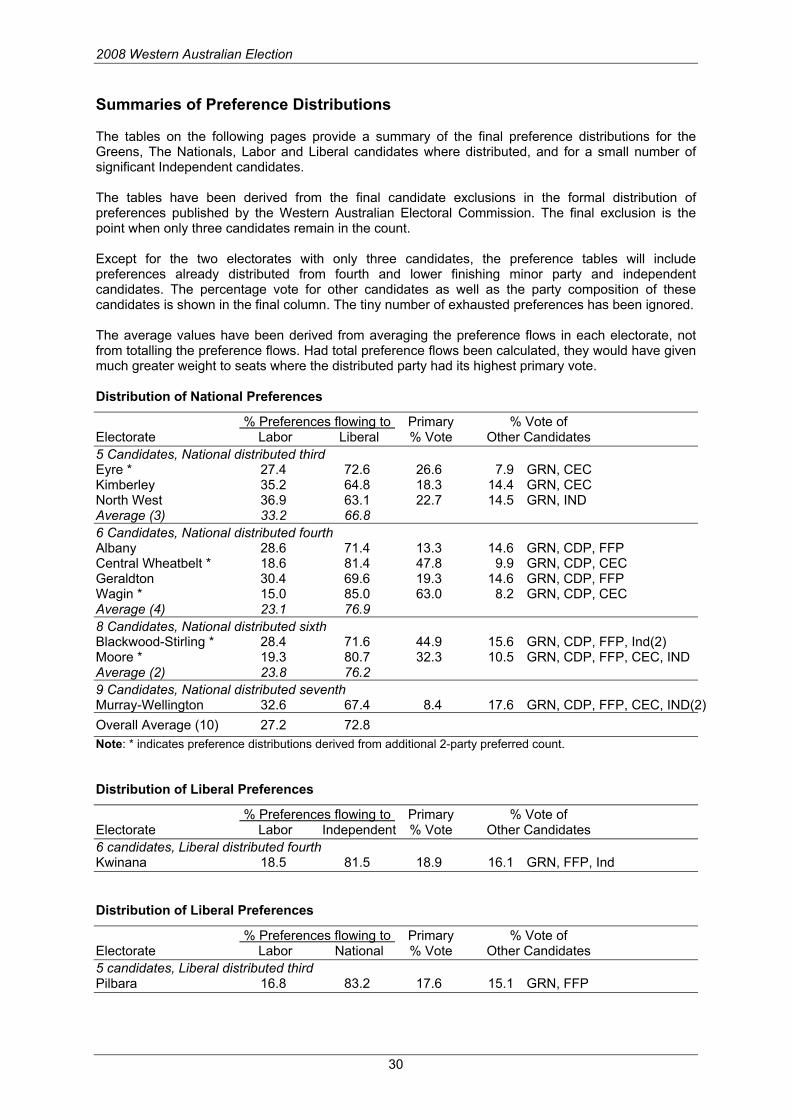
Summaries of Preference Distributions The tables on the following pages provide a summary of the final preference distributions for the Greens, The Nationals, Labor and Liberal candidates where distributed, and for a small number of significant Independent candidates. The tables have been derived from the final candidate exclusions in the formal distribution of preferences published by the Western Australian Electoral Commission. The final exclusion is the point when only three candidates remain in the count. Except for the two electorates with only three candidates, the preference tables will include preferences already distributed from fourth and lower finishing minor party and independent candidates. The percentage vote for other candidates as well as the party composition of these candidates is shown in the final column. The tiny number of exhausted preferences has been ignored. The average values have been derived from averaging the preference flows in each electorate, not from totalling the preference flows. Had total preference flows been calculated, they would have given much greater weight to seats where the distributed party had its highest primary vote. Distribution of National Preferences
% Preferences flowing to Primary % Vote of Electorate Labor Liberal % Vote Other Candidates 5 Candidates, National distributed third Eyre * 27.4 72.6 26.6 7.9 GRN, CEC Kimberley 35.2 64.8 18.3 14.4 GRN, CEC North West 36.9 63.1 22.7 14.5 GRN, IND Average (3) 33.2 66.8 6 Candidates, National distributed fourth Albany 28.6 71.4 13.3 14.6 GRN, CDP, FFP Central Wheatbelt * 18.6 81.4 47.8 9.9 GRN, CDP, CEC Geraldton 30.4 69.6 19.3 14.6 GRN, CDP, FFP Wagin * 15.0 85.0 63.0 8.2 GRN, CDP, CEC Average (4) 23.1 76.9 8 Candidates, National distributed sixth Blackwood-Stirling * 28.4 71.6 44.9 15.6 GRN, CDP, FFP, Ind(2) Moore * 19.3 80.7 32.3 10.5 GRN, CDP, FFP, CEC, IND Average (2) 23.8 76.2 9 Candidates, National distributed seventh Murray-Wellington 32.6 67.4 8.4 17.6 GRN, CDP, FFP, CEC, IND(2) Overall Average (10) 27.2 72.8 Note: * indicates preference distributions derived from additional 2-party preferred count. Distribution of Liberal Preferences
% Preferences flowing to Primary % Vote of Electorate Labor Independent % Vote Other Candidates 6 candidates, Liberal distributed fourth Kwinana 18.5 81.5 18.9 16.1 GRN, FFP, Ind Distribution of Liberal Preferences
% Preferences flowing to Primary % Vote of Electorate Labor National % Vote Other Candidates 5 candidates, Liberal distributed third Pilbara 16.8 83.2 17.6 15.1 GRN, FFP

2008 Western Australian Election
31
Distribution of Green Preferences
% Preferences flowing to Primary % Vote of Electorate Labor Liberal % Vote Other Candidates 3 candidates, Greens distributed first Girrawheen 70.0 30.0 14.8 .. Willagee 74.2 25.8 17.4 .. Average (2) 72.1 27.9 4 candidates, Greens distributed second Armadale 67.8 32.2 10.8 7.3 CDP Bassendean 67.1 32.9 16.0 5.6 CDP Cannington 70.6 29.4 16.3 5.5 CDP Cockburn 55.8 44.2 12.8 7.2 IND Cottesloe 72.8 27.2 17.0 2.0 CDP Darling Range 67.2 32.8 14.3 5.0 CDP Maylands 74.2 25.8 19.1 3.3 CDP Midland 67.4 32.6 15.0 3.6 CDP Nollamara 73.6 26.4 13.3 4.7 CDP Perth 79.7 20.3 19.3 3.1 CDP Rockingham 65.5 34.5 13.0 1.7 CEC Vasse 73.0 27.0 17.9 4.8 CDP Warnbro 66.4 33.6 12.1 7.3 FFP Average (13) 69.3 30.7 5 candidates, Green distributed third Balcatta 69.2 30.8 11.2 5.7 CDP, FFP Bateman 65.4 34.6 13.0 5.6 CDP, IND Bunbury 62.5 37.5 9.1 7.8 CDP, FFP Collie-Preston 63.1 36.9 8.8 10.1 CDP, FFP Forestfield 62.3 37.7 12.5 7.1 CDP, FFP Fremantle 79.4 20.6 27.6 3.5 CDP, FFP Gosnells 70.0 30.0 12.3 9.6 CDP, FFP Hillarys 64.7 35.3 13.2 5.5 CDP, FFP Jandakot 71.2 28.8 11.7 6.8 CDP, FFP Joondalup 69.6 30.4 13.1 7.0 CDP, FFP Kalamunda 69.0 31.0 14.8 6.2 CDP, FFP Kingsley 69.8 30.2 11.3 5.5 CDP, FFP Mindarie 71.8 28.2 10.2 5.5 CDP, FFP Mount Lawley 75.6 24.4 14.2 4.4 CDP, FFP Ocean Reef 66.6 33.4 10.4 5.1 CDP, FFP Southern River 68.1 31.9 10.3 5.7 CDP, FFP Swan Hills 68.1 31.9 14.3 6.1 CDP, FFP Victoria Park 71.5 28.5 13.9 4.9 CDP, FFP West Swan 61.3 38.7 9.0 7.3 CDP, IND Average (19) 68.4 31.6 6 candidates, Green distributed fourth Belmont 68.3 31.7 12.2 10.4 CDP, FFP, IND Dawesville 58.9 41.1 6.7 4.5 CDP, FFP, CEC Mandurah 68.9 31.1 6.1 6.9 CDP, FFP, CEC Riverton 64.4 35.6 10.5 8.3 CDP, FFP, IND Scarborough 71.5 28.5 12.5 12.5 CDP, FFP, IND South Perth 64.7 35.3 10.5 12.6 FFP, IND (2) Wanneroo 68.9 31.1 8.8 7.7 CDP, FFP, IND Average (7) 66.5 33.5 Overall Average (41) 68.5 31.5
2008 Western Australian Election
32
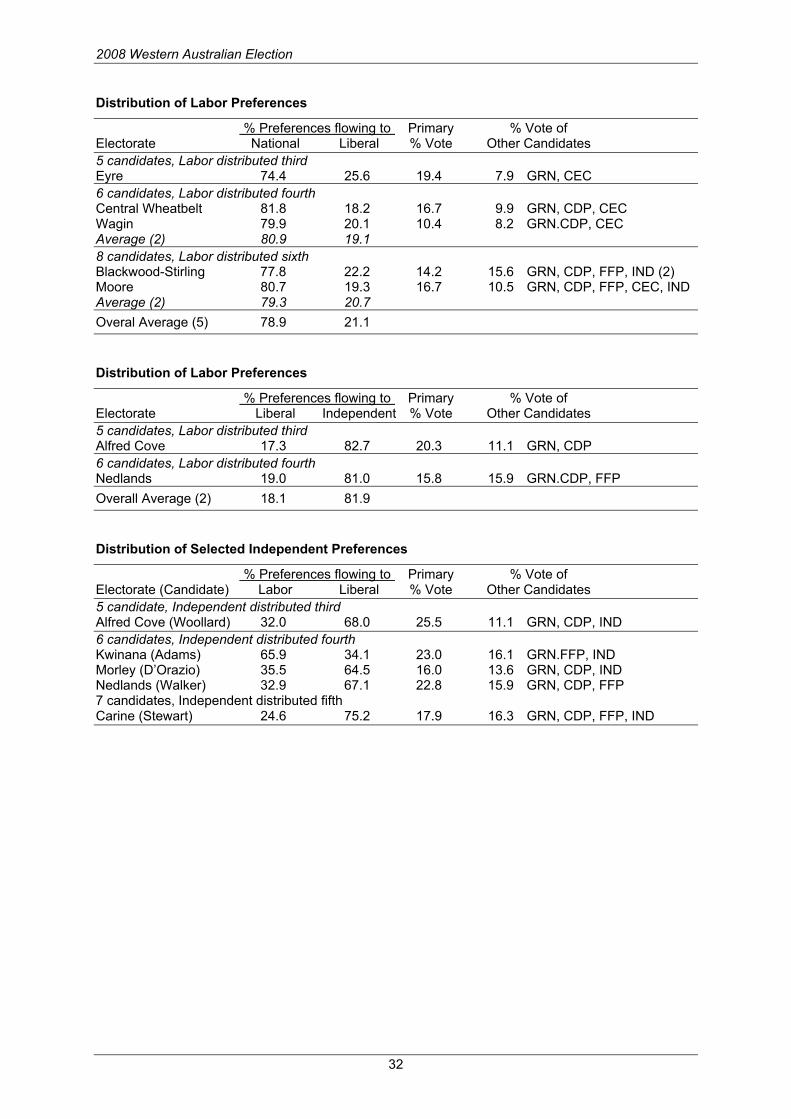
Distribution of Labor Preferences
% Preferences flowing to Primary % Vote of Electorate National Liberal % Vote Other Candidates 5 candidates, Labor distributed third Eyre 74.4 25.6 19.4 7.9 GRN, CEC 6 candidates, Labor distributed fourth Central Wheatbelt 81.8 18.2 16.7 9.9 GRN, CDP, CEC Wagin 79.9 20.1 10.4 8.2 GRN.CDP, CEC Average (2) 80.9 19.1 8 candidates, Labor distributed sixth Blackwood-Stirling 77.8 22.2 14.2 15.6 GRN, CDP, FFP, IND (2) Moore 80.7 19.3 16.7 10.5 GRN, CDP, FFP, CEC, IND Average (2) 79.3 20.7 Overal Average (5) 78.9 21.1 Distribution of Labor Preferences
% Preferences flowing to Primary % Vote of Electorate Liberal Independent % Vote Other Candidates 5 candidates, Labor distributed third Alfred Cove 17.3 82.7 20.3 11.1 GRN, CDP 6 candidates, Labor distributed fourth Nedlands 19.0 81.0 15.8 15.9 GRN.CDP, FFP Overall Average (2) 18.1 81.9 Distribution of Selected Independent Preferences
% Preferences flowing to Primary % Vote of Electorate (Candidate) Labor Liberal % Vote Other Candidates 5 candidate, Independent distributed third Alfred Cove (Woollard) 32.0 68.0 25.5 11.1 GRN, CDP, IND 6 candidates, Independent distributed fourth Kwinana (Adams) 65.9 34.1 23.0 16.1 GRN.FFP, IND Morley (D’Orazio) 35.5 64.5 16.0 13.6 GRN, CDP, IND Nedlands (Walker) 32.9 67.1 22.8 15.9 GRN, CDP, FFP 7 candidates, Independent distributed fifth Carine (Stewart) 24.6 75.2 17.9 16.3 GRN, CDP, FFP, IND

2008 Western Australian Election
33
SUMMARY OF LEGISLATIVE COUNCIL RESULTS STATE-WIDE TOTALS ROLL 1,330,399
Seats Party Votes % Vote Swing Won Change Liberal Party 443,064 39.60 +2.48 16 +1 Labor Party 404,389 36.14 -7.21 11 -5 Greens 123,942 11.08 +3.56 4 +2 National Party 59,505 5.32 +3.13 5 +4 Family First 28,149 2.52 +0.51 .. .. Christian Democrats 25,962 2.32 +0.04 .. .. One Nation 7,012 0.63 -0.96 .. .. Daylight Saving Party 6,806 0.61 +0.61 .. .. Citizens Electoral Council 2,975 0.27 +0.21 .. .. New Country Party 555 0.05 -0.26 .. .. Independents / Unaffiliated 16,480 1.47 -2.11 .. .. Formal 1,118,839 97.17 36 +2 Informal 32,643 2.83 -0.35 Total/Turnout 1,151,482 86.55 -3.45 Note: The change in seats column compares members elected in 2005 and 2008. It ignores resignations and changes in party status. Two extra MLCs were elected at the 2008 election. Legislative Council Result by Region Metropolitan Country Party % Vote Change Seats Won % Vote Change Seats Won Liberal Party 40.88 +4.24 9 (+2) 35.80 -2.74 7 (-1) Labor Party 38.11 -7.90 6 (-3) 30.29 -5.22 5 (-2) Greens 12.19 +4.36 3 (+2) 7.77 +1.17 1 National Party 0.82 +0.82 .. 18.71 +10.08 5 (+4) Family First 2.29 +0.28 .. 3.20 +1.18 .. Christian Democrats 2.39 -0.08 .. 2.12 +0.40 .. One Nation 0.58 -0.74 .. 0.76 -1.63 .. Daylight Saving Party 0.69 +0.69 .. 0.36 +0.36 .. Citizens Electoral Cncl 0.29 +0.25 .. 0.19 +0.07 .. New Country Party .. -0.06 .. 0.20 -0.84 .. Independents/Others 1.76 -1.87 .. 0.60 -2.83 ..
2008 Western Australian Election
34
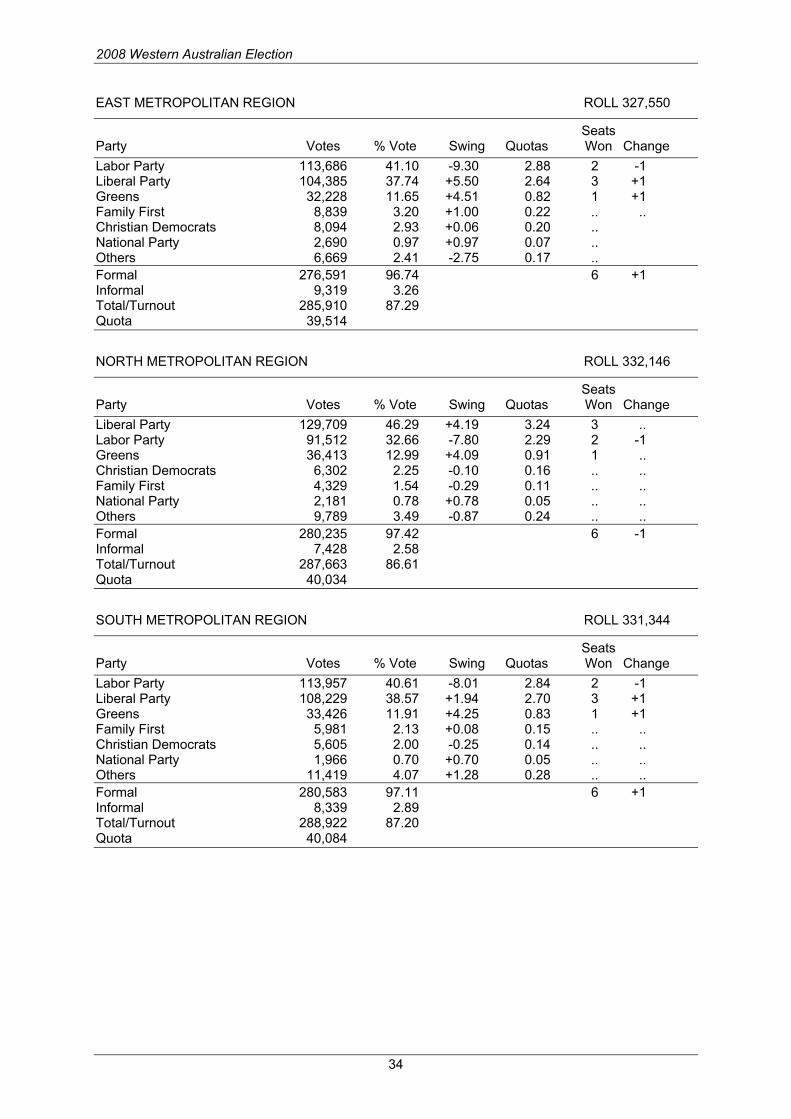
EAST METROPOLITAN REGION ROLL 327,550
Seats Party Votes % Vote Swing Quotas Won Change Labor Party 113,686 41.10 -9.30 2.88 2 -1 Liberal Party 104,385 37.74 +5.50 2.64 3 +1 Greens 32,228 11.65 +4.51 0.82 1 +1 Family First 8,839 3.20 +1.00 0.22 .. .. Christian Democrats 8,094 2.93 +0.06 0.20 .. National Party 2,690 0.97 +0.97 0.07 .. Others 6,669 2.41 -2.75 0.17 .. Formal 276,591 96.74 6 +1 Informal 9,319 3.26 Total/Turnout 285,910 87.29 Quota 39,514
NORTH METROPOLITAN REGION ROLL 332,146
Seats Party Votes % Vote Swing Quotas Won Change Liberal Party 129,709 46.29 +4.19 3.24 3 .. Labor Party 91,512 32.66 -7.80 2.29 2 -1 Greens 36,413 12.99 +4.09 0.91 1 .. Christian Democrats 6,302 2.25 -0.10 0.16 .. .. Family First 4,329 1.54 -0.29 0.11 .. .. National Party 2,181 0.78 +0.78 0.05 .. .. Others 9,789 3.49 -0.87 0.24 .. .. Formal 280,235 97.42 6 -1 Informal 7,428 2.58 Total/Turnout 287,663 86.61 Quota 40,034
SOUTH METROPOLITAN REGION ROLL 331,344
Seats Party Votes % Vote Swing Quotas Won Change Labor Party 113,957 40.61 -8.01 2.84 2 -1 Liberal Party 108,229 38.57 +1.94 2.70 3 +1 Greens 33,426 11.91 +4.25 0.83 1 +1 Family First 5,981 2.13 +0.08 0.15 .. .. Christian Democrats 5,605 2.00 -0.25 0.14 .. .. National Party 1,966 0.70 +0.70 0.05 .. .. Others 11,419 4.07 +1.28 0.28 .. .. Formal 280,583 97.11 6 +1 Informal 8,339 2.89 Total/Turnout 288,922 87.20 Quota 40,084
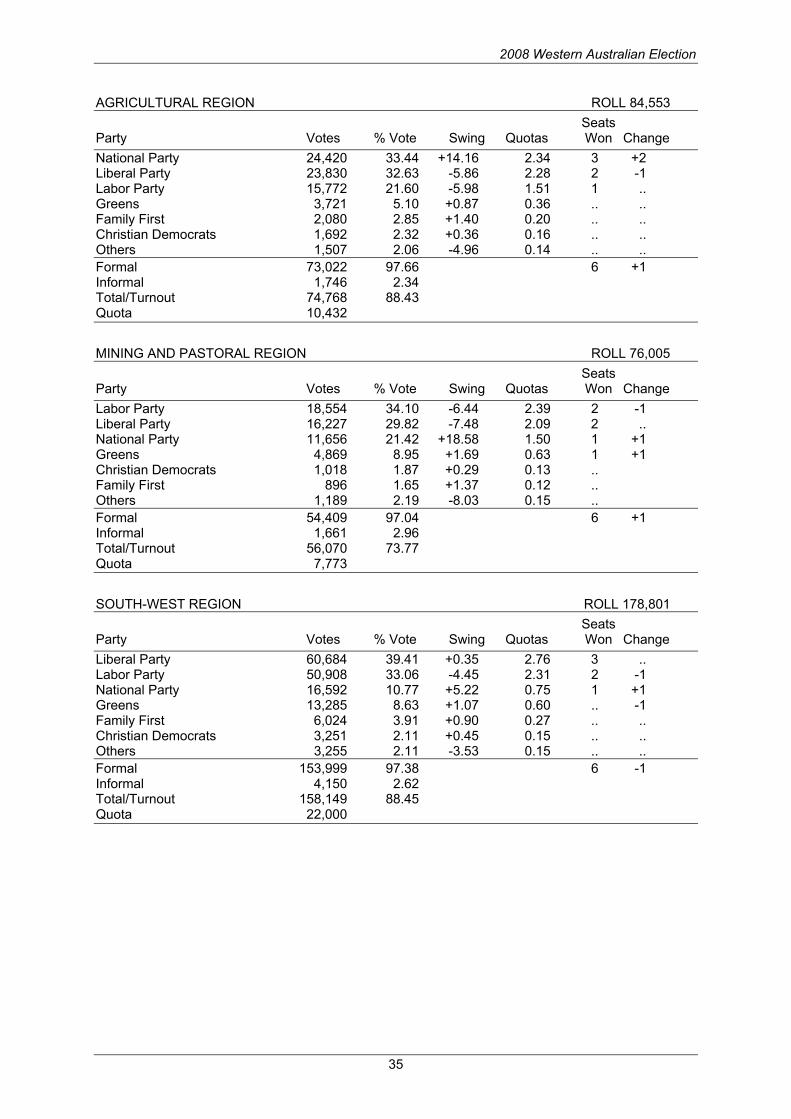
2008 Western Australian Election
35
AGRICULTURAL REGION ROLL 84,553 Seats Party Votes % Vote Swing Quotas Won Change National Party 24,420 33.44 +14.16 2.34 3 +2 Liberal Party 23,830 32.63 -5.86 2.28 2 -1 Labor Party 15,772 21.60 -5.98 1.51 1 .. Greens 3,721 5.10 +0.87 0.36 .. .. Family First 2,080 2.85 +1.40 0.20 .. .. Christian Democrats 1,692 2.32 +0.36 0.16 .. .. Others 1,507 2.06 -4.96 0.14 .. .. Formal 73,022 97.66 6 +1 Informal 1,746 2.34 Total/Turnout 74,768 88.43 Quota 10,432
MINING AND PASTORAL REGION ROLL 76,005 Seats Party Votes % Vote Swing Quotas Won Change Labor Party 18,554 34.10 -6.44 2.39 2 -1 Liberal Party 16,227 29.82 -7.48 2.09 2 .. National Party 11,656 21.42 +18.58 1.50 1 +1 Greens 4,869 8.95 +1.69 0.63 1 +1 Christian Democrats 1,018 1.87 +0.29 0.13 .. Family First 896 1.65 +1.37 0.12 .. Others 1,189 2.19 -8.03 0.15 .. Formal 54,409 97.04 6 +1 Informal 1,661 2.96 Total/Turnout 56,070 73.77 Quota 7,773
SOUTH-WEST REGION ROLL 178,801 Seats Party Votes % Vote Swing Quotas Won Change Liberal Party 60,684 39.41 +0.35 2.76 3 .. Labor Party 50,908 33.06 -4.45 2.31 2 -1 National Party 16,592 10.77 +5.22 0.75 1 +1 Greens 13,285 8.63 +1.07 0.60 .. -1 Family First 6,024 3.91 +0.90 0.27 .. .. Christian Democrats 3,251 2.11 +0.45 0.15 .. .. Others 3,255 2.11 -3.53 0.15 .. .. Formal 153,999 97.38 6 -1 Informal 4,150 2.62 Total/Turnout 158,149 88.45 Quota 22,000
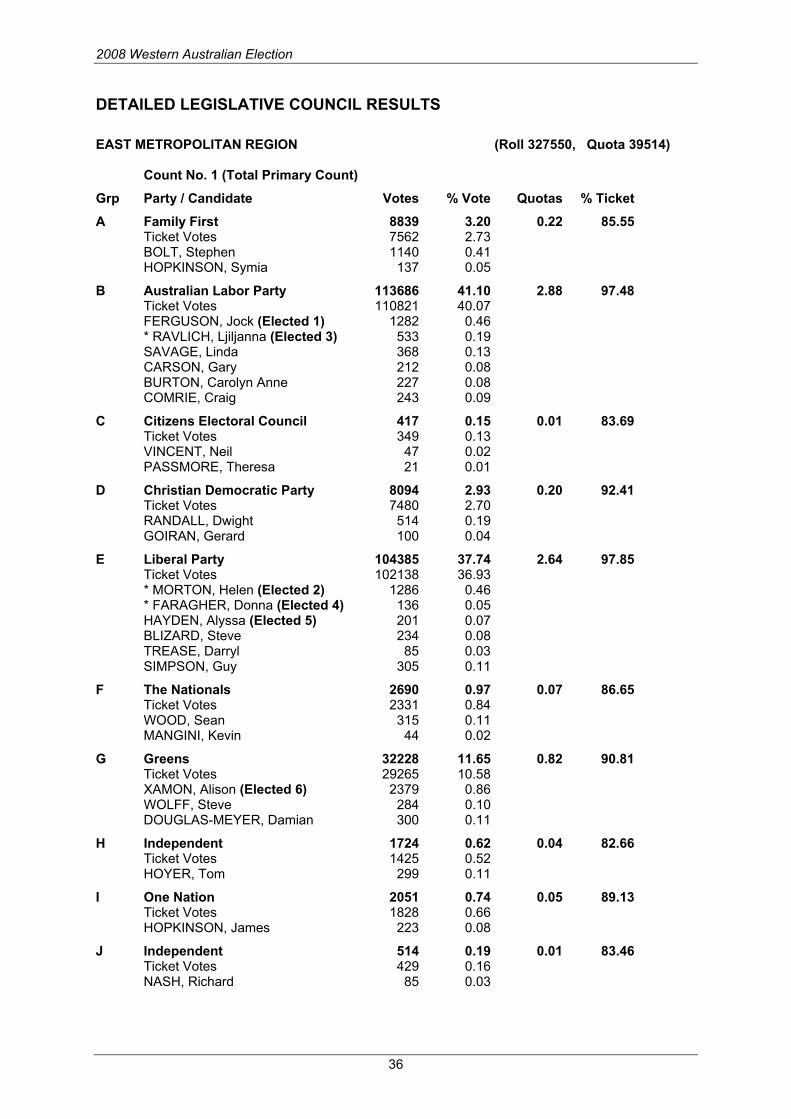
2008 Western Australian Election
36
DETAILED LEGISLATIVE COUNCIL RESULTS
EAST METROPOLITAN REGION (Roll 327550, Quota 39514) Count No. 1 (Total Primary Count)
Grp Party / Candidate Votes % Vote Quotas % Ticket
A Family First 8839 3.20 0.22 85.55 Ticket Votes 7562 2.73 BOLT, Stephen 1140 0.41 HOPKINSON, Symia 137 0.05
B Australian Labor Party 113686 41.10 2.88 97.48 Ticket Votes 110821 40.07 FERGUSON, Jock (Elected 1) 1282 0.46 * RAVLICH, Ljiljanna (Elected 3) 533 0.19 SAVAGE, Linda 368 0.13 CARSON, Gary 212 0.08 BURTON, Carolyn Anne 227 0.08 COMRIE, Craig 243 0.09
C Citizens Electoral Council 417 0.15 0.01 83.69 Ticket Votes 349 0.13 VINCENT, Neil 47 0.02 PASSMORE, Theresa 21 0.01
D Christian Democratic Party 8094 2.93 0.20 92.41 Ticket Votes 7480 2.70 RANDALL, Dwight 514 0.19 GOIRAN, Gerard 100 0.04
E Liberal Party 104385 37.74 2.64 97.85 Ticket Votes 102138 36.93 * MORTON, Helen (Elected 2) 1286 0.46 * FARAGHER, Donna (Elected 4) 136 0.05 HAYDEN, Alyssa (Elected 5) 201 0.07 BLIZARD, Steve 234 0.08 TREASE, Darryl 85 0.03 SIMPSON, Guy 305 0.11
F The Nationals 2690 0.97 0.07 86.65 Ticket Votes 2331 0.84 WOOD, Sean 315 0.11 MANGINI, Kevin 44 0.02
G Greens 32228 11.65 0.82 90.81 Ticket Votes 29265 10.58 XAMON, Alison (Elected 6) 2379 0.86 WOLFF, Steve 284 0.10 DOUGLAS-MEYER, Damian 300 0.11
H Independent 1724 0.62 0.04 82.66 Ticket Votes 1425 0.52 HOYER, Tom 299 0.11
I One Nation 2051 0.74 0.05 89.13 Ticket Votes 1828 0.66 HOPKINSON, James 223 0.08
J Independent 514 0.19 0.01 83.46 Ticket Votes 429 0.16 NASH, Richard 85 0.03
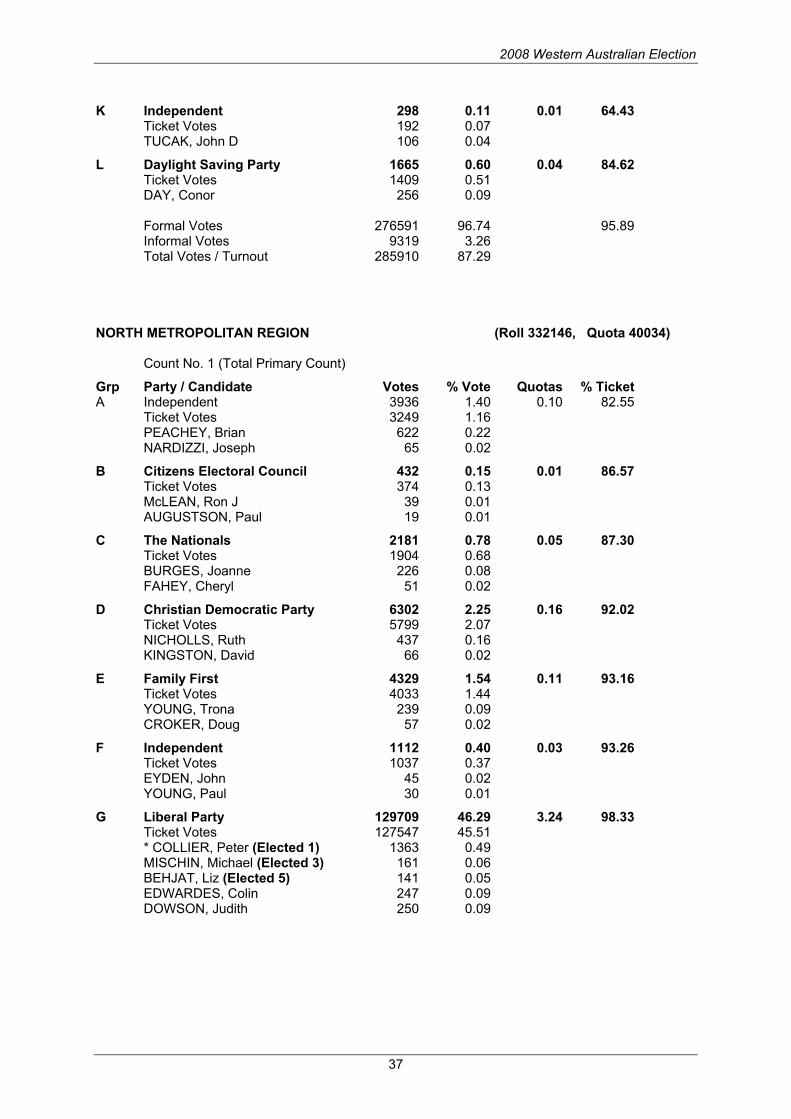
2008 Western Australian Election
37
K Independent 298 0.11 0.01 64.43 Ticket Votes 192 0.07 TUCAK, John D 106 0.04
L Daylight Saving Party 1665 0.60 0.04 84.62 Ticket Votes 1409 0.51 DAY, Conor 256 0.09 Formal Votes 276591 96.74 95.89 Informal Votes 9319 3.26 Total Votes / Turnout 285910 87.29 NORTH METROPOLITAN REGION (Roll 332146, Quota 40034) Count No. 1 (Total Primary Count)
Grp Party / Candidate Votes % Vote Quotas % Ticket A Independent 3936 1.40 0.10 82.55 Ticket Votes 3249 1.16 PEACHEY, Brian 622 0.22 NARDIZZI, Joseph 65 0.02
B Citizens Electoral Council 432 0.15 0.01 86.57 Ticket Votes 374 0.13 McLEAN, Ron J 39 0.01 AUGUSTSON, Paul 19 0.01
C The Nationals 2181 0.78 0.05 87.30 Ticket Votes 1904 0.68 BURGES, Joanne 226 0.08 FAHEY, Cheryl 51 0.02
D Christian Democratic Party 6302 2.25 0.16 92.02 Ticket Votes 5799 2.07 NICHOLLS, Ruth 437 0.16 KINGSTON, David 66 0.02
E Family First 4329 1.54 0.11 93.16 Ticket Votes 4033 1.44 YOUNG, Trona 239 0.09 CROKER, Doug 57 0.02
F Independent 1112 0.40 0.03 93.26 Ticket Votes 1037 0.37 EYDEN, John 45 0.02 YOUNG, Paul 30 0.01
G Liberal Party 129709 46.29 3.24 98.33 Ticket Votes 127547 45.51 * COLLIER, Peter (Elected 1) 1363 0.49 MISCHIN, Michael (Elected 3) 161 0.06 BEHJAT, Liz (Elected 5) 141 0.05 EDWARDES, Colin 247 0.09 DOWSON, Judith 250 0.09
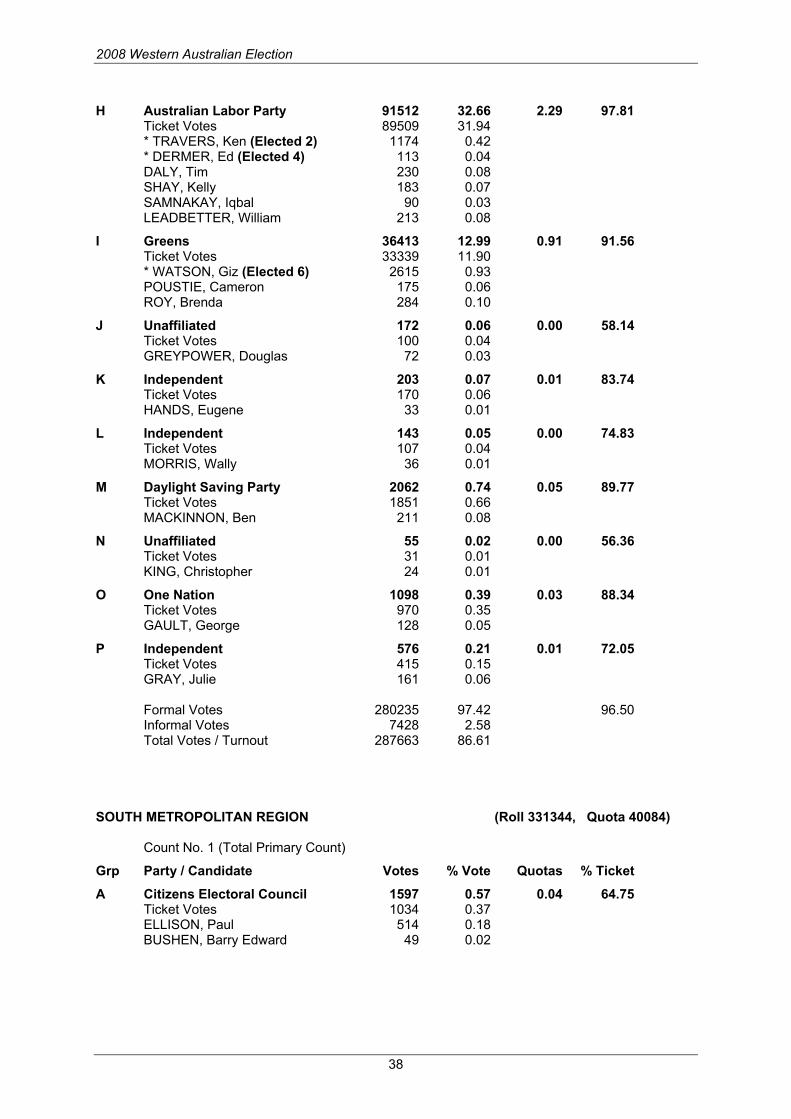
2008 Western Australian Election
38
H Australian Labor Party 91512 32.66 2.29 97.81 Ticket Votes 89509 31.94 * TRAVERS, Ken (Elected 2) 1174 0.42 * DERMER, Ed (Elected 4) 113 0.04 DALY, Tim 230 0.08 SHAY, Kelly 183 0.07 SAMNAKAY, Iqbal 90 0.03 LEADBETTER, William 213 0.08
I Greens 36413 12.99 0.91 91.56 Ticket Votes 33339 11.90 * WATSON, Giz (Elected 6) 2615 0.93 POUSTIE, Cameron 175 0.06 ROY, Brenda 284 0.10
J Unaffiliated 172 0.06 0.00 58.14 Ticket Votes 100 0.04 GREYPOWER, Douglas 72 0.03
K Independent 203 0.07 0.01 83.74 Ticket Votes 170 0.06 HANDS, Eugene 33 0.01
L Independent 143 0.05 0.00 74.83 Ticket Votes 107 0.04 MORRIS, Wally 36 0.01
M Daylight Saving Party 2062 0.74 0.05 89.77 Ticket Votes 1851 0.66 MACKINNON, Ben 211 0.08
N Unaffiliated 55 0.02 0.00 56.36 Ticket Votes 31 0.01 KING, Christopher 24 0.01
O One Nation 1098 0.39 0.03 88.34 Ticket Votes 970 0.35 GAULT, George 128 0.05
P Independent 576 0.21 0.01 72.05 Ticket Votes 415 0.15 GRAY, Julie 161 0.06 Formal Votes 280235 97.42 96.50 Informal Votes 7428 2.58 Total Votes / Turnout 287663 86.61 SOUTH METROPOLITAN REGION (Roll 331344, Quota 40084) Count No. 1 (Total Primary Count)
Grp Party / Candidate Votes % Vote Quotas % Ticket
A Citizens Electoral Council 1597 0.57 0.04 64.75 Ticket Votes 1034 0.37 ELLISON, Paul 514 0.18 BUSHEN, Barry Edward 49 0.02

2008 Western Australian Election
39
B Australian Labor Party 113957 40.61 2.84 97.64 Ticket Votes 111268 39.66 * ELLERY, Sue (Elected 1) 1657 0.59 * DOUST, Kate (Elected 3) 269 0.10 HENDERSON, Fiona 262 0.09 PHAM, Batong 161 0.06 de GROOT, Jack 109 0.04 VITOLINS, Andrew 231 0.08
C Independent 2679 0.95 0.07 91.41 Ticket Votes 2449 0.87 OUGHTON, Christopher 194 0.07 GROSSMITH, Huw 36 0.01
D Christian Democratic Party 5605 2.00 0.14 90.99 Ticket Votes 5100 1.82 TREMAIN, Brent 412 0.15 BREWER, Linda 93 0.03
E Family First 5981 2.13 0.15 93.21 Ticket Votes 5575 1.99 LINDSEY, Frank 328 0.12 CUSTERS, Bev 78 0.03
F Independent 1584 0.56 0.04 91.04 Ticket Votes 1442 0.51 MILLER, Eric 98 0.03 NARDIZZI, Yolanda 44 0.02
G Liberal Party 108229 38.57 2.70 98.10 Ticket Votes 106178 37.84 * O'BRIEN, Simon (Elected 2) 1233 0.44 GOIRAN, Nick (Elected 4) 109 0.04 EDMAN, Phil (Elected 5) 200 0.07 GORDIN, Donna 146 0.05 JAMIESON, John 123 0.04 VERKERK, Michelle 240 0.09
H Greens 33426 11.91 0.83 90.65 Ticket Votes 30301 10.80 MacLAREN, Lynn (Elected 6) 2667 0.95 RYAN, Scott 458 0.16
I The Nationals 1966 0.70 0.05 86.47 Ticket Votes 1700 0.61 WHEATER, Hilary 203 0.07 WAHLSTEN, Peter 63 0.02
J Daylight Saving Party 2061 0.73 0.05 88.55 Ticket Votes 1825 0.65 GIDMAN, Jeffrey 236 0.08
K Independent 1782 0.64 0.04 76.94 Ticket Votes 1371 0.49 WALKER, Steve 411 0.15
L One Nation 1716 0.61 0.04 86.07 Ticket Votes 1477 0.53 GILMOUR, Neil 239 0.09 Formal Votes 280583 97.11 96.13 Informal Votes 8339 2.89 Total Votes / Turnout 288922 87.20

2008 Western Australian Election
40
AGRICULTURAL REGION(Roll 84553, Quota 10432) Count No. 1 (Total Primary Count)
Grp Party / Candidate Votes % Vote Quotas % Ticket
A Australian Labor Party 15772 21.60 1.51 95.06 Ticket Votes 14993 20.53 * BENSON-LIDHOLM, Matt (Elected 3) 443 0.61 WEST, Darren 120 0.16 PETERSEN, Vickie 157 0.22 McCALLUM, Alan 59 0.08
B Independent 493 0.68 0.05 86.61 Ticket Votes 427 0.58 POSEY, Shelly 51 0.07 TAN, Valerie 15 0.02
C Citizens Electoral Council 215 0.29 0.02 80.93 Ticket Votes 174 0.24 SMITH, Stuart 25 0.03 PEPPER, Chris 16 0.02
D Liberal Party 23830 32.63 2.28 97.46 Ticket Votes 23225 31.81 * ELLIS, Brian (Elected 2) 320 0.44 CHOWN, James (Elected 5) 39 0.05 WILKINS, Chris 91 0.12 MOURITZ, Jane D 85 0.12 FALLS, Jamie 70 0.10
E Family First 2080 2.85 0.20 92.31 Ticket Votes 1920 2.63 * FELS, Anthony 142 0.19 CHANDRA, Felly 18 0.02
F Greens 3721 5.10 0.36 89.12 Ticket Votes 3316 4.54 MARGETTS, Dee 347 0.48 CONNOLLY, Paul 58 0.08
G Christian Democratic Party 1692 2.32 0.16 88.71 Ticket Votes 1501 2.06 FORSYTH, Mac 164 0.22 DUNJEY, Lachlan 27 0.04
H The Nationals 24420 33.44 2.34 95.63 Ticket Votes 23353 31.98 * TRENORDEN, Max (MLA) (Elected 1) 754 1.03 GARDINER, Philip (Elected 4) 172 0.24 DAVIES, Mia (Elected 6) 39 0.05 ALDRIDGE, Martin 37 0.05 WOOD, Cathryn 65 0.09
I New Country Party 175 0.24 0.02 94.29 Ticket Votes 165 0.23 DODOFF, Chris 10 0.01
J One Nation 624 0.85 0.06 83.97 Ticket Votes 524 0.72 PARAVICINI, Ross 100 0.14 Formal Votes 73022 97.66 95.31 Informal Votes 1746 2.34 Total Votes / Turnout 74768 88.43
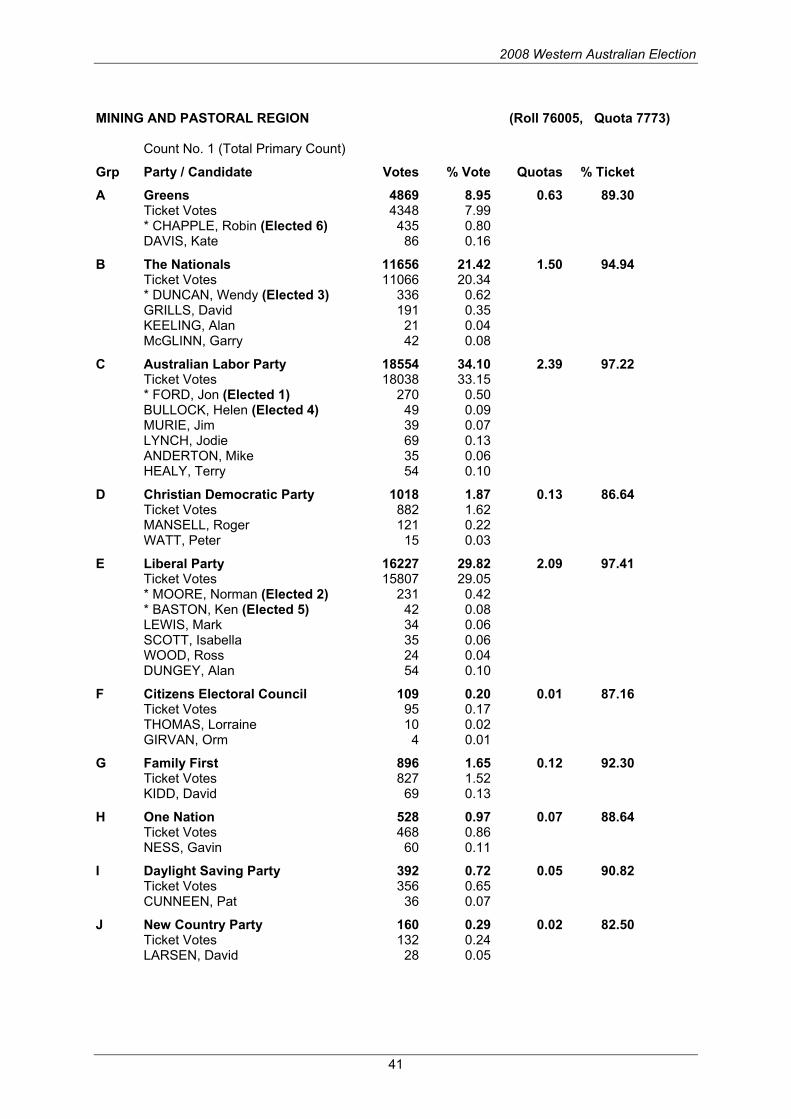
2008 Western Australian Election
41
MINING AND PASTORAL REGION (Roll 76005, Quota 7773) Count No. 1 (Total Primary Count)
Grp Party / Candidate Votes % Vote Quotas % Ticket
A Greens 4869 8.95 0.63 89.30 Ticket Votes 4348 7.99 * CHAPPLE, Robin (Elected 6) 435 0.80 DAVIS, Kate 86 0.16
B The Nationals 11656 21.42 1.50 94.94 Ticket Votes 11066 20.34 * DUNCAN, Wendy (Elected 3) 336 0.62 GRILLS, David 191 0.35 KEELING, Alan 21 0.04 McGLINN, Garry 42 0.08
C Australian Labor Party 18554 34.10 2.39 97.22 Ticket Votes 18038 33.15 * FORD, Jon (Elected 1) 270 0.50 BULLOCK, Helen (Elected 4) 49 0.09 MURIE, Jim 39 0.07 LYNCH, Jodie 69 0.13 ANDERTON, Mike 35 0.06 HEALY, Terry 54 0.10
D Christian Democratic Party 1018 1.87 0.13 86.64 Ticket Votes 882 1.62 MANSELL, Roger 121 0.22 WATT, Peter 15 0.03
E Liberal Party 16227 29.82 2.09 97.41 Ticket Votes 15807 29.05 * MOORE, Norman (Elected 2) 231 0.42 * BASTON, Ken (Elected 5) 42 0.08 LEWIS, Mark 34 0.06 SCOTT, Isabella 35 0.06 WOOD, Ross 24 0.04 DUNGEY, Alan 54 0.10
F Citizens Electoral Council 109 0.20 0.01 87.16 Ticket Votes 95 0.17 THOMAS, Lorraine 10 0.02 GIRVAN, Orm 4 0.01
G Family First 896 1.65 0.12 92.30 Ticket Votes 827 1.52 KIDD, David 69 0.13
H One Nation 528 0.97 0.07 88.64 Ticket Votes 468 0.86 NESS, Gavin 60 0.11
I Daylight Saving Party 392 0.72 0.05 90.82 Ticket Votes 356 0.65 CUNNEEN, Pat 36 0.07
J New Country Party 160 0.29 0.02 82.50 Ticket Votes 132 0.24 LARSEN, David 28 0.05
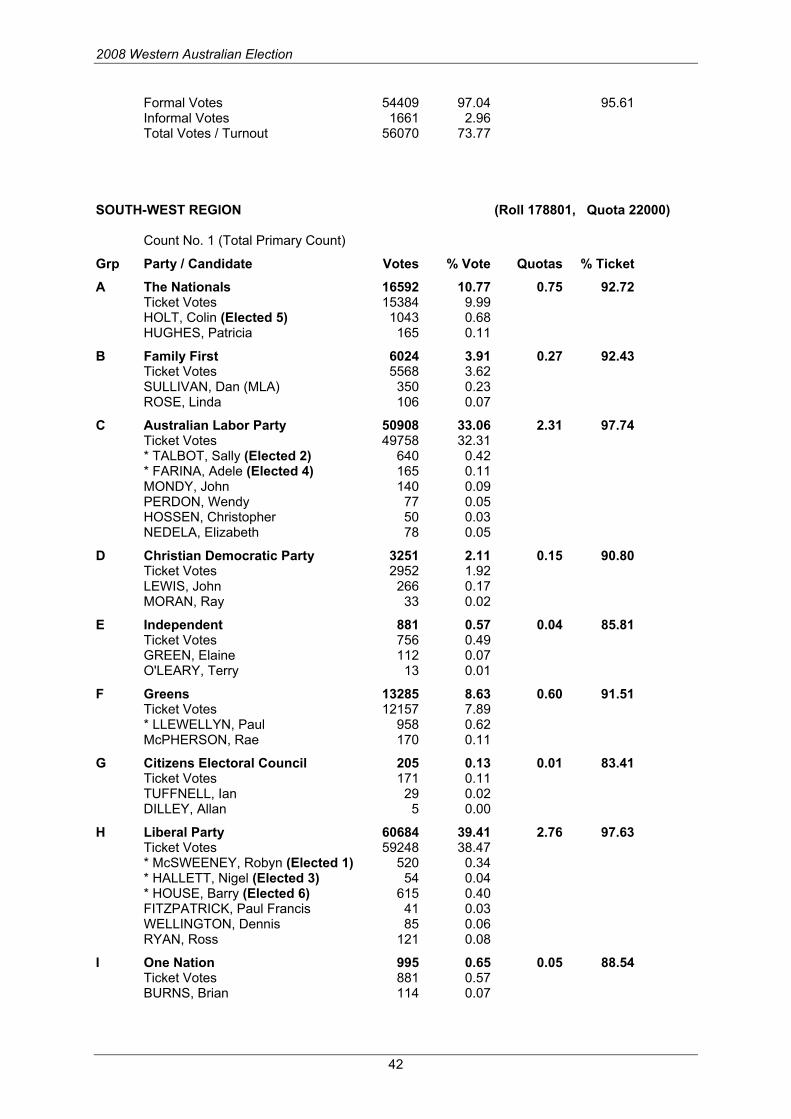
2008 Western Australian Election
42
Formal Votes 54409 97.04 95.61 Informal Votes 1661 2.96 Total Votes / Turnout 56070 73.77 SOUTH-WEST REGION (Roll 178801, Quota 22000) Count No. 1 (Total Primary Count)
Grp Party / Candidate Votes % Vote Quotas % Ticket
A The Nationals 16592 10.77 0.75 92.72 Ticket Votes 15384 9.99 HOLT, Colin (Elected 5) 1043 0.68 HUGHES, Patricia 165 0.11
B Family First 6024 3.91 0.27 92.43 Ticket Votes 5568 3.62 SULLIVAN, Dan (MLA) 350 0.23 ROSE, Linda 106 0.07
C Australian Labor Party 50908 33.06 2.31 97.74 Ticket Votes 49758 32.31 * TALBOT, Sally (Elected 2) 640 0.42 * FARINA, Adele (Elected 4) 165 0.11 MONDY, John 140 0.09 PERDON, Wendy 77 0.05 HOSSEN, Christopher 50 0.03 NEDELA, Elizabeth 78 0.05
D Christian Democratic Party 3251 2.11 0.15 90.80 Ticket Votes 2952 1.92 LEWIS, John 266 0.17 MORAN, Ray 33 0.02
E Independent 881 0.57 0.04 85.81 Ticket Votes 756 0.49 GREEN, Elaine 112 0.07 O'LEARY, Terry 13 0.01
F Greens 13285 8.63 0.60 91.51 Ticket Votes 12157 7.89 * LLEWELLYN, Paul 958 0.62 McPHERSON, Rae 170 0.11
G Citizens Electoral Council 205 0.13 0.01 83.41 Ticket Votes 171 0.11 TUFFNELL, Ian 29 0.02 DILLEY, Allan 5 0.00
H Liberal Party 60684 39.41 2.76 97.63 Ticket Votes 59248 38.47 * McSWEENEY, Robyn (Elected 1) 520 0.34 * HALLETT, Nigel (Elected 3) 54 0.04 * HOUSE, Barry (Elected 6) 615 0.40 FITZPATRICK, Paul Francis 41 0.03 WELLINGTON, Dennis 85 0.06 RYAN, Ross 121 0.08
I One Nation 995 0.65 0.05 88.54 Ticket Votes 881 0.57 BURNS, Brian 114 0.07

2008 Western Australian Election
43
J Independent 328 0.21 0.01 82.62 Ticket Votes 271 0.18 GUGLIELMANA, Filip 57 0.04
K Daylight Saving Party 626 0.41 0.03 88.18 Ticket Votes 552 0.36 PASCOE, Kara 74 0.05
L New Country Party 220 0.14 0.01 84.09 Ticket Votes 185 0.12 PEARCE, Judy 35 0.02 Formal Votes 153999 97.38 96.03 Informal Votes 4150 2.62 Total Votes / Turnout 158149 88.45
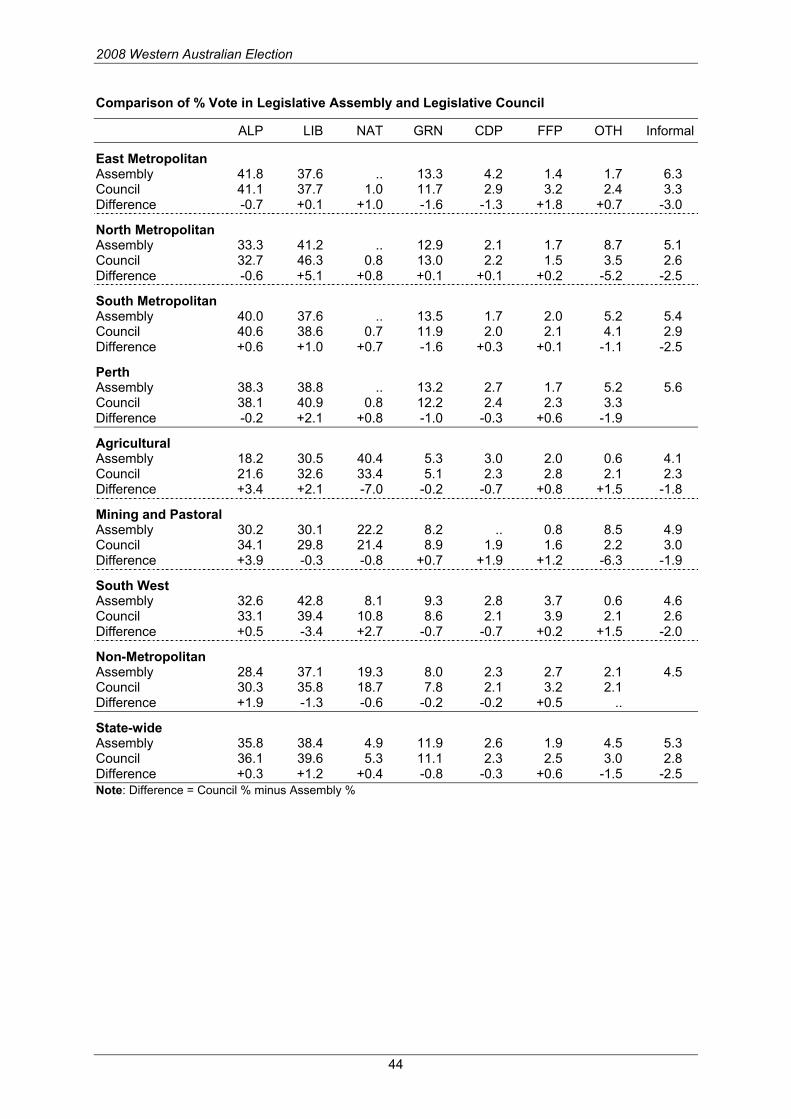
2008 Western Australian Election
44
Comparison of % Vote in Legislative Assembly and Legislative Council
ALP LIB NAT GRN CDP FFP OTH Informal
East Metropolitan Assembly 41.8 37.6 .. 13.3 4.2 1.4 1.7 6.3 Council 41.1 37.7 1.0 11.7 2.9 3.2 2.4 3.3 Difference -0.7 +0.1 +1.0 -1.6 -1.3 +1.8 +0.7 -3.0
North Metropolitan Assembly 33.3 41.2 .. 12.9 2.1 1.7 8.7 5.1 Council 32.7 46.3 0.8 13.0 2.2 1.5 3.5 2.6 Difference -0.6 +5.1 +0.8 +0.1 +0.1 +0.2 -5.2 -2.5
South Metropolitan Assembly 40.0 37.6 .. 13.5 1.7 2.0 5.2 5.4 Council 40.6 38.6 0.7 11.9 2.0 2.1 4.1 2.9 Difference +0.6 +1.0 +0.7 -1.6 +0.3 +0.1 -1.1 -2.5
Perth Assembly 38.3 38.8 .. 13.2 2.7 1.7 5.2 5.6 Council 38.1 40.9 0.8 12.2 2.4 2.3 3.3 Difference -0.2 +2.1 +0.8 -1.0 -0.3 +0.6 -1.9
Agricultural Assembly 18.2 30.5 40.4 5.3 3.0 2.0 0.6 4.1 Council 21.6 32.6 33.4 5.1 2.3 2.8 2.1 2.3 Difference +3.4 +2.1 -7.0 -0.2 -0.7 +0.8 +1.5 -1.8
Mining and Pastoral Assembly 30.2 30.1 22.2 8.2 .. 0.8 8.5 4.9 Council 34.1 29.8 21.4 8.9 1.9 1.6 2.2 3.0 Difference +3.9 -0.3 -0.8 +0.7 +1.9 +1.2 -6.3 -1.9
South West Assembly 32.6 42.8 8.1 9.3 2.8 3.7 0.6 4.6 Council 33.1 39.4 10.8 8.6 2.1 3.9 2.1 2.6 Difference +0.5 -3.4 +2.7 -0.7 -0.7 +0.2 +1.5 -2.0
Non-Metropolitan Assembly 28.4 37.1 19.3 8.0 2.3 2.7 2.1 4.5 Council 30.3 35.8 18.7 7.8 2.1 3.2 2.1 Difference +1.9 -1.3 -0.6 -0.2 -0.2 +0.5 ..
State-wide Assembly 35.8 38.4 4.9 11.9 2.6 1.9 4.5 5.3 Council 36.1 39.6 5.3 11.1 2.3 2.5 3.0 2.8 Difference +0.3 +1.2 +0.4 -0.8 -0.3 +0.6 -1.5 -2.5 Note: Difference = Council % minus Assembly %

2008 Western Australian Election
45
Comparison of % Vote in Legislative Assembly and Legislative Council by Electorate
2008 Labor Liberal National Greens Chris Dems Fam First Others Informal Electorate LA LC LA LC LA LC LA LC LA LC LA LC LA LC LA LC Armadale 56.0 48.7 25.9 28.4 .. 0.8 10.8 9.6 7.3 5.6 .. 4.2 .. 2.6 6.0 3.5 Bassendean 47.8 46.6 30.6 30.8 .. 0.8 16.0 12.8 5.6 3.1 .. 3.5 .. 2.5 7.6 3.7 Belmont 43.5 44.1 33.9 35.0 .. 1.2 12.2 11.0 3.1 1.8 3.9 4.4 3.4 2.6 7.0 3.8 Darling Range 33.9 33.6 46.8 43.5 .. 1.3 14.3 12.6 5.0 3.7 .. 2.5 .. 2.8 5.5 2.4 Forrestfield 39.5 40.5 40.9 40.0 .. 1.0 12.5 9.7 3.4 2.8 3.7 3.7 .. 2.3 6.5 3.3 Gosnells 42.9 44.6 35.2 33.6 .. 0.9 12.3 10.3 5.0 3.7 4.6 4.4 .. 2.5 6.1 3.7 Kalamunda 31.5 31.4 47.6 46.3 .. 1.1 14.8 14.2 4.1 3.2 2.1 1.9 .. 1.8 5.6 2.4 Maylands 43.7 41.6 33.9 33.6 .. 0.9 19.1 17.0 3.3 2.0 .. 2.5 .. 2.4 6.3 3.2 Midland 46.8 43.1 34.7 35.0 .. 1.1 15.0 12.7 3.6 2.3 .. 3.4 .. 2.4 6.4 3.5 Morley 35.7 39.2 34.7 41.2 .. 0.7 8.6 9.2 3.2 3.4 .. 2.8 17.8 3.5 6.4 3.4 Mount Lawley 35.0 33.8 46.4 45.4 .. 0.9 14.2 14.5 2.8 1.9 1.6 1.8 .. 1.7 5.4 2.6 Nollamara 51.2 50.4 30.8 31.1 .. 0.6 13.3 9.1 4.7 2.7 .. 3.9 .. 2.2 7.9 4.4 Swan Hills 34.1 34.5 45.5 44.9 .. 1.5 14.3 12.5 2.6 2.1 3.5 2.6 .. 1.9 5.2 2.5 West Swan 46.2 45.2 37.6 37.7 .. 0.7 9.0 8.0 4.7 2.5 .. 3.5 2.6 2.5 6.3 3.2 East Metro 41.8 41.1 37.6 37.7 .. 1.0 13.3 11.7 4.2 2.9 1.4 3.2 1.7 2.4 6.3 3.3 Balcatta 42.1 39.4 41.0 41.7 .. 0.7 11.2 10.8 3.7 2.8 2.0 1.4 .. 3.2 7.0 4.5 Carine 22.0 24.8 43.8 52.2 .. 0.9 11.3 13.0 1.9 3.9 1.5 1.1 19.5 4.1 4.3 1.8 Churchlands 17.9 21.6 .. 54.4 .. 1.0 14.8 15.4 .. 2.1 .. 0.8 67.3 4.7 3.3 1.9 Cottesloe 17.5 17.6 63.5 61.1 .. 1.0 17.0 16.0 2.0 1.2 .. 0.6 .. 2.6 4.3 1.7 Girrawheen 51.1 47.4 34.1 31.2 .. 0.6 14.8 11.3 .. 3.3 .. 2.4 .. 3.8 8.1 4.3 Hillarys 28.4 28.9 52.9 51.3 .. 0.8 13.2 12.3 2.9 2.3 2.6 1.6 .. 2.8 5.1 2.3 Joondalup 41.8 40.0 38.1 38.9 .. 0.7 13.1 12.3 3.2 2.5 3.8 2.3 .. 3.3 5.6 2.8 Kingsley 35.5 34.4 47.7 46.7 .. 0.7 11.3 11.0 2.8 2.4 2.7 2.0 .. 2.8 4.9 2.2 Mindarie 48.6 43.7 35.8 38.7 .. 0.8 10.2 9.2 2.1 1.8 3.4 2.8 .. 3.0 5.2 3.0 Nedlands 15.8 19.2 45.5 55.0 .. 1.0 14.1 18.1 1.2 1.4 0.7 0.7 22.8 4.5 3.2 1.5 Ocean Reef 36.7 35.4 47.7 47.2 .. 0.5 10.4 10.4 2.3 2.0 2.8 1.7 .. 2.8 5.0 2.4 Perth 41.0 36.4 36.7 37.3 .. 0.7 19.3 20.0 3.1 1.6 .. 0.8 .. 3.2 5.1 2.8 Scarborough 30.1 31.1 44.9 46.4 .. 0.9 12.5 13.9 2.1 2.0 1.2 0.9 9.1 4.7 5.0 2.3 Wanneroo 39.9 38.6 43.7 43.8 .. 0.6 8.8 9.0 2.7 2.3 2.8 2.5 2.2 3.3 5.1 2.8 North Metro 33.3 32.7 41.2 46.3 .. 0.8 12.9 13.0 2.1 2.2 1.7 1.5 8.7 3.5 5.1 2.6

2008 Western Australian Election
46
Comparison of % Vote in Legislative Assembly and Legislative Council by Electorate
2008 Labor Liberal National Greens Chris Dems Fam First Others Informal Electorate LA LC LA LC LA LC LA LC LA LC LA LC LA LC LA LC Alfred Cove 20.3 25.6 43.1 56.2 .. 0.8 9.5 10.8 1.6 1.5 .. 0.9 25.5 4.3 4.0 1.8 Bateman 28.1 29.8 53.4 50.9 .. 0.5 13.0 10.7 3.8 2.9 .. 2.0 1.8 3.2 4.3 2.1 Cannington 45.4 46.1 32.7 32.5 .. 0.8 16.3 11.0 5.5 3.9 .. 2.1 .. 3.8 7.0 4.0 Cockburn 48.7 49.3 31.3 31.2 .. 0.5 12.8 10.7 .. 1.4 .. 2.7 7.2 4.2 7.6 4.0 Fremantle 38.7 39.0 30.2 30.6 .. 0.7 27.6 23.6 1.9 1.3 1.7 1.2 .. 3.7 5.7 3.0 Jandakot 37.0 37.9 44.5 43.7 .. 0.5 11.7 10.3 2.8 2.3 3.9 2.3 .. 3.2 4.8 2.4 Kwinana 42.0 51.5 18.9 24.2 .. 0.6 10.7 10.3 .. 1.4 3.8 2.6 24.6 9.3 5.7 3.7 Riverton 39.9 38.6 41.3 41.4 .. 0.7 10.5 10.6 3.4 3.1 2.8 2.8 2.1 2.8 4.9 2.5 Rockingham 51.2 48.0 34.1 33.4 .. 0.7 13.0 10.9 .. 1.4 .. 1.4 1.7 4.2 5.5 3.1 South Perth 24.0 26.7 52.9 52.9 .. 1.5 10.5 11.3 .. 1.3 2.5 1.7 10.2 4.5 4.3 2.2 Southern River 39.0 40.9 45.0 43.3 .. 0.4 10.3 8.0 2.6 2.3 3.1 2.4 .. 2.7 5.9 2.7 Victoria Park 46.8 42.3 34.4 34.9 .. 1.0 13.9 13.9 2.5 2.2 2.4 1.7 .. 3.9 4.8 3.0 Warnbro 48.5 46.6 32.1 32.8 .. 0.7 12.1 9.8 .. 1.6 7.3 4.5 .. 4.0 5.1 2.7 Willagee 51.7 47.1 30.9 30.2 .. 0.5 17.4 15.9 .. 1.4 .. 1.4 .. 3.5 6.7 3.3 South Metro 40.0 40.6 37.6 38.6 .. 0.7 13.5 11.9 1.7 2.0 2.0 2.1 5.2 4.1 5.4 2.9 Metropolitan 38.3 38.1 38.8 40.9 .. 0.8 13.2 12.2 2.7 2.4 1.7 2.3 5.2 3.3 5.6 2.9 Cent. Wheatbelt 16.7 20.2 25.6 27.2 47.8 40.6 5.7 5.0 3.3 2.0 .. 2.7 0.9 2.3 4.0 2.8 Geraldton 29.1 30.5 36.9 35.7 19.3 18.9 5.8 6.0 3.1 2.7 5.8 4.4 .. 1.9 4.3 2.4 Moore 16.7 20.0 40.5 40.9 32.3 27.7 6.2 5.7 1.7 1.6 2.1 2.0 0.5 2.0 4.7 2.2 Wagin 10.4 15.6 18.4 26.1 63.0 47.3 3.5 3.6 3.8 3.0 .. 2.4 0.9 2.1 3.2 2.0 Agricultural 18.2 21.6 30.5 32.6 40.4 33.4 5.3 5.1 3.0 2.3 2.0 2.8 0.6 2.1 4.1 2.3 Eyre 19.4 24.0 46.1 35.9 26.6 26.4 7.2 7.1 .. 3.0 .. 1.3 0.7 2.3 5.1 3.4 Kalgoorlie 17.6 33.2 24.9 33.7 19.0 19.4 4.5 6.9 .. 2.1 .. 2.0 34.0 2.8 5.6 3.8 Kimberley 41.2 40.3 26.0 26.1 18.3 15.5 13.4 13.8 .. 1.2 .. 1.3 1.0 1.8 4.5 2.3 North West 36.2 36.2 26.7 27.6 22.7 22.6 7.3 8.8 .. 1.4 .. 1.3 7.2 2.1 4.3 2.3 Pilbara 44.4 42.8 17.6 21.7 22.9 20.6 9.6 9.0 .. 1.1 5.5 2.7 .. 2.0 5.2 2.9 Mining Pastoral 30.2 34.1 30.1 29.8 22.2 21.4 8.2 8.9 .. 1.9 0.8 1.6 8.5 2.2 4.9 3.0
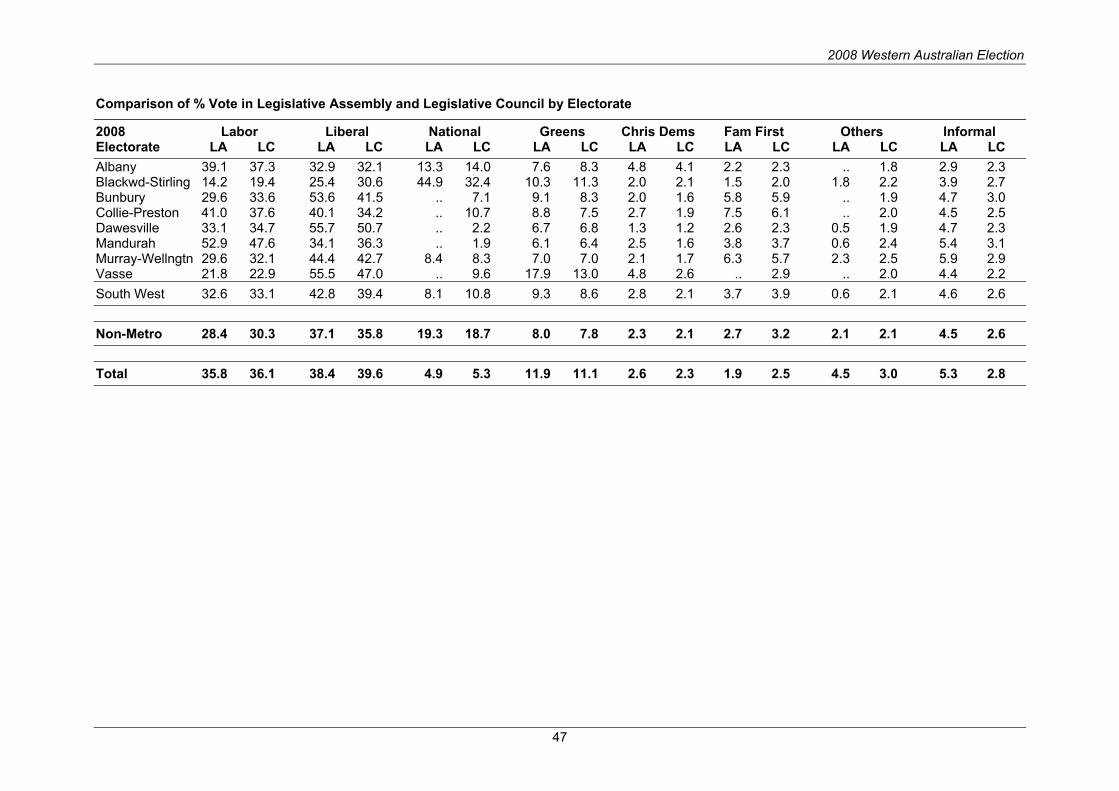
2008 Western Australian Election
47
Comparison of % Vote in Legislative Assembly and Legislative Council by Electorate
2008 Labor Liberal National Greens Chris Dems Fam First Others Informal Electorate LA LC LA LC LA LC LA LC LA LC LA LC LA LC LA LC Albany 39.1 37.3 32.9 32.1 13.3 14.0 7.6 8.3 4.8 4.1 2.2 2.3 .. 1.8 2.9 2.3 Blackwd-Stirling 14.2 19.4 25.4 30.6 44.9 32.4 10.3 11.3 2.0 2.1 1.5 2.0 1.8 2.2 3.9 2.7 Bunbury 29.6 33.6 53.6 41.5 .. 7.1 9.1 8.3 2.0 1.6 5.8 5.9 .. 1.9 4.7 3.0 Collie-Preston 41.0 37.6 40.1 34.2 .. 10.7 8.8 7.5 2.7 1.9 7.5 6.1 .. 2.0 4.5 2.5 Dawesville 33.1 34.7 55.7 50.7 .. 2.2 6.7 6.8 1.3 1.2 2.6 2.3 0.5 1.9 4.7 2.3 Mandurah 52.9 47.6 34.1 36.3 .. 1.9 6.1 6.4 2.5 1.6 3.8 3.7 0.6 2.4 5.4 3.1 Murray-Wellngtn 29.6 32.1 44.4 42.7 8.4 8.3 7.0 7.0 2.1 1.7 6.3 5.7 2.3 2.5 5.9 2.9 Vasse 21.8 22.9 55.5 47.0 .. 9.6 17.9 13.0 4.8 2.6 .. 2.9 .. 2.0 4.4 2.2 South West 32.6 33.1 42.8 39.4 8.1 10.8 9.3 8.6 2.8 2.1 3.7 3.9 0.6 2.1 4.6 2.6 Non-Metro 28.4 30.3 37.1 35.8 19.3 18.7 8.0 7.8 2.3 2.1 2.7 3.2 2.1 2.1 4.5 2.6 Total 35.8 36.1 38.4 39.6 4.9 5.3 11.9 11.1 2.6 2.3 1.9 2.5 4.5 3.0 5.3 2.8

2008 Western Australian Election
48
New and Departing Members Legislative Assembly: Departing Members (19) Member Party Seat Notes Paul Andrews ALP Southern River Defeated Matt Birney LIB Kalgoorlie Retired John D’Orazio IND Ballajura Seat abolished, resigned from Labor Party and
defeated contesting Morley Judy Edwards ALP Maylands Retired Dianne Guise ALP Wanneroo Defeated Shane Hill ALP Geraldton Defeated on new electoral boundaries Katie Hodson-Thomas LIB Carine Retired Judy Hughes ALP Kingsley Defeated Bob Kucera IND Mount Lawley Seat abolished, resigned from Labor Party after
not winning pre-slection. Retired. Sheila McHale ALP Kenwick Seat abolished, retired Tony McRae ALP Riverton Defeated Paul Omodei LIB Warren-Blackwood Seat abolished, retired after disputes in Liberal
pre-selection for Legislative Council. Jaye Radisich ALP Swan Hills Retired Fred Riebeling ALP North West Coastal Retired Gary Snook LIB Moore Defeated Dan Sullivan IND Leschenault Seat abolished, resigned from Liberal Party and
defeated contesting Legislative Council as a Family First candidate.
Steve Thomas LIB Capel Seat abolished, defeated contesting Collie-Preston
Max Trenorden NAT Avon Seat abolished, elected to Legislative Council Sue Walker IND Nedlands Resigned from Liberal Party, defeated Legislative Assembly: New Members (21) Member Party Seat Notes Peter Abetz LIB Southern River Defeated sitting Labor MP Frank Alban LIB Swan Hills Won Labor seat with no sitting MP Lisa Baker ALP Maylands Succeeded retiring Labor MP Ian Blayney LIB Geraldton Defeated Labor MP in notional Liberal seat Ian Britza LIB Morley Won notional Labor seat with no sitting MP Vincent Catania ALP North West MLC, elected to succeed Fred Riebeling Roger Cook ALP Kwinana New seat with no sitting MP Joe Francis LIB Jandakot Won notional Labor seat with no sitting MP Janine Freeman ALP Nollamara New seat with no sitting MP Liza Harvey LIB Scarborough New seat with no sitting MP Albert Jacob LIB Ocean Reef Won notional Labor seat with no sitting MP Bill Johnston ALP Cannington New seat with no sitting MP Tony Krsticevic LIB Carine Succeeded retiring Liberal MP Bill Marmion LIB Nedlands Defeated ex-Liberal MP Paul Miles LIB Wanneroo Defeated sitting Labor MP Andrea Mitchell LIB Kingsley Defeated sitting Labor MP Michael Nahan LIB Riverton Defeated sitting Labor MP Rita Saffioti ALP West Swan New seat with no sitting MP Michael Sutherland LIB Mount Lawley Won notional Labor seat with no sitting MP Chris Tallentire ALP Gosnells New seat with no sitting MP Andrew Waddell ALP Forrestfield New seat with no sitting MP

2008 Western Australian Election
49
Legislative Assembly: Members Changing Electorate (12) Member Party Old Seat New Seat John Bowler IND Murchison-Eyre Kalgoorlie Murray Cowper LIB Murray Murray-Wellington John Day LIB Darling Range Kalamunda Brendon Grylls NAT Merredin Central Wheatbelt Graham Jacobs LIB Roe Eyre Mick Murray ALP Collie-Wellington Collie-Preston Paul Papalia ALP Peel Warnbro Christian Porter LIB Murdoch Bateman Terry Redman NAT Stirling Blackwood-Stirling Tony Simpson LIB Serpentine-Jarrahdale Darling Range Tom Stephens ALP Central Kimberley-Pilbara Pilbara Grant Woodhams NAT Greenough Moore Legislative Council: Departing Members (13) Region Member Reason East Metropolitan Nick Griffiths (ALP) Did not contest election East Metropolitan Batong Vu Pham (ALP) Defeated contesting South Metropolitan North Metropolitan George Cash (LIB) Did not contest election North Metropolitan Graham Giffard (ALP) Defeated contesting Swan Hills in Assembly North Metropolitan Ray Halligan (LIB) Did not contest election South Metropolitan Sheila Mills (ALP) Did nor contest election South Metropolitan Barbara Scott (LIB) Did not contest election Agricultural Kim Chance (ALP) Did not contest election Agricultural Bruce Donaldson Did not contest election Agricultural Anthony Fels (LIB/FFP) Defeated contesting election for Family First Mining and Pastoral Shelley Archer (ALP/IND) Left Labor Party, did not contest election Mining and Pastoral Vincent Catania Elected to Legislative Assembly South West Paul Llewellyn (GRN) Defeated Legislative Assembly: Members Changing Region (2) Matt Benson-Lidholm (ALP South-West) was elected for Agricultural Region. Wendy Duncan (NAT, Agricultural) was elected for Mining and Pastoral Region.
Legislative Council: New Members (15) Region Member East Metropolitan Jock Ferguson (ALP) East Metropolitan Alyssa Hayden (LIB) East Metropolitan Alison Xamon (GRN) North Metropolitan Liz Behjat (LIB) North Metropolitan Michael Mischin (LIB) South Metropolitan Phil Edman (LIB) South Metropolitan Nick Goiran (LIB) South Metropolitan Lynn MacLaren (GRN) (Former MLC Feb-May 2005) Agricultural James Chown (LIB) Agricultural Mia Davies (NAT) Agricultural Philip Gardiner (NAT) Agricultural Max Trenorden (NAT) (MLA for Avon before election) Mining and Pastoral Helen Bullock (ALP) Mining and Pastoral Robin Chapple (GRN) (former MLC 2001-2005) South West Colin Holt (NAT)
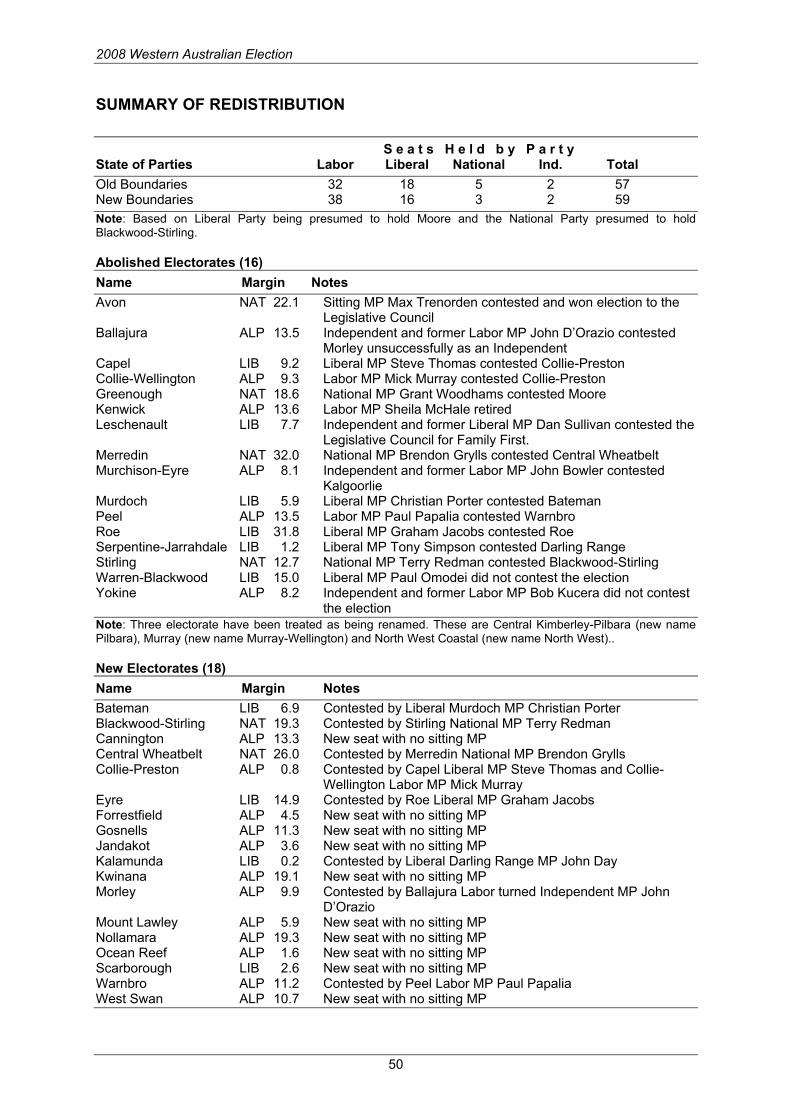
2008 Western Australian Election
50
SUMMARY OF REDISTRIBUTION S e a t s H e l d b y P a r t y State of Parties Labor Liberal National Ind. Total Old Boundaries 32 18 5 2 57 New Boundaries 38 16 3 2 59 Note: Based on Liberal Party being presumed to hold Moore and the National Party presumed to hold Blackwood-Stirling. Abolished Electorates (16) Name Margin Notes Avon NAT 22.1 Sitting MP Max Trenorden contested and won election to the
Legislative Council Ballajura ALP 13.5 Independent and former Labor MP John D’Orazio contested
Morley unsuccessfully as an Independent Capel LIB 9.2 Liberal MP Steve Thomas contested Collie-Preston Collie-Wellington ALP 9.3 Labor MP Mick Murray contested Collie-Preston Greenough NAT 18.6 National MP Grant Woodhams contested Moore Kenwick ALP 13.6 Labor MP Sheila McHale retired Leschenault LIB 7.7 Independent and former Liberal MP Dan Sullivan contested the
Legislative Council for Family First. Merredin NAT 32.0 National MP Brendon Grylls contested Central Wheatbelt Murchison-Eyre ALP 8.1 Independent and former Labor MP John Bowler contested
Kalgoorlie Murdoch LIB 5.9 Liberal MP Christian Porter contested Bateman Peel ALP 13.5 Labor MP Paul Papalia contested Warnbro Roe LIB 31.8 Liberal MP Graham Jacobs contested Roe Serpentine-Jarrahdale LIB 1.2 Liberal MP Tony Simpson contested Darling Range Stirling NAT 12.7 National MP Terry Redman contested Blackwood-Stirling Warren-Blackwood LIB 15.0 Liberal MP Paul Omodei did not contest the election Yokine ALP 8.2 Independent and former Labor MP Bob Kucera did not contest
the election Note: Three electorate have been treated as being renamed. These are Central Kimberley-Pilbara (new name Pilbara), Murray (new name Murray-Wellington) and North West Coastal (new name North West).. New Electorates (18) Name Margin Notes Bateman LIB 6.9 Contested by Liberal Murdoch MP Christian Porter Blackwood-Stirling NAT 19.3 Contested by Stirling National MP Terry Redman Cannington ALP 13.3 New seat with no sitting MP Central Wheatbelt NAT 26.0 Contested by Merredin National MP Brendon Grylls Collie-Preston ALP 0.8 Contested by Capel Liberal MP Steve Thomas and Collie-
Wellington Labor MP Mick Murray Eyre LIB 14.9 Contested by Roe Liberal MP Graham Jacobs Forrestfield ALP 4.5 New seat with no sitting MP Gosnells ALP 11.3 New seat with no sitting MP Jandakot ALP 3.6 New seat with no sitting MP Kalamunda LIB 0.2 Contested by Liberal Darling Range MP John Day Kwinana ALP 19.1 New seat with no sitting MP Morley ALP 9.9 Contested by Ballajura Labor turned Independent MP John
D’Orazio Mount Lawley ALP 5.9 New seat with no sitting MP Nollamara ALP 19.3 New seat with no sitting MP Ocean Reef ALP 1.6 New seat with no sitting MP Scarborough LIB 2.6 New seat with no sitting MP Warnbro ALP 11.2 Contested by Peel Labor MP Paul Papalia West Swan ALP 10.7 New seat with no sitting MP
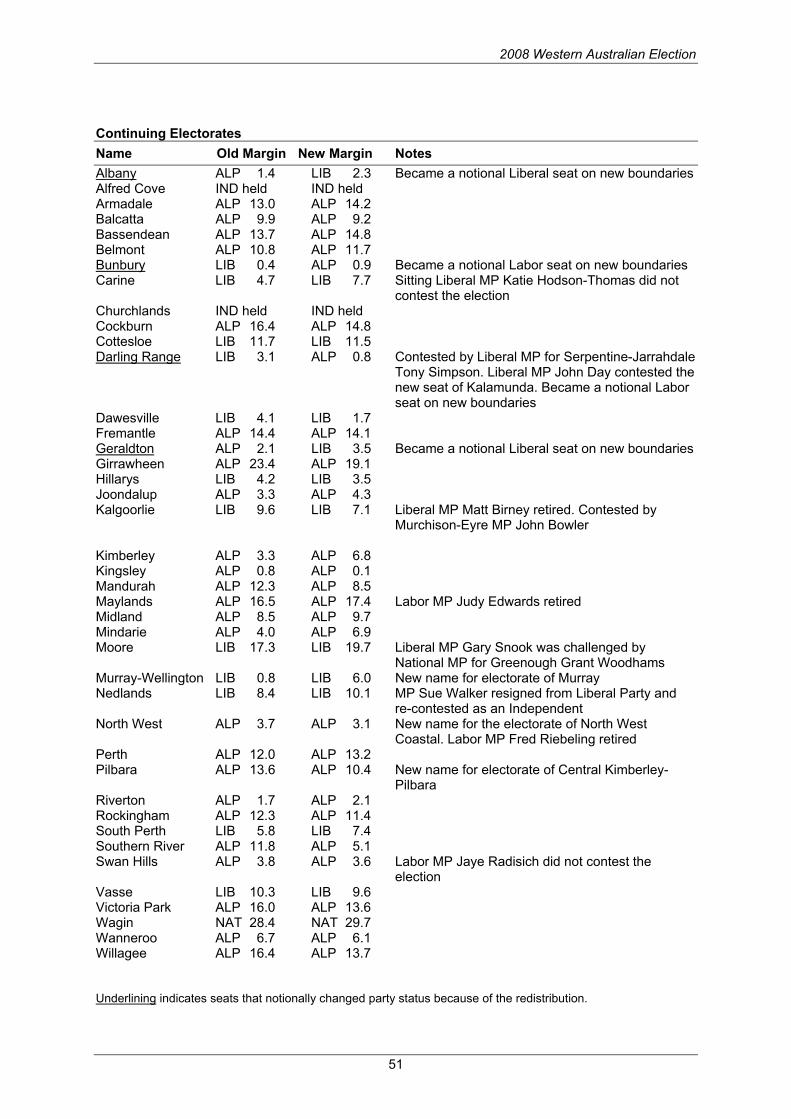
2008 Western Australian Election
51
Continuing Electorates Name Old Margin New Margin Notes Albany ALP 1.4 LIB 2.3 Became a notional Liberal seat on new boundaries Alfred Cove IND held IND held Armadale ALP 13.0 ALP 14.2 Balcatta ALP 9.9 ALP 9.2 Bassendean ALP 13.7 ALP 14.8 Belmont ALP 10.8 ALP 11.7 Bunbury LIB 0.4 ALP 0.9 Became a notional Labor seat on new boundaries Carine LIB 4.7 LIB 7.7 Sitting Liberal MP Katie Hodson-Thomas did not
contest the election Churchlands IND held IND held Cockburn ALP 16.4 ALP 14.8 Cottesloe LIB 11.7 LIB 11.5 Darling Range LIB 3.1 ALP 0.8 Contested by Liberal MP for Serpentine-Jarrahdale
Tony Simpson. Liberal MP John Day contested the new seat of Kalamunda. Became a notional Labor seat on new boundaries
Dawesville LIB 4.1 LIB 1.7 Fremantle ALP 14.4 ALP 14.1 Geraldton ALP 2.1 LIB 3.5 Became a notional Liberal seat on new boundaries Girrawheen ALP 23.4 ALP 19.1 Hillarys LIB 4.2 LIB 3.5 Joondalup ALP 3.3 ALP 4.3 Kalgoorlie LIB 9.6 LIB 7.1 Liberal MP Matt Birney retired. Contested by
Murchison-Eyre MP John Bowler Kimberley ALP 3.3 ALP 6.8 Kingsley ALP 0.8 ALP 0.1 Mandurah ALP 12.3 ALP 8.5 Maylands ALP 16.5 ALP 17.4 Labor MP Judy Edwards retired Midland ALP 8.5 ALP 9.7 Mindarie ALP 4.0 ALP 6.9 Moore LIB 17.3 LIB 19.7 Liberal MP Gary Snook was challenged by
National MP for Greenough Grant Woodhams Murray-Wellington LIB 0.8 LIB 6.0 New name for electorate of Murray Nedlands LIB 8.4 LIB 10.1 MP Sue Walker resigned from Liberal Party and
re-contested as an Independent North West ALP 3.7 ALP 3.1 New name for the electorate of North West
Coastal. Labor MP Fred Riebeling retired Perth ALP 12.0 ALP 13.2 Pilbara ALP 13.6 ALP 10.4 New name for electorate of Central Kimberley-
Pilbara Riverton ALP 1.7 ALP 2.1 Rockingham ALP 12.3 ALP 11.4 South Perth LIB 5.8 LIB 7.4 Southern River ALP 11.8 ALP 5.1 Swan Hills ALP 3.8 ALP 3.6 Labor MP Jaye Radisich did not contest the
election Vasse LIB 10.3 LIB 9.6 Victoria Park ALP 16.0 ALP 13.6 Wagin NAT 28.4 NAT 29.7 Wanneroo ALP 6.7 ALP 6.1 Willagee ALP 16.4 ALP 13.7 Underlining indicates seats that notionally changed party status because of the redistribution.
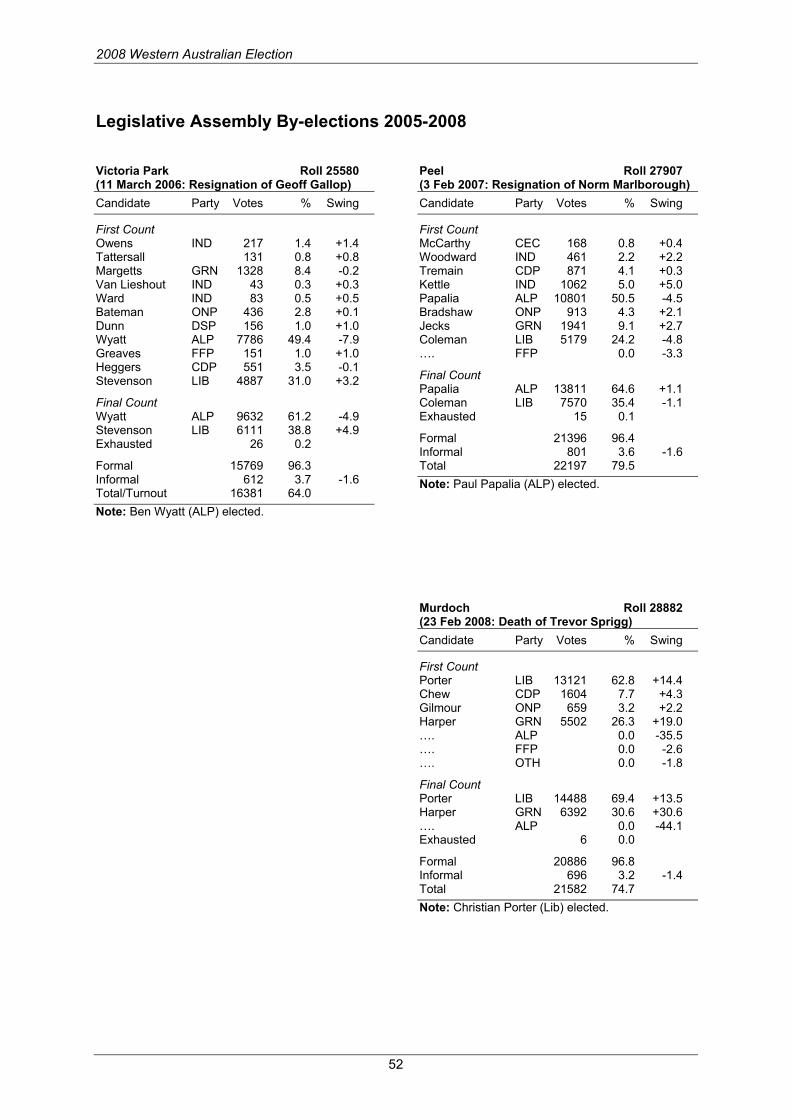
2008 Western Australian Election
52
Legislative Assembly By-elections 2005-2008 Victoria Park Roll 25580 (11 March 2006: Resignation of Geoff Gallop) Candidate Party Votes % Swing
First Count Owens IND 217 1.4 +1.4 Tattersall 131 0.8 +0.8 Margetts GRN 1328 8.4 -0.2 Van Lieshout IND 43 0.3 +0.3 Ward IND 83 0.5 +0.5 Bateman ONP 436 2.8 +0.1 Dunn DSP 156 1.0 +1.0 Wyatt ALP 7786 49.4 -7.9 Greaves FFP 151 1.0 +1.0 Heggers CDP 551 3.5 -0.1 Stevenson LIB 4887 31.0 +3.2
Final Count Wyatt ALP 9632 61.2 -4.9 Stevenson LIB 6111 38.8 +4.9 Exhausted 26 0.2
Formal 15769 96.3 Informal 612 3.7 -1.6 Total/Turnout 16381 64.0 Note: Ben Wyatt (ALP) elected.
Peel Roll 27907 (3 Feb 2007: Resignation of Norm Marlborough) Candidate Party Votes % Swing
First Count McCarthy CEC 168 0.8 +0.4 Woodward IND 461 2.2 +2.2 Tremain CDP 871 4.1 +0.3 Kettle IND 1062 5.0 +5.0 Papalia ALP 10801 50.5 -4.5 Bradshaw ONP 913 4.3 +2.1 Jecks GRN 1941 9.1 +2.7 Coleman LIB 5179 24.2 -4.8 …. FFP 0.0 -3.3
Final Count Papalia ALP 13811 64.6 +1.1 Coleman LIB 7570 35.4 -1.1 Exhausted 15 0.1
Formal 21396 96.4 Informal 801 3.6 -1.6 Total 22197 79.5 Note: Paul Papalia (ALP) elected. Murdoch Roll 28882 (23 Feb 2008: Death of Trevor Sprigg) Candidate Party Votes % Swing
First Count Porter LIB 13121 62.8 +14.4 Chew CDP 1604 7.7 +4.3 Gilmour ONP 659 3.2 +2.2 Harper GRN 5502 26.3 +19.0 …. ALP 0.0 -35.5 …. FFP 0.0 -2.6 …. OTH 0.0 -1.8
Final Count Porter LIB 14488 69.4 +13.5 Harper GRN 6392 30.6 +30.6 …. ALP 0.0 -44.1 Exhausted 6 0.0
Formal 20886 96.8 Informal 696 3.2 -1.4 Total 21582 74.7 Note: Christian Porter (Lib) elected.

2008 Western Australian Election
53
Legislative Council Casual Vacancies 2005-2008 July 2007 Agricultural Region, Brian Ellis (LIB) elected following resignation of Margaret
Rowe.
Nov 2007 East Metropolitan Region, Batong Vu Pham (ALP) elected to vacancy casued by Louise Pratt’s resignation to contest the 2007 Federal election.
June 2008 Agricultural Region, Wendy Duncan (NAT) elected following resignation of Murray Criddle.
Sept 2008 Mining and Pastoral Region, Shelley Eaton (ALP) elected to replace Vincent Catania, who resigned to contest the Legislative Assembly seat of North West.
Sept 2008 North Metropolitan Region, Carolyn Burton (ALP) elected following resignation of Graham Giffard to contest Legislative Assembly seat of Swan Hills