Embed Size (px)
Citation preview

TUALATIN RIVER
FLOW MANAGEMENT
TECHNICAL COMMITTEE
2009Annual Report
prepared by
Bernie Bonn for
wet season
dry season

Photo Credits:
top: Tualatin National Wildlife Refuge behind Visitor’s Center, July 2008
all photographs taken by Bernadine Bonn
middle: Tualatin River National Wildlife Refuge behind Visitor’s Center, April 2010
bottom: sign at Tualatin River National Wildlife Refuge near Visitor’s Center, July 2008

TUALATIN RIVER FLOW MANAGEMENT
TECHNICAL COMMITTEE
2009 Annual Report
Prepared by:
Bernie Bonn
For:
Clean Water Services
In cooperation with:
Oregon Water Resources Department, District 18 Watermaster

FLOW MANAGEMENT TECHNICAL COMMITTEE MEMBERS
Darrell Hedin, Secretary Oregon Water Resources DepartmentKevin Hanway City of Hillsboro Water DepartmentNiki Iverson City of Hillsboro Water DepartmentJan Miller, Chair Clean Water ServicesWally Otto Tualatin Valley Irrigation DistrictScott Porter Washington County — Emergency Management SystemMark Rosenkranz Lake Oswego CorporationChris Wayland Washington County Parks — Hagg LakeRandy Smith City of Forest GroveJean Woll Joint Water Commission
ACRONYMS USED IN THIS REPORT
FULL NAME ACRONYM
Facilities
Spring Hill Pumping Plant SHPP
Wastewater Treatment Plant WWTP
Organization
Barney Reservoir Joint OwnershipCommission
BRJOC
Clean Water Services(formerly Unified Sewerage Agency)
CWS
Joint Water Commission JWC
Lake Oswego Corporation LOC
Oregon Department of Environmental Quality ODEQ
Oregon Department of Transportation ODOT
Oregon Water Resources Department OWRD
Tualatin Valley Irrigation District TVID
Tualatin Valley Water District TVWD
U.S. Bureau of Reclamation BOR
U.S. Geological Survey USGS
Other
Total Maximum Daily Load TMDL
Wasteload Allocation WLA
Units of Measurement
Acre-Feet ac-ft
Cubic Feet per Second cfs
Micrograms per liter µg/L
Milligrams per Liter mg/L
Million Gallons per Day MGD
Pounds lbs
River Mile RM
Water Year WY
Water Quality Parameters
Biochemical Oxygen Demand BOD
Dissolved Oxygen DO
Sediment Oxygen Demand SOD
FULL NAME ACRONYM
DisclaimerThis report and the data presented herein are provided without any warranty, explicit or implied. The data presented in this report were supplied by the members of the committee. Although every effort was made to faithfully reproduce the data as provided, the data are not warranted to be accurate, appropriate for interpretation, merchantable, or suitable for any particular purpose.

2009 Tualatin River Flow Management Report 3
TABLE OF CONTENTS
2009 Summary . . . . . . . . . . . . . . . . . . . . . . . . . . . . . . . . . . . . . . . . . . . . . . . . . . . . . . . . . . . . . . . . . . . . 4
Background
Basin Description and Tualatin River Basin Map . . . . . . . . . . . . . . . . . . . . . . . . . . . . . . . . . . . . . . . 5
Tualatin River Water Management . . . . . . . . . . . . . . . . . . . . . . . . . . . . . . . . . . . . . . . . . . . . . . . . . . 8
Member Reports for 2009
Reservoir Status . . . . . . . . . . . . . . . . . . . . . . . . . . . . . . . . . . . . . . . . . . . . . . . . . . . . . . . . . . . . . . . . . 9
Clean Water Services . . . . . . . . . . . . . . . . . . . . . . . . . . . . . . . . . . . . . . . . . . . . . . . . . . . . . . . . . . . . 10
Joint Water Commission/Joint Barney Commission . . . . . . . . . . . . . . . . . . . . . . . . . . . . . . . . . . . . 15
Lake Oswego Corporation . . . . . . . . . . . . . . . . . . . . . . . . . . . . . . . . . . . . . . . . . . . . . . . . . . . . . . . . 17
Oregon Water Resources Department . . . . . . . . . . . . . . . . . . . . . . . . . . . . . . . . . . . . . . . . . . . . . . . 19
Tualatin Valley Irrigation District . . . . . . . . . . . . . . . . . . . . . . . . . . . . . . . . . . . . . . . . . . . . . . . . . . 22
Water Quality Status Report . . . . . . . . . . . . . . . . . . . . . . . . . . . . . . . . . . . . . . . . . . . . . . . . . . . . . . 30
Appendices
A. Stream Gage Records—Data Tables and Hydrographs of Daily Data
B. Selected Releases and Withdrawals—Data Tables and Hydrographs
C. Scoggins Reservoir (Henry Hagg Lake) Operations—Monthly Data Reports
D. Barney Reservoir Operations—Monthly Data Reports
E. Municipal Water Use Allocations—Monthly Data
F. Temperature Records—Data Tables and Graphs of Daily Data
G. Hagg Lake—Benthic Invertebrate Monitoring 2009
H. Precipitation Records—
I. River Mile Indices—

4 2009 Tualatin River Flow Managment Report
2009 SUMMARY
This is the twenty-second year that the Tualatin River Flow Management Technical Committee has pre-pared an annual report documenting the flow management of the Tualatin River. Members of the commit-tee include Clean Water Services (CWS), Tualatin Valley Irrigation District (TVID), Joint Water Commission (JWC), Lake Oswego Corporation (LOC) and Oregon Water Resources Department (OWRD).
Highlights for 2009 include:
• Both Barney and Scoggins Reservoirs filled.
• Seismic investigations of Scoggins Dam by the U.S. Bureau of Reclamation will result in upgrades to the dam, a change in dam operations, or both.
• Higher than normal minimum releases are being maintained to protect the Coho redds that were first reported in November 2006.
• The website for OWRD Tualatin data changed. It is now part of a statewide system for all OWRD data. Streamflow data is updated more frequently than before as new information is obtained in the field. The url for the new website is:
http://apps2.wrd.state.or.us/apps/sw/hydro_near_real_time/Default.aspx
2001
60
100
1000
10000
Dai
ly M
ean
Dis
char
ge
(cfs
)
1/1
2/1
3/1
4/1
5/1
6/1
7/1
8/1
9/1
10/1
11/1
12/1
1/1
13000
Tualatin River at Farmington (RM 33.3 #14206500) 1989–2009
Date
1996
10th percentile
90th percentile
75th percentile
25th percentile
1989–2009Statistical Distribution
2009

2009 Tualatin River Flow Management Report 5
BACKGROUND
Basin DescriptionThe Tualatin River Basin comprises an area of 712 square miles situated in the northwest corner of Oregon and is a subbasin of the Willamette River. The headwaters are in the Coast Range and flow in a generally easterly direction to the confluence with the Willamette River. The basin lies almost entirely in Washington County. (See map below)
The Tualatin River is about 80 miles long and changes dramatically from its headwaters to its mouth. The mountain or headwater reach (upstream of RM 55) is narrow (about 15 ft) and steep with an average slope of about 74 ft/mi. The meander reach (RM 55–33) is wider with an average slope of about 1.3 ft/mi. The reser-voir reach (RM 33–3.4) is very wide (up to 150 ft) and has an estimated slope of only 0.08 ft/mi. It includes several deep pools. Travel times through this reach are very long. The slow movement of the water causes this reach to act much like a lake. In the riffle reach (RM 3.4–0), the Tualatin River flows through a short reservoir section and then drops into a narrow gorge near the City of West Linn before it enters the Willamette River just upstream of Willamette Falls. The average slope in this reach is 10 ft/mi.
Nyberg Cr
CO
L UM
B IAR IV E R
RI V
ER
WIL
LAM
E T T E
LakeOswego
Tigard
Beaverton
Tualatin
Sherwood
Scholls
Farmington
Hillsboro
Banks
Cornelius
Dilley
ForestGrove
NorthPlains
CherryGrove
5
205
Basin boundary
C L A C K A M A S
C O L U M B I A WA S H I N GT O N
T I L L A M O O K
YA M H I L L
Scoggin
Creek
HenryHaggLake
Gales
Creek
Wes
t
Eas
t
Fork Fork
Dairy
Creek
McK
ay
Cre
ek
Fanno
Cre
ek
Beaverton
Creek
Creek
RockBronso
n
Butte rnut Cr
Chris tensen Cree
Burris Creek
McFee
Creek
He
ato
n
Cr
Cr
Bake
r
C hicke
n
Creek
Creek
Creek
Cedar MillC
anal
Osw
ego
RIVER
O R E G O N
WA S H I N GTO N
123°00' 122°37'30''122°45'123°15'123°22'30''
45°45'
45°30'
45°15'Base modified from U.S. Geological Survey
0
0 5 10 KILOMETERS
5 10 MILES
Portland
O R E G O N
Studyarea
CO
AS
T
RA
NG
E
TU
AL
AT
I N
MO
UN
TA
I NS
PA
RR
ET
TM
OU
NTA
IN
CH
EH
AL
EM
MO
U
NT
AI N S
RM60
RM70
RM30
RM40
RM50
RM10
RM20
RM0
s
k
TUALATIN
26
26
5
WestLinn
1:100,000 topographic quadrangles, 1978–84 Designated urban growth area from Metro, 1998 RM10
River mile
M U LT N O M A H
Tualatin River Basin

6 2009 Tualatin River Flow Managment Report
Water sources to the Tualatin River
Precipitation: Seasonal rainfall accounts for most of the natural flow in the Tualatin Basin; stream flow from snowmelt is minimal. The amount of rainfall ranges from 110 inches on the eastern slopes of the Coast Range to 37 inches in the southeastern area of the drainage basin. Peak months for rainfall are November through February while the driest months are normally June through October. The peak streamflow month is usually February and the lowest streamflow month is August.
Barney Reservoir: Barney Reservoir is located behind Eldon Mills Dam on the Middle Fork of the North Fork of the Trask River (outside of the Tualatin Basin). A trans-basin aqueduct carries water over a low Coast Range divide to a pipeline that discharges into the Tualatin River at RM 78. Barney Reservoir has a capacity of 20,000 acre-feet and stores water for the Joint Water Commission (Cities of Beaverton, Hills-boro and Forest Grove and the Tualatin Valley Water District) and Clean Water Services. The Barney Reservoir Joint Ownership Commission owns, operates and manages Barney Reservoir. Reservoir content is monitored through calibrated reservoir elevations; water releases are monitored using a stream gage located in the outlet flume. Water is released during the summer low-flow season to supplement shortages in natural flow. The water is used for municipal supply and for instream water quality.
Scoggins Reservoir: In the early 1970's the U.S. Bureau of Reclamation built an earthen dam on Scog-gins Creek (RM 5.1). Releases from Scoggins Reservoir (Henry Hagg Lake) flow down Scoggins Creek and enter the Tualatin River at RM 60.0. Scoggins Reservoir has an active storage capacity of 53,640 acre-feet. It is a multipurpose facility with contracted water for irrigation, municipal and industrial, and water quality uses.
Scoggins Reservoir is operated and maintained by the Tualatin Valley Irrigation District under contract with the Bureau of Reclamation. Flow into Scoggins Creek (RM 4.8) is monitored by a Bureau of Recla-mation stream gage; Oregon Water Resources Department maintains the rating curve for this site.
Clean Water Services: Clean Water Services provides sanitary and stormwater services to the urban areas of Washington County. A watershed-based NPDES permit allows Clean Water Services to dis-charge treated wastewater into the Tualatin River from four wastewater treatment plants (WWTPs). The Rock Creek WWTP discharges an average of 50 cfs (33 MGD) at RM 38.1; the Durham WWTP dis-charges an average of 31 cfs (20 MGD) at RM 9.3. The Forest Grove and Hillsboro WWTPs (RM 55.2 and 43.8, respectively) are much smaller and do not discharge during the summer. WWTP flow rates are continuously monitored at each WWTP. Clean Water Services also releases storage water from Scoggins and Barney Reservoirs for flow augmentation during the seasonal low flow periods to improve water quality in the Tualatin River and to provide operational flexibility for their WWTPs.
Water sources to the tributaries
Clean Water Services: Clean Water Services has been using the Tualatin Valley Irrigation District trans-mission lines to deliver 1 to 2.5 cfs of water to McKay Creek since 2005. In 2009, a similar program was implemented for Gales Creek. The goal is to improve water quality, specifically increasing the dissolved oxygen concentration and decreasing temperature.The flow augmentation water is from Clean Water Ser-vices’ allocation in Scoggins Reservoir.

2009 Tualatin River Flow Management Report 7
Water diversions from the Tualatin River
Cherry Grove Intake (RM 73.2): The City of Hillsboro diverts water for municipal and industrial uses at the Cherry Grove Intake. This water is delivered to the Cities of Hillsboro and Gaston, the LA Water Cooperative, and rural residents of the Dilley and Cherry Grove areas. The diversion is less than 3 cfs and is monitored via metered flows.
Spring Hill Pumping Plant (RM 56.3): The Spring Hill Pumping Plant is the largest diversion facility on the river. It is operated jointly by the Tualatin Valley Irrigation District (TVID) and the Joint Water Commission (JWC). TVID, with a pumping capacity of approximately 90 MGD (140 cfs), delivers water to about 12,000 acres of irrigated cropland via a pressure pipeline. JWC, with a pumping capacity of approximately 60 MGD (90 cfs), delivers water to the Cities of Beaverton, Hillsboro, Forest Grove and to the Tualatin Valley Water District. Both TVID and JWC have natural flow water rights that are used when natural flow is adequate; they release contracted stored water from Scoggins and Barney Reservoirs to augment low natural flow in the summer. Pumping rates are monitored by TVID and JWC using teleme-try-equipped flow meters. Additional monitoring is provided by real-time stream gages on the Tualatin River located above and below the pumping plant and on Gales Creek.
Wapato Canal Diversion: The Wapato Improvement District has a natural flow water right (priority date: 1928) to divert water from the Tualatin River at the Wapato Canal Diversion, near RM 62. This water is used for irrigation. Withdrawals were not monitored in 2009.
Irrigation withdrawals: Water is obtained directly from the Tualatin River for irrigation purposes by members of the TVID and by irrigators with natural flow water rights. About 5,000 acres of cropland served by TVID is irrigated with water obtained directly from the Tualatin River. Some of the discharge from the Rock Creek WWTP (RM 43.8) is contracted to TVID to be used by downstream irrigators.
Patton Valley Pump Plant: Tualatin Valley Irrigation District pumps water from Scoggins Creek (RM 1.71) into a low-pressure pipeline that serves customers along Patton Valley Road. Historically, this pipeline also diverted water into the upper Tualatin River (at RM 63.1 and RM 64.3) to supplement low flows in this reach, but this has not been needed in recent years due to releases from Barney Reservoir.
Lake Oswego Canal Diversion: The Lake Oswego Corporation (LOC) diverts a portion of the Tualatin flow into the Lake Oswego Canal at RM 6.7. A headwork structure regulates the flow into this mile long canal that feeds into Lake Oswego. The Lake Oswego Corporation has several natural flow water rights, including water rights for hydropower generation, irrigation, and lake level maintenance. At RM 3.4, a combination diversion dam/fish ladder structure is used during low flow periods to elevate the Tualatin River enough to divert the flow into the canal. During most of the year, river elevation is adequate to allow diversion of the LOC water right; in the summer, however, flash boards may be installed to increase the water level. The dam is 4 feet high and causes the water surface of the Tualatin River to be elevated for about 25 river miles upstream. LOC has not installed flashboards since 2003. Flow in Lake Oswego Canal is monitored during the summer by a gaging station operated by the Oregon Water Resources Department.
Water diversions from the tributaries
Irrigation withdrawals: Water is obtained directly from some tributaries for irrigation by irrigators with natural flow water rights.

8 2009 Tualatin River Flow Managment Report
Tualatin River Water Management
Tualatin River Flow Management Technical CommitteeThe Tualatin River Flow Management Technical Committee provides a mechanism for the coordination and management of flow in the Tualatin River. The members of the committee are technical staff with detailed knowledge of the specific characteristics of flow in this river. The committee meets monthly from February through November. Meetings focus on the current status of the reservoirs. In addition, a variety of other water issues and any problems are discussed. Each member updates the committee on changes that could impact the flow management of the Tualatin. The communication, coordination and coopera-tion among the partner agencies has proven invaluable in managing the resource.
Data collection systemWater in the Tualatin Basin is monitored by gages on streams and flow meters on diversions and wastewa-ter treatment plant discharges. Stream gages are present along the mainstem Tualatin and all major tribu-taries that affect water distribution. Many of these monitors have telemetry, making the data available in real-time. Throughout the season, daily operations can be monitored by Clean Water Services (CWS), Joint Water Commission (JWC), Tualatin Valley Irrigation District (TVID), and the Lake Oswego Corpo-ration (LOC).
A coordinated information system was developed to provide flow information to all members of the com-mittee. Because use or release of water by any one of the entities can impact the other users, coordination of flow information is an important aspect of the committee's work. The data are collected by field staff from the cooperating entities or from the Corps of Engineers via telemetry.
The monitoring effort makes it possible to proactively manage storage, instream flows, and diversions so that minimum instream flow requirements and general compliance with water rights and storage agree-ments are met. It also makes the calculation of pollutant loads possible, when it is necessary for the Total Maximum Daily Load (TMDL) program. Monitoring includes temperature as well as flow at some sites. As water quality issues have come to the forefront, the monitoring system has provided information vital to understanding the Tualatin Basin, helped guide basin management, and been an excellent example of interagency cooperation. The members of the Flow Management Committee appreciate the efforts of the Oregon Water Resources Department (District 18 Watermaster), the US Geological Survey and others who provide data.
Some of the monitoring data for the Tualatin Basin can be accessed at the following web sites:
• Bureau of Reclamation data:http://www.usbr.gov/pn-bin/rtindex.pl?cfg=tual
• Jackson Bottom Wetlands Center data:http://www.jacksonbottom.org/index.php/monitoring-restoration/graphs-of-last-14-days/
• Oregon Water Resources Department data:http://apps2.wrd.state.or.us/apps/sw/hydro_near_real_time/
• USGS data:http://or.water.usgs.gov/tualatin/
Annual Tualatin Basin Flow Management ReportThis report is published annually and describes water management, accounting, storage, stream gaging, diversions, and effluent discharge for the Tualatin Basin. Annual reports dating from 1992 are available at:http://www.co.washington.or.us/Watermaster/SurfaceWater/tualatin-river-flow-technical-committee-annual-report.cfm

2009 Tualatin River Flow Management Report 9
RESERVOIR STATUS
Both Scoggins and Barney Reservoirs filled in 2009. The reservoir levels for 2009 and the reservoir filling histories are shown below.
10/1
10/1
6
10/3
1
11/1
5
11/3
0
12/1
5
12/3
0
1/14
1/29
2/13
2/28
3/15
3/30
4/14
4/29
5/14
5/29
6/13
6/28
7/13
7/28
8/12
8/27
9/11
9/26
60
50
40
30
20
10
0
Sco
gg
ins
Res
ervo
ir S
tora
ge
(tho
usan
ds o
f acr
e-ft)
Rule Curve
Water Years1981-2000, 2002–2008
Water Year 2009
Water Year 2001
10/1
10/1
6
10/3
1
11/1
5
11/3
0
12/1
5
12/3
0
1/14
1/29
2/13
2/28
3/15
3/30
4/14
4/29
5/14
5/29
6/13
6/28
7/13
7/28
8/12
8/27
9/11
9/26
25
10
0
15
20
5
Bar
ney
Res
ervo
ir S
tora
ge
(tho
usan
ds o
f acr
e-ft)
Water Year 2001
Water Year 2009
Water Years2002–2008

10 2009 Tualatin River Flow Managment Report
CLEAN WATER SERVICES
BY JAN MILLER, CLEAN WATER SERVICES
Water is released by Clean Water Services (CWS) from Scoggins and Barney Reservoirs to improve water quality in the Tualatin River. The Department of Environmental Quality issued a watershed-based NPDES Permit to Clean Water Services on February 26, 2004. In response to a petition for reconsidera-tion filed in 2004, the stormwater requirements of the permit were modified and the permit was reissued on July 27, 2005. The watershed-based permit provides Clean Water Services with a mechanism to offset a portion of the thermal load from its WWTPs with releases of stored water from the reservoirs. Stored water releases also provide operational flexibility to the WWTPs.
The reservoir releases during July and August are traded to mitigate approximately 65% of the thermal impacts of the wastewater treatment plants. Clean Water Services offsets the remainder of its thermal impact by planting riparian areas along the tributaries either directly within its service area or through a partnership with the Tualatin Soil and Water Conservation District on rural lands. During the rest of the summer, the water is released to offset the impact of sediment oxygen demand on the dissolved oxygen levels in the river. The dissolved oxygen levels in the river downstream of the wastewater treatment plants determine the ammonia limits for the wastewater treatment plants. The higher the dissolved oxygen levels are, the more operational flexibility the wastewater treatment plants have.
Low dissolved oxygen levels can be a water quality issue in the lower Tualatin River. During the early parts of the summer, photosynthetic production of oxygen by algae effectively offsets the oxygen con-sumed by the decaying substances in the sediment of the river (sediment oxygen demand). In the fall, however, oxygen production by algae is reduced as the days become shorter and it no longer offsets the oxygen consumption by sediment oxygen demand. This can lead to low dissolved oxygen levels. Increas-ing streamflow reduces oxygen consumption by sediment oxygen demand because it shortens the contact time between the river water and the river sediments.
2009 Water ReleasesClean Water Services initiated its release from Scoggins Reservoir on July 1, 2009. This was the sixth year with two primary goals. One goal was to release an average of 35 cfs for July and August for temper-ature trading. Clean Water Services released an average of 36.5 cfs during this period. The second goal was to have enough water left to mitigate the impact of sediment oxygen demand after the algal popula-tions declined in late summer and early fall. Clean Water Services release of Scoggins Reservoir water averaged 54.2 cfs from September 1, 2009 through October 27, 2009. Flow releases ceased on October 27 when Farmington flows reached 427 cfs and winter flow conditions started. Clean Water Services released a total 10,611 acre-feet from Scoggins Reservoir for the summer. This was 84% of its allocation.
Clean Water Services initiated a constant rate of release of 14 cfs from Barney Reservoir on September 1, 2009. It continued, unchanged, until October 30, 2009. Clean Water Services used a total of 1,677 acre-feet from Barney Reservoir. This was 100% of its allocation.
Clean Water Services released flow augmentation water for a total of 122 days in 2009. The combined average daily release (for days with releases) was 50.7 cfs. The amount of water available to and released by Clean Water Services during 2009 and monthly details of the water releases are summarized in the tables on the following page. Clean Water Services flow augmentation and treatment plant flow accounts for a significant fraction of flow in the lower Tualatin River, especially during the late summer and early fall period (see graphs on page 12).

2009 Tualatin River Flow Management Report 11
Natural flow credit
If the natural flow in the Tualatin River measured at West Linn is less than the flow target for the months of May, June, October and November, then Clean Water Services receives a natural flow credit of up to 4,282 acre-ft. Natural flow is calculated as the actual measured flow minus Clean Water Services released flow. The table below shows that the natural flow at West Linn exceeded the flow targets for these four months, and therefore, Clean Water Services was not entitled to a natural flow credit in 2009.
CLEAN WATER SERVICES WATER AVAILABILITY AND USE — 2009
ReservoirMaximum Available
(acre-ft)Available(acre-ft)
Total CWS Release(acre-ft)
Scoggins Reservoir Storage 12,618 12,618 10,611
Natural flow credit 4,282 0
Barney Reservoir Storage 2,000 1,667 1,667
Summer storage —
Total 18,900 14,285 12,278
Percent of available 86.0%
CLEAN WATER SERVICES WATER RELEASE SUMMARY 2009
Units May June July Aug Sept OctNov1-4
Total
Scoggins Release acre-ft 0 0 1,766 2,718 3,551 2,579 0 10,611
days 0 0 31 31 30 27 0 119
Barney Release acre-ft 0 0 0 0 833 833 0 1,667
days 0 0 0 0 30 30 0 60
Total Release acre-ft 0 0 1,766 2,718 4,385 3,412 0 12,278
Daily Average Release(for days with releases)
cfs 0 0 29 44 74 57 0 50.7
Measured Flows and Flow Goals for Tualatin River at Farmington (RM 33.3) – based on daily average
Measured minimum cfs 278 152 148 146 155 182 260 —
Measured mean cfs 997 217 182 185 201 259 359 —
Measured maximum cfs 2,060 318 262 334 351 489 426 —
Daily minimum flow goal cfs 150 150 150 180 180 180 180 —
BUREAU OF RECLAMATION NATURAL FLOW CREDIT 2009
Month
Mean Daily Measured Flow
at West Linn(cfs)
Mean Daily CWS Release
(cfs)
Calculated Natural Flow at
West Linn(cfs)
Target Natural Flow at West
Linn(cfs)
Maximum Possible CWS Natural Flow
Credit(cfs) [acre-ft]
CWS Natural Flow Credit
(cfs)
May 1194 0 1194 85 13 [798] 0
June 290 0 290 140 21 [1250] 0
October 291 57 233 95 16 [984] 0
November 1370 0 1370 110 21 [1250] 0
12 2009 Tualatin River Flow Managment Report
Tualatin River Flow at Farmington (RM 33.3) — 2009
5/31
6/14
6/28
7/12
7/26 8/9
8/23 9/6
9/20
10/4
10/1
8
11/1
0
100
200
400
800F
low
(cf
s)
*Flows without CWS releases were calculated as follows. (Constant travel times and a uniform evaporative loss of 0.25% per mile were assumed.)
+ Measured flow at West Linn– 0.981 x Durham WWTP flow from 3 days before– 0.909 x Rock Ck WWTP flow from 14 days before– 0.854 x CWS Scoggins Release from 17 days before– 0.809 x CWS Barney Release from 19 days before
+ Measured flow at Farmington– 0.988 x Rock Ck WWTP flow from the same day– 0.933 x CWS Scoggins Release from 2 days before – 0.888 x CWS Barney Release from 4 days before
300
500
Flow at Farmington without CWS releases = Flow at West Linn without CWS releases =
600
700CWS release from Scoggins Reservoir
CWS Release from Barney Reservoir
Rock Creek WWTP effluent
Natural flow
Measured flow at Farmington (RM 33.3)Calculated flow without CWS releases*
5/31
6/14
6/28
7/12
7/26 8/
9
8/23 9/
6
9/20
10/4
10/1
8
11/1
Tualatin River Flow at West Linn (RM 1.75) — 2009
Flo
w (
cfs)
0
100
200
400
800
300
500
600
700CWS release from Scoggins Reservoir
CWS Release from Barney Reservoir
Rock Creek WWTP effluent
Durham WWTP effluent
Measured flow at West LinnCalculated flow without CWS releases*
Natural flow

2009 Tualatin River Flow Management Report 13
Historical perspective In 1987, Clean Water Services begin managing the release of its water with the goal of maintaining a monthly average of 150 cfs at the Tualatin River at Farmington. Work by the United States Geological Survey in the early 1990's indicated that it was more important to have higher flows in the fall to maintain dissolved oxygen levels than in the early summer to prevent algal blooms. The flow goals were changed to maintaining 120 cfs in the early summer, 150 cfs in August and then 180–200 cfs from September until the winter flows start. Winter flows are defined as flows that exceed a 7-day median of at least 350 cfs. In 2004, an additional goal of releasing water in July and August for temperature trading was added. In 2008, as a result of the Rock Creek WWTP mixing zone study, the goal was increased to 150 cfs through August. The following table shows the history of Clean Water Services releases from Scoggins Reservoir.
CLEAN WATER SERVICES — SCOGGINS RESERVOIR RELEASES
Year Start Date End DateTotal
Release Days
Total Release(acre-ft)
Average per Release Day
(cfs)
Minimum Daily Flow at Farmington (RM 33.3)
(cfs)
1987 6/9 11/30 175 *16,722 48.2 63
1988 7/2 11/4 126 *15,071 60.3 106
1989 6/27 11/15 141 *16,586 59.3 112
1990 7/12 11/1 113 11,889 53.0 124
1991 7/12 11/4 116 13,024 56.6 125
1992 6/5 11/19 168 12,730 38.2 73
1993 7/3 12/1 150 11,486 38.6 98
1994 6/21 10/27 129 10,917 42.7 105
1995 6/24 11/8 138 9,824 35.9 118
1996 7/27 11/10 114 10,952 48.4 146
1997 7/4 10/2 91 6,716 37.2 154
1998 8/12 11/7 87 9,407 54.5 146
1999 7/27 11/12 109 12,001 55.5 156
2000 7/21 11/27 130 15,275 59.2 152
2001 9/25 11/14 50 2,403 24.0 88
2002 6/12 11/9 151 12,618 42.0 103
2003 7/11 11/17 130 11,765 52.4 107
2004 7/1 11/2 125 8,650 34.9 130
2005 7/8 10/31 116 9,918 43.1 153
2006 7/1 11/3 126 9,634 38.5 148
2007 7/3 11/13 119 10,134 42.9 148
2008 7/1 11/4 127 11,896 47.2 162
2009 7/1 10/27 119 10,614 45.0 147
*During these years, Bureau of Reclamation allowed Clean Water Services to release its entire allocation (storedand natural flow.

14 2009 Tualatin River Flow Managment Report
Water is released from Barney Reservoir at a constant rate during the late summer to supplement the water released from Scoggins Reservoir. The following table shows the historic use of Barney Reservoir releases. Clean Water Services owns 10% of the 20,000 acre-foot reservoir. Each year the Joint Water Commission decides how much water is to be released for the Department of Fish and Wildlife. This, plus the dead pool, is subtracted from the available water. The remainder is allocated to the owners.
CLEAN WATER SERVICES — BARNEY RESERVOIR RELEASES
Year Start Date End DateTotal
Release(acre-ft)
Daily Release Rate
(cfs)Comment
1998 7/12 8/27 2,779 24.6 extra water released to draw down reservoir
1999 9/1 10/19 1,025 10 10 cfs also released 6/4–6/10
2000 9/8 10/23 1,461 18 —
2001 9/18 10/29 1,416 171000 acre-ft purchased in addition to allocation;reservoir did not fill; 4,000 acre-ft held in reserve
2002 8/26 10/24 1,667 14 —
2003 8/15 10/14 1,742 14 —
2004 9/1 11/2 1,777 14 —
2005 9/1 11/8 1,874 14 miscommunication about end date; extra water released
2006 9/1 11/3 1,638 14 —
2007 9/1 10/30 1,667 14 —
2008 9/4 10/31 1,611 14 —
2009 9/1 10/30 1,667 14 —

2009 Tualatin River Flow Management Report 15
JOINT WATER COMMISSION & JOINT BARNEY COMMISSION
BY NIKI IVERSON, WATER RESOURCES MANAGER, JOINT WATER COMMISSION/CITY OF HILLSBORO
IntroductionOver 300,000 people in Washington County receive at least a portion of their water from the Joint Water Commission (JWC). JWC provides water to its member agencies: the Cities of Hillsboro, Forest Grove, Beaverton and Tigard, and the Tualatin Valley Water District. JWC also provides wholesale service directly to the City of North Plains, and, indirectly, to Cornelius, Gaston, and the LA Water Cooperative as wholesale customers of Hillsboro. In 2009, JWC's annual water production was 31.02 million gallons per day. During the peak periods of the summer, production increases substantially. In 2009, daily produc-tion peaked at 62.1 million gallons per day. JWC's highest peak production of 66.8 million gallons per day occurred in 2008.
JWC's water treatment plant is supplied with water from the nearby Tualatin River. Water is pumped from an intake facility at Spring Hill that was constructed by the Bureau of Reclamation and is shared with the Tualatin Valley Irrigation District (TVID). Flows in the Tualatin River are supplemented during the sum-mer with water from impounds at Scoggins Dam (Hagg Lake) and Barney Reservoir. The Barney Reser-voir Joint Ownership Commission (BRJOC) owns Barney Reservoir. BRJOC includes the Cities of Hillsboro, Forest Grove and Beaverton, the Tualatin Valley Water District, and Clean Water Services.
The JWC water treatment plant uses conventional dual media filtration, along with disinfection, to pro-duce high quality potable water. Treated water is pumped from the plant to the member agencies either directly through finished water pipelines leaving the plant or via the Fern Hill Reservoirs. Fern Hill Reser-voirs include two 20 million gallon covered concrete tanks, for a total of 40 million gallons of storage, located about one-third mile to the east of the treatment plant. The JWC finished water pipelines include master meter and pressure reducing stations at the connection points to the member agencies.
2009 OperationsJWC completed several notable projects in 2009 including a Transmission Line Inspection Project, Seis-mic Evaluation and Assessment of the JWC water treatment plant, and several maintenance and replace-ment projects. JWC also submitted an updated Water Management and Conservation Plan to the Oregon Water Resources Department for review to meet Oregon Administrative Rules 690-086 and 690-315 requirements to maintain the JWC's water right permits.
Water Quality Monitoring–Barney Reservoir: In 2009, BRJOC staff began full implementation of the water quality monitoring program as recommended in a study completed by Portland State University the previous year. The baseline water quality and algal programs (first and second levels) were selected by BRJOC to begin in 2008 and 2009. BRJOC started the water quality monitoring of the streams and tribu-taries surrounding Barney Reservoir in 2008. The reservoir water quality monitoring began in Fall 2009. The baseline water quality monitoring program includes the minimum level recommended by the PSU team to gain a basic understanding of the water quality dynamics in the reservoir and related streams or tributaries. The algal bloom monitoring program will be primarily event driven, but may also include some investigations of algal dynamics in the reservoir during select seasons or events. The data collected will also be compared to water quality standards and historic background information included in the plan completed by PSU.
Source Water Capture Efficiency: JWC continued to maximize the capture of our source waters through improved coordination of the operation of Fern Hill Reservoirs with JWC member system demands, and through careful tracking of individual member use of their stored water. The 2009 program had continued success, as the JWC pump station recovered 96% of the water available at our intake from natural flow rights and releases from our impounded supplies.

16 2009 Tualatin River Flow Managment Report
SUMMARY OF 2009 RELEASE SEASON
DescriptionBeginningBalance(acre-ft)
Amount Released(acre-ft)
Ending Balance(acre-ft)
Average Release(acre-ft/day)
Breakdown by Reservoir
Scoggins 13,500.00 9,203.44 4,296.56 68.68
Barney (M&I) 14,886.00 4,722.71 10,163.29 35.24
Total 28,386.00 13,926.15 14,459.85 103.93
Breakdown by Agency – Including Leased Allocations
Hillsboro 9,420.40 4,269.70 5,150.70 31.86
Forest Grove 2,704.50 1,135.26 1,569.24 8.47
Beaverton 6,672.10 4,161.09 2,511.01 31.05
TVWD 9,589.00 4,360.10 5,228.90 32.54
Tigard — — — —
Total 28,386.00 13,926.15 14,459.85 103.93
Reservoir release detail after reallocation for leases (total released by storage ownership):
Reservoir Release (acre-ft) Average Release
(acre-ft/day)Barney Scoggins Total Release
Hillsboro 938.60 3,691.56 4,630.16 34.55
Forest Grove 413.50 1,822.10 2,235.60 16.68
Beaverton 907.65 3,689.78 4,597.43 34.31
TVWD 2,462.96 — 2,462.96 18.38
Total 4,722.71 9,203.44 13,926.15 103.93
North Plains usage is reflected in the figures for JWC partners:
COMPARISON OF STORED WATER RELEASES— 2007–2009
YearBegin Date
EndDate
Days Regulated
Use
Stored Water Release (acre-ft) Average Release
(acre-ft/day)Barney Scoggins Total
2009 6/14/2009 10/26/2009 134 4,722.71 9,203.44 13,926.15 103.93
2008 6/18/2008 10/31/2008 135 4,407.34 10,163.45 14,570.79 107.93
2007 5/25/2007 11/13/2007 155 5,543.88 10,371.72 15,915.60 102.68
ESTIMATED WATER CAPTURE RATES (THROUGH 10/26/2009)Peak production for season: 190.51 acre-ft/day
Average production for season: 117.38 acre-ft/day
Stored water released: 13,926.15 acre-ft
WRD loss factor: 462.22 acre-ft
Natural flow: 3,427.49 acre-ft
Total water available to be pumped: 16,891.42 acre-ft
Raw water pumped at Spring Hill Pump Station: 15,708.55 acre-ft = 93.00% of available
Water produced through Slow Sand Filter Plant: 457.93 acre-ft
Total water pumped for regulated season: 16,166.48 acre-ft = 95.71% of available
Finished water produced: 15,845.81 acre-ft = 96.42% of available
Total production: 16,303.73 acre-ft = 96.52% of available

2009 Tualatin River Flow Management Report 17
LAKE OSWEGO CORPORATION
BY MARK ROSENKRANZ, WATER RESOURCE SPECIALIST
IntroductionThe Lake Oswego Corporation (LOC), a non-profit organization, owns and manages Oswego Lake, a 168-hectare (403 acre) reservoir located 10 miles south of Portland, Oregon. LOC was formed in 1942 when the Oregon Iron and Steel Company, then owner of the land around the Lake, deeded to LOC the land, three dam structures, and all water rights. The original dam was constructed in 1871 and later upgraded in 1921. Oswego Lake is a private water body whose primary water right is hydropower genera-tion. Secondary uses include irrigation, aesthetic viewing, contact recreation, fishing, and boating.
Oswego Lake and Watershed MorphologyThe original natural lake, called Waluga, was formed 10,000 years ago by the Missoula glacial floods which altered the old Tualatin River channel. Today, the Lake has three basins: West Bay, the Main Lake, and Lakewood Bay. There are also two shallow, man-made canals, Blue Heron Canal and Oswego Canal. Oswego Canal is the 2.4-km conduit from the Tualatin River (RM 6.7). Total lake surface area and vol-ume is 1.63 km2 (403 acres) and 12.7 x 10⁶ m3 (10,300 acre-feet). Shoreline length, including bays and canals, is 18.62 km (11.56 mi.). Oswego Lake has a 5.08-km (3.15-mi) fetch and a narrow 0.56-km width (0.34-mi). The hydraulic residence time is 390 days.
Oswego Lake's two watersheds include the natural, 7.5-mi2 urban basin around the Lake (10:1 watershed to lake-area ratio) and the larger 700-mi2 Tualatin River basin (1,000:1 ratio) when the LOC Headgate is opened. Major inflows from the watershed include Springbrook Creek, Lostdog Creek, Blue Heron Creek, and 70-plus storm drains from the City of Lake Oswego.
LOC Water Rights and Contracts
Hydropower Generation: The primary hydropower water right is 57.5 cubic feet per second (cfs) obtained in 1906 that allows year around diversion. To guarantee this flow during the dry season, LOC owns and operates a diversion dam located downstream of the Oswego Canal (RM 3.4). Flaps are erected on an “as needed” basis. In 2009, no flaps were used.
Irrigation: A contract between LOC and the Bureau of Reclamation (Oct 20, 1972) provides for up to 500 ac-ft from Scoggins Reservoir for irrigation use during March through November. The largest irriga-tor on the Lake is the Lake Oswego Country Club (approximately 175 acre-feet).
Maintenance/Evaporation: LOC also has a maintenance/evaporation water right of 3.36 cfs dating from 1985. This water can be diverted between September 16th and July 30th.
Oswego Lake Watershed ManagementTo provide long-term water quality solutions and to be proactive in preserving the quality of the Lake, watershed activities are a major part of the LOC management plan. LOC continues to monitor the Lake and watershed to better understand the ecosystem. Future plans are:
• Dredge in 2010• Spillway modification in 2010• Oswego Lake Watershed Council in 2010• Continue to implement the integrated aquatic plant management plan involving hand pulling, harvest-
ing, and herbicides• Continue educating watershed residents about water quality impacts• Assess conditions in bays and canals and propose localized solutions• Work with the City to improve surface water runoff to the Lake• Maximize the water quality improvements with the 2-layer lake aeration system• Continue to use alum (aluminum sulfate) as a phosphorus reduction tool.

18 2009 Tualatin River Flow Managment Report
2009 Oswego Lake Management SummaryWater quality improvements and safety are the top priorities for LOC. The goal for the annual LOC Water Quality Management Plan is to reduce cyanobacteria productivity and maximize the aesthetic value of the Lake by focusing on flow management, water quality treatment, and macrophyte issues.
Water Quality: In 2009, the Oswego Lake water quality monitoring program included six sites where water clarity, nutrient content, biological productivity, and chemical profiles were measured. Monitoring was conducted weekly from June through September and bi-weekly from October through May.
Algae Control: Filamentous algae are a persistent problem in Oswego Canal. The high nutrient condition and shallow water promotes early growth that continues into early summer. Algae in the main part of the lake continues to be dominated by cyanobacteria, but in 2009 the bloom peaked in October. Several con-trol methods have reduced the severity in previous years, but substantial control will not occur until nutri-ents are reduced. Our phosphorus control program reduced the summer average total phosphorus to below 20 µg/L which has helped keep algae under control.
In 2009, LOC surface applied 43,550 gallons of liquid alum and injected an additional 27,720 gallons. Surface applications occurred in Lakewood Bay, West End, Main Lake, and the Oswego Canal. Alum injectors are installed in Lakewood Bay, Half Moon Bay, West Bay, Oswego Canal, and Blue Heron Canal. Considering the nutrient rich runoff contributed from the watershed and nutrient rich water enter-ing the lake via the Tualatin River and a spring near our headgate it will be necessary to continue alum treatments into the near future.
Macrophyte Control: In 2009, herbicide applications were used only to control non-native aquatic weeds in Lakewood Bay, Half Moon Bay, Oswego Canal, Blue Heron Canal, West Bay, Lost Dog delta, Springbrook delta, and the northern shoreline. A spring application of fluridone to Lakewood Bay helped reduce the amount of invasive Potamogeton crispus (curlyleaf pondweed) that dominates this area. Later applications of diquat to West Bay and spots along the northern shore helped control patches of curlyleaf. Egeria densa (Brazilian elodea) was only found in one small patch in the west end this year.
In addition to herbicides, macrophytes were controlled by an aquatic weed harvester and diver hand-pull-ing. We did not use a diver to hand pull vegetation in 2009.
Tualatin River Flows: Minimal Tualatin river flows were used to keep the lake full. River water contains high concentrations of phosphorus and sediment, making reduced river flow into Oswego Lake desirable.
2009 OSWEGO LAKE WATER QUALITY SUMMARY AVERAGES
Location SeasonChlorophyll-a
(µg/L)Total P(µg/L)
SRP(µg/L)
Total N(µg/L)
Secchi(m)
Turbidity(NTU)
Lakewood Bay Annual 15.1 34 2 421 2.3 2.1
Summer 11.0 25 0 408 2.1 2.2
Main Lake Annual 10.5 28 7 435 3.6 1.0
Summer 6.1 16 2 336 4.1 0.3
West Bay Annual 10.1 59 10 1136 1.2 3.5
Summer 9.1 51 2 800 1.2 1.6
Oswego Canal Annual 4.8 117 29 3672 0.7 4.6
Summer 6.3 112 24 4045 0.7 0.8
Blue HeronCanal
Annual 5.5 45 6 694 1.0 1.1
Summer 3.9 21 1 540 1.1 0.4
Outlet Annual 9.0 24 2 379 3.7 1.0
Summer 5.7 19 1 289 3.6 0.4
Bold = highest average during the summer; Underline = lowest average during the summer Summer=June–SeptemberAbbreviations: Total P = Total Phosphorus, SRP = Soluble Reactive Phosphorus, Total N = Total Nitrogen, Secchi = Secchi depth, Turb = Turbidity; ug/L = micrograms
per liter, m = meters, NTU = nephelometric turbidity units, C = Celsius

2009 Tualatin River Flow Management Report 19
OREGON WATER RESOURCES DEPARTMENT
BY DARRELL C. HEDIN, WATERMASTER, DISTRICT 18
IntroductionThe District 18 Watermaster's Office is part of the Field Services Division of the Oregon Water Resources Department (OWRD) in cooperation with Washington County, and is responsible for water supply man-agement within the Tualatin, Lake Oswego, and Lower Willamette Drainage Basins in northwestern Ore-gon. The Mission of OWRD is, “To serve the public by practicing and promoting responsible water management.”
Water Distribution and EnforcementThe Watermaster functions as a local contact for landowners, elected officials, and watershed councils, as well as other governmental agencies at the local, state and federal level. Duties include monitoring and measuring streamflow, conducting reservoir inspections, performing well inspections and collecting groundwater level data. Information is also provided to landowners and others on water rights and Oregon Water Law. The Watermaster is also responsible for regulating water use during times of shortage. Occa-sionally, Watermasters take more formal actions to obtain the compliance of unlawful water users or those who are engaged in practices that waste water.
Water LawsOregon's water laws are based on the principle of prior appropriation. This means the first person to obtain a water right on a stream is the last to be regulated off in times of low streamflows. In water-short times, the water right holder with the oldest date of priority can demand the water specified in their water right regardless of the needs of the junior users. If there is a surplus beyond the needs of the senior right holder, the water right holder with the next oldest priority date can take as much as necessary to satisfy needs under their right and so on down the line until there is no surplus or until all rights are satisfied. The date of application for a permit to use water usually becomes the priority date of the right.
East of the Mississippi, the riparian doctrine usually applies. Under the riparian doctrine, only landowners with water flowing through their property have claims to the water. The prior appropriation doctrine is the basis of water law for most of the states west of the Mississippi River. In Oregon, the prior appropriation doctrine has been law since February 24, 1909, when passage of the first unified water code introduced state control over the right to use water. Before then, water users had to depend on themselves or local courts to defend their rights to water.
Generally, Oregon law does not provide a preference for one kind of use over another. If there is a conflict between users, the date of priority determines who may use the available water. If the rights in conflict have the same date of priority, then the law indicates domestic use and livestock watering have preference over other uses. However, if a drought is declared by the Governor, the Department can give preference to stock watering and household consumptive purposes, regardless of the priority dates.

20 2009 Tualatin River Flow Managment Report
New Tualatin Basin Streamflow Website for 2009In an effort to consolidate and standardize near real-time streamflow data, the Water Resources Depart-ment displays all the Tualatin Basin information at:
http://apps2.wrd.state.or.us/apps/sw/hydro_near_real_time/Default.aspx
This site allows for rapid updates to streamflow data as new information is obtained in the field. All rat-ings which characterize the elevation/discharge relationship are now generated by qualified hydrographic staff in Salem for release to the public. This change has also provided a quicker assessment of year-end record work up for the Flow Management Technical Committee Annual Report.
Regulatory Summary 2009• Early streamflow conditions held up well throughout the spring leading to a normal time period to
begin regulation in mid June.• Even though summer conditions were hot and dry, Tualatin Basin streams did not drop to critical lev-
els in August requiring further regulation except for upper McKay Creek.• Rains returned early and all surface water regulation was lifted at the end of October.
2009 WATER RIGHTS REGULATION SUMMARYDate On/Off Regulatory Activity River Mile Priority Date
6/17/2009 Off City of Beaverton (P-45455, 7/15/1980) – Tualatin RiverCity of Forest Grove (P-40615, 4/28/1976) – Tualatin RiverCity of Hillsboro (P-46423,2/6/1974) – Tualatin RiverCity of Hillsboro (P-50879, 6/9/1988) – Scoggins Creek
>56.09 2/5/1974
6/30/2009 Off TVID (P-35792, 2/20/2963) – Scoggins Creek n/a 2/20/1963
6/30/2009 Off Tualatin River & tributaries above Spring Hill Pump PlantTualatin River — 11, 2/20/1963Gales Creek — 62, 9/24/1963Carpenter Creek — 4, 7/10/1967Scoggins Creek — 3, 7/28/1975
> 56.09 2/19/1963
7/28/2009 Off Tualatin River & tributaries at confluence with Dairy Ck & belowDairy Creek — 5East Fork Dairy Creek — 13West Fork Dairy Creek — 11Fanno Creek — 1McKay Creek — 6Tualatin River — 5
<44.74 >10/8/1976
8/6/2009 Off McKay Creek & tributaries above Northrup RoadMcKay Creek — 6East Fork McKay Creek — 2
=44.73=2.26>15.5
Between 5/25/1966 and
10/8/1976
8/19/2009 Off East Fork Dairy Creek & tributaries above RM 13East Fork Dairy Creek — 12, 3/6/1967
=44.73=10.56
>13
Between 5/25/1966 and
10/8/1976
8/21/2009 Off City of Hillsboro (P-2443, 5/1/1915) – Sain Creek (2 cfs)
10/19/2009 On City of Hillsboro (P-2442, 5/1/1915) – Sain CreekCity of Hillsboro (P-1136, 1/22/12) – Sain Creek(total of 5 cfs)
10/26/2009 On City of Beaverton (P-45455, 7/15/1980) – Tualatin RiverCity of Forest Grove (P-40615, 4/28/1976) – Tualatin RiverCity of Hillsboro (P-46423,2/6/1974) – Tualatin RiverCity of Hillsboro (P-50879, 6/9/1988) – Scoggins Creek
>56.09 2/5/1974
10/26/2009 On TVID (P-3579, 2/20/1963) – Scoggins CreekTVID (R-5777, 2/20/1963) – Scoggins Creek
n/a 2/19/1963

2009 Tualatin River Flow Management Report 21
Watermaster, District 18 Stream Gaging Summary 2009
WATERMASTER DISTRICT 18 GAGING STATIONS FOR 2009Station Number
Stream Stream Mile Latitude Longitude Type
14206200 Dairy Creek at Hwy 8 near Hillsboro, OR 2.06 45°30’38”N 123°06’56”W *Logger
14205480 E. Fk. Dairy Creek at Dairy Creek Rd near Mountaindale, OR 12.33 45°40’32”N 123°03’54”W Staff
14205000 W. Fk. Dairy Creek @ Banks, OR 7.7 45°37’26”N 123°06’59”W Staff
14205160 W. Fk. Dairy Creek @ Evers Rd near Roy, OR 1.96 45°34’34”N 123°05’34”W Staff
14204530 Gales Creek @ Old Hwy 47 near Forest Grove, OR 2.36 45°30’39”N 123°06’56”W *Logger
14204540 Gales Creek @ Clapshaw Hill Rd near Gales Creek, OR 12.36 45°35’39”N 123°12’38”W Staff
14207000 Oswego Canal near Lake Oswego, OR 6.7 45°23’18”N 122°43’10”W Logger
14202920 Sain Creek above Hagg Lake near Gaston, OR 1.6 45°28’50”N 123°14’40”W Logger
14202850 Scoggins Creek above Hagg Lake near Gaston, OR 8.0 45°30’06”N 123°15’06”W *Logger
14202980 Scoggins Creek below Hagg Lake near Gaston, OR 4.8 45°28’10”N 123°11’56”W Logger
14202860 Tanner Creek above Hagg Lake near Gaston, OR 1.6 45°30’21”N 123°13’10”W Staff
14206500 Tualatin River @ Farmington, OR 33.3 45°26’58”N 122°57’02”W *Logger
14202510 Tualatin River @ Gaston, OR 62.3 45°26’21”N 123°07’85”W *Logger
14204800 Tualatin River @ Golf Course Rd near Cornelius, OR 51.5 45°30’08”N 123°03’22”W *Logger
14202450 Tualatin River below Lee Falls near Cherry Grove, OR 70.7 45°30’21”N 123°13’06”W *Logger
14206295 Tualatin River @ Rood Bridge Rd near Hillsboro, OR 38.4 45°29’24”N 122°57’06”W *Logger
14206956 Tualatin River @ Tualatin (station number formerly 14206960) 8.9 45°23’14”N 122°45’46”W *Logger
*Telemetry

22 2009 Tualatin River Flow Managment Report
SCOGGINS DAM/HENRY HAGG LAKE
BY BERNIE BONN, WALLY OTTO, AND TOM VANDERPLATT
Scoggins Dam/Henry Hagg Lake is located on Scoggins Creek in the upper part of the Tualatin Basin. Scoggins Dam is an earthfill dam constructed during 1972–75 to store water during the winter for summer and fall use. The Dam is owned by the U.S. Bureau of Reclamation (BOR) and managed by the Tualatin Valley Irrigation District (TVID). Stored water from Hagg Lake is used for irrigation, municipal and industrial use, and flow augmentation in the Tualatin Basin to support water quality and protect fish and wildlife.
Three tributaries flow into Hagg Lake—Sain, Scoggins and Tanner Creeks. Flows in Sain and Scoggins Creeks are monitored by Oregon Water Resources Department gages; flow in Tanner Creek is monitored by daily readings of a staff plate by TVID personnel. Outflow is measured by a BOR stream gage in Scog-gins Creek at RM 4.8. Oregon Water Resources Department maintains the rating curves for Tanner Creek and for Scoggins Creek at RM 4.8.
Scoggins Dam stores 53,640 acre-feet of water in Henry Hagg Lake as active storage—the amount of water that can be moved in or out of the reservoir between the intake structure and the top of the spillway gates. Another 7,000 acre/feet of stored water exists below the intake structure that is not engineered to be removed. It is for the protec-tion of fish if the lake were to be drafted down completely to the intake structure.
Scoggins Dam is authorized by the U.S. Congress to provide flood control for communities located down-stream, including Gaston, Cornelius and Forest Grove. The dam controls runoff from a 39 square mile watershed (about 5% of the Tualatin Basin). From November to April, 20,000 acre-feet are designated for flood control storage. The dam does not generate electricity.
During the summer months, recre-ation is a major activity at Hagg Lake and the surrounding area. Washing-ton County maintains and operates the 2,851 acre Scoggins Valley Park/Henry Hagg Lake recreational facility. The park includes picnic areas, hiking trails, two boat launch-ing facilities, and observation decks for bird and wildlife watching; the lake is stocked for fishing. Most of the park’s facilities were designed to be accessible for disabled visitors. The park is open from the first Satur-day in March through the last Sunday before Thanksgiving and is for day-use only.
ALLOCATION OF WATER FROM SCOGGINS RESERVOIR
Contracted To Water UseAvailable Volume
ac-ft as percent
Tualatin Valley Irrigation District Irrigation(up to 17,000 acres)
27,022 50%
Joint Water CommissionCity of BeavertonCity of Forest GroveCity of Hillsboro
Municipal and industrial
13,5004,0004,5005,000
25%
Clean Water Services Instream water quality
12,618 24%
Lake Oswego Corporation Irrigation 500 1%
Total 53,640 100%
http://www.co.washington.or.us/Support_Services/Facilities/Parks/Hagglake/index.cfm

2009 Tualatin River Flow Management Report 23
History of the Tualatin ProjectOn August 18, 1998, the Hillsboro Argus published a column titled “In Other Days” written by Bill Chidester. The following is a portion of the column he wrote titled “69 days without rain in 1958.”
“Henry Hagg said the drought was the worst he'd seen in 20 years. That summer of 1958, Washington County would go without rain for 69 straight days, until Sept. 9. At Farmington Bridge, the Tualatin River was a foot wide and three inches deep. At other sections, the river was bone dry.
W.T. and Ferd Putnam ran out of irrigation water for the first time in 30 years. Up river at Rood Bridge, Delane Fry had no water for two weeks. The neighbors' cows wandered freely in the river bed. River banks were littered with dead trout and fried crawfish. Crops suf-fered. Corn yield was down a ton per acre from 1957. Heat loving insects were destroying broccoli fields.
“It was high-time,” said Hagg, “to take the U.S. Bureau of Reclamation up on its offer to build a dam and reser-voir in Scoggins Valley.” The project would cost $11 million and serve 25,000 acres. Hagg and other leaders of the Tualatin Valley Irrigation Improvement District would campaign vigorously to win farmers' support.
The dream finally came true 17 years later. Scoggins Dam and Henry Hagg Lake began operating in 1975. But by that time, the cost had shot up to $45 mil-lion. Ironically in that dry summer, the Birds Eye Cannery reported $1 million damage to the area's strawberry crop caused by a torrential rain on June 6."
It should be noted again that when the Project was eventually authorized by the United States Congress, the total acreage allowed to be served with Project water by the Tualatin Valley Irrigation District was trimmed back to 17,000 acres, not the 25,000 as originally desired.
This record of 1958 has been confirmed by former TVID board member and chairman, Remi Coussens, who has farmed and operated a dairy for years near McKay Creek north of Hillsboro. In Remi's words “The creek was so dry, even the crawdads had to carry canteens!” The discharge of the Tualatin River at West Linn to the Wil-lamette River frequently was less than 10 cfs dur-ing the summer and early fall in the 1950s and 60s. Water from the Project changed the reliabil-ity factor for all users of water. It was not just irri-gation that was putting pressure on the limited water supply. More people and industry moving into the Tualatin Valley were requiring a depend-able source of municipal and industrial water even during periods of drought. In addition, the ecological health of the Tualatin River and its tributaries, including resident fish and wildlife,
were suffering greatly. The Project brought a reliable supply of water to maintain flows in a river system that was already exceeding its limits for a healthy river in the 1950's.
Henry Hagg (left) and Ferd Putnam (right) at Tualatin River (RM ~ 25–33), circa 1959
Debris in Tualatin River (RM ~ 25–33) circa 1959

24 2009 Tualatin River Flow Managment Report
Future of the Project
Tualatin Basin Water Supply Partnership: Water resource agencies in the Tualatin Basin have sought a sustainable source of water that would supply the region's homes, farms, businesses, and environment for the next 50 years. As Washington County continues to grow and develop, demand for water in the Tualatin Basin is expected to double by 2050, which would require an additional 50,000 ac-ft of water for a total of 100,000 acre-ft of water per year.
In 2001, the water resource agencies formed a partnership to explore and compare alternatives for provid-ing the additional water needed to meet future needs. The Partnership includes Clean Water Services, the Cities of Hillsboro and Beaverton, and the Tualatin Valley Water District, as well as the U.S. Bureau of Reclamation, the owner of Scoggins Dam. Tualatin Valley Irrigation District (TVID), which manages the dam, is not a member the Partnership because it is limited to serving 17,000 acres of irrigated land and has enough water to serve its patrons in all but possibly a severe drought. TVID is an active participant in the proceedings, however, because protecting its interest in the current stored water supply is critical.
After studying many different options, in 2006 the Partners selected two alternatives for further study: 1) raising Scoggins Dam by 40 ft with a new raw water pipeline and pumpback, and 2) raising Scoggins Dam by 25 ft with a new raw water pipeline and pumpback plus expansion of the Willamette River Water Treatment Plant. More than 7 years of analysis have provided a wealth of technical information about rais-ing Scoggins Dam.
Title Transfer: In 2007, the Partners began studying the possibility of a title transfer of Scoggins Dam and related facilities from federal ownership to local ownership. Originally, a full transfer was proposed, which would include not just Scoggins Dam, but the entire TVID water delivery system, pumping plants and office, as well. Under a full transfer, all partners in the existing Project must be made “whole” mean-ing that each partner would retain all benefits of the existing Project. Therefore, the cost of electrical power for TVID water delivery would have to be paid (“made whole”) each year by the Partners in the new project. Currently, TVID receives Federally-subsidized power at a cost of $80,000. At current retail rates, this power would cost $400,000. The current proposal is for a “partial title transfer” which would include only Scoggins Dam and the Spring Hill Pump Plant. In a partial transfer, the Partners would own the dam without having to pay the retail power rate for TVID’s electrical use. A decision on title transfer cannot be made until the costs to all parties are well understood and evaluated. The Oregon Congressional delegation successfully secured $300,000 for fiscal year 2009 to support the water supply project and work on the title transfer.
Seismic Issues: In 2009, BOR conducted a risk analysis for seismic issues on Scoggins Dam. The studies included a risk assessment of embankment or spillway problems in the event of a magnitude 9 earthquake with a 200 second duration (a Cascadia subduction zone earthquake). The analysis showed that the risk exceeded BOR’s criteria. BOR will be conducting a Corrective Actions Alternatives Study (CAAS) to determine the modifications needed to reduce risk. Potential options include, but are not limited to, replacement of the dam and reservoir storage restrictions. The CAAS work plan is due to be started in summer 2010. Under the current BOR Safety of Dams program, seismic upgrades will be paid partially by the Federal Government and partially by entities who own water in the reservoir in proportion to their water rights.
The Partners contracted with Kleinfelder Engineering to consider dam raise alternatives for the project in light of the seismic concerns. The alternatives included a new higher dam downstream of the existing structure.The study also included a no-raise replacement dam option to determine the estimated cost of the federal obligation and provide a cost comparison with a new downstream dam. The seismic issues have delayed the timelines for the water supply expansion and have affected the potential cost. BOR and the Partners will be collaborating to address the seismic issues while increasing long range water supply.
More information: More information about the Tualatin Basin Water Supply Project is available at:www.tualatinbasinwatersupply.org

2009 Tualatin River Flow Management Report 25
2009 Water UseWater year 2009 marks 35 years since Scoggins Dam began storing and releasing water for downstream beneficial use. A total of 36,313 acre-feet were delivered in 2009 bringing the total delivery from the Project to more than 1,092,000 acre-feet.
Regulation of natural flow began for the Joint Water Commission on June 13, 2009; regulation for TVID began on June 23, 2009. Water delivery to two golf courses started on April 15, 2009 under a contract with the Bureau of Reclamation. This water was delivered from the TVID allocation as long as it was available. Water delivery for Lake Oswego Corporation began on July 22, 2009. With the exception of TVID, all users were permitted to return to natural flow use in the Tualatin River at the end of October. TVID continued using a minimal amount of storage water until the end of November as permitted by the Oregon Water Resources Commission.
Events in 2009
Drill Crews on Project: Additional soil testing down stream of the current dam was conducted beginning in mid-November of 2008 as part of the Partner’s Dam Raise Appraisal Study. The extra drilling was done to determine soil conditions in the area of a footprint for the foundation of an entirely new dam down-stream of the current dam. The study was needed to evaluate an alternative site if raising the height of the current dam is not feasible due to seismic concerns.
Coho Salmon Return: Five coho salmon were found in Scoggins Creek downstream from the dam on November 20, 2008, and are being allowed to establish a new run in Scoggins Creek. The hens built redds (nests) and laid their eggs which were quickly fertilized by males. A 1,000 ft long reach of stream channel provides excellent spawning gravels for the fish. The gravel came into Scoggins Creek during the 1996 flood from the small channel that drains the Knox Draw located just beyond and across from the Fee Entry Booth of the Park. The redds were closely monitored by the ODFW Regional Fish biologist. After hatch-ing, it was learned that many used the old Scoggins Creek channel for protection. All necessary releases from the dam were made in stages over the winter in an attempt to protect the redds. The minimum release was increased to the upper 20 cfs range in order to maintain enough water to keep the redds covered. Many more adults returned in November of 2009 to begin and end another life cycle.
Cold Weather /Heavy Snow/Warm Rain/Flooding: Beginning in mid December of 2008 and continu-ing until January 2009, heavy snow covered the Tualatin Valley with even more in the upper water basins. By January 15, the weather began to warm and the snow began to melt. Flooding was experienced along all creeks in the Tualatin basin and the Tualatin River. Rainfall of 6.13" in seven days as measured at the dam precipitated the flooding. All flood control procedures for Scoggins Dam were initiated and followed when the river gage at Dilley reached 16.5 feet.
2009 WATER DELIVERIES FROM SCOGGINS RESERVOIRDelivered to Volume (ac-ft)
Tualatin Valley Irrigation District 15,356
Clean Water Services 10,611
City of Beaverton 2,759
City of Forest Grove 3,049
City of Hillsboro 3,395
Lake Oswego Corporation 500
Other (includes two golf courses, from TVID allocation) 641
Total 36,311

26 2009 Tualatin River Flow Managment Report
Pacific Northwest Region Bureau of Reclamation Reorganization: In June of 2009, BOR closed the Lower Columbia Area Office in Portland. Support personnel were transferred to the Columbia Cascade Area Office (CCAO) which is located in Yakima, Washington. A new CCAO manager, Bill Gray, has been appointed. The Bend Field Office (BFO) remains open and is busier than ever. The BFO is responsi-ble for all operation and maintenance issues relating to all BOR dams located in Oregon. The new Opera-tions and Maintenance manager, Joe Lyons, replaced retiring Leo Busch.
Recreation: In 2009, there were 677,000 user-days recorded at Scoggins Valley Park/Henry Hagg Lake. The park and lake opened on March 7th and closed November 22nd. In addition to the usual recreational uses, numerous races were held throughout the year including triathlons.
Two Vehicle Accidents on the Project: Two noteworthy accidents happened in 2009 on the Project. The first involved a sedan hitting a jersey barrier that protects the spillway area and is placed to keep vehicles on the road. It was a hit/run accident that totaled the vehicle. The vehicle was found at Lake Stop Store where it had been abandoned. Washington County Sheriff's deputies were very pleased to have the acci-dent recorded on the security cameras and the offender was quickly located. No structures associated with the dam were damaged.
The second accident involved a large pickup truck off-loading a boat at A ramp. The truck and trailer backed too far down the ramp, causing the back of the rig to float and rendering the rear wheels useless. Unfortunately, the 4-wheel drive was not engaged so everything quickly went into the water. It was later found far out beyond the Sheriff's boat house. Lines were connected and the borrowed pickup was retrieved with only a minor fuel spill that quickly dissipated. The boat had been previously detached from the trailer and was moored at the dock.
Scoggins Dam Safety and SecurityAt Scoggins Dam, earthquake activity, weather including temperature and precipitation, river stage levels and the water surface elevation are reported and recorded electronically. In addition, key dam behavioral instruments report electronically over BOR's Hydromet system. The data is collected, stored and transmit-ted via satellite to BOR’s Pacific Northwest Regional office in Boise. It is made available on the internet through both secure and non-secure information channels. Many of these electronic reporting stations have alarms to alert operators if sudden or unusual conditions develop including earthquakes and flood-ing. Operation and maintenance of the dam is managed under contract between the TVID and BOR. While operators are not on site 24/7, the Project is monitored 24/7, both by BOR and TVID personnel.
A Site Security Plan specific to Scoggins Dam, adopted in October 2005, is used to maintain security on the Project for the protection of life, property, and water supply. The plan documents existing security sys-tems, procedures, security responses and responsibilities and is used in conjunction with other documents relating to the safe operation of the Project. Site security is taken very seriously at Scoggins Dam.
The Department of Homeland Security (DHS) uses a five level alert system as shown in the table at the right. BOR's Advisory System and Response Measures require the Project to follow the DHS alert levels The alert level remained at yellow for all of 2009.
Closed Circuit TV Monitoring System Upgrade: The CCTV security monitoring system was upgraded in 2009. Cameras now monitor all Mission Essential Vulnerable Areas on the dam and other areas associ-ated with the dam and reservoir. A Pan, Tilt, Zoom (PTZ) camera was added on the right abutment. The system records all activity on the Project and is accessible remotely by several TVID and BOR officials.
Green alert Low risk of terrorist attacksBlue alert General risk of terrorist attacksYellow alert Significant risk of terrorist attacksOrange alert High risk of terrorist attacksRed alert Severe risk of terrorist attacks

2009 Tualatin River Flow Management Report 27
Spillway Chute and Spillway Bridge Inspection: A formal inspection of the traffic bridge carrying West Shore traffic over the spillway chute was conducted by BOR using a qualified engineer from the Bend BOR Office on October 22, 2008. All aspects of the bridge were examined looking for any signs of fatigue. In addition to automobiles, the bridge carries a considerable amount of heavy truck equipment, including extra heavy logging equipment. The bridge is expected to remain structurally sound even under heavy load conditions. The piers on each end and in the center are anchors for the spillway gate trunnions, and as such, they are under continual pressure from up to 20 ft of reservoir water. This downstream pres-sure generally lasts from December through July. The inspection was assisted by help from TVID person-nel and the bridge met all Federal and Oregon Department of Transportation safety criteria with one exception—absence of guardrails. The only side protection is mesh fencing on both the upstream and downstream sides. The approaches have concrete deflection barriers (jersey barriers) which have been struck a number of times. BOR has drawn up plans for an upgrade.
Completion of On-site Drilling: On October 21, 2008, BOR concluded all preliminary field work related to fact finding on and below the dam for the Safety of Dams review regarding seismic activity. The con-cern is the proximity of Scoggins Dam to the Cascadia Subduction Zone, a very long sloping fault that stretches from mid-Vancouver island to Northern California and may produce earthquakes of magnitude 9.0 or higher. On-site investigations began during the summer of 2008. When built in the early 1970's, the dam was built to earthquake standards required at that time, which were lower than magnitude 9.0. All BOR drills and associated equipment were removed from the Project by the end of December, 2008.
Geophysicist Crews from BOR Technical Services Center 10/29-11/6: Upon completion of all drilling by BOR, a geophysicist crew arrived from BOR’s Technical Services Center in Denver. For over a week, they simulated earthquake activity at the down stream toe of the dam. “Shot Holes” had been drilled all the way across the field from the left to right abutments. These holes were carefully connected and, over a period of days, were carefully “shot” with dynamite. The impact of each shot was monitored at the nearby holes and recorded for later interpretation. Soil reactions under such conditions were tested to determine their response to an earthquake, especially liquefaction. This information was included along with the ear-lier drill results to evaluate of the structural integrity of Scoggins Dam in the event of an earthquake greater than magnitude 8.0.
Cascadia Peril '09: The TVID Manager and Reservoir Superintendant participated in the large earth-quake preparedness exercise named “Cascadia Peril 09.” The exercise brought together hundreds of par-ticipants from different backgrounds and disciplines that would be impacted by a large earthquake. Failure of Scoggins Dam and the resulting possibility of loss of life was only one portion of the damage that emer-gency managers and first responders would have to face. It was emphasized that emergency help arriving in Scoggins Valley should not be expected for days! A tabletop exercise was later held at the Forest Grove Fire and Rescue station that more specifically dealt with the failure of Scoggins Dam.
COOP: A Continuity of Operations Plan (COOP) for Scoggins Dam was drafted and put into place in 2009. The plan is intended to assist in continuing operations if a catastrophe were to strike. Responsibili-ties are assigned along with alternate operation modes and locations. It covers a number of different sce-narios that could happen including earthquakes, flooding and loss of power. It is intended to help provide the greatest amount of efficiency and safety following an unexpected devastating event.

28 2009 Tualatin River Flow Managment Report
TUALATIN VALLEY IRRIGATION DISTRICT
BY WALLY OTTO, RESERVOIR SUPERINTENDENT
Tualatin Valley Irrigation District OverviewThe Tualatin Valley Irrigation District (TVID), located in Forest Grove, Oregon, is the agricultural water service agency in the Tualatin Basin. In the early twentieth century, relatively little agricultural land was irrigated in Washington County: about 15 acres in 1915 and about 130 acres in 1933. By 1951, however, 18,455 acres had water rights registered in the county. When the TVID was formed in 1962, the total had grown to 33,885 acres. TVID was formed to assist in the delivery of irrigation water to about half of those acres (17,000) in the Tualatin Basin. The water was supplied from natural flow and return flows, and was extremely limited due to early summer withdrawals from the Tualatin River and increasing demands for water for irrigation and municipal use and for maintaining instream water quality and fish. The only stor-age at this time was Barney Reservoir which stored 4000 acre feet for municipal use. Beginning in 1975, additional stored water became available behind the newly completed Bureau of Reclamation Project, Scoggins Dam. Approximately half of the water stored in Scoggins Reservoir (Henry Hagg Lake) is allo-cated to TVID.
Most of the water supplied by TVID is pumped from the Tualatin River at the Spring Hill Pump Plant and delivered to TVID patrons via approximately 120 miles of pressurized pipeline. Additionally, water in both Scoggins Creek and the Tualatin River is withdrawn by irrigators with land abutting the river. When natural flow no longer meets demand, the District 18 Watermaster begins regulating water users with “junior” (or more recent) water rights off, starting with users with the most recent water right. The TVID storage right is dated 1963, so TVID patrons with water rights after that date must stop withdrawing natu-ral and return flow water. Storage water is discharged from Scoggins Reservoir to either augment the river flow or supply the entire need for the TVID patrons, both the pump plant/pressure pipeline users and the river users. Water for some of the TVID members on the lower Tualatin River is supplied by reuse water discharged from Clean Water Services’ Rock Creek Wastewater Treatment Plant.
2009 TVID Water UseFor the 2009 irrigation season (March through the end of November), TVID used 15,358 acre-feet of water from storage in Henry Hagg Lake. Compared to the 10 year average, usage was 91%. This is well below the 21,188 acre-feet used in 2007 and far greater than the 10,704 acre-feet used in the drought year of 2001.
Peak use was 125 cfs on July 30th. This was the culmination of three abnormally hot (over 100 ºF) and dry days. On the 30th, the temperature was 105 ºF. Even though temperatures dropped into the 90s for the next four days, demand remained high for the next ten. The month of November was cold and wet. Only 3 cfs/day were needed for irrigation at the beginning of November and by the 15th, delivery had decreased to 1 cfs/day. Scoggins Dame received 8.95” of precipitation during November which is 97% of average.
As in the past few years, storage water is used during the an extended irrigation season allowed for TVID. The typical irrigation season is from May through September, but through an agreement with OWRD, TVID is allowed to provide water beginning in March and continuing through November. All water used outside the normal irrigation season must come from TVID's annual allocation of 27,022 acre-feet. The extension of the irrigation season has facilitated growing specialty crops, such as berries, nursery stock and flowers. The extended Spring season serves primarily berries and nurseries; the extended Fall season serves primarily nurseries. Nursery stock, including flowers, are now raised well into November when protected by greenhouses. Because of the water availability and moderate temperatures, TVID is now home to many small specialty nurseries along with several large operations. TVID’s total contracted amount with BOR is 37,000 acre-feet including stored water plus natural flow.

2009 Tualatin River Flow Management Report 29
2009 TVID Operation and Maintenance Water conservation continues to be a priority in the District. A “moratorium” remains in place regarding new turn-out deliveries. No new deliveries were added to the delivery system during 2009.
The Measure 37 land use law approved by voters of the State of Oregon and upheld by the Oregon Supreme Court has not impacted the TVID at this time. Some lands served with TVID water have been approved for development by Washington County however no permanent water right transfers and or sub-divisions within the District service area have been approved. The application process begins with Wash-ington County and any changes in water service would have to then be approved by the TVID.
Pipeline Maintenance: TVID delivers irrigation water by high pressure pipeline to customers from Gas-ton to North Plains and from west of Forest Grove to Highway 219 south of Hillsboro. The water is with-drawn from the Tualatin River at the Spring Hill Pump Plant and lifted by pumps to a water regulating tank off Winter’s Road. From there it flows under gravity pressure to all points of delivery through 120 miles of pipeline. Preventative maintenance continues to keep service delivery as dependable as possible. Several minor disruptions of service occurred during the year, but were quickly isolated and repaired. Ser-vice was restored in minutes in some cases or in up to a day if conditions did not allow quick access.
Tributary Flow Augmentation Projects: TVID and Clean Water Services continue their cooperative effort in identifying water use needs outside the Districts boundaries. The TVID water distribution net-work is used to supply water to several tributaries. Temporary above ground pipelines are run from TVID turnout's to augment the low summer and fall flows. The “pilot project,” which began on McKay Creek several years ago, was a success, improving both water quantity and quality. Gales Creek was added in 2009 and Dairy Creek is expected to be added in 2010. This cooperative partnership continues to provide a mechanism whereby the water quality of these streams is improved greatly at minimal cost.
Road Improvements: The Council Creek bridge and Cornelius Schefflin road project has been com-pleted. In order to make room for the new, wider road and also the relocation of Spiesschaert Road, the lateral pipeline feeding the nearby properties had to be moved and irrigators got their water “turnouts” moved and upgraded.
Wapato Improvement District: The United States Fish and Wildlife Service (USFWS) is expected to have over 70% ownership of the Wapato Lake bed this calendar year. Seventy percent is the threshold amount required to dissolve the Wapato Improvement District (WID). USFWS will then enter into discus-sions with the TVID regarding assuming WID's responsibility to deliver water to all remaining TVID cus-tomers outside the lake. This is currently done with a canal that is maintained by the WID.

30 2009 Tualatin River Flow Managment Report
WATER QUALITY STATUS REPORT
BY JAN MILLER, CLEAN WATER SERVICES
Tualatin Basin TMDLsThe current Tualatin Total Maximum Daily Load (TMDL) became effective in August 2001. The Depart-ment of Environmental Quality revised the 1988 TMDLs for total phosphorus (for excessive algal growth and high pH) and for ammonia (for low dissolved oxygen in the mainstem river) and added TMDLs for temperature, bacteria, and settleable volatile solids (for low dissolved oxygen in the tributaries). The fol-lowing evaluation of river and tributary conditions and wastewater treatment plant effluent is for general information and not for determining compliance. In many instances, the statistics and reporting periods shown in this review are different than those used to judge compliance with the permits or to compare the river conditions to the TMDLs.
Total Phosphorus TMDLThe 2001 Tualatin TMDL set river and tributary loading capacities in mg/L. The following table shows the loading capacities and the data for the key sites both historically (1990, 1995, 2000, and 2005) and in recent years (2007 to 2009).
MEDIAN TOTAL PHOSPHORUS CONCENTRATIONS FOR SUMMER SEASON (MAY 1–OCT 31)
Location Code
LocationRiverMile
2001TMDL
LoadingCapacity(mg/L as P)
Total Phosphorus (mg/L as P)
1990 1995 2000 2005 2007 2008 2009
Tualatin River
3701715 Cherry Grove 71.5 0.04 — 0.01 0.01 0.01 0.01 0.01 0.01
3701612 Spring Hill 61.2 0.04 0.04 0.03 0.03 0.01 0.01 0.03 0.01
3701528 Golf Course Road 52.8 0.04 0.05 0.04 0.03 0.03 0.03 0.05 0.03
3701450 Hwy 219 44.4 0.04 — 0.07 0.05 0.06 0.06 0.07 0.06
3701391 Rood Bridge Road 39.1 0.09 0.10 0.08 0.06 0.07 0.07 0.07 0.06
3701333 Farmington Road 33.3 0.10 0.43 0.08 0.09 * 0.08 0.09 0.08
3701271 Scholls 27.1 0.10 0.15 0.09 0.08 0.09 0.09 0.09 0.09
3701165 Elsner 16.5 0.11 0.14 0.09 0.08 0.09 0.09 0.09 0.09
3701087 Boones Ferry Road 8.7 0.11 0.23 0.09 0.08 0.09 0.10 0.10 0.09
3701054 Stafford Road 5.4 0.10 0.23 0.09 0.08 0.09 0.10 0.09 0.09
3701002 Weiss Bridge 0.2 0.10 0.22 0.09 0.08 0.09 0.08 0.08 0.08
Tributaries
3805017 Scoggins @ Hwy 47 0.04 — 0.03 0.01 0.01 0.01 0.01 0.01
3810015 Gales @ New Hwy 47 0.04 0.06 0.05 0.04 0.04 0.04 0.04 0.04
3815021 Dairy @ Hwy 8 0.09 0.13 0.11 0.11 0.12 0.13 0.13 0.12
3820022 Rock @ Brookwood 0.19 0.21 0.21 0.18 0.19 0.20 0.20 0.22
3824001 Bronson @ 205th 0.13 0.13 0.12 0.12 0.14 0.15 0.16 discont.
3835020 Chicken @ Scholls-Sherwood 0.14 0.23 0.12 0.11 0.11 0.11 0.12 0.12
3838001 Nyberg @ Brown 0.14 — — 0.17 0.20 0.20 0.18 0.28
3840012 Fanno @ Durham 0.13 0.15 0.15 0.15 0.15 0.14 0.15 0.15
* Water quality data for the Tualatin River at Farmington was not available for the summer of 2005 due to bridge construction.

2009 Tualatin River Flow Management Report 31
The following table shows the treatment plant performance relative to total phosphorus.
The phosphorus TMDL was developed to protect two beneficial uses: aesthetics, as measured by chloro-phyll-a, and fish and wildlife, as measured by pH.
Chlorophyll-a: Chlorophyll-a concentrations are an indicator of the amount of algae in the river. Three-month stratified means of chlorophyll-a concentrations are shown in the following table. The water qual-ity guidance level for this statistic is 15 µg/L.
pH: High pH values can result from photosynthesis by algae and negatively affect aquatic resources. The pH data from the continuous recorders at RM 3.4 (Lake Oswego dam) and RM 24.5 were evaluated. No pH values at either site exceeded 8.5. In addition to pH data from continuous monitors, weekly pH mea-surements are taken at a number of sites during the summer by Clean Water Services. None of these data showed values greater than 8.5. Low pH values are not a problem in the Tualatin River system.
2009 MONTHLY MEDIAN TOTAL PHOSPHORUS CONCENTRATIONS IN WWTP EFFLUENT
May(mg/L as P)
June(mg/L as P)
July(mg/L as P)
Aug(mg/L as P)
Sept(mg/L as P)
Oct(mg/L as P)
Rock Creek WWTP Effluent 0.09 0.09 0.08 0.07 0.08 0.08
Limit 0.10 0.10 0.10 0.10 0.10 0.10
Durham WWTP Effluent 0.12* 0.07 0.09 0.06 0.08 0.11
Limit 0.11 0.11 0.11 0.11 0.11 0.11
*Exceeded permit limit in May at the Durham Wastewater Treatment Plant due to the need to bypass the tertiary filters for several days, after a water hammer from air entering the system caused structural damage to the pipe that delivered water to the filters.
2009 THREE-MONTH MEAN CHLOROPHYLL-a CONCENTRATIONS
LocationRiver Mile
Apr*–May (µg/L)
Apr–Jun(µg/L)
May–Jul(µg/L)
Jun–Aug(µg/L)
Jul–Sep(µg/L)
Aug–Oct(µg/L)
Tualatin River
Rood Bridge Road 39.1 4.4 3.8 3.0 2.2 2.0 2.3
Farmington Road 33.3 3.9 3.3 2.5 1.7 1.4 1.7
Scholls 27.1 4.0 3.6 2.9 2.0 1.5 1.6
Elsner 16.5 5.0 6.8 8.2 9.5 6.8 4.5
Boones Ferry Road 8.7 5.2 8.8 15.5 16.2 11.9 4.7
Stafford Road 5.4 5.6 10.3 17.1 17.9 12.6 5.5
*No chlorophyll data was available for March 2009.

32 2009 Tualatin River Flow Managment Report
Chlorophyll-a concentrations in the lower river have generally decreased since the 1990s as shown in the graph below and as evidenced by the increasing prevalence of 3-month mean values that meet the guid-ance level (shaded values in table).
MEAN CHLOROPHYLL-a CONCENTRATIONS – TUALATIN RIVER AT STAFFORD ROAD (RM 5.4)[Shading indicates values that are less than the guidance level for chlorophyll-a.]
YearApr–Jun
(µg/L)May–Jul
(µg/L)Jun–Aug
(µg/L)Jul–Sep
(µg/L)Aug–Oct
(µg/L)
1988 6.1 29.6 42.2 48.1 26.7
1989 29.8 42.3 43.4 38.0 29.3
1990 17.8 23.8 22.4 20.4 12.8
1991 13.2 26.3 27.9 28.2 22.7
1992 39.1 39.2 45.9 47.3 40.3
1993 10.9 20.9 30.3 36.1 29.5
1994 37.0 46.3 49.7 40.3 40.4
1995 16.9 27.6 37.6 33.0 23.8
1996 9.4 17.2 25.2 24.1 19.9
1997 21.1 37.6 52.7 49.5 27.6
1998 7.6 15.8 21.8 23.4 15.2
1999 14.5 24.3 32.3 30.6 20.1
2000 10.8 20.4 24.7 22.5 11.3
2001 24.4 30.6 36.9 32.7 26.2
2002 22.3 26.6 29.2 16.0 11.4
2003 16.8 21.5 22.4 11.2 6.0
2004 11.4 22.0 20.6 17.0 5.8
2005 7.1 11.3 12.7 10.0 4.4
2006 8.3 20.3 20.1 17.8 5.0
2007 7.0 14.2 14.3 11.1 3.0
2008 5.7 13.4 15.2 13.3 4.9
2009 10.3 17.1 17.9 12.6 5.5
1988 1990 1992 1994 1996 1998 2000 2002 2004
60
50
40
30
20
10
0
Max
imu
m 3
-mo
nth
Mea
n C
hlo
rop
hyl
l-
a
(µg
/L)
guidance level
TUALATIN RIVER AT STAFFORD ROAD (RM 5.4)
2006 2008

2009 Tualatin River Flow Management Report 33
Ammonia TMDL
The 2001 TMDL revised the permitted ammonia loads. It allows higher loads of ammonia in the spring and early summer when river conditions are favorable for the assimilation of ammonia and lower ammo-nia loads in the fall when sediment oxygen demand consumes more oxygen leaving very little assimilative capacity. For the months of July through November, there are two tiers of ammonia limits. The applicable tier is based on the previous weeks downstream dissolved oxygen levels. The ammonia limit ends when Farmington flow exceeds 350 cfs. On November 7, 2009, Farmington flow was 575 cfs and it did not fall below 350 cfs for the remainder of the year.
The following table compares the effluent ammonia load with the most restrictive ammonia limit (most restrictive tier). A less restrictive limit would be in place if dissolved oxygen levels downstream of the treatment plants were above 6.7 mg/L. The actual permit is based on weekly ammonia discharges. There were no weekly permit violations in 2009.
The ammonia TMDL is designed to protect the dissolved oxygen levels in the reservoir-like section of the Tualatin River (RM 33 to 3.4). The water quality criteria for this section of the river, which is considered “Cool Water Habitat,” are.
• Grab samples: DO > 6.5 mg/L • Continuous Monitoring:
– 30-day average of daily mean DO > 6.5 mg/L (no credit for supersaturation)– 7-day average of daily minimum DO > 5.0 mg/L (no credit for supersaturation)– Daily minimum DO > 4.0 mg/L
The following table shows the river conditions relative to dissolved oxygen at two locations in the reser-voir section of the river. Continuous monitors are deployed at these locations.
Graphs of the dissolved oxygen concentrations at these two locations are shown on the following page. Data are available at:
http://or.water.usgs.gov/cgi-bin/grapher/table_setup.pl?basin_id=tualatin#step1
2009 MONTHLY AMMONIA LOADS AND LIMITS FOR WWTP EFFLUENT
May June July August Sept October
Rock Creek WWTP median load (lb/day) 86 9 7 5 6 5
Durham WWTP median load (lb/day) 6 5 5 4 5 4
Total allowed load (lb/day) 7395 1675 811 301 222 282
NUMBER OF DAYS THAT DID NOT MEET DISSOLVED OXYGEN CRITERIA IN 2009
Criterion May June July Aug Sept OctSummer
Percentage
Tualatin River at RM 24.5
30 day 0 0 0 0 0 0 0%
7 day 0 0 0 0 0 0 0%
Daily 0 0 0 0 0 0 0%
Tualatin River at Oswego Dam
30 day 0 0 0 9 30 12 28%
7 day 0 0 0 7 0 0 4%
Daily 0 0 0 2 0 0 1%

34 2009 Tualatin River Flow Managment Report
Tualatin River at River Mile 24.5 (14206694)Data from U.S. Geological Survey
Oxy
gen
% S
atu
rati
on
(%
sat
.)
Dis
solv
ed O
xyg
en (
mg
/L)
0
10
20
30
40
50
60
70
80
90
100
110
120
130
140
150
0
1
2
3
4
5
6
7
8
9
10
11
12
13
14
15
5-0
1-20
09
5-1
5-20
09
5-2
9-20
09
6-1
2-20
09
6-2
6-20
09
7-1
0-20
09
7-2
4-20
09
8-0
7-20
09
8-2
1-20
09
9-0
4-20
09
9-1
8-20
09
10-0
2-20
09
10-1
6-20
09
10-3
0-20
09
11-1
3-20
09
Tualatin River at Oswego Diversion Dam (14207200)Data from U.S. Geological Survey
0
10
20
30
40
50
60
70
80
90
100
110
120
130
140
150
Oxy
gen
% S
atu
rati
on
(%
sat
.)
0
1
2
3
4
5
6
7
8
9
10
11
12
13
14
15
Dis
solv
ed O
xyg
en (
mg
/L)
5-0
1-20
09
5-1
5-20
09
5-2
9-20
09
6-1
2-20
09
6-2
6-20
09
7-1
0-20
09
7-2
4-20
09
8-0
7-20
09
8-2
1-20
09
9-0
4-20
09
9-1
8-20
09
10-0
2-20
09
10-1
6-20
09
10-3
0-20
09
11-1
3-20
09

2009 Tualatin River Flow Management Report 35
Temperature TMDLTemperature data for the Tualatin River and its tributaries are shown in Appendix F.
Dissolved Oxygen TMDL for TributariesThe 2001 Tualatin TMDL contained requirements for tributary total suspended solids (a surrogate for set-tleable volatile solids) load reductions to protect dissolved oxygen. The best way to display data concern-ing solids reduction are being developed. The following graphs show the dissolved oxygen levels measured by continuous monitors at several tributaries during the summer period. These data are available at http://or.water.usgs.gov/cgi-bin/grapher/graph_setup.pl?basin_id=tualatin.
Scoggins Creek below Henry Hagg Lake near Gaston, OR (14202980)
Data from U.S. Geological Survey
0
10
20
30
40
50
60
70
80
90
100
110
120
130
140
150
Oxy
gen
% S
atu
rati
on
(%
sat
.)
0
1
2
3
4
5
6
7
8
9
10
11
12
13
14
15
Dis
solv
ed O
xyg
en (
mg
/L)
5-0
1-20
09
5-1
5-20
09
5-2
9-20
09
6-1
2-20
09
6-2
6-20
09
7-1
0-20
09
7-2
4-20
09
8-0
7-20
09
8-2
1-20
09
9-0
4-20
09
9-1
8-20
09
10-0
2-20
09
10-1
6-20
09
10-3
0-20
09
11-1
3-20
09

36 2009 Tualatin River Flow Managment Report
Gales Creek at Old Hwy 47, Forest Grove, OR (453040123065201)Data from U.S. Geological Survey
0
10
20
30
40
50
60
70
80
90
100
110
120
130
140
150
Oxy
gen
% S
atu
rati
on
(%
sat
.)
0
1
2
3
4
5
6
7
8
9
10
11
12
13
14
15
Dis
solv
ed O
xyg
en (
mg
/L)
5-0
1-20
09
5-1
5-20
09
5-2
9-20
09
6-1
2-20
09
6-2
6-20
09
7-1
0-20
09
7-2
4-20
09
8-0
7-20
09
8-2
1-20
09
9-0
4-20
09
9-1
8-20
09
10-0
2-20
09
10-1
6-20
09
10-3
0-20
09
11-1
3-20
09
Dairy Creek at Hwy 8, Hillsboro, OR (453113123003501)Data from U.S. Geological Survey
0
10
20
30
40
50
60
70
80
90
100
110
120
130
140
150
Oxy
gen
% S
atu
rati
on
(%
sat
.)
0
1
2
3
4
5
6
7
8
9
10
11
12
13
14
15
Dis
solv
ed O
xyg
en (
mg
/L)
5-0
1-20
09
5-1
5-20
09
5-2
9-20
09
6-1
2-20
09
6-2
6-20
09
7-1
0-20
09
7-2
4-20
09
8-0
7-20
09
8-2
1-20
09
9-0
4-20
09
9-1
8-20
09
10-0
2-20
09
10-1
6-20
09
10-3
0-20
09
11-1
3-20
09
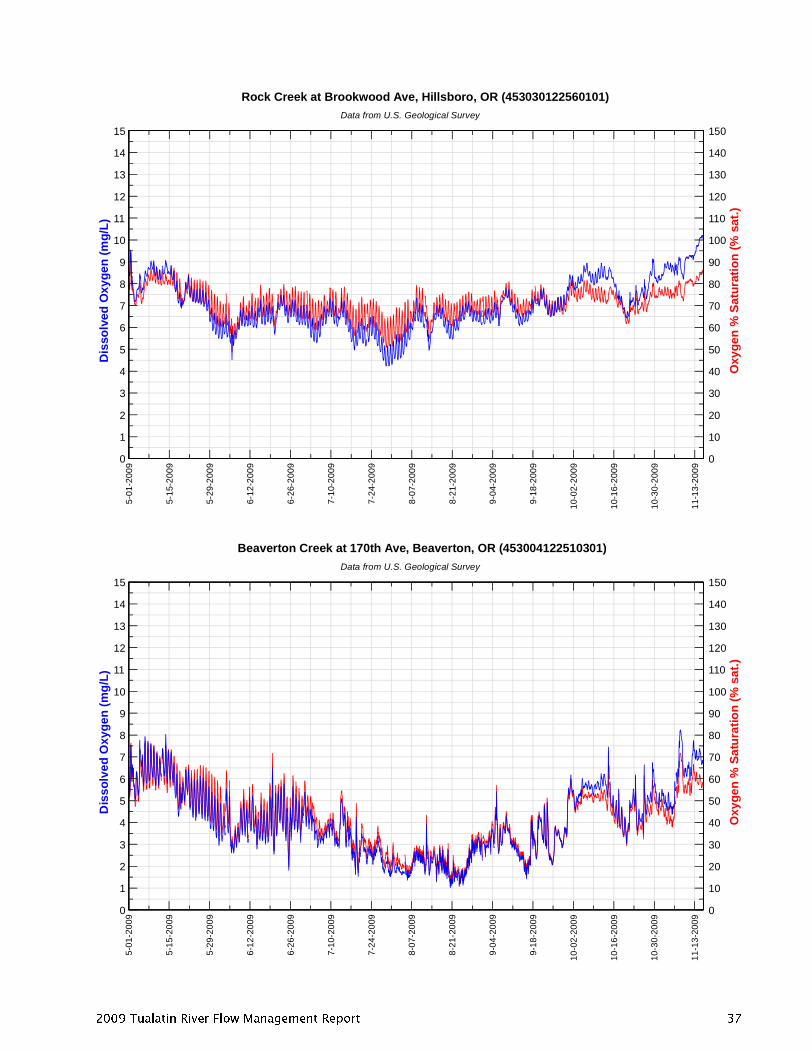
2009 Tualatin River Flow Management Report 37
Rock Creek at Brookwood Ave, Hillsboro, OR (453030122560101)Data from U.S. Geological Survey
0
10
20
30
40
50
60
70
80
90
100
110
120
130
140
150
Oxy
gen
% S
atu
rati
on
(%
sat
.)
0
1
2
3
4
5
6
7
8
9
10
11
12
13
14
15
Dis
solv
ed O
xyg
en (
mg
/L)
5-0
1-20
09
5-1
5-20
09
5-2
9-20
09
6-1
2-20
09
6-2
6-20
09
7-1
0-20
09
7-2
4-20
09
8-0
7-20
09
8-2
1-20
09
9-0
4-20
09
9-1
8-20
09
10-0
2-20
09
10-1
6-20
09
10-3
0-20
09
11-1
3-20
09
Beaverton Creek at 170th Ave, Beaverton, OR (453004122510301)Data from U.S. Geological Survey
0
10
20
30
40
50
60
70
80
90
100
110
120
130
140
150
Oxy
gen
% S
atu
rati
on
(%
sat
.)
0
1
2
3
4
5
6
7
8
9
10
11
12
13
14
15
Dis
solv
ed O
xyg
en (
mg
/L)
5-0
1-20
09
5-1
5-20
09
5-2
9-20
09
6-1
2-20
09
6-2
6-20
09
7-1
0-20
09
7-2
4-20
09
8-0
7-20
09
8-2
1-20
09
9-0
4-20
09
9-1
8-20
09
10-0
2-20
09
10-1
6-20
09
10-3
0-20
09
11-1
3-20
09

38 2009 Tualatin River Flow Managment Report
Chicken Creek at Roy Rogers Road, Sherwood, OR (452230122512201)Data from U.S. Geological Survey
0
10
20
30
40
50
60
70
80
90
100
110
120
130
140
150
Oxy
gen
% S
atu
rati
on
(%
sat
.)
0
1
2
3
4
5
6
7
8
9
10
11
12
13
14
15
Dis
solv
ed O
xyg
en (
mg
/L)
5-0
1-20
09
5-1
5-20
09
5-2
9-20
09
6-1
2-20
09
6-2
6-20
09
7-1
0-20
09
7-2
4-20
09
8-0
7-20
09
8-2
1-20
09
9-0
4-20
09
9-1
8-20
09
10-0
2-20
09
10-1
6-20
09
10-3
0-20
09
11-1
3-20
09
Fanno Creek at Durham Road (14206950)Data from U.S. Geological Survey
0
10
20
30
40
50
60
70
80
90
100
110
120
130
140
150
Oxy
gen
% S
atu
rati
on
(%
sat
.)
0
1
2
3
4
5
6
7
8
9
10
11
12
13
14
15
Dis
solv
ed O
xyg
en (
mg
/L)
5-0
1-20
09
5-1
5-20
09
5-2
9-20
09
6-1
2-20
09
6-2
6-20
09
7-1
0-20
09
7-2
4-20
09
8-0
7-20
09
8-2
1-20
09
9-0
4-20
09
9-1
8-20
09
10-0
2-20
09
10-1
6-20
09
10-3
0-20
09
11-1
3-20
09

2009 Tualatin River Flow Management Report 39
Bacteria TMDLThe TMDL for bacteria applies to both the Tualatin River and its tributaries during both summer and win-ter. The table below shows median and 90th-percentile bacteria levels for the 2009 winter and summer seasons. The median is the middle value—half of the measured values were less than the median and half were greater. Similarly, the 90th percentile also divides the data—90% of the measured values were less and 10% were greater. The water quality goals are the same for summer and winter; they are:
• median concentration of no more than 126 colony forming units/100 mL (#/100 mL)• 90th percentile concentration of no more than 406/100 mL.
A map comparing the values to water quality goals is shown on the following page.
90TH PERCENTILES OF E.COLI CONCENTRATIONS FOR 2009
MapCode
LocationCode
LocationRiverMile
Winter (Nov-08 – Apr-09)(#/100 mL)*
Summer (May-09 – Oct-09)(#/100 mL)*
median 90th pctl median 90th pctlTualatin River
a 3701715 Cherry Grove 71.5 3 11 23 51b 3701612 Spring Hill 61.2 46 181 91 188c 3701528 Golf Course Road 52.8 47 102 114 225d 3701450 Hwy 219 44.4 67 194 136 290e 3701391 Rood Bridge Road 39.1 48 154 102 300f 3701333 Farmington Road 33.3 42 241 96 171g 3701271 Scholls 27.1 47 138 54 129h 3701165 Elsner 16.5 27 121 29 67i 3701087 Boones Ferry Road 8.7 34 193 43 70j 3701054 Stafford Road 5.4 25 188 33 115k 3701002 Weiss Bridge 0.2 16 165 12 40
Tributaries1 3805017 Scoggins @ Hwy 47 37 141 25 1752 3805050 Scoggins below Hagg 1 7 1 13 3810015 Gales @ New Hwy 47 39 175 140 4364 3810070 Gales @ Stringtown 23 66 100 2155 3815021 Dairy @ Hwy 8 87 308 291 543
6a 3816010 McKay at Padgett 82 248 167 3627 3815058 Dairy @ Susbauer 131 393 170 3278 3820022 Rock @ Brookwood 91 236 269 6689 3850006 Dawson @ Brookwood 112 260 548 1200
10 3820047 Rock @ Quatama 51 186 227 51111 3821008 Beaverton @ Guston Court 98 306 235 37412 3821050 Beaverton @ 170th 68 96 102 13413 3824001 Bronson @ 205tha 148 980 — —14 3824018 Bronson @ 185th 461 2410 599 167715 3824020 Bronson @ Bronson Park 517 4840 181 46116 3824072 Bronson @ Saltzman 56 496 318 110717 3859010 Bannister @ 124th 3 33 110 75918 3811010 McFee @ Hwy 219b — — 362 85019 3835020 Chicken @ Scholls-Sherwood 59 249 193 35720 3835060 Chicken @ Kruger 114 156 308 1266— 3838001 Nyberg @ Brown 80 135 192 118021 3840012 Fanno @ Durham 146 556 254 76422 3500035 unnamed trib to Fanno @ Walnut 138 488 403 93023 3844009 Summer Creek at 121st 100 189 462 121924 3845014 Ash @ Hemlock 133 770 517 156425 3840095 Fanno near Allen 370 921 141 1438
*The Colilert-18 (Most Probable Number) method was used for all analyses.a- Sampling at Bronson at 205th was discontinued for safety reasons.b- McFee at Hwy 219 is sampled only during summer.

40 2009 Tualatin River Flow Managment Report
210
Cre
ek
Gal
esC
reek
Gales
Sain
Cre
ek
Creek
Tanner
Scoggins
Creek
Wall
Creek
Scog
gins
8
Cre
ek
EastFork Dairy Dairy8
8
219
Creek
Cre
ek
Dairy
Cre
ek
Creek
219
8
Beav
erto
n
Daw
son
Rock
Rock
Creek
Cre
ek
8
10
Creek
Creek
47
47
McKay
8
Bro
nson
Cre
ek
Cre
ek
McFee
Cre
ekBurri
sCre
ek
Cre
ek
Chr
iste
nsen
Chick
en
Creek
47
99W
26
26
217
10
Creek
Cre
ekSu
mm
er
Ash
Cre
ek
Fanno
FannoCreek
Fan
noC
reek
OswegoCanal
Dai
ry
Wes
t
For
kC
reek
Ced
arM
illC
reek
Beave
rton
Creek
217
99W
217
5
5
205
205
5
5
5
405
sum
me
r 90
th p
erce
ntil
e
win
ter
90t
h p
erc
entil
e
sum
me
r m
edia
n
win
ter
med
ian
me
dian
>1
000
; 90t
h p
erc
ent
ile >
100
0
12
6/1
00 m
L <
me
dian
≤ 1
00
0/1
00 m
L; 4
06/1
00
mL
< 9
0th
pct
l ≤ 1
000/
100
mL
me
dia
n ≤
126
/10
0 m
L; 9
0th
per
cen
tile
≤ 4
06/1
00
mL
Bac
teri
a (E
. co
li.)
Co
nce
ntr
atio
ns
— 2
009
N
10
10
Hed
ges
Cre
ek
a
b
dc
e f
g
hi
j
k
1
2
3
4
5
7
8910
11
12
13
1415
1617
19
20
21
22
23
24
25
18
219
219
210
6a
not
me
asur
ed

Appendix A
Stream Gage Records

APPENDIX A—Stream Gauge RecordsA-2 2009 Tualatin River Flow Management Report
STREAM GAGE SITES — LOCATIONS
North
SCHEMATIC MAP
Not to Scale
Fanno
Creek
Cr
Cr
Cr
S. Rock
McF
ee C
r
Christensen
Creek
Creek
Cr
Ro
McKay
East
West
Gales
Creek
SCHO SCLO
SCOO
DLLO
Scog
Barney Reservoir
Scoggins Reservoir
DAIRY
ROODRCTV
FRMO
Lake Oswego
WI L L A M E T T E R
I VE
R
TU
AL
R
GALES
Dairy
Creek
Burris Cr
He Cr
Baker Cr
Chicken
Cedar Cr
Canal
(Hagg Lake)
Ash
Hedges
Sain Cr
Ta
gins
Car
pe
Dawson Cr
Brons
Bea
v
nner Cr
nter
Cr
Fork
Fork
onat
Lake Oswego
AT
IN
VE
RI
CedarMill Cr
S. on Cr
Springbrook Cr
Saum Cr
Butte rnu t Cr
DCBR
on Cr
BCBR
BCSR
TRTFANO
JCDV
MCSC
WC143
WCHP
BCCH
WSLO
HCTP ASMP
SC121
6900
SCRL
Sylvan Cr
Cr
Cr Su
mm
er C
k
Johns
Ericks
on
CkECMR
BVTS
Wil
wCr
lo
RCQR
ck
eek
RCWU RCRRCre
ek
erto
n
CCSR
TRGC
5400
GASO
Sampling and Flow Sites
Withdrawal Points
Wastewater Treatment Plants
TRLF
SCHO
TANO
TRJB
CMMB
MCKP

APPENDIX A—Stream Gauge Records2009 Tualatin River Flow Management Report A-3
STREAM GAGE SITES — ALPHABETICAL LISTING BY SITE CODESITE CODE SITE NAME RIVER MILE STATION ID PAGE
5400 East Fork Dairy Creek near Meacham Corner, OR 12.4 14205400 A-13
6900 Fanno Creek at 56th Avenue 11.9 14206900 A-35
ASMP Ash Creek at Metzger Park at Metzger, Oregon 1.25 14206933 A-37
BCBR Bronson Creek at Bronson Road near Orenco, Oregon 2.1 14206423 A-29
BCCH Beaverton Creek at Cedar Hills Blvd at Beaverton, Oregon 7.45 14206360 A-22
BCSR Bronson Creek at Saltzman Road near Orenco, Oregon 5.1 14206419 A-28
BVTS Beaverton Creek at NE Guston Court near Orenco, Oregon 1.2 14206435 A-30
CCSR Chicken Creek at Roy Rogers Road near Sherwood, Oregon 2.3 14206750 A-34
CMMB Cedar Mill Creek at Murray Blvd near Beaverton, Oregon 1.64 14206395 A-25
DAIRY Dairy Creek at Hwy 8 near Hillsboro, Oregon 2.06 14206200 A-16
DCBR Dawson Creek at Brookwood Road near Hillsboro, Oregon 0.7 14206443 A-31
DLLO Tualatin River at Dilley, Oregon 58.8 14203500 A-10
ECMR Erickson Creek at Menlo Drive at Beaverton, Oregon 0.76 14206365 A-23
FANO Fanno Creek at Durham Road near Tigard, Oregon 1.2 14206950 A-39
FRMO Tualatin River at Farmington, Oregon 33.3 14206500 A-33
GALES Gales Creek at Old Hwy 47 near Forest Grove, Oregon 2.36 14204530 A-11
GASO Tualatin River at Gaston, Oregon 62.3 14202510 A-5
HCTP Hedges Creek at Tualatin Park at Tualatin, Oregon 0.3 14206958 A-40
JCDV Johnson Creek at Davis Road near Beaverton, Oregon 1.3 14206372 A-24
MCKP McKay Creek at Padgett Road near Hillsboro, Oregon 1.31 14206190 A-15
MCSC McKay Creek at Scotch Church Rd above Waible Ck near North Plains, Oregon 6.3 14206070 A-14
RCQR Rock Creek at Quatama Road near Orenco, Oregon 4.9 14206347 A-21
RCRR Rock Creek at NW Rock Creek Road near Bowers Junction, Oregon 15.8 14206305 A-19
RCTV Rock Creek at Hwy 8 near Hillsboro, Oregon 1.2 14206450 A-32
RCWU Rock Creek at West Union Road near Bethany, Oregon 9.0 14206338 A-20
ROOD Tualatin River at Rood Bridge Road near Hillsboro, Oregon 38.4 14206295 A-18
SC121 Summer Creek at 121st Avenue near Tigard, Oregon 1.0 14206938 A-38
SCHO Sain Creek above Henry Hagg Lake near Gaston, Oregon 1.6 14202920 A-7
SCLO Scoggins Creek above Henry Hagg Lake near Gaston, Oregon 9.3 14202850 A-6
SCOO Scoggins Creek below Henry Hagg Lake near Gaston, Oregon 4.80 14202980 A-9
SCRL Sylvan Creek at Raleighwood Lane near West Slope, Oregon 1.0 14206905 A-36
TANO Tanner Creek above Henry Hagg Lake near Gaston, Oregon 1.6 14202860 A-8
TRGC Tualatin River at Golf Course Road near Cornelius, Oregon 51.5 14204800 A-12
TRJB Tualatin River at Hwy 219 Bridge 44.4 14206241 A-17
TRLF Tualatin River below Lee Falls near Cherry Grove, Oregon 70.7 14202450 A-4
TRT Tualatin River at Tualatin, Oregon 8.9 14206956 A-41
WC143 Willow Creek at 143rd Avenue near Beaverton, Oregon 3.5 14206410 A-26
WCHP Willow Creek at Heritage Parkway near Beaverton, Oregon 0.75 14206413 A-27
WSLO Tualatin River at West Linn 1.75 14207500 A-42

APPENDIX A—Stream Gauge RecordsA-4 2009 Tualatin River Flow Management Report
TRLF – 14202450 – TUALATIN RIVER BELOW LEE FALLS NEAR CHERRY GROVE, OREGON [RM 70.7]Latitude: 45 30 21 Longitude: 123 13 06 Source Agency: District 18 Watermaster
Day2009 Daily Mean Discharge in Cubic Feet per Second
JAN FEB MAR APR MAY JUN JUL AUG SEP OCT NOV DEC 1 1630 85 127 157 56 53 50 50 46 34 91 132 2 1490 82 186 284 71 53 49 50 53 34 66 117 3 630 80 195 262 68 50 49 49 53 34 53 105 4 425 79 165 207 119 50 48 49 53 33 45 96 5 620 80 184 171 226 50 48 47 58 33 32 88 6 691 88 182 150 279 48 49 44 67 33 93 82 7 1670 86 154 142 329 47 50 45 60 33 196 75 8 2050 82 139 135 240 46 50 45 54 33 254 e70 9 964 80 124 128 174 44 51 45 52 32 208 e6710 615 78 112 118 138 44 50 44 52 32 219 e6311 479 76 103 108 120 44 49 46 52 32 158 e6212 426 74 96 139 121 42 51 55 52 33 123 e6213 388 74 92 196 133 42 52 46 53 36 117 6214 328 71 125 171 264 44 50 44 53 64 110 7215 283 71 345 144 188 41 48 44 53 47 106 27416 251 70 316 126 145 38 47 43 53 40 214 41817 225 70 292 120 123 38 49 42 53 44 575 37218 199 70 276 108 111 37 54 41 52 45 328 25419 e175 72 236 99 102 41 54 40 52 43 510 19720 e157 72 230 92 93 49 54 41 52 41 443 17921 e142 73 226 88 86 47 54 42 51 48 372 26422 132 78 197 83 80 47 54 42 51 45 689 24523 123 96 171 78 75 46 54 42 45 58 449 19424 116 235 173 73 71 46 53 42 31 53 309 16325 111 262 181 70 68 48 53 42 31 46 253 14226 103 221 175 68 65 49 52 41 32 60 252 12727 103 163 157 66 63 53 52 41 31 79 298 11628 104 134 187 70 60 52 51 41 32 62 234 10829 96 — 226 68 58 52 51 43 34 71 186 10330 92 — 185 63 55 51 50 42 36 69 153 10931 89 — 161 — 54 — 50 43 — 132 — 240
TOTAL 14907 2802 5718 3784 3835 1392 1576 1371 1447 1479 7136 4658MEAN 481 100 184 126 124 46.4 50.8 44.2 48.2 47.7 238 150MAX 2050 262 345 284 329 53 54 55 67 132 689 418MIN 89 70 92 63 54 37 47 40 31 32 32 62AC-FT 29570 5560 11340 7510 7610 2760 3130 2720 2870 2930 14150 9240 e=estimated value
20092008
TRLF — 14202450 — Tualatin River below Lee Falls near Cherry Grove, Oregon [RM 70.7]
1/1
2/1
3/1
4/1
5/1
6/1
7/1
8/1
9/1
10/1
11/1
12/1
1/1
10
100
1000
10000
Dai
ly M
ean
Dis
char
ge
(cfs
)

APPENDIX A—Stream Gauge Records2009 Tualatin River Flow Management Report A-5
GASO – 14202510 – TUALATIN RIVER AT GASTON, OREGON [RM 62.3]Latitude: 45 26 21 Longitude: 123 07 85 Source Agency: District 18 Watermaster
Day2009 Daily Mean Discharge in Cubic Feet per Second
JAN* FEB MAR APR MAY JUN JUL AUG SEP OCT NOV DEC 1 e1700 114 174 209 76 66 55 44 39 36 137 210 2 e1490 109 238 321 85 66 53 44 46 36 91 183 3 e835 105 270 336 98 64 52 44 46 36 68 162 4 e552 103 240 273 123 65 51 44 47 36 59 147 5 e609 102 243 227 331 77 51 45 50 35 44 134 6 e1050 110 262 197 347 74 51 40 61 35 103 125 7 e1900 108 225 182 452 73 54 42 61 34 227 116 8 e2400 104 208 174 360 71 53 42 52 34 377 e100 9 e1380 101 186 164 274 68 54 42 48 34 278 e9610 e848 100 166 154 217 64 51 40 48 34 323 9311 e678 99 150 141 181 63 50 40 47 34 228 9312 595 98 140 155 176 61 51 54 47 34 179 e9413 544 98 133 253 170 60 56 46 48 37 157 9514 475 94 157 235 332 65 51 42 48 60 162 9415 422 93 459 197 262 59 47 42 48 62 141 e50916 379 92 492 170 206 54 44 41 48 44 203 e98817 343 89 446 162 171 52 43 40 50 46 e800 e63418 307 89 434 146 149 52 50 37 48 51 473 44819 269 91 375 134 136 50 51 36 48 50 e952 35820 239 91 347 124 126 64 50 35 50 47 e659 31421 211 91 338 115 117 63 50 36 48 52 514 42922 190 96 302 110 108 60 49 37 48 59 e1160 41623 175 110 262 104 101 58 49 37 47 62 e711 34824 162 251 262 99 96 55 50 37 34 79 473 30125 155 330 257 93 91 58 49 37 32 61 376 26426 143 308 248 90 88 58 47 37 32 67 350 23927 138 234 224 86 85 63 47 36 34 109 453 21728 142 192 232 88 81 61 45 36 32 98 362 19929 131 — 307 98 76 59 44 38 34 95 289 18730 124 — 255 83 71 57 44 39 37 101 244 19731 118 — 223 — 69 — 44 38 — 157 — e944
TOTAL 18704 3602 8255 4920 5255 1860 1536 1248 1358 1755 10593 8734MEAN 603 129 266 164 170 62 49.5 40.3 45.3 56.6 353 282MAX 2400 330 492 336 452 77 56 54 61 157 1160 988MIN 118 89 133 83 69 50 43 35 32 34 44 93AC-FT 37100 7140 16370 9760 10420 3690 3050 2480 2690 3480 21010 17320e=estimated value
GASO — 14202510 — Tualatin River at Gaston, Oregon [RM 62.3]
20092008
1/1
2/1
3/1
4/1
5/1
6/1
7/1
8/1
9/1
10/1
11/1
12/1
1/1
10
100
1000
10000
Dai
ly M
ean
Dis
char
ge
(cfs
)
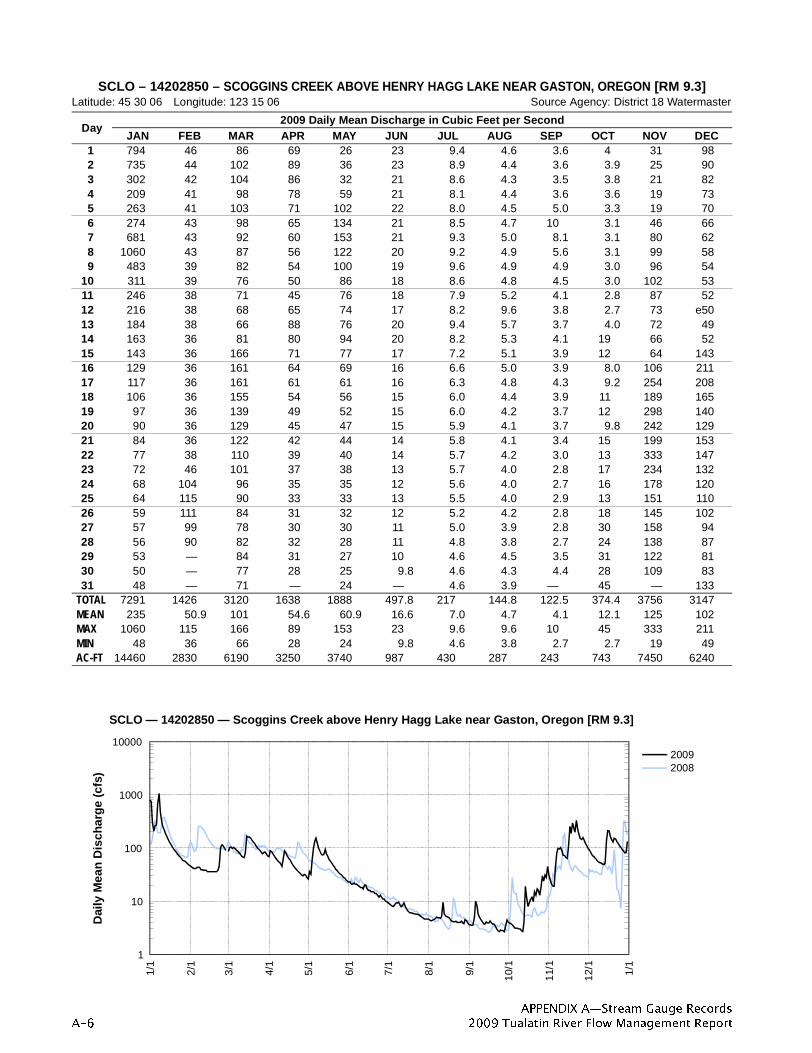
APPENDIX A—Stream Gauge RecordsA-6 2009 Tualatin River Flow Management Report
SCLO – 14202850 – SCOGGINS CREEK ABOVE HENRY HAGG LAKE NEAR GASTON, OREGON [RM 9.3]Latitude: 45 30 06 Longitude: 123 15 06 Source Agency: District 18 Watermaster
Day2009 Daily Mean Discharge in Cubic Feet per Second
JAN FEB MAR APR MAY JUN JUL AUG SEP OCT NOV DEC 1 794 46 86 69 26 23 9.4 4.6 3.6 4 31 98 2 735 44 102 89 36 23 8.9 4.4 3.6 3.9 25 90 3 302 42 104 86 32 21 8.6 4.3 3.5 3.8 21 82 4 209 41 98 78 59 21 8.1 4.4 3.6 3.6 19 73 5 263 41 103 71 102 22 8.0 4.5 5.0 3.3 19 70 6 274 43 98 65 134 21 8.5 4.7 10 3.1 46 66 7 681 43 92 60 153 21 9.3 5.0 8.1 3.1 80 62 8 1060 43 87 56 122 20 9.2 4.9 5.6 3.1 99 58 9 483 39 82 54 100 19 9.6 4.9 4.9 3.0 96 5410 311 39 76 50 86 18 8.6 4.8 4.5 3.0 102 5311 246 38 71 45 76 18 7.9 5.2 4.1 2.8 87 5212 216 38 68 65 74 17 8.2 9.6 3.8 2.7 73 e5013 184 38 66 88 76 20 9.4 5.7 3.7 4.0 72 4914 163 36 81 80 94 20 8.2 5.3 4.1 19 66 5215 143 36 166 71 77 17 7.2 5.1 3.9 12 64 14316 129 36 161 64 69 16 6.6 5.0 3.9 8.0 106 21117 117 36 161 61 61 16 6.3 4.8 4.3 9.2 254 20818 106 36 155 54 56 15 6.0 4.4 3.9 11 189 16519 97 36 139 49 52 15 6.0 4.2 3.7 12 298 14020 90 36 129 45 47 15 5.9 4.1 3.7 9.8 242 12921 84 36 122 42 44 14 5.8 4.1 3.4 15 199 15322 77 38 110 39 40 14 5.7 4.2 3.0 13 333 14723 72 46 101 37 38 13 5.7 4.0 2.8 17 234 13224 68 104 96 35 35 12 5.6 4.0 2.7 16 178 12025 64 115 90 33 33 13 5.5 4.0 2.9 13 151 11026 59 111 84 31 32 12 5.2 4.2 2.8 18 145 10227 57 99 78 30 30 11 5.0 3.9 2.8 30 158 9428 56 90 82 32 28 11 4.8 3.8 2.7 24 138 8729 53 — 84 31 27 10 4.6 4.5 3.5 31 122 8130 50 — 77 28 25 9.8 4.6 4.3 4.4 28 109 8331 48 — 71 — 24 — 4.6 3.9 — 45 — 133
TOTAL 7291 1426 3120 1638 1888 497.8 217 144.8 122.5 374.4 3756 3147MEAN 235 50.9 101 54.6 60.9 16.6 7.0 4.7 4.1 12.1 125 102MAX 1060 115 166 89 153 23 9.6 9.6 10 45 333 211MIN 48 36 66 28 24 9.8 4.6 3.8 2.7 2.7 19 49AC-FT 14460 2830 6190 3250 3740 987 430 287 243 743 7450 6240
SCLO — 14202850 — Scoggins Creek above Henry Hagg Lake near Gaston, Oregon [RM 9.3]
20092008
1/1
2/1
3/1
4/1
5/1
6/1
7/1
8/1
9/1
10/1
11/1
12/1
1/1
1
10
100
1000
10000
Dai
ly M
ean
Dis
char
ge
(cfs
)

APPENDIX A—Stream Gauge Records2009 Tualatin River Flow Management Report A-7
SCHO – 14202920 – SAIN CREEK ABOVE HENRY HAGG LAKE NEAR GASTON, OREGON [RM 1.6]
Latitude: 45 28 50 Longitude: 123 14 40 Source Agency: District 18 Watermaster
Day2009 Daily Mean Discharge in Cubic Feet per Second
JAN FEB MAR APR MAY JUN JUL AUG SEP OCT NOV DEC 1 e510 22 38 34 16 15 6.6 3.0 2.4 e2.3 e9.9 e42 2 e453 21 48 46 22 15 6.2 2.8 2.4 e2.2 e6.8 e38 3 e187 21 48 42 20 14 6.0 2.8 2.3 e2.0 e6.0 e34 4 e130 21 44 38 43 14 5.8 2.9 2.3 e2.0 e4.8 e30 5 e163 21 45 35 62 15 5.7 3.1 3.3 e1.9 e4.5 e28 6 e170 23 44 32 75 14 6.2 3.2 5.7 e1.9 e20 e25 7 e449 22 40 30 79 14 6.4 3.5 4.2 e1.9 e40 e24 8 e641 21 38 28 63 13 6.4 3.5 3.2 e1.9 e55 e18 9 e299 20 36 27 52 13 6.6 3.4 2.9 e1.9 e50 e1710 e193 20 33 25 44 12 6.0 3.1 2.8 e1.9 e55 e1611 e152 21 31 24 39 12 5.7 3.7 2.6 e1.9 e35 e1612 e134 20 30 30 38 12 6.0 6.6 2.3 e1.9 e28 e1613 e114 21 28 36 42 12 6.4 3.9 2.3 e2.3 e22 e1614 92 20 38 34 59 12 5.8 3.7 2.5 e12 e22 e1915 78 20 105 30 46 11 5.2 3.6 2.4 e5.5 e20 e7516 68 20 98 28 40 10 4.8 3.5 2.4 e3.3 e23 e13017 60 20 92 28 36 10 4.5 3.2 2.7 e3.2 e150 e12518 53 20 85 25 33 10 4.3 2.9 2.4 e4.3 e100 e7319 48 20 73 23 30 10 4.2 2.8 2.3 e5.8 e185 e6020 44 20 62 22 28 9.9 4.1 2.7 2.2 e3.5 e140 e5521 40 20 54 21 26 9.5 3.9 2.8 2.1 e5.5 e110 e7322 37 21 48 20 24 9.4 3.9 2.8 1.9 e4.6 e210 e6223 34 25 45 20 23 8.9 4.0 2.6 1.8 e3.5 e138 e5324 32 51 45 19 22 8.6 3.9 2.7 1.8 e5.8 e100 e4925 31 52 41 18 20 8.7 3.7 2.7 2.0 e3.7 e80 e4526 28 51 37 18 20 8.4 3.5 2.8 1.8 e3.9 e70 e4127 28 44 35 17 19 7.9 3.4 2.5 1.8 e8.6 e76 e3628 27 40 38 20 18 7.5 3.1 2.4 e2.0 e6.1 e64 e3429 25 — 39 19 17 7.2 3.0 3.1 e2.3 e9.2 e53 e3130 24 — 36 17 16 7.0 2.9 3.1 e2.4 e6.5 e48 e3131 23 — 34 — 16 — 3.0 2.6 — e16 — e60
TOTAL 4367 718 1508 806 1088 331 151.2 98 75.5 137 1926 1372MEAN 141 25.6 48.6 26.9 35.1 11 4.9 3.2 2.5 4.4 64.2 44.3MAX 641 52 105 46 79 15 6.6 6.6 5.7 16 210 130MIN 23 20 28 17 16 7 2.9 2.4 1.8 1.9 4.5 16AC-FT 8660 1420 2990 1600 2160 657 300 194 150 272 3820 2720e=estimated value
SCHO — 14202920 — Sain Creek above Henry Hagg Lake near Gaston, Oregon [RM 1.6]
20092008
1/1
2/1
3/1
4/1
5/1
6/1
7/1
8/1
9/1
10/1
11/1
12/1
1/1
1
10
100
1000
Dai
ly M
ean
Dis
char
ge
(cfs
)

APPENDIX A—Stream Gauge RecordsA-8 2009 Tualatin River Flow Management Report
TANO – 14202860 – TANNER CREEK ABOVE HENRY HAGG LAKE NEAR GASTON, OREGON [RM 1.6]Latitude: 45 30 21 Longitude: 123 13 10 Source Agency: Tualatin Valley Irrigation District
Day2009 Daily Mean Discharge in Cubic Feet per Seconda
JAN* FEB MAR APR MAY JUN JUL AUG SEP OCT NOV DEC 1 3 5 2 1 0 1 1 1 1 3 3 2 3 6 3 1 0 1 1 1 1 2 3 3 3 5 2 1 0 1 1 1 1 2 2 4 3 5 2 1 0 1 1 1 1 2 2 5 2 5 2 5 0 1 1 1 1 2 2 6 2 55 2 17 0 1 1 1 1 3 2 7 2 5 2 13 0 1 1 1 1 4 1 8 2 5 2 7 0 1 1 1 1 5 1 9 2 5 1 7 0 1 1 1 1 4 110 2 5 1 7 0 1 1 1 1 5 111 2 5 1 7 0 1 1 1 1 3 112 2 5 1 1 0 1 1 1 1 3 113 2 4 2 1 0 1 1 1 1 3 114 2 4 1 1 0 1 1 1 1 3 115 2 9 1 1 0 1 1 1 1 3 516 11 2 21 1 1 0 1 1 1 1 3 617 2 19 1 1 0 1 1 1 1 4 618 2 18 1 1 0 1 1 1 1 0 519 2 17 1 1 0 1 1 1 1 5 220 7 2 13 1 1 0 1 1 1 1 4 221 5 2 12 1 1 0 1 1 1 1 3 322 5 2 12 1 1 1 1 1 1 1 4 323 4 2 4 1 1 1 1 1 1 1 3 224 4 4 4 1 1 1 1 1 1 2 3 225 3 5 4 1 1 1 1 1 1 2 3 226 3 5 3 1 1 1 1 1 1 2 3 227 3 5 2 1 1 1 1 1 1 3 3 228 3 5 2 1 0 1 1 1 1 2 3 229 3 — 2 1 0 1 1 1 1 3 3 230 3 — 2 1 0 1 1 1 1 2 3 231 — 2 — 0 — 1 1 — 5 — 2
TOTAL 74 265 40 83 9 31 31 30 44 94 72AC-FT 147 526 79 165 18 61 61 60 87 186 143*Incomplete record;aValues are read from a staff plate. Values may be daily readings taken at about 0800 or averages over several days
20092008
TANO — 14202860 — Tanner Creek above Henry Hagg Lake near Gaston, Oregon [RM 1.6]
1/1
2/1
3/1
4/1
5/1
6/1
7/1
8/1
9/1
10/1
11/1
12/1
1/1
0.1
1
10
100
Dai
ly M
ean
Dis
char
ge
(cfs
)

APPENDIX A—Stream Gauge Records2009 Tualatin River Flow Management Report A-9
SCOO – 14202980 – SCOGGINS CREEK BELOW HENRY HAGG LAKE NEAR GASTON, OREGON [RM 4.8]Latitude: 45 28 10 Longitude: 123 11 56 Source Agency: Bureau of Reclamation & District 18 Watermaster
Day2009 Daily Mean Discharge in Cubic Feet per Second
JAN FEB MAR APR MAY JUN JUL AUG SEP OCT NOV DEC 1 22 21 16 16 92 44 170 236 149 130 9.7 22 2 21 20 16 16 115 36 191 235 150 124 9.8 21 3 20 20 17 16 114 42 192 218 165 129 10 22 4 20 20 18 16 115 42 186 203 167 129 14 22 5 83 20 18 16 237 42 185 201 162 136 25 22 6 115 20 17 49 327 39 177 204 162 141 24 22 7 21 20 17 91 237 36 154 201 162 137 21 22 8 22 20 17 101 145 31 139 197 124 140 21 22 9 23 21 16 101 136 30 144 197 95 145 22 2210 24 21 16 101 172 30 162 189 84 144 22 2211 25 20 17 101 168 30 176 183 98 144 23 2212 226 20 17 101 162 32 176 167 111 138 22 2213 610 18 17 101 162 52 162 143 111 124 21 2214 670 16 17 101 125 87 146 130 134 104 21 2215 702 16 17 101 84 65 164 130 157 74 21 5116 670 16 17 101 83 43 176 130 160 53 21 9017 618 16 17 101 110 95 171 145 156 48 21 14518 587 16 17 101 118 90 161 172 148 48 22 20019 557 16 17 101 123 77 161 197 146 60 22 19920 359 16 17 72 95 77 180 204 146 72 22 19721 177 16 17 37 60 77 200 204 146 73 22 22622 126 16 17 19 58 58 219 206 153 78 23 25223 77 16 17 15 64 58 217 206 162 67 22 25024 58 16 16 13 64 70 221 181 181 53 22 22025 58 16 16 13 64 77 223 152 182 53 22 20426 58 16 16 13 64 85 223 168 176 32 22 20427 58 16 16 23 64 91 223 177 176 12 22 20328 58 16 16 30 64 91 231 175 165 11 21 20329 51 — 16 50 62 96 249 175 158 10 21 20330 31 — 16 64 60 129 248 175 152 9.7 22 20331 21 — 16 — 60 — 241 162 — 9.9 — 204
TOTAL 6166 501 515 1781 3600 1851 5867 5662 4438 2629 612 3559MEAN 199 18 17 59 116 62 189 183 148 85 20 115MAX 702 21 18 101 327 129 249 236 182 145 25 252MIN 20 16 16 13 58 30 139 130 84 10 10 21AC-FT 12229 994 1021 3533 7141 3671 11637 11231 8803 5215 1214 7059
SCOO — 14202980 — Scoggins Creek below Henry Hagg Lake near Gaston, Oregon [RM 4.8]
20092008
1/1
2/1
3/1
4/1
5/1
6/1
7/1
8/1
9/1
10/1
11/1
12/1
1/1
1
10
100
1000
Dai
ly M
ean
Dis
char
ge
(cfs
)

APPENDIX A—Stream Gauge RecordsA-10 2009 Tualatin River Flow Management Report
UNITED STATES DEPARTMENT OF THE INTERIOR – GEOLOGICAL SURVEY – OREGON WATER SCIENCE CENTERSTATION NUMBER: 14203500 TUALATIN RIVER NEAR DILLEY, OREG.
LATITUDE: 452830 LONGITUDE: 1230723 DRAINAGE AREA: 125.00 DATUM: 147.57
Discharge, Cubic Feet per Second, Calendar Year January to December 2009 Daily Mean ValuesDay JAN FEB MAR APR MAY JUN JUL AUG SEP OCT† NOV† DEC†
1 914 202 261 268 160 112 191 252 157 135 136 2812 3000 192 302 310 201 93 220 251 160 117 99 2373 1890 176 341 353 220 95 224 241 174 124 78 2044 1160 168 328 327 221 92 215 219 186 124 70 1865 954 160 316 288 469 97 216 217 182 125 61 1746 1090 159 331 270 596 95 213 215 195 133 99 1617 1280 161 301 298 655 90 194 215 200 131 185 1498 2270 160 285 305 616 87 172 209 167 129 319 1339 1870 151 266 293 537 82 177 208 120 135 274 120
10 1260 148 248 284 496 78 186 202 109 135 301 11711 915 151 226 271 443 77 207 192 107 135 253 11512 817 151 211 267 402 75 209 200 125 133 207 12413 1040 150 200 343 383 79 209 169 127 124 178 11914 1170 147 208 344 437 127 180 144 139 131 178 11715 1140 143 367 318 390 120 186 143 169 124 160 28416 1120 142 515 295 328 65 201 142 173 80 184 58117 1050 136 538 285 313 119 198 147 173 77 413 71518 981 138 555 272 297 124 192 169 163 82 488 75919 931 139 537 255 288 106 195 193 157 81 475 69620 849 137 495 227 252 116 205 206 158 93 562 63221 640 136 460 181 202 118 227 207 156 100 557 64822 517 138 425 151 177 105 247 210 158 110 629 70023 408 149 377 139 174 88 248 211 168 109 765 68024 337 256 357 130 164 104 241 200 170 111 683 63125 312 345 335 121 157 108 243 155 176 92 569 56726 290 364 318 119 152 117 242 167 168 87 474 51427 277 327 292 116 145 129 241 180 168 99 500 46628 278 285 282 126 140 128 242 178 159 100 472 42929 261 — 331 147 132 127 260 182 150 89 399 40530 230 — 311 152 123 152 264 184 151 99 336 40731 209 — 283 — 120 — 257 173 — 126 — 484
TOTAL 29460 5111 10602 7255 9390 3105 6702 5981 4765 3470 10104 11835 MEAN 950 183 342 242 303 104 216 193 159 112 337 382 MAX 3000 364 555 353 655 152 264 252 200 135 765 759 MIN 209 136 200 116 120 65 172 142 107 77 61 115 AC-FT 58430 10140 21030 14390 18630 6160 13290 11860 9450 6880 20040 23470† Provisional data–subject to revision
DLLO — 14203500 — Tualatin River near Dilley, Oregon [RM 58.8]
20092008
1/1
2/1
3/1
4/1
5/1
6/1
7/1
8/1
9/1
10/1
11/1
12/1
1/1
10
100
1000
10000
Dai
ly M
ean
Dis
char
ge
(cfs
)

APPENDIX A—Stream Gauge Records2009 Tualatin River Flow Management Report A-11
GALES – 14204530 – GALES CREEK AT OLD HWY 47 NEAR FOREST GROVE, OREGON [RM 2.36]Latitude: 45 30 39 Longitude: 123 06 56 Source Agency: District 18 Watermaster
Day2009 Daily Mean Discharge in Cubic Feet per Second
JAN FEB MAR APR MAY JUN JUL AUG SEP OCT NOV DEC 1 1400 146 261 206 105 74 27 12 12 24 87 253 2 2300 143 291 237 122 74 26 10 11 22 64 227 3 1370 140 301 251 127 70 24 9.3 11 22 53 205 4 758 136 287 240 142 69 23 9.5 13 22 49 188 5 755 135 293 225 341 85 23 10 17 19 44 175 6 742 140 293 209 363 81 24 14 24 19 88 164 7 1500 139 272 196 474 79 26 15 29 19 165 153 8 2310 135 263 185 367 76 25 16 23 19 243 142 9 2050 134 250 179 299 70 28 17 18 18 205 e13310 1050 132 234 171 255 67 26 15 17 19 259 e13211 740 135 218 159 224 64 25 15 17 19 242 e13212 610 138 205 172 217 60 24 32 18 19 211 12813 556 140 196 259 204 59 30 26 19 19 195 12014 510 142 217 262 252 68 26 22 19 41 206 11915 455 140 516 239 212 60 22 20 19 51 176 35216 403 141 636 218 191 53 19 20 18 30 198 67417 358 137 622 206 175 53 17 18 20 30 650 70718 320 136 621 189 161 52 14 16 20 34 577 57519 288 137 526 175 152 50 16 14 19 34 767 46320 263 136 450 163 143 51 15 9.5 19 34 779 39521 240 134 397 153 135 49 13 11 17 36 592 46822 223 137 355 143 126 44 11 11 16 42 1000 46323 209 146 310 141 118 44 12 13 14 38 798 40924 196 239 291 137 112 40 13 12 16 56 577 36425 190 286 263 127 106 39 14 13 17 43 442 32626 178 330 243 123 102 40 12 12 18 40 388 29327 172 305 225 118 97 38 9.9 9.8 18 77 432 26428 169 279 223 120 91 35 8.4 9.7 18 74 363 24329 161 — 242 123 86 31 8.9 12 19 74 320 22630 155 — 223 112 82 28 7.4 14 24 75 284 22731 151 — 212 — 78 — 13 12 — 97 — 348
TOTAL 20782 4618 9936 5438 5659 1703 582.6 449.8 540 1166 10454 9068MEAN 670 165 321 181 183 56.8 18.8 14.5 18 37.6 348 293MAX 2310 330 636 262 474 85 30 32 29 97 1000 707MIN 151 132 196 112 78 28 7.4 9.3 11 18 44 119AC-FT 41220 9160 19710 10790 11220 3380 1160 892 1070 2310 20740 17990e=estimated value
GALES — 14204530 — Gales Creek at Old Hwy 47 near Forest Grove, Oregon [RM 2.36]
20092008
1/1
2/1
3/1
4/1
5/1
6/1
7/1
8/1
9/1
10/1
11/1
12/1
1/1
1
10
100
1000
10000
Dai
ly M
ean
Dis
char
ge
(cfs
)

APPENDIX A—Stream Gauge RecordsA-12 2009 Tualatin River Flow Management Report
TRGC – 14204800 – TUALATIN RIVER AT GOLF COURSE ROAD NEAR CORNELIUS, OREGON [RM 51.5]
Latitude: 45 30 08 Longitude: 123 03 22 Source Agency: District 18 Watermaster
Day2009 Daily Mean Discharge in Cubic Feet per Second
JAN FEB MAR APR MAY JUN JUL AUG SEP OCT NOV DEC 1 1590 342 562 467 235 88 97 126 90 138 265 603 2 2760 331 592 525 295 78 110 137 82 104 183 499 3 3200 311 669 598 348 75 108 127 92 89 119 416 4 2790 293 662 585 323 54 117 107 115 100 110 379 5 2480 282 639 532 725 94 125 109 129 91 85 355 6 2290 289 665 462 880 131 139 112 170 97 120 324 7 2290 291 597 483 1110 123 137 123 206 109 317 297 8 2800 290 568 488 1100 101 110 116 174 101 571 e252 9 3190 280 537 470 927 67 112 139 95 105 535 e22010 2860 263 503 459 813 49 123 135 74 102 579 e20611 2530 275 447 429 728 59 135 108 48 107 529 e20912 2190 291 409 405 652 49 158 161 71 108 443 e21313 1930 281 382 564 610 34 186 158 76 98 379 21114 1940 289 384 612 693 98 157 116 77 104 403 20015 1970 274 738 581 656 125 135 100 96 158 336 47216 1910 277 1160 531 555 56 106 105 109 90 331 113017 1810 266 1230 483 503 70 98 77 125 62 756 141018 1690 254 1280 448 482 80 98 70 122 70 1080 148019 1560 269 1220 408 468 89 108 65 121 64 1090 142020 1430 260 1080 382 427 97 108 88 132 95 1360 124021 1200 251 953 319 350 130 94 115 105 100 1300 119022 866 260 850 267 299 109 127 133 82 130 1380 124023 692 280 724 256 273 46 138 138 91 129 1620 120024 563 439 672 256 262 48 128 137 106 147 1580 111025 511 637 624 227 239 54 132 74 122 126 1340 97726 481 698 581 213 211 60 130 73 116 101 1030 86727 447 684 530 204 190 55 111 91 122 121 999 78528 439 619 503 206 172 61 96 99 129 172 941 70729 414 — 577 248 145 50 101 119 124 150 814 66130 383 — 545 252 116 48 117 134 132 170 703 64631 353 — 497 — 115 — 123 128 — 157 — 718
TOTAL 51559 9576 21380 12360 14902 2278 3764 3520 3333 3495 21298 21637MEAN 1663 342 690 412 481 75.9 121 114 111 113 710 698MAX 3200 698 1280 612 1110 131 186 161 206 172 1620 1480MIN 353 251 382 204 115 34 94 65 48 62 85 200AC-FT 102300 18990 42410 24520 29560 4520 7470 6980 6610 6930 42240 42920e=estimated value
TRGC — 14204800 — Tualatin River at Golf Course Road near Cornelius, Oregon [RM 51.5]
20092008
1/1
2/1
3/1
4/1
5/1
6/1
7/1
8/1
9/1
10/1
11/1
12/1
1/1
10
100
1000
10000
Dai
ly M
ean
Dis
char
ge
(cfs
)

APPENDIX A—Stream Gauge Records2009 Tualatin River Flow Management Report A-13
UNITED STATES DEPARTMENT OF THE INTERIOR – GEOLOGICAL SURVEY – OREGON WATER SCIENCE CENTER STATION NUMBER: 14205400 EAST FORK DAIRY CREEK NEAR MEACHAM CORNER, OR
LATITUDE: 454051 LONGITUDE: 1230412 DRAINAGE AREA: 32.92 DATUM: 290
Discharge, Cubic Feet per Second, Calendar Year January to December 2009 Daily Mean ValuesDay JAN FEB MAR APR MAY JUN JUL AUG SEP OCT† NOV† DEC†
1 383 60 78 87 50 35 22 e13 8.5 9.9 16 652 586 59 87 100 69 34 21 e13 8.5 e8.5 12 583 340 58 87 96 64 32 21 e13 8.7 e8 11 534 240 57 80 95 80 32 20 e13 8.9 e7.5 9.7 495 228 57 83 92 122 33 19 e12 11 e7 9.9 456 255 60 78 87 156 33 20 e12 18 e7 25 437 578 58 75 83 174 32 20 12 14 e6.5 42 408 1050 56 77 80 146 31 19 12 11 e6.5 40 369 596 56 75 76 124 31 20 12 10 e6.0 44 36
10 381 56 71 76 107 30 19 12 9.2 e6.0 51 3411 291 56 68 70 94 30 19 12 9.2 e6.0 43 3412 246 54 66 81 92 28 19 21 9.2 e6.0 36 3713 227 54 64 88 93 28 21 14 8.7 7.2 41 3314 207 53 77 81 92 28 19 13 8.8 18 41 3615 184 53 158 78 77 27 18 12 8.4 10 35 10416 161 52 192 76 70 27 17 12 8.8 8.0 35 18617 142 51 213 78 65 27 16 11 11 9.2 69 20218 127 49 212 72 61 27 16 10 10 9.4 71 15119 116 49 191 70 63 29 16 10 10 9.5 148 14020 111 48 165 67 57 27 15 10 9.4 8.2 139 12721 103 48 141 65 53 26 15 9.7 8.8 11 128 14122 97 50 126 63 51 25 15 9.6 8.6 9.4 250 9323 89 56 115 61 49 24 16 9.1 9.4 15 168 5524 83 81 107 60 47 25 15 9.2 8.7 12 118 5225 80 85 99 57 45 24 15 9.3 8.5 9.3 92 5026 74 86 92 56 44 24 15 9.5 7.7 14 92 5127 72 80 87 57 42 23 15 9.0 8.2 20 101 4528 71 77 91 60 41 22 e14 9.0 8.0 14 86 4229 67 — 93 56 39 22 e14 9.6 10 27 79 4530 64 — 83 52 37 23 e14 9.3 12 19 72 4931 63 — 81 — 36 — e14 8.4 — 23 — 85
TOTAL 7312 1659 3312 2220 2340 839 539 350.7 291.2 338.1 2104.6 2159MEAN 236 59.2 107 74.0 75.5 28.0 17.4 11.3 9.71 10.9 70.2 72.0MAX 1050 86 213 100 174 35 22 21 18 27 250 202MIN 63 48 64 52 36 22 14 8.4 7.7 6.0 9.7 33AC-FT 14500 3290 6570 4400 4640 1660 1070 696 578 671 4170 4280† Provisional data–subject to revision; e=estimated value
5400 — 14205400 — East Fork Dairy Creek near Meacham Corner, Oregon [RM 12.4]
20092008
1/1
2/1
3/1
4/1
5/1
6/1
7/1
8/1
9/1
10/1
11/1
12/1
1/1
1
10
100
1000
10000
Dai
ly M
ean
Dis
char
ge
(cfs
)

APPENDIX A—Stream Gauge RecordsA-14 2009 Tualatin River Flow Management Report
MCSC – 14206070 – MCKAY CREEK AT SCOTCH CHURCH RD ABOVE WAIBLE CREEK NEAR NORTH PLAINS, OREGON [RM 6.3]Latitude: 45 57 21 Longitude: 122 99 18 Source Agency: WEST Consultants for Clean Water Services
Day2009 Daily Mean Discharge in Cubic Feet per Second
JAN FEB MAR APR MAY JUN JUL AUG SEP OCT NOV DEC 1 717 32 52 52 20 16 5.0 2.4 5.4 3.7 12 e38 2 1740 31 61 77 28 15 3.9 2.7 5.0 3.1 7.2 e30 3 978 31 65 88 31 15 5.1 2.2 4.1 2.5 4.9 e25 4 476 30 63 82 29 14 5.4 1.5 3.4 2.2 4.1 e22 5 304 30 61 76 95 16 5.1 1.2 5.5 1.9 e6.3 e20 6 277 30 62 68 84 18 4.6 2.5 9.3 1.6 e17 e19 7 366 29 56 61 109 18 5.5 3.5 13 1.5 e40 e16 8 1170 27 55 57 100 17 5.9 5.1 9.0 1.8 e63 e14 9 998 28 56 51 87 14 6.2 6.5 6.9 1.2 e41 e1310 539 28 53 49 74 12 6.6 5.8 6.1 1.2 e36 e1211 290 30 48 44 65 12 6.3 6.0 5.2 2.0 e41 e1212 201 29 44 40 58 12 6.4 8.6 4.8 3.1 e31 e1213 166 29 42 51 52 13 7.3 12 5.0 4.0 e28 e1314 147 29 44 48 58 20 7.8 8.5 4.3 7.9 e31 e1315 127 29 101 45 49 13 7.5 7.0 4.4 10 e29 e1616 109 30 180 43 42 11 6.8 6.2 4.3 6.4 e23 e4917 93 29 170 44 39 9.9 6.4 5.7 4.1 5.9 e27 e16118 81 28 170 44 36 9.2 5.4 5.2 3.9 7.7 e38 e29719 71 25 157 40 37 9.9 4.7 4.0 3.1 7.0 e43 e22820 65 24 136 38 35 12 4.5 3.6 1.5 5.7 e71 e18721 60 24 113 36 30 9.5 5.2 3.2 1.5 6.3 e91 e18622 56 25 96 34 28 8.2 5.2 4.0 1.4 6.9 e121 e22223 52 28 77 31 26 6.6 4.3 3.7 1.6 7.1 e189 e14324 48 40 71 29 23 7.0 2.6 2.3 1.8 11 e131 e7825 46 47 64 26 22 6.6 4.8 2.9 2.9 8.0 e86 e5226 44 52 60 25 21 6.5 5.2 2.9 2.2 6.6 e71 e3727 39 50 54 23 20 6.3 5.0 2.9 1.9 10 e92 e3028 38 50 52 24 19 6.7 3.6 1.9 1.9 9.7 e112 e2829 37 — 65 25 18 6.1 2.6 3.5 2.4 10 e78 e2830 35 — 56 22 18 4.9 2.1 4.4 3.0 16 e50 e3031 34 — 52 — 17 — 2.0 5.5 — 11 — e70
TOTAL 9404 894 2436 1373 1370 345.4 159 137.4 128.9 183 1614.5 2101MEAN 303.3 32.0 78.6 45.7 44.2 11.5 5.1 4.4 4.3 5.9 53.8 67.8MAX 1740 52 180 88 109 20 7.8 12 13 16 189 297MIN 34 24 42 22 17 4.9 2.0 1.2 1.4 1.2 4.1 12AC-FT 18650 1773 4832 2723 2717 685 315 273 256 363 3202 4167e=estimated value
MCSC — 14206070 — McKay Creek at Scotch Church Road above Waible Creek near North Plains, Oregon [RM 6.3]
20092008
1/1
2/1
3/1
4/1
5/1
6/1
7/1
8/1
9/1
10/1
11/1
12/1
1/1
1
10
100
1000
10000
Dai
ly M
ean
Dis
char
ge
(cfs
)

APPENDIX A—Stream Gauge Records2009 Tualatin River Flow Management Report A-15
MCKP – 14206190 – MCKAY CREEK AT PADGETT ROAD NEAR HILLSBORO, OREGON [RM 1.31]Latitude: 45 31 57 Longitude: 123 00 16 Source Agency: WEST Consultants for Clean Water Services
Day2009 Daily Mean Discharge in Cubic Feet per Second
JAN FEB MAR APR MAY JUN JUL AUG SEP OCT NOV DEC 1 1060 42 78 73 24 14 6.3 3.7 5.8 6.3 26 85 2 e2200 41 106 105 41 13 6.0 3.7 5.6 6.4 18 67 3 e1300 40 124 141 46 12 5.4 4.4 5.4 6.3 11 53 4 e662 39 119 127 55 12 5.8 4.1 4.9 6.0 8.1 43 5 e443 37 108 113 188 13 6.0 3.9 6.9 5.9 7.4 37 6 e420 37 112 101 176 14 5.9 4.0 12 5.8 31 32 7 e540 36 95 85 228 14 6.0 4.5 13 5.9 93 29 8 e1540 33 91 78 243 14 6.2 5.4 10 5.8 156 27 9 e1330 33 91 71 186 13 6.2 6.0 7.9 5.7 83 2310 e760 35 85 67 125 13 6.3 6.0 6.9 5.4 59 1811 e431 39 74 60 89 12 6.5 6.2 6.4 5.5 61 1812 e304 37 67 54 74 12 6.6 13 5.6 5.7 44 1913 e252 38 62 68 66 11 7.3 11 5.6 6.0 42 2114 e224 38 64 66 79 15 7.4 10 6.0 15 48 2315 e194 37 167 60 68 14 6.6 8.4 5.7 10 44 12916 e165 37 470 52 50 12 6.1 7.6 5.9 11 34 60417 e140 36 520 51 43 11 5.0 6.9 6.4 23 48 90418 e121 34 558 53 37 10 4.7 6.6 6.0 10 64 85719 e105 31 561 45 41 15 4.5 5.9 6.3 8.4 85 69720 e94 29 510 41 40 16 4.6 5.8 6.2 9.0 153 53621 e86 28 408 39 32 13 4.7 5.7 5.9 12 186 53122 e79 30 295 39 28 11 5.2 5.1 5.5 8.5 314 56523 e73 38 191 36 26 9.9 5.0 5.1 5.0 17 522 47024 65 61 133 35 23 9.2 4.4 4.9 4.9 15 445 35825 63 75 107 32 21 9.1 3.7 4.7 4.9 15 312 25826 60 84 92 29 20 7.7 4.8 4.9 5.2 19 184 18027 52 85 78 28 18 7.3 4.9 4.9 5.0 14 252 13128 52 78 75 29 18 7.2 4.9 4.8 4.6 17 273 10129 49 — 101 31 17 7.4 4.3 4.9 5.3 33 171 8530 46 — 87 27 15 6.8 4.0 5.3 5.5 38 114 8531 44 — 74 — 14 — 4.1 5.6 — 32 — 171
TOTAL 12954 1208 5703 1836 2131 348.6 169.4 183 190.3 383.6 3888.5 7157MEAN 417.7 43.2 184.0 61.2 68.8 11.5 5.5 5.9 6.4 12.3 129.6 230.9MAX 2200 85 561 141 243 16 7.4 13 13 38 522 904MIN 44 28 62 27 14 6.8 3.7 3.7 4.6 5.4 7.4 18AC-FT 25690 2396 11310 3642 4227 691 336 363 377 761 7713 14200e=estimated value
20092008
MCKP — 14206190 — McKay Creek at Padgett Road near Hillsboro, Oregon [RM 1.31]
1/1
2/1
3/1
4/1
5/1
6/1
7/1
8/1
9/1
10/1
11/1
12/1
1/1
1
10
100
1000
10000
Dai
ly M
ean
Dis
char
ge
(cfs
)

APPENDIX A—Stream Gauge RecordsA-16 2009 Tualatin River Flow Management Report
DAIRY – 14206200 – DAIRY CREEK AT HWY 8 NEAR HILLSBORO, OREGON [RM 2.06]Latitude: 45 30 38 Longitude: 123 06 56 Source Agency: District 18 Watermaster
Day2009 Daily Mean Discharge in Cubic Feet per Second
JAN* FEB MAR* APR MAY* JUN JUL AUG SEP OCT NOV* DEC* 1 r 238 444 373 136 108 44 e13 23 34 114 525 2 r 222 487 415 163 105 41 e14 21 41 107 423 3 r 211 e555 503 216 102 34 e16 22 41 90 334 4 r 202 e570 478 224 98 34 e14 20 38 81 273 5 r 196 546 437 e370 95 36 e18 30 34 76 235 6 r 194 555 395 r 100 39 e20 56 33 96 207 7 r 196 506 357 r 101 42 e22 68 33 170 184 8 r 187 461 346 r 99 40 e26 68 29 393 155 9 r 181 449 322 r 95 42 e32 56 27 348 16110 r 181 423 303 e700 90 42 e36 49 23 289 15211 r 195 376 284 e595 87 45 e35 42 21 319 14812 r 196 333 251 534 83 45 59 38 25 337 13913 r 200 304 313 471 77 50 68 36 26 284 14014 r 208 292 383 476 87 53 63 36 54 271 13615 r 204 e550 364 453 90 48 52 33 64 247 e29216 r 203 r 328 349 82 44 46 28 74 197 e71717 r 199 r 303 285 78 36 41 31 77 230 r18 r 188 r 297 245 77 32 38 30 64 524 r19 r 179 r 259 231 81 29 32 35 60 e660 r20 r 172 r 233 219 85 31 28 32 59 r r21 r 168 r 213 185 80 31 28 32 63 r r22 r 169 r 196 166 72 30 27 28 62 r r23 e635 183 e726 179 155 66 28 30 21 71 r r24 497 253 e660 174 147 63 27 27 22 74 r r25 422 401 e615 165 138 60 26 23 18 80 r r26 390 468 e550 155 132 56 27 22 18 80 r r27 346 505 494 147 127 53 27 32 15 78 r e69028 325 472 446 149 122 51 30 24 12 84 r e60229 302 — 492 161 119 48 26 21 12 108 e740 51130 273 — 474 149 113 45 e26 25 21 122 e630 47431 253 — 406 — 109 — e17 27 — 120 — e558
TOTAL 6571 8632 7180 2414 1102 959 953 1799MEAN 235 288 266 80.5 35.5 30.9 31.8 58MAX 505 503 700 108 53 68 68 122MIN 168 147 109 45 17 13 12 21AC-FT 13030 17120 14240 4790 2190 1900 1890 3570*Incomplete record (monthly totals were computed when at least 80% of the record was complete for the month); e=estimated value; r=rating curve exceeded.
DAIRY — 14206200 — Dairy Creek at Hwy 8 near Hillsboro, Oregon [RM 2.06]
20092008
1/1
2/1
3/1
4/1
5/1
6/1
7/1
8/1
9/1
10/1
11/1
12/1
1/1
1
10
100
1000
Dai
ly M
ean
Dis
char
ge
(cfs
)

APPENDIX A—Stream Gauge Records2009 Tualatin River Flow Management Report A-17
TRJB – 14206241 – TUALATIN RIVER AT HWY 219 BRIDGE [RM 44.4]Latitude: 45 30 01 Longitude: 122 59 24 Source Agency: Jackson Bottom Wetland Education Center
Day2009 Daily Mean Discharge in Cubic Feet per Second
JAN* FEB MAR APR MAY JUN JUL AUG SEP OCT NOV DEC 1 2416 643 1018 901 442 200 100 115 111 143 299 1094 2 2851 615 1040 925 499 185 126 121 91 131 274 936 3 589 1178 1060 624 176 120 127 92 108 193 789 4 557 1210 1054 622 151 123 105 109 102 144 693 5 533 1151 996 1083 160 131 104 122 108 136 634 6 531 1166 914 1459 208 150 105 172 100 136 579 7 538 1107 867 1651 223 159 115 232 112 357 529 8 527 1037 867 1758 214 141 115 231 110 867 467 9 514 1008 845 1651 171 121 128 161 109 911 37310 498 967 818 1460 141 135 144 105 108 821 46411 513 898 790 1292 132 143 125 84 106 823 48912 526 827 736 1144 133 161 141 76 112 780 40513 525 776 842 1053 111 196 215 89 112 688 36614 538 746 979 1075 125 203 171 91 119 648 34315 523 1035 964 1089 206 161 127 99 166 606 59416 3057 522 1763 906 931 166 135 116 109 170 540 163817 2961 512 1972 844 812 117 110 113 125 126 726 214318 2796 489 2062 815 750 134 102 79 133 107 1297 227319 2598 483 2099 751 718 151 107 79 124 101 1387 226520 2381 478 2062 702 693 168 118 79 138 102 1661 216821 2133 461 1947 637 600 179 106 104 132 124 1763 206722 1745 462 1774 563 513 194 102 126 99 135 1839 206923 1356 495 1563 520 466 124 143 135 92 154 2086 202424 1112 652 1381 507 427 96 127 142 101 162 2137 190725 977 979 1263 489 407 98 125 108 115 176 2052 173026 920 1101 1160 446 365 100 127 77 116 144 1795 153227 847 1153 1063 430 332 95 122 88 118 137 1707 135528 814 1089 987 423 303 93 101 100 122 177 1703 120129 775 — 1045 463 277 94 94 110 121 212 1497 108630 722 — 1050 485 234 74 108 132 124 243 1277 103531 672 — 960 — 224 — 114 138 — 233 — 1122
TOTAL 17044 39314 22536 24949 4413 4012 3683 3631 4245 31150 36368MEAN 609 1268 751 805 147 129 119 121 137 1038 1173MAX 1153 2099 1060 1758 223 203 215 232 243 2137 2273MIN 461 746 423 224 74 94 77 76 100 136 343AC-FT 33807 77979 44699 49487 8752 7957 7306 7202 8420 61785 72137*Incomplete record (monthly totals were computed when at least 80% of the record was complete for the month).
TRJB — 14206241 —Tualatin River at Hwy 219 Bridge [RM 44.4]
20092008
1/1
2/1
3/1
4/1
5/1
6/1
7/1
8/1
9/1
10/1
11/1
12/1
1/1
10
100
1000
10000
Dai
ly M
ean
Dis
char
ge
(cfs
)

APPENDIX A—Stream Gauge RecordsA-18 2009 Tualatin River Flow Management Report
ROOD – 14206295 – TUALATIN RIVER AT ROOD BRIDGE ROAD NEAR HILLSBORO, OREGON [RM 38.4]Latitude: 45 29 24 Longitude: 122 57 06 Source Agency: District 18 Watermaster
Day2009 Daily Mean Discharge in Cubic Feet per Second
JAN FEB MAR APR MAY JUN JUL AUG SEP OCT NOV DEC 1 e2860 635 1040 949 458 208 94 118 131 152 301 e1170 2 e4180 606 1070 998 573 185 123 122 108 150 302 992 3 4860 579 1230 1130 727 177 122 130 105 130 225 828 4 5260 549 1270 1120 721 166 117 116 116 121 167 709 5 5120 524 1200 1050 1340 170 128 108 157 126 151 637 6 4870 515 1190 964 1660 206 142 110 252 117 236 578 7 4620 523 1140 897 1780 222 152 116 268 122 495 523 8 4560 514 1060 888 1860 216 144 122 249 125 1170 468 9 4950 501 1020 872 1760 185 127 126 192 121 1160 37610 5280 491 987 861 1570 159 133 144 133 121 934 34011 5120 532 918 832 1380 146 139 136 109 119 909 e33512 4840 523 836 772 1230 144 151 190 94 121 897 e33013 4500 524 777 869 1130 130 185 259 106 123 804 e33014 4140 531 741 1000 1190 131 206 201 110 186 719 34515 3810 518 1070 997 1170 195 170 149 110 209 649 70216 3530 516 1820 939 1010 185 147 129 121 194 564 175017 3280 504 2060 900 867 133 120 127 136 161 682 234018 3030 480 2150 883 789 140 109 101 148 172 1280 237019 2770 464 2170 793 791 169 111 95 140 136 1410 230020 2510 461 2140 728 768 266 120 91 146 118 1630 222021 2250 444 2040 668 651 227 115 107 146 148 1820 217022 1900 438 1870 592 548 211 106 128 121 176 2000 216023 1480 477 1660 536 488 159 134 138 107 203 2180 208024 1180 708 1460 514 444 114 130 146 111 273 2170 196025 1020 1020 1330 502 422 110 126 133 122 201 2110 179026 944 1140 1220 460 381 109 127 98 128 215 1930 159027 863 1190 1110 441 343 106 125 98 127 308 1970 140028 825 1130 1040 432 315 102 111 110 131 208 1890 124029 785 — 1120 482 289 104 101 119 134 289 1630 111030 726 — 1110 500 246 89 109 134 140 356 e1400 106031 671 — 1020 — 225 — 116 145 — 301 — 1260
TOTAL 96734 17037 40869 23569 27126 4864 4040 4046 4198 5502 33785 37463MEAN 3120 608 1318 786 875 162 130 131 140 177 1126 1208MAX 5280 1190 2170 1130 1860 266 206 259 268 356 2180 2370MIN 671 438 741 432 225 89 94 91 94 117 151 330AC-FT 191900 33790 81060 46750 53800 9650 8010 8030 8330 10910 67010 74310e=estimated value
ROOD — 14206295 — Tualatin River at Rood Bridge Road near Hillsboro, Oregon [RM 38.4]
20092008
1/1
2/1
3/1
4/1
5/1
6/1
7/1
8/1
9/1
10/1
11/1
12/1
1/1
10
100
1000
10000
Dai
ly M
ean
Dis
char
ge
(cfs
)

APPENDIX A—Stream Gauge Records2009 Tualatin River Flow Management Report A-19
RCRR – 14206305 – ROCK CREEK AT NW ROCK CREEK ROAD NEAR BOWERS JUNCTION, OREGON [RM 15.8]Latitude: 45 37 04 Longitude: 12 53 13 Source Agency: WEST Consultants for Clean Water Services
Day2009 Daily Mean Discharge in Cubic Feet per Second
JAN FEB MAR APR MAY JUN JUL AUG SEP OCT NOV DEC 1 43 e1.4 3.3 4.7 1.3 0.29 0.11 e0.01 e0.00 e0.01 0.83 3.1 2 e121 e1.4 4.1 11 2.6 0.30 0.10 e0.01 e0.00 e0.01 0.54 1.9 3 e59 e1.3 5.4 9.7 2.3 0.26 0.09 e0.01 e0.01 e0.01 0.42 1.4 4 e68 1.2 5.0 7.1 7.4 0.24 0.06 e0.01 e0.01 e0.02 0.37 1.2 5 e50 1.2 5.3 5.6 21 0.38 0.05 e0.01 e0.04 e0.02 0.38 0.98 6 e48 1.2 5.6 4.5 15 0.41 0.03 e0.00 e0.14 e0.01 1.3 3.2 7 e45 1.1 4.9 4.0 13 0.33 0.03 e0.01 e0.02 e0.01 3.7 2.9 8 e58 1.1 4.8 3.4 8.1 0.31 0.04 e0.01 e0.02 e0.01 3.2 0.98 9 e31 1.1 5.2 3.0 5.8 0.24 0.05 e0.01 e0.02 e0.01 1.9 0.7410 e25 1.2 4.9 3.1 4.3 0.28 0.05 e0.01 e0.02 e0.01 1.9 0.8311 e20 1.4 4.2 2.6 3.5 0.26 0.05 e0.11 e0.02 e0.01 1.5 0.8212 e15 1.5 3.6 3.0 3.1 0.23 0.06 e0.29 e0.02 e0.01 1.2 0.8213 e13 1.8 3.2 4.4 3.0 0.21 0.10 e0.03 e0.02 e0.05 1.6 0.5814 e11 1.7 3.8 4.3 4.3 0.23 0.11 e0.01 e0.02 e0.24 1.6 0.9515 e9.9 1.7 23 3.7 3.1 0.20 0.10 e0.01 e0.02 e0.07 1.3 2416 e9.2 1.7 19 3.1 2.5 0.14 0.07 e0.01 e0.02 e0.04 1.4 4117 e8.0 1.5 13 3.7 2.1 0.13 0.04 e0.01 e0.02 e0.07 2.7 2318 e6.8 1.3 11 3.6 1.8 0.13 0.03 e0.01 e0.02 0.14 2.9 1219 e5.5 1.1 8.8 3.2 2.0 0.48 0.01 e0.00 e0.02 0.06 4.3 8.3 20 e4.7 1.1 7.3 2.8 1.4 0.50 0.01 e0.00 e0.02 0.02 5.2 7.1 21 e4.1 1.0 6.0 2.5 1.2 0.52 0.01 e0.00 e0.02 0.16 5.3 2122 e3.7 1.1 5.0 2.2 1.0 0.45 e0.01 e0.00 e0.02 0.19 13 1623 e3.1 1.8 4.0 2.0 0.91 0.33 e0.01 e0.00 e0.02 0.89 6.1 9.8 24 e2.8 3.5 3.9 1.8 0.77 0.32 e0.01 e0.00 e0.01 0.62 3.2 7.0 25 e3.0 4.3 3.7 1.6 0.66 0.27 e0.01 e0.00 e0.01 0.32 2.2 5.6 26 e2.6 4.5 3.3 1.5 0.60 0.23 e0.01 e0.01 e0.01 0.96 3.7 4.7 27 e2.4 3.9 3.0 1.5 0.54 0.19 e0.01 e0.01 e0.01 0.93 12 4.0 28 e2.5 3.5 3.7 1.7 0.48 0.17 e0.01 e0.01 e0.01 0.57 8.2 3.4 29 e2.5 — 4.9 1.6 0.42 0.15 e0.01 e0.00 e0.01 1.9 7.1 3.0 30 e1.8 — 4.2 1.4 0.37 0.11 e0.01 e0.00 e0.01 1.3 5.6 3.1 31 e1.6 — 3.9 — 0.32 — e0.01 e0.00 — 1.3 — 21
TOTAL 681.2 50.6 191 108.3 114.87 8.29 1.3 0.6 0.61 9.97 104.64 234.4MEAN 22.0 1.8 6.2 3.6 3.7 0.28 0.041 0.018 0.018 0.32 3.5 7.6MAX 121 4.5 23 11 21 0.52 0.11 0.29 0.14 1.9 13 41MIN 1.6 1.0 3.0 1.4 0.32 0.11 0.01 0.00 0.00 0.01 0.37 0.58AC-FT 1351 100 379 215 228 16 2.6 1.2 1.2 20 208 465e=estimated value
RCRR — 14206305 — Rock Creek at NW Rock Creek Road near Bowers Junction, Oregon [RM 15.8]
20092008
1/1
2/1
3/1
4/1
5/1
6/1
7/1
8/1
9/1
10/1
11/1
12/1
1/1
0.01
0.1
1
10
100
1000
Dai
ly M
ean
Dis
char
ge
(cfs
)

APPENDIX A—Stream Gauge RecordsA-20 2009 Tualatin River Flow Management Report
RCWU – 14206338 – ROCK CREEK AT WEST UNION ROAD NEAR BETHANY, OREGON [RM 9.0]Latitude: 45 33 34 Longitude: 122 52 30 Source Agency: WEST Consultants for Clean Water Services
Day2009 Daily Mean Discharge in Cubic Feet per Second
JAN FEB MAR APR MAY JUN JUL** AUG** SEP** OCT** NOV** DEC** 1 221 7.3 e8.8 6.5 1.9 1.6 0.52 2 552 7.0 e9.1 19 3.7 1.5 0.34 3 223 7.0 12 18 4.2 1.4 4 53 6.9 10 12 7.0 1.3 5 63 6.9 10 9.4 47 1.5 6 65 7.0 11 7.5 27 1.8 7 67 6.7 9.1 6.2 25 1.9 8 160 6.3 9.0 5.7 16 1.9 9 115 6.6 9.0 5.1 12 1.910 57 6.7 9.3 5.4 11 1.911 41 8.1 7.7 4.8 10 1.812 33 7.4 6.5 4.3 11 1.713 26 7.7 5.9 6.6 12 1.714 22 7.7 5.8 5.9 22 1.615 18 7.7 32 5.2 e12 1.516 15 7.8 43 4.4 e9.0 1.317 13 7.4 26 5.0 e7.5 1.118 12 6.9 21 4.9 e6.4 0.8419 10 6.4 16 4.2 11 0.8820 9.6 6.3 13 3.7 e8.0 1.321 9.0 6.1 11 3.4 e6.5 1.122 8.6 6.2 8.8 3.0 6.1 1.123 7.9 e6.8 7.0 2.6 5.5 1.124 7.1 e7.2 6.8 2.5 4.8 1.225 7.2 e7.5 6.2 2.3 4.5 1.226 7.1 e7.8 5.9 2.1 4.0 1.227 6.6 e8.1 5.0 2.1 3.5 1.328 7.2 e8.5 5.5 2.2 2.9 1.329 7.0 — 9.1 2.5 2.5 1.230 6.5 — 6.9 2.1 2.0 0.8731 6.9 — 6.2 — 1.7 — — —
TOTAL 200 352.6 168.6 307.7 41.99 0.86MEAN 59.9 7.2 11.4 5.6 9.9 1.4MAX 552 8.5 43 19 47 1.9MIN 6.5 6.1 5.0 2.1 1.7 0.84AC-FT 3683 397 699 334 610 83**site discontinued 7/3/2009; e=estimated value;
RCWU — 14206338 — Rock Creek at West Union Road near Bethany, Oregon [RM 9.0]
20092008
1/1
2/1
3/1
4/1
5/1
6/1
7/1
8/1
9/1
10/1
11/1
12/1
1/1
0.1
1
10
100
1000
Dai
ly M
ean
Dis
char
ge
(cfs
)

APPENDIX A—Stream Gauge Records2009 Tualatin River Flow Management Report A-21
RCQR – 14206347 – ROCK CREEK AT QUATAMA ROAD NEAR ORENCO, OREGON [RM 4.9]Latitude: 45 31 25 Longitude: 122 54 34 Source Agency: WEST Consultants for Clean Water Services
Day2009 Daily Mean Discharge in Cubic Feet per Second
JAN FEB MAR APR MAY JUN JUL AUG SEP OCT NOV DEC 1 341 10 18 21 6.4 2.9 1.7 0.77 0.77 2.0 8.9 22 2 1060 9.8 31 44 28 2.9 1.7 0.84 0.69 1.3 5.4 16 3 436 9.8 43 43 16 3.1 1.6 0.80 0.79 0.98 4.0 12 4 149 9.5 31 31 42 3.4 1.6 0.80 0.68 1.1 3.0 9.9 5 183 9.4 30 24 132 4.5 1.5 0.81 9.3 1.1 2.9 8.6 6 145 9.9 33 20 63 4.0 1.3 0.90 9.5 0.87 35 7.5 7 139 9.4 25 17 48 3.8 1.2 1.00 5.3 0.69 110 8.5 8 253 8.6 24 16 29 3.5 1.2 0.89 2.6 0.67 151 7.0 9 169 8.6 25 15 19 3.4 1.3 1.0 2.0 0.67 33 5.6 10 96 13 25 19 14 4.0 1.4 0.99 1.3 0.52 23 4.6 11 71 13 21 14 11 3.7 1.5 1.6 1.2 0.47 24 4.4 12 59 9.9 18 16 13 3.5 1.5 14 1.3 0.43 23 4.3 13 48 11 16 23 17 3.7 3.1 5.2 0.81 1.1 24 4.5 14 40 10 17 18 31 3.4 2.6 2.7 0.71 17 16 9.4 15 35 9.9 75 15 14 3.2 1.8 1.9 1.1 5.2 12 14316 30 10 88 12 9.9 3.1 1.5 1.7 1.1 2.6 10 25117 26 9.1 63 22 8.5 3.0 1.3 1.4 3.0 8.2 47 21818 23 8.3 51 16 7.6 2.7 1.2 1.3 1.7 7.4 35 8119 20 7.8 39 12 16 11 1.0 1.6 1.1 3.0 31 5220 18 7.4 33 11 9.2 14 0.92 1.1 0.85 2.3 44 4521 17 7.3 28 9.7 6.9 6.1 0.99 0.97 0.76 10 42 8722 16 7.5 24 8.8 6.3 4.0 1.1 0.95 0.73 7.3 122 8123 15 19 20 7.9 5.8 3.1 0.97 0.87 0.53 20 58 5224 13 32 20 7.6 5.1 2.8 0.87 0.73 0.40 9.0 33 3725 15 30 18 7.2 4.7 2.5 0.95 0.74 0.32 3.1 22 2926 13 28 17 6.8 4.5 2.2 0.94 0.83 0.30 28 48 2427 13 21 14 6.5 4.2 2.0 1.00 0.76 0.32 12 117 2028 15 18 21 7.6 3.9 2.2 0.92 0.74 0.31 4.2 54 1629 13 — 29 10.0 3.6 2.0 0.88 0.77 0.73 32 38 1530 12 — 20 7.2 3.3 1.7 0.85 1.1 2.2 12 29 3131 11 — 18 — 3.0 — 0.83 0.83 — 14 — 118
TOTAL 3494 357.2 935 488.3 585.9 115.4 41.22 50.59 52.4 209.2 1205.2 1424.3MEAN 112.5 12.8 30.2 16.2 18.9 3.9 1.3 1.6 1.7 6.8 40.2 46.0MAX 1060 32 88 44 132 14 3.1 14 9.5 32 151 251MIN 11 7.3 14 6.5 3.0 1.7 0.83 0.73 0.30 0.43 2.9 4.3AC-FT 6930 708 1855 969 1162 229 82 100 104 415 2390 2825
RCQR — 14206347 — Rock Creek at Quatama Road near Orenco, Oregon [RM 4.9]
20092008
1/1
2/1
3/1
4/1
5/1
6/1
7/1
8/1
9/1
10/1
11/1
12/1
1/1
0.1
1
10
100
1000
10000
Dai
ly M
ean
Dis
char
ge
(cfs
)

APPENDIX A—Stream Gauge RecordsA-22 2009 Tualatin River Flow Management Report
BCCH – 14206360 – BEAVERTON CREEK AT CEDAR HILLS BLVD AT BEAVERTON, OREGON [RM 7.45]Latitude: 45 49 31 Longitude: 122 81 05 Source Agency: WEST Consultants for Clean Water Services
Day2009 Daily Mean Discharge in Cubic Feet per Second
JAN FEB MAR APR MAY JUN JUL AUG SEP OCT NOV DEC 1 146 3.4 5.2 8.9 2.5 1.8 1.5 1.2 1.4 1.6 8.4 10 2 150 3.4 11 13 32 1.8 1.2 1.2 1.3 1.1 7.2 9.3 3 21 3.2 14 6.0 7.3 1.7 1.7 1.3 2.6 1.1 6.3 8.5 4 14 3.3 4.7 4.4 51 3.2 1.4 1.3 1.7 2.3 6.7 8.2 5 33 3.1 5.9 3.7 34 3.9 1.4 1.1 34 1.3 7.6 7.5 6 18 4.5 4.9 3.6 24 2.1 1.6 1.2 20 1.4 36 7.1 7 26 3.0 3.8 3.5 18 2.3 1.3 1.2 4.9 1.3 96 8.6 8 37 3.5 3.7 3.7 10 2.1 1.3 1.1 2.4 1.5 55 6.2 9 13 3.1 5.2 4.1 9.2 2.0 1.2 1.2 1.7 1.5 45 5.9 10 11 9.6 4.0 6.7 7.6 2.3 1.2 1.2 1.3 1.5 35 5.8 11 11 4.8 3.2 2.7 6.3 2.2 1.1 3.7 1.0 1.6 41 5.9 12 12 4.9 3.3 7.8 6.9 1.9 2.0 29 0.76 3.0 50 6.0 13 9.2 5.5 2.8 5.5 16 2.0 2.2 3.9 0.69 5.3 32 7.4 14 8.6 3.7 9.6 3.7 10.0 2.0 2.4 1.6 0.78 17 22 1315 8.0 4.8 35 3.0 5.9 1.8 1.2 1.4 0.91 3.4 14 2516 7.3 3.3 14 2.5 4.4 1.8 1.1 1.5 1.3 2.2 15 11117 5.9 3.2 14 10 3.7 2.4 1.3 2.2 1.9 11 39 3518 5.9 2.0 7.5 3.1 3.8 1.9 1.3 1.3 1.3 1.8 25 2819 5.9 2.3 5.6 2.9 18 23 1.3 1.1 4.3 5.6 19 2520 5.9 2.6 5.0 2.8 4.4 13 1.4 1.0 1.5 6.9 24 2321 5.7 1.9 4.5 2.8 3.0 5.2 1.2 1.0 1.3 12 24 3822 5.3 2.1 4.6 2.6 2.7 2.4 1.2 1.1 0.91 23 49 2023 4.6 15 4.9 2.8 2.4 1.9 1.4 1.0 0.83 28 20 1724 4.7 26 4.4 2.8 2.4 1.8 1.2 1.1 0.82 13 17 1625 6.9 11 5.2 2.3 2.2 1.8 1.2 0.93 0.71 13 18 1526 4.4 8.0 3.7 2.3 2.2 1.6 1.2 0.87 0.84 33 45 1327 6.3 4.7 3.3 3.0 2.2 1.5 1.2 0.90 0.82 18 24 1228 4.5 3.6 14 6.9 2.0 1.6 1.4 0.96 1.0 18 20 1129 3.9 — 6.9 2.9 2.0 1.6 1.2 1.1 1.3 20 16 1030 3.7 — 4.2 2.3 1.8 1.4 1.3 1.1 2.0 43 12 9.9 31 3.5 — 4.0 — 1.8 — 1.2 1.3 — 13 — 54
TOTAL 602.2 149.5 222.1 132.3 299.7 96 42.8 70.06 96.27 306.4 829.2 572.3MEAN 19.5 5.4 7.2 4.4 9.7 3.2 1.4 2.3 3.2 9.8 27.6 18.5MAX 150 26 35 13 51 23 2.4 29 34 43 96 111MIN 3.5 1.9 2.8 2.3 1.8 1.4 1.1 0.87 0.69 1.1 6.3 5.8AC-FT 1194 297 441 262 594 190 85 139 191 608 1645 1135
BCCH — 14206360 — Beaverton Creek at Cedar Hills Blvd at Beaverton, Oregon [RM 7.45]
20092008
1/1
2/1
3/1
4/1
5/1
6/1
7/1
8/1
9/1
10/1
11/1
12/1
1/1
0.1
1
10
100
1000
Dai
ly M
ean
Dis
char
ge
(cfs
)

APPENDIX A—Stream Gauge Records2009 Tualatin River Flow Management Report A-23
ECMR – 14206365 – ERICKSON CREEK AT MENLO DRIVE AT BEAVERTON, OREGON [RM 0.76]Latitude: 45 29 14 Longitude: 122 58 54 Source Agency: WEST Consultants for Clean Water Services
Day2009 Daily Mean Discharge in Cubic Feet per Second
JAN FEB MAR APR MAY JUN JUL AUG SEP** OCT** NOV** DEC** 1 18 0.14 0.52 0.85 0.13 0.07 0.04 e0.01 0.01 2 14 0.14 1.1 1.5 3.6 0.09 0.04 e0.01 0.01 3 2.7 0.15 1.6 0.39 0.56 0.08 0.04 e0.02 0.06 4 1.6 0.12 0.42 0.27 6.5 0.09 0.04 e0.02 0.01 5 4.0 0.11 0.46 0.20 2.8 0.18 0.06 e0.01 2.7 6 1.9 0.29 0.29 0.15 2.8 0.12 0.06 e0.01 1.8 7 3.4 0.13 0.24 0.14 1.8 0.10 0.05 e0.01 0.05 8 4.3 0.22 0.21 0.14 0.57 0.08 0.04 e0.01 0.03 9 1.3 0.16 0.46 0.23 0.42 0.08 e0.04 e0.01 0.0410 0.87 1.2 0.21 0.56 0.33 0.12 e0.04 e0.01 0.0311 0.69 0.26 0.15 0.19 0.33 0.09 e0.03 e0.20 0.0412 0.76 0.19 0.12 0.84 0.36 0.07 e0.07 2.213 0.44 0.37 0.11 0.48 1.6 0.26 e0.08 0.0614 0.36 0.18 1.5 0.26 0.70 0.17 e0.10 0.0215 0.30 0.28 4.6 0.22 0.27 0.07 e0.03 0.0216 0.25 0.15 2.0 0.18 0.21 0.07 e0.02 0.0117 0.21 0.14 1.7 1.2 0.16 0.06 e0.02 0.0118 0.19 0.13 0.68 0.26 0.17 0.06 e0.02 0.0119 0.17 0.11 0.49 0.20 1.8 1.7 e0.02 0.0120 0.15 0.12 0.39 0.18 0.24 0.72 e0.03 0.0121 0.16 0.10 0.32 0.13 0.17 0.18 e0.01 0.0122 0.16 0.10 0.27 0.14 0.15 0.10 e0.01 0.0123 0.15 2.0 0.45 0.16 0.14 0.09 e0.02 0.0124 0.14 3.6 0.27 0.15 0.14 0.07 e0.01 0.0125 0.42 1.2 0.41 0.16 0.12 0.06 e0.01 0.0126 0.17 0.75 0.22 0.16 0.11 0.06 e0.01 0.0127 0.58 0.35 0.19 0.69 0.10 0.06 e0.01 0.0128 0.21 0.29 1.5 0.72 0.09 0.05 e0.03 0.0129 0.16 — 0.44 0.21 0.07 0.05 e0.01 0.0130 0.16 — 0.26 0.18 0.08 0.05 e0.02 0.0131 0.15 — 0.25 — 0.08 — e0.01 0.01 — —
TOTAL 58.05 12.98 21.83 11.14 26.6 5.05 1.02 2.78MEAN 1.9 0.46 0.70 0.37 0.85 0.17 0.033 0.089MAX 18 3.6 4.6 1.5 6.5 1.7 0.10 2.2MIN 0.14 0.10 0.11 0.13 0.07 0.05 0.01 0.01AC-FT 115 26 43 22 53 10 2.0 5.5**site discontinued 9/12/2009; e=estimated value
ECMR — 14206365 — Erickson Creek at Menlo Drive at Beaverton, Oregon [RM 0.76]
20092008
1/1
2/1
3/1
4/1
5/1
6/1
7/1
8/1
9/1
10/1
11/1
12/1
1/1
0.01
0.1
1
10
100
Dai
ly M
ean
Dis
char
ge
(cfs
)

APPENDIX A—Stream Gauge RecordsA-24 2009 Tualatin River Flow Management Report
JCDV – 14206372 – JOHNSON CREEK AT DAVIS ROAD NEAR BEAVERTON, OREGON [RM 1.3]Latitude:45 28 30 Longitude:122 49 52 Source Agency: WEST Consultants for Clean Water Services
Day2009 Daily Mean Discharge in Cubic Feet per Second
JAN FEB MAR APR MAY JUN JUL AUG SEP OCT NOV DEC 1 e102 1.0 2.5 2.5 1.0 0.59 0.37 0.22 0.13 0.20 2.1 2.8 2 88 1.0 4.6 4.5 11 0.59 0.36 0.20 0.12 0.20 1.6 2.3 3 12 1.0 5.7 2.4 2.7 0.59 0.39 0.19 0.12 0.16 1.4 1.9 4 7.7 0.97 2.9 1.9 29 0.64 0.31 0.18 0.11 0.24 1.3 1.7 5 16 0.97 2.9 1.7 8.8 0.86 0.27 0.16 4.5 0.19 2.9 1.5 6 7.5 1.4 2.5 1.5 8.6 0.71 0.23 0.17 3.7 0.16 9.7 1.5 7 14 1.1 2.0 1.5 5.8 0.67 0.26 0.20 1.1 0.14 41 1.4 8 22 1.0 1.9 1.4 3.2 0.59 0.28 0.20 0.55 0.12 13 1.3 9 7.3 1.0 2.5 1.5 2.4 0.61 0.33 0.20 0.41 0.12 8.0 1.2 10 4.9 2.5 2.0 2.1 2.0 0.80 0.29 0.19 0.33 0.20 5.6 1.2 11 3.8 2.0 1.7 1.4 1.6 0.63 0.30 0.26 0.28 0.28 9.1 1.2 12 3.4 1.5 1.5 2.4 1.6 0.54 0.33 4.6 0.26 0.12 8.7 1.3 13 2.8 1.8 1.4 2.2 3.5 2.8 0.60 0.91 0.21 0.22 6.3 1.3 14 2.4 1.4 3.6 1.6 2.9 1.6 0.38 0.53 0.19 3.5 3.5 4.8 15 2.1 1.5 15 1.3 1.6 0.64 0.36 0.40 0.15 0.68 3.3 3116 1.8 1.3 7.7 1.2 1.3 0.58 0.53 0.33 0.15 0.36 2.6 2517 1.6 1.2 6.9 3.1 1.1 0.55 0.33 0.27 0.16 2.8 13 9.4 18 1.5 1.0 4.2 1.5 1.0 0.56 0.27 0.29 0.15 0.97 4.6 5.8 19 1.4 0.94 3.3 1.3 4.4 1.7 0.23 0.27 0.69 0.53 7.3 4.4 20 1.3 0.90 2.8 1.1 1.3 1.1 0.24 0.23 0.29 0.42 11 5.4 21 1.3 0.87 2.3 1.1 1.0 0.79 0.25 0.17 0.20 2.4 7.5 1022 1.3 0.90 2.1 0.99 0.93 0.61 0.26 0.17 0.20 0.76 21 5.0 23 1.2 4.1 2.1 0.88 0.86 0.56 0.24 0.17 0.21 6.2 5.9 3.5 24 1.1 10.0 1.9 0.84 0.77 0.51 0.23 0.16 0.12 1.4 4.2 2.9 25 1.7 5.7 2.1 0.82 0.72 0.45 0.21 0.13 0.13 0.95 3.1 2.4 26 1.3 3.9 1.6 0.81 0.66 0.38 0.22 0.12 0.13 9.6 18 2.1 27 1.7 2.7 1.4 1.1 0.68 0.38 0.26 0.14 0.11 2.1 13 1.8 28 1.5 2.3 3.9 1.8 0.61 0.38 0.26 0.15 0.07 1.1 5.8 1.7 29 1.2 — 2.6 1.2 0.63 0.38 0.26 0.16 0.11 9.0 4.2 1.5 30 1.1 — 1.8 1.1 0.59 0.35 0.21 0.11 0.24 4.1 3.4 7.0 31 1.1 — 1.7 — 0.58 — 0.20 0.11 — 3.9 — 24
TOTAL 318 55.95 101.1 48.74 102.83 22.14 9.26 11.59 15.12 53.12 242.1 168.3MEAN 10.2 2.0 3.3 1.6 3.3 0.74 0.30 0.37 0.51 1.7 8.0 5.4MAX 102 10.0 15 4.5 29 2.8 0.60 4.6 4.5 9.6 41 31MIN 1.1 0.87 1.4 0.81 0.58 0.35 0.20 0.11 0.07 0.12 1.3 1.2AC-FT 631 111 201 97 204 44 18 23 30 105 480 334e=estimated value
JCDV — 14206372 — Johnson Creek at Davis Road near Beaverton, Oregon [RM 1.3]
20092008
1/1
2/1
3/1
4/1
5/1
6/1
7/1
8/1
9/1
10/1
11/1
12/1
1/1
0.01
0.1
1
10
100
1000
Dai
ly M
ean
Dis
char
ge
(cfs
)

APPENDIX A—Stream Gauge Records2009 Tualatin River Flow Management Report A-25
CMMB – 14206395 – CEDAR MILL CREEK AT MURRAY BLVD NEAR BEAVERTON, OREGON [RM 1.64]Latitude:45 30 37 Longitude: 122 49 18 Source Agency: WEST Consultants for Clean Water Services
Day2009 Daily Mean Discharge in Cubic Feet per Second
JAN FEB MAR APR MAY JUN JUL AUG SEP** OCT** NOV** DEC** 1 e200 2.8 6.0 8.9 3.5 e2.8 e1.8 e1.8 e1.6 2 e180 2.8 11 14 25 e2.8 e1.8 e1.7 e1.6 3 31 2.6 15 6.4 12 e2.8 e1.8 e1.7 e1.6 4 18 2.6 7.8 4.8 39 e4.5 e1.9 e1.7 e1.6 5 40 2.5 9.3 4.4 26 e6.2 e1.9 e1.7 e20 6 26 3.1 8.4 4.1 e23 e3.8 e1.8 e1.7 e6.1 7 e19 2.7 6.2 3.8 e18 e3.1 e1.9 e1.8 e2.4 8 e57 2.4 6.0 4.0 e13 e3.0 e1.8 e1.8 e1.8 9 18 2.6 7.4 4.5 e9.2 e2.9 e1.9 e1.8 e1.710 12 5.4 6.9 7.6 e7.2 e3.7 e2.1 e1.7 e1.711 11 4.8 5.4 4.1 e6.4 e3.7 e1.9 e2.1 e2.012 11 3.0 4.5 9.3 e6.0 e2.7 e2.4 e2113 9.0 3.7 4.1 10 e19 e2.8 e3.5 e2.314 7.9 3.0 6.8 5.6 e14 e2.7 e2.2 e2.015 7.1 4.3 31 4.9 e8.1 e2.4 e2.0 e1.816 6.4 3.4 16 4.1 e6.9 e2.3 e1.9 e1.817 5.7 3.1 14 15 e6.1 e2.6 e1.9 e1.818 5.1 2.5 11 6.2 e5.8 e2.7 e1.9 e1.819 5.5 2.3 6.4 5.2 e16 e7.0 e1.9 e1.820 5.0 2.3 4.0 5.0 e5.9 e7.5 e1.9 e1.821 4.4 2.3 2.8 4.7 e4.7 e3.9 e1.9 e1.722 4.0 2.3 2.9 4.6 e4.3 e2.5 e1.8 e1.823 3.7 11 2.7 4.0 e3.9 e2.1 e1.8 e1.624 3.4 24 3.0 3.8 e3.5 e2.1 e1.8 e1.725 4.7 16 3.1 3.7 e3.3 e1.9 e1.9 e1.626 3.8 9.9 2.7 3.9 e3.3 e1.9 e1.9 e1.627 4.2 6.9 2.4 4.0 e3.3 e1.9 e1.9 e1.628 5.1 5.7 11 7.2 e3.0 e1.8 e1.8 e1.629 3.6 — 7.1 5.0 e2.9 e1.9 e1.9 e1.730 3.1 — 3.9 3.4 e2.9 e1.8 e1.9 e1.731 2.9 — 4.3 — e2.8 — e1.9 e1.6 — —
TOTAL 717.6 140 233.1 176.2 308 93.8 60.7 73.8MEAN 23.1 5.0 7.5 5.9 9.9 3.1 2.0 2.4MAX 200 24 31 15 39 7.5 3.5 21MIN 2.9 2.3 2.4 3.4 2.8 1.8 1.8 1.6AC-FT 1423 278 462 349 611 186 120 146**site discontinued 9/12/2009; e=estimated value
CMMB — 14206395 — Cedar Mill Creek at Murray Boulevard near Beaverton, Oregon [RM 1.64]
20092008
1/1
2/1
3/1
4/1
5/1
6/1
7/1
8/1
9/1
10/1
11/1
12/1
1/1
0.1
1
10
100
1000
Dai
ly M
ean
Dis
char
ge
(cfs
)

APPENDIX A—Stream Gauge RecordsA-26 2009 Tualatin River Flow Management Report
WC143 – 14206410 – WILLOW CREEK AT NW 143RD AVE NEAR BEAVERTON, OREGON [RM 3.5]Latitude: 45 32 12 Longitude: 122 49 24 Source Agency: WEST Consultants for Clean Water Services
Day2009 Daily Mean Discharge in Cubic Feet per Second
JAN FEB MAR APR MAY JUN JUL AUG SEP OCT NOV DEC 1 19 0.89 1.2 2.0 0.32 0.37 0.12 0.06 0.06 0.17 0.58 1.8 2 12 0.89 1.8 2.2 3.0 0.35 0.09 0.06 0.06 0.09 0.39 1.7 3 3.8 0.86 2.2 1.4 1.1 0.35 0.09 0.06 0.15 0.08 0.36 1.6 4 2.5 0.86 1.3 1.2 5.6 0.38 0.10 0.05 0.07 0.15 0.32 1.5 5 5.4 0.85 1.5 1.2 3.6 0.68 0.10 0.05 4.2 0.10 0.71 1.5 6 2.9 0.97 1.4 1.1 2.7 0.47 0.09 0.06 2.1 0.07 3.6 1.5 7 3.4 0.86 1.2 1.1 1.6 0.42 0.09 0.07 0.43 0.06 15 1.4 8 6.3 0.81 1.2 1.1 1.1 0.38 0.11 0.08 0.16 0.05 5.8 1.3 9 2.3 0.82 1.3 1.1 0.98 0.35 0.16 0.09 0.11 0.05 4.0 1.3 10 1.9 1.4 1.2 1.5 0.88 0.35 0.17 0.09 0.09 0.05 3.3 1.3 11 1.8 1.1 1.0 1.0 0.85 0.37 0.17 0.29 0.09 0.04 4.0 1.3 12 1.8 0.92 0.97 1.9 1.2 0.33 0.20 3.0 0.08 0.04 3.5 1.4 13 1.5 1.1 0.94 1.2 2.2 0.32 0.63 0.43 0.06 0.06 3.3 1.4 14 1.4 0.92 1.4 0.73 1.8 0.30 0.37 0.13 0.02 1.8 2.2 2.5 15 1.3 1.3 5.0 0.57 0.96 0.30 0.25 0.10 0.05 0.30 2.1 1116 1.3 0.95 2.5 0.46 0.82 0.28 0.16 0.09 0.07 0.17 1.9 1017 1.2 0.86 2.5 1.8 0.73 0.25 0.14 0.08 0.66 1.6 5.0 5.1 18 1.2 0.81 1.9 0.67 0.78 0.25 0.13 0.07 0.15 0.46 2.9 2.8 19 1.2 0.80 1.6 0.53 1.9 0.99 0.09 0.06 0.12 0.24 3.8 2.4 20 1.2 0.78 1.4 0.48 0.81 0.72 0.07 0.06 0.15 0.16 4.7 3.1 21 1.1 0.80 1.3 0.53 0.67 0.59 0.07 0.06 0.08 1.3 3.7 4.3 22 1.1 0.80 1.3 0.44 0.61 0.44 0.08 0.06 0.05 0.28 8.0 2.9 23 1.1 1.9 1.3 0.37 0.56 0.35 0.07 0.05 0.03 3.5 2.9 2.1 24 1.0 3.0 1.2 0.36 0.53 0.28 0.07 0.05 0.03 0.59 2.2 1.9 25 1.4 2.2 1.2 0.33 0.50 0.22 0.07 0.05 0.04 0.29 1.9 1.8 26 1.1 1.8 1.1 0.35 0.48 0.21 0.08 0.06 0.05 4.5 6.1 1.7 27 1.3 1.3 1.0 0.33 0.47 0.20 0.08 0.06 0.05 1.00 5.6 1.6 28 1.3 1.2 2.2 1.1 0.44 0.17 0.08 0.05 0.05 0.43 2.7 1.5 29 1.1 — 1.6 0.57 0.42 0.14 0.07 0.06 0.07 4.1 2.2 1.7 30 1.0 — 1.2 0.37 0.40 0.16 0.06 0.06 0.29 1.2 1.9 3.8 31 0.99 — 1.3 — 0.38 — 0.06 0.06 — 1.6 — 9.3
TOTAL 85.89 31.75 48.21 27.99 38.39 10.97 4.12 5.6 9.62 24.53 104.66 88.5MEAN 2.8 1.1 1.5 0.93 1.2 0.37 0.13 0.18 0.32 0.79 3.5 2.9MAX 19 3.0 5.0 2.2 5.6 0.99 0.63 3.0 4.2 4.5 15 11MIN 0.99 0.78 0.94 0.33 0.32 0.14 0.06 0.05 0.02 0.04 0.32 1.3AC-FT 170 63 96 56 76 22 8.2 11 19 49 208 176
WC143 — 14206410 — Willow Creek at NW 143rd Avenue near Beaverton, Oregon [RM 3.5]
20092008
1/1
2/1
3/1
4/1
5/1
6/1
7/1
8/1
9/1
10/1
11/1
12/1
1/1
0.01
0.1
1
10
100
Dai
ly M
ean
Dis
char
ge
(cfs
)

APPENDIX A—Stream Gauge Records2009 Tualatin River Flow Management Report A-27
WCHP – 14206413 – WILLOW CREEK AT HERITAGE PARKWAY NEAR BEAVERTON, OREGON [RM 0.75]Latitude: 45 31 12 Longitude: 122 51 35 Source Agency: WEST Consultants for Clean Water Services
Day2009 Daily Mean Discharge in Cubic Feet per Second
JAN FEB MAR APR MAY JUN JUL AUG SEP OCT NOV DEC 1 e36 1.2 3.5 6.8 1.2 0.87 0.31 0.25 0.28 e1.2 9.0 6.4 2 e63 1.4 8.9 9.0 15 0.78 0.31 0.27 0.29 e0.75 7.9 5.4 3 20 1.2 12 3.9 4.8 0.80 0.28 0.35 0.37 e0.55 11 4.9 4 12 1.3 4.8 2.9 e17 1.6 0.37 0.25 0.42 e0.71 11 4.6 5 e29 1.2 6.2 2.5 e21 2.4 0.50 0.24 13 e0.76 15 4.8 6 15 1.7 4.6 2.1 17 1.3 0.35 0.26 6.0 e0.57 27 4.7 7 17 1.4 3.1 1.9 9.8 1.0 0.35 0.25 1.4 e0.48 e49 5.2 8 e31 1.4 3.1 1.9 5.2 0.94 0.47 0.23 0.39 e0.45 e27 4.9 9 11 1.4 4.0 2.4 3.1 0.89 0.40 0.26 0.20 e0.45 18 4.6 10 6.5 6.4 3.2 4.7 2.6 0.96 0.43 0.26 e0.24 e0.45 16 4.6 11 5.6 3.1 2.5 2.2 2.1 0.83 0.55 0.61 e0.24 e0.42 18 4.7 12 5.7 1.9 2.4 7.4 4.3 0.79 0.63 9.3 e0.29 e0.39 16 5.9 13 2.5 3.1 2.1 6.3 10 0.72 2.0 2.2 e0.32 e0.45 16 6.3 14 2.0 2.0 5.8 3.0 8.6 0.70 0.78 0.71 e0.44 e4.0 9.5 1115 1.6 2.5 28 2.5 2.8 0.71 0.56 0.53 e0.47 e7.2 9.1 e4716 1.4 2.0 15 2.0 2.2 0.70 0.55 0.45 e0.74 e1.6 7.7 e4117 1.2 1.6 14 9.4 1.9 0.64 0.40 0.43 e2.9 e4.8 22 e2418 1.1 1.3 7.8 3.0 1.6 0.62 0.35 0.35 e1.0 e6.9 12 1319 1.1 1.3 4.8 2.3 9.4 5.4 0.36 0.30 e0.42 e1.6 16 1120 1.1 1.3 4.2 2.0 2.3 3.1 0.37 0.30 e0.51 e1.5 22 1421 1.1 1.4 3.5 1.8 1.6 1.6 0.28 0.29 e0.35 e5.5 e16 2022 1.1 1.5 3.5 1.6 1.4 1.0 0.25 0.29 e0.32 e1.6 e35 1323 0.99 11 3.3 1.4 1.3 0.81 0.27 0.38 e0.33 e8.1 12 8.9 24 0.98 17 3.5 1.4 1.2 0.74 0.32 0.34 e0.32 e15 8.7 7.5 25 2.5 12 3.8 1.3 1.1 0.63 0.28 0.33 e0.31 e2.2 7.4 6.8 26 1.3 7.4 2.6 1.3 1.1 0.66 0.24 0.33 e0.32 e22 e23 6.2 27 2.3 3.8 2.1 1.2 1.1 0.78 0.32 0.33 e0.33 e4.7 e24 5.8 28 2.4 3.3 10 4.1 1.0 0.50 0.23 0.34 e0.34 3.0 11 5.7 29 1.4 — 5.9 2.3 0.87 0.44 0.24 0.38 e0.39 e23 8.1 5.7 30 1.2 — 3.1 1.4 0.87 0.36 0.30 0.39 e0.97 14 7.2 1731 1.3 — 3.3 — 0.85 — 0.26 0.33 — 14 — 36
TOTAL 96.1 184.6 96 154.29 33.27 13.31 21.53 33.9 148.33 491.6 360.6MEAN 9.0 3.4 6.0 3.2 5.0 1.1 0.43 0.69 1.1 4.8 16.3 11.6MAX 63 17 28 9.4 21 5.4 2.0 9.3 13 23 49 47MIN 0.98 1.2 2.1 1.2 0.85 0.36 0.23 0.23 0.20 0.39 7.2 4.6AC-FT 556 191 366 190 306 66 26 43 67 294 975 715e=estimated value
WCHP — 14206413 — Willow Creek at Heritage Parkway near Beaverton, Oregon [RM 0.75]
20092008
1/1
2/1
3/1
4/1
5/1
6/1
7/1
8/1
9/1
10/1
11/1
12/1
1/1
0.1
1
10
100
Dai
ly M
ean
Dis
char
ge
(cfs
)

APPENDIX A—Stream Gauge RecordsA-28 2009 Tualatin River Flow Management Report
BCSR – 14206419 – BRONSON CREEK AT SALTZMAN ROAD NEAR ORENCO, OREGON [RM 5.1]Latitude: 45 33 19 Longitude: 122 48 25 Source Agency: WEST Consultants for Clean Water Services
Day2009 Daily Mean Discharge in Cubic Feet per Second
JAN FEB MAR APR MAY JUN JUL AUG SEP OCT NOV DEC 1 13 0.43 0.50 0.83 0.38 0.22 0.11 0.06 0.05 0.07 0.14 0.30 2 13 0.43 0.62 1.4 0.98 0.23 0.11 0.05 0.05 0.07 0.11 0.27 3 3.4 0.41 0.77 0.98 0.64 0.21 0.10 0.05 0.09 0.06 0.10 0.26 4 2.2 0.40 0.54 0.80 1.9 0.24 0.10 0.05 0.07 0.07 0.13 0.24 5 3.3 0.40 0.61 0.74 1.9 0.32 0.10 0.07 0.42 0.06 0.17 0.23 6 2.7 0.42 0.53 0.67 1.8 0.29 0.10 0.07 0.16 0.05 0.55 0.22 7 2.9 0.37 0.49 0.64 1.4 0.23 0.12 0.08 0.08 0.05 2.1 0.19 8 4.5 0.38 0.48 0.60 1.1 0.21 0.12 0.07 0.06 0.05 0.72 0.17 9 2.1 0.36 0.52 0.60 0.93 0.19 0.13 0.06 0.05 0.05 0.46 0.1510 1.6 0.47 0.47 0.70 0.80 0.20 0.14 0.09 0.04 0.04 0.40 0.1611 1.4 0.42 0.43 0.56 0.70 0.20 0.11 0.18 0.04 0.04 0.50 0.1512 1.4 0.37 0.39 0.76 0.74 0.17 0.13 0.66 0.03 0.04 0.44 0.1713 1.4 0.40 0.38 0.73 1.0 0.18 0.23 0.13 0.04 0.05 0.40 0.1614 1.2 0.36 0.48 0.62 1.1 0.17 0.13 0.09 0.04 0.23 0.26 0.2715 1.3 0.43 1.6 0.57 0.74 0.16 0.17 0.08 0.03 0.09 0.24 3.4 16 1.5 0.37 1.2 0.53 0.65 0.13 0.10 0.07 0.04 0.09 0.24 3.1 17 0.78 0.36 1.2 0.84 0.56 0.14 0.13 0.07 0.07 0.21 0.78 2.2 18 0.71 0.33 1.0 0.63 0.52 0.13 0.09 0.09 0.04 0.12 0.43 1.4 19 0.69 0.32 0.89 0.58 0.77 0.57 0.08 0.07 0.06 0.09 0.55 1.2 20 0.66 0.31 0.79 0.54 0.49 0.28 0.09 0.06 0.04 0.09 0.73 1.3 21 0.62 0.31 0.69 0.50 0.44 0.20 0.09 0.06 0.03 0.24 0.57 1.6 22 0.59 0.34 0.61 0.46 0.40 0.17 0.08 0.05 0.03 0.12 1.6 1.4 23 0.55 0.54 0.56 0.44 0.37 0.17 0.09 0.04 0.03 0.59 0.51 1.1 24 0.54 0.95 0.55 0.41 0.34 0.14 0.09 0.04 0.03 0.16 0.36 1.0 25 0.57 0.93 0.56 0.39 0.32 0.13 0.09 0.06 0.04 0.13 0.31 0.9326 0.47 0.71 0.49 0.38 0.29 0.12 0.07 0.06 0.04 0.53 1.3 0.8727 0.53 0.55 0.47 0.39 0.28 0.11 0.08 0.04 0.04 0.13 1.3 0.8128 0.56 0.50 0.82 0.56 0.27 0.11 0.07 0.04 0.04 0.10 0.52 0.7829 0.49 — 0.67 0.43 0.25 0.10 0.06 0.06 0.08 0.48 0.39 0.7830 0.47 — 0.56 0.39 0.23 0.11 0.08 0.05 0.09 0.19 0.34 1.2 31 0.45 — 0.59 — 0.23 — 0.06 0.05 — 0.26 — 3.1
TOTAL 65.58 12.57 20.46 18.67 22.52 5.83 3.25 2.7 1.95 4.55 16.65 29.11MEAN 2.1 0.45 0.66 0.62 0.73 0.20 0.11 0.087 0.064 0.15 0.55 0.94MAX 13 0.95 1.6 1.4 1.9 0.57 0.23 0.66 0.42 0.59 2.1 3.4MIN 0.45 0.31 0.38 0.38 0.23 0.10 0.06 0.04 0.03 0.04 0.10 0.15AC-FT 130 25 41 37 45 12 6.4 5.4 3.9 9.0 33 58
BCSR — 14206419 — Bronson Creek at Saltzman Road near Orenco, Oregon [RM 5.1]
20092008
1/1
2/1
3/1
4/1
5/1
6/1
7/1
8/1
9/1
10/1
11/1
12/1
1/1
0.01
0.1
1
10
100
Dai
ly M
ean
Dis
char
ge
(cfs
)

APPENDIX A—Stream Gauge Records2009 Tualatin River Flow Management Report A-29
BCBR – 14206423 – BRONSON CREEK AT BRONSON ROAD NEAR ORENCO, OREGON [RM 2.1]Latitude: 45 32 18 Longitude: 122 51 15 Source Agency: WEST Consultants for Clean Water Services
Day2009 Daily Mean Discharge in Cubic Feet per Second
JAN FEB MAR APR MAY JUN JUL AUG SEP OCT NOV DEC 1 e60 1.7 2.7 4.3 1.3 0.75 0.31 0.18 0.25 0.38 2.8 2.9 2 e70 1.6 5.5 8.1 8.2 0.94 0.38 0.16 0.24 0.25 1.5 2.4 3 23 1.6 7.1 5.0 4.0 0.88 0.39 0.14 0.28 0.21 1.1 2.1 4 11 1.6 3.5 3.5 14 0.76 0.34 0.12 0.33 0.24 1.0 1.9 5 19 1.5 3.7 3.2 24 1.3 0.31 0.12 7.2 0.27 1.6 1.6 6 13 1.8 4.2 2.9 11 1.2 0.26 0.12 4.8 0.21 9.8 1.6 7 14 1.8 2.5 2.6 7.1 0.92 0.24 0.18 1.8 0.15 34 1.3 8 29 1.5 2.5 2.4 4.2 0.88 0.24 0.30 0.91 0.12 25 1.1 9 11 1.5 2.7 2.4 3.2 0.90 0.24 0.26 0.60 0.10 7.9 1.0 10 7.6 2.5 2.7 4.2 2.6 0.85 0.26 0.25 0.42 0.09 7.5 0.9511 6.8 3.2 2.1 2.4 2.5 0.81 0.30 0.41 0.28 0.08 11 0.9412 6.7 1.8 1.8 3.7 3.6 0.68 0.37 5.6 0.17 0.07 8.1 1.1 13 5.9 2.2 1.7 5.9 5.1 0.75 0.67 1.9 0.14 0.10 6.7 1.3 14 5.0 1.9 2.2 3.0 7.9 0.80 0.64 0.75 0.11 2.8 4.2 2.4 15 4.2 2.0 14 2.2 2.9 0.76 0.47 0.51 0.11 1.2 2.9 3716 4.0 2.1 8.6 1.8 2.2 0.89 0.42 0.42 0.16 0.52 2.7 3917 3.3 1.7 7.7 5.7 2.1 0.67 0.40 0.39 0.54 2.7 14 2418 2.6 1.5 6.9 3.2 2.0 0.67 0.36 0.41 0.30 2.3 8.4 8.7 19 2.4 1.4 4.6 2.3 5.5 3.4 0.32 0.45 0.20 0.77 7.8 e7.820 2.4 1.4 4.0 2.2 2.2 4.4 0.31 0.31 0.18 0.61 10 e8.421 2.2 1.3 3.3 2.1 1.5 1.6 0.29 0.24 0.15 2.2 7.8 e1122 2.1 1.4 2.9 1.6 1.4 0.94 0.26 0.27 0.12 1.6 26 e9.923 2.0 4.4 2.4 1.5 1.5 0.75 0.23 0.31 0.11 7.4 7.1 e8.424 1.9 8.6 2.9 1.7 1.1 0.67 0.24 0.17 0.08 3.2 4.0 e7.925 2.7 7.3 2.7 1.2 0.98 0.57 0.24 e0.18 0.07 0.94 2.9 e7.526 2.1 5.4 2.5 1.3 1.0 0.50 0.26 e0.18 0.08 9.9 12 e7.327 1.9 3.4 2.1 1.1 1.2 0.48 0.32 e0.18 0.08 4.1 22 e7.028 3.1 2.7 4.8 2.5 0.79 0.47 0.30 e0.18 0.07 2.0 6.1 e7.029 2.1 — 5.6 2.5 0.90 0.37 0.28 e0.19 0.20 9.8 4.0 e7.230 1.8 — 2.7 1.4 0.79 0.34 0.29 e0.19 0.33 4.4 3.2 e1231 1.8 — 2.7 — 0.79 — 0.21 0.31 — 4.1 — e30
TOTAL 324.6 70.8 125.3 87.9 127.6 29.9 10.15 15.38 20.31 62.81 263.1 262.7MEAN 10.5 2.5 4.0 2.9 4.1 1.00 0.33 0.50 0.68 2.0 8.7 8.5MAX 70 8.6 14 8.1 24 4.4 0.67 5.6 7.2 9.9 34 39MIN 1.8 1.3 1.7 1.1 0.79 0.34 0.21 0.12 0.07 0.07 1.0 0.94AC-FT 644 140 249 174 253 59 20 31 40 125 522 521e=estimated value
BCBR — 14206423 — Bronson Creek at Bronson Road near Orenco, Oregon [RM 2.1]
20092008
1/1
2/1
3/1
4/1
5/1
6/1
7/1
8/1
9/1
10/1
11/1
12/1
1/1
0.01
0.1
1
10
100
Dai
ly M
ean
Dis
char
ge
(cfs
)

APPENDIX A—Stream Gauge RecordsA-30 2009 Tualatin River Flow Management Report
BVTS – 14206435 – BEAVERTON CREEK AT NE GUSTON COURT NEAR ORENCO, OREGON [RM 1.2]Latitude: 45 31 15 Longitude: 122 53 59 Source Agency: WEST Consultants for Clean Water Services
Day2009 Daily Mean Discharge in Cubic Feet per Second
JAN FEB MAR APR MAY JUN JUL AUG SEP OCT NOV DEC 1 280 17 26 33 12 9.2 5.5 5.3 e5.0 8.0 33 30 2 633 17 58 73 93 9.5 5.0 5.1 e5.2 5.2 17 26 3 323 17 84 42 77 9.4 4.2 5.0 e5.3 4.0 12 22 4 136 16 41 29 70 9.1 4.5 4.5 e6.0 4.1 9.5 20 5 202 16 37 24 273 24 4.7 4.1 50 5.8 8.9 19 6 136 18 41 21 116 15 4.2 3.4 63 3.8 100 17 7 117 19 28 20 88 11 4.0 3.0 33 3.1 189 17 8 249 16 25 19 51 10 4.0 3.2 12 3.1 325 20 9 140 17 27 21 35 9.6 4.6 3.6 6.1 3.9 103 1510 96 24 32 37 30 11 4.4 4.2 3.7 4.3 78 1511 82 44 24 24 26 11 4.5 4.6 2.9 4.4 78 1512 65 22 21 24 29 11 4.3 51 2.5 4.7 110 1513 49 25 19 58 35 8.9 12 36 2.5 6.2 73 1614 40 22 23 30 85 11 9.0 14 2.5 47 56 1915 35 20 163 21 31 10 7.0 8.0 2.2 29 34 21116 32 23 111 18 23 8.4 5.4 6.6 3.2 10 31 30617 29 18 88 49 19 8.0 4.3 6.9 6.5 21 100 24018 25 16 68 36 17 8.2 4.0 7.3 9.5 38 85 8319 23 14 43 21 66 26 4.0 6.8 4.7 13 63 5320 23 14 36 18 31 67 3.6 5.8 9.0 8.3 92 5021 22 14 30 17 19 31 4.1 4.7 4.8 26 89 11122 21 13 27 15 15 14 3.7 4.4 3.7 27 210 8923 20 36 26 14 14 10 3.0 3.8 2.8 64 105 4824 19 119 30 14 13 8.3 3.1 4.1 1.7 62 45 3725 26 109 27 12 13 7.6 3.3 4.6 1.5 15 34 3226 24 55 26 12 12 7.0 3.6 4.6 1.9 82 79 2927 21 38 21 12 13 6.7 3.9 4.7 1.9 86 226 2528 31 29 38 22 12 6.0 4.3 e4.5 2.0 23 81 2329 22 — 69 28 11 5.6 5.2 e5.0 3.3 92 43 2230 19 — 30 15 10 5.4 5.6 e5.2 8.8 72 34 5731 18 — 26 — 9.7 — 5.5 e5.3 — 43 — 178
TOTAL 2958 808 1345 779 1348.7 388.9 148.5 239.3 267.2 818.9 2543.4 1860MEAN 95.6 28.9 43.4 26.1 43.5 13.0 4.8 7.7 8.9 26.5 84.8 60.0MAX 633 119 163 73 273 67 12 51 63 92 325 306MIN 18 13 19 12 9.7 5.4 3.0 3.0 1.5 3.1 8.9 15AC-FT 5867 1603 2668 1545 2675 771 295 475 530 1624 5045 3689e=estimated value
BVTS — 14206435 — Beaverton Creek at NE Guston Court near Orenco, Oregon [RM 1.2]
20092008
1/1
2/1
3/1
4/1
5/1
6/1
7/1
8/1
9/1
10/1
11/1
12/1
1/1
1
10
100
1000
Dai
ly M
ean
Dis
char
ge
(cfs
)

APPENDIX A—Stream Gauge Records2009 Tualatin River Flow Management Report A-31
DCBR – 14206443 – DAWSON CREEK AT BROOKWOOD ROAD NEAR HILLSBORO, OREGON [RM 0.7]Latitude: 45 31 27 Longitude:122 56 01 Source Agency: WEST Consultants for Clean Water Services
Day2009 Daily Mean Discharge in Cubic Feet per Second
JAN FEB MAR APR MAY JUN JUL AUG SEP OCT NOV DEC 1 64 1.8 3.9 3.4 1.3 e0.89 e0.59 e0.50 e0.55 e0.62 e2.3 e2.4 2 57 1.8 6.8 4.2 9.9 e1.0 e0.64 e0.49 e1.5 e0.56 e1.4 e2.1 3 17 1.8 7.5 2.8 3.8 e0.96 e0.64 e0.48 e3.0 e0.52 e1.1 e1.8 4 8.1 1.8 4.5 2.3 19 e0.90 e0.61 e0.46 e4.7 e0.55 e1.1 e1.5 5 24 1.8 5.0 2.0 16 e1.3 e0.59 e0.45 e6.2 e0.57 e3.1 e1.4 6 8.8 1.9 4.0 2.0 8.7 e1.2 e0.56 e0.45 e3.8 e0.51 e8.0 e1.5 7 10 1.8 3.3 1.8 e5.8 e1.00 e0.55 e0.50 e2.0 e0.48 e28 e1.4 8 25 1.7 3.4 1.7 e3.7 e1.00 e0.55 e0.58 e0.97 e0.46 e13 e1.5 9 6.9 1.6 3.3 1.8 e3.1 e1.0 e0.54 e0.56 e0.76 e0.44 e6.7 e1.410 5.1 3.0 3.0 3.7 e2.7 e0.98 e0.56 e0.55 e0.69 e0.44 e5.8 e1.311 4.6 2.8 2.7 2.3 e2.3 e0.92 e0.59 e0.64 e0.55 e0.43 e5.9 e1.912 4.7 1.9 2.5 3.4 e2.2 e0.85 e0.63 e4.3 e0.48 e0.43 e7.5 e1.813 4.0 2.7 2.4 4.1 e6.0 e0.90 e0.83 e1.6 e0.47 e0.44 e6.3 e1.514 3.7 2.0 3.5 2.7 e4.7 e0.94 e0.83 e0.89 e0.45 e2.2 e3.5 e5.015 3.3 2.2 16 2.6 e2.3 e0.92 e0.71 e0.71 e0.45 e1.2 e2.6 e3216 3.1 1.9 8.6 2.0 e1.9 e0.99 e0.66 e0.67 e0.49 e0.75 e2.3 e2517 2.9 1.7 7.3 6.0 e1.7 e0.85 e0.66 e0.65 e0.74 e2.2 e9.8 e1218 2.6 1.6 5.6 2.9 e1.8 e0.86 e0.63 e0.66 e0.60 e2.0 e4.3 e6.219 2.5 1.5 4.3 2.1 e4.5 e2.8 e0.59 e0.69 e0.52 e0.95 e5.1 e4.820 2.5 1.5 3.7 1.8 e2.0 e3.4 e0.59 e0.60 e0.50 e0.82 e9.0 e9.921 2.3 1.5 3.3 1.6 e1.4 e1.6 e0.58 e0.54 e0.48 e3.0 e6.3 e1222 2.4 1.6 2.8 1.5 e1.4 e1.0 e0.55 e0.57 e0.46 e2.7 e18 e6.123 2.2 6.4 2.7 1.6 e1.4 e0.86 e0.53 e0.59 e0.46 e7.6 e5.1 e4.324 2.2 7.7 3.1 1.6 e1.1 e0.85 e0.54 e0.51 e0.44 e1.8 e3.8 e3.525 3.0 5.2 2.9 1.5 e1.1 e0.78 e0.55 e0.50 e0.44 e1.0 e2.7 e2.926 2.3 4.7 2.7 1.5 e1.1 e0.72 e0.56 e0.50 e0.43 e9.8 e17 e2.627 2.3 4.4 2.4 1.6 e1.2 e0.70 e0.58 e0.50 e0.43 e3.4 e9.9 e2.328 2.7 3.3 5.2 2.0 e0.95 e0.69 e0.58 e0.51 e0.42 e1.8 e4.9 e2.029 2.2 — 4.6 2.1 e1.0 e0.64 e0.57 e0.50 e0.49 e8.7 e3.5 e2.130 2.0 — 2.9 1.5 e0.93 e0.60 e0.56 e0.51 e0.61 e3.6 e2.9 e9.931 2.0 — 2.6 — e0.93 — e0.52 e0.59 — e3.2 — e31
TOTAL 285.4 73.6 136.5 72.1 115.9 32.1 18.67 22.25 34.08 63.17 200.9 195.1MEAN 9.2 2.6 4.4 2.4 3.7 1.1 0.60 0.72 1.1 2.0 6.6 6.3MAX 64 7.7 16 6.0 19 3.4 0.83 4.3 6.2 9.8 28 32MIN 2.0 1.5 2.4 1.5 0.93 0.60 0.52 0.45 0.42 0.43 1.1 1.3AC-FT 566 146 271 143 230 64 37 44 68 125 398 387e=estimated value
DCBR — 14206443 — Dawson Creek at Brookwood Road near Hillsboro, Oregon [RM 0.7]
20092008
1/1
2/1
3/1
4/1
5/1
6/1
7/1
8/1
9/1
10/1
11/1
12/1
1/1
0.1
1
10
100
Dai
ly M
ean
Dis
char
ge
(cfs
)

APPENDIX A—Stream Gauge RecordsA-32 2009 Tualatin River Flow Management Report
RCTV – 14206450 – ROCK CREEK AT HWY 8 NEAR HILLSBORO, OREGON [RM 1.2]
Latitude: 45 30 08 Longitude: 122 56 52 Source Agency: WEST Consultants for Clean Water Services
Day2009 Daily Mean Discharge in Cubic Feet per Second
JAN FEB MAR APR MAY JUN JUL AUG SEP OCT NOV DEC 1 e820 45 59 61 33 26 8.9 7.4 6.3 16 75 63 2 e1950 43 116 132 150 26 9.2 6.7 6.4 12 31 51 3 e974 43 170 114 152 27 8.5 6.4 6.3 9.1 23 44 4 e409 42 105 78 128 26 8.1 6.3 8.2 8.3 21 41 5 e534 42 88 63 534 39 8.1 6.0 51 11 20 39 6 e403 43 94 55 308 38 7.6 5.8 132 9.5 182 37 7 e371 45 71 51 229 32 7.1 6.3 60 7.3 374 35 8 e676 41 63 48 145 30 7.3 7.0 24 6.1 636 37 9 e439 41 64 48 90 29 8.5 7.4 15 5.4 296 3310 e287 48 74 68 65 32 8.3 7.3 10 5.7 175 3111 e235 84 60 57 55 32 8.4 7.2 8.1 4.7 155 3012 e194 50 52 49 61 31 7.8 81 7.9 4.7 197 3013 e155 52 49 103 68 30 15 67 7.0 4.8 160 3214 e130 50 50 68 177 32 16 23 6.8 94 128 3715 e115 46 274 52 73 32 12 14 6.7 63 62 41116 e102 49 330 45 50 28 10 10 7.7 20 54 65517 e92 43 267 80 44 28 8.3 9.6 14 27 179 71118 e81 41 254 83 41 27 7.5 8.9 17 65 217 43419 e73 38 211 48 103 43 7.8 8.8 11 25 142 32820 e69 37 186 43 74 128 7.6 7.9 14 15 193 27621 e65 37 142 40 43 47 7.1 7.7 11 31 236 37022 e63 37 94 38 37 23 7.0 7.1 8.4 54 474 35323 55 63 65 36 35 17 6.5 6.5 6.6 93 370 23924 51 202 65 35 34 14 5.8 6.8 5.9 169 219 16625 58 198 60 34 32 12 5.9 6.6 5.1 29 171 10826 58 118 59 33 31 12 5.9 6.9 5.3 112 178 7227 50 85 50 33 31 11 5.9 5.9 5.0 217 513 6028 64 64 64 36 31 10 5.4 5.6 4.7 51 263 5429 54 — 140 54 29 9.7 5.8 6.3 5.7 167 118 5130 48 — 71 38 28 9.1 6.6 6.7 15 170 78 9131 46 — 58 — 27 — 6.3 6.9 — 91 — 370
TOTAL 8721 1727 3505 1723 2938 880.8 250.2 377 492.1 1597.6 5940 5289MEAN 281.3 61.7 113.1 57.4 94.8 29.4 8.1 12.2 16.4 51.5 198.1 170.5MAX 1950 202 330 132 534 128 16 81 132 217 636 711MIN 46 37 49 33 27 9.1 5.4 5.6 4.7 4.7 20 30AC-FT 17300 3425 6952 3418 5827 1747 496 748 976 3169 11780 10490e=estimated value
RCTV — 14206450 — Rock Creek at Hwy 8 near Hillsboro, Oregon [RM 1.2]
20092008
1/1
2/1
3/1
4/1
5/1
6/1
7/1
8/1
9/1
10/1
11/1
12/1
1/1
1
10
100
1000
10000
Dai
ly M
ean
Dis
char
ge
(cfs
)

APPENDIX A—Stream Gauge Records2009 Tualatin River Flow Management Report A-33
FRMO – 14206500 – TUALATIN RIVER AT FARMINGTON, OREGON [RM 33.3]Latitude: 45 26 58 Longitude: 122 57 02 Source Agency: District 18 Watermaster
Day2009 Daily Mean Discharge in Cubic Feet per Second
JAN FEB MAR APR MAY JUN JUL AUG SEP OCT NOV DEC 1 3060 748 1200 1050 537 265 148 168 190 216 407 1330 2 4610 718 1210 1080 625 238 173 172 166 219 426 1140 3 e5970 689 1370 1220 819 226 178 180 160 198 341 956 4 e6460 659 1430 1230 830 219 172 172 168 186 260 821 5 e6300 633 1360 1160 1430 216 179 160 201 189 229 740 6 e6000 621 1340 1070 1840 254 191 162 321 182 315 678 7 e5670 627 1300 987 1960 275 203 167 351 182 575 621 8 5600 621 1210 970 2060 271 199 174 337 191 1250 565 9 e6080 608 1170 956 1980 243 183 177 274 188 1340 e46310 e6440 596 1130 942 1770 214 183 195 201 185 1090 e37911 e6240 637 1060 917 1570 200 191 192 171 183 1040 e37112 e5900 634 963 854 1390 197 199 233 155 185 1030 e36413 e5500 632 896 925 1280 185 229 334 162 187 948 e37714 5080 638 855 1080 1330 185 262 281 167 245 853 42215 4610 628 1160 1090 1330 233 231 214 167 301 778 73616 4190 622 1960 1030 1170 245 202 185 176 281 689 188017 3830 613 2310 983 1010 193 175 180 190 239 751 269018 3500 588 2420 972 919 188 163 159 205 257 1340 279019 3180 568 2440 880 907 210 163 149 202 221 1540 269020 2870 565 2410 809 898 318 170 146 204 191 1740 258021 e2560 547 2300 750 773 298 168 157 209 214 1980 252022 2190 538 2110 675 657 270 160 176 186 259 2190 251023 1720 570 1880 613 583 226 177 189 168 278 2410 241024 1370 797 1650 585 531 175 182 197 168 389 2400 227025 1180 1130 1490 573 500 168 176 191 179 307 2340 208026 1090 1290 1360 532 459 167 176 157 188 298 2160 184027 995 1340 1240 508 415 163 176 150 187 437 2210 162028 945 1290 1150 497 382 159 167 161 192 324 2140 143029 907 — 1220 546 355 161 155 170 196 373 1860 128030 847 — 1230 573 311 152 159 184 202 489 1570 121031 789 — 1130 — 278 — 167 198 — 430 — 1400
TOTAL 115683 20147 45954 26057 30899 6514 5657 5730 6043 8024 38202 43163MEAN 3732 720 1482 869 997 217 182 185 201 259 1273 1392MAX 6460 1340 2440 1230 2060 318 262 334 351 489 2410 2790MIN 789 538 855 497 278 152 148 146 155 182 229 364AC-FT 229500 39960 91150 51680 61290 12920 11220 11370 11990 15920 75770 85610 e=estimated value
FRMO — 14206500 — Tualatin River at Farmington, Oregon [RM 33.3]
20092008
1/1
2/1
3/1
4/1
5/1
6/1
7/1
8/1
9/1
10/1
11/1
12/1
1/1
100
1000
10000
Dai
ly M
ean
Dis
char
ge
(cfs
)
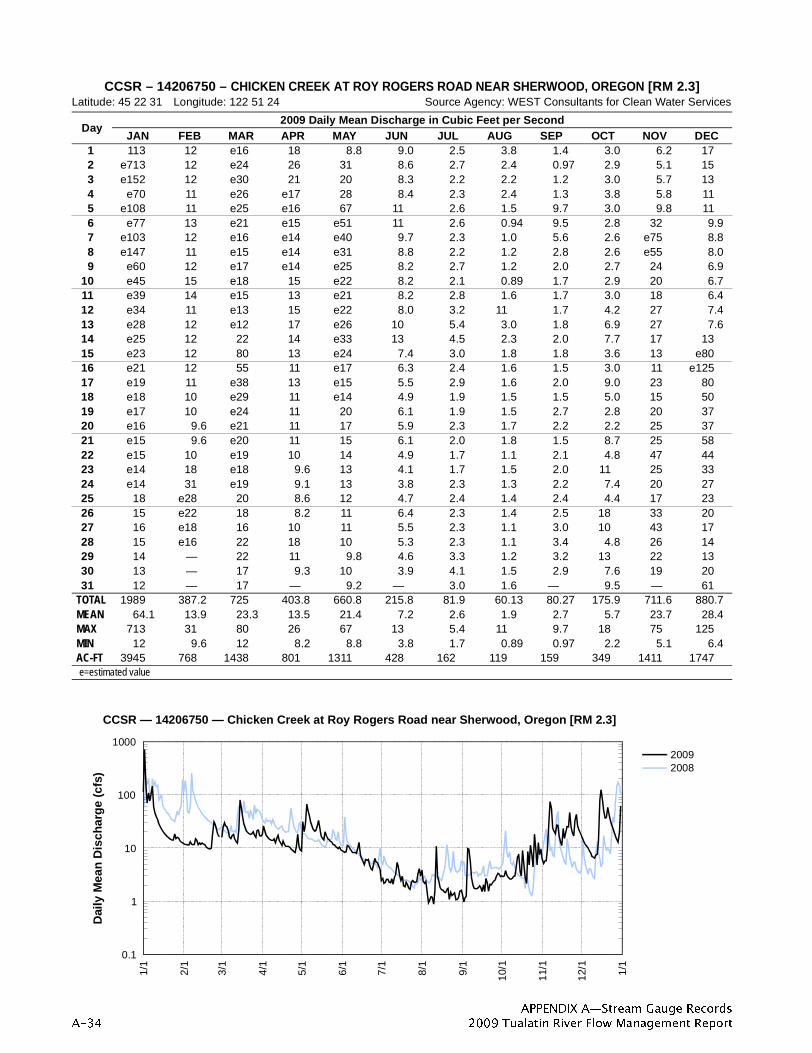
APPENDIX A—Stream Gauge RecordsA-34 2009 Tualatin River Flow Management Report
CCSR – 14206750 – CHICKEN CREEK AT ROY ROGERS ROAD NEAR SHERWOOD, OREGON [RM 2.3]Latitude: 45 22 31 Longitude: 122 51 24 Source Agency: WEST Consultants for Clean Water Services
Day2009 Daily Mean Discharge in Cubic Feet per Second
JAN FEB MAR APR MAY JUN JUL AUG SEP OCT NOV DEC 1 113 12 e16 18 8.8 9.0 2.5 3.8 1.4 3.0 6.2 17 2 e713 12 e24 26 31 8.6 2.7 2.4 0.97 2.9 5.1 15 3 e152 12 e30 21 20 8.3 2.2 2.2 1.2 3.0 5.7 13 4 e70 11 e26 e17 28 8.4 2.3 2.4 1.3 3.8 5.8 11 5 e108 11 e25 e16 67 11 2.6 1.5 9.7 3.0 9.8 11 6 e77 13 e21 e15 e51 11 2.6 0.94 9.5 2.8 32 9.9 7 e103 12 e16 e14 e40 9.7 2.3 1.0 5.6 2.6 e75 8.8 8 e147 11 e15 e14 e31 8.8 2.2 1.2 2.8 2.6 e55 8.0 9 e60 12 e17 e14 e25 8.2 2.7 1.2 2.0 2.7 24 6.9 10 e45 15 e18 15 e22 8.2 2.1 0.89 1.7 2.9 20 6.7 11 e39 14 e15 13 e21 8.2 2.8 1.6 1.7 3.0 18 6.4 12 e34 11 e13 15 e22 8.0 3.2 11 1.7 4.2 27 7.4 13 e28 12 e12 17 e26 10 5.4 3.0 1.8 6.9 27 7.6 14 e25 12 22 14 e33 13 4.5 2.3 2.0 7.7 17 1315 e23 12 80 13 e24 7.4 3.0 1.8 1.8 3.6 13 e8016 e21 12 55 11 e17 6.3 2.4 1.6 1.5 3.0 11 e12517 e19 11 e38 13 e15 5.5 2.9 1.6 2.0 9.0 23 8018 e18 10 e29 11 e14 4.9 1.9 1.5 1.5 5.0 15 5019 e17 10 e24 11 20 6.1 1.9 1.5 2.7 2.8 20 3720 e16 9.6 e21 11 17 5.9 2.3 1.7 2.2 2.2 25 3721 e15 9.6 e20 11 15 6.1 2.0 1.8 1.5 8.7 25 5822 e15 10 e19 10 14 4.9 1.7 1.1 2.1 4.8 47 4423 e14 18 e18 9.6 13 4.1 1.7 1.5 2.0 11 25 3324 e14 31 e19 9.1 13 3.8 2.3 1.3 2.2 7.4 20 2725 18 e28 20 8.6 12 4.7 2.4 1.4 2.4 4.4 17 2326 15 e22 18 8.2 11 6.4 2.3 1.4 2.5 18 33 2027 16 e18 16 10 11 5.5 2.3 1.1 3.0 10 43 1728 15 e16 22 18 10 5.3 2.3 1.1 3.4 4.8 26 1429 14 — 22 11 9.8 4.6 3.3 1.2 3.2 13 22 1330 13 — 17 9.3 10 3.9 4.1 1.5 2.9 7.6 19 2031 12 — 17 — 9.2 — 3.0 1.6 — 9.5 — 61
TOTAL 1989 387.2 725 403.8 660.8 215.8 81.9 60.13 80.27 175.9 711.6 880.7MEAN 64.1 13.9 23.3 13.5 21.4 7.2 2.6 1.9 2.7 5.7 23.7 28.4MAX 713 31 80 26 67 13 5.4 11 9.7 18 75 125MIN 12 9.6 12 8.2 8.8 3.8 1.7 0.89 0.97 2.2 5.1 6.4AC-FT 3945 768 1438 801 1311 428 162 119 159 349 1411 1747e=estimated value
CCSR — 14206750 — Chicken Creek at Roy Rogers Road near Sherwood, Oregon [RM 2.3]
20092008
1/1
2/1
3/1
4/1
5/1
6/1
7/1
8/1
9/1
10/1
11/1
12/1
1/1
0.1
1
10
100
1000
Dai
ly M
ean
Dis
char
ge
(cfs
)

APPENDIX A—Stream Gauge Records2009 Tualatin River Flow Management Report A-35
UNITED STATES DEPARTMENT OF THE INTERIOR – GEOLOGICAL SURVEY – OREGON WATER SCIENCE CENTERSTATION NUMBER 14206900 FANNO CREEK AT 56TH AVENUE
LATITUDE: 452917 LONGITUDE: 1224401 DRAINAGE AREA: 2.37
Discharge, Cubic Feet per Second, Calendar Year January to December 2009 Daily Mean ValuesDay JAN FEB MAR APR MAY JUN JUL AUG SEP OCT† NOV† DEC†
1 94 1.8 1.8 2.4 0.59 0.42 0.31 0.12 0.10 0.21 0.70 0.152 59 1.8 2.6 3.4 9.5 0.40 0.30 0.14 0.08 0.20 0.56 0.193 5.9 1.8 4.3 1.4 2.1 0.36 0.30 0.18 0.09 0.19 0.55 0.334 3.9 1.8 1.6 1.2 22 1.1 0.29 0.17 0.09 0.81 0.65 0.515 9.5 1.8 2.1 1.1 8.0 1.1 0.28 0.15 5.3 0.15 2.2 0.506 4.6 2.4 1.5 1.00 7.4 0.63 0.24 0.15 1.8 0.15 4.4 0.517 7.1 1.6 1.3 0.96 4.2 0.41 0.27 0.19 0.32 0.14 16 0.478 11 2.1 1.3 0.92 2.4 0.40 0.32 0.17 0.23 0.14 1.4 4.59 3.9 1.8 1.9 1.2 1.9 0.32 0.32 0.17 0.17 0.11 0.77 1.3
10 3.1 3.6 1.4 1.6 1.6 0.44 0.26 0.16 0.18 0.07 0.73 0.6711 3.0 1.9 1.2 0.82 1.4 0.30 0.25 0.66 0.17 0.09 2.8 1.812 3.1 1.5 1.2 4.6 1.5 0.26 1.1 6.2 0.16 0.08 0.94 1.2 13 2.3 1.8 1.1 2.0 4.0 0.29 0.72 0.18 0.18 0.40 0.54 1.2 14 2.1 1.4 3.1 1.4 2.1 0.29 0.32 0.17 0.17 1.8 0.11 2.0 15 2.1 1.7 12 0.99 1.3 0.23 0.28 0.15 0.20 0.20 0.13 9.5 16 2.3 1.3 4.4 0.87 1.1 0.22 0.25 0.14 0.70 0.15 0.19 8.0 17 2.2 1.3 2.7 2.6 1.00 0.20 0.20 0.12 0.54 3.1 1.6 0.5718 3.1 1.2 1.7 1.0 0.95 0.16 0.19 0.11 0.13 0.41 0.16 0.2319 3.2 1.2 1.5 0.85 4.2 4.9 0.17 0.12 1.0 0.26 0.54 0.1720 2.9 1.2 1.5 0.76 1.1 1.3 0.18 0.11 0.17 0.23 1.3 1.2 21 2.7 1.2 1.2 0.71 0.88 0.85 0.18 0.11 0.13 2.1 1.3 2.0 22 2.6 1.2 1.5 0.62 0.81 0.68 0.17 0.11 0.11 0.46 2.9 0.4823 2.5 3.8 1.3 0.58 0.75 0.56 0.19 0.10 0.12 6.0 0.19 0.2524 2.4 6.9 1.1 0.52 0.67 0.52 0.26 0.10 0.08 0.49 0.13 0.1925 3.5 3.1 1.6 0.45 0.64 0.43 0.19 0.10 0.07 0.33 0.26 0.1826 2.0 2.3 1.0 0.42 0.58 0.41 0.15 0.10 0.09 9.5 4.7 0.1727 2.9 1.7 0.89 2.5 0.52 0.38 0.14 0.09 0.08 1.0 1.0 0.1528 2.2 1.6 4.8 3.5 0.50 0.34 0.15 0.11 0.06 0.42 0.20 0.1329 2.0 — 1.6 0.88 0.46 0.34 0.20 0.12 0.08 6.8 0.13 0.1430 1.9 — 1.1 0.68 0.42 0.33 0.11 0.07 0.51 2.8 0.11 1.5 31 1.9 — 1.3 — 0.40 — 0.22 0.09 — 2.9 — 9.7
TOTAL 254.9 56.8 67.59 41.93 84.97 18.57 8.51 10.66 13.11 41.69 47.19 41.62MEAN 8.22 2.03 2.18 1.40 2.74 0.62 0.27 0.34 0.44 1.34 1.57 1.54MAX 94 6.9 12 4.6 22 4.9 1.1 6.2 5.3 9.5 16 9.7 MIN 1.9 1.2 0.89 0.42 0.40 0.16 0.11 0.07 0.06 0.07 0.11 0.13AC-FT 506 113 134 83 169 37 17 21 26 83 94 83† Provisional data–subject to revision
6900 — 14206900 — Fanno Creek at 56th Avenue [RM 11.9]
20092008
1/1
2/1
3/1
4/1
5/1
6/1
7/1
8/1
9/1
10/1
11/1
12/1
1/1
0.01
0.1
1
10
100
Dai
ly M
ean
Dis
char
ge
(cfs
)

APPENDIX A—Stream Gauge RecordsA-36 2009 Tualatin River Flow Management Report
SCRL – 14206905 – SYLVAN CREEK AT RALEIGHWOOD LANE NEAR WEST SLOPE, OREGON [RM 1.0]Latitude: 45 29 35 Longitude: 122 44 48 Source Agency: WEST Consultants for Clean Water Services
Day2009 Daily Mean Discharge in Cubic Feet per Second
JAN FEB MAR APR MAY JUN JUL AUG SEP OCT NOV DEC 1 18 0.57 0.71 1.3 0.30 0.30 0.15 0.12 0.00 0.00 0.36 0.64 2 13 0.56 1.0 1.5 2.8 0.31 0.12 0.12 0.00 0.00 0.22 0.53 3 4.3 0.55 1.4 0.85 0.65 0.30 0.12 0.11 0.00 0.00 0.17 0.42 4 3.1 0.57 0.70 0.73 5.5 0.72 0.13 0.11 0.00 0.38 0.17 0.35 5 4.8 0.55 1.1 0.65 4.6 0.61 0.13 0.12 3.8 0.00 0.86 0.30 6 3.2 0.64 0.70 0.58 4.6 0.36 0.12 0.13 1.8 0.00 2.3 0.28 7 4.3 0.51 0.61 0.54 3.5 0.36 0.12 0.15 0.28 0.00 8.9 0.23 8 5.7 0.54 0.65 0.50 2.1 0.36 0.19 0.15 0.18 0.00 2.7 0.19 9 2.5 0.52 1.0 0.67 1.7 0.34 0.25 0.16 0.12 0.00 1.9 0.1610 1.9 1.00 0.68 1.0 1.2 0.40 0.25 0.21 0.10 0.00 1.3 0.1711 1.8 0.68 0.60 0.97 1.1 0.29 0.26 0.64 0.08 0.00 3.7 0.1912 1.7 0.55 0.57 1.5 1.1 0.26 0.68 3.1 0.08 0.00 2.7 0.2013 1.3 0.66 0.53 1.0 2.5 0.30 0.44 0.32 0.06 0.67 1.6 0.2014 1.2 0.54 1.3 0.68 1.5 0.31 0.28 0.22 0.05 0.00 0.79 3.2 15 1.0 0.77 3.7 0.49 0.98 0.25 0.22 0.19 0.00 0.00 0.82 1016 0.94 0.54 1.7 0.47 0.83 0.22 0.16 0.17 1.4 0.00 0.59 7.1 17 0.91 0.51 1.4 1.4 0.73 0.22 0.15 0.15 0.31 0.00 4.0 2.6 18 0.99 0.46 1.1 0.58 0.73 0.21 0.14 0.13 0.00 0.00 0.97 1.5 19 0.96 0.45 0.95 0.51 2.4 2.6 0.15 0.13 1.0 0.00 1.6 1.2 20 0.91 0.42 0.87 0.46 0.88 0.57 0.16 0.12 0.53 0.00 2.9 2.0 21 0.84 0.42 0.76 0.41 0.78 0.37 0.15 0.11 0.00 0.00 2.3 3.0 22 0.80 0.42 0.77 0.38 0.73 0.32 0.13 0.10 0.00 0.00 4.5 1.6 23 0.75 1.5 0.74 0.35 0.68 0.29 0.14 0.09 0.00 0.00 1.1 1.0024 0.72 2.5 0.64 0.35 0.62 0.26 0.14 0.08 0.00 0.00 0.77 0.7725 0.92 1.3 0.79 0.32 0.52 0.22 0.14 0.09 0.00 0.00 0.59 0.6326 0.68 0.99 0.59 0.30 0.40 0.23 0.18 0.09 0.00 4.9 5.5 0.5427 0.88 0.75 0.54 0.43 0.37 0.20 0.19 0.07 0.00 0.34 3.3 0.4428 0.73 0.68 1.8 0.90 0.36 0.20 0.18 0.07 0.04 0.15 1.3 0.3729 0.64 — 0.85 0.36 0.35 0.20 0.20 0.08 0.16 3.0 0.99 0.3730 0.61 — 0.68 0.32 0.36 0.18 0.15 0.00 0.14 1.1 0.79 2.2 31 0.59 — 0.69 — 0.31 — 0.13 0.00 — 1.9 — 7.3
TOTAL 80.67 20.15 30.12 20.5 45.18 11.76 5.95 7.33 10.13 12.44 59.69 49.68MEAN 2.6 0.72 0.97 0.69 1.5 0.39 0.19 0.24 0.34 0.40 2.0 1.6MAX 18 2.5 3.7 1.5 5.5 2.6 0.68 3.1 3.8 4.9 8.9 10MIN 0.59 0.42 0.53 0.30 0.30 0.18 0.12 0.00 0.00 0.00 0.17 0.16AC-FT 160 40 60 41 90 23 12 15 20 25 118 99e=estimated value
SCRL — 14206905 — Sylvan Creek at Raleighwood Lane near West Slope, Oregon [RM 1.0]
20092008
1/1
2/1
3/1
4/1
5/1
6/1
7/1
8/1
9/1
10/1
11/1
12/1
1/1
0.01
0.1
1
10
100
Dai
ly M
ean
Dis
char
ge
(cfs
)

APPENDIX A—Stream Gauge Records2009 Tualatin River Flow Management Report A-37
ASMP – 14206933 – ASH CREEK AT METZGER PARK AT METZGER, OREGON [RM 1.25]Latitude: 45 27 00 Longitude: 122 45 45 Source Agency: WEST Consultants for Clean Water Services
Day2009 Daily Mean Discharge in Cubic Feet per Second
JAN FEB MAR APR MAY JUN JUL AUG SEP OCT NOV DEC 1 56 1.1 1.8 2.8 1.4 0.48 0.20 0.22 0.14 0.84 0.61 1.6 2 45 1.2 3.1 5.0 12 0.50 0.20 0.19 0.13 0.74 0.51 1.4 3 7.6 1.1 4.6 2.4 4.1 0.49 0.22 0.19 0.14 0.67 0.42 1.2 4 4.8 1.0 2.3 1.9 20 0.95 0.22 0.17 0.14 0.63 0.67 1.1 5 11 1.0 2.1 1.7 13 1.4 0.25 0.16 4.7 0.27 2.0 0.98 6 5.7 1.6 1.8 1.5 10 0.76 0.22 0.18 1.4 0.15 5.3 1.1 7 8.4 1.1 1.5 1.4 6.3 0.57 0.22 0.20 0.38 0.12 21 1.1 8 13 1.2 1.9 1.2 3.8 0.54 0.19 0.19 0.20 0.12 9.2 1.1 9 4.8 1.2 2.4 1.3 3.0 0.50 0.23 0.19 0.17 0.13 4.5 0.9910 3.6 3.0 1.8 2.0 2.5 0.72 0.28 0.19 0.17 0.20 3.7 0.9811 3.3 1.9 1.4 1.2 2.1 0.73 0.24 0.30 0.19 0.16 3.9 1.4 12 3.2 1.2 1.2 3.1 2.0 0.47 0.37 4.8 0.24 0.16 4.9 1.3 13 2.7 1.5 1.1 3.1 4.4 0.49 0.69 0.36 0.21 0.38 4.0 1.1 14 2.4 1.1 3.2 2.0 3.3 0.45 0.32 0.25 0.21 2.1 2.2 3.7 15 2.1 1.6 14 1.6 1.9 0.39 0.26 0.19 0.19 0.33 2.1 2616 1.9 1.1 6.0 1.3 1.6 0.35 0.24 0.19 0.20 0.18 1.9 1917 1.7 0.89 4.2 2.7 1.4 0.44 0.23 0.20 0.55 3.0 6.8 7.0 18 1.7 0.76 3.1 1.5 1.3 0.47 0.22 0.22 0.16 0.67 2.7 4.0 19 1.8 0.68 2.6 1.3 3.7 1.6 0.22 0.21 0.72 0.38 3.4 3.1 20 1.7 0.68 2.4 1.1 1.3 1.7 0.24 0.20 0.26 0.34 6.1 6.1 21 1.6 0.65 2.0 0.97 1.0 0.79 0.22 0.18 0.15 1.7 4.0 8.3 22 1.6 0.67 2.1 0.90 0.90 0.39 0.21 0.20 0.10 0.50 13 3.9 23 1.4 3.1 1.9 0.81 0.78 0.28 0.21 0.15 0.05 5.0 3.3 2.7 24 1.4 7.0 1.8 0.73 0.68 0.29 0.21 0.16 0.05 0.64 2.6 2.3 25 2.3 4.8 2.1 0.70 0.63 0.24 0.22 0.15 0.06 0.30 1.7 2.0 26 1.5 2.9 1.6 0.66 0.62 0.24 0.22 0.14 0.06 6.8 12 1.7 27 2.1 2.0 1.4 3.5 0.63 0.22 0.24 0.14 0.05 1.2 7.5 1.5 28 1.9 1.7 4.9 4.6 0.56 0.21 0.22 0.14 0.16 0.62 3.2 1.4 29 1.4 — 2.8 1.9 0.52 0.22 0.23 0.19 0.65 5.9 2.3 1.5 30 1.3 — 1.9 1.3 0.51 0.19 0.23 0.16 1.00 2.2 1.9 6.7 31 1.2 — 1.8 — 0.48 — 0.22 0.15 — 1.7 — 24
TOTAL 200.1 47.73 86.8 56.17 106.41 17.07 7.69 10.56 12.83 38.13 137.41 140.25MEAN 6.5 1.7 2.8 1.9 3.4 0.57 0.25 0.34 0.43 1.2 4.6 4.5MAX 56 7.0 14 5.0 20 1.7 0.69 4.8 4.7 6.8 21 26MIN 1.2 0.65 1.1 0.66 0.48 0.19 0.19 0.14 0.05 0.12 0.42 0.98AC-FT 397 95 172 111 211 34 15 21 25 76 273 278
ASMP — 14206933 — Ash Creek at Metzger Park at Metzger, Oregon [RM 1.25]
20092008
1/1
2/1
3/1
4/1
5/1
6/1
7/1
8/1
9/1
10/1
11/1
12/1
1/1
0.01
0.1
1
10
100
Dai
ly M
ean
Dis
char
ge
(cfs
)

APPENDIX A—Stream Gauge RecordsA-38 2009 Tualatin River Flow Management Report
SC121 – 14206938 – SUMMER CREEK AT SW 121ST AVENUE NEAR TIGARD, OREGON [RM 1.0]Latitude: 45 26 06 Longitude: 122 47 55 Source Agency: WEST Consultants for Clean Water Services
Day2009 Daily Mean Discharge in Cubic Feet per Second
JAN FEB MAR APR MAY JUN JUL AUG SEP** OCT** NOV** DEC** 1 e62 0.66 3.6 3.5 1.5 2.9 0.66 3.4 0.34 2 e55 0.66 11 9.6 e32 2.9 0.62 6.5 0.28 3 34 0.58 12 4.0 10 1.7 0.81 3.0 0.38 4 26 0.63 5.3 2.6 e30 3.8 0.94 1.9 0.36 5 40 0.50 5.6 1.9 e51 13 0.92 1.2 23 6 24 1.7 3.5 1.6 31 5.9 0.95 1.5 15 7 e41 1.0 2.3 1.3 26 3.0 0.83 2.9 5.4 8 e40 0.60 2.0 1.2 20 2.3 0.70 2.3 2.3 9 24 0.90 2.3 1.2 21 2.2 0.69 2.6 1.510 15 5.7 2.2 3.9 18 7.5 0.75 2.4 1.111 11 4.1 1.3 1.5 15 3.1 0.96 4.4 1.0012 8.7 1.7 0.94 8.3 13 1.9 2.4 20 0.7713 6.8 2.4 0.71 8.9 23 e9.5 10 2.1 0.6414 5.7 1.6 5.3 3.6 26 12 2.6 1.4 0.2015 4.9 1.7 e36 3.7 15 3.1 1.5 0.84 0.0716 4.2 1.5 21 2.5 12 1.5 1.3 0.60 0.1117 3.4 1.1 13 10 8.0 1.2 1.2 0.55 0.1618 2.6 0.71 7.4 3.5 7.7 0.93 1.0 0.45 0.2119 2.1 0.60 6.0 2.3 25 5.8 0.89 0.44 3.220 1.5 0.57 5.3 2.2 11 4.3 1.1 0.38 2.021 1.3 0.52 4.4 1.1 7.3 5.1 1.1 0.30 1.022 1.2 0.48 3.5 1.4 7.0 0.72 1.0 0.2923 0.79 10 3.1 1.3 6.1 0.82 1.3 0.2224 0.78 26 3.7 1.1 5.6 1.4 1.2 0.2025 3.0 16 3.8 1.0 3.3 0.80 1.5 0.2026 1.6 7.6 2.6 0.95 3.3 1.1 1.4 0.3127 1.9 4.9 1.8 4.6 3.5 0.92 1.3 0.3428 2.1 3.3 9.1 14 3.9 0.90 1.3 0.2929 0.99 — 6.1 3.0 3.1 0.83 1.3 0.3830 0.85 — 2.7 2.4 2.0 0.74 1.1 0.4631 0.83 — 2.2 — 2.7 — 2.5 0.44
TOTAL 97.71 189.75 108.15 444 101.86 45.82 62.29 59.02MEAN 13.8 3.5 6.1 3.6 14.3 3.4 1.5 2.0MAX 62 26 36 14 51 13 10 20MIN 0.78 0.48 0.71 0.95 1.5 0.72 0.62 0.20AC-FT 847 194 376 215 881 202 91 124**site discontinued 9/22/2009; e=estimated value
SC121 — 14206938 — Summer Creek at SW 121st Avenue near Tigard, Oregon [RM 1.0]
20092008
1/1
2/1
3/1
4/1
5/1
6/1
7/1
8/1
9/1
10/1
11/1
12/1
1/1
0.01
0.1
1
10
100
Dai
ly M
ean
Dis
char
ge
(cfs
)

APPENDIX A—Stream Gauge Records2009 Tualatin River Flow Management Report A-39
UNITED STATES DEPARTMENT OF THE INTERIOR – GEOLOGICAL SURVEY – OREGON WATER SCIENCE CENTERSTATION NUMBER 14206950 FANNO CREEK AT DURHAM
LATITUDE: 452413 LONGITUDE: 1224513 DRAINAGE AREA: 31.50
Day2009 Daily Mean Discharge in Cubic Feet per Second
JAN FEB MAR APR MAY JUN JUL AUG SEP OCT NOV DEC 1 509 14 21 30 15 7.1 3.5 3.2 3.1 5.6 15 19 2 1130 13 48 75 139 7.1 3.3 2.7 3.3 4.0 9.5 15 3 207 13 65 35 63 7.2 3.0 3.0 3.0 3.1 8.0 13 4 90 13 28 26 112 13 3.0 2.3 2.8 5.7 5.9 12 5 169 12 28 22 331 22 2.9 2.6 72 5.5 13 11 6 98 17 27 20 149 13 3.0 2.5 41 3.8 93 10 7 138 15 19 18 103 10 3.5 2.7 20 2.8 188 e9.2 8 222 13 18 17 57 9.0 3.4 3.0 8.5 2.5 256 e8.8 9 86 15 22 17 39 8.0 3.8 2.8 6.4 2.3 58 8.310 59 33 23 30 30 11 3.8 3.2 5.0 2.0 47 8.111 51 36 16 19 26 10 3.8 3.9 4.1 1.8 51 8.212 47 18 14 32 23 8.4 4.3 81 3.6 1.8 86 8.813 41 19 13 65 41 13 11 14 3.4 3.7 48 9.714 33 16 33 28 69 32 7.1 7.6 3.1 30 30 2215 29 18 230 22 26 8.9 4.9 6.0 2.8 12 20 28016 26 16 101 18 21 6.9 3.8 5.1 2.4 5.1 17 30617 24 13 70 35 17 5.9 3.5 4.0 3.7 35 90 13918 22 12 43 24 15 5.8 2.9 4.1 4.3 26 33 5419 20 11 34 17 56 11 2.6 3.4 9.5 7.3 55 3820 19 10 30 15 23 28 2.5 3.2 9.4 4.9 86 5621 18 10 27 14 16 20 2.7 3.0 4.4 25 56 12522 17 10 26 13 14 9.2 2.6 3.3 2.9 13 196 5523 16 36 25 12 13 6.7 2.5 2.9 2.2 57 48 3224 15 101 28 11 12 5.7 2.7 3.1 1.9 26 26 2525 24 92 29 11 10 5.8 3.2 3.8 2.0 7.8 20 2126 20 42 25 11 9.5 5.2 3.0 3.3 2.0 87 106 1827 21 27 19 22 9.6 4.9 2.7 3.7 1.9 43 179 1628 24 21 55 78 8.9 4.5 2.7 3.5 1.9 16 44 1529 17 — 58 28 8.3 4.1 4.3 3.1 2.2 84 28 1430 16 — 26 18 7.6 3.8 3.7 3.0 4.5 37 23 6931 15 — 23 — 7.2 — 3.5 3.2 — 29 — 210
TOTAL 3223 666 1224 783 1471.1 307.2 113.2 196.2 237.3 589.7 1935.4 1636.1MEAN 104 23.8 39.5 26.1 47.5 10.2 3.65 6.33 7.91 19.0 64.5 52.8MAX 1130 101 230 78 331 32 11 81 72 87 256 306MIN 15 10 13 11 7.2 3.8 2.5 2.3 1.9 1.8 5.9 8.1AC-FT 6390 1320 2430 1550 2920 609 225 389 471 1170 3840 3250e=estimated value
FANO — 14206950 — Fanno Creek at Durham Road near Tigard, Oregon [RM 1.2]
2009200820092008
1/1
2/1
3/1
4/1
5/1
6/1
7/1
8/1
9/1
10/1
11/1
12/1
1/1
1
10
100
1000
10000
Dai
ly M
ean
Dis
char
ge
(cfs
)

APPENDIX A—Stream Gauge RecordsA-40 2009 Tualatin River Flow Management Report
HCTP – 14206958 – HEDGES CREEK AT TUALATIN PARK AT TUALATIN, OREGON [RM 0.3]Latitude: 45 23 08 Longitude:122 45 37 Source Agency: WEST Consultants for Clean Water Services
Day2009 Daily Mean Discharge in Cubic Feet per Second
JAN FEB MAR APR MAY JUN JUL AUG SEP OCT NOV DEC 1 e56 1.7 2.8 2.3 1.2 0.12 0.01 e0.00 e0.00 e0.00 0.45 1.4 2 e54 1.7 8.7 4.9 13 0.23 0.01 e0.00 e0.00 e0.00 0.18 1.0 3 e23 1.5 13 2.4 8.7 0.08 0.01 e0.00 e0.00 e0.00 0.11 0.80 4 e18 1.3 5.3 1.1 7.2 0.15 0.01 e0.00 e0.00 0.01 0.10 0.79 5 e27 1.3 4.3 0.77 31 0.44 0.01 e0.00 0.24 e0.00 0.52 0.76 6 e18 1.9 3.4 1.2 20 0.51 0.01 e0.00 1.8 e0.00 13 0.61 7 27 1.7 2.6 1.3 16 0.47 0.01 e0.00 2.8 e0.00 16 0.41 8 32 1.3 3.4 1.4 8.0 0.46 0.02 e0.00 0.99 e0.00 24 0.36 9 17 1.8 3.8 2.2 4.2 0.09 0.02 e0.00 0.40 e0.00 9.5 0.2110 10 5.4 2.9 4.5 2.0 0.14 0.02 e0.00 0.04 e0.00 6.5 0.1611 8.8 6.4 3.0 3.3 2.2 0.28 0.01 e0.32 0.02 e0.00 4.4 0.1212 7.6 3.8 1.4 4.1 2.2 0.05 0.02 0.17 e0.00 e0.00 8.0 0.1613 6.0 3.9 1.8 2.9 5.0 0.06 0.02 0.16 e0.00 0.01 6.8 0.1914 5.2 2.9 9.9 0.56 10 0.18 0.02 0.02 e0.00 0.01 4.4 1.0 15 4.7 3.4 31 0.51 3.1 0.29 0.02 0.02 e0.00 e0.00 2.5 1816 4.1 2.8 24 0.82 2.1 0.12 0.01 0.02 e0.00 e0.00 1.7 3517 3.7 2.0 14 2.2 1.5 0.10 0.01 0.06 e0.00 2.3 8.2 2018 3.0 1.7 7.7 1.6 1.2 0.08 0.01 0.02 e0.00 1.4 5.7 8.4 19 2.9 1.6 4.9 0.87 2.5 0.11 0.01 0.01 0.06 0.64 7.9 5.4 20 2.6 1.2 5.3 0.56 2.0 0.13 0.00 0.01 e0.00 0.07 11 6.5 21 2.5 1.4 5.6 1.0 1.4 0.16 0.00 0.01 e0.00 1.2 8.6 1522 2.4 1.4 5.2 e1.2 1.0 0.14 0.00 0.01 e0.00 0.24 15 8.9 23 2.2 4.7 5.9 e1.3 0.72 0.10 0.00 0.01 e0.00 1.7 7.1 4.7 24 2.1 14 7.9 e1.3 0.68 0.07 0.00 0.01 e0.00 1.2 3.3 3.3 25 3.7 10.0 6.2 e1.4 0.45 0.07 0.00 0.01 e0.00 0.44 1.9 2.6 26 2.9 4.8 4.5 e2.9 0.52 0.25 e0.00 0.01 e0.00 7.1 7.3 2.1 27 3.0 2.0 2.5 e5.4 0.41 0.04 e0.00 0.01 e0.00 6.0 16 1.8 28 3.2 1.2 7.3 e6.1 0.21 0.02 e0.00 0.00 e0.00 2.0 5.9 1.6 29 2.4 — 11 3.4 0.54 0.02 e0.00 0.00 e0.00 4.1 3.0 1.4 30 2.1 — 3.5 1.5 0.54 0.02 e0.00 0.00 e0.00 3.1 1.9 4.8 31 1.9 — 2.5 — 0.15 — e0.00 e0.00 — 1.9 — 21
TOTAL 359 88.8 215.3 64.99 149.72 4.98 0.26 0.88 6.35 33.42 200.96 168.47MEAN 11.6 3.2 6.9 2.2 4.8 0.17 0.009 0.029 0.21 1.1 6.7 5.5MAX 56 14 31 6.1 31 0.51 0.02 0.32 2.8 7.1 24 35MIN 1.9 1.2 1.4 0.51 0.15 0.02 0.00 0.00 0.00 0.00 0.10 0.12AC-FT 712 176 427 129 297 9.9 0.5 1.7 13 66 399 334e=estimated value
HCTP — 14206958 — Hedges Creek at Tualatin Park at Tualatin, Oregon [RM 0.3]
20092008
1/1
2/1
3/1
4/1
5/1
6/1
7/1
8/1
9/1
10/1
11/1
12/1
1/1
0.01
0.1
1
10
100
Dai
ly M
ean
Dis
char
ge
(cfs
)

APPENDIX A—Stream Gauge Records2009 Tualatin River Flow Management Report A-41
TRT – 14206956 (formerly 14206960) – TUALATIN RIVER AT TUALATIN, OREGON [RM 8.9]Latitude: 45 23 14 Longitude: 122 45 46 Source Agency: District 18 Watermaster
DayDaily Elevation in Feet above Mean Sea Level for 2009*
JAN FEB MAR APR MAY JUN JUL AUG SEP OCT NOV DEC 1 107.3 102.7 103.7 103.4 102.4 101.8 101.5 101.5 101.6 101.6 102.0 103.9 2 110.3 102.7 103.7 103.5 102.7 101.8 101.5 101.5 101.5 101.6 102.0 103.6 3 109.7 102.6 103.9 103.6 102.9 101.7 101.6 101.6 101.5 101.6 101.9 103.3 4 109.9 102.5 104.0 103.7 103.1 101.7 101.6 101.6 101.5 101.6 101.8 103.0 5 110.5 102.5 104.0 103.6 104.3 101.8 101.6 101.5 101.7 101.5 101.7 102.8 6 110.5 102.5 103.9 103.5 104.9 101.8 101.6 101.5 101.8 101.5 102.0 102.6 7 110.4 102.5 103.8 103.3 105.1 101.8 101.6 101.5 101.9 101.5 102.4 102.5 8 110.4 102.4 103.7 103.2 105.1 101.8 101.6 101.5 101.9 101.5 103.6 102.4 9 110.0 102.4 103.5 103.2 105.0 101.8 101.6 101.5 101.8 101.5 103.8 102.310 110.1 102.5 103.5 103.2 104.7 101.7 101.6 101.6 101.7 101.5 103.5 102.111 110.3 102.5 103.4 103.2 104.4 101.7 101.6 101.6 101.6 101.5 103.3 102.012 110.4 102.5 103.2 103.1 104.0 101.7 101.6 101.8 101.5 101.5 103.3 102.113 110.1 102.5 103.1 103.2 103.8 101.7 101.7 101.8 101.5 101.5 103.2 102.114 109.6 102.5 103.0 103.3 103.9 101.7 101.7 101.9 101.5 101.6 103.0 102.115 109.0 102.5 103.8 103.4 103.8 101.7 101.8 101.8 101.5 101.7 102.8 103.016 108.3 102.5 104.7 103.3 103.6 101.7 101.7 101.6 101.5 101.7 102.6 104.717 107.8 102.5 105.4 103.3 103.3 101.7 101.6 101.6 101.5 101.8 102.7 106.018 107.3 102.4 105.6 103.2 103.1 101.6 101.6 101.6 101.6 101.8 103.1 106.219 106.8 102.4 105.6 103.1 103.1 101.6 101.5 101.5 101.6 101.7 103.9 106.020 106.3 102.3 105.6 103.0 103.0 101.8 101.5 101.5 101.6 101.6 104.2 105.921 105.9 102.3 105.5 102.8 102.9 101.9 101.6 101.5 101.6 101.6 104.7 105.922 105.4 102.3 105.2 102.7 102.7 101.8 101.5 101.5 101.6 101.6 105.2 105.823 104.7 102.4 104.9 102.6 102.5 101.8 101.5 101.5 101.5 101.8 105.3 105.624 104.1 102.8 104.5 102.5 102.4 101.7 101.6 101.6 101.5 101.9 105.4 105.425 103.7 103.4 104.2 102.4 102.3 101.6 101.6 101.6 101.5 101.9 105.3 105.126 103.4 103.7 104.0 102.4 102.2 101.6 101.6 101.6 101.5 102.0 105.3 104.827 103.3 103.8 103.8 102.4 102.2 101.6 101.6 101.5 101.5 102.1 105.4 104.428 103.1 103.8 103.6 102.5 102.1 101.6 101.5 101.5 101.5 102.0 105.2 104.129 103.0 — 103.7 102.4 102.0 101.5 101.5 101.5 101.6 102.1 104.8 103.830 102.9 — 103.7 102.4 102.0 101.5 101.5 101.5 101.6 102.2 104.4 103.731 102.8 — 103.6 — 101.9 — 101.5 101.5 — 102.1 — 104.1
MEAN 107.3 102.7 104.1 103.0 103.3 101.7 101.6 101.6 101.6 101.7 103.6 103.9MAX 110.5 103.8 105.6 103.7 105.1 101.9 101.8 101.9 101.9 102.2 105.4 106.2MIN 102.8 102.3 103.0 102.4 101.9 101.5 101.5 101.5 101.5 101.5 101.7 102.0*Preliminary data–subject to revision
TRT — 14206956 (formerly 14206960) — Tualatin River at Tualatin, Oregon [RM 8.9]
20092008
101
103
105
107
109
111
113
115
117
119
Sta
ge
(fee
t ab
ove
sea
leve
l)
1/1
2/1
3/1
4/1
5/1
6/1
7/1
8/1
9/1
10/1
11/1
12/1
1/1

APPENDIX A—Stream Gauge RecordsA-42 2009 Tualatin River Flow Management Report
UNITED STATES DEPARTMENT OF THE INTERIOR - GEOLOGICAL SURVEY - OREGON WATER SCIENCE CENTER STATION NUMBER: 14207500 TUALATIN RIVER AT WEST LINN, OREG.
LATITUDE: 452103 LONGITUDE: 1224030 DRAINAGE AREA: 706.00 DATUM: 85.61
Discharge, Cubic Feet per Second, Calendar Year January to December 2009 Daily Mean ValuesDay JAN FEB MAR APR MAY JUN JUL AUG SEP OCT† NOV† DEC†
1 4120 887 1430 1280 683 362 194 201 230 237 420 15402 7110 848 1410 1290 840 346 191 205 221 249 404 13103 6270 823 1530 1320 954 320 213 212 202 243 389 11304 6300 787 1610 1370 1050 306 220 215 191 230 320 9675 6930 752 1590 1350 1730 311 216 205 277 216 265 8526 6980 738 1530 1280 2140 309 224 200 351 211 406 7777 6890 729 1490 1190 2310 329 239 214 409 202 620 7168 6910 723 1420 1140 2340 346 249 210 405 202 1290 6579 6480 717 1350 1120 2280 334 250 216 372 209 1460 589
10 6470 721 1300 1120 2090 304 235 e230 310 210 1310 49011 6750 762 1240 1100 1860 287 232 e235 249 206 1150 46312 6810 751 1150 1050 1660 267 236 e260 212 204 1170 49013 6520 746 1070 1080 1510 260 266 e355 195 206 1100 49714 6020 744 1040 1150 1520 282 293 e380 203 249 971 49015 5450 739 1430 1220 1500 264 305 e330 206 298 854 98616 4880 734 1970 1200 1400 294 274 e265 206 308 767 203017 4380 717 2490 1150 1230 287 243 e240 217 320 807 303018 3960 698 2650 1130 1090 245 217 e230 234 316 1010 319019 3580 670 2680 1060 1050 242 205 e220 253 276 1490 306020 3220 652 2660 994 1040 293 206 e200 254 238 1700 295021 2890 643 2570 929 961 377 209 e190 248 238 2000 302022 2550 630 2400 859 841 368 203 192 242 255 2370 291023 2110 661 2180 789 732 337 191 214 218 310 2500 275024 1690 901 1950 733 666 291 213 231 200 359 2500 257025 1440 1270 1770 703 617 242 218 234 200 358 2460 236026 1290 1460 1620 681 586 227 213 221 207 397 2430 212027 1190 1500 1480 647 539 225 213 185 214 450 2570 187028 1120 1500 1390 734 498 221 209 176 217 423 2390 165029 1060 — 1410 689 468 216 199 185 222 423 2130 147030 1010 — 1400 687 433 209 187 196 227 481 1820 141031 947 — 1360 — 386 — 190 217 — 489 — 1690
TOTAL 133327 23503 52570 31045 37004 8701 6953 7064 7392 9013 41073 50034 MEAN 4301 839 1696 1035 1194 290 224 228 246 291 1369 1614 MAX 7110 1500 2680 1370 2340 377 305 380 409 489 2570 3190 MIN 947 630 1040 647 386 209 187 176 191 202 265 463 AC-FT 264500 46620 104300 61580 73400 17260 13790 14010 14660 17880 81470 99240† Provisional data–subject to revision; e=estimated value
WSLO — 14207500 —Tualatin River at West Linn, Oregon [RM 1.75]
20092008
1/1
2/1
3/1
4/1
5/1
6/1
7/1
8/1
9/1
10/1
11/1
12/1
1/1
100
1000
10000
Dai
ly M
ean
Dis
char
ge
(cfs
)

Appendix B
Selected Releases and Withdrawals
The following information is for selected water releases to and withdrawals from the Tualatin River and its tributaries. It is not a comprehensive listing of releases and with-drawals. Some of the data represent daily mean flows and some represent instanta-
neous measurements. All streamflow measurements are in Appendix A.

APPENDIX B—Selected Releases and WithdrawalsB-2 2009 Tualatin River Flow Management Report
SELECTED RELEASES AND WITHDRAWALS — LOCATIONS
North
SCHEMATIC MAP
Not to Scale
Fanno Creek
Cr
Cr
Cr
S. Rock
McF
ee C
r
Christensen
Creek
Creek
Rock
Gales
SCHO
TRTR
TRNF
CGIC
PVR1 & PVR2
WAPO
PVPP
Scog
Barney Reservoir
Scoggins Reservoir
SHPP
USARC
USADH
Lake Oswego
WI L L A M
E T T E RI V
ER
TU
AL
R
Sampling and Flow Sites
Withdrawal Points
Wastewater Treatment Plants
JWCS
Dairy
Creek
Burris Cr
He Cr
Baker CrChicken
Cedar Cr
Canal
(Hagg Lake)
Ash C
r
Hedges C
r
Sain Cr
Ta
gins
Car
pe
Dawson Cr
Beav
erto
n C
reek
nner Cr
nter
Cr
onat
Lake Oswego
AT
IN
VE
RI
Coun
cil
Cr
S. Johns on Cr
Springbrook Cr
Saum Cr
Butte rnu t Cr
CreekMcKay
East
West Fork
Fork
Brons
CedarMill Cr
on Cr
Creek
LOCL
USAHB
USAFG

APPENDIX B—Selected Releases and Withdrawals2009 Tualatin River Flow Management Report B-3
SELECTED RELEASE AND WITHDRAWAL SITES — ALPHABETICAL LISTING BY SITE CODESITE CODE SITE NAME RIVER MILE PAGE
CGIC City of Hillsboro Withdrawal at Cherry Grove 73.3 B-6
JWCS Joint Water Commission Withdrawal at Springhill Pump Plant 56.1 B-8LOCL Lake Oswego Corp. Canal Diversion 6.7 B-13PVPP TVID Withdrawal at Patton Valley Pump Plant 1.71 *PVR1 TVID—Patton Valley River Turnout #1 Release 63.13 *
PVR2 TVID—Patton Valley River Turnout #2 Release 64.26 *SHPP TVID–Withdrawal at Springhill Pump Plant 56.1 B-7TRNF Barney Reservoir Measured Flow to North Fork Trask River — B-4TRTR Barney Reservoir Release to Tualatin River 78.0 B-5
USADH CWS Durham WWTP Release 9.33 B-12USAFG CWS Forest Grove WWTP Release 55.2 B-9USAHB CWS Hillsboro WWTP Release 43.8 B-10USARC CWS Rock Creek WWTP Release 38.08 B-11WAPO Wapato Canal Diversion 62.0 *
*Withdrawals and releases at Patton Valley Pump Plant, Patton Valley River turnouts, and Wapato Canal were not measured in 2009

APPENDIX B—Selected Releases and WithdrawalsB-4 2009 Tualatin River Flow Management Report
TRNF – BARNEY RESERVOIR MEASURED FLOW TO NORTH FORK TRASK RIVER
Source Agency: Joint Water Commission
Day2009 — Instantaneous Measured Flow Rate in Cubic Feet per Second
JAN FEB MAR APR MAY JUN JUL AUG SEP OCT NOV DEC 1 41.0 23.6 12.2 8.0 8.4 2 31.3 55.5 8.0 9.5 8.2 8.4 3 64.0 12.5 8.4 4 27.5 47.0 31.3 9.6 8.2 8.4 5 2.8 12.5 8.4 9.5 6 31.3 47.0 41.0 79.6 8.4 9.0 7 5.1 8.4 9.5 8.4 8 35.0 64.0 11.3 8.0 9.5 9 3.4 31.3 41.0 9.5 8.410 35.0 9.8 8.4 9.5 8.211 31.3 35.0 35.0 8.412 95.2 9.8 8.4 8.213 31.3 31.3 35.014 64.0 47.0 8.4 8.4 9.5 9.5 8.415 41.0 11.0 8.416 55.5 95.2 9.5 9.5 8.2 9.517 23.9 41.0 8.2 8.218 64.0 31.3 8.4 9.5 8.419 11.0 9.5 11.020 23.9 47.0 31.3 31.3 8.4 8.421 41.0 8.4 9.5 9.522 31.3 27.6 8.2 8.4 9.523 42.0 35.0 41.0 9.5 14.0 8.2 9.524 31.3 8.2 8.4 8.425 64.0 47.0 9.5 8.426 31.3 16.0 8.2 8.4 9.527 35.0 47.0 41.0 27.6 8.4 8.428 8.4 9.5 5.2 8.429 — 31.3 13.5 8.2 8.430 31.3 — 47.0 9.5 8.5 8.4 8.431 — — — 8.4 8.4 — —
20092008
TRNF – Barney Reservoir Measured Flow to North Fork Trask River
1/1
2/1
3/1
4/1
5/1
6/1
7/1
8/1
9/1
10/1
11/1
12/1
1/1
0
60
180
240
Flo
w R
ate
(cfs
)
300
120

APPENDIX B—Selected Releases and Withdrawals2009 Tualatin River Flow Management Report B-5
TRTR — BARNEY RESERVOIR MEASURED FLOW TO TUALATIN RIVER [RM 78.0]Source Agency: Joint Water Commission
Day2009 — Instantaneous Measured Flow Rate in Cubic Feet per Second
JAN FEB MAR APR MAY JUN JUL AUG SEP OCT NOV DEC 1 0.0 0.0 0.0 20.0 34.0 2 0.0 0.0 20.0 20.0 0.8 0.0 3 0.0 0.0 30.0 4 0.0 0.0 0.0 34.0 0.8 0.0 5 0.0 0.0 30-24 20.0 6 0.0 0.0 0.0 0.0 20.0 0.0 7 0.0 24.0 20.0 0.0 8 0.0 0.0 0.0 20.0 34.0 9 0.0 0.0 0.0 20.0 0.010 0.0 0.0 20.0 34.0 0.011 0.0 0.0 0.0 0.012 0.0 0.0 24.0 0.013 0.0 0.0 0.014 0.0 0.0 20.0 24.0 34.0 20.0 0.015 0.0 0.0 20.016 0.0 0.0 34.0 20.0 0.0 0.017 0.0 0.0 0.0 30.018 0.0 0.0 24.0 34.0 0.019 14.8 20.0 0.020 0.0 0.0 0.0 0.0 30.0 24.021 0.0 24.0 34.0 0.022 0.0 0.0 12.4 30.0 20.023 0.0 0.0 0.0 20.0 20.0 0.0 0.024 0.0 15.0 30.0 24.025 0.0 0.0 20.0 0.026 0.0 0.0 20.0 24.0 14.027 0.0 0.0 0.0 0.0 30.0 0.028 24.0 20.0 14.2 0.029 — 0.0 0.0 20.0 30.030 0.0 — 0.0 20.0 14.2 0.0 0.031 — — — 30.0 24.0 — —
20092008
TRTR – Barney Reservoir Measured Flow to Tualatin River [RM 78.0]
1/1
2/1
3/1
4/1
5/1
6/1
7/1
8/1
9/1
10/1
11/1
12/1
1/1
0
20
40
60
80
Flo
w R
ate
(cfs
)

APPENDIX B—Selected Releases and WithdrawalsB-6 2009 Tualatin River Flow Management Report
CGIC — CITY OF HILLSBORO WITHDRAWAL AT CHERRY GROVE [RM 73.3]Source Agency: Joint Water Commission
Day2009 — Calculated Average Flow Rate in Cubic Feet per Second
JAN FEB MAR APR MAY JUN JUL AUG SEP OCT NOV DEC 1 1.22 1.09 1.49 1.62 1.66 1.83 2.26 2.46 0.95 1.57 1.32 0.74 2 1.18 1.09 1.55 1.63 1.66 1.82 2.32 2.46 0.94 1.45 1.34 0.73 3 1.23 1.23 1.58 1.63 1.65 1.82 2.27 2.35 0.93 1.37 1.30 0.71 4 1.24 1.45 1.56 1.56 1.59 1.84 2.51 2.29 0.91 1.38 1.32 1.05 5 1.24 1.43 1.62 1.65 1.64 1.80 2.48 2.11 1.23 1.38 1.32 1.43 6 0.94 1.47 1.62 1.64 1.64 1.72 2.38 2.05 1.47 1.36 1.32 1.41 7 0.73 1.48 1.62 1.64 1.64 1.80 2.08 2.04 1.47 1.36 1.32 1.41 8 0.71 1.48 1.61 2.02 1.56 1.41 2.00 1.83 1.47 1.36 1.26 1.39 9 0.71 1.47 1.56 1.62 1.64 1.13 1.90 1.85 1.48 1.38 0.93 1.4110 0.71 1.47 1.63 1.55 1.61 1.13 2.03 1.84 1.43 1.37 1.39 1.4111 0.69 1.38 1.63 1.63 1.67 1.10 1.58 1.83 1.51 1.37 1.39 1.3312 0.71 1.47 1.62 1.63 1.65 1.15 1.32 1.79 1.50 0.90 1.38 1.4113 0.70 1.49 2.02 1.63 1.64 1.09 0.96 1.76 1.50 0.55 1.40 1.4314 0.86 1.49 1.58 1.63 2.52 1.05 0.95 1.51 1.48 0.29 1.40 1.4715 1.06 1.49 1.55 1.63 1.62 1.43 1.03 1.54 1.45 0.58 1.34 1.4916 1.01 1.49 1.63 1.61 1.62 1.70 1.93 1.55 1.46 1.06 1.40 1.5317 1.05 1.20 1.18 1.78 1.68 1.74 2.35 1.78 1.48 1.14 1.40 1.4718 1.06 0.99 0.96 1.78 1.22 1.74 2.46 1.97 1.49 1.11 1.13 1.5319 1.06 1.02 0.96 1.79 0.90 1.74 2.37 2.09 1.49 1.11 0.64 1.5320 1.05 1.38 1.27 1.81 0.91 1.72 2.27 2.22 1.42 1.14 0.70 1.5421 1.05 1.69 1.59 1.81 1.40 1.67 2.35 2.14 1.70 1.13 0.67 1.5222 1.00 1.70 1.60 1.55 1.77 1.55 2.32 2.05 1.74 1.15 0.71 1.5123 1.05 1.62 1.62 1.54 1.77 1.88 2.34 1.86 1.96 1.19 0.71 1.4524 1.06 1.70 1.62 1.53 1.76 2.15 2.32 1.72 1.94 1.14 0.71 1.5325 1.04 1.70 1.54 1.53 1.77 2.12 2.26 1.83 1.77 1.19 0.73 1.5426 0.89 1.69 1.61 1.51 1.76 2.09 2.36 1.88 1.71 1.20 0.73 1.5427 0.74 1.59 1.62 1.49 1.63 2.04 2.38 1.88 1.75 1.17 0.70 1.5428 0.76 1.54 1.62 1.54 1.77 2.16 2.45 1.88 1.75 1.27 0.73 1.5429 0.89 — 1.62 1.59 1.80 2.17 2.51 1.84 1.64 1.27 0.73 1.5530 1.06 — 1.54 1.65 1.80 2.15 2.35 1.81 1.51 1.34 0.73 1.4231 1.05 — 1.62 — 1.81 — 2.46 1.28 — 1.34 — 1.49
20092008
CGIC – City of Hillsboro Withdrawal at Cherry Grove [RM 73.3]
1/1
2/1
3/1
4/1
5/1
6/1
7/1
8/1
9/1
10/1
11/1
12/1
1/1
0
1
2
3
4
Flo
w R
ate
(cfs
)

APPENDIX B—Selected Releases and Withdrawals2009 Tualatin River Flow Management Report B-7
SHPP – TVID WITHDRAWAL AT SPRINGHILL PUMP PLANT [RM 56.1]Source Agency: US Geological Survey, Oregon Water Science Center
Day2009 — Mean Daily Water Withdrawal in Cubic Feet per Second
JAN FEB MAR APR MAY JUN JUL AUG SEP OCT NOV DEC 1 0.3 0.3 0.3 1.0 3.5 44.8 65.7 63.0 34.4 6.7 4.1 1.3 2 0.3 0.3 0.6 1.5 2.6 43.7 72.3 56.3 36.3 6.7 4.0 0.7 3 0.6 0.2 0.3 1.4 1.9 43.2 77.9 58.2 37.6 4.3 3.9 0.7 4 0.3 0.0 0.6 1.4 2.8 38.8 70.0 56.1 33.5 3.1 3.3 0.7 5 0.4 0.0 0.6 1.7 1.6 27.3 59.0 54.3 20.9 6.7 1.7 0.7 6 0.4 0.0 0.4 2.9 2.0 26.1 52.3 54.4 13.7 8.9 2.1 0.7 7 0.3 0.0 0.5 3.8 2.3 24.8 56.0 50.3 1.0 8.2 1.7 0.7 8 0.3 0.0 0.6 3.1 3.0 32.6 55.1 51.8 9.5 7.5 2.0 0.7 9 0.6 0.0 0.6 1.7 2.0 41.1 51.5 37.1 13.2 1.6 2.0 1.110 0.3 0.7 0.3 1.6 2.2 39.3 55.1 39.5 12.6 1.6 1.8 1.011 0.3 0.3 0.9 1.2 2.9 34.1 52.5 44.8 24.4 3.3 2.2 0.712 0.3 0.3 1.0 1.0 3.9 39.8 36.8 23.4 25.7 2.4 2.1 1.113 0.6 0.3 1.0 1.4 3.9 44.2 30.2 24.4 23.3 2.3 2.2 1.114 0.6 0.3 1.0 1.9 3.4 28.2 40.7 24.7 25.8 3.4 1.8 1.115 0.3 0.3 0.8 3.4 2.6 32.9 49.8 22.7 28.9 3.2 2.0 1.116 0.5 0.3 0.7 2.0 3.8 35.8 62.4 20.8 23.3 3.6 2.0 1.017 0.4 0.6 0.9 2.3 8.8 38.7 64.4 43.5 18.9 6.1 1.3 1.018 0.3 0.3 0.6 4.7 11.3 37.7 61.7 55.1 24.4 6.1 1.5 1.019 0.6 0.3 0.9 1.4 6.2 30.0 48.7 61.6 14.0 4.9 1.4 1.020 0.3 0.3 0.9 4.0 9.1 24.5 62.0 51.7 12.7 4.8 0.8 1.021 0.6 0.3 0.9 6.0 15.9 13.5 15.8 42.2 26.5 5.7 1.4 1.022 0.3 0.6 0.6 5.9 21.3 31.2 43.8 39.6 37.4 4.7 1.5 0.823 0.3 0.3 1.0 5.0 24.1 42.5 65.1 33.0 32.6 3.9 1.5 0.924 0.6 0.3 0.9 7.8 17.2 44.3 62.9 42.5 28.4 3.8 1.7 1.025 0.3 0.3 1.0 6.7 22.6 40.3 65.5 47.2 25.3 3.4 1.5 1.026 0.6 0.3 1.0 4.4 28.3 42.4 64.1 47.4 21.0 3.7 1.2 1.027 0.3 0.6 0.7 3.2 36.7 51.5 75.7 47.9 12.4 2.8 1.4 1.028 0.3 0.3 0.9 4.0 40.6 40.8 85.5 39.7 7.6 2.7 1.5 1.029 0.6 — 0.9 3.5 49.0 53.4 80.1 33.8 1.7 3.5 1.4 1.130 0.3 — 1.0 2.9 48.1 61.7 71.6 26.4 1.7 2.9 1.4 1.131 0.6 — 1.0 — 45.0 — 64.9 31.1 — 3.3 — 1.1
20092008
SHPP – Tualatin Valley Irrigation District Withdrawal at Springhill Pump Plant [RM 56.1]
1/1
2/1
3/1
4/1
5/1
6/1
7/1
8/1
9/1
10/1
11/1
12/1
1/1
0
20
40
60
80
100
Flo
w R
ate
(cfs
)

APPENDIX B—Selected Releases and WithdrawalsB-8 2009 Tualatin River Flow Management Report
JWCS – JOINT WATER COMMISSION WITHDRAWAL AT SPRINGHILL PUMP PLANT [RM 56.1]Source Agency: Joint Water Commission
Day2009 — Calculated Average Flow Rate in Cubic Feet per Second
JAN FEB MAR APR MAY JUN JUL AUG SEP OCT NOV DEC 1 48.4 41.3 35.8 43.8 37.3 76.6 61.3 89.1 57.3 31.7 25.9 18.9 2 46.3 41.1 44.3 33.8 38.6 59.4 81.4 82.8 58.4 34.1 25.6 42.7 3 32.9 43.6 45.3 47.1 31.8 64.8 82.8 88.4 59.8 52.4 35.4 46.1 4 29.2 50.7 42.3 36.7 39.9 63.5 70.9 77.9 63.4 41.2 24.2 33.1 5 41.9 45.8 36.7 34.0 44.4 61.5 74.7 74.1 58.5 46.8 45.3 32.5 6 57.1 42.2 41.4 52.0 37.9 40.4 71.0 71.2 51.3 42.3 24.0 33.0 7 58.6 44.0 55.3 39.0 37.3 40.4 57.2 72.6 50.6 38.6 39.5 32.6 8 52.7 39.6 42.5 38.1 43.8 50.7 59.2 66.7 50.2 40.2 40.8 31.4 9 43.5 39.0 39.6 39.5 42.4 50.5 54.0 68.4 50.1 47.5 28.3 32.010 35.7 50.7 35.2 32.6 31.9 56.5 54.5 68.5 49.7 47.7 33.0 39.011 42.2 47.9 42.2 32.9 32.0 49.1 64.9 70.1 47.7 47.7 29.9 44.412 48.9 36.1 44.8 39.5 41.5 49.3 64.8 59.2 48.9 47.4 40.0 45.113 48.6 42.7 45.0 45.3 43.2 55.7 57.2 51.7 49.0 47.6 39.3 44.514 45.4 43.4 43.9 36.1 33.3 56.7 47.0 50.0 52.5 47.5 23.8 45.815 44.0 44.4 42.8 22.8 41.2 51.9 50.9 55.6 68.5 44.0 37.5 29.616 44.2 43.7 43.2 25.4 48.0 41.5 74.7 52.7 68.4 32.8 47.5 42.017 43.9 45.7 37.6 42.1 52.1 60.1 74.7 57.4 59.9 35.8 46.6 38.318 43.5 50.6 45.0 44.0 41.7 65.6 66.8 62.7 56.9 38.2 27.8 37.419 43.1 35.6 44.6 48.5 39.8 51.5 69.8 80.5 50.5 36.2 39.6 39.520 44.4 44.8 39.9 40.4 39.7 56.6 72.6 78.8 46.7 26.3 42.0 37.621 39.9 47.7 31.2 45.1 44.0 37.5 88.0 68.1 53.3 28.5 31.8 27.322 39.2 39.6 37.2 49.4 44.0 47.5 69.0 65.7 54.5 29.7 37.7 38.723 39.4 39.2 50.6 42.1 54.7 45.6 85.3 70.2 59.7 35.2 42.0 44.524 49.3 31.6 39.9 26.9 52.4 53.3 83.8 63.6 54.7 35.1 30.4 44.025 46.3 37.5 31.2 41.2 56.8 52.0 79.4 59.2 58.3 35.1 30.6 38.326 42.0 45.6 31.8 43.4 63.8 61.0 82.1 61.9 57.0 38.8 27.1 32.827 43.9 46.0 33.3 42.9 60.2 66.9 87.4 59.2 57.0 39.6 33.6 28.328 47.6 44.7 33.0 48.6 60.9 69.5 90.4 58.0 52.9 37.3 30.7 39.229 50.4 — 39.4 30.3 67.1 69.0 96.4 54.7 46.9 31.1 30.5 25.130 45.3 — 44.8 33.8 68.7 60.4 95.9 56.3 43.1 43.9 23.9 31.931 43.8 — 45.0 — 70.2 — 93.8 53.2 — 43.9 — 38.0
20092008
JWCS – Joint Water Commission Withdrawal at Springhill Pump Plant [RM 56.1]
1/1
2/1
3/1
4/1
5/1
6/1
7/1
8/1
9/1
10/1
11/1
12/1
1/1
0
20
40
60
80
100
Flo
w R
ate
(cfs
)

APPENDIX B—Selected Releases and Withdrawals2009 Tualatin River Flow Management Report B-9
USAFG – CLEAN WATER SERVICES FOREST GROVE WASTEWATER TREATMENT PLANT DISCHARGE [RM 55.2]Source Agency: Clean Water Services
Day2009 — Mean Daily Water Discharge in Cubic Feet per Second
JAN FEB MAR APR MAY JUN JUL AUG SEP OCT NOV DEC 1 17.2 4.0 6.3 5.6 0.0 0.0 0.0 0.0 0.0 0.0 0.0 4.7 2 12.5 4.0 6.6 5.3 0.0 0.0 0.0 0.0 0.0 0.0 0.0 4.3 3 12.7 3.9 6.7 4.6 0.0 0.0 0.0 0.0 0.0 0.0 0.0 4.3 4 9.5 3.8 6.1 4.3 0.0 0.0 0.0 0.0 0.0 0.0 2.7 4.0 5 9.3 3.9 6.0 4.3 0.0 0.0 0.0 0.0 0.0 0.0 3.6 3.8 6 8.8 3.5 5.4 4.2 0.0 0.0 0.0 0.0 0.0 0.0 4.6 3.7 7 7.3 3.5 5.3 4.3 0.0 0.0 0.0 0.0 0.0 0.0 7.9 3.7 8 11.3 3.7 5.3 3.6 0.0 0.0 0.0 0.0 0.0 0.0 6.5 3.3 9 10.7 3.7 5.1 4.0 0.0 0.0 0.0 0.0 0.0 0.0 6.8 3.610 9.5 4.5 4.8 4.1 0.0 0.0 0.0 0.0 0.0 0.0 5.4 3.511 8.3 4.1 4.6 3.7 0.0 0.0 0.0 0.0 0.0 0.0 5.2 3.412 7.4 4.1 4.4 0.0 0.0 0.0 0.0 0.0 0.0 0.0 4.7 3.413 6.8 4.1 4.3 0.0 0.0 0.0 0.0 0.0 0.0 0.0 4.9 3.514 6.4 3.9 6.5 0.0 0.0 0.0 0.0 0.0 0.0 0.0 4.2 5.715 6.0 4.0 8.9 0.0 0.0 0.0 0.0 0.0 0.0 0.0 4.3 12.216 5.4 4.0 8.6 0.0 0.0 0.0 0.0 0.0 0.0 0.0 4.7 11.917 5.2 3.8 8.7 0.0 0.0 0.0 0.0 0.0 0.0 0.0 5.8 9.318 5.7 3.6 8.0 0.0 0.0 0.0 0.0 0.0 0.0 0.0 5.9 7.419 5.4 3.5 7.1 0.0 0.0 0.0 0.0 0.0 0.0 0.0 6.8 6.520 5.0 3.5 6.4 0.0 0.0 0.0 0.0 0.0 0.0 0.0 6.1 7.621 5.0 3.5 6.1 0.0 0.0 0.0 0.0 0.0 0.0 0.0 8.4 8.822 4.9 3.7 5.4 0.0 0.0 0.0 0.0 0.0 0.0 0.0 9.8 7.323 4.6 5.5 5.8 0.0 0.0 0.0 0.0 0.0 0.0 0.0 7.4 6.224 4.6 6.1 5.3 0.0 0.0 0.0 0.0 0.0 0.0 0.0 6.0 5.625 5.0 5.4 5.1 0.0 0.0 0.0 0.0 0.0 0.0 0.0 5.3 4.926 4.3 6.6 4.7 0.0 0.0 0.0 0.0 0.0 0.0 0.0 6.7 4.827 4.5 5.9 4.5 0.0 0.0 0.0 0.0 0.0 0.0 0.0 6.3 4.528 4.2 5.4 6.1 0.0 0.0 0.0 0.0 0.0 0.0 0.0 5.4 4.529 4.2 — 5.6 0.0 0.0 0.0 0.0 0.0 0.0 0.0 5.4 4.330 4.1 — 5.0 0.0 0.0 0.0 0.0 0.0 0.0 0.0 5.2 6.231 4.1 — 4.9 — 0.0 — 0.0 0.0 — 0.0 — 12.8
20092008
USAFG –Clean Water Services Forest Grove Wastewater Treatment Plant Discharge [RM 55.2]
1/1
2/1
3/1
4/1
5/1
6/1
7/1
8/1
9/1
10/1
11/1
12/1
1/1
0
5
10
15
20
Flo
w R
ate
(cfs
)

APPENDIX B—Selected Releases and WithdrawalsB-10 2009 Tualatin River Flow Management Report
USAHB – CLEAN WATER SERVICES HILLSBORO WASTEWATER TREATMENT PLANT DISCHARGE [RM 43.8]Source Agency: Clean Water Services
Day2009 — Mean Daily Water Discharge in Cubic Feet per Second
JAN FEB MAR APR MAY JUN JUL AUG SEP OCT NOV DEC 1 20.5 5.3 6.5 5.7 4.4 0.0 0.0 0.0 0.0 0.0 0.0 5.3 2 18.8 5.3 6.5 0.0 5.0 0.0 0.0 0.0 0.0 0.0 0.0 5.1 3 16.1 5.2 6.9 0.0 4.8 0.0 0.0 0.0 0.0 0.0 0.0 4.8 4 13.6 5.1 6.5 0.0 7.6 0.0 0.0 0.0 0.0 0.0 0.0 4.8 5 14.2 5.0 6.5 4.7 7.9 0.0 0.0 0.0 0.0 0.0 0.0 4.9 6 12.2 5.0 6.0 4.3 8.1 0.0 0.0 0.0 0.0 0.0 0.0 4.4 7 13.1 4.8 5.9 4.1 6.7 0.0 0.0 0.0 0.0 0.0 0.0 4.6 8 13.8 5.0 5.9 4.0 6.1 0.0 0.0 0.0 0.0 0.0 7.2 1.3 9 11.5 4.9 5.5 3.4 5.7 0.0 0.0 0.0 0.0 0.0 6.9 0.010 10.2 5.4 5.7 3.6 5.6 0.0 0.0 0.0 0.0 0.0 5.9 0.011 9.4 4.8 5.5 1.4 5.3 0.0 0.0 0.0 0.0 0.0 5.7 0.012 8.6 5.1 5.5 5.0 5.3 0.0 0.0 0.0 0.0 0.0 5.3 0.013 7.8 4.8 5.3 4.9 6.1 0.0 0.0 0.0 0.0 0.0 5.7 0.014 7.7 5.0 6.4 5.0 5.9 0.0 0.0 0.0 0.0 0.0 5.6 0.015 6.8 5.2 8.9 4.5 5.1 0.0 0.0 0.0 0.0 0.0 5.4 7.716 6.3 5.2 8.2 4.6 4.9 0.0 0.0 0.0 0.0 0.0 5.5 11.017 6.0 5.1 8.2 4.9 4.8 0.0 0.0 0.0 0.0 0.0 6.2 9.118 6.4 5.0 7.3 4.9 4.9 0.0 0.0 0.0 0.0 0.0 6.0 7.719 6.2 5.0 6.7 4.6 4.9 0.0 0.0 0.0 0.0 0.0 7.0 7.020 5.9 4.8 6.5 4.1 4.6 0.0 0.0 0.0 0.0 0.0 6.7 8.021 5.2 4.7 6.4 3.0 4.6 0.0 0.0 0.0 0.0 0.0 8.2 8.422 5.0 5.0 6.1 3.1 4.3 0.0 0.0 0.0 0.0 0.0 9.2 7.323 5.0 6.0 6.0 3.4 4.0 0.0 0.0 0.0 0.0 0.0 7.5 6.724 5.6 6.5 5.9 2.6 3.8 0.0 0.0 0.0 0.0 0.0 6.2 6.425 5.8 6.3 5.5 1.9 4.5 0.0 0.0 0.0 0.0 0.0 5.8 5.826 5.6 6.6 5.1 2.6 4.2 0.0 0.0 0.0 0.0 0.0 7.7 6.027 5.5 6.1 5.1 2.7 4.1 0.0 0.0 0.0 0.0 0.0 7.4 5.928 5.4 0.0 5.8 2.3 4.0 0.0 0.0 0.0 0.0 0.0 6.8 5.829 5.3 — 5.9 2.1 3.9 0.0 0.0 0.0 0.0 0.0 6.5 5.630 5.1 — 5.6 8.4 3.8 0.0 0.0 0.0 0.0 0.0 6.0 7.031 5.2 — 5.7 — 0.0 — 0.0 0.0 — 0.0 — 13.1
20092008
1/1
2/1
3/1
4/1
5/1
6/1
7/1
8/1
9/1
10/1
11/1
12/1
1/1
0
5
10
15
20
25
Flo
w R
ate
(cfs
)
USAHB – Clean Water Services Hillsboro Wastewater Treatment Plant Discharge [RM 43.8]

APPENDIX B—Selected Releases and Withdrawals2009 Tualatin River Flow Management Report B-11
USARC – CLEAN WATER SERVICES ROCK CREEK WASTEWATER TREATMENT PLANT DISCHARGE [RM 38.08]Source Agency: Clean Water Services
Day2009 — Mean Daily Water Discharge in Cubic Feet per Second
JAN FEB MAR APR MAY JUN JUL AUG SEP OCT NOV DEC 1 165.4 42.0 49.6 50.0 48.8 44.5 42.1 41.3 42.1 42.7 49.0 46.2 2 136.0 41.1 52.0 55.6 56.8 41.9 40.9 41.2 42.2 40.6 47.1 45.1 3 88.9 40.6 49.6 50.4 52.1 44.1 39.4 41.3 42.2 43.6 47.7 43.0 4 89.8 40.4 47.0 50.9 75.6 47.9 36.6 41.1 42.1 43.2 43.7 42.0 5 89.3 41.0 47.3 45.6 70.7 47.7 40.6 41.5 47.9 41.7 48.1 43.1 6 76.9 40.6 44.5 43.9 72.3 47.5 42.9 42.1 47.7 41.4 54.3 43.7 7 89.7 39.6 45.2 43.9 64.0 48.9 42.0 42.6 48.4 41.4 79.4 45.5 8 85.1 41.2 44.9 44.1 55.6 47.1 42.3 42.8 45.1 41.0 60.5 46.7 9 71.4 40.1 50.3 46.4 54.6 47.1 42.5 43.9 43.9 40.8 54.1 42.910 68.0 44.1 39.9 45.9 54.4 47.9 42.6 43.6 44.1 41.0 50.4 44.211 66.1 42.3 42.7 46.5 48.7 46.7 42.2 47.9 42.0 42.7 52.6 44.312 62.2 41.6 41.6 55.4 51.3 45.8 45.0 50.9 42.5 41.4 50.5 45.213 58.5 41.8 41.4 51.0 61.2 47.4 44.9 44.8 45.0 45.2 49.5 46.514 53.4 41.1 48.9 48.9 57.1 48.3 43.1 43.8 43.6 47.4 45.9 56.515 51.6 42.2 69.1 47.0 51.2 46.4 42.7 42.9 42.9 43.2 48.4 82.716 48.8 42.7 59.6 47.0 48.6 43.9 41.7 43.3 45.0 44.5 47.8 80.317 49.8 40.3 59.0 51.5 49.5 45.4 40.8 44.0 43.1 47.6 52.9 65.418 46.1 39.2 54.4 47.9 50.9 46.0 40.4 42.4 42.4 46.4 50.5 57.019 46.3 39.0 52.6 46.8 52.3 51.0 42.1 41.2 42.8 42.5 50.8 54.020 43.1 37.9 48.7 45.0 49.6 48.3 42.1 41.7 43.2 43.7 54.7 57.021 44.1 39.7 47.5 44.9 47.5 47.5 41.5 39.8 41.8 46.7 58.8 58.322 44.1 41.3 45.1 44.9 45.7 46.9 41.2 42.5 40.9 44.5 66.8 53.523 42.7 49.9 46.3 43.5 44.2 46.7 41.4 42.6 41.2 52.7 53.6 49.824 42.8 54.6 45.8 43.2 42.3 46.4 42.3 43.1 41.7 45.5 49.4 47.725 45.5 51.1 45.6 44.3 44.4 44.1 41.6 42.7 40.6 47.0 47.4 44.526 42.6 47.9 43.9 45.1 44.6 42.2 42.1 42.0 41.7 54.1 66.0 43.927 44.7 45.3 43.1 45.1 43.7 42.0 41.4 41.4 43.4 48.9 61.9 43.028 42.4 51.5 50.6 46.7 46.9 43.1 41.0 43.0 43.1 47.9 53.1 36.229 41.9 — 49.0 44.9 43.1 42.7 41.1 43.3 43.6 58.5 51.1 42.130 40.8 — 46.3 44.7 43.4 42.3 41.0 43.6 43.6 52.6 48.5 53.331 41.2 — 44.7 — 47.0 — 41.2 43.2 — 51.2 — 84.9
20092008
1/1
2/1
3/1
4/1
5/1
6/1
7/1
8/1
9/1
10/1
11/1
12/1
1/1
0
40
80
120
160
200
Flo
w R
ate
(cfs
)
USARC – Clean Water Services Rock Creek Wastewater Treatment Plant Discharge [RM 38.08]

APPENDIX B—Selected Releases and WithdrawalsB-12 2009 Tualatin River Flow Management Report
USADH – CLEAN WATER SERVICES DURHAM WASTEWATER TREATMENT PLANT DISCHARGE [RM 9.33]Source Agency: Clean Water Services
Day2009 — Mean Daily Water Discharge in Cubic Feet per Second
JAN FEB MAR APR MAY JUN JUL AUG SEP OCT NOV DEC 1 132.3 33.4 39.0 40.5 33.9 29.9 27.7 27.2 26.5 28.2 32.3 34.8 2 105.4 32.2 40.1 40.5 40.7 29.2 29.5 28.0 29.2 27.8 31.2 33.7 3 66.5 31.2 39.8 37.1 38.1 27.7 27.7 28.3 28.9 28.9 30.5 32.6 4 63.3 30.8 37.1 37.1 58.8 29.7 27.2 27.5 28.5 30.5 30.6 31.7 5 61.9 31.9 37.0 36.2 55.4 30.8 29.1 27.7 34.5 28.9 34.3 32.0 6 56.0 32.3 35.9 35.3 54.5 30.5 28.5 27.8 33.0 27.8 37.6 33.3 7 65.6 32.3 36.4 34.2 48.3 30.6 28.6 27.5 34.0 26.9 58.2 32.2 8 63.9 33.6 36.4 33.0 43.2 29.9 28.5 27.7 31.6 28.2 46.7 31.6 9 52.8 32.0 36.4 34.2 41.2 29.7 28.0 28.0 29.7 27.2 41.9 31.210 49.7 35.9 35.1 34.3 39.1 28.6 28.2 28.6 30.3 27.8 39.0 32.211 47.3 34.2 33.6 33.9 37.4 28.9 28.5 32.0 29.9 28.6 39.8 31.612 43.9 33.4 33.1 36.5 35.6 28.9 29.9 33.1 30.0 28.5 39.0 32.213 41.6 33.1 33.3 37.4 *19.5 29.1 29.1 30.0 31.4 30.0 38.1 33.114 39.6 33.1 41.9 35.0 *40.1 30.0 29.9 29.5 30.9 30.9 35.4 39.615 38.8 34.2 56.9 33.4 *36.2 29.9 29.1 28.5 29.4 28.5 35.4 70.116 37.3 35.0 48.6 33.9 *35.1 30.6 28.5 29.2 28.9 27.7 36.2 66.117 37.1 32.6 45.6 36.0 *34.5 31.4 27.5 29.4 28.2 31.4 39.4 52.018 36.4 31.6 43.0 34.2 35.6 30.3 28.3 28.0 28.5 30.0 35.7 45.019 37.0 31.7 40.7 34.5 36.0 32.3 28.3 28.3 29.9 29.2 37.6 42.720 34.0 31.7 38.5 33.7 34.2 32.2 28.9 28.5 30.2 28.8 43.3 47.321 34.0 32.3 38.1 32.3 32.8 32.2 28.2 28.6 28.2 30.9 44.2 51.522 34.3 33.0 36.4 32.0 31.2 31.1 28.0 28.5 28.5 29.5 49.8 44.623 32.8 38.1 36.0 31.2 30.3 30.3 27.5 28.6 28.5 33.3 39.9 41.224 33.9 45.2 34.8 31.1 29.1 29.7 26.6 29.2 27.8 30.0 37.4 39.625 35.4 43.8 35.7 31.1 31.4 29.2 28.0 29.1 27.7 30.2 35.6 35.426 33.7 39.9 34.3 32.3 30.3 28.6 28.0 28.3 27.5 36.7 51.8 36.227 34.8 38.2 33.7 33.7 30.0 28.0 28.3 28.2 28.5 32.2 47.0 33.428 34.2 37.3 40.8 35.4 29.9 28.8 27.8 27.5 28.0 31.2 40.7 35.329 32.8 — 38.2 32.2 29.4 29.5 28.6 28.0 27.8 37.9 38.5 35.130 31.9 — 36.8 31.6 30.3 29.7 28.5 28.6 29.1 33.1 37.0 46.931 32.6 — 35.6 — 30.8 — 27.5 28.8 — 32.3 — 68.8*Malfunction of a WWTP pipe resulted in flow being diverted to surge basins and then to the wet weather outfall. Tabled values are discharge from normal effluent outfall
plus wet weather outfall. Discharges from the normal outfall flows for these days are: 15.5, 22.4, 20.0, 20.1, and 33.0 cfs for 5/13/2009 through 5/17/2009, respectively. Low discharge on 5/13/2009 resulted from filling the surge basins.
0
20
40
60
80
120
100
20092008
USADH – Clean Water Services Durham Wastewater Treatment Plant Discharge [RM 9.33]
1/1
2/1
3/1
4/1
5/1
6/1
7/1
8/1
9/1
10/1
11/1
12/1
1/1
Flo
w R
ate
(cfs
)
low discharge on 5/13/2009 resulted from filling the surge basins; see table footnote

APPENDIX B—Selected Releases and Withdrawals2009 Tualatin River Flow Management Report B-13
LOCL – OSWEGO CANAL NEAR LAKE OSWEGO, OREGON [RM 6.7]Source Agency: District 18 Watermaster
Day2009 — Daily Water Discharge in Cubic Feet per Second*
JAN FEB MAR APR MAY JUN JUL AUG SEP OCT NOV DEC 1 13.0 1.7 1.2 1.4 1.2 1.2 0.91 2.0 0.11 0.36 1.4 2.3 2 17.0 1.7 1.4 1.5 1.9 1.2 0.91 2.0 0.07 0.48 1.4 2.3 3 5.5 1.6 1.6 1.4 1.4 1.1 0.91 2.0 0.07 0.57 1.4 2.3 4 4.5 1.6 1.4 1.3 2.6 1.2 0.91 2.0 0.07 0.63 1.4 2.1 5 5.0 1.6 1.3 1.3 2.4 1.2 0.91 2.0 0.48 0.57 1.6 2.1 6 4.2 1.6 1.3 1.4 2.0 1.2 0.91 2.0 0.36 0.57 2.3 2.0 7 4.6 1.5 1.3 1.4 1.9 1.1 0.91 2.0 0.36 0.57 2.8 2.0 8 5.5 1.5 1.3 1.3 1.7 1.1 0.86 2.0 0.31 0.48 1.9 2.0 9 4.1 1.5 1.3 1.3 1.7 1.1 0.82 2.0 0.22 0.36 2.0 1.910 3.7 1.6 1.2 1.3 1.6 1.1 2.1 2.0 0.22 0.45 1.9 1.911 3.5 1.5 1.2 1.3 1.6 1.1 4.4 2.0 0.22 0.57 1.9 1.812 3.3 1.4 1.2 1.4 1.6 1.1 4.5 1.2 0.22 0.57 2.2 1.813 3.2 1.5 1.2 1.4 1.7 1.2 4.6 0.22 0.22 0.64 2.1 1.814 3.0 1.4 1.4 1.3 1.7 1.1 4.7 0.22 0.20 0.83 2.0 1.915 3.0 1.4 2.1 1.3 1.6 1.1 4.8 0.22 0.13 0.82 1.9 3.416 2.8 1.4 1.7 1.2 1.6 1.1 4.7 0.18 0.13 0.84 1.9 3.217 2.7 1.4 1.6 1.2 1.5 1.1 4.5 0.13 0.13 1.10 2.2 2.618 2.6 1.2 1.6 1.2 1.4 1.1 4.3 0.13 0.13 0.91 2.0 2.219 2.5 1.2 1.5 1.2 1.5 1.1 4.2 0.13 0.24 0.91 2.2 2.120 2.4 1.2 1.5 1.2 1.4 1.1 1.9 0.13 0.22 0.91 2.3 2.121 2.4 1.2 1.5 1.2 1.4 1.0 0.36 0.13 0.22 1.2 2.3 2.422 2.2 1.2 1.5 1.2 1.4 1.0 1.9 0.13 0.22 1.1 2.8 2.223 2.2 1.2 1.5 1.2 1.3 1.0 5.1 0.13 0.22 1.5 2.5 2.024 2.1 1.3 1.5 1.2 1.3 1.0 5.3 2.6 0.22 1.4 2.4 1.925 2.1 1.7 1.6 1.2 1.3 1.0 5.3 6.9 0.22 1.4 2.3 1.926 2.0 1.4 1.5 1.2 1.3 1.0 5.3 6.9 0.22 1.8 2.8 1.927 2.0 1.3 1.4 1.3 1.2 1.0 5.2 6.3 0.22 1.4 2.8 1.928 1.9 1.3 1.5 1.3 1.2 1.0 5.1 6.1 0.27 1.3 2.5 1.829 1.8 — 1.5 1.2 1.2 1.0 5.1 6.2 0.36 1.6 2.4 1.830 1.8 — 1.4 1.2 1.2 0.91 5.0 6.4 0.36 1.4 2.4 1.831 1.7 — 1.3 — 1.2 — 3.4 3.4 — 1.5 — 1.8
20092008
LOCL — 14207000 — Oswego Canal near Lake Oswego, Oregon [RM 6.7]
1/1
2/1
3/1
4/1
5/1
6/1
7/1
8/1
9/1
10/1
11/1
12/1
1/1
0
5
10
15
20
Dai
ly M
ean
Dis
char
ge
(cfs
)

APPENDIX B—Selected Releases and WithdrawalsB-14 2009 Tualatin River Flow Management Report
(this page intentionally blank)

Appendix C
Scoggins Reservoir Operations
Monthly Records
The information presented here regarding water allocations is provisional. Final alloca-tions for municipal use can be found in the Appendix E of this report.

A P P E N D I X C — S c o g g i n s R e s e r v o i r O p e r a t i o n s M o n t h l y R e p o r t s
C - 2 2 0 0 9 T u a l a t i n R i v e r F l o w M a n a g e m e n t R e p o r t
Sou
rce:
Tua
latin
Val
ley
Irrig
atio
n D
istr
ict
[See
App
endi
x E
for
brea
kdow
n of
mun
icip
al u
se b
y w
ater
pro
vide
r.]
SC
HO
SC
LOT
AN
OT
OT
INF
LO
W.S
. E
LEV
ST
OR
CO
NT
CH
NG
ST
OR
CH
NG
ST
OR
RE
LC
OM
P
INF
LO
GA
SO
DLL
OG
OLF
RO
OD
FR
MO
WS
LOT
EM
P
MA
XT
EM
P
MIN
TV
IDC
WS
LOM
UN
IO
TH
R
(cfs
)(c
fs)
(cfs
)(c
fs)
(ft)
(ac-
ft)(a
c-f
t)(c
fs)
(cfs
)(c
fs)
(cfs
)(c
fs)
(cfs
)(c
fs)
(cfs
)(c
fs)
(°F
)(°
F)
(cfs
)(c
fs)
(cfs
)(c
fs)
(cfs
)[1
][2
][3
][4
][5
][6
][7
][8
][9
][1
0][1
1][1
2][1
3][1
4][1
5][1
6][1
8][1
9][2
0][2
1][2
2][2
3][2
4]
145
295
214
0427
4.90
2543
872
236
423
387
657
689
1503
2827
3540
1.15
4436
00
00
02
382
1637
2019
279.
5029
386
3948
1990
2020
1012
6132
5023
3345
3275
002.
8250
320
00
00
313
376
990
228
1.52
3118
618
0090
820
928
998
2020
2887
4680
5229
6420
0.02
4131
00
00
04
8663
972
528
2.59
3215
697
048
920
509
740
1240
2554
5460
6451
6300
0.00
3729
00
00
05
119
753
872
283.
5733
053
897
452
2047
284
590
722
9452
5067
7969
900.
7740
300
00
00
610
128
438
528
4.36
3380
274
937
813
651
482
711
0021
1849
2063
8370
600.
0649
360
00
015
57
210
630
840
285.
7935
120
1318
664
5972
311
6510
7020
7846
5058
9869
600.
3653
490
00
00
841
011
6015
7028
9.14
3832
732
0716
1721
1638
1223
2210
2347
4550
5610
7100
0.91
5446
00
00
09
176
542
718
291.
5240
669
2342
1181
2312
0411
0519
8028
1748
3057
1766
100.
0049
320
00
00
1013
332
545
829
2.81
4196
212
9365
223
675
886
1320
2351
5490
6645
6500
0.00
4431
00
00
011
106
303
409
293.
7542
894
932
470
2449
473
592
923
5152
6068
6968
000.
0442
370
00
00
1284
251
335
294.
4943
619
725
366
2539
165
575
820
2649
0063
2369
200.
0047
410
00
00
1363
212
275
294.
2443
466
-153
-77
488
411
619
995
1820
4560
5717
6682
0.01
4941
00
00
014
5918
324
229
3.45
4260
9-8
57-4
3267
824
656
311
9018
1242
0051
5762
300.
0044
370
00
00
1549
164
213
292.
5641
710
-899
-453
635
182
519
1140
1856
3850
4679
5690
0.00
4430
00
00
016
4115
511
207
291.
4340
580
-113
0-5
7070
013
048
311
2018
0735
5042
6051
100.
0052
280
00
00
1736
139
175
290.
4039
560
-102
0-5
1466
214
845
010
5017
3732
9038
8446
000.
0050
270
00
00
1831
129
160
289.
3938
571
-989
-499
608
109
418
976
1628
3030
3552
4180
0.00
5234
00
00
019
2612
014
628
8.39
3760
0-9
71-4
9057
888
383
925
1518
2760
3236
3790
0.00
5028
00
00
020
2411
07
141
287.
3936
639
-961
-485
546
6154
686
014
0524
8029
1034
200.
0050
260
00
00
2143
805
128
287.
1636
419
-220
-111
255
144
306
640
1232
2200
2640
3100
0.00
4726
00
00
022
3673
511
428
7.11
3637
1-4
8-2
415
413
027
851
489
118
7022
6527
600.
0044
270
00
00
2335
684
107
287.
1236
381
105
105
110
259
402
707
1420
1780
2320
0.00
4732
00
00
024
3465
410
328
7.25
3650
512
463
5812
123
031
556
711
2014
0918
500.
0041
270
00
00
2532
613
9628
7.37
3661
911
457
5811
523
128
851
093
611
9115
500.
1347
320
00
00
2630
563
8928
7.48
3670
687
4458
102
212
267
482
875
1100
1350
0.06
3727
00
00
027
2754
384
287.
5636
801
9548
5810
619
925
044
479
510
0412
400.
0039
280
00
00
2827
553
8528
7.64
3687
877
3958
9721
225
543
875
594
211
600.
0339
310
00
00
2926
513
8028
7.74
3697
496
4858
106
197
244
413
723
972
1100
0.00
4628
00
00
030
2551
379
287.
8237
051
7739
4584
186
218
385
668
853
1040
0.00
4628
00
00
031
2348
374
287.
9537
176
125
6321
8417
719
035
161
679
497
30.
0047
280
00
00
TO
TA
LS6.
36in
ches
cfs
3059
1011
957
1323
562
8262
3712
519
1756
529
312
4766
289
688
1176
0813
6845
MA
X54
490
00
015
5ac
-ft
6068
2007
111
326
252
1246
012
460
1237
124
831
3484
058
140
9453
817
7896
2332
7527
1432
MIN
3726
00
00
307
Wat
er s
tora
ge
elev
atio
n ±
to
fill
cu
rve:
1.13
SN
OT
EL
Su
mm
ary
for
Wat
er Y
ear
2009
RE
SE
RV
OIR
DE
LIV
ER
Y S
TA
TU
SU
SE
DW
ater
sto
rag
e in
ac-
ft ±
to
fill
cu
rve:
1075
Upt
date
d: J
an 2
3, 2
009
The
se a
lloca
tions
, am
ount
s us
ed a
ndT
VID
0P
erce
nta
ge
of
full
rese
rvo
ir:
69.5
%S
EC
O W
/Y p
c:31
.7sn
o de
pth/
wat
er c
onte
nt0.3
/0.2
"re
mai
ning
are
pro
visi
onal
and
sub
ject
CW
S0
SD
MO
W/Y
pc:
40.6
sno
dept
h/w
ater
con
tent
8.5
/6.1
"to
dai
ly c
hang
es a
s th
e W
S e
leva
tion
LO0
rises
and
falls
. The
se n
umbe
rs a
re fo
r M
UN
I0
plan
ning
pur
pose
s on
ly.
Oth
er30
7
DA
Y
HE
NR
Y H
AG
G L
AK
ET
UA
LA
TIN
RIV
ER
[17]
(inch
es)
Min
imu
m R
equ
ired
Dis
char
ges
Dec
-Sep
t: 10
cfs
Oct
-Nov
: 20
cfs
1261
8
SC
OG
GIN
S D
AM
--
RE
SE
RV
OIR
OP
ER
AT
ION
SJa
nuar
y 20
09IN
FL
OW
PR
EC
IP
WA
TE
R D
EL
IVE
RIE
SW
EA
TH
ER
500
1350
0
RE
MA
ININ
G

A P P E N D I X C — S c o g g i n s R e s e r v o i r O p e r a t i o n s M o n t h l y R e p o r t s
2 0 0 9 T u a l a t i n R i v e r F l o w M a n a g e m e n t R e p o r t C - 3
Sou
rce:
Tua
latin
Val
ley
Irrig
atio
n D
istr
ict
[See
App
endi
x E
for
brea
kdow
n of
mun
icip
al u
se b
y w
ater
pro
vide
r.]
SC
HO
SC
LOT
AN
OT
OT
INF
LO
W.S
. E
LEV
ST
OR
CO
NT
CH
NG
ST
OR
CH
NG
ST
OR
RE
LC
OM
P
INF
LO
GA
SO
DLL
OG
OLF
RO
OD
FR
MO
WS
LOT
EM
P
MA
XT
EM
P
MIN
TV
IDC
WS
LOM
UN
IO
TH
R
(cfs
)(c
fs)
(cfs
)(c
fs)
(ft)
(ac-
ft)(a
c-f
t)(c
fs)
(cfs
)(c
fs)
(cfs
)(c
fs)
(cfs
)(c
fs)
(cfs
)(c
fs)
(°F
)(°
F)
(cfs
)(c
fs)
(cfs
)(c
fs)
(cfs
)[1
][2
][3
][4
][5
][6
][7
][8
][9
][1
0][1
1][1
2][1
3][1
4][1
5][1
6][1
8][1
9][2
0][2
1][2
2][2
3][2
4]
123
463
7228
8.09
3731
113
568
2189
170
183
343
577
747
907
0.00
4727
00
00
02
2145
369
288.
2037
416
105
5320
7316
517
633
255
771
786
20.
0044
280
00
00
321
433
6728
8.30
3751
397
4920
6915
815
931
352
969
083
70.
0053
290
00
00
421
433
6728
8.40
3761
097
4920
6915
515
529
350
066
079
80.
0059
300
00
00
520
452
6728
8.51
3771
610
653
2073
152
145
278
477
632
764
0.00
6030
00
00
06
2346
271
288.
6437
842
126
6420
8416
214
128
346
661
674
60.
1347
370
00
00
721
432
6628
8.76
3795
811
658
2078
163
148
292
472
621
741
0.00
5133
00
00
08
2146
269
288.
8838
074
116
5820
7815
614
829
146
361
872
90.
0054
290
00
00
919
402
6128
8.98
3817
197
4920
6915
313
628
043
560
772
30.
0043
280
00
00
1019
422
6328
9.11
3829
812
764
2084
144
131
267
441
590
712
0.04
3829
00
00
011
2340
265
289.
2438
424
126
6420
8414
614
028
147
762
677
60.
3537
330
00
00
1219
402
6128
9.35
3853
210
854
2074
147
141
300
471
632
758
0.00
4829
00
00
013
2040
262
289.
4838
658
126
6420
8414
913
227
947
262
875
20.
1537
300
00
00
1419
362
5728
9.58
3876
610
854
1670
144
134
296
475
631
752
0.02
4229
00
00
015
1835
255
289.
7038
878
112
5616
7213
813
027
246
762
674
60.
0645
300
00
00
1619
362
5728
9.81
3898
110
352
1668
139
130
278
463
616
746
0.04
4932
00
00
017
1835
255
289.
8939
059
7839
1655
135
125
269
456
612
718
0.00
4934
00
00
018
1835
255
290.
0239
187
128
6516
8113
612
625
443
659
070
00.
0049
320
00
00
1919
362
5729
0.11
3927
588
4416
6013
712
626
641
656
267
10.
0055
310
00
00
2019
362
5729
0.21
3937
499
5016
6613
712
626
241
856
264
80.
0056
300
00
00
2119
352
5629
0.32
3948
210
854
1670
138
125
274
399
543
642
0.00
5731
00
00
022
2038
260
290.
4439
600
118
5916
7514
012
325
239
052
862
60.
1154
330
00
00
2320
412
6329
0.56
3971
811
859
1675
152
129
257
407
541
620
0.03
5140
00
00
024
5610
84
168
290.
7939
945
227
114
1613
028
119
337
360
274
783
70.
7748
410
00
00
2555
108
516
829
1.13
4028
233
717
016
186
448
316
629
905
1088
1280
0.12
5342
00
00
026
6110
65
172
291.
4840
630
348
175
1619
143
634
368
410
3012
7215
100.
2550
320
00
00
2749
945
148
291.
7840
929
299
151
1616
734
831
068
810
9013
4015
700.
1344
280
00
00
2843
835
131
292.
0441
188
259
131
1614
728
726
562
210
4012
9715
800.
0044
320
00
00
TO
TA
LS2.
20in
ches
cfs
724
1421
7422
1920
2350
125
2452
1646
3695
0815
331
1993
923
751
MA
X60
420
00
00
ac-f
t14
3628
1914
744
0140
1240
1299
450
0610
346
9196
1885
930
409
3954
947
110
MIN
3727
00
00
0
Wat
er s
tora
ge
elev
atio
n ±
to
fill
cu
rve:
-6.1
6S
NO
TE
L S
um
mar
y fo
r W
ater
Yea
r 20
09 R
ES
ER
VO
IR D
EL
IVE
RY
ST
AT
US
US
ED
Wat
er s
tora
ge
in a
c-ft
± t
o f
ill c
urv
e:-6
361
Upt
date
d: F
eb. 2
8, 2
009
The
se a
lloca
tions
, am
ount
s us
ed a
ndT
VID
0P
erce
nta
ge
of
full
rese
rvo
ir:
77.2
%S
EC
O W
/Y p
c:35
.4"
sno
dept
h/w
ater
con
tent
1.6
/0.4
"re
mai
ning
are
pro
visi
onal
and
sub
ject
CW
S0
SD
MO
W/Y
pc:
45.1
"sn
o de
pth/
wat
er c
onte
nt11.8
/4.6
"to
dai
ly c
hang
es a
s th
e W
S e
leva
tion
LO0
rises
and
falls
. The
se n
umbe
rs a
re fo
r M
UN
I0
plan
ning
pur
pose
s on
ly.
Oth
er30
7
SC
OG
GIN
S D
AM
--
RE
SE
RV
OIR
OP
ER
AT
ION
SF
ebru
ary
2009
DA
Y
INF
LO
WH
EN
RY
HA
GG
LA
KE
TU
AL
AT
IN R
IVE
RW
EA
TH
ER
WA
TE
R D
EL
IVE
RIE
S
PR
EC
IP
Min
imu
m R
equ
ired
Dis
char
ges
1350
0D
ec-S
ept:
10 c
fs
O
ct-N
ov: 2
0 cf
s
RE
MA
ININ
G
1261
850
0
[17]
(inch
es)

A P P E N D I X C — S c o g g i n s R e s e r v o i r O p e r a t i o n s M o n t h l y R e p o r t s
C - 4 2 0 0 9 T u a l a t i n R i v e r F l o w M a n a g e m e n t R e p o r t
Sou
rce:
Tua
latin
Val
ley
Irrig
atio
n D
istr
ict
[See
App
endi
x E
for
brea
kdow
n of
mun
icip
al u
se b
y w
ater
pro
vide
r.]
SC
HO
SC
LOT
AN
OT
OT
INF
LO
W.S
. E
LEV
ST
OR
CO
NT
CH
NG
ST
OR
CH
NG
ST
OR
RE
LC
OM
P
INF
LO
GA
SO
DLL
OG
OLF
RO
OD
FR
MO
WS
LOT
EM
P
MA
XT
EM
P
MIN
TV
IDC
WS
LOM
UN
IO
TH
R
(cfs
)(c
fs)
(cfs
)(c
fs)
(ft)
(ac-
ft)(a
c-f
t)(c
fs)
(cfs
)(c
fs)
(cfs
)(c
fs)
(cfs
)(c
fs)
(cfs
)(c
fs)
(°F
)(°
F)
(cfs
)(c
fs)
(cfs
)(c
fs)
(cfs
)[1
][2
][3
][4
][5
][6
][7
][8
][9
][1
0][1
1][1
2][1
3][1
4][1
5][1
6][1
8][1
9][2
0][2
1][2
2][2
3][2
4]
139
755
119
292.
2941
439
251
127
1614
325
523
655
696
012
1315
000.
0052
401
00
00
254
976
157
292.
5741
720
281
142
1615
833
326
555
295
411
8614
700.
4647
431
00
00
395
975
197
292.
8742
022
302
152
1616
839
931
764
911
0013
3015
800.
2357
411
00
00
491
925
188
293.
1542
303
281
142
1715
935
330
665
811
8014
4416
800.
0257
321
00
00
591
114
521
029
3.43
4258
928
614
417
161
319
279
619
1110
1373
1690
0.15
5034
10
00
06
9110
655
252
293.
7142
874
285
144
1716
138
331
066
910
1013
3516
000.
0845
301
00
00
785
995
189
293.
9643
128
254
128
1714
532
827
959
810
6013
1915
700.
0050
311
00
00
874
955
174
294.
2143
384
256
129
1714
630
826
456
797
012
2015
000.
1744
331
00
00
978
885
171
294.
4443
619
235
118
1713
527
524
454
693
611
7114
100.
0542
291
00
00
1074
825
161
294.
6443
824
205
103
1611
925
022
951
890
911
3213
600.
0740
321
00
00
1169
765
150
294.
8444
030
206
104
1712
122
720
546
785
310
7613
000.
0042
271
00
00
1267
745
146
295.
0144
205
175
8818
106
212
193
426
773
977
1210
0.00
4829
10
00
013
6371
413
829
5.14
4433
913
468
1785
201
183
398
713
902
1110
0.00
5328
10
00
014
6371
413
829
5.60
4450
416
583
1710
019
817
737
967
085
310
500.
0156
291
00
00
1515
614
29
307
295.
6944
908
404
204
1822
242
329
261
178
094
113
801.
1145
391
00
00
1616
017
821
359
296.
3445
585
677
341
1735
858
748
510
9016
3018
5119
000.
3451
371
00
00
1715
716
719
343
296.
8746
140
555
280
1729
752
650
811
7919
3022
6925
800.
3449
391
00
00
1814
317
218
333
297.
3946
687
547
276
1729
353
852
812
4020
4024
0727
800.
2249
371
00
00
1913
315
517
305
297.
8647
184
497
251
1726
848
551
412
1420
7024
4028
300.
0057
381
00
00
2012
114
413
278
298.
2647
606
422
213
1723
045
647
510
8720
5024
2028
100.
0056
431
00
00
2155
136
1220
329
8.61
4798
137
518
917
206
454
438
964
1950
2327
2730
0.00
5737
10
00
022
5112
512
188
298.
9448
334
353
178
1719
542
740
987
017
8021
5325
600.
1152
371
00
00
2347
994
150
299.
2148
624
290
146
1716
337
335
874
315
8019
3123
400.
0145
311
00
00
2449
984
151
299.
5348
968
344
173
1719
036
733
768
313
6016
7621
100.
3043
351
00
00
2545
914
140
299.
7749
226
258
130
1614
636
431
263
412
3015
1218
800.
0052
391
00
00
2642
873
132
299.
9949
464
238
120
1613
636
229
759
411
2013
7717
300.
0153
301
00
00
2740
812
123
300.
2049
691
227
114
1613
032
927
253
311
1012
6515
700.
0054
341
00
00
2837
782
117
300.
3949
897
206
104
1612
030
525
349
310
0011
5414
460.
0355
411
00
00
2944
882
134
300.
6650
191
294
148
1616
443
331
057
510
7011
9814
800.
4251
331
00
00
3040
822
124
300.
8750
480
289
146
1616
237
629
554
711
0012
4014
600.
0049
311
00
00
3138
762
116
301.
0750
638
158
8016
9632
726
349
899
811
5414
300.
0049
351
00
00
TO
TA
LS4.
13in
ches
cfs
2392
3236
265
5893
4764
518
5282
1117
398
3321
157
3799
645
846
5504
6M
AX
5743
310
00
0ac
-ft
4745
6419
526
1168
994
5094
5010
2710
478
2216
219
504
4196
575
365
9093
610
9184
MIN
4027
610
00
0
Wat
er s
tora
ge
elev
atio
n ±
to
fill
cu
rve:
-0.5
6S
NO
TE
L S
um
mar
y fo
r W
ater
Yea
r 20
09 R
ES
ER
VO
IR D
EL
IVE
RY
ST
AT
US
US
ED
Wat
er s
tora
ge
in a
c-ft
± t
o f
ill c
urv
e:-6
10U
ptda
ted:
Mar
ch 3
1, 2
009
The
se a
lloca
tions
, am
ount
s us
ed a
ndT
VID
61P
erce
nta
ge
of
full
rese
rvo
ir:
95.0
%S
EC
O W
/Y p
c:41
.2"
sno
dept
h/w
ater
con
tent
0.5/
0.2"
rem
aini
ng a
re p
rovi
sion
al a
nd s
ubje
ctC
WS
0S
DM
O W
/Y p
c:53
.0"
sno
dept
h/w
ater
con
tent
21.7
/9.5
"to
dai
ly c
hang
es a
s th
e W
S e
leva
tion
LO0
rises
and
falls
. The
se n
umbe
rs a
re fo
r M
UN
I0
plan
ning
pur
pose
s on
ly.
Oth
er30
7
SC
OG
GIN
S D
AM
--
RE
SE
RV
OIR
OP
ER
AT
ION
SM
arch
200
9
DA
Y
INF
LO
WH
EN
RY
HA
GG
LA
KE
TU
AL
AT
IN R
IVE
RW
EA
TH
ER
WA
TE
R D
EL
IVE
RIE
S
PR
EC
IP
Min
imu
m R
equ
ired
Dis
char
ges
1350
0D
ec-S
ept:
10 c
fs
O
ct-N
ov: 2
0 cf
s
RE
MA
ININ
G
1261
850
0
[17]
(inch
es)

A P P E N D I X C — S c o g g i n s R e s e r v o i r O p e r a t i o n s M o n t h l y R e p o r t s
2 0 0 9 T u a l a t i n R i v e r F l o w M a n a g e m e n t R e p o r t C - 5
Sou
rce:
Tua
latin
Val
ley
Irrig
atio
n D
istr
ict
[See
App
endi
x E
for
brea
kdow
n of
mun
icip
al u
se b
y w
ater
pro
vide
r.]
SC
HO
SC
LOT
AN
OT
OT
INF
LO
W.S
. E
LEV
ST
OR
CO
NT
CH
NG
ST
OR
CH
NG
ST
OR
RE
LC
OM
P
INF
LO
GA
SO
DLL
OG
OLF
RO
OD
FR
MO
WS
LOT
EM
P
MA
XT
EM
P
MIN
TV
IDC
WS
LOM
UN
IO
TH
R
(cfs
)(c
fs)
(cfs
)(c
fs)
(ft)
(ac-
ft)(a
c-f
t)(c
fs)
(cfs
)(c
fs)
(cfs
)(c
fs)
(cfs
)(c
fs)
(cfs
)(c
fs)
(°F
)(°
F)
(cfs
)(c
fs)
(cfs
)(c
fs)
(cfs
)[1
][2
][3
][4
][5
][6
][7
][8
][9
][1
0][1
1][1
2][1
3][1
4][1
5][1
6][1
8][1
9][2
0][2
1][2
2][2
3][2
4]
136
722
110
301.
2450
824
186
9416
110
300
251
463
921
1056
1340
0.01
5036
10
00
02
5195
314
930
1.48
5108
626
213
216
148
414
295
484
928
1045
1320
0.30
5039
10
00
03
4693
214
130
1.70
5132
824
212
216
138
456
362
591
1080
1200
1350
0.00
5133
20
00
04
4487
213
330
1.93
5158
125
312
816
144
276
339
583
1090
1233
1430
0.00
4728
20
00
05
4081
212
330
2.13
5180
222
111
116
127
241
298
538
1030
1180
1420
0.00
6130
20
00
06
3775
211
430
2.32
5201
120
910
516
121
213
265
471
949
1088
1340
0.00
7036
20
00
07
3471
210
730
2.40
5210
089
4571
116
198
293
478
861
984
1240
0.00
7738
50
00
08
3267
210
130
2.41
5211
111
610
110
718
931
149
085
496
511
800.
0075
415
00
00
931
651
9730
2.43
5213
322
1110
111
217
930
246
884
695
911
600.
0853
455
00
00
1029
631
9330
2.43
5213
30
010
110
117
329
446
282
193
211
600.
0555
442
00
00
1128
541
8330
2.41
5211
1-2
2-1
110
190
160
279
433
809
925
1140
0.00
5640
20
00
012
2756
184
302.
3952
089
-22
-11
101
9015
226
840
073
885
610
800.
0254
452
00
00
1337
982
137
302.
5152
221
132
6710
116
825
235
356
078
086
911
100.
7054
391
00
00
1437
951
133
302.
6152
332
111
5610
115
724
835
860
896
510
700.
1146
322
00
00
1534
851
120
302.
6552
377
4523
101
124
215
330
593
990
1110
1250
0.00
5130
30
00
016
3278
111
130
2.70
5243
255
2810
112
919
030
653
592
110
5012
400.
0055
334
00
01
1733
761
110
302.
7452
476
4422
101
123
179
292
483
856
972
1190
0.22
6037
20
00
118
3068
199
302.
7652
499
2312
101
113
165
282
457
866
984
1170
0.00
6033
30
00
119
2863
192
302.
7652
499
00
101
101
154
267
417
770
892
1110
0.00
6438
50
00
120
2759
187
302.
7452
476
-23
-12
101
8914
425
439
473
181
410
300.
0077
422
00
01
2124
561
8130
2.80
5254
569
3555
9013
619
732
765
076
396
00.
0083
436
00
01
2223
531
7730
2.90
5265
410
955
2479
131
162
268
574
685
881
0.00
8240
80
00
123
2250
173
302.
9852
743
8945
1863
123
148
256
509
615
806
0.00
6033
80
00
124
2249
172
303.
0952
865
122
6213
7512
113
924
648
458
374
10.
2250
328
00
01
2521
471
6930
3.18
5296
610
151
1364
114
129
236
478
574
706
0.00
6134
80
00
126
2045
166
303.
2753
066
100
5013
6311
112
821
642
853
168
80.
0052
387
00
01
2719
441
6430
3.35
5315
589
4513
5810
712
120
641
050
564
20.
0155
417
00
01
2821
421
6430
3.40
5321
156
2830
5810
613
421
039
348
974
60.
0158
446
00
01
2923
451
6930
3.51
5333
412
362
3092
124
155
244
441
529
688
0.25
5141
70
00
130
2241
164
303.
5253
345
116
6571
104
162
242
469
568
678
0.01
5634
70
00
1
TO
TA
LS1.
99in
ches
cfs
910
1973
4029
2313
6517
5431
1956
7574
7412
359
2264
226
026
3079
6M
AX
8345
125
00
015
ac-f
t18
0539
1379
5798
2707
2707
3479
6186
1125
614
825
2451
444
910
5162
361
084
MIN
4628
248
00
030
Wat
er s
tora
ge
elev
atio
n ±
to
fill
cu
rve:
0.06
SN
OT
EL
Su
mm
ary
for
Wat
er Y
ear
2009
RE
SE
RV
OIR
DE
LIV
ER
Y S
TA
TU
SU
SE
DW
ater
sto
rag
e in
ac-
ft ±
to
fill
cu
rve:
66U
ptda
ted:
Apr
il 30
, 20
09T
hese
allo
catio
ns, a
mou
nts
used
and
TV
ID30
9P
erce
nta
ge
of
full
rese
rvo
ir:
100.
0%S
EC
O W
/Y p
c:44
.3"
sno
dept
h/w
ater
con
tent
0re
mai
ning
are
pro
visi
onal
and
sub
ject
CW
S0
SD
MO
W/Y
pc:
57.3
"sn
o de
pth/
wat
er c
onte
nt0
to d
aily
cha
nges
as
the
WS
ele
vatio
nLO
0ris
es a
nd fa
lls. T
hese
num
bers
are
for
MU
NI
0pl
anni
ng p
urpo
ses
only
.O
ther
337
SC
OG
GIN
S D
AM
--
RE
SE
RV
OIR
OP
ER
AT
ION
SA
pril
2009
DA
Y
INF
LO
WH
EN
RY
HA
GG
LA
KE
TU
AL
AT
IN R
IVE
RW
EA
TH
ER
WA
TE
R D
EL
IVE
RIE
S
PR
EC
IP
Min
imu
m R
equ
ired
Dis
char
ges
1350
0D
ec-S
ept:
10 c
fs
O
ct-N
ov: 2
0 cf
s
RE
MA
ININ
G
1261
850
0
[17]
(inch
es)

A P P E N D I X C — S c o g g i n s R e s e r v o i r O p e r a t i o n s M o n t h l y R e p o r t s
C - 6 2 0 0 9 T u a l a t i n R i v e r F l o w M a n a g e m e n t R e p o r t
Sou
rce:
Tua
latin
Val
ley
Irrig
atio
n D
istr
ict
[See
App
endi
x E
for
brea
kdow
n of
mun
icip
al u
se b
y w
ater
pro
vide
r.]
SC
HO
SC
LOT
AN
OT
OT
INF
LO
W.S
. E
LEV
ST
OR
CO
NT
CH
NG
ST
OR
CH
NG
ST
OR
RE
LC
OM
P
INF
LO
GA
SO
DLL
OG
OLF
RO
OD
FR
MO
WS
LOT
EM
P
MA
XT
EM
P
MIN
TV
IDC
WS
LOM
UN
IO
TH
R
(cfs
)(c
fs)
(cfs
)(c
fs)
(ft)
(ac-
ft)(a
c-f
t)(c
fs)
(cfs
)(c
fs)
(cfs
)(c
fs)
(cfs
)(c
fs)
(cfs
)(c
fs)
(°F
)(°
F)
(cfs
)(c
fs)
(cfs
)(c
fs)
(cfs
)[1
][2
][3
][4
][5
][6
][7
][8
][9
][1
0][1
1][1
2][1
3][1
4][1
5][1
6][1
8][1
9][2
0][2
1][2
2][2
3][2
4]
121
391
6130
3.52
5334
50
065
6599
156
436
543
683
0.00
6441
00
00
12
471
4830
3.46
5327
8-6
7-3
411
682
9520
346
253
679
30.
3270
490
00
01
348
149
303.
3953
200
-78
-39
114
7512
223
868
379
294
90.
1861
400
00
01
424
441
6930
3.33
5313
3-6
7-3
411
480
106
218
652
784
962
0.05
6043
00
00
15
6612
05
191
303.
5553
378
245
124
116
240
319
449
1140
1254
1630
1.45
5547
00
00
16
9310
617
216
303.
3253
122
-256
-129
311
182
253
591
1620
1798
2030
0.30
5948
00
00
17
8917
013
272
303.
3153
110
-12
-630
029
437
666
417
0019
0421
500.
7659
410
00
01
862
138
720
730
3.37
5317
767
3420
223
632
864
718
4020
4723
400.
0457
350
00
01
955
116
717
830
3.49
5331
113
468
121
189
279
564
1770
1992
2290
0.00
6137
00
00
010
4810
37
158
303.
5253
345
3417
155
172
231
514
1570
1789
2130
0.00
6840
00
00
111
4293
714
230
3.45
5326
7-7
8-3
917
213
319
846
713
8015
7218
900.
0067
460
00
00
1242
911
134
303.
3853
189
-78
-39
162
123
185
414
1220
1382
1680
0.16
5940
00
00
113
3482
111
730
3.28
5307
7-1
12-5
616
210
617
439
311
0012
5815
100.
0053
360
00
00
1464
108
117
330
3.33
5313
356
2816
219
032
047
011
3012
6015
300.
6253
420
00
01
1548
881
137
303.
4253
222
8945
102
147
270
423
1200
1315
1500
0.00
6338
00
00
316
4281
112
430
3.54
5336
714
573
7514
822
134
610
0011
620.
0071
420
00
01
1737
741
112
303.
6153
446
7940
9113
118
732
385
198
412
500.
0081
470
00
03
1832
681
101
303.
6053
434
-12
-611
811
216
531
176
387
711
000.
0083
490
00
00
1932
631
9630
3.55
5337
8-5
6-2
812
294
153
303
429
730
833
1050
0.07
7645
00
00
020
3259
192
303.
4853
300
-78
-39
119
8014
227
876
087
710
400.
0057
370
00
03
2128
551
8430
3.49
5331
111
680
8613
322
763
975
897
40.
0063
410
00
00
2227
531
8130
3.54
5336
958
2953
8212
418
627
852
964
485
70.
0073
420
00
01
2325
491
7530
3.57
5340
132
1666
8211
618
426
645
856
474
30.
0074
410
00
02
2424
471
7230
3.57
5340
10
064
6411
017
324
141
251
667
80.
0074
390
00
02
2523
451
6930
3.57
5340
10
064
6410
616
723
438
848
462
00.
0073
370
00
02
2622
421
6530
3.57
5340
10
064
6410
116
120
735
045
059
50.
0073
440
00
02
2721
411
6330
3.56
5339
6-5
-364
6198
154
191
311
405
552
0.00
7345
00
00
228
2039
059
303.
5553
378
-18
-964
5593
149
199
281
372
507
0.00
7746
00
00
229
1938
057
303.
5553
378
00
6464
9014
318
125
834
847
30.
0086
500
00
03
3018
360
5430
3.52
5334
5-3
3-1
760
4386
131
146
217
309
445
0.00
8640
00
00
331
1736
053
303.
5153
334
-11
-660
5483
129
154
184
267
401
0.00
8950
00
00
3
TO
TA
LS3.
95in
ches
cfs
1107
2219
8334
09-5
.55
3602
3596
5363
9776
2526
2603
430
076
3535
2M
AX
8950
00
00
43ac
-ft
2196
4401
165
6762
-11
-11
7145
7134
1063
819
391
5010
5163
859
656
7012
1M
IN53
350
00
085
Wat
er s
tora
ge
elev
atio
n ±
to
fill
cu
rve:
0.01
SN
OT
EL
Su
mm
ary
for
Wat
er Y
ear
2009
RE
SE
RV
OIR
DE
LIV
ER
Y S
TA
TU
SU
SE
DW
ater
sto
rag
e in
ac-
ft ±
to
fill
cu
rve:
11U
ptda
ted:
May
31,
200
9T
hese
allo
catio
ns, a
mou
nts
used
and
TV
ID30
9P
erce
nta
ge
of
full
rese
rvo
ir:
100.
0%S
EC
O W
/Y p
c:48
.6"
sno
dept
h/w
ater
con
tent
0re
mai
ning
are
pro
visi
onal
and
sub
ject
CW
S0
SD
MO
W/Y
pc:
64.2
"sn
o de
pth/
wat
er c
onte
nt0
to d
aily
cha
nges
as
the
WS
ele
vatio
nLO
0ris
es a
nd fa
lls. T
hese
num
bers
are
for
MU
NI
0pl
anni
ng p
urpo
ses
only
.O
ther
422
SC
OG
GIN
S D
AM
--
RE
SE
RV
OIR
OP
ER
AT
ION
SM
ay 2
009
DA
Y
INF
LO
WH
EN
RY
HA
GG
LA
KE
TU
AL
AT
IN R
IVE
RW
EA
TH
ER
WA
TE
R D
EL
IVE
RIE
S
PR
EC
IP
Min
imu
m R
equ
ired
Dis
char
ges
1350
0D
ec-S
ept:
10 c
fs
O
ct-N
ov: 2
0 cf
s
RE
MA
ININ
G
1261
850
0
[17]
(inch
es)

A P P E N D I X C — S c o g g i n s R e s e r v o i r O p e r a t i o n s M o n t h l y R e p o r t s
2 0 0 9 T u a l a t i n R i v e r F l o w M a n a g e m e n t R e p o r t C - 7
Sou
rce:
Tua
latin
Val
ley
Irrig
atio
n D
istr
ict
[See
App
endi
x E
for
brea
kdow
n of
mun
icip
al u
se b
y w
ater
pro
vide
r.]
SC
HO
SC
LOT
AN
OT
OT
INF
LO
W.S
. E
LEV
ST
OR
CO
NT
CH
NG
ST
OR
CH
NG
ST
OR
RE
LC
OM
P
INF
LO
GA
SO
DLL
OG
OLF
RO
OD
FR
MO
WS
LOT
EM
P
MA
XT
EM
P
MIN
TV
IDC
WS
LOM
UN
IO
TH
R
(cfs
)(c
fs)
(cfs
)(c
fs)
(ft)
(ac-
ft)(a
c-f
t)(c
fs)
(cfs
)(c
fs)
(cfs
)(c
fs)
(cfs
)(c
fs)
(cfs
)(c
fs)
(°F
)(°
F)
(cfs
)(c
fs)
(cfs
)(c
fs)
(cfs
)[1
][2
][3
][4
][5
][6
][7
][8
][9
][1
0][1
1][1
2][1
3][1
4][1
5][1
6][1
8][1
9][2
0][2
1][2
2][2
3][2
4]
116
340
5030
3.49
5331
1-2
3-1
260
4880
126
122
181
266
368
0.00
8553
00
00
32
1634
050
303.
5153
334
2312
2840
8097
117
149
236
356
0.00
7758
00
00
33
1533
048
303.
5153
334
00
4242
7810
212
815
322
232
90.
0080
540
00
03
415
310
4630
3.50
5332
3-1
1-6
4236
7599
9615
222
331
40.
0086
580
00
03
515
320
4730
3.51
5333
411
642
4891
105
123
135
211
317
0.10
8457
00
00
36
1532
047
303.
5053
323
-11
-642
3689
172
179
252
314
0.00
6754
00
00
2.5
715
310
4630
3.49
5331
1-1
2-6
3630
8815
420
528
032
90.
0064
540
00
02.
58
1530
045
303.
4953
311
00
3636
8615
620
228
135
20.
0062
520
00
02.
59
1429
043
303.
5153
334
2312
2941
8411
217
724
934
00.
0070
480
00
02.
510
1328
041
303.
5253
345
116
3137
7985
9614
321
431
70.
0073
560
00
02.
511
1228
040
303.
5253
345
00
3030
7977
9713
020
130
30.
0070
570
00
02.
512
1228
040
303.
5353
356
116
3036
7675
9312
719
428
20.
0072
520
00
01.
513
1228
040
303.
5653
356
00
3636
7475
8110
918
627
80.
0275
670
00
01.
514
1230
042
303.
4653
278
-78
-39
7233
8212
311
410
718
831
40.
5171
540
00
351.
515
1228
040
303.
3753
177
-101
-51
8635
7712
315
217
321
727
50.
0066
530
00
501.
516
1126
037
303.
3653
166
-11
-641
3570
6110
818
425
529
90.
0075
500
00
151.
517
1126
037
303.
3053
099
-67
-34
6834
6711
311
212
020
130
60.
0073
510
00
351.
518
1125
036
303.
1652
943
-156
-79
101
2267
127
113
120
185
268
0.00
6952
00
065
1.5
1911
250
3630
3.08
5285
4-8
9-4
581
3665
105
125
129
194
262
0.07
7456
00
044
1.5
2010
240
3430
2.99
5275
4-1
00-5
077
2749
114
131
258
306
289
0.02
6752
00
040
221
1024
034
302.
8952
643
-111
-56
7721
7911
525
721
430
539
30.
0462
450
00
402
2210
141
2530
2.79
5253
2-1
11-5
677
2177
113
164
201
271
364
0.00
6442
00
040
223
1014
125
302.
7552
488
-44
-22
4422
7582
9516
424
033
30.
0065
430
00
202
2410
131
2430
2.69
5242
1-6
7-3
467
3371
103
9598
177
272
0.00
7950
140
029
225
1013
124
302.
6152
332
-89
-45
7025
7410
497
9217
121
50.
0078
5420
00
252
2610
121
2330
2.50
5221
0-1
22-6
280
1875
115
105
8516
720
10.
0064
4320
00
352
279
121
2230
2.36
5205
6-1
54-7
891
1380
130
102
8416
719
90.
0071
4430
00
401.
528
911
121
302.
2451
923
-133
-67
9124
7812
710
078
160
199
0.00
8349
300
040
1.5
298
111
2030
2.11
5177
9-1
44-7
391
1877
126
9981
162
193
0.00
7543
300
040
1.5
308
111
2030
1.95
5160
3-1
76-8
910
415
7414
281
7215
718
20.
0076
4142
00
401.
5
TO
TA
LS0.
76in
ches
cfs
357
717
910
83-8
7318
0292
922
9627
6435
9743
0265
3887
63M
AX
8667
186
00
633
62ac
-ft
708
1422
1821
48-1
731
-173
135
7418
4345
5454
8271
3585
3312
968
1738
1M
IN62
4136
90
012
5612
3
Wat
er s
tora
ge
elev
atio
n ±
to
fill
cu
rve:
-0.8
1S
NO
TE
L S
um
mar
y fo
r W
ater
Yea
r 20
09 R
ES
ER
VO
IR D
EL
IVE
RY
ST
AT
US
US
ED
Wat
er s
tora
ge
in a
c-ft
± t
o f
ill c
urv
e:-9
02U
ptda
ted:
Jun
e 30
, 20
09T
hese
allo
catio
ns, a
mou
nts
used
and
TV
ID67
8P
erce
nta
ge
of
full
rese
rvo
ir:
96.8
%S
EC
O W
/Y p
c:49
.7"
sno
dept
h/w
ater
con
tent
0re
mai
ning
are
pro
visi
onal
and
sub
ject
CW
S0
SD
MO
W/Y
pc:
65.1
"sn
o de
pth/
wat
er c
onte
nt0
to d
aily
cha
nges
as
the
WS
ele
vatio
nLO
0ris
es a
nd fa
lls. T
hese
num
bers
are
for
MU
NI
1256
plan
ning
pur
pose
s on
ly.
Oth
er54
5
SC
OG
GIN
S D
AM
--
RE
SE
RV
OIR
OP
ER
AT
ION
SJu
ne 2
009
DA
Y
INF
LO
WH
EN
RY
HA
GG
LA
KE
TU
AL
AT
IN R
IVE
RW
EA
TH
ER
WA
TE
R D
EL
IVE
RIE
S
PR
EC
IP
Min
imu
m R
equ
ired
Dis
char
ges
1224
4D
ec-S
ept:
10 c
fs
O
ct-N
ov: 2
0 cf
s
RE
MA
ININ
G
1261
850
0
[17]
(inch
es)

A P P E N D I X C — S c o g g i n s R e s e r v o i r O p e r a t i o n s M o n t h l y R e p o r t s
C - 8 2 0 0 9 T u a l a t i n R i v e r F l o w M a n a g e m e n t R e p o r t
Sou
rce:
Tua
latin
Val
ley
Irrig
atio
n D
istr
ict
[See
App
endi
x E
for
brea
kdow
n of
mun
icip
al u
se b
y w
ater
pro
vide
r.]
SC
HO
SC
LOT
AN
OT
OT
INF
LO
W.S
. E
LEV
ST
OR
CO
NT
CH
NG
ST
OR
CH
NG
ST
OR
RE
LC
OM
P
INF
LO
GA
SO
DLL
OG
OLF
RO
OD
FR
MO
WS
LOT
EM
P
MA
XT
EM
P
MIN
TV
IDC
WS
LOM
UN
IO
TH
R
(cfs
)(c
fs)
(cfs
)(c
fs)
(ft)
(ac-
ft)(a
c-f
t)(c
fs)
(cfs
)(c
fs)
(cfs
)(c
fs)
(cfs
)(c
fs)
(cfs
)(c
fs)
(°F
)(°
F)
(cfs
)(c
fs)
(cfs
)(c
fs)
(cfs
)[1
][2
][3
][4
][5
][6
][7
][8
][9
][1
0][1
1][1
2][1
3][1
4][1
5][1
6][1
8][1
9][2
0][2
1][2
2][2
3][2
4]
18
101
1930
1.73
5136
1-2
42-1
2214
523
7317
598
6514
317
20.
0077
5486
100
282
27
101
1830
1.40
5099
9-3
62-1
8318
63
7021
610
892
169
163
0.00
8751
108
100
482
37
101
1830
1.08
5064
9-3
50-1
7619
620
6822
410
899
179
185
0.00
9452
101
200
552
46
91
1630
0.77
5031
1-3
38-1
7018
616
6621
311
591
172
193
0.00
9149
101
200
473
56
91
1630
0.45
4996
2-3
49-1
7618
610
6721
411
010
117
919
00.
0091
5310
120
045
36
69
116
300.
1149
594
-368
-186
185
-169
217
124
111
187
196
0.00
7853
100
200
453
77
101
1829
9.81
4926
9-3
25-1
6416
95
7220
313
112
519
921
00.
0065
4794
200
353
87
101
1829
9.56
4900
0-2
69-1
3614
48
7017
511
014
020
321
80.
0070
5283
100
303
97
101
1829
9.34
4876
3-2
37-1
1913
718
7217
310
512
318
821
80.
0066
5176
100
303
107
91
1729
9.09
4849
5-2
68-1
3514
510
6917
311
612
118
220
70.
0074
5191
100
243
116
91
1629
8.81
4819
5-3
00-1
5117
625
6720
612
412
918
920
10.
0087
5591
300
353.
512
79
117
298.
5147
875
-320
-161
176
1566
205
132
136
193
207
0.00
7655
9030
035
3.5
138
101
1929
8.20
4754
5-3
30-1
6617
610
7521
415
516
921
923
00.
1965
5688
300
353.
514
79
117
297.
9547
279
-266
-134
150
1670
180
148
261
258
0.02
6849
8130
018
3.5
157
81
1629
7.14
4701
4-2
65-1
3414
612
6617
512
823
728
20.
0078
5081
300
153.
516
67
114
297.
4046
697
-317
-160
176
1662
198
110
207
249
0.00
8753
8330
045
3.5
176
71
1429
7.12
4640
2-2
95-1
4917
627
6019
910
511
018
222
10.
0091
5784
300
453
186
61
1329
6.81
4607
7-3
25-1
6416
62
6019
991
9816
519
60.
0093
5385
300
353
195
61
1229
6.51
4576
2-3
15-1
5916
12
6919
210
097
158
182
0.00
8448
8630
030
320
56
112
296.
2145
449
-313
-158
161
369
194
108
104
169
180
0.00
8057
8630
030
321
56
112
295.
8645
085
-364
-184
195
1168
223
101
105
171
182
0.00
9257
100
300
503
225
51
1129
5.49
4470
1-3
84-1
9420
814
6824
711
195
162
180
0.00
9152
114
350
453
234
51
1029
5.07
4426
7-4
34-2
1921
90
6824
613
611
316
716
50.
0082
4911
935
349
324
45
110
294.
6643
845
-422
-213
220
769
240
122
117
184
188
0.00
7750
117
403
455
253
51
929
4.28
4345
5-3
90-1
9722
225
6724
112
211
417
619
30.
0086
5711
740
349
526
35
19
293.
8943
057
-398
-201
223
2266
241
117
112
175
188
0.00
9158
116
403
505
273
41
829
3.49
4265
0-4
07-2
0522
318
6624
211
511
517
718
50.
0093
6211
740
350
528
34
18
293.
1042
255
-395
-199
223
2465
237
9910
517
118
50.
0010
167
117
403
505
293
41
829
2.68
4183
1-4
24-2
1423
925
6425
498
9015
617
50.
0010
466
123
403
605
303
41
829
2.20
4134
9-4
82-2
4325
310
6326
510
894
157
165
0.00
105
6212
550
362
531
34
18
291.
7540
899
-450
-227
245
1862
259
112
103
163
165
0.00
9357
120
503
604
TO
TA
LS0.
21in
ches
cfs
170
224
3142
5-5
397
5813
416
2086
6640
3567
3074
5640
6129
MA
X10
567
3081
890
2712
8010
8ac
-ft
337
444
6184
3-1
0704
-107
0411
530
826
4138
1317
070
7560
9711
187
1215
7M
IN65
4761
1117
6554
2539
214
Wat
er s
tora
ge
elev
atio
n ±
to
fill
cu
rve:
-11.
75S
NO
TE
L S
um
mar
y fo
r W
ater
Yea
r 20
09 R
ES
ER
VO
IR D
EL
IVE
RY
ST
AT
US
US
ED
Wat
er s
tora
ge
in a
c-ft
± t
o f
ill c
urv
e:-1
2424
Upt
date
d: J
uly
31,
2009
The
se a
lloca
tions
, am
ount
s us
ed a
ndT
VID
6790
Per
cen
tag
e o
f fu
ll re
serv
oir
:76
.7%
SE
CO
W/Y
pc:
49.3
"sn
o de
pth/
wat
er c
onte
nt0
rem
aini
ng a
re p
rovi
sion
al a
nd s
ubje
ctC
WS
1765
SD
MO
W/Y
pc:
65.7
"sn
o de
pth/
wat
er c
onte
nt0
to d
aily
cha
nges
as
the
WS
ele
vatio
nLO
54ris
es a
nd fa
lls. T
hese
num
bers
are
for
MU
NI
3794
plan
ning
pur
pose
s on
ly.
Oth
er76
0
SC
OG
GIN
S D
AM
--
RE
SE
RV
OIR
OP
ER
AT
ION
SJu
ly 2
009
DA
Y
INF
LO
WH
EN
RY
HA
GG
LA
KE
TU
AL
AT
IN R
IVE
RW
EA
TH
ER
WA
TE
R D
EL
IVE
RIE
S
PR
EC
IP
Min
imu
m R
equ
ired
Dis
char
ges
9706
Dec
-Sep
t: 10
cfs
Oct
-Nov
: 20
cfs
RE
MA
ININ
G
1085
344
6
[17]
(inch
es)

A P P E N D I X C — S c o g g i n s R e s e r v o i r O p e r a t i o n s M o n t h l y R e p o r t s
2 0 0 9 T u a l a t i n R i v e r F l o w M a n a g e m e n t R e p o r t C - 9
Sou
rce:
Tua
latin
Val
ley
Irrig
atio
n D
istr
ict
[See
App
endi
x E
for
brea
kdow
n of
mun
icip
al u
se b
y w
ater
pro
vide
r.]
SC
HO
SC
LOT
AN
OT
OT
INF
LO
W.S
. E
LEV
ST
OR
CO
NT
CH
NG
ST
OR
CH
NG
ST
OR
RE
LC
OM
P
INF
LO
GA
SO
DLL
OG
OLF
RO
OD
FR
MO
WS
LOT
EM
P
MA
XT
EM
P
MIN
TV
IDC
WS
LOM
UN
IO
TH
R
(cfs
)(c
fs)
(cfs
)(c
fs)
(ft)
(ac-
ft)(a
c-f
t)(c
fs)
(cfs
)(c
fs)
(cfs
)(c
fs)
(cfs
)(c
fs)
(cfs
)(c
fs)
(°F
)(°
F)
(cfs
)(c
fs)
(cfs
)(c
fs)
(cfs
)[1
][2
][3
][4
][5
][6
][7
][8
][9
][1
0][1
1][1
2][1
3][1
4][1
5][1
6][1
8][1
9][2
0][2
1][2
2][2
3][2
4]
13
41
829
1.29
4044
1-4
58-2
3123
76
6325
011
510
316
617
70.
0094
6111
060
352
42
33
17
290.
8439
995
-446
-225
235
1063
250
121
107
169
180
0.00
9659
109
603
524
33
31
729
0.39
3955
1-4
44-2
2423
511
6325
012
118
176
182
0.00
9455
109
603
524
43
31
729
0.00
3916
7-3
84-1
9420
612
6221
997
112
175
188
0.00
8952
9750
345
45
33
17
289.
6938
785
-382
-193
202
965
216
103
9215
618
00.
0082
5210
250
336
46
34
18
289.
2838
415
-370
-187
201
1459
212
103
9615
917
00.
0078
5710
250
335
47
34
18
288.
8338
026
-389
-196
207
1160
279
113
9716
319
00.
0067
5710
450
339
38
34
18
288.
4537
653
-373
-188
197
961
206
106
109
171
182
0.00
6848
9850
335
39
34
18
288.
0737
291
-362
-183
197
1460
207
118
107
168
188
0.00
7353
9850
335
310
34
18
287.
7136
945
-346
-174
197
2360
206
127
131
189
193
0.00
7948
9850
335
311
34
18
287.
3736
619
-326
-164
182
1857
189
105
124
191
193
0.00
8254
9340
335
312
713
121
287.
1136
371
-248
-125
184
5975
206
108
148
199
193
0.18
7463
8330
344
313
46
111
286.
8536
123
-248
-125
155
3066
174
148
267
328
193
0.20
7450
8820
330
314
35
19
286.
6235
905
-218
-110
133
2360
142
114
205
289
292
0.22
6750
8210
323
315
35
19
286.
3835
677
-228
-115
140
2560
142
9614
121
829
20.
0067
5191
103
243
163
41
828
6.14
3545
0-2
27-1
1413
016
6114
296
114
183
292
0.00
6745
8110
325
317
34
18
285.
9135
233
-217
-109
130
2159
139
9311
317
429
20.
0077
5081
103
253
183
31
728
5.64
3497
9-2
54-1
2815
628
5515
878
9016
129
20.
0089
5788
303
253
193
31
728
5.31
3466
9-3
10-1
5618
226
5318
371
8014
618
80.
0091
5793
303
453
203
31
728
4.91
3429
5-3
74-1
8920
718
5320
686
7014
118
80.
0097
5598
403
563
213
31
728
4.52
3393
2-3
63-1
8320
118
5420
510
183
148
188
0.00
8154
100
503
383
223
31
728
4.11
3355
2-3
80-1
9220
614
5520
912
010
216
418
00.
0075
5293
603
403
233
31
728
3.70
3317
3-3
79-1
9120
615
5520
811
711
618
219
90.
0078
4493
603
403
243
31
728
3.28
3278
7-3
86-1
9520
510
5621
212
812
718
721
80.
0071
4592
603
403
253
41
828
2.98
3251
2-2
75-1
3915
920
5515
175
123
190
224
0.00
8049
7040
335
326
34
18
282.
6632
219
-293
-148
154
656
159
7879
154
218
0.00
7146
7040
330
327
34
18
282.
3231
928
-291
-147
178
3154
180
8974
142
177
0.00
8449
7460
330
328
34
18
282.
0131
629
-299
-151
175
2453
177
9189
153
167
0.00
9051
7560
327
229
34
18
281.
6631
312
-317
-160
175
1556
180
101
9415
917
50.
0074
5574
603
282
303
51
928
1.34
3103
4-2
78-1
4017
535
5918
411
710
517
018
50.
0674
5371
603
302
313
41
828
1.00
3071
8-3
16-1
5917
516
5618
012
312
418
720
40.
0084
5372
603
302
TO
TA
LS0.
66in
ches
cfs
9812
731
256
-513
357
2258
918
2460
2131
5035
4055
5863
80M
AX
9763
2789
1370
9311
1695
ac-f
t19
425
261
508
-101
81-1
0181
1135
011
6836
1811
943
6248
7022
1102
412
655
MIN
6744
5532
2717
184
2214
188
Wat
er s
tora
ge
elev
atio
n ±
to
fill
cu
rve:
-22.
50S
NO
TE
L S
um
mar
y fo
r W
ater
Yea
r 20
09 R
ES
ER
VO
IR D
EL
IVE
RY
ST
AT
US
US
ED
Wat
er s
tora
ge
in a
c-ft
± t
o f
ill c
urv
e:-2
2605
Upt
date
d: A
ugus
t 31,
200
9T
hese
allo
catio
ns, a
mou
nts
used
and
TV
ID12
322
Per
cen
tag
e o
f fu
ll re
serv
oir
:57
.6%
SE
CO
W/Y
pc:
50.5
"sn
o de
pth/
wat
er c
onte
nt0
rem
aini
ng a
re p
rovi
sion
al a
nd s
ubje
ctC
WS
4483
SD
MO
W/Y
pc:
66.9
"sn
o de
pth/
wat
er c
onte
nt0
to d
aily
cha
nges
as
the
WS
ele
vatio
nLO
238
rises
and
falls
. The
se n
umbe
rs a
re fo
r M
UN
I60
08pl
anni
ng p
urpo
ses
only
.O
ther
948
SC
OG
GIN
S D
AM
--
RE
SE
RV
OIR
OP
ER
AT
ION
SA
ugus
t 20
09
DA
Y
INF
LO
WH
EN
RY
HA
GG
LA
KE
TU
AL
AT
IN R
IVE
RW
EA
TH
ER
WA
TE
R D
EL
IVE
RIE
S
PR
EC
IP
Min
imu
m R
equ
ired
Dis
char
ges
7492
Dec
-Sep
t: 10
cfs
Oct
-Nov
: 20
cfs
RE
MA
ININ
G
8135
262
[17]
(inch
es)

A P P E N D I X C — S c o g g i n s R e s e r v o i r O p e r a t i o n s M o n t h l y R e p o r t s
C - 1 0 2 0 0 9 T u a l a t i n R i v e r F l o w M a n a g e m e n t R e p o r t
Sou
rce:
Tua
latin
Val
ley
Irrig
atio
n D
istr
ict
[See
App
endi
x E
for
brea
kdow
n of
mun
icip
al u
se b
y w
ater
pro
vide
r.]
SC
HO
SC
LOT
AN
OT
OT
INF
LO
W.S
. E
LEV
ST
OR
CO
NT
CH
NG
ST
OR
CH
NG
ST
OR
RE
LC
OM
P
INF
LO
GA
SO
DLL
OG
OLF
RO
OD
FR
MO
WS
LOT
EM
P
MA
XT
EM
P
MIN
TV
IDC
WS
LOM
UN
IO
TH
R
(cfs
)(c
fs)
(cfs
)(c
fs)
(ft)
(ac-
ft)(a
c-f
t)(c
fs)
(cfs
)(c
fs)
(cfs
)(c
fs)
(cfs
)(c
fs)
(cfs
)(c
fs)
(°F
)(°
F)
(cfs
)(c
fs)
(cfs
)(c
fs)
(cfs
)[1
][2
][3
][4
][5
][6
][7
][8
][9
][1
0][1
1][1
2][1
3][1
4][1
5][1
6][1
8][1
9][2
0][2
1][2
2][2
3][2
4]
13
41
828
0.70
3045
0-2
68-1
3515
318
5816
087
128
188
224
0.00
8154
5560
325
22
34
18
280.
4130
191
-259
-131
146
1567
169
8310
316
421
30.
0077
5148
603
252
33
41
828
0.13
2994
3-2
48-1
2515
227
6717
787
9615
219
60.
0082
5349
603
302
43
41
827
9.79
2964
1-3
02-1
5217
422
6820
211
210
415
618
20.
0076
5456
703
352
53
61
1027
9.48
2936
8-2
73-1
3816
224
6919
010
612
517
421
00.
2176
5552
603
352
64
81
1327
9.20
2912
2-2
46-1
2416
238
7820
414
224
330
432
10.
4168
5449
603
352
74
101
1527
8.90
2885
6-2
66-1
3416
228
8521
618
825
833
740
10.
0865
5247
603
352
83
71
1127
8.61
2860
5-2
51-1
2716
235
7420
016
225
533
639
70.
0068
4451
603
352
93
51
927
8.44
2845
7-1
48-7
598
2369
131
9520
128
137
60.
0072
4637
203
272
103
51
927
8.28
2831
8-1
39-7
093
2369
121
7113
120
331
70.
0075
532
203
272
113
51
927
8.14
2819
6-1
22-6
278
1668
106
6010
616
324
90.
0084
5224
203
202
123
41
827
7.95
2803
2-1
64-8
311
128
6813
477
8414
721
00.
0091
5228
503
202
133
41
827
7.80
2790
2-1
30-6
611
145
6813
581
9415
019
30.
0088
5528
503
202
143
41
827
7.56
2769
5-2
07-1
0411
17
6913
782
102
157
196
0.00
7054
2850
320
215
34
18
277.
2727
445
-250
-126
152
2670
177
9710
215
920
10.
0076
5139
603
402
163
41
827
6.96
2719
0-2
55-1
2916
031
6918
410
411
016
419
90.
0081
5347
603
402
173
51
927
6.65
2691
5-2
75-1
3916
122
7218
411
812
717
521
30.
0367
4747
603
402
183
41
827
6.36
2666
8-2
47-1
2515
328
7017
711
913
718
922
70.
0073
4648
603
321.
519
34
18
276.
0926
439
-229
-115
146
3169
167
109
131
192
242
0.01
8153
4860
325
1.5
203
41
827
5.82
2621
1-2
28-1
1514
631
7116
912
313
018
525
30.
0167
4748
603
251.
521
34
18
275.
5325
966
-245
-124
146
2270
168
116
140
197
246
0.00
7346
4860
325
1.5
222
31
627
5.25
2573
1-2
35-1
1814
628
7016
591
118
180
242
0.00
8456
5060
325
1.5
232
31
627
4.94
2547
2-2
59-1
3115
827
6917
698
100
158
218
0.00
9149
5560
332
1.5
242
31
627
4.61
2519
7-2
75-1
3916
627
5217
310
710
015
519
90.
0088
4753
703
321.
525
23
16
274.
2324
881
-316
-159
191
3251
191
121
108
164
196
0.00
7145
5880
342
1.5
262
31
627
3.87
2458
4-2
97-1
5017
626
5217
811
111
817
320
40.
0079
4543
803
421.
527
23
16
273.
5024
280
-304
-153
176
2352
178
113
114
170
215
0.00
7342
4380
342
1.5
282
31
627
3.12
2396
9-3
11-1
5717
619
5117
712
312
017
721
50.
0080
4343
803
421.
529
24
17
272.
8123
717
-252
-127
158
3152
159
114
125
181
221
0.04
6544
3680
330
1.5
303
51
927
2.50
2346
5-2
52-1
2715
831
5616
411
212
918
222
70.
0358
4224
803
401.
5
TO
TA
LS0.
82in
ches
cfs
8413
330
247
-365
744
4478
719
7350
6932
0939
3957
1372
03M
AX
9156
1314
1790
9094
354
ac-f
t16
726
460
490
-725
3-7
253
8815
1562
3913
1005
463
6578
1311
332
1428
7M
IN58
526
0635
5017
918
7010
6
Wat
er s
tora
ge
elev
atio
n ±
to
fill
cu
rve:
-31
SN
OT
EL
Su
mm
ary
for
Wat
er Y
ear
2009
RE
SE
RV
OIR
DE
LIV
ER
Y S
TA
TU
SU
SE
DW
ater
sto
rag
e in
ac-
ft ±
to
fill
cu
rve:
-298
58U
ptda
ted:
Sep
tem
ber
30,
2009
The
se a
lloca
tions
, am
ount
s us
ed a
ndT
VID
14928
Per
cen
tag
e o
f fu
ll re
serv
oir
:44
.0%
SE
CO
W/Y
pc:
53.7
"sn
o de
pth/
wat
er c
onte
nt0
rem
aini
ng a
re p
rovi
sion
al a
nd s
ubje
ctC
WS
8033
SD
MO
W/Y
pc:
69.2
"sn
o de
pth/
wat
er c
onte
nt0
to d
aily
cha
nges
as
the
WS
ele
vatio
nLO
417
rises
and
falls
. The
se n
umbe
rs a
re fo
r M
UN
I78
78
plan
ning
pur
pose
s on
ly.
Oth
er10
54D
ec-S
ept:
10 c
fs
O
ct-N
ov: 2
0 cf
s
4585 83
Min
imu
m R
equ
ired
Dis
char
ges
5622
(inch
es)
[17]
RE
MA
ININ
G
SC
OG
GIN
S D
AM
--
RE
SE
RV
OIR
OP
ER
AT
ION
SS
epte
mbe
r 20
09
DA
Y
INF
LO
WH
EN
RY
HA
GG
LA
KE
TU
AL
AT
IN R
IVE
RW
EA
TH
ER
WA
TE
R D
EL
IVE
RIE
S
PR
EC
IP

A P P E N D I X C — S c o g g i n s R e s e r v o i r O p e r a t i o n s M o n t h l y R e p o r t s
2 0 0 9 T u a l a t i n R i v e r F l o w M a n a g e m e n t R e p o r t C - 1 1
Sou
rce:
Tua
latin
Val
ley
Irrig
atio
n D
istr
ict
[See
App
endi
x E
for
brea
kdow
n of
mun
icip
al u
se b
y w
ater
pro
vide
r.]
*
*An
addi
tiona
l 2 c
fs o
f na
tura
l flo
w w
as r
elea
sed
for
mun
icip
al u
se. (
tota
l mun
icip
al u
se: 2
0 cf
s)
SC
HO
SC
LOT
AN
OT
OT
INF
LO
W.S
. E
LEV
ST
OR
CO
NT
CH
NG
ST
OR
CH
NG
ST
OR
RE
LC
OM
P
INF
LO
GA
SO
DLL
OG
OLF
RO
OD
FR
MO
WS
LOT
EM
P
MA
XT
EM
P
MIN
TV
IDC
WS
LOM
UN
IO
TH
R
(cfs
)(c
fs)
(cfs
)(c
fs)
(ft)
(ac-
ft)(a
c-f
t)(c
fs)
(cfs
)(c
fs)
(cfs
)(c
fs)
(cfs
)(c
fs)
(cfs
)(c
fs)
(°F
)(°
F)
(cfs
)(c
fs)
(cfs
)(c
fs)
(cfs
)[1
][2
][3
][4
][5
][6
][7
][8
][9
][1
0][1
1][1
2][1
3][1
4][1
5][1
6][1
8][1
9][2
0][2
1][2
2][2
3][2
4]
13
41
827
2.21
2323
1-2
34-1
1814
830
5615
413
114
219
223
60.
0161
4415
803
402
22
41
727
2.01
2307
0-1
61-8
111
736
5512
210
014
720
224
90.
0165
4710
803
152
32
41
727
1.76
2286
9-2
01-1
0112
928
5513
489
122
183
249
0.03
5935
1960
338
24
24
17
271.
5122
668
-201
-101
129
2855
133
9711
717
023
60.
0357
4019
603
382
52
41
727
1.26
2246
9-1
99-1
0012
929
5413
195
117
169
218
0.00
6636
1960
338
26
24
17
270.
9922
254
-215
-108
141
3353
141
9511
016
521
50.
0066
3621
703
382
72
41
727
0.71
2203
1-2
23-1
1214
129
5314
110
811
016
320
70.
0070
3826
803
232
82
41
727
0.45
2182
4-2
07-1
0413
430
5313
499
118
172
207
0.00
6839
1980
323
29
24
17
270.
2021
626
-198
-100
145
4553
145
102
113
172
210
0.00
6837
2180
332
210
24
17
269.
9021
389
-237
-119
144
2553
144
9911
216
821
50.
0065
3620
803
322
112
31
626
9.60
2115
2-2
37-1
1914
425
5314
410
110
816
621
30.
0063
3821
803
322
122
31
626
9.33
2094
0-2
12-1
0714
437
5314
510
411
216
720
70.
0057
3721
803
322
132
41
726
9.05
2072
0-2
20-1
1113
524
5513
792
115
170
207
0.05
5838
1180
332
214
818
127
268.
9320
627
-93
-47
116
6968
138
8414
518
624
90.
9756
402
603
322
154
121
1726
8.86
2057
2-5
5-2
896
6893
152
146
206
292
299
0.11
6450
440
032
216
38
112
268.
7920
517
-55
-28
6032
6591
8919
627
132
10.
0261
515
100
221
173
81
1226
8.77
2050
2-1
5-8
4840
6676
6414
121
830
30.
0263
545
100
221
183
121
1626
8.74
2047
8-2
4-1
248
3673
8875
165
239
344
0.20
6654
510
022
119
411
116
268.
7320
470
-8-4
4844
7184
7013
321
129
60.
2162
515
100
221
203
111
1526
8.68
2043
1-3
9-2
070
5069
9995
110
177
255
0.00
6545
930
015
121
413
118
268.
5820
361
-70
-35
7338
6810
394
131
197
230
0.30
6049
440
010
122
414
119
268.
5320
315
-46
-23
7350
8411
811
817
124
026
20.
0264
423
400
101
233
121
1626
8.41
2022
1-9
4-4
783
3675
117
117
161
232
278
0.11
5742
840
017
124
418
224
268.
4520
252
3116
5369
109
126
118
291
390
368
0.35
5941
410
017
125
313
218
268.
4020
214
-38
-19
5334
8498
122
196
296
393
0.00
5941
410
017
126
314
219
268.
3920
206
-8-4
5450
8192
9816
124
532
90.
1857
433
100
171
2723
283
5426
8.45
2025
246
2312
3512
610
589
336
463
459
0.32
5639
310
00
028
1724
243
268.
5020
291
3920
1232
129
112
161
197
315
468
0.06
5335
30
00
029
2431
358
268.
5820
354
6332
1042
105
8613
421
929
440
10.
4649
363
00
00
3018
282
4826
8.68
2043
177
3910
4912
610
716
336
651
448
70.
0855
443
00
00
3137
525
9426
8.79
2051
786
4310
5312
497
117
301
426
532
0.19
6051
30
00
0
TO
TA
LS3.
73in
ches
cfs
195
377
4461
6-1
486
2709
1223
2317
3694
3266
5169
7465
9143
MA
X70
5431
813
0042
668
41ac
-ft
387
748
8712
22-2
948
-294
853
73
2425
4596
7327
6478
1025
314
807
1813
5M
IN49
3563
125
7983
1325
81
Wat
er s
tora
ge
elev
atio
n ±
to
fill
cu
rve:
-34.
71S
NO
TE
L S
um
mar
y fo
r W
ater
Yea
r 20
09 R
ES
ER
VO
IR D
EL
IVE
RY
ST
AT
US
US
ED
Wat
er s
tora
ge
in a
c-ft
± t
o f
ill c
urv
e:-3
2806
Upt
date
d: O
ctob
er 3
1,T
hese
allo
catio
ns, a
mou
nts
used
and
TV
ID15
559
Per
cen
tag
e o
f fu
ll re
serv
oir
:38
.5%
SE
CO
W/Y
pc:
5.9"
sno
dept
h/w
ater
con
tent
0re
mai
ning
are
pro
visi
onal
and
sub
ject
CW
S10
612
SD
MO
W/Y
pc:
7.7"
sno
dept
h/w
ater
con
tent
0to
dai
ly c
hang
es a
s th
e W
S e
leva
tion
LO50
0ris
es a
nd fa
lls. T
hese
num
bers
are
for
MU
NI
9203
plan
ning
pur
pose
s on
ly.
Oth
er11
36D
ec-S
ept:
10 c
fs
O
ct-N
ov: 2
0 cf
s0
2006 0
Min
imu
m R
equ
ired
Dis
char
ges
4297
(inch
es)
[17]
RE
MA
ININ
G
SC
OG
GIN
S D
AM
--
RE
SE
RV
OIR
OP
ER
AT
ION
SO
ctob
er 2
009
DA
Y
INF
LO
WH
EN
RY
HA
GG
LA
KE
TU
AL
AT
IN R
IVE
RW
EA
TH
ER
WA
TE
R D
EL
IVE
RIE
S
PR
EC
IP

A P P E N D I X C — S c o g g i n s R e s e r v o i r O p e r a t i o n s M o n t h l y R e p o r t s
C - 1 2 2 0 0 9 T u a l a t i n R i v e r F l o w M a n a g e m e n t R e p o r t
Sou
rce:
Tua
latin
Val
ley
Irrig
atio
n D
istr
ict
[See
App
endi
x E
for
brea
kdow
n of
mun
icip
al u
se b
y w
ater
pro
vide
r.]
SC
HO
SC
LOT
AN
OT
OT
INF
LO
W.S
. E
LEV
ST
OR
CO
NT
CH
NG
ST
OR
CH
NG
ST
OR
RE
LC
OM
P
INF
LO
GA
SO
DLL
OG
OLF
RO
OD
FR
MO
WS
LOT
EM
P
MA
XT
EM
P
MIN
TV
IDC
WS
LOM
UN
IO
TH
R
(cfs
)(c
fs)
(cfs
)(c
fs)
(ft)
(ac-
ft)(a
c-f
t)(c
fs)
(cfs
)(c
fs)
(cfs
)(c
fs)
(cfs
)(c
fs)
(cfs
)(c
fs)
(°F
)(°
F)
(cfs
)(c
fs)
(cfs
)(c
fs)
(cfs
)[1
][2
][3
][4
][5
][6
][7
][8
][9
][1
0][1
1][1
2][1
3][1
4][1
5][1
6][1
8][1
9][2
0][2
1][2
2][2
3][2
4]
125
313
5926
8.89
2059
578
3910
4916
614
825
726
536
845
40.
0458
363
00
00
219
252
4626
8.95
2064
247
2410
3411
910
717
030
742
342
30.
0057
353
00
00
317
222
4126
9.01
2068
947
2410
3494
8411
822
433
642
30.
0056
373
00
00
415
202
3726
9.03
2070
516
810
1883
7510
416
224
735
20.
0059
393
00
00
514
182
3426
9.04
2071
38
420
2465
9292
152
208
285
0.00
6239
30
00
06
4546
394
269.
1420
791
7839
2160
9068
7518
723
644
50.
7759
442
00
00
756
584
118
269.
3020
916
125
6321
8419
114
227
235
945
545
90.
5155
462
00
00
828
935
126
269.
7721
286
370
187
2120
833
432
211
7913
301.
5150
462
00
00
963
744
141
270.
0621
515
229
115
2213
726
026
714
0915
300.
0852
432
00
00
1086
955
186
270.
4921
856
341
172
2319
532
231
011
1014
300.
7850
392
00
00
1173
823
158
270.
8022
102
246
124
2314
724
626
410
4812
400.
1353
402
00
00
1260
713
134
271.
0322
285
183
9224
116
201
204
407
1026
1270
0.10
4839
20
00
013
5164
311
827
1.23
2244
516
081
2110
216
416
735
880
795
911
600.
1647
402
00
00
1450
633
116
271.
4522
621
176
8920
109
185
176
373
717
861
1060
0.08
4933
20
00
015
4556
310
427
1.63
2276
514
473
2093
157
152
278
662
794
924
0.07
4234
20
00
016
5061
311
427
1.70
2290
113
669
2190
199
164
312
563
690
834
0.09
4941
20
00
017
8324
14
328
272.
3623
352
451
227
2224
950
636
758
254
465
886
90.
5159
442
00
00
1853
155
020
827
3.14
2398
563
331
922
341
399
488
1070
1240
1300
962
0.30
4938
20
00
019
113
288
540
627
3.85
2456
858
329
423
317
386
428
970
1400
1528
1550
0.87
4839
20
00
020
7120
64
281
274.
8925
430
862
435
2245
744
654
913
3015
7016
7416
900.
2255
451
00
00
2158
157
321
827
5.62
2604
261
230
922
331
391
547
1280
1830
1975
2090
0.37
4637
10
00
022
211
348
456
327
6.62
2688
984
742
723
450
575
583
1260
1940
2113
2430
1.37
4738
10
00
023
102
196
330
127
7.87
2799
311
0455
722
579
495
768
1550
2180
2402
2610
0.09
4936
10
00
024
6414
23
209
278.
5928
588
595
300
2232
237
969
715
3021
7023
9926
400.
0051
391
00
00
2557
118
317
827
9.08
2901
642
821
622
238
327
575
1350
2130
2360
2600
0.00
5639
20
00
026
4510
33
151
279.
4929
377
361
182
2220
429
046
210
3019
4021
8724
800.
0250
391
00
00
2757
125
318
528
0.00
2982
745
022
722
249
368
483
979
1960
2185
2710
0.88
4841
10
00
028
4610
63
155
280.
4130
191
364
184
2120
532
247
194
119
2021
8025
500.
0053
381
00
00
2940
933
136
280.
7730
513
322
162
2118
328
039
879
716
7019
0823
100.
0047
381
00
00
3036
893
128
281.
0730
781
268
135
2115
624
733
367
814
1016
1019
700.
0052
361
00
00
TO
TA
LS8.
95in
ches
cfs
1733
3246
9450
7351
7560
457
7982
8798
9118
163
2830
937
828
4308
0M
AX
6246
550
00
0ac
-ft
3437
6438
186
1006
210
264
1026
411
98
1146
216
437
1961
936
026
5615
175
032
8544
9M
IN42
3310
90
00
0
Wat
er s
tora
ge
elev
atio
n ±
to
fill
cu
rve:
-2.4
3S
NO
TE
L S
um
mar
y fo
r W
ater
Yea
r 20
09 R
ES
ER
VO
IR D
EL
IVE
RY
ST
AT
US
US
ED
Wat
er s
tora
ge
in a
c-ft
± t
o f
ill c
urv
e:-2
208
Upt
date
d: N
ovem
ber
30,
2009
The
se a
lloca
tions
, am
ount
s us
ed a
ndT
VID
15668
Per
cen
tag
e o
f fu
ll re
serv
oir
:57
.7%
SE
CO
W/Y
pc:
18.6
"sn
o de
pth/
wat
er c
onte
nt0
rem
aini
ng a
re p
rovi
sion
al a
nd s
ubje
ctC
WS
10612
SD
MO
W/Y
pc:
23.3
"sn
o de
pth/
wat
er c
onte
nt0
to d
aily
cha
nges
as
the
WS
ele
vatio
nLO
500
rises
and
falls
. The
se n
umbe
rs a
re fo
r M
UN
I92
03
plan
ning
pur
pose
s on
ly.
Oth
er11
36D
ec-S
ept:
10 c
fs
O
ct-N
ov: 2
0 cf
s0
2006 0
Min
imu
m R
equ
ired
Dis
char
ges
4297
(inch
es)
[17]
RE
MA
ININ
G
SC
OG
GIN
S D
AM
--
RE
SE
RV
OIR
OP
ER
AT
ION
SN
ovem
ber
2009
DA
Y
INF
LO
WH
EN
RY
HA
GG
LA
KE
TU
AL
AT
IN R
IVE
RW
EA
TH
ER
WA
TE
R D
EL
IVE
RIE
S
PR
EC
IP

A P P E N D I X C — S c o g g i n s R e s e r v o i r O p e r a t i o n s M o n t h l y R e p o r t s
2 0 0 9 T u a l a t i n R i v e r F l o w M a n a g e m e n t R e p o r t C - 1 3
Sou
rce:
Tua
latin
Val
ley
Irrig
atio
n D
istr
ict
[See
App
endi
x E
for
brea
kdow
n of
mun
icip
al u
se b
y w
ater
pro
vide
r.]
SC
HO
SC
LOT
AN
OT
OT
INF
LO
W.S
. E
LEV
ST
OR
CO
NT
CH
NG
ST
OR
CH
NG
ST
OR
RE
LC
OM
P
INF
LO
GA
SO
DLL
OG
OLF
RO
OD
FR
MO
WS
LOT
EM
P
MA
XT
EM
P
MIN
TV
IDC
WS
LOM
UN
IO
TH
R
(cfs
)(c
fs)
(cfs
)(c
fs)
(ft)
(ac-
ft)(a
c-f
t)(c
fs)
(cfs
)(c
fs)
(cfs
)(c
fs)
(cfs
)(c
fs)
(cfs
)(c
fs)
(°F
)(°
F)
(cfs
)(c
fs)
(cfs
)(c
fs)
(cfs
)[1
][2
][3
][4
][5
][6
][7
][8
][9
][1
0][1
1][1
2][1
3][1
4][1
5][1
6][1
8][1
9][2
0][2
1][2
2][2
3][2
4]
134
713
108
281.
3030
988
207
104
2212
621
827
856
913
6216
700.
0043
390
00
00
229
643
9628
1.51
3117
718
995
2111
619
623
146
211
7014
300.
0051
320
00
00
327
562
8528
1.69
3133
916
282
2110
317
519
837
697
712
300.
0049
320
00
00
423
532
7828
1.86
3149
315
478
2210
016
218
434
283
210
500.
0046
250
00
00
521
472
7028
2.00
3161
912
664
2286
150
177
321
746
930
0.00
4425
00
00
06
1944
265
282.
1131
719
100
5022
7214
316
329
068
485
40.
0044
270
00
00
718
411
6028
2.21
3181
091
4622
6813
415
126
752
662
977
10.
0036
220
00
00
815
361
5228
2.31
3190
191
4622
6813
710
924
446
556
571
60.
0029
200
00
00
915
321
4828
2.39
3197
372
3622
5817
310
619
538
856
564
60.
0031
100
00
00
1018
321
5128
2.46
3203
764
3222
5410
211
122
230
054
70.
0031
110
00
00
1121
321
5428
2.55
3211
982
4122
6310
010
919
637
445
049
20.
0034
120
00
00
1221
331
5528
2.63
3219
273
3722
5911
712
119
239
547
352
20.
0036
120
00
00
1321
311
5328
2.70
3225
664
3222
5411
312
118
834
644
954
70.
0036
240
00
00
1414
321
4728
2.81
3235
610
050
2272
110
115
170
335
435
522
0.12
3823
00
00
015
4376
512
428
3.10
3262
226
613
424
158
238
218
269
524
572
828
1.45
4136
00
00
016
7415
16
231
283.
7933
256
634
320
9041
043
955
810
7016
2016
8018
800.
9650
410
00
00
1774
174
625
428
4.47
3388
663
031
890
408
452
697
1340
2390
2650
3110
0.46
5144
00
00
018
5513
45
194
284.
7934
183
297
150
200
350
366
773
1420
2470
2810
3340
0.06
4839
00
00
019
4511
12
158
284.
8934
277
9447
199
246
318
708
1380
2400
2710
3200
0.03
4842
00
00
020
4198
214
128
4.89
3427
70
019
719
728
763
612
3023
1026
1030
600.
0449
450
00
00
2155
123
318
128
5.09
3439
812
161
199
260
349
634
1140
2240
2520
3110
0.70
5447
00
00
022
4711
63
166
285.
0234
398
00
253
253
351
699
1210
2240
2514
3050
0.13
4833
00
00
023
4010
32
145
284.
9534
333
-65
-33
250
217
312
687
1180
2160
2425
2900
0.00
4230
00
00
024
3793
213
228
4.82
3421
1-1
22-6
225
018
828
464
511
0020
4023
0027
200.
0037
280
00
00
2532
842
118
284.
7434
137
-74
-37
204
167
252
575
980
1880
2111
2530
0.00
4227
00
00
026
2976
210
728
4.62
3402
5-1
12-5
620
414
824
152
486
016
7018
7522
800.
0043
280
00
00
2728
702
100
284.
4633
876
-149
-75
203
128
224
473
765
1470
1644
2020
0.00
4230
00
00
028
2663
291
284.
3033
728
-148
-75
203
128
207
434
679
1300
1452
1780
0.00
4029
00
00
029
2558
285
284.
1033
542
-186
-94
203
109
195
405
626
1150
1288
1570
0.00
4525
00
00
030
2558
285
283.
9933
441
-101
-51
203
152
198
404
606
1070
1198
1460
0.17
3632
00
00
031
4263
210
728
3.84
3330
2-1
39-7
020
413
421
542
561
611
7012
8315
200.
9938
340
00
00
TO
TA
LS5.
11in
ches
cfs
1014
2255
7233
4112
71
3482
4753
6958
1166
920
505
33233
42979
52285
MA
X54
470
00
00
ac-f
t20
1144
7314
366
272521
2521
6907
9428
1380
123
145
4067
265
918
85249
103707
MIN
2910
00
00
0
Wat
er s
tora
ge
elev
atio
n ±
to
fill
cu
rve:
0.34
SN
OT
EL
Su
mm
ary
for
Wat
er Y
ear
Dat
e: R
ES
ER
VO
IR D
EL
IVE
RY
ST
AT
US
US
ED
Wat
er s
tora
ge
in a
c-ft
± t
o f
ill c
urv
e:31
3U
ptda
ted:
Dec
embe
r 31
, 20
09T
hese
allo
catio
ns, a
mou
nts
used
and
TV
ID15
668
Per
cen
tag
e o
f fu
ll re
serv
oir
:62
.5%
SE
CO
W/Y
pc:
25.5
"sn
o de
pth/
wat
er c
onte
nt2.
0/0.
2"re
mai
ning
are
pro
visi
onal
and
sub
ject
CW
S10
612
SD
MO
W/Y
pc:
30.8
"sn
o de
pth/
wat
er c
onte
nt9.
0/1.
1"to
dai
ly c
hang
es a
s th
e W
S e
leva
tion
LO50
0ris
es a
nd fa
lls. T
hese
num
bers
are
for
MU
NI
9203
plan
ning
pur
pose
s on
ly.
Oth
er11
36D
ec-S
ept:
10 c
fs
O
ct-N
ov: 2
0 cf
s
2006 0
Min
imu
m R
equ
ired
Dis
char
ges
4297
(inch
es)
[17]
RE
MA
ININ
G
SC
OG
GIN
S D
AM
--
RE
SE
RV
OIR
OP
ER
AT
ION
SD
ecem
ber
2009
DA
Y
INF
LO
WH
EN
RY
HA
GG
LA
KE
TU
AL
AT
IN R
IVE
RW
EA
TH
ER
WA
TE
R D
EL
IVE
RIE
S
PR
EC
IP

A P P E N D I X C — S c o g g i n s R e s e r v o i r O p e r a t i o n s M o n t h l y R e p o r t s
C - 1 4 2 0 0 9 T u a l a t i n R i v e r F l o w M a n a g e m e n t R e p o r t
(this page intentionally blank)

Appendix D
Barney Reservoir Operations
Monthly Records
Breakdown of allocations for municipal use by water provider can be found inAppendix E of this report.

APPENDIX D—Barney Reservoir Operations Monthly ReportsD-2 2009 Tualatin River Flow Management Report
BARNEY RESERVOIR OPERATIONS FOR THE MONTH OF JANUARY 2009
[See Appendix E for breakdown of municipal use by water provider.] Source: Joint Water Commission
DAY
SURFACEELEVATION
STORAGECHANGE INSTORAGE
RAIN @BARNEY
TEMP @ BARNEY
MEASURED FLOW TO STORAGE RELEASED TO TRASK—ODFW
STORAGE RELEASED TO TUALATIN
Min Max TRASK TUALATIN CWS MUNICIPAL
feet ac-ft ac-ft in. ºF ºF cfs cfs cfs ac-ft cfs ac-ft cfs ac-ft
1 0 0 0 0
2 0 0 0 0
3 0 0 0 0
4 0 0 0 0
5 1635.2 17700 1912 1.73 26 40 2.8 0.0 0 0 0 0 0 0
6 0 0 0 0
7 1637.0 18500 800 1.81 36 44 5.1 0.0 0 0 0 0 0 0
8 0 0 0 0
9 1640.3 19920 1420 2.36 32 44 3.4 0.0 0 0 0 0 0 0
10 0 0 0 0
11 0 0 0 0
12 1640.8 20000 80 0.27 30 44 95.2 0.0 0 0 0 0 0 0
13 0 0 0 0
14 1640.8 20000 0 0.02 28 46 64.0 0.0 0 0 0 0 0 0
15 0 0 0 0
16 1640.7 20000 0 0.02 30 43 55.5 0.0 0 0 0 0 0 0
17 0 0 0 0
18 0 0 0 0
19 0 0 0 0
20 0 0 0 0
21 1640.7 20000 0 0.01 28 44 41.0 0.0 0 0 0 0 0 0
22 0 0 0 0
23 1640.7 20000 0 0.00 32 42 42.0 0.0 0 0 0 0 0 0
24 0 0 0 0
25 0 0 0 0
26 1640.7 20000 0 0.20 22 40 31.3 0.0 0 0 0 0 0 0
27 1640.7 20000 0 0.00 23 32 35.0 0.0 0 0 0 0 0 0
28 0 0 0 0
29 0 0 0 0
30 1640.7 20000 0 0.64 28 38 31.3 0.0 0 0 0 0 0 0
31 0 0 0 0
Monthly Totals 4212 7.06 0 0 0
Year to Date Totals 4212 7.06 0 0 0

APPENDIX D—Barney Reservoir Operations Monthly Reports2009 Tualatin River Flow Management Report D-3
BARNEY RESERVOIR OPERATIONS FOR THE MONTH OF FEBRUARY 2009
[See Appendix E for breakdown of municipal use by water provider.] Source: Joint Water Commission
DAY
SURFACEELEVATION
STORAGECHANGE INSTORAGE
RAIN @BARNEY
TEMP @ BARNEY
MEASURED FLOW TO STORAGE RELEASED TO TRASK—ODFW
STORAGE RELEASED TO TUALATIN
Min Max TRASK TUALATIN CWS MUNICIPAL
feet ac-ft ac-ft in. ºF ºF cfs cfs cfs ac-ft cfs ac-ft cfs ac-ft
1 0 0 0 0 0 0
2 1640.6 20000 0 0.03 28 44 31.3 0.0 0 0 0 0 0 0
3 0 0 0 0 0 0
4 1640.6 20000 0 0.00 32 52 27.5 0.0 0 0 0 0 0 0
5 0 0 0 0 0 0
6 1640.7 20000 0 0.26 35 50 31.3 0.0 0 0 0 0 0 0
7 0 0 0 0 0 0
8 0 0 0 0 0 0
9 1640.7 20000 0 0.32 27 49 31.3 0.0 0 0 0 0 0 0
10 0 0 0 0 0 0
11 1640.7 20000 0 0.59 27 33 31.3 0.0 0 0 0 0 0 0
12 0 0 0 0 0 0
13 1640.7 20000 0 0.33 30 32 31.3 0.0 0 0 0 0 0 0
14 0 0 0 0 0 0
15 0 0 0 0 0 0
16 0 0 0 0 0 0
17 1640.6 20000 0 0.24 32 40 23.9 0.0 0 0 0 0 0 0
18 0 0 0 0 0 0
19 0 0 0 0 0 0
20 1640.6 20000 0 0.00 28 46 23.9 0.0 0 0 0 0 0 0
21 0 0 0 0 0 0
22 0 0 0 0 0 0
23 1640.7 20000 0 0.00 32 46 35.0 0.0 0 0 0 0 0 0
24 0 0 0 0 0 0
25 1640.7 20000 0 1.98 34 43 64.0 0.0 0 0 0 0 0 0
26 0 0 0 0 0 0
27 1640.7 20000 0.94 25 38 47.0 0.0 0 0 0 0 0 0
28 0 0 0 0 0 0
Monthly Totals 0 4.69 0 0 0
Year to Date Totals 4212 11.75 0 0 0

APPENDIX D—Barney Reservoir Operations Monthly ReportsD-4 2009 Tualatin River Flow Management Report
BARNEY RESERVOIR OPERATIONS FOR THE MONTH OF MARCH 2009
[See Appendix E for breakdown of municipal use by water provider.] Source: Joint Water Commission
DAY
SURFACEELEVATION
STORAGECHANGE INSTORAGE
RAIN @BARNEY
TEMP @ BARNEY
MEASURED FLOW TO STORAGE RELEASED TO TRASK—ODFW
STORAGE RELEASED TO TUALATIN
Min Max TRASK TUALATIN CWS MUNICIPAL
feet ac-ft ac-ft in. ºF ºF cfs cfs cfs ac-ft cfs ac-ft cfs ac-ft
1 0 0 0 0 0 0
2 1640.7 20000 0 0.75 28 44 55.5 0.0 0 0 0 0 0 0
3 0 0 0 0 0 0
4 1640.7 20000 0 0.56 30 44 47.0 0.0 0 0 0 0 0 0
5 0 0 0 0 0 0
6 1640.7 20000 0 1.01 28 40 47.0 0.0 0 0 0 0 0 0
7 0 0 0 0 0 0
8 0 0 0 0 0 0
9 1640.7 20000 0 0.62 27 36 41.0 0.0 0 0 0 0 0 0
10 0 0 0 0 0 0
11 1640.7 20000 0 0.15 27 33 35.0 0.0 0 0 0 0 0 0
12 0 0 0 0 0 0
13 1640.6 20000 0 0.00 26 42 31.3 0.0 0 0 0 0 0 0
14 0 0 0 0 0 0
15 0 0 0 0 0 0
16 1640.8 20000 0 3.51 32 42 95.2 0.0 0 0 0 0 0 0
17 0 0 0 0 0 0
18 1640.7 20000 0 1.03 38 42 64.0 0.0 0 0 0 0 0 0
19 0 0 0 0 0 0
20 1640.7 20000 0 0.02 36 46 47.0 0.0 0 0 0 0 0 0
21 0 0 0 0 0 0
22 0 0 0 0 0 0
23 1640.7 20000 0 0.47 30 46 41.0 0.0 0 0 0 0 0 0
24 0 0 0 0 0 0
25 1640.7 20000 0 1.00 32 42 47.0 0.0 0 0 0 0 0 0
26 0 0 0 0 0 0
27 1640.7 20000 0 0.05 30 44 41.0 0.0 0 0 0 0 0 0
28 0 0 0 0 0 0
29 0 0 0 0 0 0
30 1640.7 20000 0 1.16 29 45 47.0 0.0 0 0 0 0 0 0
31 0 0 0 0 0 0
Monthly Totals 0 10.33 0 0 0
Year to Date Totals 4212 22.08 0 0 0

APPENDIX D—Barney Reservoir Operations Monthly Reports2009 Tualatin River Flow Management Report D-5
BARNEY RESERVOIR OPERATIONS FOR THE MONTH OF APRIL 2009
[See Appendix E for breakdown of municipal use by water provider.] Source: Joint Water Commission
DAY
SURFACEELEVATION
STORAGECHANGE INSTORAGE
RAIN @BARNEY
TEMP @ BARNEY
MEASURED FLOW TO STORAGE RELEASED TO TRASK—ODFW
STORAGE RELEASED TO TUALATIN
Min Max TRASK TUALATIN CWS MUNICIPAL
feet ac-ft ac-ft in. ºF ºF cfs cfs cfs ac-ft cfs ac-ft cfs ac-ft
1 1640.7 20000 0 0.25 29 39 41.0 0.0 0 0 0 0 0 0
2 0 0 0 0 0 0
3 1640.7 20000 0 1.81 31 43 64.0 0.0 0 0 0 0 0 0
4 0 0 0 0 0 0
5 0 0 0 0 0 0
6 1640.7 20000 0 0.00 28 60 41.0 0.0 0 0 0 0 0 0
7 0 0 0 0 0 0
8 1640.7 20000 0 0.00 39 65 35.0 0.0 0 0 0 0 0 0
9 0 0 0 0 0 0
10 1640.7 20000 0 0.27 37 44 35.0 0.0 0 0 0 0 0 0
11 0 0 0 0 0 0
12 0 0 0 0 0 0
13 0 0 0 0 0 0
14 1640.7 20000 0 1.97 29 45 47.0 0.0 0 0 0 0 0 0
15 0 0 0 0 0 0
16 0 0 0 0 0 0
17 1640.7 20000 0 0.25 31 52 41.0 0.0 0 0 0 0 0 0
18 0 0 0 0 0 0
19 0 0 0 0 0 0
20 1640.6 20000 0 0.00 32 66 31.3 0.0 0 0 0 0 0 0
21 0 0 0 0 0 0
22 1640.6 20000 0 0.00 40 70 31.3 0.0 0 0 0 0 0 0
23 0 0 0 0 0 0
24 1640.6 20000 0 0.08 30 52 31.3 0.0 0 0 0 0 0 0
25 0 0 0 0 0 0
26 0 0 0 0 0 0
27 1640.6 20000 0 0.14 34 55 27.6 0.0 0 0 0 0 0 0
28 0 0 0 0 0 0
29 1640.6 20000 0 0.36 36 46 31.3 0.0 0 0 0 0 0 0
30 0 0 0 0 0 0
Monthly Totals 0 5.13 0 0 0
Year to Date Totals 4212 27.21 0 0 0

APPENDIX D—Barney Reservoir Operations Monthly ReportsD-6 2009 Tualatin River Flow Management Report
BARNEY RESERVOIR OPERATIONS FOR THE MONTH OF MAY 2009
[See Appendix E for breakdown of municipal use by water provider.] Source: Joint Water Commission
DAY
SURFACEELEVATION
STORAGECHANGE INSTORAGE
RAIN @BARNEY
TEMP @ BARNEY
MEASURED FLOW TO STORAGE RELEASED TO TRASK—ODFW
STORAGE RELEASED TO TUALATIN
Min Max TRASK TUALATIN CWS MUNICIPAL
feet ac-ft ac-ft in. ºF ºF cfs cfs cfs ac-ft cfs ac-ft cfs ac-ft
1 1640.6 20000 0 0.00 32 52 23.6 0.0 0 0 0 0 0 0
2 0 0 0 0 0 0
3 0 0 0 0 0 0
4 1640.6 20000 0 1.04 37 59 31.3 0.0 0 0 0 0 0 0
5 0 0 0 0 0 0
6 1640.7 20000 0 2.85 41 49 79.6 0.0 0 0 0 0 0 0
7 0 0 0 0 0 0
8 1640.7 20000 0 1.22 32 49 64.0 0.0 0 0 0 0 0 0
9 0 0 0 0 0 0
10 0 0 0 0 0 0
11 1640.6 20000 0 0.03 34 58 35.0 0.0 0 0 0 0 0 0
12 0 0 0 0 0 0
13 1640.6 20000 0 0.75 33 51 35.0 0.0 0 0 0 0 0 0
14 0 0 0 0 0 0
15 1640.7 20000 0 1.06 36 50 41.0 0.0 0 0 0 0 0 0
16 0 0 0 0 0 0
17 0 0 0 0 0 0
18 1640.6 20000 0 0.00 42 71 31.3 0.0 0 0 0 0 0 0
19 0 0 0 0 0 0
20 1640.6 20000 0 0.18 38 66 31.3 0.0 0 0 0 0 0 0
21 0 0 0 0 0 0
22 1640.7 20000 0 0.00 37 62 27.6 0.0 0 0 0 0 0 0
23 0 0 0 0 0 0
24 0 0 0 0 0 0
25 0 0 0 0 0 0
26 1640.6 20000 0 0.00 36 64 16.0 0.0 0 0 0 0 0 0
27 0 0 0 0 0 0
28 0 0 0 0 0 0
29 1640.6 20000 0 0.00 44 73 13.5 0.0 0 0 0 0 0 0
30 0 0 0 0 0 0
31 0 0 0 0 0 0
Monthly Totals 0 7.13 0 0 0
Year to Date Totals 4212 34.34 0 0 0

APPENDIX D—Barney Reservoir Operations Monthly Reports2009 Tualatin River Flow Management Report D-7
BARNEY RESERVOIR OPERATIONS FOR THE MONTH OF JUNE 2009
[See Appendix E for breakdown of municipal use by water provider.] Source: Joint Water Commission
DAY
SURFACEELEVATION
STORAGECHANGE INSTORAGE
RAIN @BARNEY
TEMP @ BARNEY
MEASURED FLOW TO STORAGE RELEASED TO TRASK—ODFW
STORAGE RELEASED TO TUALATIN
Min Max TRASK TUALATIN CWS MUNICIPAL
feet ac-ft ac-ft in. ºF ºF cfs cfs cfs ac-ft cfs ac-ft cfs ac-ft
1 1640.6 20000 0 0.00 48 76 12.2 0.0 0 0 0 0 0 0
2 0 0 0 0
3 1640.6 20000 0 0.00 54 71 12.5 0.0 0 0 0 0 0 0
4 0 0 0 0
5 1640.6 20000 0 0.12 52 73 12.5 0.0 0 0 0 0 0 0
6 0 0 0 0
7 0 0 0 0
8 1640.6 20000 0 0.04 47 58 11.3 0.0 0 0 0 0 0 0
9 0 0 0 0
10 1640.6 20000 0 0.00 46 62 9.8 0.0 0 0 0 0 0 0
11 0 0 0 0
12 1640.6 20000 0 0.00 49 62 9.8 0.0 0 0 0 0 0 0
13 0 0 0 0
14 0 0 0 0
15 1640.6 20000 0 0.03 48 64 11.0 0.0 0 0 0 0 0 0
16 0 0 0 0
17 1640.6 20000 0 0.00 59 64 8.2 0.0 0 0 0 0 0 0
18 0 0 0 0
19 1640.6 20000 0 0.10 50 62 11.0 14.8 8 16 0 0 0 0
20 8 16 0 0 15 30
21 8 16 0 0 15 30
22 1640.4 19960 -40 0.04 42 58 8.2 12.4 8 16 0 0 15 30
23 8 16 0 0 15 30
24 1640.3 19920 -40 0.00 42 68 8.2 15.0 8 16 0 0 15 30
25 8 16 0 0 15 30
26 1640.1 19840 -80 0.11 41 64 8.2 20.0 8 16 0 0 15 30
27 8 16 0 0 20 40
28 8 16 0 0 20 40
29 1639.8 19720 -120 0.00 42 71 8.2 20.0 8 16 0 0 20 40
30 8 16 0 0 20 40
Monthly Totals -280 0.44 190 0 367
Year to Date Totals 190 0 367

APPENDIX D—Barney Reservoir Operations Monthly ReportsD-8 2009 Tualatin River Flow Management Report
BARNEY RESERVOIR OPERATIONS FOR THE MONTH OF JULY 2009
[See Appendix E for breakdown of municipal use by water provider.] Source: Joint Water Commission
DAY
SURFACEELEVATION
STORAGECHANGE INSTORAGE
RAIN @BARNEY
TEMP @ BARNEY
MEASURED FLOW TO STORAGE RELEASED TO TRASK—ODFW
STORAGE RELEASED TO TUALATIN
Min Max TRASK TUALATIN CWS MUNICIPAL
feet ac-ft ac-ft in. ºF ºF cfs cfs cfs ac-ft cfs ac-ft cfs ac-ft
1 1639.4 19560 -160 0.00 40 68 8.0 20.0 8 16 0 0 20 40
2 1639.4 19560 0 0.00 53 75 8.0 20.0 8 16 0 0 20 40
3 8 16 0 0 20 40
4 8 16 0 0 20 40
5 8 16 0 0 20 40
6 1638.9 19360 -200 0.01 48 80 8.4 20.0 8 16 0 0 20 40
7 8 16 0 0 20 40
8 1638.7 19280 -80 0.00 47 58 8.0 20.0 8 16 0 0 20 40
9 8 16 0 0 20 40
10 1638.4 19160 -120 0.02 57 61 8.4 20.0 8 16 0 0 20 40
11 8 16 0 0 20 40
12 8 16 0 0 20 40
13 8 16 0 0 20 40
14 1637.9 18950 -210 0.29 42 72 8.4 20.0 8 16 0 0 20 40
15 1637.9 18925 -25 0.00 48 68 8.4 20.0 8 16 0 0 20 40
16 8 16 0 0 20 40
17 1637.5 18750 -175 0.00 48 78 8.2 30.0 8 16 0 0 20 40
18 8 16 0 0 30 60
19 8 16 0 0 30 60
20 1637.0 18500 -250 0.00 47 78 8.4 30.0 8 16 0 0 30 60
21 8 16 0 0 30 60
22 1636.7 18350 -150 0.00 50 77 8.4 30.0 8 16 0 0 30 60
23 8 16 0 0 30 60
24 1636.3 18150 -200 0.00 47 68 8.4 30.0 8 16 0 0 30 60
25 8 16 0 0 30 60
26 8 16 0 0 30 60
27 1635.7 17888 -262 0.00 54 79 8.4 30.0 8 16 0 0 30 60
28 8 16 0 0 30 60
29 1635.3 17738 -150 0.00 66 90 8.4 30.0 8 16 0 0 30 60
30 8 16 0 0 30 60
31 1634.9 17588 -150 0.00 54 88 8.4 30.0 8 16 0 0 30 60
Monthly Totals -2132 0.32 492 0 1507
Year to Date Totals 1800 35.10 682 0 1874

APPENDIX D—Barney Reservoir Operations Monthly Reports2009 Tualatin River Flow Management Report D-9
BARNEY RESERVOIR OPERATIONS FOR THE MONTH OF AUGUST 2009
[See Appendix E for breakdown of municipal use by water provider.] Source: Joint Water Commission
DAY
SURFACEELEVATION
STORAGECHANGE INSTORAGE
RAIN @BARNEY
TEMP @ BARNEY
MEASURED FLOW TO STORAGE RELEASED TO TRASK—ODFW
STORAGE RELEASED TO TUALATIN
Min Max TRASK TUALATIN CWS MUNICIPAL
feet ac-ft ac-ft in. ºF ºF cfs cfs cfs ac-ft cfs ac-ft cfs ac-ft
1 8 16 0 0 30 60
2 8 16 0 0 30 60
3 1634.3 17363 -225 0.00 59 82 8.4 30.0 8 16 0 0 30 60
4 8 16 0 0 30 60
5 1633.9 17213 -150 0.00 49 75 8.4 30 to 24 8 16 0 0 30 60
6 8 16 0 0 24 48
7 1633.6 17100 -113 0.04 51 66 8.4 24.0 8 16 0 0 24 48
8 8 16 0 0 24 48
9 8 16 0 0 24 48
10 8 16 0 0 24 48
11 8 16 0 0 24 48
12 1632.8 16800 -300 0.87 46 68 8.4 24.0 8 16 0 0 24 48
13 8 16 0 0 24 48
14 1632.5 16688 -112 0.02 48 62 8.4 24.0 8 16 0 0 24 48
15 8 16 0 0 24 48
16 8 16 0 0 24 48
17 8 16 0 0 24 48
18 1631.8 16425 -263 0.00 44 76 8.4 24.0 8 16 0 0 24 48
19 8 16 0 0 24 48
20 1631.5 16313 -112 0.00 53 81 8.4 24.0 8 16 0 0 24 48
21 1631.3 16238 -75 0.00 52 69 8.4 24.0 8 16 0 0 24 48
22 8 16 0 0 24 48
23 8 16 0 0 24 48
24 1630.8 16050 -188 0.00 44 77 8.4 24.0 8 16 0 0 24 48
25 8 16 0 0 24 48
26 1630.5 15938 -112 0.02 45 67 8.4 24.0 8 16 0 0 24 48
27 8 16 0 0 24 48
28 1630.1 15788 -150 0.00 53 74 8.4 24.0 8 16 0 0 24 48
29 8 16 0 0 24 48
30 8 16 0 0 24 48
31 1629.5 15563 -225 0.15 51 70 8.4 24.0 8 16 0 0 24 48
Monthly Totals -2025 1.10 492 0 1535
Year to Date Totals -225 36.20 1174 0 3410

APPENDIX D—Barney Reservoir Operations Monthly ReportsD-10 2009 Tualatin River Flow Management Report
BARNEY RESERVOIR OPERATIONS FOR THE MONTH OF SEPTEMBER 2009
[See Appendix E for breakdown of municipal use by water provider.] Source: Joint Water Commission
DAY
SURFACEELEVATION
STORAGECHANGE INSTORAGE
RAIN @BARNEY
TEMP @ BARNEY
MEASURED FLOW TO STORAGE RELEASED TO TRASK—ODFW
STORAGE RELEASED TO TUALATIN
Min Max TRASK TUALATIN CWS MUNICIPAL
feet ac-ft ac-ft in. ºF ºF cfs cfs cfs ac-ft cfs ac-ft cfs ac-ft
1 1629.1 15413 -150 0.00 50 69 8.4 34.0 8 16 14 28 24 48
2 8 16 14 28 20 40
3 8 16 14 28 20 40
4 1628.6 15225 -188 0.00 51 68 9.6 34.0 8 16 14 28 20 40
5 8 16 14 28 20 40
6 8 16 14 28 20 40
7 8 16 14 28 20 40
8 1627.8 14925 -300 1.50 41 60 9.5 34.0 8 16 14 28 20 40
9 8 16 14 28 20 40
10 1627.3 14738 -187 0.00 50 69 9.5 34.0 8 16 14 28 20 40
11 8 16 14 28 20 40
12 8 16 14 28 20 40
13 8 16 14 28 20 40
14 1626.3 14363 -375 0.02 50 75 9.5 34.0 8 16 14 28 20 40
15 8 16 14 28 20 40
16 1625.9 14213 -150 0.03 50 66 9.5 34.0 8 16 14 28 20 40
17 8 16 14 28 20 40
18 1625.3 13988 -225 0.06 46 60 9.5 34.0 8 16 14 28 20 40
19 8 16 14 28 20 40
20 8 16 14 28 20 40
21 1624.6 13725 -263 0.06 42 65 9.5 34.0 8 16 14 28 20 40
22 8 16 14 28 20 40
23 1624.1 13538 -187 0.00 54 76 9.5 20.0 8 16 14 28 20 40
24 8 16 14 28 6 12
25 1623.7 13388 -150 0.00 42 74 9.5 20.0 8 16 14 28 6 12
26 8 16 14 28 6 12
27 8 16 14 28 6 12
28 1623.3 13238 -150 0.00 42 64 9.5 20.0 8 16 14 28 6 12
29 8 16 14 28 6 12
30 1623.0 13125 -113 0.64 41 53 9.5 20.0 8 16 14 28 6 12
Monthly Totals -2438 2.31 476 833 1004
Year to Date Totals -2663 38.51 1650 833 4413

APPENDIX D—Barney Reservoir Operations Monthly Reports2009 Tualatin River Flow Management Report D-11
BARNEY RESERVOIR OPERATIONS FOR THE MONTH OF OCTOBER 2009
[See Appendix E for breakdown of municipal use by water provider.] Source: Joint Water Commission
DAY
SURFACEELEVATION
STORAGECHANGE INSTORAGE
RAIN @BARNEY
TEMP @ BARNEY
MEASURED FLOW TO STORAGE RELEASED TO TRASK—ODFW
STORAGE RELEASED TO TUALATIN
Min Max TRASK TUALATIN CWS MUNICIPAL
feet ac-ft ac-ft in. ºF ºF cfs cfs cfs ac-ft cfs ac-ft cfs ac-ft
1 8 16 14 28 6 12
2 1622.7 13013 -112 0.06 44 53 9.5 20.0 8 16 14 28 6 12
3 8 16 14 28 6 12
4 8 16 14 28 6 12
5 1622.3 12863 -150 0.06 36 54 9.5 20.0 8 16 14 28 6 12
6 8 16 14 28 6 12
7 1621.9 12713 -150 0.01 40 58 9.5 20.0 8 16 14 28 6 12
8 8 16 14 28 6 12
9 1621.5 12563 -150 0.00 40 56 9.5 20.0 8 16 14 28 6 12
10 8 16 14 28 6 12
11 8 16 14 28 6 12
12 8 16 14 28 6 12
13 8 16 14 28 6 12
14 1620.9 12338 -225 1.61 32 54 9.5 20.0 8 16 14 28 6 12
15 8 16 14 28 6 12
16 1620.7 12263 -75 1.00 47 66 9.5 20.0 8 16 14 28 6 12
17 8 16 14 28 6 12
18 8 16 14 28 6 12
19 1620.4 12150 -113 0.86 46 58 9.5 20.0 8 16 14 28 6 12
20 8 16 14 28 6 12
21 8 16 14 28 6 12
22 1620.0 12000 -150 0.46 42 51 9.5 20.0 8 16 14 28 6 12
23 1619.9 11966 -34 0.44 47 51 14.0 20.0 8 16 14 28 6 12
24 8 16 14 28 6 12
25 8 16 14 28 6 12
26 1619.6 11866 -100 1.35 34 52 9.5 14.0 8 16 14 28 6 12
27 8 16 14 28 0 0
28 1619.7 11900 34 0.95 34 44 5.2 14.2 8 16 14 28 0 0
29 8 16 14 28 0 0
30 1619.7 11900 0 0.95 38 52 8.5 14.2 8 16 14 28 0 0
31 8 16 14 28 0 0
Monthly Totals -1225 7.75 476 833 309
Year to Date Totals -3888 46.26 2126 1666 4723

APPENDIX D—Barney Reservoir Operations Monthly ReportsD-12 2009 Tualatin River Flow Management Report
BARNEY RESERVOIR OPERATIONS FOR THE MONTH OF NOVEMBER 2009
[See Appendix E for breakdown of municipal use by water provider.] Source: Joint Water Commission
DAY
SURFACEELEVATION
STORAGECHANGE INSTORAGE
RAIN @BARNEY
TEMP @ BARNEY
MEASURED FLOW TO STORAGE RELEASED TO TRASK—ODFW
STORAGE RELEASED TO TUALATIN
Min Max TRASK TUALATIN CWS MUNICIPAL
feet ac-ft ac-ft in. ºF ºF cfs cfs cfs ac-ft cfs ac-ft cfs ac-ft
1 8 16 0 0 0 0
2 1619.6 11866 -34 0.77 34 51 8.2 0.8 8 16 0 0 0 0
3 8 16 0 0 0 0
4 1619.5 11833 -33 0.01 34 53 8.2 0.8 8 16 0 0 0 0
5 8 16 0 0 0 0
6 1619.7 11883 50 1.50 38 50 9.0 0.0 8 16 0 0 0 0
7 8 16 0 0 0 0
8 8 16 0 0 0 0
9 8 16 0 0 0 0
10 1620.9 12388 505 4.25 35 44 8.2 0.0 8 16 0 0 0 0
11 8 16 0 0 0 0
12 1621.3 12459 71 0.85 31 44 8.2 0.0 8 16 0 0 0 0
13 8 16 0 0 0 0
14 8 16 0 0 0 0
15 6 12 0 0 0 0
16 1621.8 12675 216 1.51 44 48 8.2 0.0 6 12 0 0 0 0
17 6 12 0 0 0 0
18 6 12 0 0 0 0
19 1623.6 13313 638 4.75 44 48 11.0 0.0 6 12 0 0 0 0
20 6 12 0 0 0 0
21 6 12 0 0 0 0
22 6 12 0 0 0 0
23 1626.3 14363 1050 4.25 43 48 8.2 0.0 6 12 0 0 0 0
24 6 12 0 0 0 0
25 1626.9 14588 225 0.03 37 48 8.4 0.0 6 12 0 0 0 0
26 6 12 0 0 0 0
27 1627.5 14813 225 0.97 33 54 8.4 0.0 6 12 0 0 0 0
28 6 12 0 0 0 0
29 6 12 0 0 0 0
30 1628.0 14963 150 0.03 NA 44 8.4 0.0 6 12 0 0 0 0
Monthly Totals 3063 18.92 413 0 0
Year to Date Totals -825 65.18 2539 1666 4723

APPENDIX D—Barney Reservoir Operations Monthly Reports2009 Tualatin River Flow Management Report D-13
BARNEY RESERVOIR OPERATIONS FOR THE MONTH OF DECEMBER 2009
[See Appendix E for breakdown of municipal use by water provider.] Source: Joint Water Commission
DAY
SURFACEELEVATION
STORAGECHANGE INSTORAGE
RAIN @BARNEY
TEMP @ BARNEY
MEASURED FLOW TO STORAGE RELEASED TO TRASK—ODFW
STORAGE RELEASED TO TUALATIN
Min Max TRASK TUALATIN CWS MUNICIPAL
feet ac-ft ac-ft in. ºF ºF cfs cfs cfs ac-ft cfs ac-ft cfs ac-ft
1 6 12 0 0 0 0
2 1628.0 15000 37 0.03 32 44 8.4 0.0 6 12 0 0 0 0
3 6 12 0 0 0 0
4 1628.3 15113 113 0.00 28 38 8.4 0.0 6 12 0 0 0 0
5 6 12 0 0 0 0
6 6 12 0 0 0 0
7 1628.4 15150 37 0.00 16 38 8.4 0.0 6 12 0 0 0 0
8 6 12 0 0 0 0
9 1628.5 15188 38 0.00 11 25 8.4 0.0 6 12 0 0 0 0
10 6 12 0 0 0 0
11 1628.6 15225 37 0.00 16 27 8.4 0.0 6 12 0 0 0 0
12 6 12 0 0 0 0
13 6 12 0 0 0 0
14 1628.7 15263 38 0.68 20 36 8.4 0.0 6 12 0 0 0 0
15 6 12 0 0 0 0
16 1629.7 15638 375 3.48 32 44 9.5 0.0 6 12 0 0 0 0
17 6 12 0 0 0 0
18 1630.5 15938 300 0.48 38 44 8.4 0.0 6 12 0 0 0 0
19 6 12 0 0 0 0
20 6 12 0 0 0 0
21 1631.5 16313 375 0.70 27 36 9.5 0.0 6 12 0 0 0 0
22 6 12 0 0 0 0
23 1631.5 16313 0 0.00 27 36 9.5 0.0 6 12 0 0 0 0
24 6 12 0 0 0 0
25 6 12 0 0 0 0
26 6 12 0 0 0 0
27 6 12 0 0 0 0
28 1632.1 16538 225 0.03 28 32 8.4 0.0 6 12 0 0 0 0
29 6 12 0 0 0 0
30 1632.4 16650 112 0.66 25 34 8.4 0.0 6 12 0 0 0 0
31 6 12 0 0 0 0
Monthly Totals 1687 6.06 369 0 0
Year to Date Totals 862 71.24 2908 1666 4723

APPENDIX D—Barney Reservoir Operations Monthly ReportsD-14 2009 Tualatin River Flow Management Report
(this page intentionally blank)

Appendix E
Municipal Water Use Allocations
Monthly Records

APPENDIX E—Municipal Allocations Monthly ReportsE-2 2009 Tualatin River Flow Management Report
MONTHLY SUMMARIES OF MUNICIPAL ALLOCATIONSMONTH PAGE
January no stored water released for municipal water use
February no stored water released for municipal water use
March no stored water released for municipal water use
April no stored water released for municipal water use
May no stored water released for municipal water use
June E–3
July E–4
August E–5
September E–6
October E–7
November no stored water released for municipal water use
December no stored water released for municipal water use

APPENDIX E—Municipal Allocations Monthly Reports2009 Tualatin River Flow Management Report E-3
MUNICIPAL ALLOCATIONS FOR THE MONTH OF JUNE 2009
Source: Joint Water Commission
DAY
TOTAL MUNICIPAL
USE
MUNICIPAL USE BY RESERVOIR
BREAKDOWN OF MUNCIPAL USE BY WATER PROVIDER
HILLSBORO FOREST GROVE BEAVERTON TVWD
Barney Scoggins Barney Scoggins Barney Scoggins Barney Scoggins Barney
(cfs) (cfs) (cfs) (cfs) (cfs) (cfs) (cfs) (cfs) (cfs) (cfs)
1 0 0 0 0.0 0.0 0.0 0.0 0.0 0.0 0.0
2 0 0 0 0.0 0.0 0.0 0.0 0.0 0.0 0.0
3 0 0 0 0.0 0.0 0.0 0.0 0.0 0.0 0.0
4 0 0 0 0.0 0.0 0.0 0.0 0.0 0.0 0.0
5 0 0 0 0.0 0.0 0.0 0.0 0.0 0.0 0.0
6 0 0 0 0.0 0.0 0.0 0.0 0.0 0.0 0.0
7 0 0 0 0.0 0.0 0.0 0.0 0.0 0.0 0.0
8 0 0 0 0.0 0.0 0.0 0.0 0.0 0.0 0.0
9 0 0 0 0.0 0.0 0.0 0.0 0.0 0.0 0.0
10 0 0 0 0.0 0.0 0.0 0.0 0.0 0.0 0.0
11 0 0 0 0.0 0.0 0.0 0.0 0.0 0.0 0.0
12 0 0 0 0.0 0.0 0.0 0.0 0.0 0.0 0.0
13 0 0 0 0.0 0.0 0.0 0.0 0.0 0.0 0.0
14 35 0 35 0.0 20.4 0.0 4.6 0.0 10.0 0.0
15 50 0 50 0.0 26.3 0.0 7.7 0.0 16.1 0.0
16 15 0 15 0.0 7.4 0.0 2.6 0.0 5.0 0.0
17 35 0 35 0.0 13.0 0.0 7.9 0.0 14.1 0.0
18 65 0 65 0.0 23.8 0.0 15.2 0.0 26.0 0.0
19 44 0 44 0.0 16.0 0.0 11.3 0.0 16.7 0.0
20 55 15 40 3.0 16.5 0.5 2.7 3.8 20.8 7.6
21 55 15 40 4.6 13.6 0.8 2.3 8.2 24.1 1.4
22 55 15 40 3.9 17.7 0.8 3.5 4.1 18.7 6.3
23 35 15 20 4.8 9.0 1.1 2.1 4.7 8.9 4.4
24 44 15 29 3.7 13.1 1.2 4.2 3.4 11.8 6.7
25 40 15 25 3.7 11.5 1.2 3.9 3.1 9.6 6.9
26 50 15 35 2.5 14.9 0.8 5.1 2.5 15.0 9.2
27 60 20 40 3.9 18.3 1.2 5.5 3.5 16.2 11.4
28 60 20 40 3.8 17.6 1.3 6.3 3.5 16.1 11.4
29 60 20 40 3.5 17.4 1.4 7.0 3.1 15.5 11.9
30 60 20 40 3.0 16.8 1.2 6.8 2.9 16.3 12.9
Monthly Totals
cfs 818 185 633 40.5 273.2 11.6 98.6 42.8 261.2 90.1
ac-ft 1623 367 1256 80.3 542.0 23.0 195.6 84.9 518.0 178.7
Year-to-Date Totals
cfs 818 185 633 40.5 273.2 11.6 98.6 42.8 261.2 90.1
ac-ft 1623 367 1256 80.3 542.0 23.0 195.6 84.9 518.0 178.7

APPENDIX E—Municipal Allocations Monthly ReportsE-4 2009 Tualatin River Flow Management Report
MUNICIPAL ALLOCATIONS FOR THE MONTH OF JULY 2009
Source: Joint Water Commission
DAY
TOTAL MUNICIPAL
USE
MUNICIPAL USE BY RESERVOIR
BREAKDOWN OF MUNCIPAL USE BY WATER PROVIDER
HILLSBORO FOREST GROVE BEAVERTON TVWD
Barney Scoggins Barney Scoggins Barney Scoggins Barney Scoggins Barney
(cfs) (cfs) (cfs) (cfs) (cfs) (cfs) (cfs) (cfs) (cfs) (cfs)
1 48 20 28 5.0 13.0 1.9 4.9 3.9 10.1 9.2
2 68 20 48 3.4 22.8 1.3 8.5 2.5 16.7 12.7
3 75 20 55 1.9 24.7 0.8 11.0 1.5 19.3 15.8
4 67 20 47 2.3 21.2 1.0 9.0 1.8 16.8 15.0
5 65 20 45 2.7 20.4 1.1 8.4 2.1 16.2 14.1
6 65 20 45 3.2 20.0 1.3 8.1 2.7 16.9 12.8
7 55 20 35 4.7 16.3 1.8 6.3 3.6 12.5 9.8
8 50 20 30 5.8 13.5 2.1 4.9 5.0 11.6 7.1
9 50 20 30 5.9 13.7 1.9 4.4 5.1 11.9 7.1
10 44 20 24 6.6 11.8 1.9 3.4 4.9 8.8 6.6
11 55 20 35 4.9 16.3 1.8 5.9 3.8 12.8 9.5
12 55 20 35 3.6 14.0 1.5 5.9 3.9 15.1 10.9
13 55 20 35 4.7 14.6 1.5 4.7 5.1 15.7 8.7
14 38 20 18 7.8 8.5 1.5 1.7 7.2 7.8 3.4
15 35 20 15 7.9 7.4 2.3 2.1 5.9 5.5 3.9
16 65 20 45 4.2 22.1 1.4 7.6 2.9 15.3 11.4
17 65 20 45 3.7 21.7 1.4 8.5 2.5 14.8 12.4
18 65 30 35 6.6 14.3 3.4 7.4 6.2 13.3 13.8
19 60 30 30 8.3 14.2 3.0 5.2 6.2 10.7 12.4
20 60 30 30 9.0 14.7 3.3 5.4 6.0 9.9 11.7
21 80 30 50 6.2 22.9 2.7 10.1 4.6 17.0 16.6
22 75 30 45 6.1 20.3 2.9 9.6 4.6 15.1 16.4
23 79 30 49 5.3 21.5 2.5 9.9 4.3 17.6 17.9
24 75 30 45 6.9 20.9 2.8 8.5 5.1 15.6 15.2
25 79 30 49 6.0 21.3 2.6 9.4 5.1 18.3 16.3
26 80 30 50 6.5 23.0 2.6 9.2 5.1 17.9 15.8
27 80 30 50 5.6 20.6 2.9 10.6 5.1 18.8 16.4
28 80 30 50 5.9 22.0 2.7 10.1 4.8 17.9 16.5
29 90 30 60 4.1 25.0 2.1 13.1 3.6 21.9 20.2
30 92 30 62 4.0 27.0 1.9 12.8 3.3 22.1 20.8
31 90 30 60 3.8 23.8 2.3 14.3 3.5 21.8 20.5
Monthly Totals
cfs 2040 760 1280 162.5 573.4 64.3 240.8 132.0 465.7 401.1
ac-ft 4046 1507 2539 322.4 1137.4 127.6 477.7 261.8 923.8 795.6
Year-to-Date Totals
cfs 2858 945 1913 203.0 846.7 75.9 339.4 174.8 726.9 491.2
ac-ft 5669 1874 3794 402.7 1679.4 150.6 673.2 346.8 1441.8 974.3

APPENDIX E—Municipal Allocations Monthly Reports2009 Tualatin River Flow Management Report E-5
MUNICIPAL ALLOCATIONS FOR THE MONTH OF AUGUST 2009
Source: Joint Water Commission
DAY
TOTAL MUNICIPAL
USE
MUNICIPAL USE BY RESERVOIR
BREAKDOWN OF MUNCIPAL USE BY WATER PROVIDER
HILLSBORO FOREST GROVE BEAVERTON TVWD
Barney Scoggins Barney Scoggins Barney Scoggins Barney Scoggins Barney
(cfs) (cfs) (cfs) (cfs) (cfs) (cfs) (cfs) (cfs) (cfs) (cfs)
1 82 30 52 4.7 22.6 2.6 12.3 3.6 17.1 19.1
2 82 30 52 5.0 22.7 2.5 11.4 3.9 17.9 18.6
3 82 30 52 5.5 24.0 2.5 10.8 4.0 17.2 18.0
4 75 30 45 5.2 18.3 3.0 10.5 4.5 16.1 17.4
5 66 30 36 6.6 14.8 3.7 8.3 5.8 13.0 14.0
6 59 24 35 3.8 12.6 2.4 8.0 4.4 14.4 13.3
7 63 24 39 4.8 16.1 2.4 7.8 4.5 15.1 12.3
8 59 24 35 4.4 13.2 2.5 7.4 4.8 14.5 12.3
9 59 24 35 4.5 13.6 2.5 7.4 4.7 14.0 12.3
10 59 24 35 4.8 14.1 2.6 7.5 4.6 13.4 12.0
11 59 24 35 4.3 13.2 2.6 8.0 4.5 13.8 12.6
12 68 24 44 3.4 14.4 2.0 8.6 5.0 21.1 13.6
13 54 24 30 5.5 9.9 2.8 5.2 8.2 14.9 7.5
14 47 24 23 5.5 7.3 3.0 3.9 8.9 11.8 6.6
15 48 24 24 7.1 9.5 2.7 3.6 8.1 10.9 6.1
16 49 24 25 5.9 8.7 2.8 4.1 8.4 12.3 6.9
17 49 24 25 6.1 9.9 3.1 5.0 6.3 10.2 8.6
18 49 24 25 5.6 10.0 3.2 5.7 5.2 9.3 10.0
19 69 24 45 3.7 18.5 2.1 10.3 3.2 16.2 15.0
20 80 24 56 3.1 24.8 1.5 11.9 2.4 19.3 17.0
21 62 24 38 4.7 16.7 2.2 7.8 3.8 13.5 13.3
22 64 24 40 5.0 18.0 2.1 7.6 4.0 14.4 12.9
23 64 24 40 5.5 19.0 2.1 7.2 4.0 13.8 12.4
24 64 24 40 6.0 18.5 2.3 7.0 4.7 14.5 11.1
25 59 24 35 6.7 15.9 2.6 6.3 5.4 12.8 9.3
26 54 24 30 6.6 13.0 3.1 6.2 5.4 10.8 8.9
27 54 24 30 5.8 11.9 3.2 6.5 5.6 11.5 9.5
28 51 24 27 5.8 10.5 3.0 5.5 6.0 11.0 9.2
29 52 24 28 6.1 11.1 2.9 5.2 6.5 11.7 8.4
30 54 24 30 7.0 12.4 2.9 5.1 7.0 12.5 7.1
31 54 24 30 7.0 12.5 3.2 5.7 6.6 11.8 7.3
Monthly Totals
cfs 1890 774 1116 165.7 457.9 81.7 227.7 163.9 430.4 362.6
ac-ft 3749 1535 2214 328.7 908.2 162.1 451.6 325.1 853.8 719.3
Year-to-Date Totals
cfs 4748 1719 3029 368.8 1304.5 157.7 567.1 338.7 1157.4 853.8
ac-ft 9418 3410 6008 731.4 2587.5 312.7 1124.8 671.9 2295.6 1693.6

APPENDIX E—Municipal Allocations Monthly ReportsE-6 2009 Tualatin River Flow Management Report
MUNICIPAL ALLOCATIONS FOR THE MONTH OF SEPTEMBER 2009
Source: Joint Water Commission
DAY
TOTAL MUNICIPAL
USE
MUNICIPAL USE BY RESERVOIR
BREAKDOWN OF MUNCIPAL USE BY WATER PROVIDER
HILLSBORO FOREST GROVE BEAVERTON TVWD
Barney Scoggins Barney Scoggins Barney Scoggins Barney Scoggins Barney
(cfs) (cfs) (cfs) (cfs) (cfs) (cfs) (cfs) (cfs) (cfs) (cfs)
1 49 24 25 5.1 8.5 3.6 5.9 6.4 10.6 8.9
2 45 20 25 3.9 9.6 2.4 5.8 3.9 9.6 9.7
3 50 20 30 2.4 9.4 2.0 7.6 3.4 13.0 12.2
4 55 20 35 2.9 13.6 1.6 7.4 3.0 14.1 12.5
5 55 20 35 2.8 12.6 1.6 7.5 3.3 14.9 12.3
6 55 20 35 3.7 14.0 1.7 6.5 3.8 14.5 10.8
7 55 20 35 3.8 14.1 1.7 6.5 3.8 14.4 10.7
8 55 20 35 2.7 12.3 1.7 7.8 3.3 14.8 12.3
9 47 20 27 3.6 8.9 2.3 5.7 5.0 12.3 9.1
10 47 20 27 5.3 11.2 2.3 4.8 5.2 11.0 7.1
11 40 20 20 5.6 8.1 2.7 3.9 5.4 7.9 6.3
12 40 20 20 6.2 9.2 2.4 3.6 4.9 7.3 6.5
13 40 20 20 5.6 8.6 2.5 3.8 5.0 7.6 7.0
14 40 20 20 3.9 6.6 2.6 4.4 5.3 9.0 8.1
15 60 20 40 2.9 16.3 1.5 8.4 2.7 15.3 13.0
16 60 20 40 2.3 15.2 1.4 8.9 2.4 15.9 13.9
17 60 20 40 2.2 14.1 1.4 8.8 2.7 17.2 13.8
18 52 20 32 4.1 13.0 2.0 6.2 4.0 12.8 9.9
19 45 20 25 4.7 9.5 2.3 4.7 5.3 10.7 7.7
20 45 20 25 5.0 9.3 2.4 4.5 6.0 11.2 6.5
21 45 20 25 5.9 10.5 2.5 4.5 5.6 10.0 5.9
22 45 20 25 4.5 9.8 2.4 5.3 4.5 9.8 8.6
23 52 20 32 3.5 12.5 2.0 7.1 3.5 12.4 11.0
24 38 6 32 0.0 12.5 0.0 8.1 0.0 11.5 6.0
25 48 6 42 0.0 17.3 0.0 9.6 0.0 15.1 6.0
26 48 6 42 0.0 15.2 0.0 9.3 0.0 17.5 6.0
27 48 6 42 0.0 17.0 0.0 8.7 0.0 16.3 6.0
28 48 6 42 0.0 15.7 0.0 9.4 0.0 17.0 6.0
29 36 6 30 0.7 12.4 0.3 5.1 0.8 12.6 4.2
30 46 6 40 0.5 11.0 0.3 7.0 1.0 22.0 4.2
Monthly Totals
cfs 1449 506 943 93.8 358.0 49.6 197.0 100.1 388.0 262.4
ac-ft 2874 1004 1870 186.1 710.1 98.4 390.7 198.6 769.6 520.5
Year-to-Date Totals
cfs 6197 2225 3972 462.6 1662.6 207.3 764.1 438.9 1545.4 1116.3
ac-ft 12292 4413 7878 917.5 3297.7 411.2 1515.5 870.5 3065.3 2214.1

APPENDIX E—Municipal Allocations Monthly Reports2009 Tualatin River Flow Management Report E-7
MUNICIPAL ALLOCATIONS FOR THE MONTH OF OCTOBER 2009
Source: Joint Water Commission
DAY
TOTAL MUNICIPAL
USE
MUNICIPAL USE BY RESERVOIR
BREAKDOWN OF MUNCIPAL USE BY WATER PROVIDER
HILLSBORO FOREST GROVE BEAVERTON TVWD
Barney Scoggins Barney Scoggins Barney Scoggins Barney Scoggins Barney
(cfs) (cfs) (cfs) (cfs) (cfs) (cfs) (cfs) (cfs) (cfs) (cfs)
1 46 6 40 0.4 11.1 0.3 7.5 0.7 21.4 4.7
2 21 6 15 1.2 6.0 0.5 2.4 1.3 6.6 3.0
3 44 6 38 0.0 14.4 0.0 7.9 0.0 15.7 6.0
4 44 6 38 0.0 13.7 0.0 8.5 0.0 15.8 6.0
5 44 6 38 0.0 15.1 0.0 8.3 0.0 14.6 6.0
6 44 6 38 0.0 13.6 0.0 9.3 0.0 15.1 6.0
7 29 6 23 0.0 8.5 0.0 5.2 0.0 9.3 6.0
8 29 6 23 0.0 7.6 0.0 5.1 0.0 10.3 6.0
9 38.0 6 32 0.0 10.0 0.0 7.8 0.0 14.2 6.0
10 38.0 6 32 0.0 9.9 0.0 7.7 0.0 14.4 6.0
11 38 6 32 0.0 9.5 0.0 8.1 0.0 14.4 6.0
12 38 6 32 0.0 8.8 0.0 8.0 0.0 15.2 6.0
13 38 6 32 0.0 9.9 0.0 7.4 0.0 14.7 6.0
14 38 6 32 0.0 8.5 0.0 7.9 0.0 15.6 6.0
15 38 6 32 0.0 8.2 0.0 7.0 0.0 16.8 6.0
16 28 6 22 0.0 1.6 0.2 6.3 0.4 14.1 5.3
17 28 6 22 0.6 6.4 0.3 5.0 1.0 10.6 4.2
18 28 6 22 0.7 7.4 0.0 4.1 0.9 10.5 4.4
19 28 6 22 0.7 6.2 0.0 4.4 1.3 11.4 3.9
20 21 6 15 1.7 5.1 0.0 3.4 2.1 6.4 2.3
21 16 6 10 1.8 3.1 0.0 2.8 2.4 4.1 1.7
22 16 6 10 1.4 2.5 0.0 2.9 2.7 4.6 1.9
23 23 6 17 1.4 5.4 0.0 3.8 1.9 7.7 2.7
24 23 6 17 0.2 1.5 0.0 5.0 1.6 10.5 4.2
25 23 6 17 0.4 2.5 0.0 4.3 1.5 10.2 4.1
26 23 6 17 0.2 2.0 0.0 4.6 0.9 10.4 5.0
27 0 0 0 0.0 0.0 0.0 0.0 0.0 0.0 0.0
28 0 0 0 0.0 0.0 0.0 0.0 0.0 0.0 0.0
29 0 0 0 0.0 0.0 0.0 0.0 0.0 0.0 0.0
30 0 0 0 0.0 0.0 0.0 0.0 0.0 0.0 0.0
31 0 0 0 0.0 0.0 0.0 0.0 0.0 0.0 0.0
Monthly Totals
cfs 824.0 156 668 10.6 198.6 1.2 154.6 18.7 314.9 125.5
ac-ft 1634.4 309 1325 21.1 393.9 2.3 306.6 37.1 624.5 248.9
Year-to-Date Totals
cfs 7021.0 2381 4640 473.2 1861.1 208.5 918.6 457.6 1860.2 1241.7
ac-ft 13926.2 4722 9203 938.6 3691.6 413.5 1822.1 907.7 3689.8 2463.0

APPENDIX E—Municipal Allocations Monthly ReportsE-8 2009 Tualatin River Flow Management Report
(this page intentionally blank)

Appendix F
Stream Temperature Records

STREAM TEMPERATURE SITES — LOCATIONS
Bea
v
Fanno
Creek
Cr
Cr
Cr
S. Rock
McF
ee C
r
Christensen
Creek
Creek
Cr
Ro
McKay
East
West
Gales
Creek
SCLO
SCOO
DLLO
Scog
Barney Reservoir
Scoggins Reservoir
DAIRY
ROODRCTV
FRMO
Lake Oswego
WI L L A M E T T E R
I VE
R
TU
AL
R
GALES
Dairy
Creek
Burris Cr
He Cr
Baker Cr
Chicken
Cedar Cr
Canal
(Hagg Lake)
Ash
Hedges
Sain Cr
Ta
gins
Car
pe
Dawson Cr
Brons
nner Cr
nter
Cr
Fork
Fork
onat
Lake Oswego
AT
IN
VE
RI
CedarMill Cr
S. on Cr
Springbrook Cr
Saum Cr
Buttern ut Cr
DCBR
on Cr
BCSR
CMMB
TRTFANO
MCSC
WC143
BCCH
WSLO
LOCS
HCTPTRCP
SCRL
Sylvan Cr
Cr
Cr Su
mm
er C
k
Johns
Ericks
on
CkECMR
BVTS
Wil
wCr
lo
CCERELSN
MCFEBCHH
RCQR
ck
eekRCRR
Creek
erto
n
CCSR
MCKH
MCKN
TRGC
EFDREFDD
WFDE
WFDM
GCCH
4550
GASO
Sampling and Flow Sites
Withdrawal Points
Wastewater Treatment Plants
North
SCHEMATIC MAP
Not to Scale
SCBR
TRLF
SCHO
RCBR
WCHP
B170
NEAL
ODAM
TRJB MCKP
BCBR
DCSR
GCSR
CCKR

APPENDIX F—Stream Temperature Records2009 Tualatin River Flow Management Report F-3
STREAM TEMPERATURE SITES — ALPHABETICAL LISTING BY SITE CODESITE CODE SITE NAME RIVER MILE STATION ID PAGE
4550 Gales Creek above Glenwood, Oregon 19.9 14204550 F-10ASMP Ash Creek at Metzger Park at Metzger, Oregon 1.25 14206933 F-49B170 Beaverton Creek at 170th Ave, Beaverton, Oregon 4.9 — F-32BCBR Bronson Creek at Bronson Road near Orenco, Oregon 2.1 14206423 F-36BCCH Beaverton Creek at Cedar Hills Blvd at Beaverton, Oregon 7.45 14206360 F-29BCHH Burris Creek at Hwy 219 0.38 — F-41BCSR Bronson Creek at Saltzman Road near Orenco, Oregon 5.1 14206419 F-35BVTS Beaverton Creek at NE Guston Court near Orenco, Oregon 1.2 14206435 ND*CCER Cedar Creek at Edy Road near Sherwood, Oregon 0.62 14206748 F-46CCKR Chicken Creek at Kruger Road 4.5 — F-45CCSR Chicken Creek at Roy Rogers Road 2.3 14206750 F-47CMMB Cedar Mill Creek at Murray Boulevard near Beaverton, Oregon 1.64 14206395 F-31DAIRY Dairy Creek at Hwy 8 near Hillsboro, Oregon 2.06 14206200 F-24DCBR Dawson Creek at Brookwood Road near Hillsboro, Oregon 0.7 14206443 F-37DCSR Dairy Creek at Susbauer Road 6.02 — F-19DLLO Tualatin River at Dilley, Oregon 58.8 14203500 F-9ECMR Erickson Creek at Menlo Drive at Beaverton, Oregon 0.76 14206365 F-30EFDD East Fork Dairy Creek near Dairy Creek Road near Mountaindale, Oregon 12.33 14205480 F-17EFDR East Fork Dairy Creek at Roy Road 1.24 — F-18ELSN Tualatin River at Elsner Road near Sherwood, Oregon 16.2 14206600 F-44FANO Fanno Creek at Durham Road near Tigard, Oregon 1.2 14206950 F-51FRMO Tualatin River at Farmington, Oregon 33.3 14206500 F-40GALES Gales Creek at Old Hwy 47 near Forest Grove, Oregon 2.36 14204530 F-13GASO Tualatin River at Gaston, Oregon 62.3 14202510 ND*GCCH Gales Creek at Clapshaw Hill Road near Gales Creek, Oregon 12.36 14204540 F-11GCSR Gales Creek at Stringtown Road 6.98 — F-12HCTP Hedges Creek at Tualatin Community Park at Tualatin, Oregon 0.3 14206958 F-52LOCS Tualatin River at Oswego Canal near Lake Oswego, Oregon 6.7 14206990 F-55MCKH McKay Creek at Hornecker Road near Hillsboro, Oregon 2.2 14206180 F-22MCKN McKay Creek at Northrup Road near North Plains, Oregon 15.5 14205980 F-20MCKP McKay Creek at Padgett Road 1.31 14206190 F-23MCFE McFee Creek at Hwy 219 near Scholls, Oregon 0.8 14206670 F-42MCSC McKay Creek at Scotch Church Road above Waible Ck near North Plains, Oregon 6.3 14206070 F-21NEAL Tualatin River at RM 24.5 near Scholls, Oregon 24.5 14206694 F-43ODAM Tualatin River at Oswego Dam near West Linn, Oregon 3.4 14207200 F-56RCQR Rock Creek at Quatama near Orenco, Oregon 4.9 14206347 F-28RCBR Rock Creek at Brookwood Avenue, Hillsboro, Oregon 2.4 — F-38RCRR Rock Creek at Rock Creek Road near Bowers Junction, Oregon 15.8 14206305 F-27RCTV Rock Creek at Hwy 8 near Hillsboro, Oregon 1.2 14206450 F-39ROOD Tualatin River at Rood Bridge Road near Hillsboro, Oregon 38.4 14206295 F-26SCBR Saum Creek at Borland Road 0.6 — F-54SCHO Sain Creek above Henry Hagg Lake near Gaston, Oregon 1.6 14202920 F-7SCLO Scoggins Creek above Henry Hagg Lake near Gaston, Oregon 9.3 14202850 F-6SCOO Scoggins Creek below Henry Hagg Lake near Gaston, Oregon 4.80 14202980 F-8SCRL Sylvan Creek at Raleighwood Lane near West Slope, Oregon 1.0 14206905 F-48TRCP Tualatin River at RM 9.9 near Tualatin Oregon 9.9 14206800 F-50TRGC Tualatin River at Golf Course Road near Cornelius, Oregon 51.5 14204800 F-14TRJB Tualatin River at Hwy 219 Bridge 44.4 14206241 F-25TRLF Tualatin River below Lee Falls near Cherry Grove, Oregon 70.7 14202450 F-4TRT Tualatin River at Tualatin, Oregon 8.9 14206956 F-53WC143 Willow Creek at 143rd Avenue near Beaverton, Oregon 3.5 14206410 F-33WCHP Willow Creek at Heritage Parkway near Beaverton, Oregon 0.75 14206413 F-34WFDE West Fork Dairy Creek at Evers Road 1.96 14205160 F-16WFDM West Fork Dairy Creek at Manning, Oregon 12.9 — F-15WSLO Tualatin River at West Linn 1.75 14207500 F-57*Not done in 2009, site will resume next year

APPENDIX F—Stream Temperature RecordsF-4 2009 Tualatin River Flow Management Report
TRLF – 14202450 – TUALATIN RIVER BELOW LEE FALLS NEAR CHERRY GROVE, OREGON [RM 70.7]
Latitude: 45 30 21 Longitude: 123 13 06 Source Agency: WEST Consultants for Clean Water Services
Day2009 Mean Daily Water Temperature in Degrees Celsius
JAN FEB MAR APR MAY JUN JUL AUG SEP OCT NOV DEC 1 8.7 13.9 12.2 14.4 12.7 11.1 2 9.5 13.9 12.9 14.2 12.2 11.1 3 8.7 14.2 13.7 13.8 12.1 9.5 4 8.4 14.2 13.7 13.1 11.8 9.8 5 8.4 13.8 13.4 12.7 11.7 9.5 6 8.4 12.8 11.9 12.4 11.6 9.6 7 8.0 11.9 11.4 12.0 11.5 10.4 8 7.7 12.2 11.2 11.9 10.9 10.2 9 8.4 12.6 11.5 12.9 11.6 10.110 8.8 12.7 12.2 12.6 11.9 9.611 9.2 12.9 13.1 12.7 12.1 8.212 8.2 13.5 12.4 13.3 12.4 8.213 7.2 13.5 12.2 12.4 12.5 8.714 8.5 13.0 12.4 11.8 12.1 9.615 8.6 13.7 13.1 11.8 12.3 10.316 9.8 13.5 13.9 11.8 12.0 11.117 11.1 13.3 14.3 12.6 11.7 11.618 11.4 13.3 13.7 13.4 11.8 11.719 10.0 13.9 12.9 13.8 12.2 11.420 9.0 12.2 13.0 13.9 11.2 10.821 9.6 11.4 13.6 13.1 11.3 11.022 10.7 11.0 13.3 12.8 11.7 10.823 11.0 11.7 12.7 12.1 12.1 11.224 10.8 12.8 12.6 12.0 12.5 10.125 10.7 11.8 13.4 11.9 11.9 9.926 10.8 11.6 13.8 11.9 11.6 10.227 11.6 11.9 14.2 12.5 11.1 8.628 12.3 12.3 14.8 12.0 11.0 7.829 — 13.3 12.2 14.9 12.3 10.5 8.330 — 13.8 11.8 14.9 12.6 10.2 9.631 — — 14.2 — 14.4 13.0 — 10.2 —
MEAN 9.9 12.8 13.2 12.7 11.7 10.0MAX 14.2 14.2 14.9 14.4 12.7 11.7MIN 7.2 11.0 11.2 11.8 10.2 7.8
TRLF – 14202450 – Tualatin River below Lee Falls near Cherry Grove, Oregon [RM 70.7]
20092008
1/1
2/1
3/1
4/1
5/1
6/1
7/1
8/1
9/1
10/1
11/1
12/1
1/1
0
5
10
15
20
25
Mea
n D
aily
Tem
per
atu
re (
°C)
32
41
50
59
68
77
(°F
)
Oregon Temperature Guidelinefor Salmonid Rearing and Migration

APPENDIX F—Stream Temperature Records2009 Tualatin River Flow Management Report F-5
SCLO – 14202850 — SCOGGINS CREEK ABOVE HENRY HAGG LAKE NEAR GASTON, OREGON [RM 9.3]Latitude: 45 30 06 Longitude: 123 15 06 Source Agency: WEST Consultants for Clean Water Services
Day2009 Mean Daily Water Temperature in Degrees Celsius
JAN FEB MAR APR MAY JUN JUL AUG SEP OCT NOV DEC 1 9.2 13.8 13.7 19.9 15.7 11.5 2 9.9 13.9 15.0 19.5 15.6 11.5 3 9.0 14.2 15.6 18.8 15.6 9.3 4 8.8 14.1 15.6 17.5 15.1 9.9 5 8.8 13.5 15.5 16.7 15.0 9.1 6 9.0 12.7 14.0 16.0 14.2 8.9 7 8.4 12.1 13.0 15.3 13.7 9.8 8 8.1 12.2 12.8 14.6 12.9 9.8 9 8.8 12.7 13.2 16.0 13.7 9.310 9.2 13.0 13.9 15.5 14.5 8.811 9.4 13.1 15.0 16.4 15.0 7.312 8.5 13.6 14.4 16.7 15.4 7.113 7.5 13.8 14.2 15.2 15.9 7.714 9.0 12.9 14.3 14.2 15.3 9.215 9.1 13.5 15.2 14.5 15.0 10.116 10.0 13.2 16.2 14.0 14.6 10.917 11.2 13.1 17.2 15.6 13.6 11.618 11.6 13.2 16.9 16.8 13.4 11.919 10.3 13.9 15.7 17.5 14.1 11.820 9.3 12.8 16.4 17.6 12.6 10.821 10.0 11.9 17.3 16.5 12.7 11.022 10.8 11.5 16.9 15.7 13.2 10.623 11.0 12.1 16.1 14.4 13.5 11.224 10.7 13.4 15.8 14.0 13.6 10.125 10.5 12.9 17.1 14.2 13.1 9.726 10.9 12.3 17.7 14.1 12.6 10.127 11.5 12.8 19.0 14.8 12.2 8.728 12.2 13.6 20.2 14.6 11.7 7.829 — 13.2 13.2 20.6 15.1 11.3 8.630 — 13.5 13.0 20.6 15.4 10.2 9.831 — — 13.7 — 19.9 15.9 — 10.6 —
MEAN 10.1 13.1 16.1 15.9 13.8 9.8MAX 13.7 14.2 20.6 19.9 15.9 11.9MIN 7.5 11.5 12.8 14.0 10.2 7.1
20092008
SCLO – 14202850 – Scoggins Creek above Henry Hagg Lake near Gaston, Oregon [RM 9.3]
1/1
2/1
3/1
4/1
5/1
6/1
7/1
8/1
9/1
10/1
11/1
12/1
1/1
0
5
10
15
20
25
Mea
n D
aily
Tem
per
atu
re (
°C)
32
41
50
59
68
77
(°F
)
Oregon Temperature Guidelinefor Salmonid Rearing and Migration

APPENDIX F—Stream Temperature RecordsF-6 2009 Tualatin River Flow Management Report
SCHO – 14202920 — SAIN CREEK ABOVE HENRY HAGG LAKE NEAR GASTON, OREGON [RM 1.6]Latitude: 45 28 50 Longitude: 123 14 40 Source Agency: WEST Consultants for Clean Water Services
Day2009 Mean Daily Water Temperature in Degrees Celsius
JAN FEB MAR APR MAY JUN JUL AUG SEP OCT NOV DEC 1 9.6 14.5 14.9 20.9 16.2 11.5 2 10.4 14.6 15.9 20.5 16.1 11.4 3 9.3 14.9 16.9 19.8 16.2 9.3 4 9.1 14.7 16.9 18.5 15.7 9.9 5 9.3 14.1 16.6 17.6 15.3 9.0 6 9.5 13.3 14.9 16.8 14.6 8.9 7 9.1 12.6 14.1 16.2 14.1 9.9 8 8.8 12.8 14.0 15.5 13.2 9.6 9 9.5 13.4 14.2 17.0 14.0 9.310 9.7 13.5 15.1 16.5 14.7 8.811 10.0 13.8 16.1 17.0 15.2 7.212 9.1 14.2 15.3 17.1 15.7 7.013 8.1 14.3 15.4 15.8 16.1 7.514 9.8 13.6 15.5 15.0 15.5 8.815 9.8 14.2 16.2 14.9 15.4 9.716 10.8 13.9 17.4 14.7 15.0 10.417 12.0 13.9 18.3 16.1 13.9 11.218 12.3 14.1 18.1 17.4 13.7 11.519 10.7 14.7 16.9 18.2 14.5 11.420 9.8 13.4 17.6 18.2 12.9 10.621 10.7 12.6 18.4 17.1 13.0 10.822 11.5 12.2 18.0 16.3 13.5 10.423 11.7 13.1 17.1 15.1 13.8 10.824 11.3 14.3 16.7 14.7 13.8 9.725 11.1 13.8 18.1 15.0 13.2 9.326 11.4 13.2 18.9 14.8 12.7 9.727 12.1 13.8 20.0 15.5 12.0 8.128 12.9 14.4 21.2 15.2 11.7 7.229 — 14.0 14.2 21.7 15.7 11.2 7.930 — 14.2 13.8 21.6 15.8 10.3 9.231 — — 14.6 — 20.8 16.3 — 10.1 —
MEAN 10.7 13.8 17.2 16.6 14.1 9.6MAX 14.6 14.9 21.7 20.9 16.2 11.5MIN 8.1 12.2 14.0 14.7 10.3 7.0
20092008
SCHO – 14202920 – Sain Creek above Henry Hagg Lake near Gaston, Oregon [RM 1.6]
1/1
2/1
3/1
4/1
5/1
6/1
7/1
8/1
9/1
10/1
11/1
12/1
1/1
0
5
10
15
20
25
Mea
n D
aily
Tem
per
atu
re (
°C)
32
41
50
59
68
77
(°F
)
Oregon Temperature Guidelinefor Salmonid Rearing and Migration

APPENDIX F—Stream Temperature Records2009 Tualatin River Flow Management Report F-7
UNITED STATES DEPARTMENT OF THE INTERIOR – GEOLOGICAL SURVEY — OREGON WATER SCIENCE CENTERSTATION NUMBER 14202980 SCOGGINS CK BLW HENRY HAGG LAKE, NR GASTON, OR
LATITUDE: 452810 LONGITUDE: 12311561
Day2009 Mean Daily Water Temperature in Degrees Celsius
JAN FEB MAR APR MAY JUN JUL AUG SEP OCT† NOV† DEC†
1 5.1 4.5 5.2 6.0 6.5 7.1 7.3 8.2 10.8 16.0 13.2 8.9 2 4.9 4.6 5.1 6.5 6.5 7.0 7.2 8.3 10.7 16.1 13.0 8.9 3 4.8 4.5 5.1 5.9 6.4 7.1 7.4 8.4 11.0 16.3 12.8 8.7 4 4.7 4.6 5.2 6.1 6.5 7.1 7.3 8.4 11.1 16.4 12.8 8.5 5 4.9 4.5 5.4 6.4 9.7 7.1 7.3 8.4 11.3 16.0 12.6 8.2 6 5.0 4.6 5.2 6.1 12.6 6.9 7.3 8.5 11.2 16.2 12.6 7.8 7 5.4 4.6 5.2 6.2 9.4 7.0 7.3 8.5 11.7 16.2 12.4 7.4 8 5.4 4.5 5.0 6.2 6.6 7.1 7.4 8.6 11.7 15.9 12.2 7.2 9 5.1 4.4 4.9 6.1 6.6 7.3 7.3 8.6 11.7 16.2 11.9 6.810 5.0 4.4 4.9 6.1 6.6 7.4 7.4 8.7 11.9 16.2 11.8 6.111 5.2 4.5 5.1 6.2 6.7 7.4 7.4 8.8 11.9 16.0 11.5 5.912 5.4 4.5 5.3 6.2 6.7 7.5 7.4 8.9 12.1 15.7 11.2 5.913 5.7 4.5 5.4 6.2 6.6 7.2 7.5 8.9 12.0 15.4 11.2 5.914 5.8 4.5 5.1 6.3 6.7 7.0 7.4 8.9 12.3 15.0 11.1 5.915 5.7 4.6 5.7 6.2 6.8 7.2 7.5 9.1 12.4 15.1 10.7 6.016 5.4 4.5 5.6 6.4 6.7 7.2 7.5 9.0 12.4 15.0 10.6 5.917 5.3 4.6 5.4 6.2 6.8 7.1 7.5 9.2 12.8 14.9 10.6 6.018 5.2 4.7 5.9 6.3 6.7 7.0 7.6 9.2 12.8 15.0 10.4 6.119 5.2 4.7 5.7 6.4 6.7 7.1 7.6 9.4 13.0 15.0 10.3 6.120 5.1 4.7 5.6 6.4 6.8 7.0 7.7 9.3 13.2 14.7 10.1 6.021 5.1 4.7 5.6 6.6 6.9 7.1 7.8 9.6 13.5 14.9 10.0 6.022 5.1 4.7 5.5 6.5 6.8 7.1 7.7 9.5 13.5 14.9 9.8 6.223 5.1 4.7 5.4 6.5 6.9 7.2 7.8 9.8 13.7 14.7 9.5 6.324 5.0 4.8 5.9 6.6 6.8 7.1 7.8 9.9 13.9 14.8 9.4 6.125 5.0 4.9 5.8 6.6 6.9 7.1 7.9 9.8 14.3 14.7 9.3 6.126 4.9 4.9 5.6 6.5 6.8 7.1 7.9 10.1 14.7 14.5 9.3 6.027 4.8 4.7 5.8 6.5 6.9 7.1 8.0 10.1 14.9 14.1 9.4 5.828 4.8 5.1 5.8 6.6 6.9 7.2 8.0 10.2 15.1 13.7 9.2 5.829 4.7 — 6.2 6.4 7.0 7.1 8.1 10.3 15.4 13.3 9.1 5.630 4.7 — 5.7 6.5 7.0 7.2 8.2 10.5 15.6 13.5 9.1 5.631 4.6 — 6.0 — 7.0 — 8.2 10.6 — 13.6 — 5.5
MEAN 5.1 4.6 5.5 6.3 7.1 7.1 7.6 9.2 12.8 15.2 10.9 6.6MAX 5.8 5.1 6.2 6.6 12.6 7.5 8.2 10.6 15.6 16.4 13.2 8.9MIN 4.6 4.4 4.9 5.9 6.4 6.9 7.2 8.2 10.7 13.3 9.1 5.5
† Provisional data–subject to revision
SCOO – 14202980 – Scoggins Creek below Henry Hagg Lake near Gaston, Oregon [RM 4.80]
20092008
1/1
2/1
3/1
4/1
5/1
6/1
7/1
8/1
9/1
10/1
11/1
12/1
1/1
0
5
10
15
20
25
Mea
n D
aily
Tem
per
atu
re (
°C)
32
41
50
59
68
77
(°F
)
Oregon Temperature Guidelinefor Salmonid Rearing and Migration
Temperature spike occurred becauseScoggins Reservoir was temporarily discharging from spillway

APPENDIX F—Stream Temperature RecordsF-8 2009 Tualatin River Flow Management Report
DLLO – 14203500 – TUALATIN RIVER AT DILLEY, OREGON [RM 58.8]Latitude: 45 28 30 Longitude: 123 07 23 Source Agency: WEST Consultants for Clean Water Services
Day2009 Mean Daily Water Temperature in Degrees Celsius
JAN FEB MAR APR MAY JUN JUL AUG SEP OCT NOV DEC 1 9.9 14.1 10.6 12.5 14.8 2 9.9 14.9 10.6 12.7 14.8 3 9.5 14.1 10.6 12.7 14.2 4 9.0 14.6 10.6 12.5 14.4 5 9.7 13.6 10.4 12.4 14.1 6 11.5 13.0 10.0 12.4 14.3 7 10.9 12.5 9.9 12.4 14.5 8 9.6 12.4 9.9 12.4 14.5 9 10.3 13.5 10.2 12.9 14.410 10.1 14.2 10.4 13.4 14.311 10.2 14.0 10.4 13.8 13.812 9.9 14.4 11.2 13.6 13.613 8.6 14.5 11.1 13.8 13.114 9.2 11.3 e10.3 10.7 13.6 12.815 10.2 e10.6 10.2 10.6 13.4 12.516 11.1 10.3 10.9 13.2 12.817 11.6 10.4 11.3 13.1 13.318 12.0 10.9 11.4 13.2 13.519 11.1 10.7 11.3 13.6 13.720 10.1 10.5 11.3 13.3 13.421 10.8 10.4 11.1 13.3 13.122 12.1 10.2 11.1 13.6 12.923 13.9 10.0 11.1 13.9 13.224 10.5 10.0 11.1 14.1 12.025 11.8 10.2 11.5 14.4 11.626 11.8 10.3 11.3 14.3 11.827 11.8 10.6 11.5 14.4 10.228 12.7 10.7 11.4 14.4 8.629 — 13.4 10.5 11.6 14.5 8.430 — 13.8 10.5 11.9 14.3 9.431 — — 14.0 — 10.5 12.3 — 10.6 —
MEAN 11.0 e13.7 e10.4 10.9 13.4 12.9MAX 14.0 e14.9 e10.9 12.3 14.5 14.8MIN 8.6 e11.3 e10.0 9.9 12.4 8.4e=estimated value due to incomplete record
DLLO – 14203500 – Tualatin River at Dilley, Oregon [RM 58.8]
20092008
1/1
2/1
3/1
4/1
5/1
6/1
7/1
8/1
9/1
10/1
11/1
12/1
1/1
0
5
10
15
20
25
Mea
n D
aily
Tem
per
atu
re (
°C)
32
41
50
59
68
77
(°F
)
Oregon Temperature Guidelinefor Salmonid Rearing and Migration

APPENDIX F—Stream Temperature Records2009 Tualatin River Flow Management Report F-9
4550 – 14204550 – GALES CREEK ABOVE GLENWOOD, OREGON [RM 19.9]Latitude: 45 28 30 Longitude: 123 07 23 Source Agency: WEST Consultants for Clean Water Services
Day2009 Mean Daily Water Temperature in Degrees Celsius
JAN FEB MAR APR MAY JUN JUL AUG SEP OCT NOV DEC 1 9.0 12.3 12.9 2 9.3 12.3 13.6 3 9.0 12.7 14.3 4 8.5 12.3 14.3 5 8.7 12.0 13.9 6 8.6 11.6 12.6 7 8.2 10.9 12.3 8 8.0 11.3 11.9 9 8.6 11.8 12.310 8.9 11.6 13.011 9.1 11.8 14.112 8.2 12.4 12.913 7.4 12.1 12.914 8.9 11.6 13.015 8.8 12.3 14.016 9.8 11.9 14.717 10.6 12.0 15.418 10.7 12.2 15.219 9.5 12.3 14.420 9.0 11.3 15.121 9.6 11.3 15.822 10.2 10.8 15.423 10.2 11.6 14.624 10.0 12.3 14.625 10.1 11.8 15.826 10.5 11.7 e15.027 10.7 12.128 11.4 12.629 — 12.1 12.230 — 12.2 12.131 — — 12.6 — — —
MEAN 9.6 11.9 e14.0MAX 12.6 12.7 e15.8MIN 7.4 10.8 e11.9e=estimated value due to incomplete record
14204550 – Gales Creek above Glenwood, Oregon [RM 19.9]
2009
1/1
2/1
3/1
4/1
5/1
6/1
7/1
8/1
9/1
10/1
11/1
12/1
1/1
0
5
10
15
20
25
Mea
n D
aily
Tem
per
atu
re (
°C)
32
41
50
59
68
77
(°F
)
Oregon Temperature Guidelinefor Salmonid Rearing and Migration
(not done in 2008)

APPENDIX F—Stream Temperature RecordsF-10 2009 Tualatin River Flow Management Report
GCCH – 14204540 – GALES CREEK AT CLAPSHAW HILL ROAD NEAR GALES CREEK, OREGON [RM 12.36]Latitude: 45 35 39 Longitude: 123 12 38 Source Agency: WEST Consultants for Clean Water Services
Day2009 Mean Daily Water Temperature in Degrees Celsius
JAN FEB MAR APR MAY JUN JUL AUG SEP OCT NOV DEC 1 10.2 15.3 16.8 23.1 17.9 12.6 2 10.6 15.1 18.2 22.8 18.0 12.4 3 9.9 15.5 19.0 22.1 18.1 10.3 4 9.4 15.1 19.2 20.8 16.7 10.9 5 9.3 14.3 18.7 19.4 16.4 10.4 6 9.5 13.4 15.6 18.0 15.6 10.3 7 9.0 12.8 15.4 17.1 15.3 11.6 8 8.7 13.4 14.9 16.9 15.0 11.4 9 9.4 14.3 15.4 18.3 15.5 11.010 9.6 14.3 16.8 18.3 17.1 10.111 10.0 14.5 18.5 18.4 17.9 8.512 9.4 15.6 16.5 18.3 18.1 8.213 7.8 15.1 16.4 16.8 17.7 8.314 9.8 14.1 17.1 15.6 17.1 9.515 10.0 15.5 18.4 16.0 17.3 10.416 11.1 14.8 19.6 16.4 16.2 11.217 12.4 14.5 20.7 18.4 15.6 12.418 12.7 15.0 20.3 20.0 15.7 12.419 11.2 15.7 19.1 20.9 16.0 12.420 10.3 14.3 19.9 20.9 14.3 11.121 11.1 13.9 20.8 18.8 14.8 11.322 12.1 13.2 20.4 18.3 14.9 10.723 12.2 14.4 19.1 17.1 15.4 11.324 12.0 15.9 19.2 16.9 15.8 10.725 12.0 14.6 20.9 16.7 15.1 9.726 12.2 14.8 21.7 17.1 14.7 10.227 13.0 15.7 23.0 17.9 14.4 8.828 13.9 16.5 24.1 17.0 13.1 7.729 — 15.1 16.1 24.4 17.9 12.4 8.530 — 15.3 15.9 24.4 18.6 11.5 9.831 — — 15.9 — 23.1 18.8 — 10.7 —
MEAN 11.1 14.8 19.3 18.5 15.8 10.5MAX 15.9 16.5 24.4 23.1 18.1 12.6MIN 7.8 12.8 14.9 15.6 11.5 7.7
GCCH – 14204540 – Gales Creek at Clapshaw Hill Road near Gales Creek, Oregon [RM 12.36]
20092008
1/1
2/1
3/1
4/1
5/1
6/1
7/1
8/1
9/1
10/1
11/1
12/1
1/1
0
5
10
15
20
25
Mea
n D
aily
Tem
per
atu
re (
°C)
32
41
50
59
68
77
(°F
)
Oregon Temperature Guidelinefor Salmonid Rearing and Migration

APPENDIX F—Stream Temperature Records2009 Tualatin River Flow Management Report F-11
GCSR – GALES CREEK AT STRINGTOWN ROAD [RM 6.98]Latitude: 45 32 26 Longitude: 123 10 09 Source Agency: WEST Consultants for Clean Water Services
Day2009 Mean Daily Water Temperature in Degrees Celsius
JAN FEB MAR APR MAY JUN JUL AUG SEP OCT NOV DEC 1 10.7 16.5 18.1 25.0 19.6 13.4 2 11.2 16.1 19.3 24.7 19.6 13.4 3 10.1 16.6 20.5 24.4 19.6 11.4 4 9.5 16.5 20.7 23.2 18.2 11.5 5 9.3 15.1 20.6 21.8 17.6 11.3 6 9.5 14.1 18.1 19.8 16.5 11.0 7 9.2 13.5 16.3 18.1 15.9 12.0 8 8.9 14.0 16.1 17.7 15.7 12.2 9 9.7 15.1 16.2 19.2 16.5 11.610 9.8 15.4 17.4 19.6 17.7 10.911 10.4 15.7 19.5 19.9 18.7 9.512 9.7 16.7 18.3 20.0 19.2 9.013 8.0 16.5 16.8 18.1 19.0 9.114 10.0 14.9 18.2 16.7 18.1 9.915 10.4 16.4 19.9 17.0 18.3 10.716 11.6 16.1 21.3 17.1 17.5 11.517 13.0 15.4 22.5 19.3 16.5 12.618 13.5 15.7 22.4 21.3 16.6 13.019 12.0 16.9 21.2 22.5 16.9 13.020 10.8 15.8 21.5 22.8 15.7 11.821 11.7 14.9 22.7 21.2 15.6 12.022 12.9 14.4 22.6 20.0 16.0 11.523 13.1 15.1 21.4 19.0 16.5 11.824 12.9 17.3 21.1 18.6 16.8 11.225 12.8 16.3 22.6 18.3 16.2 10.426 13.0 15.6 23.6 18.5 15.7 10.927 13.8 16.9 25.0 19.4 15.2 9.628 14.8 18.0 26.4 18.7 14.2 8.229 — 16.1 17.7 26.8 18.6 13.4 8.730 — 16.6 17.5 26.5 19.4 12.4 9.931 — — 17.1 — 25.4 20.3 — 11.0 —
MEAN 11.7 15.9 20.9 20.0 16.8 11.1MAX 17.1 18.0 26.8 25.0 19.6 13.4MIN 8.0 13.5 16.1 16.7 12.4 8.2
GCSR – Gales Creek at Stringtown Road [RM 6.98]
20092008
1/1
2/1
3/1
4/1
5/1
6/1
7/1
8/1
9/1
10/1
11/1
12/1
1/1
0
5
10
15
20
25
Mea
n D
aily
Tem
per
atu
re (
°C)
32
41
50
59
68
77
(°F
)
Oregon Temperature Guidelinefor Salmonid Rearing and Migration

APPENDIX F—Stream Temperature RecordsF-12 2009 Tualatin River Flow Management Report
UNITED STATES DEPARTMENT OF THE INTERIOR – GEOLOGICAL SURVEY — OREGON WATER SCIENCE CENTERSTATION NUMBER 453040123065201* GALES CREEK AT OLD HWY 47, FOREST GROVE, OR
LATITUDE: 453039.75 LONGITUDE: 1230652.0
Day2009 Mean Daily Water Temperature in Degrees Celsius
JAN FEB MAR APR MAY JUN JUL AUG SEP OCT† NOV† DEC†
1 5.0 3.6 6.2 6.8 11.4 18.0 18.7 25.3 19.3 12.9 9.9 7.9 2 5.0 4.2 7.2 8.0 12.3 16.9 19.8 24.9 19.1 13.3 8.4 6.0 3 5.5 3.9 7.2 7.4 10.9 17.2 21.2 24.2 19.2 12.0 7.8 4.7 4 5.2 4.2 6.6 6.8 10.6 17.9 21.7 23.2 18.7 11.4 7.8 4.5 5 5.1 4.6 6.6 7.9 9.8 16.2 21.7 22.0 18.0 11.0 8.2 4.1 6 6.2 5.5 6.3 9.1 10.2 14.9 19.6 20.7 16.9 10.6 9.1 3.8 7 6.9 5.6 5.7 9.9 9.9 14.4 17.4 19.2 16.3 11.3 8.8 1.7 8 7.0 4.5 5.4 10.1 9.5 14.2 16.6 18.1 15.7 11.7 8.5 0.2 9 4.0 5.0 9.1 10.2 15.7 16.4 19.1 16.2 11.4 8.9 0.010 3.1 5.0 9.3 10.5 16.5 17.7 19.5 17.4 11.0 8.6 0.011 3.5 5.1 9.2 11.0 16.3 19.3 20.0 18.2 9.7 8.6 0.012 3.7 5.1 9.3 10.4 17.2 19.6 20.2 18.7 8.9 8.0 0.213 3.8 5.2 8.9 8.9 18.0 17.7 19.6 19.2 9.0 7.8 1.214 6.4 3.7 6.1 7.9 10.0 16.1 17.9 17.6 18.7 9.8 6.8 2.915 5.4 4.2 6.1 7.6 10.9 16.2 19.7 16.9 18.2 10.7 7.2 3.716 4.9 4.1 6.0 8.3 12.0 17.6 21.3 17.0 17.8 11.3 8.3 5.817 4.6 4.7 6.3 10.1 13.5 16.4 22.6 18.6 16.8 12.3 8.9 6.618 4.4 5.2 7.0 9.4 14.5 16.4 22.8 20.1 16.3 13.0 7.8 6.919 4.1 5.2 7.5 10.4 13.1 17.6 21.7 21.1 16.6 13.4 8.4 7.520 3.8 5.4 8.0 12.1 11.5 17.0 21.9 21.5 15.5 12.5 8.9 8.021 3.5 5.2 7.0 13.0 12.1 15.4 22.5 21.0 15.4 11.9 7.8 8.122 4.4 6.1 7.3 12.3 13.5 15.3 22.7 20.1 15.6 12.0 7.9 6.223 4.7 6.7 5.9 9.9 13.9 15.3 21.6 19.0 15.7 11.8 8.0 5.324 4.8 6.8 6.7 9.3 13.8 17.7 21.0 18.2 16.3 11.4 8.6 5.125 4.4 6.9 7.6 9.6 13.6 17.7 22.3 18.2 16.1 10.8 8.1 4.226 3.8 5.7 7.3 9.5 14.0 16.0 23.4 18.1 15.6 10.8 8.1 3.727 2.9 5.1 7.5 9.7 14.2 17.4 24.5 18.6 15.0 10.1 8.5 3.628 3.8 5.2 7.9 9.7 15.4 18.6 26.0 18.7 14.3 8.5 7.9 4.229 3.8 — 7.2 9.4 16.9 18.5 26.6 18.6 13.6 8.4 8.2 3.030 3.5 — 6.5 10.4 17.4 18.2 26.5 19.0 12.6 9.5 7.8 3.231 3.7 — 7.4 — 18.0 — 25.5 19.6 — 10.9 — 4.3
MEAN e4.6 4.8 6.5 9.3 12.4 16.7 21.2 19.9 16.8 11.1 8.2 4.1MAX e6.9 6.9 8.0 13.0 18.0 18.6 26.6 25.3 19.3 13.4 9.9 8.1MIN e2.9 3.1 5.0 6.8 8.9 14.2 16.4 16.9 12.6 8.4 6.8 0.0
† Provisional data–subject to revision; estimated value
GALES – 453040123065201* – Gales Creek at Old Hwy 47 near Forest Grove, Oregon [RM 2.36]
20092008
*USGS #453040123065201 is equivalent to OWRD #14204530.
1/1
2/1
3/1
4/1
5/1
6/1
7/1
8/1
9/1
10/1
11/1
12/1
1/1
0
5
10
15
20
25
Mea
n D
aily
Tem
per
atu
re (
°C)
32
41
50
59
68
77
(°F
)
Oregon Temperature Guidelinefor Salmonid Rearing and Migration

APPENDIX F—Stream Temperature Records2009 Tualatin River Flow Management Report F-13
TRGC – 14204800 – TUALATIN RIVER AT GOLF COURSE ROAD NEAR CORNELIUS, OREGON [RM 51.5]Latitude: 45 30 39 Longitude: 123 06 56 Source Agency: WEST Consultants for Clean Water Services
Day2009 Mean Daily Water Temperature in Degrees Celsius
JAN FEB MAR APR MAY JUN JUL AUG SEP OCT NOV DEC 1 10.7 16.7 14.1 13.4 14.2 2 10.9 16.4 13.4 13.3 14.4 3 10.7 16.9 13.3 13.0 13.2 4 9.9 17.1 13.4 13.0 13.3 5 9.6 16.2 13.2 12.7 13.1 6 10.9 14.8 12.3 12.1 12.9 7 10.8 14.1 e11.3 11.4 13.8 8 10.1 14.2 11.5 e13.5 9 10.4 14.8 11.910 10.8 15.9 12.411 10.8 16.3 e12.8 12.512 10.5 16.7 11.9 12.713 9.5 17.3 11.4 13.414 9.0 15.8 e11.4 12.615 10.7 14.0 12.416 11.6 14.6 12.517 12.5 15.8 13.718 13.2 14.2 14.619 12.7 14.6 14.520 11.1 14.5 e13.9 14.021 11.5 13.4 13.8 13.0 e14.422 12.8 12.9 13.3 12.9 14.023 13.4 14.0 12.5 12.5 14.224 13.4 15.5 12.5 12.4 14.525 13.2 15.1 12.7 e12.3 14.526 13.2 14.6 13.1 14.527 13.4 14.6 13.5 14.428 14.2 15.2 14.0 14.129 — 15.4 15.0 14.0 13.930 — 16.1 15.2 13.6 13.731 — — 16.6 — 13.2 — —
MEAN 11.9 15.2 e13.0 e12.9 e14.2 e13.6MAX 16.6 17.3 e14.1 e14.6 e14.5 e14.4MIN 9.0 12.9 e11.4 e11.4 e13.7 e12.9
e=estimated value due to incomplete record
20092008
TRCG – 14204800 – Tualatin River at Golf Course Road near Cornelius, Oregon [RM 51.5]
1/1
2/1
3/1
4/1
5/1
6/1
7/1
8/1
9/1
10/1
11/1
12/1
1/1
0
5
10
15
20
25
Mea
n D
aily
Tem
per
atu
re (
°C)
32
41
50
59
68
77
(°F
)
Oregon Temperature Guidelinefor Salmonid Rearing and Migration

APPENDIX F—Stream Temperature RecordsF-14 2009 Tualatin River Flow Management Report
WFDM – WEST FORK DAIRY CREEK AT MANNING, OREGON [RM 12.9]Latitude: 45 39 36 Longitude 123 09 18 Source Agency: WEST Consultants for Clean Water Services
Day2009 Mean Daily Water Temperature in Degrees Celsius
JAN FEB MAR APR MAY JUN JUL AUG SEP OCT NOV DEC 1 10.4 15.6 15.8 22.7 17.7 12.3 2 11.1 15.4 16.5 22.7 17.5 12.1 3 10.5 15.2 17.5 21.9 17.6 10.7 4 10.2 15.5 18.0 20.9 16.8 10.7 5 9.7 15.1 18.3 19.7 16.5 10.1 6 10.0 14.3 17.3 18.7 15.9 9.8 7 9.6 13.7 16.1 17.6 15.4 10.6 8 9.3 13.5 15.5 17.1 14.8 10.5 9 9.6 14.0 15.3 17.8 15.1 10.510 9.9 14.5 15.9 17.9 16.0 9.911 10.3 14.6 16.9 18.4 16.6 8.712 9.9 15.0 16.9 18.3 17.0 8.213 9.0 15.5 16.2 17.2 17.5 8.114 9.3 15.0 16.4 16.3 17.1 8.815 10.2 14.8 17.5 16.1 17.1 9.616 10.8 15.1 18.6 15.9 16.8 10.317 11.9 14.9 19.7 17.3 16.0 11.118 12.7 14.9 19.9 18.7 15.6 11.819 12.2 15.3 19.1 19.9 15.9 12.320 11.1 15.1 19.3 20.2 14.6 11.821 11.1 14.4 20.0 19.1 14.5 11.622 11.7 14.0 19.8 18.5 14.4 11.123 12.2 13.8 19.0 17.6 14.5 11.124 12.2 14.6 18.8 17.0 15.0 10.725 12.1 14.9 20.0 16.8 14.6 10.126 12.3 14.5 20.6 16.5 14.6 10.127 12.6 14.8 22.0 17.0 14.1 9.428 13.1 15.5 23.3 16.9 13.3 8.229 — 14.2 15.7 24.0 17.3 12.6 8.030 — 14.9 15.5 24.2 18.0 12.0 8.731 — — 15.3 — 23.0 18.3 — 9.8 —
MEAN 11.3 14.8 18.8 18.3 15.6 10.2MAX 15.3 15.7 24.2 22.7 17.7 12.3MIN 9.0 13.5 15.3 15.9 12.0 8.0
WFDM – West Fork Dairy Creek at Manning, Oregon [RM 12.9]
20092008
1/1
2/1
3/1
4/1
5/1
6/1
7/1
8/1
9/1
10/1
11/1
12/1
1/1
0
5
10
15
20
25
Mea
n D
aily
Tem
per
atu
re (
°C)
32
41
50
59
68
77
(°F
)
Oregon Temperature Guidelinefor Salmonid Rearing and Migration

APPENDIX F—Stream Temperature Records2009 Tualatin River Flow Management Report F-15
WFDE – 14205160 – WEST FORK DAIRY CREEK AT EVERS ROAD BRIDGE [RM 1.96]Latitude: 45 34 34 Longitude: 123 05 34 Source Agency: WEST Consultants for Clean Water Services
Day2009 Mean Daily Water Temperature in Degrees Celsius
JAN FEB MAR APR MAY JUN JUL AUG SEP OCT NOV DEC 1 12.0 18.2 17.0 22.7 17.9 12.7 2 12.9 18.1 18.2 22.8 17.6 13.0 3 12.3 17.7 19.3 22.1 17.6 12.0 4 12.1 17.8 19.7 21.0 17.1 11.4 5 11.2 17.0 19.7 19.9 16.7 10.9 6 11.7 15.9 18.0 18.6 16.4 10.6 7 11.3 15.3 16.7 17.9 16.0 11.1 8 11.5 15.0 16.3 17.3 15.6 11.4 9 12.3 15.4 16.4 18.5 15.6 11.110 12.8 16.0 17.0 18.3 16.5 10.811 13.0 16.4 17.9 18.7 17.3 10.012 12.6 17.0 17.7 18.8 17.4 9.113 11.5 17.3 17.0 18.1 18.2 8.714 11.0 16.7 17.2 16.9 17.6 9.315 12.5 16.8 18.3 16.5 17.6 10.216 13.6 16.9 19.3 16.5 17.2 10.917 14.9 16.9 20.4 17.5 16.4 11.518 15.9 16.9 20.6 18.9 16.0 12.219 15.2 17.2 19.8 19.8 16.1 12.420 13.6 16.4 19.9 20.2 15.4 12.221 13.4 15.6 20.6 19.5 15.1 12.222 14.1 15.3 20.5 18.8 15.2 11.923 14.4 15.5 19.4 18.0 15.1 11.824 14.5 16.4 19.4 17.2 15.5 11.325 14.4 16.2 20.5 16.7 15.5 10.826 14.5 15.7 21.0 16.6 15.6 10.827 14.6 16.2 22.4 17.1 14.8 10.328 15.6 17.0 23.8 16.9 14.2 9.029 — 16.8 16.7 24.5 17.2 13.5 8.930 — 17.4 16.5 24.1 17.8 12.9 9.431 — — 18.1 — 22.7 18.5 — 10.1 —
MEAN 13.6 16.5 19.5 18.6 16.1 10.9MAX 18.1 18.2 24.5 22.8 18.2 13.0MIN 11.0 15.0 16.3 16.5 12.9 8.7
WFDE – 14205160 – West Fork Dairy Creek at Evers Road Bridge [RM 1.96]
20092008
1/1
2/1
3/1
4/1
5/1
6/1
7/1
8/1
9/1
10/1
11/1
12/1
1/1
0
5
10
15
20
25
Mea
n D
aily
Tem
per
atu
re (
°C)
32
41
50
59
68
77
(°F
)
Oregon Temperature Guidelinefor Salmonid Rearing and Migration

APPENDIX F—Stream Temperature RecordsF-16 2009 Tualatin River Flow Management Report
EFDD – 14205480 – EAST FORK DAIRY CREEK AT DAIRY CREEK ROAD NEAR MOUNTAINDALE, OR [RM 12.33]Latitude: 45 40 32 Longitude: 123 03 54 Source Agency: WEST Consultants for Clean Water Services
Day2009 Mean Daily Water Temperature in Degrees Celsius
JAN FEB MAR APR MAY JUN JUL AUG SEP OCT NOV DEC 1 9.0 14.1 14.6 20.7 16.3 11.4 2 9.6 13.6 15.9 20.6 16.1 11.4 3 8.9 13.9 16.6 19.6 16.2 9.8 4 8.4 13.7 16.8 18.4 15.2 10.0 5 8.8 13.1 16.6 17.4 14.8 9.7 6 8.7 12.2 14.5 16.3 14.2 9.5 7 8.3 11.6 13.8 15.5 14.0 10.6 8 8.0 12.0 13.4 15.2 13.8 10.6 9 8.6 12.8 13.6 16.4 14.3 10.410 8.8 12.6 15.0 16.3 15.3 9.711 9.3 12.8 15.8 16.4 15.9 8.212 8.4 13.5 14.8 16.2 16.3 7.813 7.0 13.4 14.4 15.3 16.6 7.914 8.9 12.8 14.7 14.2 16.1 9.015 9.1 13.5 16.0 14.1 16.0 9.916 10.2 13.3 17.0 14.6 15.3 10.717 11.3 13.3 17.9 16.2 14.5 11.518 11.8 13.5 18.0 17.6 14.2 11.919 10.2 13.9 16.9 18.5 14.6 12.020 9.3 12.8 17.5 18.6 13.5 11.021 10.1 12.3 18.3 16.9 13.4 10.922 11.0 11.8 17.9 16.7 13.8 10.423 11.0 12.6 16.9 15.6 14.4 10.724 10.8 13.9 16.8 15.2 14.4 9.825 10.7 13.3 18.1 15.0 13.9 9.226 10.9 13.0 18.9 15.0 13.8 9.727 11.4 13.5 20.0 15.7 13.3 8.428 12.2 14.5 21.0 15.5 12.4 7.529 — 13.5 14.1 21.6 15.9 11.6 7.930 — 13.6 14.0 21.6 16.8 10.7 9.131 — — 14.0 — 20.8 17.1 — 10.3 —
MEAN 10.1 13.2 17.0 16.6 14.5 9.9MAX 14.0 14.5 21.6 20.7 16.6 12.0MIN 7.0 11.6 13.4 14.1 10.7 7.5
EFDD – 14205480 – East Fork Dairy Creek at Dairy Creek Road near Mountaindale, Oregon [RM 12.33]
20092008
1/1
2/1
3/1
4/1
5/1
6/1
7/1
8/1
9/1
10/1
11/1
12/1
1/1
0
5
10
15
20
25
Mea
n D
aily
Tem
per
atu
re (
°C)
32
41
50
59
68
77
(°F
)
Oregon Temperature Guidelinefor Salmonid Rearing and Migration

APPENDIX F—Stream Temperature Records2009 Tualatin River Flow Management Report F-17
EFDR – EAST FORK DAIRY CREEK AT ROY ROAD [RM 1.24]Latitude: 45 34 43 Longitude: 123 04 14 Source Agency: WEST Consultants for Clean Water Services
Day2009 Mean Daily Water Temperature in Degrees Celsius
JAN FEB MAR APR MAY JUN JUL AUG SEP OCT NOV DEC 1 10.8 16.6 16.1 22.0 17.2 12.1 2 11.7 16.5 17.1 22.1 16.9 12.1 3 11.2 16.0 18.0 21.2 17.3 10.6 4 10.8 16.3 18.5 20.1 16.8 10.5 5 10.5 15.7 18.5 19.0 16.4 9.9 6 11.0 14.6 17.1 18.0 15.8 9.3 7 10.4 13.9 16.0 17.3 15.2 10.5 8 10.1 13.7 15.3 16.8 14.5 10.7 9 10.5 14.1 15.2 17.5 14.8 10.410 11.0 14.8 15.8 17.4 15.8 9.711 11.3 15.0 16.6 17.9 16.4 8.512 10.9 15.2 16.6 18.4 16.9 8.013 9.7 15.7 16.2 17.1 17.6 8.114 9.5 15.3 15.8 16.1 17.3 9.115 11.1 15.0 16.9 15.5 17.1 9.916 11.8 14.9 17.9 15.4 16.7 10.617 13.2 15.2 19.2 16.6 15.9 11.618 14.1 15.3 19.5 18.1 15.1 12.219 13.4 15.5 18.6 19.2 15.4 12.520 11.5 15.2 18.9 19.5 14.2 12.121 11.6 14.3 19.6 18.4 14.4 11.822 12.7 13.8 19.3 17.9 14.6 11.323 13.1 14.0 18.4 16.9 14.7 11.424 13.0 14.9 18.1 16.1 15.1 10.825 12.8 15.5 19.2 16.0 14.7 10.026 13.1 14.7 19.9 15.7 14.5 10.227 13.3 14.9 21.2 16.1 14.0 9.328 14.0 15.8 22.6 16.3 13.1 8.429 — 15.2 15.8 23.3 17.0 12.4 8.430 — 15.9 15.6 23.3 17.5 11.6 8.931 — — 16.3 — 22.1 17.9 — 10.0 —
MEAN 12.1 15.1 18.4 17.8 15.4 10.3MAX 16.3 16.6 23.3 22.1 17.6 12.5MIN 9.5 13.7 15.2 15.4 11.6 8.0
EFDR – East Fork Dairy Creek at Roy Road [RM 1.24]
20092008
1/1
2/1
3/1
4/1
5/1
6/1
7/1
8/1
9/1
10/1
11/1
12/1
1/1
0
5
10
15
20
25
Mea
n D
aily
Tem
per
atu
re (
°C)
32
41
50
59
68
77
(°F
)
Oregon Temperature Guidelinefor Salmonid Rearing and Migration

APPENDIX F—Stream Temperature RecordsF-18 2009 Tualatin River Flow Management Report
DCSR – DAIRY CREEK AT SUSBAUER ROAD [RM 6.02]Latitude: 45 32 23 Longitude: 123 02 30 Source Agency: WEST Consultants for Clean Water Services
Day2009 Mean Daily Water Temperature in Degrees Celsius
JAN FEB MAR APR MAY JUN JUL AUG SEP OCT NOV DEC 1 11.0 17.3 16.7 22.7 17.9 12.5 2 12.1 17.3 17.6 22.7 17.5 12.8 3 11.8 17.1 18.7 22.1 17.5 11.6 4 11.3 17.1 19.2 21.0 17.3 11.0 5 10.8 16.6 19.3 19.8 16.9 10.6 6 11.1 15.5 17.9 18.7 16.2 10.0 7 10.8 14.7 16.5 17.7 15.7 10.5 8 10.7 14.5 16.0 17.2 15.2 10.9 9 11.2 14.8 15.8 17.8 15.2 10.910 11.9 15.2 16.5 18.0 16.0 10.311 12.0 15.7 17.2 18.5 16.7 9.212 11.9 16.0 17.0 18.6 17.3 8.513 10.9 16.3 16.5 18.0 17.8 8.514 10.1 16.0 16.6 16.8 17.7 9.215 11.5 16.0 17.4 16.3 17.4 10.216 12.5 16.1 18.6 16.2 17.0 10.717 13.8 16.2 19.7 17.1 16.3 11.518 14.9 16.2 20.2 18.4 15.6 12.319 14.6 16.4 19.4 19.6 15.7 12.720 13.0 15.8 19.4 20.0 14.9 12.321 12.5 15.1 20.2 19.2 14.5 12.122 13.2 14.6 20.2 18.5 14.8 11.923 13.7 14.8 19.2 17.6 15.1 11.824 13.8 15.6 18.6 16.8 15.4 11.325 13.7 15.8 19.6 16.5 15.2 10.726 13.8 15.5 20.5 16.3 15.0 10.627 14.0 15.6 21.5 16.7 14.6 10.128 14.6 16.4 22.8 16.8 13.9 9.029 — 15.7 16.4 23.6 17.1 13.0 8.830 — 16.5 16.2 23.9 17.6 12.2 9.331 — — 17.1 — 23.1 18.2 — 10.1 —
MEAN 12.8 15.9 19.0 18.3 15.9 10.7MAX 17.1 17.3 23.9 22.7 17.9 12.8MIN 10.1 14.5 15.8 16.2 12.2 8.5
DCSR – Dairy Creek at Susbauer Road [RM 6.02]
20092008
1/1
2/1
3/1
4/1
5/1
6/1
7/1
8/1
9/1
10/1
11/1
12/1
1/1
0
5
10
15
20
25
Mea
n D
aily
Tem
per
atu
re (
°C)
32
41
50
59
68
77
(°F
)
Oregon Temperature Guidelinefor Salmonid Rearing and Migration

APPENDIX F—Stream Temperature Records2009 Tualatin River Flow Management Report F-19
MCKN – 14205980 – MCKAY CREEK AT NORTHRUP ROAD NEAR NORTH PLAINS, OREGON [RM 15.5]Latitude: 45 38 36 Longitude: 122 59 32 Source Agency: WEST Consultants for Clean Water Services
Day2009 Mean Daily Water Temperature in Degrees Celsius
JAN FEB MAR APR MAY JUN JUL AUG SEP OCT NOV DEC 1 10.1 16.0 15.5 21.6 16.7 11.7 2 10.9 15.7 16.5 21.6 16.4 11.9 3 10.0 15.6 17.5 20.8 16.8 10.2 4 9.4 15.6 17.9 19.7 16.0 10.3 5 9.9 14.7 17.9 18.4 15.4 10.0 6 9.8 13.8 15.9 17.3 14.6 9.8 7 9.4 13.1 14.7 16.4 14.2 10.5 8 8.7 13.3 14.4 16.1 13.9 10.6 9 9.5 14.0 14.2 17.2 14.3 10.210 9.9 14.3 15.1 17.3 15.1 9.911 10.5 14.2 16.2 17.3 15.7 8.412 9.5 14.7 15.6 17.1 16.3 8.113 7.8 15.1 15.0 15.8 16.7 8.314 9.8 14.4 15.3 14.8 16.8 9.315 10.0 15.0 16.2 14.4 16.5 10.116 11.2 14.7 17.5 14.9 15.9 10.817 12.6 14.6 18.6 16.2 15.0 11.518 13.4 14.8 18.8 17.5 14.6 12.019 11.8 15.2 17.8 18.4 14.8 12.120 10.2 14.2 17.9 19.0 14.0 11.321 11.1 13.5 18.9 17.7 13.7 11.122 12.2 13.2 18.8 17.3 14.1 10.623 12.4 13.6 17.7 16.4 14.6 10.924 12.3 14.9 17.5 15.6 14.4 10.025 12.0 14.5 18.4 15.4 14.0 9.326 12.4 14.2 19.3 15.2 13.6 9.827 12.8 14.6 20.5 15.9 13.2 8.728 13.7 15.5 21.7 16.0 12.6 7.729 — 15.0 15.2 22.2 16.0 12.0 8.030 — 15.4 15.0 22.4 16.4 11.0 9.131 — — 15.8 — 21.8 17.1 — 10.3 —
MEAN 11.3 14.6 17.7 17.1 14.8 10.1MAX 15.8 16.0 22.4 21.6 16.8 12.1MIN 7.8 13.1 14.2 14.4 11.0 7.7
MCKN – 14205980 – McKay Creek at Northrup Road near North Plains, Oregon [RM 15.5]
20092008
1/1
2/1
3/1
4/1
5/1
6/1
7/1
8/1
9/1
10/1
11/1
12/1
1/1
0
5
10
15
20
25
Mea
n D
aily
Tem
per
atu
re (
°C)
32
41
50
59
68
77
(°F
)
Oregon Temperature Guidelinefor Salmonid Rearing and Migration

APPENDIX F—Stream Temperature RecordsF-20 2009 Tualatin River Flow Management Report
MCSC – 14206070 – MCKAY CREEK AT SCOTCH CHURCH ROAD ABOVE WAIBLE CREEK NEAR NORTH PLAINS, OREGON [RM 6.3]Latitude: 45 57 21 Longitude: 122 99 18 Source Agency: WEST Consultants for Clean Water Services
Day2009 Mean Daily Water Temperature in Degrees Celsius
JAN FEB MAR APR MAY JUN JUL AUG SEP OCT NOV DEC 1 22.3 16.1 12.6 2 22.3 15.9 12.6 3 21.4 16.2 11.1 4 20.1 16.0 11.3 5 18.8 15.6 10.8 6 17.8 15.2 10.4 7 17.2 15.0 11.2 8 16.3 14.3 11.2 9 16.9 14.5 10.910 16.6 15.2 10.411 17.2 15.6 9.412 17.5 16.2 9.313 17.1 16.7 9.414 16.0 16.6 10.315 e17.9 15.2 16.5 10.716 18.3 15.3 15.9 11.117 19.4 16.3 15.3 11.918 19.6 17.4 14.6 12.419 18.6 18.2 14.9 12.620 19.0 18.5 13.9 12.321 19.8 17.3 13.7 12.222 19.5 17.1 14.0 11.723 18.2 16.0 14.3 11.624 18.0 15.2 14.4 10.625 19.3 15.1 14.0 9.826 20.2 14.9 13.9 10.027 21.5 15.4 13.3 9.228 23.0 15.7 12.8 8.229 — 23.7 15.7 12.4 8.130 — 23.7 15.9 11.9 8.831 — — — 22.5 16.4 — 9.7 —
MEAN e20.3 17.2 14.8 10.7MAX e23.7 22.3 16.7 12.6MIN e18.0 14.9 11.9 8.1e=estimated value due to incomplete record
MCSC – 14206070 – McKay Creek at Scotch Church Road above Waible Creek near North Plains, Oregon [RM 6.3]
20092008
1/1
2/1
3/1
4/1
5/1
6/1
7/1
8/1
9/1
10/1
11/1
12/1
1/1
0
5
10
15
20
25
Mea
n D
aily
Tem
per
atu
re (
°C)
32
41
50
59
68
77
(°F
)
Oregon Temperature Guidelinefor Salmonid Rearing and Migration

APPENDIX F—Stream Temperature Records2009 Tualatin River Flow Management Report F-21
MCKH – 14206180 – MCKAY CREEK AT HORNECKER ROAD NEAR HILLSBORO, OREGON [RM 2.2]Latitude: 45 32 33 Longitude: 123 00 14 Source Agency: WEST Consultants for Clean Water Services
Day2009 Mean Daily Water Temperature in Degrees Celsius
JAN FEB MAR APR MAY JUN JUL AUG SEP OCT NOV DEC 1 11.5 18.9 18.4 24.4 18.2 12.6 2 12.8 18.7 19.6 24.2 17.8 12.9 3 12.6 18.7 20.6 23.4 17.9 11.6 4 11.9 18.9 21.0 22.2 17.6 11.2 5 11.7 17.9 21.0 20.9 17.3 10.7 6 11.7 16.9 19.4 19.7 16.7 10.2 7 11.4 16.3 18.1 18.8 16.0 10.9 8 10.9 16.3 17.7 18.4 15.5 11.1 9 10.9 16.5 17.5 19.2 15.7 10.910 11.4 16.8 18.3 19.2 16.4 10.311 12.0 17.3 19.2 19.6 16.9 9.112 11.9 17.8 18.7 19.9 17.4 8.613 10.8 18.0 18.1 18.8 18.0 8.714 11.0 17.4 18.2 17.5 18.0 9.515 11.9 18.0 19.3 17.0 17.8 10.616 13.0 17.9 20.5 17.0 17.3 11.517 14.3 17.8 21.6 18.2 16.6 12.318 15.5 17.9 21.9 19.5 15.7 12.919 15.2 18.3 21.0 20.5 15.8 13.120 13.9 17.2 21.3 20.8 15.0 12.521 13.4 16.6 22.1 19.8 14.6 12.322 14.1 16.2 21.9 19.2 14.7 12.023 14.6 16.7 20.7 18.2 15.0 12.124 14.7 17.9 20.3 17.3 15.3 11.325 14.7 18.0 21.6 16.9 15.0 10.426 14.9 17.2 22.3 16.7 14.7 10.527 15.2 17.4 23.5 17.1 14.2 9.928 16.2 18.3 24.8 17.2 13.6 8.829 — 17.5 18.1 25.6 17.7 12.9 8.730 — 17.9 17.9 25.6 18.2 12.2 9.331 — — 18.5 — 24.6 18.6 — 10.0 —
MEAN 13.5 17.6 20.8 19.2 16.0 10.9MAX 18.5 18.9 25.6 24.4 18.2 13.1MIN 10.8 16.2 17.5 16.7 12.2 8.6
MCKH – 14206180 – McKay Creek at Hornecker Road near Hillsboro, Oregon [RM 2.2]
20092008
1/1
2/1
3/1
4/1
5/1
6/1
7/1
8/1
9/1
10/1
11/1
12/1
1/1
0
5
10
15
20
25
Mea
n D
aily
Tem
per
atu
re (
°C)
32
41
50
59
68
77
(°F
)
Oregon Temperature Guidelinefor Salmonid Rearing and Migration

APPENDIX F—Stream Temperature RecordsF-22 2009 Tualatin River Flow Management Report
MCKP – 14206190 – MCKAY CREEK AT PADGETT ROAD NEAR HILLSBORO, OREGON [RM 1.31]Latitude: 45 31 57 Longitude: 123 00 16 Source Agency: WEST Consultants for Clean Water Services
Day2009 Mean Daily Water Temperature in Degrees Celsius
JAN FEB MAR APR MAY JUN JUL AUG SEP OCT NOV DEC 1 23.0 12.3 2 22.8 e17.6 12.5 3 22.1 17.3 11.2 4 20.9 16.9 10.9 5 19.7 16.7 10.3 6 18.6 16.2 9.9 7 17.7 15.6 10.5 8 17.3 14.8 10.7 9 18.1 15.0 10.510 18.0 15.8 10.011 18.6 16.4 8.812 18.9 16.7 8.413 18.0 17.4 8.514 16.6 17.4 9.915 e18.3 16.1 17.1 10.516 19.0 e15.6 16.7 11.317 20.1 16.1 12.118 20.4 15.3 12.819 19.6 15.3 12.920 19.8 14.5 12.321 20.6 14.1 12.222 20.4 14.3 11.923 19.5 14.4 12.124 18.9 14.8 11.325 20.0 14.5 10.426 20.9 14.3 10.827 22.0 13.8 10.028 23.3 13.1 8.829 24.1 12.5 9.030 — 24.2 12.0 9.431 — — — 23.3 — 10.3 —
MEAN e21.0 e19.1 15.3 10.7MAX e24.2 e23.0 17.4 12.9MIN e18.3 e15.6 12.0 8.4e=estimated value due to incomplete record
MCKP – 14206190 – McKay Creek at Padgett Road near Hillsboro, Oregon [RM 1.31]
20092008
1/1
2/1
3/1
4/1
5/1
6/1
7/1
8/1
9/1
10/1
11/1
12/1
1/1
0
5
10
15
20
25
Mea
n D
aily
Tem
per
atu
re (
°C)
32
41
50
59
68
77
(°F
)
Oregon Temperature Guidelinefor Salmonid Rearing and Migration

APPENDIX F—Stream Temperature Records2009 Tualatin River Flow Management Report F-23
UNITED STATES DEPARTMENT OF THE INTERIOR – GEOLOGICAL SURVEY — OREGON WATER SCIENCE CENTERSTATION NUMBER 453113123003501* DAIRY CREEK AT HWY 8, HILLSBORO, OR
LATITUDE: 453113.40 LONGITUDE: 1230035.31
Day2009 Mean Daily Water Temperature in Degrees Celsius
JAN FEB MAR APR MAY JUN JUL AUG SEP OCT† NOV† DEC†
1 5.1 3.3 5.9 7.6 11.3 17.9 17.1 23.4 18.1 12.7 9.8 7.8 2 4.9 3.6 6.8 7.7 12.5 17.9 18.1 23.3 17.9 12.8 8.8 6.9 3 4.1 3.6 7.7 8.2 12.4 17.8 19.1 22.5 18.1 11.5 8.3 5.5 4 3.8 3.7 7.5 7.8 11.8 17.8 19.7 21.5 17.5 11.3 7.9 4.4 5 3.6 4.1 7.4 8.1 11.6 17.2 19.8 20.3 17.2 10.6 8.1 3.7 6 4.3 4.8 7.1 9.4 11.5 16.2 18.4 19.0 16.6 10.1 8.9 3.3 7 6.0 5.3 6.8 10.5 11.4 15.4 17.0 18.1 16.0 10.8 8.9 1.8 8 7.3 4.9 6.2 11.1 11.0 15.1 16.4 17.6 15.4 10.9 8.8 0.5 9 6.8 4.3 5.7 11.0 11.3 15.4 16.2 18.3 15.5 10.8 8.8 0.010 5.8 3.7 5.5 10.4 12.0 15.8 16.9 18.4 16.3 10.2 8.7 0.011 5.7 3.6 5.2 10.2 12.3 16.1 17.6 18.9 16.9 9.1 8.7 0.012 6.1 3.4 5.3 10.2 12.2 16.7 17.4 19.2 17.4 8.6 8.4 0.113 6.8 3.7 5.5 9.8 11.3 16.9 16.8 18.3 17.9 8.6 8.0 0.114 7.0 3.7 6.0 9.1 10.8 16.4 16.9 17.2 17.9 9.6 7.3 0.515 6.3 3.9 6.6 8.6 11.6 16.5 17.9 16.5 17.7 10.3 7.1 1.316 5.4 4.1 6.9 8.7 12.7 16.7 18.9 16.5 17.2 10.9 7.6 3.017 4.7 4.5 6.7 10.0 14.0 16.6 20.1 17.6 16.5 11.7 8.4 5.318 4.3 4.8 7.0 10.5 15.2 16.7 20.6 18.8 15.8 12.4 8.2 6.119 4.0 5.0 8.0 10.8 15.1 16.9 19.8 20.0 15.9 12.8 8.2 6.220 3.6 5.2 8.7 12.0 13.7 16.4 20.1 20.4 15.0 12.4 8.5 6.921 3.3 5.2 9.0 13.5 13.0 15.5 20.7 19.4 14.8 12.2 8.3 7.622 3.5 5.8 8.5 13.7 13.6 15.1 20.6 19.0 14.9 11.9 7.9 7.223 4.1 6.2 7.9 12.3 14.1 15.2 19.7 17.9 15.0 12.1 7.6 5.724 4.4 6.8 7.3 10.8 14.2 16.2 19.3 17.3 15.4 11.4 7.8 4.925 4.4 7.4 7.9 10.1 14.2 16.3 20.2 16.9 15.1 10.6 8.1 4.226 3.8 7.0 8.2 10.1 14.2 15.9 21.0 16.7 15.0 10.8 7.8 3.527 3.2 6.1 8.1 10.2 14.4 16.2 22.2 17.1 14.4 10.2 7.9 3.128 3.2 5.6 8.4 10.4 15.1 16.8 23.4 17.1 13.7 9.2 8.1 3.229 3.4 — 8.0 10.1 16.3 16.9 24.1 17.6 13.0 9.0 7.9 3.030 3.4 — 7.4 10.5 17.0 16.7 24.4 18.0 12.3 9.4 8.0 2.631 3.4 — 7.6 — 17.7 — 23.6 18.4 — 10.1 — 3.1
MEAN 4.7 4.8 7.1 10.1 13.2 16.4 19.5 18.8 16.0 10.8 8.2 3.6MAX 7.3 7.4 9.0 13.7 17.7 17.9 24.4 23.4 18.1 12.8 9.8 7.8MIN 3.2 3.3 5.2 7.6 10.8 15.1 16.2 16.5 12.3 8.6 7.1 0.0
† Provisional data–subject to revision
DAIRY – 453113123003501* – Dairy Creek at Hwy 8 near Hillsboro, Oregon [RM 2.06]
20092008
*USGS #453113123003501 is equivalent to OWRD #14206200.
1/1
2/1
3/1
4/1
5/1
6/1
7/1
8/1
9/1
10/1
11/1
12/1
1/1
0
5
10
15
20
25
Mea
n D
aily
Tem
per
atu
re (
°C)
32
41
50
59
68
77
(°F
)
Oregon Temperature Guidelinefor Salmonid Rearing and Migration

APPENDIX F—Stream Temperature RecordsF-24 2009 Tualatin River Flow Management Report
TRJB – 14206241 – TUALATIN RIVER AT HWY 219 BRIDGE [RM 44.4]Latitude: 45 30 01 Longitude: 122 59 24 Source Agency: Jackson Bottom Wetland Education Center
Day2009 Mean Daily Water Temperature in Degrees Celsius
JAN FEB MAR APR MAY JUN JUL AUG SEP OCT NOV DEC 1 5.3 3.6 5.8 7.6 11.0 17.9 17.2 16.5 15.5 13.6 10.1 7.7 2 5.0 3.8 6.7 7.7 12.0 17.7 16.5 16.3 15.5 13.9 9.3 7.1 3 4.6 4.0 7.5 8.2 11.8 17.8 16.6 16.0 16.0 12.9 8.5 5.6 4 4.4 4.0 7.3 7.6 11.0 18.1 16.6 15.8 15.5 12.4 8.0 4.6 5 4.2 4.3 7.1 7.9 10.8 17.4 16.5 15.5 14.9 12.3 8.0 4.0 6 4.9 4.9 6.9 9.1 11.0 16.2 15.2 14.6 14.6 11.9 8.7 3.5 7 6.5 5.5 6.5 10.2 11.3 15.3 14.0 13.5 14.2 12.6 9.0 2.3 8 7.6 5.2 6.0 10.5 10.7 15.1 13.6 13.3 14.0 13.0 8.8 0.8 9 6.9 4.4 5.6 10.2 10.9 15.5 13.9 13.9 14.3 12.7 8.7 0.010 6.0 3.9 5.4 9.7 11.4 16.0 14.4 14.2 15.3 12.2 8.9 0.011 5.9 3.7 5.2 9.7 11.5 16.6 14.9 14.7 16.0 11.5 8.7 0.012 6.3 3.5 5.3 9.7 11.5 17.2 14.3 15.4 16.7 11.1 8.4 0.213 6.9 3.8 5.5 9.4 10.6 17.4 13.4 15.0 16.8 11.1 8.0 0.614 6.8 3.8 6.0 8.8 9.8 16.9 13.8 14.7 16.5 11.3 7.4 1.215 6.2 4.0 6.5 8.1 11.0 16.5 15.2 14.3 16.2 12.0 7.0 2.316 5.4 4.3 6.6 8.3 12.0 16.2 16.3 14.3 15.6 12.0 7.6 3.717 4.8 4.6 6.6 9.4 13.1 16.5 17.1 15.1 14.8 12.4 8.5 5.618 4.4 4.9 7.0 10.1 14.1 16.9 17.4 16.7 14.4 12.9 8.3 6.319 4.2 5.1 8.0 10.3 14.0 16.6 16.9 17.6 14.7 13.3 7.9 6.520 4.0 5.3 8.6 11.5 12.6 16.1 16.8 17.5 14.3 13.0 8.6 7.121 3.7 5.4 8.8 12.9 12.2 15.2 17.3 15.9 14.0 12.8 8.3 7.722 3.7 5.8 8.2 13.4 13.1 14.4 17.1 15.1 14.4 12.5 7.7 7.123 4.4 6.2 7.7 12.1 13.9 15.0 15.3 14.5 14.6 12.5 7.6 5.724 4.7 6.8 7.0 10.6 14.1 16.4 15.1 14.0 14.9 12.0 7.8 5.125 4.6 7.2 7.7 10.1 14.0 16.7 15.5 14.1 14.8 11.3 8.2 4.526 4.0 6.9 8.1 10.1 14.0 16.3 15.9 14.6 14.7 11.2 7.9 3.927 3.4 5.8 7.9 10.2 14.3 16.5 16.5 15.1 14.5 10.7 8.0 3.628 3.4 5.4 8.2 10.4 14.9 17.1 17.8 14.8 14.1 9.8 8.1 3.829 3.7 — 8.0 10.1 16.1 17.0 18.3 14.3 13.7 9.2 7.8 3.630 3.7 — 7.4 10.2 17.0 17.1 17.9 14.6 13.3 9.4 7.9 3.231 3.6 — 7.3 — 17.6 — 16.9 15.2 — 10.1 — 3.7
MEAN 4.9 4.9 7.0 9.8 12.7 16.5 15.9 15.1 15.0 11.9 8.3 3.9MAX 7.6 7.2 8.8 13.4 17.6 18.1 18.3 17.6 16.8 13.9 10.1 7.7MIN 3.4 3.5 5.2 7.6 9.8 14.4 13.4 13.3 13.3 9.2 7.0 0.0
20092008
TRJB – 14206241 – Tualatin River at Hwy 219 Bridge [RM 44.4]
1/1
2/1
3/1
4/1
5/1
6/1
7/1
8/1
9/1
10/1
11/1
12/1
1/1
0
5
10
15
20
25
Mea
n D
aily
Tem
per
atu
re (
°C)
32
41
50
59
68
77
(°F
)
Oregon Temperature Guidelinefor Salmonid Rearing and Migration

APPENDIX F—Stream Temperature Records2009 Tualatin River Flow Management Report F-25
ROOD – 14206295 – TUALATIN RIVER AT ROOD BRIDGE ROAD NEAR HILLSBORO, OREGON [RM 38.4]Latitude: 45 30 38 Longitude: 123 06 56 Source Agency: WEST Consultants for Clean Water Services
Day2009 Mean Daily Water Temperature in Degrees Celsius
JAN FEB MAR APR MAY JUN JUL AUG SEP OCT NOV DEC 1 11.1 18.3 17.6 18.4 15.9 13.5 2 12.1 18.1 17.9 18.1 16.1 13.8 3 12.1 18.2 17.8 17.7 16.6 13.2 4 11.5 18.4 17.8 17.2 16.5 12.6 5 11.1 17.8 17.7 16.8 15.9 12.2 6 11.0 16.9 16.8 16.2 15.3 12.0 7 11.7 15.9 15.4 15.0 14.7 12.2 8 11.1 15.5 14.5 14.3 14.3 12.5 9 10.9 15.8 14.3 14.6 14.4 12.710 11.5 16.3 14.9 14.9 15.0 12.311 11.8 16.6 15.4 15.3 16.0 11.612 11.7 17.4 15.3 15.7 16.7 11.013 11.0 17.8 14.4 15.6 17.3 10.914 10.3 17.3 14.1 15.2 17.2 11.215 10.7 17.3 15.2 14.8 17.0 11.716 12.0 16.8 16.5 14.8 16.5 12.217 13.1 16.6 17.8 15.4 15.6 12.318 14.1 16.9 18.5 16.6 15.0 12.619 14.3 17.4 18.4 18.0 14.9 13.120 13.3 16.7 18.1 18.7 14.7 13.321 12.5 16.0 18.4 18.1 14.4 13.022 13.2 15.2 18.7 16.7 14.5 12.723 14.0 15.1 17.7 15.7 14.8 12.724 14.4 16.3 16.3 15.0 15.0 12.225 14.4 17.0 16.7 14.7 14.9 11.726 14.4 16.9 17.2 14.8 14.8 11.527 14.5 17.0 17.7 15.6 14.6 11.028 15.1 17.4 18.5 15.8 14.3 10.329 — 16.1 17.5 19.7 15.4 13.8 9.930 — 17.1 17.4 20.0 15.2 13.4 9.731 — — 17.9 — 19.2 15.6 — 10.0 —
MEAN 12.9 16.9 17.0 16.0 15.3 12.0MAX 17.9 18.4 20.0 18.7 17.3 13.8MIN 10.3 15.1 14.1 14.3 13.4 9.7
20092008
ROOD – 14206295 – Tualatin River at Rood Bridge Road near Hillsboro, Oregon [RM 38.4]
1/1
2/1
3/1
4/1
5/1
6/1
7/1
8/1
9/1
10/1
11/1
12/1
1/1
0
5
10
15
20
25
Mea
n D
aily
Tem
per
atu
re (
°C)
32
41
50
59
68
77
(°F
)
Oregon Temperature Guidelinefor Salmonid Rearing and Migration

APPENDIX F—Stream Temperature RecordsF-26 2009 Tualatin River Flow Management Report
RCRR – 14206305 – ROCK CREEK AT ROCK CREEK ROAD NEAR BOWERS JUNCTION, OREGON [RM 15.8]Latitude: 45 37 04 Longitude: 122 53 13 Source Agency: WEST Consultants for Clean Water Services
Day2009 Mean Daily Water Temperature in Degrees Celsius
JAN FEB MAR APR MAY JUN JUL AUG SEP OCT NOV DEC 1 20.0 15.0 11.0 2 19.8 14.4 11.1 3 19.0 14.8 9.0 4 17.9 14.6 9.4 5 17.0 14.7 8.9 6 16.1 14.1 8.4 7 15.8 13.4 9.2 8 15.5 13.1 9.4 9 16.5 13.5 9.010 15.9 14.7 8.211 16.8 15.4 6.712 17.3 15.5 7.013 15.7 16.2 7.014 e15.5 14.5 15.8 8.815 15.6 14.0 15.4 9.816 16.8 14.1 15.2 10.817 17.7 15.4 14.3 11.618 17.5 16.5 13.5 12.019 16.0 17.0 13.9 12.020 16.4 17.5 12.7 11.221 17.5 16.4 13.0 10.822 17.3 15.8 14.3 10.223 15.9 14.3 13.9 10.924 15.5 13.3 13.8 9.125 16.9 13.6 12.9 8.626 17.7 13.4 12.5 9.627 18.7 13.8 12.1 7.828 20.2 14.5 11.8 6.829 — 21.0 15.0 11.0 8.030 — 21.1 15.2 10.2 9.731 — — — 20.1 15.3 — 10.6
MEAN e17.8 15.9 13.9 9.4MAX e21.1 20.0 16.2 12.0MIN e15.5 13.3 10.2 6.7e=estimated value due to incomplete record
RCRR – 14206305 – Rock Creek at Rock Creek Road near Bowers Junction, Oregon [RM 15.8]
20092008
1/1
2/1
3/1
4/1
5/1
6/1
7/1
8/1
9/1
10/1
11/1
12/1
1/1
0
5
10
15
20
25
Mea
n D
aily
Tem
per
atu
re (
°C)
32
41
50
59
68
77
(°F
)
Oregon Temperature Guidelinefor Salmonid Rearing and Migration

APPENDIX F—Stream Temperature Records2009 Tualatin River Flow Management Report F-27
RCQR – 14206347 – ROCK CREEK AT QUATAMA ROAD NEAR ORENCO, OREGON [RM 4.9]Latitude: 45 31 25 Longitude: 122 54 34 Source Agency: WEST Consultants for Clean Water Services
Day2009 Mean Daily Water Temperature in Degrees Celsius
JAN FEB MAR APR MAY JUN JUL AUG SEP OCT NOV DEC 1 23.1 17.9 13.0 2 23.1 17.5 13.2 3 22.3 17.9 11.5 4 21.1 17.4 11.3 5 19.9 17.3 10.7 6 18.9 17.4 10.1 7 18.1 17.1 10.9 8 17.6 16.0 10.8 9 18.6 16.1 10.610 18.5 16.8 10.111 19.3 17.2 8.912 19.6 17.6 8.813 19.4 18.3 8.814 18.0 18.0 10.615 e18.7 17.0 17.7 11.916 19.5 16.9 17.4 12.617 20.6 17.9 17.1 13.818 20.7 19.0 16.1 14.319 19.6 20.0 16.3 14.120 19.8 20.4 15.0 13.421 20.7 19.6 14.6 13.022 20.5 18.8 15.4 12.823 19.4 17.6 15.4 13.124 18.9 16.7 15.3 12.525 20.2 16.6 14.6 11.326 21.2 16.1 14.2 12.027 22.4 16.8 13.7 11.328 23.6 17.2 13.1 10.029 — 24.2 17.5 12.6 9.930 — 24.2 17.8 12.4 11.431 — — — 23.3 18.1 — 12.1 —
MEAN e21.2 18.8 16.1 11.6MAX e24.2 23.1 18.3 14.3MIN e18.9 16.1 12.4 8.8e=estimated value due to incomplete record
RCQR – 14206347 – Rock Creek at Quatama Road near Orenco, Oregon [RM 4.9]
20092008
1/1
2/1
3/1
4/1
5/1
6/1
7/1
8/1
9/1
10/1
11/1
12/1
1/1
0
5
10
15
20
25
Mea
n D
aily
Tem
per
atu
re (
°C)
32
41
50
59
68
77
(°F
)
Oregon Temperature Guidelinefor Salmonid Rearing and Migration

APPENDIX F—Stream Temperature RecordsF-28 2009 Tualatin River Flow Management Report
BCCH – 14206360 – BEAVERTON CREEK AT CEDAR HILLS BLVD AT BEAVERTON, OREGON [RM 7.45]Latitude: 45 49 31 Longitude: 122 81 05 Source Agency: WEST Consultants for Clean Water Services
Day2009 Mean Daily Water Temperature in Degrees Celsius
JAN FEB MAR APR MAY JUN JUL AUG SEP OCT NOV DEC 1 13.7 18.7 18.4 23.7 18.5 14.4 2 13.4 17.6 19.5 23.2 18.5 14.5 3 13.0 18.4 20.4 22.5 18.7 12.5 4 12.0 18.4 20.5 21.6 18.0 13.3 5 12.3 16.6 20.1 20.0 17.4 12.3 6 12.5 15.8 17.5 18.2 17.0 12.1 7 12.1 15.5 16.9 17.2 17.1 13.1 8 12.1 16.2 16.7 17.9 16.3 13.0 9 12.5 17.2 17.0 19.2 16.5 12.710 12.7 16.7 18.3 19.8 17.6 11.911 13.7 16.7 18.6 19.8 18.2 10.212 12.6 17.4 17.3 20.0 18.6 9.813 11.2 17.3 17.1 19.0 18.5 9.514 12.9 16.5 17.8 17.3 18.2 12.115 13.5 17.7 19.8 16.6 18.3 12.916 14.8 17.6 21.1 17.4 17.8 13.417 16.1 17.3 21.9 18.6 17.9 14.618 16.7 17.6 21.8 20.1 17.1 14.619 14.5 18.0 20.6 21.0 16.8 14.120 13.7 17.0 21.0 21.2 16.0 13.621 14.9 16.4 22.1 19.2 15.6 13.622 15.9 16.2 21.7 19.2 16.6 13.423 16.0 17.2 20.2 18.0 16.8 13.624 15.9 18.7 20.3 17.7 16.2 12.725 16.0 17.7 21.7 17.0 16.1 11.626 16.1 17.3 22.7 17.5 16.0 12.427 16.7 18.3 23.8 18.6 15.5 11.628 17.6 18.9 24.6 18.1 14.6 10.329 — 18.7 18.3 24.5 18.0 14.2 10.430 — 18.7 18.0 24.0 18.4 14.0 12.531 — — 19.0 — 23.4 18.9 — 13.1 —
MEAN 14.6 17.4 20.4 19.2 17.0 12.6MAX 19.0 18.9 24.6 23.7 18.7 14.6MIN 11.2 15.5 16.7 16.6 14.0 9.5
BCCH – 14206360 – Beaverton Creek at Cedar Hills Blvd at Beaverton, Oregon [RM 7.45]
20092008
1/1
2/1
3/1
4/1
5/1
6/1
7/1
8/1
9/1
10/1
11/1
12/1
1/1
0
5
10
15
20
25
Mea
n D
aily
Tem
per
atu
re (
°C)
32
41
50
59
68
77
(°F
)
Oregon Temperature Guidelinefor Salmonid Rearing and Migration

APPENDIX F—Stream Temperature Records2009 Tualatin River Flow Management Report F-29
ECMR – 14206365 – ERICKSON CREEK AT MENLO DRIVE AT BEAVERTON, OREGON [RM 0.76]Latitude: 45 29 14 Longitude: 122 58 54 Source Agency: WEST Consultants for Clean Water Services
Day2009 Mean Daily Water Temperature in Degrees Celsius
JAN FEB MAR APR MAY JUN JUL AUG SEP OCT NOV DEC 1 13.2 18.3 17.3 21.4 18.1 14.5 2 13.4 18.0 18.3 21.4 17.8 14.3 3 13.1 18.2 19.4 21.1 18.2 12.5 4 12.4 18.5 19.7 20.7 17.7 12.7 5 12.6 17.0 19.5 19.9 17.9 12.0 6 12.9 16.3 17.5 19.1 17.6 11.7 7 12.7 16.0 16.9 18.3 17.3 12.7 8 12.9 16.1 16.8 18.0 16.6 12.8 9 13.5 16.6 16.8 18.3 16.7 12.210 13.6 16.8 17.4 18.3 17.7 11.411 13.8 16.9 17.9 18.7 18.0 10.212 12.9 17.1 17.4 20.0 18.4 9.913 11.7 17.4 17.1 19.1 18.8 9.814 13.4 17.3 17.4 18.1 18.2 12.815 13.7 17.5 18.2 17.3 18.0 13.516 14.8 17.6 19.1 17.3 17.9 14.017 15.9 17.6 19.8 18.1 17.7 15.218 16.3 17.6 19.8 19.1 16.7 14.919 14.6 18.1 18.9 19.8 17.4 14.620 13.6 17.2 19.1 20.0 16.0 13.921 14.5 16.4 20.0 19.3 15.7 13.922 15.4 15.9 20.0 18.7 16.6 13.623 15.3 16.5 19.1 17.8 16.6 13.824 15.2 17.8 18.7 17.3 16.3 12.825 15.2 17.3 19.7 17.2 16.0 12.026 15.6 16.5 20.6 17.0 15.6 12.827 16.0 16.9 21.3 17.4 15.1 12.328 16.6 17.6 21.7 17.9 14.6 11.129 — 17.7 17.0 21.9 18.0 14.3 11.130 — 18.0 16.8 21.8 18.1 14.1 13.531 — — 18.3 — 21.5 18.3 — 13.8 —
MEAN 14.5 17.2 19.1 18.7 16.9 12.8MAX 18.3 18.5 21.9 21.4 18.8 15.2MIN 11.7 15.9 16.8 17.0 14.1 9.8
ECMR – 14206365 – Erickson Creek at Menlo Drive at Beaverton, Oregon [RM 0.76]
20092008
1/1
2/1
3/1
4/1
5/1
6/1
7/1
8/1
9/1
10/1
11/1
12/1
1/1
0
5
10
15
20
25
Mea
n D
aily
Tem
per
atu
re (
°C)
32
41
50
59
68
77
(°F
)
Oregon Temperature Guidelinefor Salmonid Rearing and Migration

APPENDIX F—Stream Temperature RecordsF-30 2009 Tualatin River Flow Management Report
CMMB – 14206395 – CEDAR MILL CREEK AT MURRAY BOULEVARD NEAR BEAVERTON, OREGON [RM 1.64]Latitude: 45 30 37 Longitude: 122 49 18 Source Agency: WEST Consultants for Clean Water Services
Day2009 Mean Daily Water Temperature in Degrees Celsius
JAN FEB MAR APR MAY JUN JUL AUG SEP OCT NOV DEC 1 13.4 20.0 18.0 23.0 17.9 13.5 2 14.0 19.5 18.6 22.9 17.6 13.9 3 13.0 19.4 19.9 22.2 18.1 12.3 4 12.5 19.6 20.4 21.3 17.8 12.1 5 12.1 18.1 20.0 20.0 17.3 11.4 6 12.5 16.7 18.1 18.6 16.7 11.2 7 12.6 16.3 17.1 17.8 16.1 12.0 8 12.7 16.4 16.7 17.6 15.5 12.1 9 13.4 17.1 16.5 18.5 15.6 11.910 13.8 17.4 17.2 18.6 16.6 11.411 14.1 17.5 17.9 19.4 17.3 10.212 12.9 18.0 17.5 19.4 18.0 9.613 11.4 18.2 17.0 18.3 18.6 9.314 12.6 17.4 17.3 17.2 18.0 10.415 13.5 17.5 18.1 16.4 17.9 11.516 15.0 17.7 19.2 16.8 17.8 12.517 16.8 17.8 20.3 18.2 17.3 13.618 17.7 17.8 20.4 19.6 16.4 13.519 15.2 18.3 19.3 20.4 16.8 13.720 13.9 17.2 19.4 20.8 15.3 13.221 14.7 16.5 20.3 19.5 15.2 12.922 15.8 15.9 20.3 18.7 16.1 13.023 16.1 16.5 19.1 17.7 16.4 12.924 15.9 18.0 18.7 16.7 16.2 11.725 16.0 17.7 20.0 16.7 15.7 10.826 16.4 16.9 21.5 16.2 15.3 11.627 16.8 17.2 22.3 17.3 14.9 10.928 17.8 18.1 23.8 17.7 14.6 9.529 — 19.1 17.6 24.0 17.8 13.8 9.530 — 19.5 17.4 24.2 17.9 13.1 10.931 — — 19.9 — 23.3 18.2 — 11.9 —
MEAN 14.9 17.7 19.6 18.8 16.5 11.8MAX 19.9 20.0 24.2 23.0 18.6 13.9MIN 11.4 15.9 16.5 16.2 13.1 9.3
CMMB – 14206395 – Cedar Mill Creek at Murray Boulevard near Beaverton, Oregon [RM 1.64]
20092008
1/1
2/1
3/1
4/1
5/1
6/1
7/1
8/1
9/1
10/1
11/1
12/1
1/1
0
5
10
15
20
25
Mea
n D
aily
Tem
per
atu
re (
°C)
32
41
50
59
68
77
(°F
)
Oregon Temperature Guidelinefor Salmonid Rearing and Migration

APPENDIX F—Stream Temperature Records2009 Tualatin River Flow Management Report F-31
UNITED STATES DEPARTMENT OF THE INTERIOR – GEOLOGICAL SURVEY — OREGON WATER SCIENCE CENTERSTATION NUMBER 453004122510301 BEAVERTON CREEK AT 170TH AVE, BEAVERTON, OR.
LATITUDE: 453004 LONGITUDE: 1225103
Day2009 Mean Daily Water Temperature in Degrees Celsius
JAN FEB MAR APR MAY JUN JUL AUG SEP OCT† NOV† DEC†
1 6.7 4.1 7.0 8.2 14.6 21.8 18.9 23.9 18.2 13.6 11.2 8.52 5.9 4.2 8.2 9.2 14.7 21.3 19.7 23.6 18.0 13.8 9.7 6.83 5.6 4.3 8.5 9.4 13.5 20.6 20.8 23.0 18.4 12.5 9.0 5.24 4.6 4.6 8.0 9.3 13.0 21.2 21.3 22.1 18.1 11.9 8.9 4.35 4.8 5.1 8.4 11.1 12.5 19.2 21.4 21.0 17.8 11.5 9.1 3.56 7.3 5.8 8.0 12.8 13.1 17.6 20.0 19.8 17.2 11.0 9.9 2.97 9.3 6.4 7.6 13.7 13.2 17.2 18.5 18.9 16.7 11.5 9.5 1.08 9.2 5.9 6.7 13.4 13.5 17.1 18.0 18.5 16.1 11.7 9.3 0.29 7.4 5.0 6.5 12.1 14.2 17.9 17.6 19.0 16.4 11.5 9.5 0.2
10 6.0 4.2 6.2 11.9 14.7 18.6 18.1 19.0 17.2 10.9 9.4 0.311 6.9 4.4 6.1 11.7 15.0 18.5 18.7 19.6 17.5 10.1 9.5 0.312 8.4 4.2 6.4 11.9 14.4 18.7 18.5 20.1 18.0 9.6 8.2 0.613 9.0 4.5 6.9 11.1 12.2 19.2 18.0 19.6 18.5 9.5 8.3 0.914 8.3 4.4 7.9 10.4 13.2 18.6 18.1 18.4 18.3 10.3 7.3 1.615 6.5 4.9 7.9 9.9 14.5 18.7 19.2 17.4 18.3 11.7 7.7 3.416 5.0 5.2 8.2 11.1 16.2 19.4 20.4 17.2 18.2 12.4 8.7 6.717 4.1 5.8 8.2 12.9 18.1 19.3 21.4 18.1 17.9 13.2 9.5 7.718 3.8 5.9 9.4 12.1 19.4 19.3 21.5 19.2 17.2 14.2 8.7 7.619 3.6 6.2 10.6 13.5 16.6 19.6 20.8 20.3 17.1 14.1 8.8 8.320 3.3 6.3 11.0 15.8 14.8 18.0 20.6 20.8 16.1 13.6 9.2 8.921 3.0 6.6 10.6 17.1 15.6 17.0 21.4 20.1 15.6 13.3 8.4 9.222 3.5 7.2 10.1 16.3 17.2 17.0 21.4 19.4 16.4 12.9 8.0 7.223 4.3 7.3 8.2 13.3 17.8 17.3 20.5 18.6 16.5 13.0 7.9 5.724 4.7 7.8 8.4 12.5 17.9 18.8 19.9 17.7 16.2 12.2 8.7 5.025 4.7 8.7 9.2 12.5 17.7 19.1 20.8 17.4 15.6 11.3 8.4 3.826 3.3 7.6 8.8 11.7 18.1 18.1 21.7 16.9 15.4 11.7 8.2 2.927 2.7 6.6 9.4 11.9 18.5 18.4 22.7 17.4 14.9 11.1 9.0 2.628 4.0 6.3 9.7 12.3 19.2 19.2 23.9 17.7 14.5 9.8 8.4 2.929 4.3 — 8.7 12.0 20.5 19.0 24.5 17.8 13.8 9.6 8.4 2.230 3.9 — 8.5 12.8 21.1 18.7 24.7 18.0 13.3 10.7 8.5 2.731 4.1 — 9.0 — 21.5 — 24.0 18.4 — 12.1 — 4.0
MEAN 5.4 5.7 8.3 12.1 16.0 18.8 20.6 19.3 16.8 11.8 8.8 4.1MAX 9.3 8.7 11.0 17.1 21.5 21.8 24.7 23.9 18.5 14.2 11.2 9.2MIN 2.7 4.1 6.1 8.2 12.2 17.0 17.6 16.9 13.3 9.5 7.3 0.2
† Provisional data–subject to revision
B170 – Beaverton Creek at 170th Ave, Beaverton, Oregon [RM 4.9]
20092008
1/1
2/1
3/1
4/1
5/1
6/1
7/1
8/1
9/1
10/1
11/1
12/1
1/1
0
5
10
15
20
25
Mea
n D
aily
Tem
per
atu
re (
°C)
32
41
50
59
68
77
(°F
)
Oregon Temperature Guidelinefor Salmonid Rearing and Migration

APPENDIX F—Stream Temperature RecordsF-32 2009 Tualatin River Flow Management Report
WC143 – 14206410 – WILLOW CREEK AT 143RD AVENUE NEAR BEAVERTON, OREGON [RM 3.5]Latitude: 45 32 12 Longitude: 122 49 24 Source Agency: WEST Consultants for Clean Water Services
Day2009 Mean Daily Water Temperature in Degrees Celsius
JAN FEB MAR APR MAY JUN JUL AUG SEP OCT NOV DEC 1 23.8 19.7 15.5 2 23.6 19.4 15.4 3 22.7 20.3 13.6 4 21.7 19.6 13.3 5 20.5 20.2 13.1 6 19.6 19.5 12.6 7 19.3 18.5 13.3 8 19.3 17.9 13.4 9 20.4 18.3 13.110 20.6 19.1 12.111 21.5 19.6 10.412 23.3 20.1 9.613 21.1 20.2 8.914 19.6 18.8 11.715 e22.3 18.7 19.3 12.716 22.7 19.1 19.4 13.617 23.8 20.4 19.8 14.018 23.7 21.4 19.0 14.119 22.0 22.3 18.9 14.420 21.8 22.4 17.7 14.021 22.6 21.1 17.1 14.022 22.6 20.2 17.2 13.723 21.4 19.0 17.4 13.724 21.1 18.5 17.1 12.825 22.5 18.5 16.7 12.026 23.3 18.4 16.6 12.627 24.5 19.3 16.0 11.828 25.6 19.5 15.4 10.629 — 25.5 19.5 14.6 11.230 — 24.9 19.7 14.6 12.231 — — — 24.0 20.0 — 12.6 —
MEAN e23.3 20.5 18.3 12.8MAX e25.6 23.8 20.3 15.5MIN e21.1 18.4 14.6 8.9e=estimated value due to incomplete record
WC143 – 14206410 – Willow Creek at 143rd Avenue near Beaverton, Oregon [RM 3.5]
20092008
1/1
2/1
3/1
4/1
5/1
6/1
7/1
8/1
9/1
10/1
11/1
12/1
1/1
0
5
10
15
20
25
Mea
n D
aily
Tem
per
atu
re (
°C)
32
41
50
59
68
77
(°F
)
Oregon Temperature Guidelinefor Salmonid Rearing and Migration

APPENDIX F—Stream Temperature Records2009 Tualatin River Flow Management Report F-33
WCHP – 14206413 – WILLOW CREEK AT HERITAGE PARKWAY NEAR BEAVERTON, OREGON [RM 0.75]Latitude: 45 31 12 Longitude: 122 51 35 Source Agency: WEST Consultants for Clean Water Services
Day2009 Mean Daily Water Temperature in Degrees Celsius
JAN FEB MAR APR MAY JUN JUL AUG SEP OCT NOV DEC 1 24.4 18.8 13.8 2 24.1 18.3 14.0 3 23.8 18.5 12.6 4 22.6 18.4 12.0 5 21.2 18.0 11.6 6 19.8 17.5 11.1 7 18.7 17.0 11.3 8 18.2 16.3 11.7 9 19.5 16.6 11.510 19.4 17.5 11.011 20.1 17.9 10.112 20.6 18.0 9.713 19.7 18.7 9.614 18.3 18.2 11.115 e20.6 17.3 17.9 12.316 21.4 17.8 17.9 13.017 22.1 19.2 18.1 14.318 22.3 20.3 16.7 14.519 21.2 21.2 17.1 14.220 21.7 21.2 15.8 13.621 22.2 20.5 15.5 13.422 21.8 19.6 15.8 13.023 20.8 18.7 15.8 13.324 20.8 17.9 16.0 12.525 21.5 17.6 15.4 11.326 22.9 17.0 14.8 12.027 24.4 17.7 14.4 11.328 25.5 18.1 14.1 10.029 — 25.9 18.3 13.7 10.130 — 25.7 18.6 13.6 11.731 — — — 24.6 18.9 — 12.5 —
MEAN e22.8 19.7 16.7 12.1MAX e25.9 24.4 18.8 14.5MIN e20.8 17.0 13.6 9.6e=estimated value due to incomplete record
WCHP – 14206413 – Willow Creek at Heritage Parkway near Beaverton, Oregon [RM 0.75]
20092008
1/1
2/1
3/1
4/1
5/1
6/1
7/1
8/1
9/1
10/1
11/1
12/1
1/1
0
5
10
15
20
25
Mea
n D
aily
Tem
per
atu
re (
°C)
32
41
50
59
68
77
(°F
)
Oregon Temperature Guidelinefor Salmonid Rearing and Migration

APPENDIX F—Stream Temperature RecordsF-34 2009 Tualatin River Flow Management Report
BCSR – 14206419 – BRONSON CREEK AT SALTZMAN ROAD NEAR ORENCO, OREGON [RM 5.1]
Latitude: 45 33 19 Longitude: 122 48 25 Source Agency: WEST Consultants for Clean Water Services
Day2009 Mean Daily Water Temperature in Degrees Celsius
JAN FEB MAR APR MAY JUN JUL AUG SEP OCT NOV DEC 1 10.0 14.5 13.8 19.2 15.2 11.9 2 10.8 14.4 15.2 19.0 14.6 12.0 3 9.8 14.8 15.6 18.3 15.0 9.9 4 9.6 14.9 15.8 17.3 e14.4 10.3 5 9.8 13.9 15.9 16.3 9.7 6 9.9 13.3 14.5 15.5 9.4 7 9.4 12.9 13.8 15.2 10.4 8 9.0 13.0 13.8 15.3 10.7 9 9.4 13.1 13.6 16.3 e14.7 10.410 9.9 13.4 14.6 15.7 15.0 9.611 10.6 13.5 15.0 16.2 15.7 8.112 9.4 13.9 14.5 16.7 16.4 8.113 8.2 14.0 14.1 15.2 16.7 7.914 9.8 13.6 14.2 14.3 16.2 9.815 9.6 13.7 15.0 13.9 15.8 11.216 10.7 13.9 15.9 13.9 15.7 12.017 11.9 14.1 16.8 15.3 15.0 12.718 12.6 14.3 16.7 16.8 14.0 12.919 11.1 14.3 15.4 17.4 14.6 12.720 10.0 13.2 16.2 17.6 13.1 11.921 10.7 12.3 17.1 16.5 13.8 11.922 11.3 12.2 16.7 15.6 15.3 11.523 11.3 12.6 15.6 14.3 15.5 11.924 11.0 13.6 15.5 13.5 15.0 10.525 10.9 13.7 16.8 13.8 14.2 9.726 11.3 12.5 17.6 13.3 13.7 10.827 11.8 12.8 18.6 14.1 13.3 e9.328 12.5 13.5 19.9 14.7 12.929 — 13.7 13.3 20.4 15.2 11.830 — 13.9 12.8 20.4 15.4 11.031 — — 14.3 — 19.2 15.6 — —
MEAN 10.8 13.5 16.1 15.7 e14.6 e10.7MAX 14.3 14.9 20.4 19.2 e16.7 e12.9MIN 8.2 12.2 13.6 13.3 e11.0 e7.9e=estimated value due to incomplete record
BCSR – 14206419 – Bronson Creek at Saltzman Road near Orenco, Oregon [RM 5.1]
20092008
1/1
2/1
3/1
4/1
5/1
6/1
7/1
8/1
9/1
10/1
11/1
12/1
1/1
0
5
10
15
20
25
Mea
n D
aily
Tem
per
atu
re (
°C)
32
41
50
59
68
77
(°F
)
Oregon Temperature Guidelinefor Salmonid Rearing and Migration

APPENDIX F—Stream Temperature Records2009 Tualatin River Flow Management Report F-35
BCBR – 14206423 – BRONSON CREEK AT BRONSON ROAD NEAR ORENCO, OREGON [RM 2.1]]
Latitude: 45 32 18 Longitude: 122 51 15 Source Agency: WEST Consultants for Clean Water Services
Day2009 Mean Daily Water Temperature in Degrees Celsius
JAN FEB MAR APR MAY JUN JUL AUG SEP OCT NOV DEC 1 12.4 18.8 16.8 20.9 17.0 12.6 2 13.6 18.5 17.6 21.0 16.9 12.8 3 12.9 18.4 18.4 20.5 17.1 11.3 4 12.5 18.6 18.7 19.7 16.8 11.1 5 12.2 17.5 18.5 18.9 16.5 10.6 6 12.8 16.5 17.4 18.1 16.1 10.2 7 12.5 16.1 16.7 17.8 15.6 10.8 8 11.9 16.0 16.4 17.5 14.9 11.1 9 12.6 16.3 16.2 18.0 15.1 10.710 13.2 16.4 16.6 18.1 16.0 10.211 14.0 16.7 17.2 18.6 16.5 9.412 12.9 17.3 16.9 18.7 17.0 9.113 10.9 17.5 16.5 17.7 17.3 8.814 12.3 16.9 16.8 16.6 17.3 10.115 12.6 17.2 17.8 15.9 17.3 11.016 13.8 17.2 18.6 16.1 17.0 11.617 15.4 17.1 19.3 17.2 16.7 12.618 16.9 17.3 19.4 18.4 15.6 13.319 15.0 17.5 18.6 19.1 15.8 13.220 13.3 16.4 18.6 19.5 14.8 12.621 14.0 15.5 19.1 18.6 14.7 12.422 14.9 15.3 18.9 18.0 15.6 12.023 15.5 15.6 18.2 16.9 15.7 12.324 15.0 16.6 18.2 16.2 15.2 11.325 14.9 16.8 18.9 15.9 14.9 10.226 15.0 16.3 19.4 15.7 14.6 11.127 15.8 16.6 20.5 16.0 14.2 e10.328 16.2 17.1 21.4 16.1 13.629 — 17.3 16.9 21.6 16.4 12.830 — 17.9 16.6 21.6 16.8 12.231 — — 18.3 — 21.0 17.3 — —
MEAN 14.1 16.9 18.4 17.8 15.7 e11.2MAX 18.3 18.8 21.6 21.0 17.3 e13.3MIN 10.9 15.3 16.2 15.7 12.2 e8.8e=estimated value due to incomplete record
BCBR – 14206423 – Bronson Creek at Bronson Road near Orenco, Oregon [RM 2.1]
20092008
1/1
2/1
3/1
4/1
5/1
6/1
7/1
8/1
9/1
10/1
11/1
12/1
1/1
0
5
10
15
20
25
Mea
n D
aily
Tem
per
atu
re (
°C)
32
41
50
59
68
77
(°F
)
Oregon Temperature Guidelinefor Salmonid Rearing and Migration

APPENDIX F—Stream Temperature RecordsF-36 2009 Tualatin River Flow Management Report
DCBR – 14206443 – DAWSON CREEK AT BROOKWOOD ROAD NEAR HILLSBORO, OREGON [RM 0.7]Latitude: 45 31 27 Longitude:122 56 01 Source Agency: WEST Consultants for Clean Water Services
Day2009 Mean Daily Water Temperature in Degrees Celsius
JAN FEB MAR APR MAY JUN JUL AUG SEP OCT NOV DEC 1 13.8 21.2 19.6 24.4 19.0 13.9 2 14.3 20.5 20.5 24.2 18.7 14.1 3 14.0 20.6 21.4 23.6 18.8 12.7 4 13.1 20.9 21.8 22.5 18.4 12.2 5 12.9 19.2 21.9 21.1 17.9 11.7 6 13.7 17.8 19.9 19.8 17.3 11.5 7 14.0 17.2 18.9 18.8 16.6 12.1 8 13.5 17.3 18.3 18.4 16.1 12.1 9 14.2 18.1 18.0 19.6 16.6 11.710 14.6 18.3 18.7 19.9 17.4 11.211 15.2 18.4 19.2 20.2 18.0 10.212 14.2 19.1 18.4 20.2 18.5 9.913 12.3 19.2 18.0 19.2 19.0 9.814 13.1 18.3 18.6 18.2 18.8 11.115 14.4 18.9 19.8 17.3 18.6 12.016 16.0 19.1 21.1 17.5 18.2 12.517 17.7 18.9 22.1 18.6 17.6 13.218 18.8 19.1 22.3 20.0 17.1 14.019 16.5 19.3 21.4 21.0 16.9 14.020 14.7 17.9 21.4 21.4 16.0 13.421 15.5 17.4 22.3 20.5 15.7 12.922 16.9 17.1 22.2 19.9 16.1 e12.823 17.3 17.6 21.0 18.9 16.124 17.4 19.3 20.9 18.2 16.125 17.3 18.9 22.0 17.8 15.626 17.6 18.4 22.9 17.5 15.527 18.0 19.0 23.9 18.0 14.928 18.8 19.7 25.1 18.2 14.529 — 20.2 19.4 25.6 18.4 13.930 — 20.6 19.2 25.5 18.7 13.531 — — 21.2 — 24.7 19.1 — —
MEAN 15.9 18.8 21.2 19.7 16.9 e12.2MAX 21.2 21.2 25.6 24.4 19.0 e14.1MIN 12.3 17.1 18.0 17.3 13.5 e9.8e=estimated value due to incomplete record
DCBR – 14206443 – Dawson Creek at Brookwood Road near Hillsboro, Oregon [RM 0.7]
20092008
1/1
2/1
3/1
4/1
5/1
6/1
7/1
8/1
9/1
10/1
11/1
12/1
1/1
0
5
10
15
20
25
Mea
n D
aily
Tem
per
atu
re (
°C)
32
41
50
59
68
77
(°F
)
Oregon Temperature Guidelinefor Salmonid Rearing and Migration

APPENDIX F—Stream Temperature Records2009 Tualatin River Flow Management Report F-37
UNITED STATES DEPARTMENT OF THE INTERIOR – GEOLOGICAL SURVEY — OREGON WATER SCIENCE CENTERSTATION NUMBER 453030122560101 ROCK CREEK AT BROOKWOOD AVENUE, HILLSBORO, OR.
LATITUDE: 453029.5 LONGITUDE: 1225600.6
Day2009 Mean Daily Water Temperature in Degrees Celsius
JAN FEB MAR APR MAY JUN JUL AUG SEP OCT† NOV† DEC†
1 6.3 3.3 6.6 8.2 13.1 20.0 18.4 24.1 18.4 13.1 11.1 8.02 5.9 3.5 7.6 8.7 14.0 19.9 19.3 23.9 18.2 13.3 9.4 6.53 4.9 3.3 8.2 9.1 13.8 19.8 20.4 23.2 18.4 11.7 8.6 5.44 4.6 3.5 7.7 8.7 13.0 20.0 20.9 22.1 17.9 11.4 8.4 4.35 4.3 3.9 7.8 9.9 12.3 18.8 20.7 20.7 17.4 10.9 8.7 3.26 5.8 4.8 7.5 11.3 12.8 17.6 18.9 19.3 17.2 10.5 9.7 2.67 7.8 5.3 7.1 12.4 13.0 16.7 17.9 18.3 16.7 11.3 9.6 0.68 8.9 4.8 6.5 12.7 12.7 16.6 17.3 18.0 16.0 11.2 9.1 0.09 7.5 4.4 6.0 12.0 13.2 17.1 17.1 19.0 16.1 11.0 9.4 0.0
10 6.2 4.0 6.0 11.6 13.8 17.5 17.8 19.2 17.0 10.4 9.4 0.011 5.9 4.3 5.6 11.5 14.3 17.6 18.4 19.7 17.5 9.2 9.5 0.112 6.9 3.8 5.6 11.5 13.6 18.0 17.9 19.7 18.1 9.0 8.8 0.113 8.0 4.2 5.9 11.1 12.1 18.3 17.3 19.4 18.6 9.0 8.3 0.114 7.9 4.2 6.7 10.2 12.3 17.7 17.8 18.2 18.5 10.0 7.5 0.315 6.5 4.4 7.4 9.5 13.5 18.1 18.9 17.2 18.2 11.4 7.5 2.616 5.0 4.6 7.8 10.2 14.7 18.1 20.2 17.2 17.6 12.3 8.5 5.117 3.9 5.1 7.9 11.8 16.3 18.2 21.5 18.2 17.3 13.2 9.3 6.518 3.6 5.3 8.4 12.1 17.6 18.3 21.6 19.6 16.6 14.0 8.8 6.719 3.3 5.2 9.5 12.6 16.3 18.5 20.6 20.6 16.5 14.1 8.7 7.220 2.9 5.4 10.1 14.4 14.8 18.2 20.8 21.1 15.6 13.3 9.1 8.021 2.4 5.4 9.8 15.6 14.6 17.0 21.7 20.1 15.1 12.8 8.5 8.822 2.9 6.3 9.4 15.3 15.7 16.3 21.4 19.5 15.6 12.8 8.0 7.223 3.5 6.7 8.1 12.9 16.2 16.6 20.1 18.3 15.9 12.8 7.7 5.624 4.0 7.5 8.1 11.9 16.2 17.9 19.9 17.5 15.9 12.4 8.1 4.725 4.1 8.1 8.8 11.5 16.1 17.9 21.1 17.2 15.3 11.2 8.0 3.626 3.3 7.5 8.6 11.1 16.3 17.4 22.1 17.0 15.0 11.5 8.0 2.927 2.5 6.5 8.8 11.3 16.8 17.6 23.4 17.6 14.4 11.3 8.6 2.728 3.3 6.0 9.1 11.6 17.6 18.5 24.7 17.7 13.7 9.9 8.3 2.829 3.4 — 8.7 11.7 18.9 18.2 25.3 18.1 13.1 9.5 8.0 1.830 3.2 — 8.1 12.1 19.5 17.9 25.2 18.3 12.6 10.3 8.0 2.131 3.5 — 8.5 — 20.0 — 24.3 18.7 — 11.6 — 3.3
MEAN 4.9 5.0 7.8 11.5 15.0 18.0 20.4 19.3 16.5 11.5 8.7 3.6MAX 8.9 8.1 10.1 15.6 20.0 20.0 25.3 24.1 18.6 14.1 11.1 8.8MIN 2.4 3.3 5.6 8.2 12.1 16.3 17.1 17.0 12.6 9.0 7.5 0.0
† Provisional data–subject to revision
RCBR – Rock Creek at Brookwood Avenue, Hillsboro, Oregon [RM 2.4]
20092008
1/1
2/1
3/1
4/1
5/1
6/1
7/1
8/1
9/1
10/1
11/1
12/1
1/1
0
5
10
15
20
25
Mea
n D
aily
Tem
per
atu
re (
°C)
32
41
50
59
68
77
(°F
)
Oregon Temperature Guidelinefor Salmonid Rearing and Migration

APPENDIX F—Stream Temperature RecordsF-38 2009 Tualatin River Flow Management Report
RCTV – 14206450 – ROCK CREEK AT HWY 8 NEAR HILLSBORO, OREGON [RM 1.2]Latitude: 45 30 08 Longitude: 122 56 52 Source Agency: WEST Consultants for Clean Water Services
Day2009 Mean Daily Water Temperature in Degrees Celsius
JAN FEB MAR APR MAY JUN JUL AUG SEP OCT NOV DEC 1 13.1 20.1 18.3 24.1 18.5 13.1 2 14.1 19.9 19.2 23.9 18.1 13.4 3 14.0 19.7 20.3 23.3 18.4 11.9 4 13.1 20.1 20.8 22.2 17.9 11.4 5 12.5 18.9 20.8 20.9 17.6 10.9 6 13.0 17.7 19.4 19.6 17.3 10.5 7 13.2 16.8 17.9 18.4 16.8 11.1 8 12.9 16.6 17.5 17.9 16.1 11.3 9 13.3 17.0 17.1 18.7 16.1 11.010 13.9 17.5 17.7 19.0 17.0 10.611 14.4 17.6 18.3 19.6 17.5 9.512 13.8 17.9 18.2 19.6 18.0 8.913 12.4 18.4 17.2 19.5 18.6 9.014 12.4 17.8 17.6 18.3 18.5 10.115 13.5 17.8 18.7 17.3 18.2 11.416 14.7 18.3 20.0 17.1 17.8 12.217 16.3 18.2 21.2 18.0 17.2 13.318 17.6 18.2 21.6 19.4 16.6 14.119 16.6 18.5 20.7 20.5 16.7 14.120 14.9 18.3 20.6 21.0 15.6 13.621 14.6 17.2 21.5 20.3 15.1 13.022 15.6 16.4 21.5 19.5 15.4 12.823 16.1 16.3 20.4 18.6 15.8 12.924 16.2 17.8 19.8 17.6 15.9 12.625 16.1 18.0 20.7 17.3 15.4 11.526 16.3 17.3 21.9 16.9 15.0 11.627 16.7 17.6 23.0 17.4 14.5 11.528 17.4 18.4 24.4 17.8 13.8 e10.329 — 18.7 18.2 25.1 17.9 13.230 — 19.4 17.9 25.3 18.3 12.631 — — 19.9 — 24.4 18.7 — —
MEAN 15.1 18.0 20.4 19.3 16.5 e11.8MAX 19.9 20.1 25.3 24.1 18.6 e14.1MIN 12.4 16.3 17.1 16.9 12.6 e8.9e=estimated value due to incomplete record
RCTV – 14206450 – Rock Creek at Hwy 8 near Hillsboro, Oregon [RM 1.2]
20092008
1/1
2/1
3/1
4/1
5/1
6/1
7/1
8/1
9/1
10/1
11/1
12/1
1/1
0
5
10
15
20
25
Mea
n D
aily
Tem
per
atu
re (
°C)
32
41
50
59
68
77
(°F
)
Oregon Temperature Guidelinefor Salmonid Rearing and Migration

APPENDIX F—Stream Temperature Records2009 Tualatin River Flow Management Report F-39
FRMO – 14206500 – TUALATIN RIVER AT FARMINGTON, OREGON [RM 33.3]Latitude: 45 26 58 Longitude: 122 57 02 Source Agency: WEST Consultants for Clean Water Services
Day2009 Mean Daily Water Temperature in Degrees Celsius
JAN FEB MAR APR MAY JUN JUL AUG SEP OCT NOV DEC 1 11.8 19.2 19.7 21.7 18.2 15.5 2 12.7 19.1 20.1 21.2 18.5 15.5 3 13.0 19.1 20.2 20.6 19.0 15.0 4 12.3 19.5 20.2 20.0 18.9 14.9 5 12.0 19.0 20.1 19.6 18.4 14.5 6 11.5 18.1 19.0 19.0 17.7 14.2 7 12.0 17.2 17.7 18.0 16.9 14.6 8 11.5 16.8 16.9 17.3 16.2 14.5 9 11.2 17.0 16.4 17.4 16.3 14.610 11.7 17.5 17.2 17.5 17.1 14.511 12.1 17.9 17.6 17.9 18.1 13.912 12.1 18.5 17.6 18.4 19.0 13.513 11.5 18.9 16.7 18.5 19.5 13.214 11.1 18.7 16.3 17.2 19.5 13.415 11.0 18.7 17.0 17.1 19.4 13.116 12.3 18.4 18.5 17.2 18.9 13.917 13.4 18.0 19.8 17.8 18.3 14.618 14.5 18.5 20.6 18.8 17.5 15.019 14.9 18.9 20.6 20.1 17.3 15.420 14.2 18.4 20.5 21.0 16.9 15.421 13.4 17.6 20.7 20.8 16.6 15.322 13.7 17.0 20.8 19.7 16.6 14.923 14.5 16.7 20.5 18.5 17.1 14.724 15.1 17.8 19.3 17.7 17.5 14.025 15.2 18.6 19.3 17.3 17.3 13.526 15.2 18.6 19.9 17.4 17.1 13.627 15.5 18.9 20.4 18.4 16.9 12.928 16.1 19.4 21.1 18.5 16.5 12.329 — 17.0 19.4 22.0 18.3 15.8 12.030 — 17.9 19.4 22.6 18.1 15.4 11.431 — — 18.8 — 22.3 18.1 — 11.9 —
MEAN 13.5 18.4 19.4 18.7 17.6 14.1MAX 18.8 19.5 22.6 21.7 19.5 15.5MIN 11.0 16.7 16.3 17.1 15.4 11.4
FRMO – 14206500 – Tualatin River at Farmington, Oregon [RM 33.3]
20092008
1/1
2/1
3/1
4/1
5/1
6/1
7/1
8/1
9/1
10/1
11/1
12/1
1/1
0
5
10
15
20
25
Mea
n D
aily
Tem
per
atu
re (
°C)
32
41
50
59
68
77
(°F
)
Oregon Temperature Guidelinefor Salmonid Rearing and Migration

APPENDIX F—Stream Temperature RecordsF-40 2009 Tualatin River Flow Management Report
BCHH – BURRIS CREEK AT HWY 219 [RM 0.38]Latitude: 45 25 34 Longitude: 122 57 40 Source Agency: WEST Consultants for Clean Water Services
Day2009 Mean Daily Water Temperature in Degrees Celsius
JAN FEB MAR APR MAY JUN JUL AUG SEP OCT NOV DEC 1 11.3 17.9 16.9 21.1 16.4 12.0 2 12.6 18.0 17.2 20.9 16.3 12.1 3 12.4 18.2 17.7 20.6 16.3 11.3 4 11.7 18.3 18.0 20.0 16.0 11.2 5 11.9 17.4 18.3 19.2 15.9 10.5 6 12.3 16.4 17.8 18.4 15.8 10.0 7 11.6 15.8 17.2 17.8 15.7 10.0 8 11.1 15.7 16.8 17.3 15.2 9.7 9 11.5 16.0 16.6 17.5 14.9 9.610 12.1 16.3 16.9 17.3 14.9 9.411 12.6 16.5 17.0 17.5 15.0 8.812 12.2 16.9 16.8 17.8 15.2 8.513 10.8 17.0 16.6 17.8 15.5 8.314 11.4 16.6 16.5 17.1 15.7 8.815 12.5 16.8 16.8 16.3 15.8 10.116 13.0 16.9 17.7 15.9 15.6 10.817 14.2 16.9 18.1 16.0 15.3 11.318 15.3 17.0 18.9 16.4 14.9 11.919 15.1 17.4 18.3 17.0 14.7 12.420 13.7 17.0 18.3 17.4 14.1 12.221 13.4 16.1 18.5 17.5 13.7 11.922 14.1 15.7 18.5 17.5 13.5 11.623 14.5 15.7 18.3 16.9 13.4 11.624 14.5 16.3 18.1 16.2 13.5 11.325 14.3 16.7 18.3 15.6 13.3 10.526 14.5 16.4 18.6 15.2 13.2 10.627 15.1 16.4 19.3 15.1 13.2 10.428 15.6 16.8 20.0 14.9 12.6 9.729 — 16.5 16.8 20.6 15.2 12.3 9.530 — 17.3 16.7 21.1 15.8 11.9 10.331 — — 17.7 — 21.1 16.3 — 11.1 —
MEAN 13.4 16.8 18.1 17.3 14.7 10.6MAX 17.7 18.3 21.1 21.1 16.4 12.4MIN 10.8 15.7 16.5 14.9 11.9 8.3
BCHH – Burris Creek at Hwy 219 [RM 0.38]
20092008
1/1
2/1
3/1
4/1
5/1
6/1
7/1
8/1
9/1
10/1
11/1
12/1
1/1
0
5
10
15
20
25
Mea
n D
aily
Tem
per
atu
re (
°C)
32
41
50
59
68
77
(°F
)
Oregon Temperature Guidelinefor Salmonid Rearing and Migration

APPENDIX F—Stream Temperature Records2009 Tualatin River Flow Management Report F-41
MCFE – 14206670 – MCFEE CREEK AT HWY 219 NEAR SCHOLLS, OREGON [RM 0.8]Latitude: 45 24 19 Longitude: 122 56 19 Source Agency: WEST Consultants for Clean Water Services
Day2009 Mean Daily Water Temperature in Degrees Celsius
JAN FEB MAR APR MAY JUN JUL AUG SEP OCT NOV DEC 1 10.9 17.4 16.7 22.6 17.5 12.4 2 12.0 17.2 17.4 22.3 17.2 12.8 3 11.4 17.3 18.4 21.6 17.3 11.6 4 10.6 17.8 19.0 20.6 16.8 10.9 5 10.5 16.6 18.9 19.5 16.7 10.1 6 10.7 15.2 17.8 18.4 16.3 9.5 7 10.2 14.6 16.2 17.3 15.6 9.9 8 9.9 14.8 15.8 16.6 14.9 10.2 9 10.3 15.3 15.8 17.5 14.8 10.210 10.8 15.9 16.4 17.7 15.6 9.711 11.6 16.3 17.1 18.5 16.2 8.612 11.0 16.3 16.8 18.9 16.6 8.113 9.7 16.7 16.2 18.2 17.2 8.114 10.5 16.1 16.6 16.9 17.2 9.115 11.5 16.2 17.3 16.0 17.0 10.316 12.2 16.4 18.4 15.7 16.7 11.117 13.6 16.5 19.5 16.5 16.2 11.918 14.6 16.6 19.9 17.9 15.3 12.519 14.0 17.2 19.2 18.9 15.2 12.820 12.2 16.5 19.2 19.5 14.6 12.321 12.3 15.2 19.9 18.9 14.1 12.122 13.3 14.8 20.1 18.3 14.0 11.823 13.7 15.1 19.2 17.4 14.2 11.924 13.6 16.5 18.7 16.4 14.6 11.225 13.4 16.7 19.3 16.0 14.4 10.426 13.7 15.9 20.4 15.7 14.1 10.727 14.4 15.9 21.5 16.1 13.5 10.428 15.1 16.7 22.8 16.3 12.8 9.129 — 16.2 16.7 23.3 16.3 12.4 9.030 — 16.9 16.3 23.4 17.0 12.2 10.131 — — 17.3 — 22.7 17.5 — 11.0 —
MEAN 12.5 16.2 18.8 18.0 15.4 10.6MAX 17.3 17.8 23.4 22.6 17.5 12.8MIN 9.7 14.6 15.8 15.7 12.2 8.1
MCFE – 14206670 – McFee Creek at Hwy 219 near Scholls, Oregon [RM 0.8]
20092008
1/1
2/1
3/1
4/1
5/1
6/1
7/1
8/1
9/1
10/1
11/1
12/1
1/1
0
5
10
15
20
25
Mea
n D
aily
Tem
per
atu
re (
°C)
32
41
50
59
68
77
(°F
)
Oregon Temperature Guidelinefor Salmonid Rearing and Migration

APPENDIX F—Stream Temperature RecordsF-42 2009 Tualatin River Flow Management Report
UNITED STATES DEPARTMENT OF THE INTERIOR – GEOLOGICAL SURVEY — OREGON WATER SCIENCE CENTERSTATION NUMBER 14206694 TUALATIN RIVER AT RIVER MILE 24.5, NR SCHOLLS, OR
LATITUDE: 452406 LONGITUDE: 1225338
Day2009 Mean Daily Water Temperature in Degrees Celsius
JAN FEB MAR APR MAY JUN JUL AUG SEP OCT† NOV† DEC1 12.2 19.5 20.3 24.0 18.8 14.9 11.32 12.6 19.7 20.7 23.6 18.5 15.1 11.03 13.2 19.7 21.4 22.9 18.7 14.5 10.54 12.9 20.0 21.9 22.2 18.9 13.9 10.35 12.3 19.6 21.8 21.3 18.8 13.6 10.26 12.0 18.6 21.0 20.4 18.4 13.4 10.47 11.9 17.9 19.7 19.4 17.6 13.4 10.58 12.0 17.6 18.4 18.6 16.7 13.5 10.19 11.6 17.5 17.8 18.4 16.4 13.6 9.4
10 11.8 17.7 17.6 18.4 16.6 13.3 9.311 12.3 18.0 18.0 18.6 17.1 13.0 9.512 12.3 18.4 18.3 18.7 17.9 12.6 9.313 12.0 18.9 17.8 18.6 18.7 12.3 9.014 11.6 18.8 17.6 18.4 19.1 12.5 8.515 11.4 19.0 17.8 17.4 19.3 12.9 8.216 12.1 19.4 18.4 17.1 19.2 13.1 8.317 13.3 19.0 19.6 17.7 18.8 13.5 8.618 14.5 18.7 20.7 18.6 18.1 14.1 9.019 15.1 19.1 21.3 19.6 17.8 14.5 8.820 14.8 19.1 21.7 20.4 17.0 14.4 8.421 14.2 18.4 22.0 20.9 16.5 14.622 14.0 17.8 22.2 20.9 16.5 14.523 14.6 17.7 21.8 20.4 16.4 14.424 15.2 18.1 21.5 19.3 16.6 13.725 15.6 18.6 21.4 18.4 16.7 13.326 15.7 18.7 21.3 17.8 16.8 12.927 16.0 19.2 21.8 17.9 16.6 12.628 16.4 19.8 22.5 18.2 16.1 12.029 — 17.2 20.0 23.0 18.6 15.7 11.530 — 18.0 20.1 23.5 18.7 15.2 11.631 — — 18.9 — 23.8 18.9 — 11.4 —
MEAN 13.9 18.8 20.5 19.5 17.5 13.4 e9.6MAX 18.9 20.1 23.8 24.0 19.3 15.1 e11.3MIN 11.4 17.5 17.6 17.1 15.2 11.4 e8.2
† Provisional data–subject to revision; estimated value
NEAL – 14206694 – Tualatin River at River Mile 24.5 near Scholls, OR [RM 24.5]
20092008
1/1
2/1
3/1
4/1
5/1
6/1
7/1
8/1
9/1
10/1
11/1
12/1
1/1
0
5
10
15
20
25
Mea
n D
aily
Tem
per
atu
re (
°C)
32
41
50
59
68
77
(°F
)
Oregon Temperature Guidelinefor Salmonid Rearing and Migration

APPENDIX F—Stream Temperature Records2009 Tualatin River Flow Management Report F-43
ELSN – 14206600 – TUALATIN RIVER AT ELSNER ROAD NEAR SHERWOOD, OREGON [RM 16.2]Latitude: 45 23 17 Longitude: 122 51 03 Source Agency: WEST Consultants for Clean Water Services
Day2009 Mean Daily Water Temperature in Degrees Celsius
JAN FEB MAR APR MAY JUN JUL AUG SEP OCT NOV DEC 1 12.3 19.7 21.0 25.4 19.9 15.9 2 12.7 20.1 21.4 25.5 20.0 15.6 3 13.0 20.5 22.0 25.4 20.0 15.0 4 13.4 20.8 22.5 25.2 20.0 14.6 5 12.9 20.5 22.8 24.6 19.7 14.3 6 12.6 19.9 22.7 23.6 19.4 14.0 7 12.1 19.4 22.2 22.5 19.1 13.8 8 12.4 19.0 21.5 21.6 18.5 13.7 9 12.1 18.8 20.8 21.1 18.0 13.610 11.9 18.8 20.2 20.8 17.8 13.411 12.4 18.7 19.9 20.8 18.0 13.012 12.8 18.9 19.6 20.6 18.1 12.813 12.4 19.1 19.0 20.2 18.5 12.514 12.2 19.2 19.2 19.7 18.6 12.515 12.2 19.5 19.7 19.2 19.0 12.716 12.1 19.9 20.0 19.1 19.4 13.117 13.4 20.0 20.5 19.0 19.5 13.618 14.4 20.2 21.0 19.2 19.4 13.819 15.2 20.3 21.5 19.8 19.3 13.920 15.2 20.1 22.0 20.4 18.7 14.221 15.2 19.6 22.9 20.8 18.1 14.322 15.0 19.4 23.4 20.9 17.7 14.323 15.0 19.1 23.5 21.1 17.5 14.324 15.4 19.3 23.3 21.2 17.3 14.125 16.0 19.5 23.4 21.0 17.2 13.826 16.4 19.4 23.7 20.5 17.1 13.427 16.6 19.6 24.1 20.0 16.9 13.028 17.1 20.1 24.4 19.8 16.8 12.329 — 17.7 20.5 24.6 19.5 16.6 12.230 — 18.3 20.7 25.0 19.4 16.1 12.031 — — 19.0 — 25.1 19.5 — 12.0 —
MEAN 14.2 19.7 22.0 21.2 18.4 13.6MAX 19.0 20.8 25.1 25.5 20.0 15.9MIN 11.9 18.7 19.0 19.0 16.1 12.0
ELSN – 14206600 – Tualatin River at Elsner Road near Sherwood, Oregon [RM 16.2]
20092008
1/1
2/1
3/1
4/1
5/1
6/1
7/1
8/1
9/1
10/1
11/1
12/1
1/1
0
5
10
15
20
25
Mea
n D
aily
Tem
per
atu
re (
°C)
32
41
50
59
68
77
(°F
)
Oregon Temperature Guidelinefor Salmonid Rearing and Migration

APPENDIX F—Stream Temperature RecordsF-44 2009 Tualatin River Flow Management Report
CCKR – CHICKEN CREEK AT KRUGER ROAD [RM 4.5]Latitude: 45 22 05 Longitude: 122 51 22 Source Agency: WEST Consultants for Clean Water Services
Day2009 Mean Daily Water Temperature in Degrees Celsius
JAN FEB MAR APR MAY JUN JUL AUG SEP OCT NOV DEC 1 11.0 16.4 15.5 20.1 16.3 11.9 2 12.0 16.6 16.5 20.2 15.9 12.1 3 11.2 16.8 17.4 19.3 15.8 9.8 4 10.6 17.0 17.5 18.0 15.5 10.0 5 10.9 15.4 17.1 16.9 15.3 9.3 6 10.7 14.4 15.5 16.3 14.9 8.8 7 10.5 14.1 14.9 15.9 14.3 10.0 8 10.5 14.3 15.1 15.8 13.5 9.8 9 11.0 14.6 15.2 17.1 14.1 9.610 11.1 14.9 16.0 16.7 15.5 8.611 11.9 15.2 16.3 17.4 15.8 7.612 10.8 15.5 15.5 17.9 16.1 6.613 9.4 15.6 15.3 16.4 16.6 7.414 11.6 14.7 15.7 15.2 16.1 9.715 11.7 15.4 16.4 14.6 15.7 10.816 12.6 15.5 17.2 14.6 15.6 11.617 13.8 15.6 18.4 16.1 14.8 12.518 14.5 15.8 18.5 17.4 13.8 12.619 13.0 16.0 17.3 18.2 14.4 12.120 11.4 14.9 17.7 18.2 13.1 11.321 12.4 13.9 18.6 16.9 13.4 11.422 13.3 13.6 18.2 16.5 13.8 10.923 13.3 14.4 17.2 15.3 13.9 11.524 13.0 15.6 16.9 14.8 14.2 9.725 13.1 15.1 18.2 14.7 13.6 9.026 13.4 14.4 19.1 14.5 13.1 10.527 14.0 14.8 20.4 15.3 12.5 9.128 14.7 15.8 21.5 15.4 12.2 7.729 — 15.8 15.1 21.9 16.0 11.7 8.730 — 16.1 14.8 21.5 16.4 11.0 10.831 — — 16.5 — 19.9 16.6 — 11.3 —
MEAN 12.4 15.2 17.5 16.6 14.4 10.1MAX 16.5 17.0 21.9 20.2 16.6 12.6MIN 9.4 13.6 14.9 14.5 11.0 6.6
CCKR – Chicken Creek at Kruger Road [RM 4.5]
20092008
1/1
2/1
3/1
4/1
5/1
6/1
7/1
8/1
9/1
10/1
11/1
12/1
1/1
0
5
10
15
20
25
Mea
n D
aily
Tem
per
atu
re (
°C)
32
41
50
59
68
77
(°F
)
Oregon Temperature Guidelinefor Salmonid Rearing and Migration

APPENDIX F—Stream Temperature Records2009 Tualatin River Flow Management Report F-45
CCER – 14206748 – CEDAR CREEK AT EDY ROAD NEAR SHERWOOD, OREGON [RM 0.62]Latitude: 45 22 05 Longitude: 122 51 22 Source Agency: WEST Consultants for Clean Water Services
Day2009 Mean Daily Water Temperature in Degrees Celsius
JAN FEB MAR APR MAY JUN JUL AUG SEP OCT NOV DEC 1 12.7 19.2 16.6 20.4 16.4 12.8 2 13.6 18.8 16.8 20.5 16.3 12.9 3 13.1 18.7 17.4 20.1 16.3 11.9 4 12.4 19.3 17.9 19.6 16.1 11.8 5 11.9 18.1 18.2 18.9 16.4 10.9 6 12.2 16.9 17.8 18.3 16.3 10.3 7 11.9 16.3 17.2 17.9 16.0 10.5 8 11.7 16.3 16.8 17.2 15.2 10.4 9 12.1 16.6 16.6 17.5 14.9 10.310 12.4 17.0 16.5 17.1 15.3 10.011 13.0 16.9 16.7 17.5 15.4 9.612 12.7 17.0 16.8 18.6 15.7 9.413 11.2 17.4 16.5 18.2 16.3 9.714 12.1 17.1 16.6 17.5 16.5 11.015 13.3 16.9 17.0 16.7 16.4 11.616 14.0 17.5 17.6 16.2 16.1 11.917 15.2 17.5 18.2 16.2 16.1 13.018 16.4 17.6 18.5 16.7 15.1 13.819 15.7 18.0 18.3 17.1 15.2 13.520 14.0 17.5 18.2 17.7 14.7 13.021 14.0 16.5 18.5 17.7 14.3 12.722 15.0 16.0 18.7 17.5 14.1 12.423 15.6 15.9 18.4 16.9 14.0 12.524 15.7 16.7 17.9 16.3 14.1 11.825 15.6 17.2 18.2 16.0 14.0 11.126 15.8 16.8 18.8 15.5 13.7 11.627 16.3 16.6 19.2 15.4 13.3 11.028 16.9 17.2 19.7 15.5 13.1 10.029 — 17.8 17.2 20.2 16.0 13.0 9.730 — 18.5 16.9 20.5 16.3 12.6 10.531 — — 18.9 — 20.4 16.3 — 11.5 —
MEAN 14.2 17.3 18.0 17.4 15.1 11.4MAX 18.9 19.3 20.5 20.5 16.5 13.8MIN 11.2 15.9 16.5 15.4 12.6 9.4
CCER – 14206748 – Cedar Creek at Edy Road near Sherwood, Oregon [RM 0.62]
20092008
1/1
2/1
3/1
4/1
5/1
6/1
7/1
8/1
9/1
10/1
11/1
12/1
1/1
0
5
10
15
20
25
Mea
n D
aily
Tem
per
atu
re (
°C)
32
41
50
59
68
77
(°F
)
Oregon Temperature Guidelinefor Salmonid Rearing and Migration

APPENDIX F—Stream Temperature RecordsF-46 2009 Tualatin River Flow Management Report
UNITED STATES DEPARTMENT OF THE INTERIOR – GEOLOGICAL SURVEY — OREGON WATER SCIENCE CENTERSTATION NUMBER 452230122512201* CHICKEN CREEK AT ROY ROGERS ROAD, SHERWOOD OR
LATITUDE: 452230.09 LONGITUDE: 1225121.76
Day2009 Mean Daily Water Temperature in Degrees Celsius
JAN FEB MAR APR MAY JUN JUL AUG SEP OCT† NOV† DEC1 13.1 18.6 17.1 22.0 17.1 12.6 10.52 13.3 18.4 17.6 21.6 16.9 12.7 9.13 12.7 18.4 18.4 21.1 17.0 11.4 8.44 12.0 18.9 18.9 20.3 16.6 11.3 8.15 11.6 17.8 18.9 19.4 16.6 10.4 8.26 11.9 16.5 18.1 18.6 16.3 9.9 9.27 11.5 15.7 17.3 17.9 15.9 10.3 8.98 11.4 15.9 17.0 17.3 15.2 10.2 9.09 11.8 16.2 16.7 18.1 15.0 10.0 8.9
10 12.1 16.7 17.0 17.8 15.7 9.5 8.811 12.8 16.7 17.3 18.4 16.0 8.8 8.912 12.4 16.8 17.0 18.8 16.2 8.6 8.413 10.7 17.1 16.5 18.4 16.6 9.2 7.914 11.7 16.8 16.8 17.4 16.7 10.0 7.115 12.9 16.7 17.3 16.6 16.7 10.7 7.416 13.6 17.0 18.2 16.3 16.3 11.2 8.117 14.9 17.2 19.3 16.9 16.2 12.3 9.118 16.2 17.4 19.4 17.7 15.2 13.1 8.419 15.5 17.8 19.1 18.1 15.1 13.0 8.520 13.6 17.2 19.2 18.5 14.6 12.4 8.821 13.5 16.1 19.7 18.1 14.2 12.4 8.122 14.6 15.6 19.6 17.9 14.2 11.9 7.923 15.2 15.7 19.0 17.3 14.1 12.1 7.724 15.3 16.6 18.7 16.5 14.2 11.3 7.925 15.2 17.0 19.2 16.2 14.0 10.426 15.3 16.7 19.9 15.8 13.7 11.127 15.8 16.7 20.8 15.8 13.3 10.628 16.5 17.3 21.7 16.0 12.8 9.429 — 17.5 17.2 22.4 16.4 12.6 9.530 — 18.1 17.0 22.4 16.8 12.2 10.331 — — 18.5 — 21.8 17.0 — 11.2 —
MEAN 13.9 17.0 18.8 17.9 15.2 10.9 e8.5MAX 18.5 18.9 22.4 22.0 17.1 13.1 e10.5MIN 10.7 15.6 16.5 15.8 12.2 8.6 e7.1
† Provisional data–subject to revision; estimated value
CCSR – 452230122512201* – Chicken Creek at Roy Rogers Road near Sherwood, Oregon [RM 2.3]
20092008
*USGS #452230122512201 is equivalent to OWRD #14206750.
1/1
2/1
3/1
4/1
5/1
6/1
7/1
8/1
9/1
10/1
11/1
12/1
1/1
0
5
10
15
20
25
Mea
n D
aily
Tem
per
atu
re (
°C)
32
41
50
59
68
77
(°F
)
Oregon Temperature Guidelinefor Salmonid Rearing and Migration

APPENDIX F—Stream Temperature Records2009 Tualatin River Flow Management Report F-47
SCRL – 14206905 – SYLVAN CREEK AT RALEIGHWOOD LANE NEAR WEST SLOPE, OREGON [RM 1.0]Latitude: 45 29 35 Longitude: 122 44 48 Source Agency: WEST Consultants for Clean Water Services
Day2009 Mean Daily Water Temperature in Degrees Celsius
JAN FEB MAR APR MAY JUN JUL AUG SEP OCT NOV DEC 1 20.7 16.5 12.3 2 20.5 16.2 12.5 3 19.7 16.4 10.8 4 18.7 15.9 10.7 5 17.6 15.6 10.4 6 16.3 15.1 10.2 7 15.9 14.6 11.0 8 16.1 14.3 11.1 9 17.1 14.5 11.010 17.0 15.8 10.211 17.6 16.5 8.912 17.8 17.0 8.513 16.2 17.1 8.314 15.0 16.6 9.715 e18.2 14.5 16.5 11.016 17.5 14.9 16.2 11.817 18.3 16.3 15.7 12.718 18.1 17.7 14.7 12.819 16.9 18.5 15.1 12.520 17.7 18.6 13.8 12.121 18.7 17.1 14.1 11.922 18.2 16.7 15.7 11.823 16.9 15.4 15.7 11.924 16.9 15.0 15.2 10.925 18.3 14.9 14.7 10.026 19.1 14.9 14.3 10.627 20.3 15.9 13.9 9.528 21.6 16.1 13.5 8.529 — 22.0 16.4 12.6 8.830 — 21.6 16.7 11.9 10.731 — — — 20.6 16.9 — 11.3 —
MEAN e18.9 16.9 15.2 10.8MAX e22.0 20.7 17.1 12.8MIN e16.9 14.5 11.9 8.3e=estimated value due to incomplete record
SCRL – 14206905 – Sylvan Creek at Raleighwood Lane near West Slope, Oregon [RM 1.0]
20092008
1/1
2/1
3/1
4/1
5/1
6/1
7/1
8/1
9/1
10/1
11/1
12/1
1/1
0
5
10
15
20
25
Mea
n D
aily
Tem
per
atu
re (
°C)
32
41
50
59
68
77
(°F
)
Oregon Temperature Guidelinefor Salmonid Rearing and Migration

APPENDIX F—Stream Temperature RecordsF-48 2009 Tualatin River Flow Management Report
ASMP – 14206933 – ASH CREEK AT METZGER PARK AT METZGER, OREGON [RM 1.25]Latitude: 45 27 00 Longitude: 122 45 45 Source Agency: WEST Consultants for Clean Water Services
Day2009 Mean Daily Water Temperature in Degrees Celsius
JAN FEB MAR APR MAY JUN JUL AUG SEP OCT NOV DEC 1 17.7 13.2 2 17.2 13.3 3 17.5 11.3 4 16.9 11.1 5 17.0 10.6 6 e17.2 16.5 9.8 7 17.2 16.1 10.7 8 17.7 15.3 10.5 9 19.3 15.7 10.410 18.6 16.9 10.111 19.4 17.2 9.012 19.5 17.9 8.513 18.3 18.4 8.214 17.2 17.9 10.115 e18.9 16.6 17.7 11.416 18.8 16.5 17.6 12.117 19.8 17.6 17.1 13.618 19.8 18.8 15.6 14.019 18.5 19.7 16.4 13.620 18.8 20.0 14.8 12.921 19.8 18.9 13.8 12.722 19.7 18.3 14.9 12.323 18.6 17.1 15.2 12.724 18.1 16.2 15.2 11.325 19.2 16.3 14.7 10.226 20.2 15.9 14.1 11.427 21.2 16.7 13.3 10.228 22.1 17.3 13.7 8.829 — e22.3 17.8 13.0 9.430 — 17.9 12.7 11.431 — — — 17.9 — 12.3 —
MEAN e19.6 e17.9 15.9 11.2MAX e22.1 e20.0 18.4 14.0MIN e18.1 e15.9 12.7 8.2e=estimated value due to incomplete record
ASMP – 14206933 – Ash Creek at Metzger Park at Metzger, Oregon [RM 1.25]
20092008
1/1
2/1
3/1
4/1
5/1
6/1
7/1
8/1
9/1
10/1
11/1
12/1
1/1
0
5
10
15
20
25
Mea
n D
aily
Tem
per
atu
re (
°C)
32
41
50
59
68
77
(°F
)
Oregon Temperature Guidelinefor Salmonid Rearing and Migration

APPENDIX F—Stream Temperature Records2009 Tualatin River Flow Management Report F-49
UNITED STATES DEPARTMENT OF THE INTERIOR – GEOLOGICAL SURVEY — OREGON WATER SCIENCE CENTERSTATION NUMBER 14206800 TUALATIN RIVER AT RM 9.9 NEAR TUALATIN, OR
LATITUDE: 452338 LONGITUDE: 1224612 Water Temperature, degrees Celsius, Calendar Year January to December 2009 Daily Mean Values
Day JAN FEB MAR APR MAY JUN JUL AUG SEP OCT NOV DEC1 19.5 20.3 19.5 15.72 19.5 20.8 19.4 15.63 19.9 21.4 19.5 15.14 20.4 21.9 19.5 14.75 20.1 22.2 19.4 14.26 19.7 21.6 19.27 19.3 21.3 18.98 19.0 21.1 18.59 19.1 21.0 18.4
10 18.8 20.9 18.211 18.7 20.7 18.312 18.7 20.0 18.413 18.7 19.2 18.414 18.6 19.0 19.7 18.415 18.9 19.3 19.1 18.516 19.2 20.0 18.8 18.517 19.5 20.6 19.0 18.518 19.8 21.0 19.6 18.519 20.0 21.1 20.1 18.620 19.7 21.3 20.3 18.421 19.4 21.9 20.0 18.222 19.0 21.9 20.0 18.223 19.0 20.0 17.924 19.6 20.0 17.625 19.3 19.9 17.426 19.1 20.0 17.127 19.5 20.3 16.728 19.8 20.2 16.429 — 20.0 20.1 16.130 — 20.1 19.9 15.831 — — — 19.6 — —
MEAN 19.4 e20.8 e19.8 18.2 e15.3MAX 20.4 e22.2 e20.3 19.5 e15.7MIN 18.6 e19.0 e18.8 15.8 e14.7
TRCP – 14206800 – Tualatin River at RM 9.9 near Tualatin, Oregon [RM 9.9]
20092008
1/1
2/1
3/1
4/1
5/1
6/1
7/1
8/1
9/1
10/1
11/1
12/1
1/1
0
5
10
15
20
25
Mea
n D
aily
Tem
per
atu
re (
°C)
32
41
50
59
68
77
(°F
)
Oregon Temperature Guidelinefor Salmonid Rearing and Migration

APPENDIX F—Stream Temperature RecordsF-50 2009 Tualatin River Flow Management Report
UNITED STATES DEPARTMENT OF THE INTERIOR – GEOLOGICAL SURVEY — OREGON WATER SCIENCE CENTERSTATION NUMBER 14206950 FANNO CREEK AT DURHAM, OR
LATITUDE: 452413 LONGITUDE: 1224513 Water Temperature, degrees Celsius, Calendar Year January to December 2009 Daily Mean Values
Day JAN FEB MAR APR MAY JUN JUL AUG SEP OCT† NOV† DEC†
1 6.9 4.2 7.0 8.1 13.3 20.2 18.5 24.2 18.7 13.6 11.4 8.32 6.1 4.2 7.6 8.6 13.8 19.4 19.3 23.8 18.6 13.8 9.8 6.83 5.8 4.1 8.1 9.4 13.3 19.6 20.5 23.1 18.8 12.4 9.0 5.54 5.3 4.5 8.0 9.3 12.8 19.9 21.1 22.4 18.3 11.9 8.9 4.75 4.9 5.0 7.9 10.5 12.2 18.6 20.9 21.1 17.4 11.5 9.2 3.76 7.3 5.8 7.6 11.9 12.7 17.4 19.0 19.9 17.3 11.1 9.9 2.97 9.2 6.3 7.2 12.7 12.8 16.8 17.8 18.5 17.0 11.7 9.4 1.08 9.3 5.9 6.8 12.8 13.1 16.8 17.6 18.4 16.3 11.8 9.2 0.29 7.8 5.2 6.3 12.2 13.7 17.3 17.5 19.2 16.4 11.5 9.6 0.2
10 6.6 4.4 6.0 11.8 14.1 17.1 18.1 19.5 17.4 11.1 9.6 0.211 7.1 4.4 5.9 11.7 14.6 17.4 18.7 20.4 17.9 10.1 9.7 0.212 8.2 4.3 5.8 11.7 14.0 17.7 18.1 20.1 18.5 9.6 8.6 0.613 8.7 4.6 6.3 11.0 12.2 17.9 17.2 19.6 18.9 9.4 8.4 1.214 8.2 4.6 7.2 10.2 12.6 18.7 18.0 18.4 18.4 10.5 7.7 2.315 6.9 5.1 7.3 9.7 13.7 18.7 19.1 17.4 18.3 11.5 7.9 4.216 5.5 5.5 7.8 10.6 14.9 18.6 20.2 17.2 18.2 12.4 8.7 6.617 4.6 6.0 8.0 11.8 16.4 18.4 21.5 18.2 17.7 14.1 9.5 7.418 4.0 6.1 8.8 12.1 17.6 18.8 21.8 19.5 16.9 14.6 8.9 7.419 3.7 6.2 9.8 12.8 16.1 18.7 21.0 20.5 16.9 14.3 8.8 8.220 3.6 6.4 10.4 14.5 14.9 17.8 21.0 21.0 16.1 13.8 9.1 8.821 3.4 6.5 10.2 15.7 14.9 16.6 21.9 20.0 15.7 13.2 8.4 9.322 3.9 6.9 9.7 15.1 15.9 16.4 21.9 19.4 16.5 13.1 8.0 7.623 4.2 7.1 8.4 12.9 16.5 16.8 20.8 18.6 16.6 13.1 8.0 6.024 4.5 7.7 8.5 12.0 16.6 18.0 20.2 17.9 16.2 12.5 8.6 5.325 4.6 8.3 8.9 11.6 16.6 18.0 21.0 17.5 15.7 11.3 8.5 4.226 3.4 7.6 8.8 11.5 16.7 17.4 22.1 17.2 15.5 12.0 8.5 3.227 3.0 6.7 9.1 11.4 17.2 18.0 23.3 17.8 14.9 11.3 9.0 3.028 4.0 6.5 9.2 11.5 18.0 18.7 24.4 18.2 14.5 10.0 8.6 3.129 4.3 — 8.5 11.6 19.1 18.5 24.8 18.3 13.8 9.6 8.4 2.330 4.2 — 8.3 12.1 19.8 18.2 24.8 18.3 13.2 10.8 8.4 3.131 4.4 — 8.6 — 20.2 — 24.1 18.6 — 12.1 — 4.2
MEAN 5.6 5.8 8.0 11.7 15.3 18.1 20.5 19.6 16.9 11.9 8.9 4.2MAX 9.3 8.3 10.4 15.7 20.2 20.2 24.8 24.2 18.9 14.6 11.4 9.3MIN 3.0 4.1 5.8 8.1 12.2 16.4 17.2 17.2 13.2 9.4 7.7 0.2
† Provisional data–subject to revision
FANO – 14206950 – Fanno Creek at Durham Road near Tigard, Oregon [RM 1.2]
20092008
1/1
2/1
3/1
4/1
5/1
6/1
7/1
8/1
9/1
10/1
11/1
12/1
1/1
0
5
10
15
20
25
Mea
n D
aily
Tem
per
atu
re (
°C)
32
41
50
59
68
77
(°F
)
Oregon Temperature Guidelinefor Salmonid Rearing and Migration

APPENDIX F—Stream Temperature Records2009 Tualatin River Flow Management Report F-51
HCTP – 14206958 – HEDGES CREEK AT TUALATIN COMMUNITY PARK AT TUALATIN, OREGON [RM 0.3]Latitude: 45 23 08 Longitude: 122 45 37 Source Agency: WEST Consultants for Clean Water Services
Day2009 Mean Daily Water Temperature in Degrees Celsius
JAN FEB MAR APR MAY JUN JUL AUG SEP OCT NOV DEC 1 15.4 20.1 17.4 21.6 17.1 12.3 2 15.8 20.6 18.3 21.7 16.6 12.8 3 15.6 19.6 19.6 21.0 16.7 12.0 4 14.0 20.1 20.1 20.2 16.4 11.7 5 12.8 18.6 20.0 19.3 16.7 11.1 6 14.1 17.5 18.1 18.8 17.0 10.1 7 14.5 17.4 17.4 17.9 17.5 10.4 8 15.5 18.0 17.3 17.3 16.7 10.6 9 16.9 17.1 17.2 18.0 16.9 10.410 16.8 17.7 17.8 17.6 17.4 9.911 17.1 18.4 18.3 18.3 17.0 8.912 15.4 17.6 17.6 18.8 17.3 8.413 13.0 17.8 16.6 18.7 17.8 8.514 15.0 17.8 16.8 17.1 17.4 10.615 16.9 19.3 17.5 16.3 17.2 11.516 18.8 18.9 18.5 15.8 17.2 12.017 20.5 18.6 19.7 16.3 16.8 14.018 21.2 18.5 20.0 17.3 15.5 14.919 18.5 19.4 18.9 17.8 16.4 14.920 16.7 17.8 18.8 18.2 15.3 14.221 17.6 17.2 19.7 18.1 14.3 14.022 18.3 16.9 19.8 17.6 14.4 13.623 18.1 17.4 19.4 16.8 14.6 13.724 17.2 18.4 18.8 15.9 14.8 12.525 17.0 17.8 19.3 16.1 14.5 11.426 18.3 18.2 20.0 15.5 14.1 12.127 19.4 18.5 20.7 15.8 13.3 11.228 17.7 18.4 21.8 16.3 13.1 10.029 — 19.9 17.5 22.2 16.7 12.7 10.130 — 20.5 17.1 22.4 17.0 12.2 11.531 — — 20.2 — 21.6 17.1 — 12.5 —
MEAN 17.1 18.3 19.1 17.8 15.8 11.7MAX 21.2 20.6 22.4 21.7 17.8 14.9MIN 12.8 16.9 16.6 15.5 12.2 8.4
HCTP – 14206958 – Hedges Creek at Tualatin Community Park at Tualatin, Oregon [RM 0.3]
20092008
1/1
2/1
3/1
4/1
5/1
6/1
7/1
8/1
9/1
10/1
11/1
12/1
1/1
0
5
10
15
20
25
Mea
n D
aily
Tem
per
atu
re (
°C)
32
41
50
59
68
77
(°F
)
Oregon Temperature Guidelinefor Salmonid Rearing and Migration

APPENDIX F—Stream Temperature RecordsF-52 2009 Tualatin River Flow Management Report
TRT – 14206956 (formerly 14206960) – TUALATIN RIVER AT TUALATIN, OREGON [RM 8.9]Latitude: 45 23 14 Longitude: 122 45 46 Source Agency: WEST Consultants for Clean Water Services
Day2009 Mean Daily Water Temperature in Degrees Celsius
JAN FEB MAR APR MAY JUN JUL AUG SEP OCT NOV DEC 1 12.5 19.5 20.3 24.8 19.9 16.3 2 13.0 19.5 20.8 24.8 19.9 16.2 3 13.1 20.0 21.4 24.6 20.0 15.6 4 13.1 20.4 e21.4 24.5 20.0 15.3 5 13.0 19.9 24.1 19.4 14.9 6 12.8 19.6 23.3 19.1 14.7 7 12.3 19.3 22.5 19.0 14.6 8 12.3 19.1 22.2 18.7 14.5 9 12.4 19.2 21.9 18.7 14.310 12.1 19.0 21.8 18.8 13.911 12.4 18.9 21.8 18.9 13.212 12.7 18.9 21.1 19.2 13.213 12.4 19.0 20.8 19.2 12.814 12.4 e18.6 20.0 19.1 12.815 12.4 19.4 19.2 13.016 12.6 19.2 19.1 13.217 13.0 e21.4 19.6 19.1 13.818 14.4 21.3 20.1 18.9 14.119 15.0 21.2 20.8 18.7 14.320 15.1 21.5 21.1 18.6 14.521 15.3 22.0 20.7 18.6 14.522 15.6 22.3 20.6 18.7 14.323 15.5 22.2 20.3 18.6 14.324 15.6 22.2 20.3 18.3 e13.925 15.9 22.7 20.1 18.126 16.3 23.2 20.2 17.827 16.9 e20.4 23.8 20.7 17.428 17.4 19.9 24.2 20.6 17.029 — 17.9 20.0 24.6 20.6 16.630 — 18.5 20.1 24.7 20.4 16.331 — — 19.1 — 24.7 20.2 — —
MEAN 14.3 e19.5 e22.5 21.4 18.7 e14.3MAX 19.1 e20.4 e24.7 24.8 20.0 e16.3MIN 12.1 e18.9 e20.3 19.2 16.3 e12.8
e=estimated value due to incomplete record
TRT – 14206956 (formerly 14206960)– Tualatin River at Tualatin, Oregon [RM 8.9]
20092008
1/1
2/1
3/1
4/1
5/1
6/1
7/1
8/1
9/1
10/1
11/1
12/1
1/1
0
5
10
15
20
25
Mea
n D
aily
Tem
per
atu
re (
°C)
32
41
50
59
68
77
(°F
)
Oregon Temperature Guidelinefor Salmonid Rearing and Migration

APPENDIX F—Stream Temperature Records2009 Tualatin River Flow Management Report F-53
SCBR – SAUM CREEK AT BORLAND ROAD [RM 0.6]Latitude: 45 22 32 Longitude: 122 43 22 Source Agency: WEST Consultants for Clean Water Services
Day2009 Mean Daily Water Temperature in Degrees Celsius
JAN FEB MAR APR MAY JUN JUL AUG SEP OCT NOV DEC 1 12.4 17.4 15.2 19.7 15.6 11.8 2 13.1 17.2 15.8 19.7 15.4 12.1 3 12.3 17.2 16.6 19.0 15.5 11.1 4 11.9 17.6 17.1 18.1 15.1 10.5 5 11.6 16.7 17.0 17.2 15.3 10.4 6 12.1 15.5 16.1 16.5 15.3 9.8 7 12.2 15.0 15.4 16.0 14.7 10.1 8 12.0 15.0 15.3 15.9 14.0 10.2 9 12.3 15.4 15.1 16.5 13.9 10.110 12.8 15.6 15.4 16.3 14.7 9.711 13.3 15.6 15.9 16.8 15.1 9.212 12.5 15.8 15.6 17.7 15.4 8.913 10.9 15.9 15.3 16.8 15.9 8.914 12.1 15.6 15.5 15.8 15.6 9.515 12.6 15.7 15.9 15.1 15.4 10.416 13.6 16.0 16.7 14.9 15.4 11.017 15.1 16.2 18.2 15.3 15.2 11.618 16.1 16.4 18.2 16.2 14.3 12.119 14.8 16.5 17.3 16.9 14.3 12.020 13.0 15.7 17.5 17.2 13.8 11.821 13.4 14.7 18.2 16.6 13.3 11.522 14.5 14.5 18.0 16.1 13.8 11.523 14.5 14.5 17.2 15.5 13.8 11.524 14.4 15.4 16.7 14.7 13.7 11.025 14.3 15.5 17.7 14.6 13.5 10.126 14.6 15.1 18.6 14.3 13.1 10.327 15.1 15.1 19.6 14.7 12.8 10.128 15.6 15.7 20.7 15.0 12.5 9.129 — 16.7 15.4 20.6 15.3 12.2 9.030 — 17.2 15.1 20.6 15.5 11.7 9.831 — — 17.4 — 19.8 15.7 — 10.7 —
MEAN 13.7 15.8 17.2 16.3 14.3 10.5MAX 17.4 17.6 20.7 19.7 15.9 12.1MIN 10.9 14.5 15.1 14.3 11.7 8.9
SCBR – Saum Creek at Borland Road [RM 0.6]
20092008
1/1
2/1
3/1
4/1
5/1
6/1
7/1
8/1
9/1
10/1
11/1
12/1
1/1
0
5
10
15
20
25
Mea
n D
aily
Tem
per
atu
re (
°C)
32
41
50
59
68
77
(°F
)
Oregon Temperature Guidelinefor Salmonid Rearing and Migration

APPENDIX F—Stream Temperature RecordsF-54 2009 Tualatin River Flow Management Report
LOCS – 14206990 – TUALATIN RIVER AT OSWEGO CANAL NEAR LAKE OSWEGO, OREGON [RM 6.7]Latitude: 45 22 57 Longitude: 122 43 17 Source Agency: WEST Consultants for Clean Water Services
Day2009 Mean Daily Water Temperature in Degrees Celsius
JAN FEB MAR APR MAY JUN JUL AUG SEP OCT NOV DEC 1 12.9 25.5 20.5 2 13.4 25.4 20.3 3 13.4 25.1 20.5 4 13.2 24.9 20.3 5 13.0 e22.3 24.4 20.0 6 12.9 e19.2 21.3 23.7 19.2 7 12.6 19.2 20.9 22.6 19.3 8 12.5 19.0 20.8 22.3 19.2 9 12.6 18.9 20.9 22.4 19.110 12.3 19.1 21.4 22.1 19.311 12.6 18.9 21.1 22.4 19.412 12.9 18.9 20.4 21.8 e19.613 12.5 18.8 19.7 21.2 e12.814 12.6 18.9 19.9 20.4 13.015 12.7 19.4 20.4 19.8 13.316 12.9 19.6 21.2 19.5 13.617 13.3 19.6 21.3 19.8 14.018 14.6 19.9 21.9 20.4 14.519 15.1 20.0 21.9 21.1 14.720 15.3 19.6 22.0 21.6 14.721 15.5 19.2 22.5 21.3 14.822 15.9 19.2 22.8 20.9 14.623 16.0 19.4 22.6 20.7 14.524 15.9 19.8 22.3 20.5 14.225 16.1 e19.3 23.0 20.5 13.926 16.6 23.6 20.3 14.127 17.1 24.3 20.9 13.528 17.6 24.9 21.1 13.029 e17.4 25.3 20.8 12.630 — 25.6 20.8 12.631 — — — 25.4 20.7 — 12.9 —
MEAN e14.1 e19.3 e22.2 21.8 e19.7 e13.8MAX e17.6 e20.0 e25.6 25.5 e20.5 e14.8MIN e12.3 e18.8 e19.7 19.5 e19.1 e12.6
e=estimated value due to incomplete record
LOCS – 14206990 – Tualatin River at Oswego Canal near Lake Oswego, Oregon [RM 6.7]
20092008
1/1
2/1
3/1
4/1
5/1
6/1
7/1
8/1
9/1
10/1
11/1
12/1
1/1
0
5
10
15
20
25
Mea
n D
aily
Tem
per
atu
re (
°C)
32
41
50
59
68
77
(°F
)
Oregon Temperature Guidelinefor Salmonid Rearing and Migration

APPENDIX F—Stream Temperature Records2009 Tualatin River Flow Management Report F-55
UNITED STATES DEPARTMENT OF THE INTERIOR – GEOLOGICAL SURVEY — OREGON WATER SCIENCE CENTERSTATION NUMBER 14207200 TUALATIN RIVER AT OSWEGO DAM, NEAR WEST LINN, OR.
LATITUDE: 452124 LONGITUDE: 1224102
Water Temperature, degrees Celsius, Calendar Year January to December 2009 Daily Mean ValuesDay JAN FEB MAR APR MAY JUN JUL AUG SEP OCT† NOV† DEC†
1 5.6 4.5 7.2 8.5 12.9 19.6 20.6 20.5 16.2 12.5 8.32 6.1 4.6 6.9 8.4 13.3 19.8 20.7 20.4 16.1 11.9 7.93 6.0 4.6 7.0 8.7 13.5 19.9 21.2 25.4 20.3 15.8 11.5 7.54 5.0 4.6 7.4 9.0 13.2 20.1 21.8 24.9 20.2 15.3 11.2 7.15 4.5 4.8 7.8 9.3 12.9 20.2 22.3 24.5 20.0 14.9 10.9 6.66 4.8 5.1 7.9 9.9 12.8 19.8 22.0 23.8 19.6 14.6 11.0 5.87 5.6 5.6 7.7 10.1 12.6 19.4 21.3 23.0 18.9 14.5 11.0 4.58 6.7 5.6 7.5 10.4 12.4 19.2 20.8 22.3 18.7 14.3 10.2 3.39 7.2 5.6 7.3 10.9 12.7 19.2 20.7 22.1 18.8 14.3 10.2 2.6
10 7.1 5.6 6.9 11.5 12.4 19.3 20.8 22.1 18.9 14.0 9.9 2.111 6.7 5.6 6.5 11.6 12.4 19.4 21.1 22.2 19.2 13.5 9.6 1.812 6.7 5.6 6.3 11.6 12.7 19.2 20.9 22.1 19.2 13.1 9.5 1.813 6.7 5.4 6.3 11.2 12.6 19.1 20.4 21.5 19.5 12.6 9.4 1.814 6.9 5.2 6.6 10.8 12.5 19.2 20.0 20.8 19.5 12.5 9.1 2.015 6.9 5.2 6.9 10.5 12.8 19.1 20.0 20.1 19.5 12.8 9.0 3.116 6.6 5.2 7.3 10.4 13.0 19.3 20.4 19.5 19.4 13.0 9.0 4.417 5.9 5.4 7.6 10.6 13.2 19.6 21.0 19.6 19.3 13.3 9.1 4.918 5.2 5.6 7.7 10.5 14.3 19.8 21.6 20.0 19.1 13.6 9.0 5.519 4.8 5.7 7.8 10.9 15.0 20.0 21.9 20.6 18.9 14.0 8.9 6.620 4.4 6.0 8.3 11.9 15.2 20.1 22.0 21.1 18.5 14.2 9.2 7.121 4.2 6.2 8.9 13.1 15.5 19.5 22.3 21.4 18.4 14.2 8.6 7.522 4.2 6.5 9.2 13.5 15.9 19.1 22.7 21.1 18.3 14.2 8.7 7.623 4.2 6.7 9.1 13.1 16.1 19.2 22.7 20.6 18.4 14.2 8.5 7.524 4.3 7.0 8.6 13.3 16.0 19.4 22.4 20.3 18.5 13.9 8.2 6.925 4.6 7.5 8.5 13.6 16.1 19.9 22.5 20.1 18.3 13.5 8.0 5.726 4.7 7.6 8.3 13.3 16.5 19.8 23.1 19.9 18.0 13.5 8.1 4.927 4.7 7.7 8.3 13.1 16.9 19.8 23.8 20.1 17.8 13.3 8.6 4.528 4.9 7.4 8.8 12.8 17.5 20.2 24.5 20.4 17.3 12.7 8.3 4.329 4.8 — 8.8 12.1 18.0 20.4 25.0 20.5 16.9 12.3 8.3 3.930 4.6 — 8.7 12.1 18.6 20.5 25.4 20.5 16.4 12.2 8.5 3.831 4.4 — 8.8 — 19.1 — 25.4 20.5 — 12.5 — 4.2
MEAN 5.5 5.8 7.8 11.2 14.5 19.6 21.9 e21.3 19.0 13.8 9.5 5.0MAX 7.2 7.7 9.2 13.6 19.1 20.5 25.4 e24.9 20.5 16.2 12.5 8.3MIN 4.2 4.5 6.3 8.4 12.4 19.1 20.0 e19.5 16.4 12.2 8.0 1.8
† Provisional data–subject to revision; e=estimated value due to incomplete record
ODAM – 14207200 – Tualatin River at Oswego Dam near West Linn, Oregon [RM 3.4]
20092008
1/1
2/1
3/1
4/1
5/1
6/1
7/1
8/1
9/1
10/1
11/1
12/1
1/1
0
5
10
15
20
25
Mea
n D
aily
Tem
per
atu
re (
°C)
32
41
50
59
68
77
(°F
)
Oregon Temperature Guidelinefor Salmonid Rearing and Migration

APPENDIX F—Stream Temperature RecordsF-56 2009 Tualatin River Flow Management Report
WSLO – 14207500 – TUALATIN RIVER AT WEST LINN, OREGON [RM 1.75]Latitude: 45 22 57 Longitude: 122 43 17 Source Agency: WEST Consultants for Clean Water Services
Day2009 Mean Daily Water Temperature in Degrees Celsius
JAN FEB MAR APR MAY JUN JUL AUG SEP OCT NOV DEC 1 12.8 19.8 21.0 26.1 20.6 16.2 2 13.2 19.9 21.6 26.0 20.7 16.0 3 13.5 20.0 22.1 25.7 20.6 15.5 4 13.2 20.4 22.7 25.2 20.3 15.2 5 12.9 20.1 22.8 24.5 20.0 14.7 6 12.7 19.7 22.0 23.7 19.5 14.4 7 12.6 19.3 21.6 22.7 18.9 14.5 8 12.3 19.4 20.9 22.3 18.7 14.3 9 12.6 19.4 20.7 22.2 18.8 14.110 12.4 19.3 21.0 22.3 19.0 13.811 12.4 19.4 21.2 22.4 19.3 13.312 12.7 19.4 20.8 22.3 19.7 13.013 12.5 19.4 20.4 21.8 19.6 12.614 12.4 19.1 20.4 20.8 19.6 12.515 12.7 19.5 20.5 20.1 19.8 12.616 13.0 19.6 21.0 19.6 19.6 12.917 13.2 19.7 21.7 19.8 19.4 13.218 14.2 20.1 22.1 20.5 19.2 13.519 14.9 20.2 22.3 21.2 18.9 13.820 15.1 20.0 22.6 21.5 18.4 14.021 15.4 19.6 23.1 21.3 18.3 14.022 15.9 19.2 23.2 21.2 18.4 13.923 16.2 19.4 22.9 20.9 18.5 14.024 16.2 19.9 22.7 20.5 18.3 13.825 16.2 19.9 23.1 20.2 18.1 13.426 16.4 19.9 23.6 20.1 18.0 13.327 17.0 20.4 24.5 20.5 17.7 13.128 17.6 20.6 25.3 20.3 17.3 12.529 — 18.2 20.7 25.9 20.4 16.7 12.230 — 18.9 20.8 26.1 20.6 16.3 12.231 — — 19.5 — 26.0 20.6 — 12.3 —
MEAN 14.5 19.8 22.4 21.8 18.9 13.7MAX 19.5 20.8 26.1 26.1 20.7 16.2MIN 12.3 19.1 20.4 19.6 16.3 12.2
20092008
WSLO – 14207500 – Tualatin River at West Linn, Oregon [RM 1.75]
1/1
2/1
3/1
4/1
5/1
6/1
7/1
8/1
9/1
10/1
11/1
12/1
1/1
0
5
10
15
20
25
Mea
n D
aily
Tem
per
atu
re (
°C)
32
41
50
59
68
77
(°F
)
Oregon Temperature Guidelinefor Salmonid Rearing and Migration

Appendix G
Hagg Lake Monitoring
2009 Data
The following data are provisional and have not been fully reviewed or edited.

APPENDIX G—Hagg Lake Monitoring ProgramG-2 2009 Tualatin River Flow Management Report
HAGG LAKE MONITORING PROGRAM 2009 — DATA LIST
DATA TABLE PAGE
Hagg Lake Tributaries
Benthic Invertebrate Index of Biological Integrity (BIBI) G–3
Benthic community indicators of biological condition G–3
Benthic invertebrate density G–4
Hagg Lake monitoring was discontinued in 2007 for the following:Petroleum hydrocarbonsPhysical and chemical data, including field dataBacteriological dataPhytoplankton density and biovolumeZooplankton density and zooplankton length frequency
Hagg Lake tributary monitoring for the following was discontinued in 2007:Physical and chemical data, including field dataBacteriological data

APPENDIX G—Hagg Lake Monitoring Program2009 Tualatin River Flow Management Report G-3
HAGG LAKE MONITORING 2009 — BENTHIC INVERTEBRATE INDEX OF BIOLOGICAL INTEGRITY[Metric code: a ‘+’ indicates metric value generally decreases with declining biological integrity; a ‘–’ indicates metric value generally increases with declining biological integrity. Condition categories: L= low, M=medium, H=high. Sample collected 11/25/2009.]
MetricSain Ck Scoggins Ck Tanner Ck
Value Score Value Score Value Score
+ Total number of taxa 36 3 34 3 34 3
+ Number of Ephemeroptera taxa 11 5 10 5 8 3
+ Number of Plecoptera taxa 6 3 10 5 7 3
+ Number of Tricoptera taxa 4 1 7 3 3 1
+ Number of long-lived taxa 2 1 3 3 2 1
+ Number of intolerant taxa 2 1 3 3 4 5
– Percent tolerant taxa 40.88 3 31.29 3 57.15 1
+ Percent predator 2.52 1 3.09 1 5.41 1
+ Number of clinger taxa 29 5 30 5 23 5
– Percent Dominance (3 taxa) 63.73 3 56.93 3 76.03 1
BIBI TOTAL SCORE 26 34 24
BIOLOGICAL CONDITION CATEGORY M M L
Categories based on comparison with unimpacted Puget Lowland and Willamette Valley streams. Scores indicate: 1-low, 3-moderate, 5-high. Maximum IBI score=50. BIBI scores: 0–24=L, 25–39=M, >40=H. Based on average/summation of 3 replicates, not on each individual replicate. Riffle habitat. D-Frame net; 5 point composite sample; total area= 1 square meter; 500 micron mesh; 500 organism subsample minimum. Based on single composite sample.
HAGG LAKE MONITORING 2009 — BENTHIC COMMUNITY INDICATORS OF BIOLOGICAL CONDITION[Metric code: a ‘+’ indicates metric value generally decreases with declining biological integrity; a ‘–’ indicates metric value generally increases with declining biological integrity. Condition: L= low, M=medium, H=high. Sample collected 11/25/2009.]
MetricScoggins Ck Scoggins Ck Tanner Ck
Value Condition Value Condition Value Condition
+ Total abundance (number/m2) 477 L 390 L 2250 H
+ EPT taxa richness 21 M 27 M 18 L
+ Predator richness 9 L 8 L 9 L
+ Scraper richness 12 M 13 M 11 M
+ Shredder richness 4 L 8 M 5 M
+ Percent intolerant taxa 0.42 L 0.78 L 0.96 L
– Hilsenhoff Biotic Index 5.98 M 5.46 M 6.2 L
– Percent Baetis tricaudatus 40.04 L 31.03 L 56.67 L
– Percent collector 65.83 L 48.49 M 80.79 L
– Percent Parasite 0 H 0 H 0 H
– Percent Oligochaeta 9.85 L 1.54 H 5.71 M
– Number of tolerant taxa 5 M 2 H 4 H
– Percent Simuliidae 11.53 L 9.74 M 13.17 L
– Percent Chironomidae 1.68 H 1.03 H 1.75 H
Condition based on comparisons with a Pacific Northwest montane stream with high biological integrity. (A montane is the biome characterized by moist cool upland slopes below timberline and dominated by large coniferous trees.)

APPENDIX G—Hagg Lake Monitoring ProgramG-4 2009 Tualatin River Flow Management Report
HAGG LAKE MONITORING 2009 — BENTHIC INVERTEBRATE DENSITY (SHEET 1 OF 2)[Sample collected November 25, 2009]
TAXON
SAIN CK (RM 1.6) SCOGGINS CK (RM 8.0) TANNER CK (RM 1.6)
Abundance(number/m2)
Percent of Total
Abundance(number/m2)
Percent of Total
Abundance(number/m2)
Percent of Total
NO
N-IN
SEC
TS Juga — — 1 0.26 — —
Oligochaeta 47 9.85 6 1.54 144 5.71
TOTAL NON-INSECTS 47 9.85 7 1.79 144 5.71
EP
HE
ME
RO
PT
ER
A
Ameletus 1 0.21 1 0.26 — —
Attenella delantala 4 0.84 4 1.03 — —
Baetis tricaudatus 191 40.04 121 31.03 1428 56.67
Cinygmula 33 6.92 54 13.85 92 3.65
Diphetor hageni 2 0.42 — — — —
Drunella coloradensis 4 0.84 12 3.08 — —
Epeorus 28 5.87 8 2.05 12 0.48
Epeorus grandis 1 0.21 — — 4 0.16
Ephemerella excrusians 2 0.42 28 7.18 4 0.16
Ironodes — — 2 0.51 12 0.48
Paraleptophlebia 1 0.21 4 1.03 28 1.11
Rhithrogena 58 12.16 47 12.05 8 0.32
TOTAL EPHEMEROPTERA 325 68.13 281 72.05 1588 63.02
PL
EC
OP
TE
RA
Calineuria californica 4 0.84 2 0.51 — —
Capniidae 20 4.19 29 7.44 156 6.19
Cultus — — 1 0.26 — —
Hesperoperla pacifica — — — — 12 0.48
Isoperla — — 3 0.77 — —
Leuctridae-early instar 1 0.21 1 0.26 8 0.32
Perlodidae 1 0.21 1 0.26 16 0.63
Skwala — — 2 0.51 — —
Sweltsa 1 0.21 — — 12 0.48
Taeniopterygidae — — 4 1.03 — —
Yoraperla — — 1 0.26 — —
Zapada cinctipes 2 0.42 6 1.54 4 0.16
Zapada Oregonensis Group — — — — 4 0.16
TOTAL PLECOPTERA 29 6.08 50 12.82 212 8.41
ODO
NATA Octogomphus — — — — 4 0.16
TOTAL ODONATA — — — — 4 0.16
TR
ICH
OP
TE
RA
Amiocentrus aspilus — — 1 0.26 — —
Glossosoma 1 0.21 1 0.26 16 0.63
Hydropsyche 4 0.84 1 0.26 16 0.63
Micrasema — — 2 0.51 — —
Psychoglypha — — 1 0.26 — —
Psychomyia 1 0.21 — — — —
Rhyacophila arnaudi 1 0.21 — — — —
Rhyacophila Betteni Group — — 1 0.26 4 0.16
Rhyacophila pellisa/valuma — — 1 0.26 — —
TOTAL TRICHOPTERA 7 1.47 8 2.05 36 1.43

APPENDIX G—Hagg Lake Monitoring Program2009 Tualatin River Flow Management Report G-5
CO
LEO
PTER
A Heterlimnius — — 1 0.26 64 2.54
Lara avara 2 0.42 — — — —
Optioservus — — — — 4 0.16
TOTAL COLEOPTERA 2 0.42 1 0.26 68 2.70
DIP
TE
RA
Dicranota 1 0.21 1 0.26 68 2.70
Dolichopodidae 1 0.21 — — — —
Forcipomyiinae 1 0.21 — — — —
Glutops — — — — 8 0.32
Limnophila — — — — 8 0.32
Pericoma/Telmatoscopus — — — — 8 0.32
Simulium 55 11.53 38 9.74 332 13.17
Wiedemannia 1 0.21 — — — —
TOTAL DIPTERA 59 12.37 39 10.00 424 16.83
CH
IRO
NO
MID
AE
Brillia — — 3 0.77 20 0.79
Chironomidae-pupae — — 1 0.26 — —
Cladotanytarsus 1 0.21 — — — —
Cryptochironomus 1 0.21 — — 4 0.16
Eukiefferiella cf tirolensis — — — — 4 0.16
Heterotrissocldius — — — — 4 0.16
Micropsectra 1 0.21 — — — —
Micropsectra 1 0.21 — — — —
Parametriocnemus 1 0.21 — — — —
Rheocricotopus 1 0.21 — — 4 0.16
Rheotanytarsus 1 0.21 — — 4 0.16
Tanytarsus 1 0.21 — — — —
Virgatanytarsus 8 1.68 4 1.03 44 1.75
TOTAL CHIRONOMIDAE 477 100.00 390 100.00 2520 100.00
TOTAL BENTHIC INVERTEBRATES 649 100.00 649 100.00 460 100.00
HAGG LAKE MONITORING 2009 — BENTHIC INVERTEBRATE DENSITY (CONTINUED) (SHEET 2 OF 2)[Sample collected November 25, 2009]
TAXON
SAIN CK (RM 1.6) SCOGGINS CK (RM 8.0) TANNER CK (RM 1.6)
Abundance(number/m2)
Percent of Total
Abundance(number/m2)
Percent of Total
Abundance(number/m2)
Percent of Total

APPENDIX G—Hagg Lake Monitoring ProgramG-6 2009 Tualatin River Flow Management Report
(this page intentionally blank)

Appendix H
Precipitation Data

APPENDIX H—Precipitation DataH-2 2009 Tualatin River Flow Management Report
PRECIPITATION MONITORING STATIONS — LOCATIONS
North
SCHEMATIC MAP
Not to Scale
Fanno Creek
Cr
Cr
Cr
S. Rock
McF
ee C
r
Christensen
Creek
Creek
Rock
Gales
SCHO
Scog
Barney Reservoir
Scoggins Reservoir
DURP
Lake Oswego
SDMO
WI L L A M
E T T E RI V
ER
TU
AL
R
FGOP
Dairy
Creek
Burris Cr
He Cr
Baker CrChicken
Cedar Cr
Canal
(Hagg Lake)
Ash C
r
Hedges C
r
Sain Cr
Ta
gins
Car
pe
Dawson Cr
Beav
erto
n C
reek
nner Cr
nter
Cr
onat
Lake Oswego
AT
IN
VE
RI
Coun
cil
Cr
S. Johns on Cr
Springbrook Cr
Saum Cr
Butte rnu t Cr
CreekMcKay
East
West Fork
Fork
Brons
CedarMill Cr
on Cr
CreekSECO
DLLP

APPENDIX H—Precipitation Data2009 Tualatin River Flow Management Report H-3
PRECIPITATION SITES — ALPHABETICAL LISTING BY SITE CODESITE CODE SITE NAME Elevation (ft) PAGE
DLLP Dilley Precipitation Station 170 H-8DURP Durham Wastewater Treatment Plant Precipitation Station 140 H-12FGOP Forest Grove Precipitation Station (Verboort) 180 H-10SDMO South Saddle Mountain Precipitation Station 3250 H-4
SECO Sain Creek Precipitation Station 2000 H-6

APPENDIX H—Precipitation DataH-4 2009 Tualatin River Flow Management Report
SDMO – SOUTH SADDLE MOUNTAIN PRECIPITATION STATION
Elevation: 3250 ft Source Agency: Natural Resources Conservation ServiceLatitude: 45 31 48 Longitude: 123 22 12 http://www.wcc.nrcs.usda.gov/cgibin/tab.pl?state=OR
Water Year*
Total Monthly Precipitation (inches)OCT NOV DEC JAN FEB MAR APR MAY JUN JUL AUG SEP
1980 10.8 7.5 19.2 19.3 11.2 10.1 6.5 6.4 8.7 1.0 0.6 4.91981 4.2 19.3 26.8 5.2 18.6 7.5 7.9 4.1 7.2 0.4 0.7 4.41982 13.0 14.9 26.6 19.3 17.2 7.5 7.2 0.0 2.0 1.1 1.9 3.31983 13.4 16.7 21.5 17.3 15.2 11.5 7.1 4.3 4.7 4.9 3.4 4.71984 1.7 23.3 11.8 8.3 12.6 8.1 6.3 6.4 3.8 0.6 1.1 3.81985 11.4 28.6 12.9 1.8 10.2 11.8 4.8 1.5 4.3 0.2 1.4 5.91986 12.2 11.1 5.4 15.8 13.4 7.2 5.7 3.2 1.1 1.4 0.2 6.21987 5.3 20.2 11.1 17.1 7.7 16.0 2.3 4.9 1.1 1.7 0.2 0.91988 0.7 10.8 22.2 14.1 9.6 15.0 7.8 6.1 2.4 2.0 0.3 2.71989 2.5 28.5 11.4 14.9 10.2 17.4 5.3 2.8 1.7 1.9 2.0 0.01990 5.8 9.6 8.6 31.4 20.8 7.0 6.4 3.3 4.9 0.4 0.8 1.51991 11.4 18.7 10.0 12.7 12.7 12.1 15.3 4.4 2.7 1.0 1.2 0.61992 2.8 14.4 11.8 19.1 8.8 1.8 10.5 2.4 1.2 1.4 1.1 5.31993 6.8 13.8 16.2 10.8 3.3 12.4 13.7 6.4 3.2 1.6 0.9 0.01994 2.7 3.3 18.8 11.0 15.2 9.3 5.5 3.6 4.2 0.9 0.5 1.21995 14.7 20.9 31.0 19.7 13.5 14.8 6.8 1.5 4.3 3.0 1.3 3.71996 8.5 34.8 21.7 21.2 32.6 6.0 17.1 6.4 2.0 1.2 1.0 3.71997 11.6 16.9 34.3 17.2 7.3 20.1 8.3 5.9 5.3 2.1 2.6 10.71998 19.8 15.3 9.3 24.2 14.7 10.4 3.3 6.1 1.6 0.2 0.4 2.71999 7.7 25.9 28.7 20.3 33.7 12.9 2.8 5.0 0.9 0.2 1.3 0.02000 6.1 23.6 18.6 17.7 10.1 6.3 2.9 4.9 6.0 0.1 0.6 1.62001 4.3 5.6 9.2 5.5 4.8 6.2 6.1 5.2 3.3 1.4 3.1 0.72002 6.6 23.0 20.3 21.7 7.5 10.7 7.6 2.9 3.6 0.2 0.3 0.12003 0.5 5.8 17.2 21.5 5.4 19.5 7.5 2.3 0.3 0.3 0.4 1.92004 9.4 12.1 13.5 15.0 8.7 5.4 4.4 4.9 2.7 0.1 5.4 5.72005 7.4 5.0 10.9 9.3 2.1 11.0 6.5 5.8 2.2 1.0 0.4 1.42006 9.4 12.4 18.2 29.8 6.1 7.3 3.5 3.0 2.0 0.7 0.0 2.12007 1.9 37.7 15.1 9.0 10.3 4.9 3.7 0.5 2.0 0.9 1.1 2.12008 7.7 9.5 21.9 11.5 4.7 7.6 4.9 1.1 2.3 0.3 2.4 0.02009 6.6 11.9 10.7 11.5 4.4 7.1 4.8 7.0 0.8 0.5 1.3 2.4
MIN 0.5 3.3 5.4 1.8 2.1 1.8 2.3 0.0 0.3 0.1 0.0 0.0MAX 19.8 37.7 34.3 31.4 33.7 20.1 17.1 7.0 8.7 4.9 5.4 10.7MEAN 7.56 16.70 17.16 15.69 11.75 10.16 6.75 4.08 3.08 1.09 1.26 2.81*Water Year (WY) begins October 1st of the previous calendar year and ends September 30th of current year.

APPENDIX H—Precipitation Data2009 Tualatin River Flow Management Report H-5
SDMO – Saddle Mountain Precipitation Station
198
0
0
10
20
30
40M
on
thly
Pre
cip
itat
ion
(in
ches
)
Oct Nov Dec Jan Feb Mar Apr May Jun Jul Aug Sept
WY 2009
Maximum
Mean
Minimum
Statistics(period of record:
1980–2009)
SDMO – Saddle Mountain Precipitation Station
0
40
80
120
160
To
tal A
nn
ual
Pre
cip
itat
ion
(in
ches
/wat
er y
ear)
200
6
198
2
198
3
198
4
198
5
198
6
198
7
198
8
198
9
199
0
199
1
198
1
199
2
199
3
199
4
199
5
199
6
199
7
199
8
199
9
200
0
200
1
200
2
200
3
Water Year
200
5
200
4
200
7
mean value
200
9
200
8

APPENDIX H—Precipitation DataH-6 2009 Tualatin River Flow Management Report
SECO – SAIN CREEK PRECIPITATION STATION
Elevation: 2000 ft Source Agency: Natural Resources Conservation ServiceLatitude: 45 31 12 Longitude: 123 16 48 http://www.wcc.nrcs.usda.gov/cgibin/tab.pl?state=OR
Water Year*
Total Monthly Precipitation (inches)OCT NOV DEC JAN FEB MAR APR MAY JUN JUL AUG SEP
1981 2.3 13.5 17.8 5.8 12.8 5.3 6.0 3.6 5.6 0.0 0.2 3.01982 10.3 11.8 20.8 13.2 14.9 7.9 6.4 0.7 2.0 1.1 1.9 2.41983 11.1 11.4 17.0 15.5 17.3 14.5 6.3 2.5 3.1 1.6 0.0 0.11984 1.4 16.7 3.5 3.5 12.1 9.1 2.5 5.3 3.3 0.0 0.0 2.81985 10.4 22.6 7.0 1.1 4.0 7.9 4.3 1.4 3.5 0.1 1.6 3.21986 9.3 4.9 2.8 13.2 15.1 2.9 5.2 6.1 0.2 1.0 0.2 6.31987 4.5 15.3 8.4 12.4 6.4 12.3 3.6 3.3 0.4 1.2 0.2 0.31988 0.7 6.8 15.8 12.2 2.8 9.1 4.4 4.0 2.0 0.7 0.0 1.41989 1.3 21.5 7.4 9.1 7.3 11.6 3.7 1.7 1.9 0.9 1.7 0.11990 4.5 6.2 5.8 21.8 14.5 6.4 3.2 2.6 2.5 0.3 0.7 0.81991 8.4 10.9 6.1 7.4 9.1 8.3 12.9 2.8 2.1 0.8 0.8 0.51992 2.5 9.7 8.4 12.2 6.7 1.2 9.2 1.1 1.1 0.6 0.4 3.11993 5.0 9.3 11.9 8.9 2.0 8.8 9.9 5.7 2.7 2.4 0.5 0.01994 1.7 4.5 12.7 8.5 10.7 5.9 4.2 3.1 2.4 0.1 0.2 1.61995 13.0 13.4 16.6 16.0 9.3 11.2 5.2 1.9 2.9 1.1 0.8 2.51996 6.6 24.6 15.7 15.3 21.9 3.4 13.8 4.8 1.4 0.4 0.4 2.61997 8.4 12.7 27.6 13.3 4.7 13.7 5.6 4.8 3.4 0.4 1.9 8.11998 13.0 12.0 6.4 19.8 12.0 8.5 2.5 5.1 0.8 0.0 0.2 1.51999 5.6 20.5 22.3 16.1 25.9 11.1 2.0 4.0 1.0 0.2 1.2 0.02000 4.6 18.3 15.4 13.5 8.5 5.3 2.6 3.8 4.0 0.0 0.2 0.92001 2.9 3.7 6.4 3.2 3.1 3.7 3.7 2.4 1.1 0.3 1.2 0.22002 3.8 16.7 13.3 14.9 5.1 6.6 5.1 2.0 2.0 0.1 0.0 0.32003 0.3 7.8 16.5 15.8 4.3 14.1 5.9 1.4 0.0 0.0 0.0 1.52004 5.8 7.3 12.0 12.2 7.6 3.9 4.7 2.3 2.0 0.2 3.2 4.42005 5.6 3.2 8.3 8.4 1.1 8.5 4.9 5.3 2.5 0.4 0.2 0.62006 9.1 10.4 14.7 21.8 3.7 6.9 3.3 3.1 1.5 0.2 0.0 0.92007 1.8 25.9 12.0 6.1 9.5 4.0 3.2 0.4 1.1 1.2 0.9 1.92008 4.7 7.5 20.0 11.2 5.0 7.5 4.5 0.5 0.6 0.6 1.9 0.02009 5.8 7.4 11.3 7.9 3.0 5.9 2.9 5.3 0.8 0.0 1.3 2.0
MIN 0.3 3.2 2.8 1.1 1.1 1.2 2.0 0.4 0.0 0.0 0.0 0.0MAX 13.0 25.9 27.6 21.8 25.9 14.5 13.8 6.1 5.6 2.4 3.2 8.1MEAN 5.67 12.29 12.55 11.73 8.98 7.78 5.23 3.14 2.00 0.55 0.75 1.83*Water Year (WY) begins October 1st of the previous calendar year and ends September 30th of current year.

APPENDIX H—Precipitation Data2009 Tualatin River Flow Management Report H-7
mean value
SECO – Sain Creek Precipitation Station
198
1
0
10
20
30M
on
thly
Pre
cip
itat
ion
(in
ches
)
Oct Nov Dec Jan Feb Mar Apr May Jun Jul Aug Sept
WY 2009
Maximum
Mean
Minimum
Statistics(period of record:
1981–2009)
SECO – Sain Creek Precipitation Station
0
40
80
120
To
tal A
nn
ual
Pre
cip
itat
ion
(in
ches
/wat
er y
ear)
200
7
198
2
198
3
198
4
198
5
198
6
198
7
198
8
198
9
199
0
199
1
199
2
199
3
199
4
199
5
199
6
199
7
199
8
199
9
200
0
200
1
200
2
200
3
Water Year
200
4
200
5
200
6
200
9
200
8
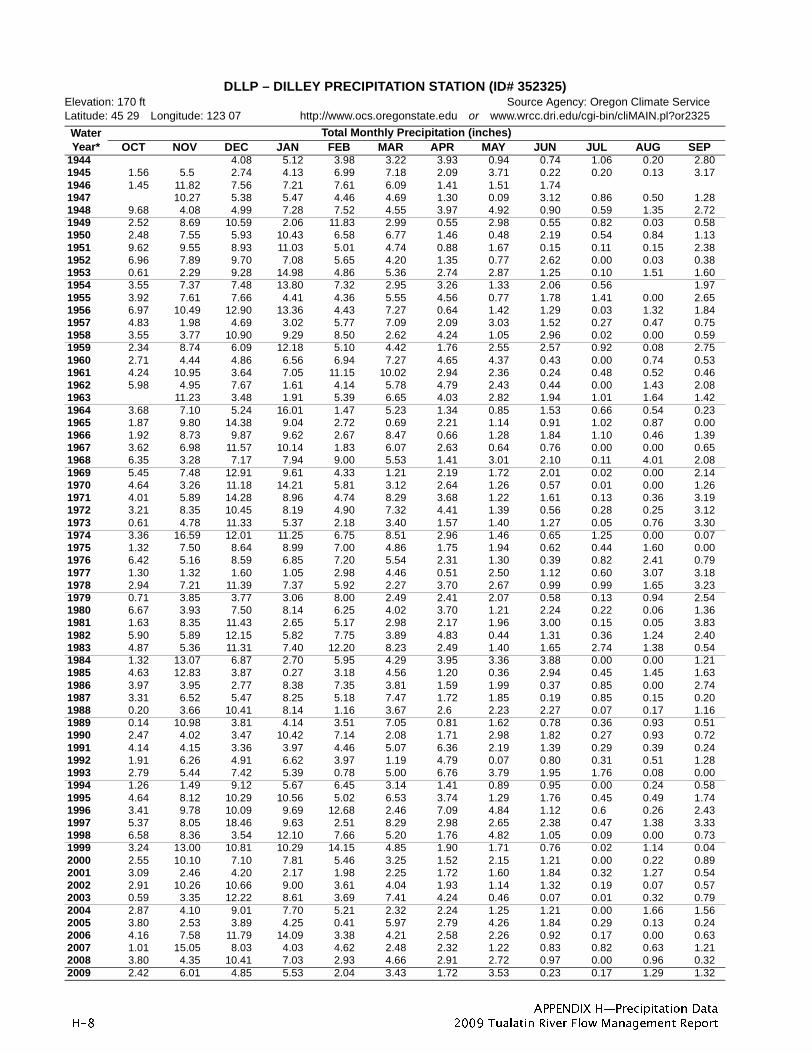
APPENDIX H—Precipitation DataH-8 2009 Tualatin River Flow Management Report
DLLP – DILLEY PRECIPITATION STATION (ID# 352325)
Elevation: 170 ft Source Agency: Oregon Climate ServiceLatitude: 45 29 Longitude: 123 07 http://www.ocs.oregonstate.edu or www.wrcc.dri.edu/cgi-bin/cliMAIN.pl?or2325
Water Year*
Total Monthly Precipitation (inches)OCT NOV DEC JAN FEB MAR APR MAY JUN JUL AUG SEP
1944 4.08 5.12 3.98 3.22 3.93 0.94 0.74 1.06 0.20 2.801945 1.56 5.5 2.74 4.13 6.99 7.18 2.09 3.71 0.22 0.20 0.13 3.171946 1.45 11.82 7.56 7.21 7.61 6.09 1.41 1.51 1.741947 10.27 5.38 5.47 4.46 4.69 1.30 0.09 3.12 0.86 0.50 1.281948 9.68 4.08 4.99 7.28 7.52 4.55 3.97 4.92 0.90 0.59 1.35 2.721949 2.52 8.69 10.59 2.06 11.83 2.99 0.55 2.98 0.55 0.82 0.03 0.581950 2.48 7.55 5.93 10.43 6.58 6.77 1.46 0.48 2.19 0.54 0.84 1.131951 9.62 9.55 8.93 11.03 5.01 4.74 0.88 1.67 0.15 0.11 0.15 2.381952 6.96 7.89 9.70 7.08 5.65 4.20 1.35 0.77 2.62 0.00 0.03 0.381953 0.61 2.29 9.28 14.98 4.86 5.36 2.74 2.87 1.25 0.10 1.51 1.601954 3.55 7.37 7.48 13.80 7.32 2.95 3.26 1.33 2.06 0.56 1.971955 3.92 7.61 7.66 4.41 4.36 5.55 4.56 0.77 1.78 1.41 0.00 2.651956 6.97 10.49 12.90 13.36 4.43 7.27 0.64 1.42 1.29 0.03 1.32 1.841957 4.83 1.98 4.69 3.02 5.77 7.09 2.09 3.03 1.52 0.27 0.47 0.751958 3.55 3.77 10.90 9.29 8.50 2.62 4.24 1.05 2.96 0.02 0.00 0.591959 2.34 8.74 6.09 12.18 5.10 4.42 1.76 2.55 2.57 0.92 0.08 2.751960 2.71 4.44 4.86 6.56 6.94 7.27 4.65 4.37 0.43 0.00 0.74 0.531961 4.24 10.95 3.64 7.05 11.15 10.02 2.94 2.36 0.24 0.48 0.52 0.461962 5.98 4.95 7.67 1.61 4.14 5.78 4.79 2.43 0.44 0.00 1.43 2.081963 11.23 3.48 1.91 5.39 6.65 4.03 2.82 1.94 1.01 1.64 1.421964 3.68 7.10 5.24 16.01 1.47 5.23 1.34 0.85 1.53 0.66 0.54 0.231965 1.87 9.80 14.38 9.04 2.72 0.69 2.21 1.14 0.91 1.02 0.87 0.001966 1.92 8.73 9.87 9.62 2.67 8.47 0.66 1.28 1.84 1.10 0.46 1.391967 3.62 6.98 11.57 10.14 1.83 6.07 2.63 0.64 0.76 0.00 0.00 0.651968 6.35 3.28 7.17 7.94 9.00 5.53 1.41 3.01 2.10 0.11 4.01 2.081969 5.45 7.48 12.91 9.61 4.33 1.21 2.19 1.72 2.01 0.02 0.00 2.141970 4.64 3.26 11.18 14.21 5.81 3.12 2.64 1.26 0.57 0.01 0.00 1.261971 4.01 5.89 14.28 8.96 4.74 8.29 3.68 1.22 1.61 0.13 0.36 3.191972 3.21 8.35 10.45 8.19 4.90 7.32 4.41 1.39 0.56 0.28 0.25 3.121973 0.61 4.78 11.33 5.37 2.18 3.40 1.57 1.40 1.27 0.05 0.76 3.301974 3.36 16.59 12.01 11.25 6.75 8.51 2.96 1.46 0.65 1.25 0.00 0.071975 1.32 7.50 8.64 8.99 7.00 4.86 1.75 1.94 0.62 0.44 1.60 0.001976 6.42 5.16 8.59 6.85 7.20 5.54 2.31 1.30 0.39 0.82 2.41 0.791977 1.30 1.32 1.60 1.05 2.98 4.46 0.51 2.50 1.12 0.60 3.07 3.181978 2.94 7.21 11.39 7.37 5.92 2.27 3.70 2.67 0.99 0.99 1.65 3.231979 0.71 3.85 3.77 3.06 8.00 2.49 2.41 2.07 0.58 0.13 0.94 2.541980 6.67 3.93 7.50 8.14 6.25 4.02 3.70 1.21 2.24 0.22 0.06 1.361981 1.63 8.35 11.43 2.65 5.17 2.98 2.17 1.96 3.00 0.15 0.05 3.831982 5.90 5.89 12.15 5.82 7.75 3.89 4.83 0.44 1.31 0.36 1.24 2.401983 4.87 5.36 11.31 7.40 12.20 8.23 2.49 1.40 1.65 2.74 1.38 0.541984 1.32 13.07 6.87 2.70 5.95 4.29 3.95 3.36 3.88 0.00 0.00 1.211985 4.63 12.83 3.87 0.27 3.18 4.56 1.20 0.36 2.94 0.45 1.45 1.631986 3.97 3.95 2.77 8.38 7.35 3.81 1.59 1.99 0.37 0.85 0.00 2.741987 3.31 6.52 5.47 8.25 5.18 7.47 1.72 1.85 0.19 0.85 0.15 0.201988 0.20 3.66 10.41 8.14 1.16 3.67 2.6 2.23 2.27 0.07 0.17 1.161989 0.14 10.98 3.81 4.14 3.51 7.05 0.81 1.62 0.78 0.36 0.93 0.511990 2.47 4.02 3.47 10.42 7.14 2.08 1.71 2.98 1.82 0.27 0.93 0.721991 4.14 4.15 3.36 3.97 4.46 5.07 6.36 2.19 1.39 0.29 0.39 0.241992 1.91 6.26 4.91 6.62 3.97 1.19 4.79 0.07 0.80 0.31 0.51 1.281993 2.79 5.44 7.42 5.39 0.78 5.00 6.76 3.79 1.95 1.76 0.08 0.001994 1.26 1.49 9.12 5.67 6.45 3.14 1.41 0.89 0.95 0.00 0.24 0.581995 4.64 8.12 10.29 10.56 5.02 6.53 3.74 1.29 1.76 0.45 0.49 1.741996 3.41 9.78 10.09 9.69 12.68 2.46 7.09 4.84 1.12 0.6 0.26 2.431997 5.37 8.05 18.46 9.63 2.51 8.29 2.98 2.65 2.38 0.47 1.38 3.331998 6.58 8.36 3.54 12.10 7.66 5.20 1.76 4.82 1.05 0.09 0.00 0.731999 3.24 13.00 10.81 10.29 14.15 4.85 1.90 1.71 0.76 0.02 1.14 0.042000 2.55 10.10 7.10 7.81 5.46 3.25 1.52 2.15 1.21 0.00 0.22 0.892001 3.09 2.46 4.20 2.17 1.98 2.25 1.72 1.60 1.84 0.32 1.27 0.542002 2.91 10.26 10.66 9.00 3.61 4.04 1.93 1.14 1.32 0.19 0.07 0.572003 0.59 3.35 12.22 8.61 3.69 7.41 4.24 0.46 0.07 0.01 0.32 0.792004 2.87 4.10 9.01 7.70 5.21 2.32 2.24 1.25 1.21 0.00 1.66 1.562005 3.80 2.53 3.89 4.25 0.41 5.97 2.79 4.26 1.84 0.29 0.13 0.242006 4.16 7.58 11.79 14.09 3.38 4.21 2.58 2.26 0.92 0.17 0.00 0.632007 1.01 15.05 8.03 4.03 4.62 2.48 2.32 1.22 0.83 0.82 0.63 1.212008 3.80 4.35 10.41 7.03 2.93 4.66 2.91 2.72 0.97 0.00 0.96 0.322009 2.42 6.01 4.85 5.53 2.04 3.43 1.72 3.53 0.23 0.17 1.29 1.32

APPENDIX H—Precipitation Data2009 Tualatin River Flow Management Report H-9
DLLP – DILLEY PRECIPITATION STATION (ID# 352325) – CONTINUEDTotal Monthly Precipitation (inches)
OCT NOV DEC JAN FEB MAR APR MAY JUN JUL AUG SEPMIN 0.14 1.32 1.60 0.27 0.41 0.69 0.51 0.07 0.07 0.00 0.00 0.00MAX 9.68 16.59 18.46 16.01 14.15 10.02 7.09 4.92 3.88 2.74 4.01 3.83MEAN 3.49 7.01 8.08 7.52 5.47 4.86 2.68 1.97 1.35 0.44 0.71 1.43*Water Year (WY) begins October 1st of the previous calendar year and ends September 30th of current year.
mean value
DLLP – Dilley Precipitation Station (ID# 352325)
195
1
0
12
16
20
Mo
nth
ly P
reci
pit
atio
n (
inch
es)
Oct Nov Dec Jan Feb Mar Apr May Jun Jul Aug Sept
WY 2009
Maximum
Mean
Minimum
Statistics(period of record:
1944–2009)
DLLP – Dilley Precipitation Station (ID# 352325)
0
20
40
70
To
tal A
nn
ual
Pre
cip
itat
ion
(in
ches
/wat
er y
ear)
200
7
195
3
195
5
195
7
195
9
196
1
196
3
196
5
196
7
196
9
197
1
197
3
197
5
197
7
197
9
198
1
198
3
198
5
200
5
Water Year
8
4 1
987
198
9
199
1
199
3
199
5
199
7
199
9
200
3
60
50
30
10
194
5
194
7
194
9
200
1
200
9

APPENDIX H—Precipitation DataH-10 2009 Tualatin River Flow Management Report
FGOP – FOREST GROVE PRECIPITATION STATION (VERBOORT)
Elevation: 180 ft Source Agency: US Bureau of Reclamation – AgrimetLatitude: 45 33 11 Longitude: 123 05 01 http://www.usbr.gov/pn/agrimet/wxdata.html
Water Year*
Total Monthly Precipitation (inches)OCT NOV DEC JAN FEB MAR APR MAY JUN JUL AUG SEP
1992 1.5 5.1 3.7 5.9 3.6 1.6 4.4 0.1 0.9 0.3 0.3 1.11993 2.4 4.2 6.0 3.2 2.2 4.2 4.9 4.2 0.6 1.1 0.1 0.01994 1.1 1.7 7.6 5.0 5.8 2.3 1.5 1.3 1.0 0.0 0.2 0.81995 6.3 7.5 7.6 9.7 4.1 5.8 3.1 1.6 1.2 0.5 0.5 1.61996 3.1 11.7 8.6 9.1 3.6 2.3 6.4 4.1 0.9 0.5 0.3 2.01997 4.5 8.0 15.0 7.6 1.8 7.8 3.3 1.8 1.8 0.2 1.3 3.31998 7.0 7.1 3.5 9.1 7.2 4.6 1.4 4.3 1.1 0.1 0.0 0.81999 3.4 13.7 9.8 9.7 15.0 5.4 1.7 1.7 1.0 0.4 0.7 0.02000 2.8 7.8 5.9 7.7 4.0 2.4 1.1 2.1 1.6 0.1 0.1 0.92001 3.1 2.6 4.3 1.7 1.7 2.1 1.7 1.1 2.1 0.4 1.2 0.62002 2.8 11.2 9.7 9.3 3.5 4.6 1.6 1.2 1.2 0.2 0.0 0.92003 0.4 3.0 12.2 10.1 3.2 6.2 5.1 0.6 0.1 0.0 0.4 0.72004 3.5 4.6 7.9 6.1 5.2 1.9 2.6 1.1 0.8 0.0 2.1 1.52005 3.8 2.8 4.4 2.5 0.7 6.0 2.6 4.1 1.6 0.2 0.1 1.32006 4.3 7.4 11.4 15.2 2.2 4.4 2.2 2.9 0.7 0.2 0.1 0.62007 1.0 15.6 8.6 3.9 4.2 2.5 2.1 0.8 0.6 0.6 0.5 1.32008 3.1 4.5 13.0 8.8 2.7 4.1 2.5 0.7 0.8 0.0 1.0 0.12009 2.7 5.7 4.7 6.1 1.9 3.7 1.8 3.4 1.2 0.1 1.1 1.3
MIN 0.4 1.7 3.5 1.7 0.7 1.6 1.1 0.1 0.1 0.0 0.0 0.0MAX 7.0 15.6 15.0 15.2 15.0 7.8 6.4 4.3 2.1 1.1 2.1 3.3MEAN 3.15 6.93 7.99 7.25 4.02 3.99 2.76 2.05 1.06 0.27 0.55 1.04*Water Year (WY) begins October 1st of the previous calendar year and ends September 30th of current year.

APPENDIX H—Precipitation Data2009 Tualatin River Flow Management Report H-11
mean value
FGOP – Forest Grove Precipitation Station (Verboort)
199
2
Mo
nth
ly P
reci
pit
atio
n (
inch
es)
Oct Nov Dec Jan Feb Mar Apr May Jun Jul Aug Sept
WY 2009
Maximum
Mean
Minimum
Statistics(period of record:
1992–2009)
FGOP – Forest Grove Precipitation Station (Verboort)
0
40
60
80
To
tal A
nn
ual
Pre
cip
itat
ion
(in
ches
/wat
er y
ear)
200
9
199
3
199
4
199
5
199
6
199
7
199
8
199
9
200
0
200
1
200
2
200
3
Water Year
0
12
16
20
8
4
20
200
4
200
5
200
6
200
7
200
8

APPENDIX H—Precipitation DataH-12 2009 Tualatin River Flow Management Report
DURP – DURHAM WASTEWATER TREATMENT PLANT PRECIPITATION STATION
Elevation: 140 ftLatitude: 45 23 59 Longitude: 122 45 45 Source Agency: US Geological Survey
Water Year*
Total Monthly Precipitation (inches)†
OCT NOV DEC JAN FEB MAR APR MAY JUN JUL AUG SEP2001 1.5 0.8 0.7 0.72002 3.8 6.9 5.9 5.4 3.4 3.5 2.1 1.6 1.3 0.5 0.2 2.22003 0.4 2.6 10.4 8.1 3.2 4.7 5.5 1.3 0.4 0.0 0.4 0.92004 2.5 4.7 8.9 4.8 4.7 1.2 1.3 1.1 1.3 0.0 2.1 1.82005 3.1 2.4 3.7 1.7 0.6 3.5 3.1 4.1 1.6 0.4 0.0 1.82006 2.9 5.8 9.7 9.7 2.1 2.7 2.1 3.0 0.9 0.0 0.0 0.62007 1.1 13.4 7.5 3.6 5.5 3.2 2.6 1.6 0.9 0.5 0.7 2.02008 3.9 4.1 11.3 6.9 2.4 4.4 2.8 1.6 1.2 0.1 1.3 0.32009 3.2 5.4 3.7 5.5 1.9 3.1 1.8 3.7 0.8 0.1 0.7 1.4
MIN 0.4 2.4 3.7 1.7 0.6 1.2 1.3 1.1 0.4 0.0 0.0 0.3MAX 3.9 13.4 11.3 9.7 5.5 4.7 5.5 4.1 1.6 0.5 2.1 2.2MEAN 2.61 5.67 7.64 5.72 2.97 3.30 2.66 2.25 1.04 0.20 0.68 1.38*Water Year (WY) begins October 1st of the previous calendar year and ends September 30th of current year.†The USGS adjusted all historical values for precipitation at the Durham Wastewater Treatment Plant in 2006 to correct for systematic undercatch of rainfall.

APPENDIX H—Precipitation Data2009 Tualatin River Flow Management Report H-13
mean value
DURP – Durham Wastewater Treatment Plant Precipitation Station†
0
6
8
14M
on
thly
Pre
cip
itat
ion
(in
ches
)
Oct Nov Dec Jan Feb Mar Apr May Jun Jul Aug Sept
WY 2009
Maximum
Mean
Minimum
Statistics(period of record:
2001–2009)
DURP – Durham Wastewater Treatment Plant Precipitation Station†
0
20
30
50
To
tal A
nn
ual
Pre
cip
itat
ion
(in
ches
/wat
er y
ear)
2009 2001 2002 2003
Water Year
4
2
10
incompletedata
2004
10
40
2005
†The USGS adjusted all historical values for precipitation at the Durham Wastewater Treatment Plant in 2006 to correct for systematic undercatch of rainfall.
12
2006 2007 2008

APPENDIX H—Precipitation DataH-14 2009 Tualatin River Flow Management Report
(this page intentionally blank)

Appendix I
River Mile Indices

APPENDIX I—River Mile IndicesI-2 2009 Tualatin River Flow Management Report
STREAMS INDEXED
Fanno Creek
Cr
Cr
Cr
S. Rock
McF
ee C
r
Christensen
Creek
Creek
Rock
Gales
Creek
SCHO
Scog
Barney Reservoir
Scoggins Reservoir
Lake Oswego
WI L L A M
E T T E RI V
ER
TU
AL
R
Streams that are Indexed
Withdrawal Points
Wastewater Treatment Plants
Dairy
Creek
Burris Cr
He Cr
Baker CrChicken
Cedar Cr
Canal
(Hagg Lake)
Ash C
r
Hedges C
r
Sain Cr
Ta
gins
Car
pe
Dawson Cr
Beav
erto
n C
reek
nner Cr
nter
Cr
onat
Lake Oswego
AT
IN
VE
RI
Coun
cilC
r
S. Johns on Cr
Saum C
r
Springbrook Cr
Butte rnu t Cr
CreekMcKay
East
West Fork
Fork
Brons
CedarMill Cr
on Cr
North
SCHEMATIC MAP
Not to Scale

APPENDIX I—River Mile Indices2009 Tualatin River Flow Management Report I-3
STREAMS INDEXED
STREAM NAME HYDROLOGIC UNIT CODE PAGE
Tualatin River 211400300 I-4
Fanno Creek 2114003000180 I-7
Rock Creek 2114003000420 I-8
Beaverton Creek 2114003000420060 I-9
Dairy Creek 2114003000480 I-10
McKay Creek 2114003000480020 I-11
East Fork Dairy Creek 2114003000480080 I-12
West Fork Dairy Creek 2114003000480090 I-13
Gales Creek 2114003000560 I-14
Scoggins Creek 2114003000640 I-15

APPENDIX I—River Mile IndicesI-4 2009 Tualatin River Flow Management Report
TUALATIN RIVER — RIVER MILE INDEXHUC: 211400300[Elevation measured relative to 0.00 gage datum; Abbreviations: RB= right bank, LB= left bank, HUC= Hydrologic Unit Code]
River Mile Bank DescriptionDrainage Area(square miles)
Elevation(feet)
0.00 Mouth of Tualatin River at Willamette River(LB of Willamette River @ River Mile 28.5)
712
0.20 Weiss Bridge – Petes Mtn Rd.
1.60 RB Fields Creek (HUC: 02114003000010)
1.69 State Hwy 212 Bridge (Fields Bridge)
1.75 LB West Linn Stream Gage Station – USGS #14207500 706 85.61
2.40 LB Tate Creek (HUC: 02114003000020)
3.45 Lake Oswego Corp. Diversion Dam
4.25 Interstate 205 Bridge
4.56 LB Wilson Creek (HUC: 02114003000080)
5.34 LB Boat Launch
5.36 LB Shipley Creek (HUC: 02114003000100)
5.38 Shipley Bridge– Stafford Rd.NWS Wire Weight Gage
5.62 LB Pecan Creek (HUC: 02114003000120)
6.02 RB Athey Creek (HUC: 02114003000123)
6.70 RB Saum Creek (HUC: 02114003000130)
6.70LB
Oswego Canal DiversionRiver Elevation Recording Gage #14206990, Headgate, andCanal Recording Gage #14207000
7.36 LB Boat Launch – Dogwood Drive
7.67 RB Browns Ferry Park Canoe Launch
7.83 Clackamas County – Washington County Boundary(Underground Cable Crossing Sign)
8.18 Interstate 5 Bridge
8.60 Boones Ferry Road Bridge
8.64 RB Hedges Creek (HUC: 02114003000150)
8.90 RB Tualatin Park Boat Launch
8.91RB
Southern Pacific RR BridgeTualatin River at Tualatin Elevation Recording Station #14206956(formerly #14206960)
9.32 LB Fanno Creek (HUC: 02114003000180) [Index on page I-13] 26.8
9.33 LB Durham Wastewater Treatment Plant Outfall
9.34 Oregon Electric RR Bridge
9.80 LB Cook Park Boat Launch
11.50LB
US Hwy. 99W Bridge (Pacific Highway)Canoe Launch(access from southeast of bridge)
12.68 Overhead BPA Transmission Line; Vancouver–Eugene
12.80 LB Rivermeade Boat Launch (Private)
15.20 RB Rock Creek–South (HUC: 02114003000250) 13.7
15.50 RB Chicken Creek (HUC: 02114003000270)
16.09 RB Chicken Creek Drainage Ditch
16.22RB
Shamberg Bridge (Elsner Road)Rated Staff Gage for Stream Flow

APPENDIX I—River Mile Indices2009 Tualatin River Flow Management Report I-5
21.12 Overhead BPA Transmission Line; Big Eddy–Keeler
26.90 State Hwy. 210 bridge (Scholls)
28.20 RB McFee Creek (HUC: 02114003000310)
30.76 LB Unnamed Stream (HUC: 02114003000320) (Jacktown)
31.62 RB Burris Creek (HUC: 02114003000330)
31.92 RB Christensen Creek (HUC: 02114003000350)
33.30LB
Harris Bridge (State Highway 208)Farmington Recording Stream Gage #14206500
568 100.42
35.68 LB Butternut Creek (HUC: 02114003000380)
37.38 LB Gordon Creek (HUC: 02114003000400)
38.08 LB Rock Creek Wastewater Treatment Plant Outfall
38.09 LB Rock Creek (HUC: 02114003000420Beaverton Creek (HUC:02114003000420060)
74.636
38.44 LB
LB
Rood Bridge Small Watercraft LaunchRood Bridge Road BridgeRecording Stream Gage #14206295 105.16
40.44 RB Davis Creek (HUC: 02114003000430)
41.64 Minter Bridge Road Bridge
43.88 LB
LB
Jackson SloughJackson Bottom WetlandsHillsboro Wastewater Treatment Plant Effluent Outfall
44.40RB
State Highway 219 BridgeRecording Stream Gage #14206241
44.73 LB Dairy Creek (HUC: 02114003000480) [Index on page I-9]McKay Creek (LB) (HUC: 02114003000480020) [Index on page I-10]East Fork Dairy Creek (HUC: 02114003000480080) [Index on page I-11]West Fork Dairy Creek (HUC: 02114003000480090) [Index on page I-12]
22663.4
51.54RB
Golf Course Road BridgeGolf Course Recording Stream Gage #14204800
53.74 LaFollett Road (Bridge removed)
55.24 LB Forest Grove Wastewater Treatment Plant OutfallFern Hill Wetlands
55.32 Fernhill Road Bridge
56.10 Springhill Pump Plant Intake
56.80 LB Gales Creek (HUC: 02114003000560) [Index on page I-8] 78.6
57.38 LB Carpenter Creek (HUC: 02114003000580)
57.84 LB Dilley Creek (HUC: 02114003000600)
58.04 LB Johnson Creek (HUC: 02114003000602)
58.82LB
Springhill Road BridgeTualatin River at Dilley Stream Gage; USGS #14203500
125 147.57
59.02 LB O'Neil Creek (HUC: 02114003000620)
60.00 LB Scoggins Creek (HUC: 02114003000640) [Index on page I-7]
60.80 RB Wapato Creek (HUC: –02114003000670)Wapato Creek Improvement District Return Flow
62.00 RB Wapato Improvement District Headgate)
62.24 Southern Pacific RR Bridge
TUALATIN RIVER — RIVER MILE INDEXHUC: 211400300[Elevation measured relative to 0.00 gage datum; Abbreviations: RB= right bank, LB= left bank, HUC= Hydrologic Unit Code]
River Mile Bank DescriptionDrainage Area(square miles)
Elevation(feet)

APPENDIX I—River Mile IndicesI-6 2009 Tualatin River Flow Management Report
62.25 State Highway 47 Bridge (Gaston)New Tualatin River at Gaston Recording Stream Gage #14202510
62.30 Bates Road Bridge
62.80 LB Black Jack Creek (HUC: 02114003000700)
62.90 Overhead BPA Transmission Line; Forest Grove–McMinnville
63.13 TVID Patten Valley Pump Station Outfall #1
63.87 RB Discontinued Tualatin River at Gaston Recording Stream Gage 48.5
64.26 TVID Patten Valley Pump Station Outfall #2
65.34 RB Williams Canyon (HUC: 02114003000730)
65.90 Mt. Richmond Road Bridge
67.30 LB Hering Creek (HUC: 02114003000760)
67.83 South Road Bridge (Cherry Grove)
68.44 RB Roaring Creek (HUC: 02114003000790)
69.42 Little Lee Falls
70.70LB
Raines Bridge– Tualatin River below Lee FallsRated Staff Gage for Stream Flow
71.07 Lee Falls
73.28 Haines Falls
73.30 LB City of Hillsboro Haines Falls Intake
74.00 LB Lee Creek (LB–02114003000860)
74.05 RB Patten Creek (HUC: 02114003000870)
75.70 LB Sunday Creek (HUC: 02114003000900)
76.60 LB Maple Creek (HUC: –02114003000940)
76.95 Ki–A–Cut Falls
78.00 RB Barney Reservoir Aqueduct Outfall
79.3+ Headwaters of Tualatin River
TUALATIN RIVER — RIVER MILE INDEXHUC: 211400300[Elevation measured relative to 0.00 gage datum; Abbreviations: RB= right bank, LB= left bank, HUC= Hydrologic Unit Code]
River Mile Bank DescriptionDrainage Area(square miles)
Elevation(feet)
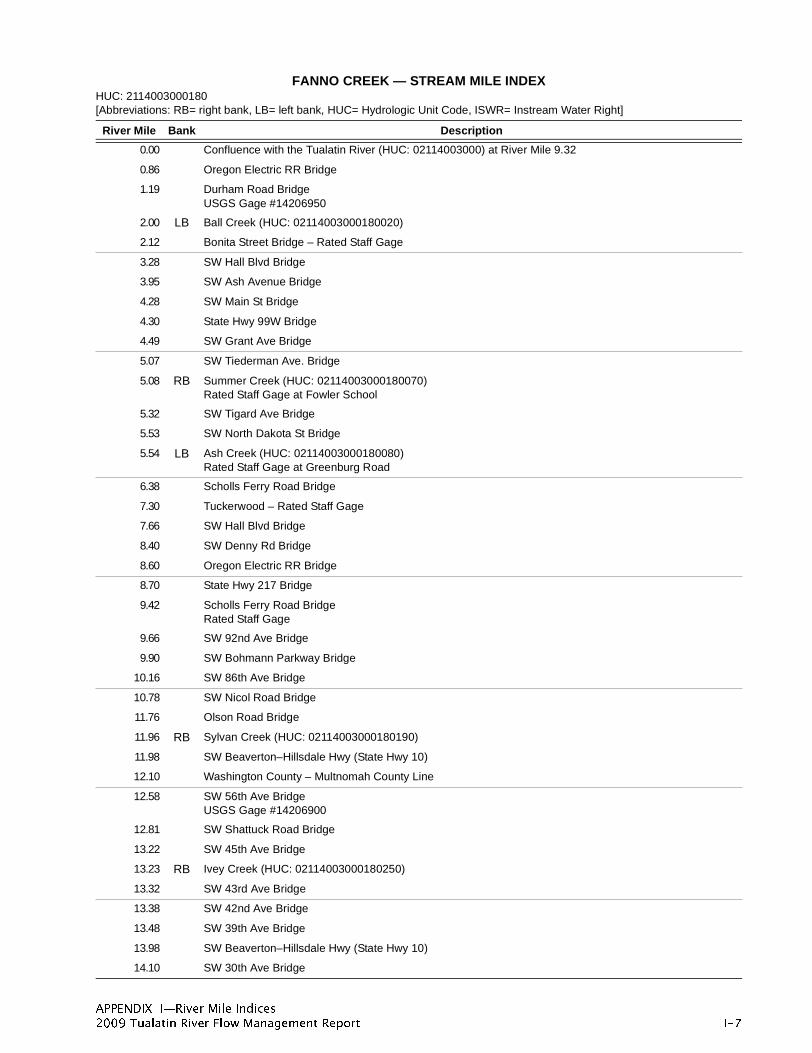
APPENDIX I—River Mile Indices2009 Tualatin River Flow Management Report I-7
FANNO CREEK — STREAM MILE INDEXHUC: 2114003000180[Abbreviations: RB= right bank, LB= left bank, HUC= Hydrologic Unit Code, ISWR= Instream Water Right]
River Mile Bank Description
0.00 Confluence with the Tualatin River (HUC: 02114003000) at River Mile 9.32
0.86 Oregon Electric RR Bridge
1.19 Durham Road BridgeUSGS Gage #14206950
2.00 LB Ball Creek (HUC: 02114003000180020)
2.12 Bonita Street Bridge – Rated Staff Gage
3.28 SW Hall Blvd Bridge
3.95 SW Ash Avenue Bridge
4.28 SW Main St Bridge
4.30 State Hwy 99W Bridge
4.49 SW Grant Ave Bridge
5.07 SW Tiederman Ave. Bridge
5.08 RB Summer Creek (HUC: 02114003000180070)Rated Staff Gage at Fowler School
5.32 SW Tigard Ave Bridge
5.53 SW North Dakota St Bridge
5.54 LB Ash Creek (HUC: 02114003000180080)Rated Staff Gage at Greenburg Road
6.38 Scholls Ferry Road Bridge
7.30 Tuckerwood – Rated Staff Gage
7.66 SW Hall Blvd Bridge
8.40 SW Denny Rd Bridge
8.60 Oregon Electric RR Bridge
8.70 State Hwy 217 Bridge
9.42 Scholls Ferry Road BridgeRated Staff Gage
9.66 SW 92nd Ave Bridge
9.90 SW Bohmann Parkway Bridge
10.16 SW 86th Ave Bridge
10.78 SW Nicol Road Bridge
11.76 Olson Road Bridge
11.96 RB Sylvan Creek (HUC: 02114003000180190)
11.98 SW Beaverton–Hillsdale Hwy (State Hwy 10)
12.10 Washington County – Multnomah County Line
12.58 SW 56th Ave BridgeUSGS Gage #14206900
12.81 SW Shattuck Road Bridge
13.22 SW 45th Ave Bridge
13.23 RB Ivey Creek (HUC: 02114003000180250)
13.32 SW 43rd Ave Bridge
13.38 SW 42nd Ave Bridge
13.48 SW 39th Ave Bridge
13.98 SW Beaverton–Hillsdale Hwy (State Hwy 10)
14.10 SW 30th Ave Bridge

APPENDIX I—River Mile IndicesI-8 2009 Tualatin River Flow Management Report
ROCK CREEK — STREAM MILE INDEXHUC: 2114003000420[Abbreviations: RB= right bank, LB= left bank, HUC= Hydrologic Unit Code]
River Mile Bank Description
0.8 River Road Bridge
1.2 Southern Pacific RR Bridge
1.2+ State Highway 8 Bridge – Rated Staff Gage for Stream Flow
2.4 SW Brookwood Avenue Bridge
3.1 RB Dawson Creek
4.4 LB Beaverton Creek
4.5 Baseline Road Bridge
4.9 NW Quatama Road Bridge – Rated Staff Gage for Stream Flow
5.5 Oregon Electric RR Bridge
5.7 NW 216th Avenue Bridge
6.7 NW Cornell Road Bridge
7.8 US Highway 26 Bridge
9.0 West Union Road Bridge – Rated Staff Gage for Stream Flow
9.3 RB Holcomb Creek
10.0 NW 185th Avenue Bridge
10.9 LB Abbey Creek
11.0 Germantown Road Bridge
11.9 Cornelius Pass Road Bridge
13.0 Old Cornelius Pass Road Bridge
14.1 Burlington Northern RR Bridge
15.1 Rated Staff Gage for Stream Flow
16.4 Rock Creek Road Bridge
16.5 Van Raden Reservoir
19.1 Headwaters

APPENDIX I—River Mile Indices2009 Tualatin River Flow Management Report I-9
BEAVERTON CREEK — STREAM MILE INDEXHUC: 2114003000420060[Abbreviations: RB= right bank, LB= left bank, HUC= Hydrologic Unit Code]
River Mile Bank Description
0.00 Confluence with Rock Creek (LB, HUC: 02114003000480080260) @ River Mile 4.3
0.40 Southwest Baseline Road
1.16 Southwest 216th Avenue Road Bridge– Rated Staff Gage for Stream Flow
2.20 RB Bronson Creek (HUC: 02114003000420060010)
3.32 RB Willow Creek (HUC: 02114003000420060050)
4.90 Southwest 170th Avenue Road Bridge– Rated Staff Gage for Stream Flow
5.47 LB Unnamed Stream (HUC: 02114003000420060096)
6.06 LB Johnson Creek (HUC: 02114003000420060100)
6.30 LB Unnamed Stream (HUC: 02114003000420060120)
6.66 Oregon Electric Railroad
7.45 Cedar Hills Boulevard
7.90 RB Reasoners Creek (HUC: 02114003000420060130)
8.75+ Headwaters

APPENDIX I—River Mile IndicesI-10 2009 Tualatin River Flow Management Report
DAIRY CREEK — STREAM MILE INDEXHUC: 02114003000480[Abbreviations: RB= right bank, LB= left bank, HUC= Hydrologic Unit Code]
River Mile Bank Description
0.00 Confluence with Tualatin River (HUC: 0211400300) @ River Mile 44.73
1.65 Southern Pacific RR Bridge
2.06 State Highway 8 BridgeDairy Creek at TV Hwy Recording Stream Gage #14206200
2.20 Oregon Electric RR Bridge
2.26 LB McKay Creek (HUC: 02114003000480020)
3.53 RB Council Creek (HUC: 02114003000480040)
6.02 Susbauer Road Bridge (County Road 196)
7.39 BPA Power Line Crossing
8.51 Cornelius–Schefflin Road Bridge (County Road 2161)Rated Staff Gage for Stream Flow
10.55 Confluence of East Fork Dairy Ck (HUC: 02114003000480080) & West Fork Dairy Ck (02114003000480090)

APPENDIX I—River Mile Indices2009 Tualatin River Flow Management Report I-11
MC KAY CREEK — STREAM MILE INDEXHUC: 2114003000480020[Abbreviations: RB= right bank, LB= left bank, HUC= Hydrologic Unit Code]
River Mile Bank Description
0.00 Confluence with Dairy Creek (HUC: 02114003000480) @ River Mile 2.26
1.31 Padgett Road Bridge (County Road 2245)
2.25 Hornecker Road Bridge (County Road 2393)Rated Staff Gage for Stream Flow
2.30 Southern Pacific RR Crossing
4.32 Glencoe Road Bridge (County Road A–146½)Rated Staff Gage for Stream Flow
4.46 BPA Transmission Line Crossing
5.34 LB Waible Creek (HUC: 02114003000480020040)
6.30 NW Old Scotch Church Road Bridge (County Road A–66)
8.00 US Hwy 26 Bridge – Sunset Highway
9.36 NW West Union Road Bridge (County Road 2496)City of North Plains to West
9.38 Southern Pacific RR Crossing
10.94 LB Jackson Creek (HUC: 02114003000480020100)
12.80 NW Shadybrook Road Bridge (County Road A–110)
15.56 NW Collins Road Bridge (County Road 1889)Rated Staff Gage for Stream Flow
16.56 RB Brunswick Canyon (HUC: 02114003000480020179)
16.66 LB East Fork McKay Creek (HUC: 02114003000480020180)
24.0+ Headwaters
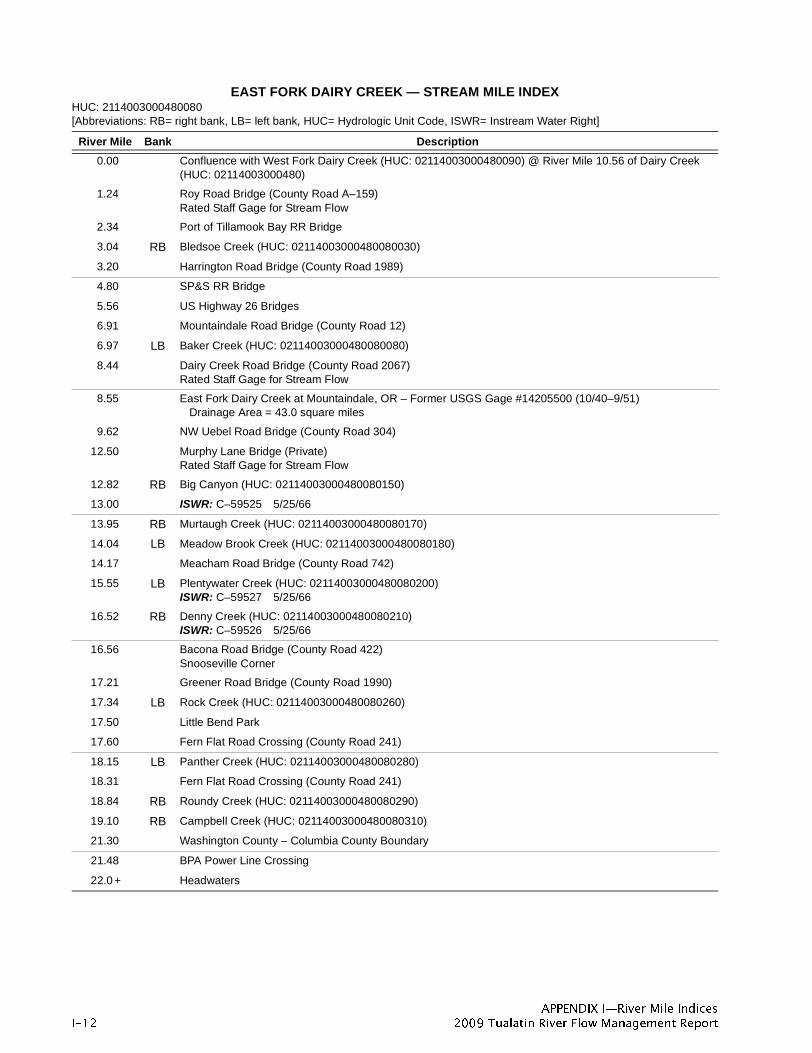
APPENDIX I—River Mile IndicesI-12 2009 Tualatin River Flow Management Report
EAST FORK DAIRY CREEK — STREAM MILE INDEXHUC: 2114003000480080[Abbreviations: RB= right bank, LB= left bank, HUC= Hydrologic Unit Code, ISWR= Instream Water Right]
River Mile Bank Description
0.00 Confluence with West Fork Dairy Creek (HUC: 02114003000480090) @ River Mile 10.56 of Dairy Creek (HUC: 02114003000480)
1.24 Roy Road Bridge (County Road A–159)Rated Staff Gage for Stream Flow
2.34 Port of Tillamook Bay RR Bridge
3.04 RB Bledsoe Creek (HUC: 02114003000480080030)
3.20 Harrington Road Bridge (County Road 1989)
4.80 SP&S RR Bridge
5.56 US Highway 26 Bridges
6.91 Mountaindale Road Bridge (County Road 12)
6.97 LB Baker Creek (HUC: 02114003000480080080)
8.44 Dairy Creek Road Bridge (County Road 2067)Rated Staff Gage for Stream Flow
8.55 East Fork Dairy Creek at Mountaindale, OR – Former USGS Gage #14205500 (10/40–9/51)Drainage Area = 43.0 square miles
9.62 NW Uebel Road Bridge (County Road 304)
12.50 Murphy Lane Bridge (Private)Rated Staff Gage for Stream Flow
12.82 RB Big Canyon (HUC: 02114003000480080150)
13.00 ISWR: C–59525 5/25/66
13.95 RB Murtaugh Creek (HUC: 02114003000480080170)
14.04 LB Meadow Brook Creek (HUC: 02114003000480080180)
14.17 Meacham Road Bridge (County Road 742)
15.55 LB Plentywater Creek (HUC: 02114003000480080200)ISWR: C–59527 5/25/66
16.52 RB Denny Creek (HUC: 02114003000480080210)ISWR: C–59526 5/25/66
16.56 Bacona Road Bridge (County Road 422)Snooseville Corner
17.21 Greener Road Bridge (County Road 1990)
17.34 LB Rock Creek (HUC: 02114003000480080260)
17.50 Little Bend Park
17.60 Fern Flat Road Crossing (County Road 241)
18.15 LB Panther Creek (HUC: 02114003000480080280)
18.31 Fern Flat Road Crossing (County Road 241)
18.84 RB Roundy Creek (HUC: 02114003000480080290)
19.10 RB Campbell Creek (HUC: 02114003000480080310)
21.30 Washington County – Columbia County Boundary
21.48 BPA Power Line Crossing
22.0 + Headwaters

APPENDIX I—River Mile Indices2009 Tualatin River Flow Management Report I-13
WEST FORK DAIRY CREEK — STREAM MILE INDEXHUC: 2114003000480090[Abbreviations: RB= right bank, LB= left bank, HUC= Hydrologic Unit Code]
River Mile Bank Description
0.00 Confluence with East Fork Dairy Creek (HUC: 02114003000480080) @ River Mile 10.56 of Dairy Creek (HUC: 02114003000480)
1.96 Evers Road Bridge (County Road A–187)Rated Staff Gage for Stream Flow
2.09 RB Lousignant Canal (HUC: 02114003000480090010)
2.82 State Highway 47 Bridge
5.28 Greenville Road Bridge (County Road A–159)
6.20 State Highway 6 Bridge
6.22 RB Cedar Canyon Creek (HUC: 02114003000480090110)
7.53 Cedar Canyon Road Bridge (County Road 1938)City of Banks to SE
7.70 State Hwy 47 Bridge – Rated Staff Gage for Stream FlowWest Fork Dairy Creek at Banks, OR –Former USGS Gage #14205000 (10/40 – 9/43)
Drainage Area = 47.5 square miles
7.72 Port of Tillamook Bay RR Bridge
9.30 US Highway 26 Bridge
10.60 NW Green Mountain Road Bridge (County Road 127)
11.02 LB Garrigus Creek (HUC: 02114003000480090180)
12.19 NW Turk Road Bridge (County Road 233)
12.36 RB Kuder Creek (HUC: 02114003000480090190)
12.90 NW Pihl Road Bridge (County Road 1045)Community of Manning
13.33 Port of Tillamook Bay RR Bridge
13.48 Port of Tillamook Bay RR Bridge
13.58 LB Witcher Creek (HUC: 02114003000480090200)
14.37 Port of Tillamook Bay RR Bridge
14.50 US Highway 26 Bridge
15.00 NW Fisher Road Bridge (County Road 394)
15.11 LB Mendenhall Creek (HUC: 02114003000480090220)
15.58 RB Burgholzer Creek (HUC: 02114003000480090230)
15.60 US Highway 26 Bridge
16.00 Community of Buxton – ½ mile east
17.02 LB Williams Creek (HUC: 02114003000480090240)
17.98 RB Cummings Creek (HUC: 02114003000480090250)
18.10 State Highway 47 Bridge
18.85 Port of Tillamook Bay RR Bridge
22+ Headwaters

APPENDIX I—River Mile IndicesI-14 2009 Tualatin River Flow Management Report
GALES CREEK — STREAM MILE INDEXHUC: 2114003000560[Abbreviations: RB= right bank, LB= left bank, HUC= Hydrologic Unit Code, ISWR= Instream Water Right]
River Mile RB Description
0.00 Confluence with Tualatin River (HUC: 0211400300) @ River Mile 56.80ISWR: C–59523 5/25/66
1.63 Southern Pacific RR Bridge
1.75 Forest Grove Bypass Bridge – State Highway 47 to State Highway 8
2.36 State Highway 47 BridgeGales Creek Recording Stream Gage #14204530
3.66 Ritchey Road Bridge (County Road 461)
6.53 RB Prickett Creek (HUC: 02114003000560090)
6.98 Stringtown Road Bridge (County Road A–176)
7.70 RB Roderick Creek (HUC: 02114003000560110)
8.56 Roderick Road Bridge (County Road 395)Gales Creek near Forest Grove Oregon – Former USGS Gage #14204500 (10/40–9/56 & 10/70–9/81)
8.94 RB Godfrey Creek (HUC: 02114003000560130)
9.22 LB Kelly Creek (HUC: 02114003000560120)
10.68 RB Clear Creek (HUC: 02114003000560150)
11.44 RB Iler Creek (HUC: 02114003000560170)
11.46 NW Gales Creek Road (County Road 1312)Community of Gales Creek
11.47 RB Fir Creek (HUC: 02114003000560190)
12.00 ISWR: C–59509 5/25/66 above this point
12.36 Clapshaw Hill Road Bridge (County Road 2037)Rated Staff Gage for Stream Flow
12.40 LB Little Beaver Creek (HUC: 02114003000560200)
ISWR: C–59512 5/25/66
12.92 Parson Road Bridge
14.44 RB White Creek (HUC: 02114003000560210)
14.68 NW Wilson River Highway Bridge (State Highway 6)
15.74 RB Lyda Creek (HUC: 02114003000560230)
16.26 RB Bateman Creek (HUC: 02114003000560250)
17.50 Gales Creek near Gales Creek, OR – Former USGS Gage #1420400 (10/35–9/45 & 10/639/70)
18.00 LB Beaver Creek (HUC: 02114003000560280)Community of GlenwoodISWR: C–59524 5/25/66
18.45 NW Timber Road Bridge (County Road 374)
18.65 Wilson River Highway Bridge (State Highway 6)
19.70 Wilson River Highway Bridge (State Highway 6)
19.88 LB Coffee Creek (HUC: 02114003000560300)
20.07 LB Finger Creek (HUC: 02114003000560305)
20.70 RB South Fork Gales Creek (HUC: 02114003000560310)ISWR: C–59514 5/25/66
21.60 LB North Fork Gales Creek (HUC: 02114003000560320)ISWR: C–59513 5/25/66
22.76 RB Low Divide Creek (HUC: 02114003000560330)
Gales Creek Forest Park
23.20 Gales Creek near Glenwood, OR – USGS Gage #14203750 (7/94 – present)

APPENDIX I—River Mile Indices2009 Tualatin River Flow Management Report I-15
SCOGGINS CREEK — STREAM MILE INDEXHUC: 2114003000640[Abbreviations: RB= right bank, LB= left bank, HUC= Hydrologic Unit Code]
River Mile Bank Description
0.00 Confluence with Tualatin River (HUC: 0211400300) @ River Mile 60.00
0.94 RR Bridge
1.00 State Highway 47 Bridge
1.70 Old State Highway 47 Bridge
1.71 Scoggins Creek near Gaston, OR – Former USGS Gage #14203000 (10/1940 – 9/1974)Drainage Area = 43.3 square miles
4.80 Scoggins Creek below Henry Hagg Lake, near Gaston, OR – USGS Gage #14202980 (1/1975 –present)Drainage Area = 38.8 square miles
5.10 Scoggins Dam
7.00 RB Sain Creek (HUC: 02114003000640170)
7.62 LB Tanner Creek (HUC: 02114003000640200)
8.40 LB Wall Creek (HUC: 02114003000640220)
9.00 Lake Loop Road Bridge
9.30 Scoggins Creek above Henry Hagg, near Gaston, OR – Gage #14202850 (10/1972 – present)Drainage Area = 15.9 square miles
10.52 LB Parson Creek (HUC: 02114003000640240)
15.50 LB Fisher Creek (HUC: 02114003000640300)