Embed Size (px)
Citation preview

Stock code:8021
2008 Annual Report Taiwan Stock Exchange Market Observation Post System:http://newmops.tse.com.tw
Published on April 30, 2009

Topoint Technology Co., Ltd. 1. Spokesperson
Name: Davidj Lin Title: Manager of the Audit Office Tel.: 886-2-2680-5868 ext. 809 E-mail address: [email protected]
Acting Spokesperson Name: Karen Lin Title: Special Assistant to Chairman Tel.: 886-2-2680-5868 ext. 818
E-mail address: [email protected]
2. Addresses and telephone number of Headquarter and Factory Address: No.203, Sec.3, Jiayuan Road, Shulin City, Taipei, Taiwan(R.O.C.) Tel.: 886-2-2680-5868
3. Stock transfer agent
Taiwan International Securities Group Address: B2F., No. 97, Sec. 2, Dunhua S. Rd., Taipei Tel.: 886-2-2705-8280 Website: www.tisc.com.tw
4. Auditors Deloittee & Touche Auditors: Xie Jian-xin, Chen Chao-mei Address: 12F., No. 156, Sec. 3, Minsheng E. Rd., Taipei Tel.: 886-2-2545-9988
Website: www.deloitte.com.tw
5. Name of the institute for oversea negotiable security trade : None 6. Company website:www.topoint.tw

Table of contents page
I . A Le t te r t o Sha reho lde rs . . . . . . . . . . . . . . . . . . . . . . . . . . . . . . . . . . . . . . . . . . . . . . . 1~3 I I . I n t roduc t ion o f Corpora t ion . . . . . . . . . . . . . . . . . . . . . . . . . . . . . . . . . . . . . . . . . . . . 4~5
1 . E s t a b l i s h m e n t D a t e . . . . . . . . . . . . . . . . . . . . . . . . . . . . . . . . . . . . . . . . . . . . . . . 4 2 . D e v e l o p m e n t h i s t o r y . . . . . . . . . . . . . . . . . . . . . . . . . . . . . . . . . . . . . . . . . . . . . . 4
III. Corporate Governance Report......................................... 6~25 1 . O r g a n i z a t i o n S y s t e m . . . . . . . . . . . . . . . . . . . . . . . . . . . . . . . . . . . . . . . . . . . . . . 6 2. Directors, Supervisors, President, Vice president, Assistant V.P., and
d e p a r t m e n t h e a d s . . . . . . . . . . . . . . . . . . . . . . . . . . . . . . . . . . . . . . . . . . . . . . . . 8 3 . B u s i n e s s m a n a g e m e n t . . . . . . . . . . . . . . . . . . . . . . . . . . . . . . . . . . . . . . . . . . . . 16 4 . C P A ’ s F e e s . . . . . . . . . . . . . . . . . . . . . . . . . . . . . . . . . . . . . . . . . . . . . . . . . . . . . . 22 5. CPA’s information................................................. 23 6. The Chairman, President, and financial or accounting manager of the
company who had worked for the independent auditor or the related par ty in the most recent years . . . . . . . . . . . . . . . . . . . . . . . . . . . . . . . . . . . . 24
7. Information on Net Change in Shareholding and Net Chang in Shares Pledged by Directors, Supervisors, Department Heads, and Shareholders 10% sha reho ld ing o r more . . . . . . . . . . . . . . . . . . . . . . . . . . . . . . . . . . . . . . . . . 24
8. The relation of the top ten shareholders as defined by Finance Standard A r t i c l e 6 . . . . . . . . . . . . . . . . . . . . . . . . . . . . . . . . . . . . . . . . . . . . . . . . . . . . . . . . . 24
9. Investment form Directors, Supervisors, Managers and directly or ind i rec t ly cont ro l led bus inesses. . . . . . . . . . . . . . . . . . . . . . . . . . . . . . . . . . . . . 25
I V . S t o c k s u b s c r i p t i o n . . . . . . . . . . . . . . . . . . . . . . . . . . . . . . . . . . . . . . . . . . . . . . . . . . . 26~33 1 . C a p i t a l a n d s h a r e s . . . . . . . . . . . . . . . . . . . . . . . . . . . . . . . . . . . . . . . . . . . . . . . . 26 2 . C o r p o r a t e b o n d s . . . . . . . . . . . . . . . . . . . . . . . . . . . . . . . . . . . . . . . . . . . . . . . . . . 32 3 . P r e f e r r e d s t o c k . . . . . . . . . . . . . . . . . . . . . . . . . . . . . . . . . . . . . . . . . . . . . . . . . . . 32 4 . A D R / G D R . . . . . . . . . . . . . . . . . . . . . . . . . . . . . . . . . . . . . . . . . . . . . . . . . . . . . . . 32 5. Employees stock opt ion cert i f icates.. . . . . . . . . . . . . . . . . . . . . . . . . . . . . . . . . 32 6. Merger and acquisition (including merger, acquisition, and split) ........ 33 7 . Fund imp lementa t ion p lan . . . . . . . . . . . . . . . . . . . . . . . . . . . . . . . . . . . . . . . . . . 33
V. Overv iew of bus iness operat ion. . . . . . . . . . . . . . . . . . . . . . . . . . . . . . . . . . . . . . . . 34~45 1 . P r i n c i p a l a c t i v i t i e s . . . . . . . . . . . . . . . . . . . . . . . . . . . . . . . . . . . . . . . . . . . . . . . . . 34 2. Market analysis and the condition of sale and production .............. 39 3 . S t a t u s o f e m p l o y e e s . . . . . . . . . . . . . . . . . . . . . . . . . . . . . . . . . . . . . . . . . . . . . . . 43 4. Expenditure on Environmental Protection ............................ 43 5. Employee / Employer re la t ion. . . . . . . . . . . . . . . . . . . . . . . . . . . . . . . . . . . . . . . 43 6 . I m p o r t a n t a g r e e m e n t s . . . . . . . . . . . . . . . . . . . . . . . . . . . . . . . . . . . . . . . . . . . . . 45
VI. Financial information................................................ 46~98

page 1. Condensed Balance Sheet and Income Statement of the last five years.. 46 2. Financial Analysis in the past five years.............................. 48 3. Supervisor’s report in the most recent years.......................... 52 4. Financial statements in the most recent years......................... 53 5. Consolidated financial statements in the most recent years............. 93 6. Impact of financial difficulties of the Company and related party on the
Company ’s f i nanc ia l pos i t i on . . . . . . . . . . . . . . . . . . . . . . . . . . . . . . . . . . . . . . . 54 VII. Review of financial position, management performance and risk
m a n a g e m e n t . . . . . . . . . . . . . . . . . . . . . . . . . . . . . . . . . . . . . . . . . . . . . . . . . . . . . . . 99~1051 . F i n a n c i a l p o s i t i o n . . . . . . . . . . . . . . . . . . . . . . . . . . . . . . . . . . . . . . . . . . . . . . . . . 99 2 . Managemen t pe r f o rm ance . . . . . . . . . . . . . . . . . . . . . . . . . . . . . . . . . . . . . . . . . 100 3 . Ana l ys i s o f cas h f l ow . . . . . . . . . . . . . . . . . . . . . . . . . . . . . . . . . . . . . . . . . . . . . . 101 4. Impact of major capital expenditure on finance and business............ 101 5. Policies, reasons for gain or loss and action plan in regard to investment
plans in current year and the next year.............................. 102 6 . R i s k m a n a g e m e n t . . . . . . . . . . . . . . . . . . . . . . . . . . . . . . . . . . . . . . . . . . . . . . . . . 103 7 . O the r impor tan t ma t te rs . . . . . . . . . . . . . . . . . . . . . . . . . . . . . . . . . . . . . . . . . . . . 105
V I I I . S p e c i a l d i s c l o s u r e s . . . . . . . . . . . . . . . . . . . . . . . . . . . . . . . . . . . . . . . . . . . . . . . . . 106~1081 . R e l a t e d p a r t y . . . . . . . . . . . . . . . . . . . . . . . . . . . . . . . . . . . . . . . . . . . . . . . . . . . . . 106 2. Subscription of marketable securities privately in the most recent years... 107 3. The stock shares of the company held or disposed by the subsidiaries in
t h e m o s t r e c e n t y e a r s . . . . . . . . . . . . . . . . . . . . . . . . . . . . . . . . . . . . . . . . . . . . . 107
4 . Supp lementa ry d isc losu res . . . . . . . . . . . . . . . . . . . . . . . . . . . . . . . . . . . . . . . . . 107 5. Occurrence of events defined in Securities Transaction Law Article 36.2.2
that has great impact on shareholder’s equity or security price in the most years and up to the date of the report printed..........................
108
- 1 -
I. Letter to Shareholders Dear Shareholders, Global financial crisis has led to the worldwide economic slowdown in the year of 2008. As a result of hard work of the staff, Topoint’s consolidated revenue for 2008 totaled NT$1,967 million, decreasing by 8% from NT$2,140 million in 2007. Due to rigorous cost control, we managed to achieve a decent gross margin of 37%. Net income was NT$258 million with basic after-tax earnings per share of NT2.42. Although the visibility of this year remains limited, we are confident of delivering better sales and profit results than our competitors in 2009. I. Operation Results in 2008
1. Consolidated financial result Unit: NT$million
2008 2007 AMT % AMT %
Net Sales 1,967 100% 2,140 100% Cost of Goods Sold 1,240 63% 1,242 58% Gross Profit 727 37% 899 42% Operating Expense 316 16% 254 12% Operating Income 412 21% 645 30% Pretax Income 285 14% 608 28% Net Income 258 13% 512 24%
2. Budget Implementation
As dictated in current statutory laws and regulations, we didn’t release our 2008 financial forecast to the public. However, our overall operating results are generally in line with the internal operation plan.
3. Profitability Analysis Item 2008 2007
Debt to Asset Ratio (%) 55.0 46.7 Long-term Capital to Fixed Asset Ratio (%) 120 126 Current Ratio (%) 142 147 Accounts Receivable Turnover (x) 3.58 4.01 Inventory Turnover (x) 2.21 2.55 Return on Assets (%) 6.39 13.72 Return on Shareholders’ Equity (%) 10.46 23.97 Basic after-tax EPS (NT$) 2.42 4.92

- 2 -
4. Research and Development Status (1) We have successfully developed shank 2.0mm composite drill in 2007 and
went into mass production in 2008. While meeting multiple stacks and high hole accuracy requirement for high speed drilling machine, which is the best cost down solution to our customers through its special design and technology of composite material.
(2) We have introduced new generation material brazing technology to mass production in 2008. In the end of 2008, we have 90% of products completed conversion.
(3) We have accomplished development and readied conditions for mass production of 0.05mm micron drills. We are ahead of market and waiting for demand to start immediate production.
(4) We are continuously developing high aspect ratio drills, special tools for environment friendly PCBs, and long life cutting tools. We have completed some product certification with several key customers.
5. Other Projects Execution Results
(1) Capacity Expansion: In anticipation of business expansion and new market demand, we have completed the construction of Shanghai new facility. Our global monthly capacity is increased from 13 million to 17 million in 2008.
(2) Market Development and Competition Status: Sales volume of 2008 reached 129 million pieces, marking a 13.5% YoY. Year 2008 was a successful year for us in terms of gaining new market share; our global market share was growing from 13% in 2007 to 17% in the end of 2008. At present, it is only second to Japan-based Union Tool to rank the 2nd place in the world.
(3) Quality Certification: We were awarded “Supplier of the Year” and “2008 Excellent Material Supplier” by two major international IC substrates manufacturers. This is a significant recognition showing that our product and service quality has reached the international standard.
II. Overview of Operation Plan in 2009
1. Operation Principle and Important Policies (1) Based on “discipline, insistence and innovation”, our tenet is to earn utmost
customer satisfaction. (2) To expand domestic and overseas customer base, further increase our
global market share. (3) To boost sales proportion of micro-drills below 0.25mm in order to improve
our product mix. (4) To continue developing drills with finer size and higher aspect ratio so as to
catch market trends in the future.

- 3 -
(5) To effectively lower production cost by enhancing material technology, optimizing production process, and improving yield rate.
2. Perspectives
Since 4th quarter of 2008, market researchers have projected that PCB market growth of 2009 will decline by 4-16%, based on current turbulent economic climate. However, while the market keeps rolling out “smaller, thinner, and multi-function” electronic products, the demand for high-end substrates has been accelerated, which results in the design of PCB heading towards higher hole density and finer line width/spacing in an attempt to directly drive the demand for micro-drill. It will bring more micro-size drills demand and form higher entry barrier from which Topoint have been well positioned to benefit.
Finally, we would like to thank you for your continued support for Topoint. All of us at Topoint will continue to commit ourselves to assuring customers’ success and increasing shareholders’ value. Xu-Ting Lin Zhen-Wen Jiang Li-ching Ko Chairman/CEO President Financial Manager

- 4 -
II. Introduction of Corporation 1. Establishment date:
Established on: April 12, 1996
2. Development history: 1) 1996: Topoint Technology Co., Ltd. was established to engage in production and
sales of precision drills with NT$15 million in capital. 2) 1997:In order to meet the market demand, it increased its capital by NT$17.5 million
to purchase new machinery equipment. By then, the total paid-in capital was NT$32.5 million.
3) 1998:It increased its capital by NT$66.7 million to enlarge its business scale and purchase new machinery equipment. By then, the total paid-in capital was NT$99.2 million. The factory was relocated to Beinei Street of Shulin where the factory buildings were enlarged so as to meet future expanding operation
4) 1999: It garnered RWTUV ISO9002, a quality assurance accreditation, in April, and had a cash capital increase of NT$20.8 million on Sep. 20 for the purchase of leading-edge equipment to enhance production capacity. By then, the capital increase by earnings recapitalization was NT$18.25 million, whereas the paid-in capitalization was NT$138.25 million.
5) 2000: As approved by the competent authorities in May for public offer, it increased NT$120 million of capital in cash in June to purchase production equipment and advanced inspection instruments to elevate production capacity and assure product quality. By then, the capital increase by earnings recapitalization was NT$10.56 million, capital increase by capital surplus as stock dividends was NT$4.19 million and the paid-in capitalization was NT$273 million.
6) 2001: It increased NT$54.91 million of capital by earnings recapitalization and NT$12.09 million of capital by capital surplus as stock dividends in August. In December of the same year, it increased NT$ 50 million of capital in cash to purchase production equipment, repay bank loans and supplement the working capital. By then, the paid-in capitalization was NT$390 million.
7) 2003: It registered for the listing of the emerging stock on January 2, and increased NT20 million of capital in cash in December to purchase equipment and expand production capacity. By then, the paid-in capitalization was NT$410 million.
8) 2004: It increased NT$16.93 million of capital by earnings recapitalization in June to supplement the working capital. In December, it increased NT$57 million of capital in cash to repay bank loans. As a total the paid-in capitalization was NT$483.93 million. In December, its stock went public on the OTC market.
9) 2005: It relocated its factory to the present address having larger space so as to

- 5 -
meet the demand for future expanding operation, and increased NT$68,651,250 of capital by earnings recapitalization in July. As a total, the paid-in capitalization was NT$552,581,250.
10) 2006: It issued NT$40 million of its first local unsecured convertible corporate bonds in February to purchase equipment and repay bank loans, increased NT$100 million of capital in cash in March to purchase equipment and expand production capacity, issued 5,520 units of employee stock options in April, and increased NT$101,706,700 of capital by earnings recapitalization in July. As a total, the paid-in capitalization was NT$773,881,710.
11) 2007: It increased NT$112,269,820 of capital by earnings recapitalization in July to supplement the working capital. As a total, the paid-in capitalization was NT$954,691,270.
12) 2008: It increased NT$115,873,410 of capital by earnings recapitalization and change shares of employee stock option. As a total, the paid-in capitalization was NT$1,070,564,680.

III. Corporate Governance Report 1. Organization System (1) Organization Chart
(2) Major Corporate Functions
Department Major functions
Chairman Office
To establish corporate guidelines, strategies and operation plans. To plan and management of company projects. Planning and execution of relationships with investors. Corporate stock affairs and investment evaluation.
Audit Office To audit and evaluate the functions and operations of each department and the execution of internal control system.
Environmental Health & Safety Office
Planning and implementation of the systems relating to factory environment, security and health.
Research & Development Division
R&D of advanced technologies and development of new products. Patent planning and management.
- 6 -

- 7 -
Production Dept. Production schedule planning, and management of product process and manufacture
Production Engineering Dept.
Management of production technology and process standardization, and maintenance of production equipment
Quality Control Dept. Planning and execution of quality control system
Sales & Marketing Dept.
Planning sales and promotion strategies. Expansion of markets, introduction of customers, and increase market share to achieve company's sales goals. Provision of production forecast to coordinate production and sales.
Logistic Dept. Management and planning of purchasing and warehousing
Administration Dept. Planning and execution of general affairs, factory affairs, and information systems.
Human Resource Dept. Management of human resources, personnel administration and regulated systems.
Finance Dept. Corporate financial planning and investment management. Planning and execution of accounting and taxes system.

- 8 -
2. Information about Directors, Supervisors, Presidents, Vice presidents, Assistant presidents, Chiefs of Respective Divisions and Branch Offices (1)Directors and supervisors:
a. directors and supervisors April 30, 2009
Shares held when being elected Current shareholding Shareholding of spouse
and minors Shares held in the names of others
Other executives, directors or supervisors in spouse relationship or kin relationship
within 2nd degree Title name Elected
(inaugurated ) date
Term 1st elected date
shares Shareholding ratio
Number of shares
Shareholding ratio Shares Shareholding
ratio Shares Shareholding ratio
Current post and/or e d u c a t i o n
Post concurrently taken in t he company o r o the r c o m p a n i e s
Title Name Relation
Chairman Lin Xu-ting 06/20/2006 3 yrs 03/18/1996 3,701,900 6.05% 5,138,322 4.80% - - - -
President of the company/Student of National Open University
CEO of the company
Special assistant to the PresidentV i c e G e n e r a l m a n a g e r
W a n g J i a -
L i n R u o - p i n g
j o n g
Father / . daughter
Director Liu Rong-rong 06/20/2006 3 yrs 06/20/2006 - - - - - - - - MBA from the Wharton School
General Manager of Crimson Asia Capital Holdings, Ltd. Director of Gordon Auto Body Parts Co., Ltd., the Director of Infosystem Technology Corporation, Ltd., and the Director of Rosta Inter Ltd.
- - -
Director UMC Capital Corporation D.C Cheng
06/20/2006
3 yrs 06/20/2006 100,000
0.37%
1,892,967 1.77% - - -
-
MBA from Columbia University /General manager of AIG United Guaranty.
President of UMC Capital Corporation , Director of United Microdisplay Optronics CorpDirector of SerComm Corp. Independent director of DEOM Technology Co., Ltd.
- - -
Director
China Development
Industrial Bank C.C Chang
06/20/2006 3 yrs 09/30/2000 4,709,001 8.35% 7,152,796 6.68% - - - - EMBA from National Cheng Chi University
Vice President of China Development Industrial Bank.
- - -
Independent director Lo Tsung-Ming 06/20/2006 3 yrs 06/20/2006 1,487 - 2,355 0.00% 2,355 0.00% - -
Graduate of NTU College of Law/Legal affairs manager of Sampo Group.
Legal Manager of Sampo - - -
Independent director Ko Po-cheng 06/20/2006 3 yrs 06/06/2003 - - - - - - - -
Associate professor of the Accounting Department of Soochow University
Supervisor of High Tech Computer Corp. Supervisor of CyberPower Systems,Inc.
- - -
Independent director Pai Jung-sheng 06/13/2008 1yrs 06/13/2008 - - - - - - - -
National Chung Hsing University, Chemistry
TPCA technical consultant and magazine editor. currently technical consultant of Unimicron Corporation, Delta Electronics, Inc., Atotech Taiwan Ltd.,
- - -
Supervisor Chen Ken-ching 06/20/2006 3 yrs 06/20/2006 819,891 1.43% 1,299,627 1.21% 310,394 0.29% - -
Graduate of a commercial senior high school / employee of Sampo Group
President of Hong Gy Co., Ltd. Supervisor of Lustrous Technology Ltd.
- - -
Independent supervisor Liang Shwu-jian 06/20/2006 3 yrs 06/06/2003 60,755 0.08% 72,232 0.07% - - - -
PhD of Materials Science from University of Pennsylvania
Senior Consultant of High Tech Computer Corp. - - -
Independent supervisor Niu Cheng-chie 06/20/2006 3 yrs 06/20/2006 - - 2,119 0.00% - - - -
PhD of Polymer Chemistry from Polytechnic Institute of Brooklyn.
IT director of STTC consultancy Co. - - -

- 9 -
Major institutional shareholders: April 30, 2009
Name of institutional shareholder Major shareholders of the institutional shareholders
UMC Capital Corporation 99.99% of shares are held by United Microelectronics Corp.
China Development Industrial Bank
100% of shares are held by China Development Financial Holding Company.
Major shareholders of the major shareholders that are Juridical Persons April 30, 2009
Institutional shareholder name Major shareholders of the institutional shareholder
United Microelectronics Corp.
8.31% of shares are held by Citicorp Financial Service Ltd., as representative of holders of the ADRs and as nominee for Citibank,N.a. 3.40% of shares are held by Hsun Chieh Investment Co.,Ltd. 2.43% of shares are held by Silicon Integrated Systems Corp. 2.13% of shares are held by Deutsche Bank AG 1.77% of shares are held by Alliance Bernstein International Value Fund 1.24% of shares are held by Citicorp Financial Service Ltd., as representative of the ABN AMRO Bank N.V. 0.92% of shares are held by Cathay Life Insurance Co.,Ltd. 0.79% of shares are held by Administrative Committee, Yao Hua Glass Co., Ltd. 0.77% of shares are held by Sanford Bernstein Emerging Markets Value Portfolio 0.73% of shares are held by Citicorp Financial Service Ltd., as representative of the Singapore Government Fund
China Development Financial Holding Co., Ltd.
1.42% of shares are held by Mega International Commercial Bank. 1.8% of shares are held by Bank of Taiwan. 0.75% of shares are held by Taiwan Post Co., Ltd. 5.67% of shares are held by Xing Wen Investment Co.,Ltd.

- 10 -
b. Personal data of directors and supervisors With over five years of job experience and
the following business qualification Are they in compliance with the independence
terms(Note) Condition
Name (Note1)
Teachers of public or private colleges for the subject Of commerce, law, finance, accounting, or business
Judge, prosecutor, attorney, accountant, or business salespersons passed national exam & certified specialists or technicians
With job experience in commerce, law, finance, accounting, or business
1 2 3 4 5 6 7 8 9 10
Also an independent director of
other public company
Lin Xu- ting
-
Liu Rong-rong
-
D.C. Cheng
1
C.C Chang
-
Lo Tsung-ming
-
Ko Po-cheng
-
Pai Jung-sheng
1
Chen Ken-ching
-
Liang Shwu-jian
-
Niu Cheng-chie
-
Note: Directors and supervisors who have qualified the following conditions two years before being elected and during the term are to tick the box (“ ”) of the corresponding condition.
(1) Not the employee of the company or its affiliated enterprises (2) Not the director or supervisor of the company or its affiliated enterprises (however, it is not limited to the
independent director of the subsidiary in which the company directly or indirectly holds more than 50% of voting shares.)
(3) Not the shareholder whose spouse, minor children or related persons in his or her name hold more for than 1% of the company’s issued shares, nor the one who is one of company’s top-10 nature person shareholders.
(4) Not the direct lineal blood relative (including spouse and the relatives within 2nd degree) of the persons listed in the preceding three items.
(5) Not the director, supervisor or employee of the institutional shareholder who directly holds more than 5% of the company’s issued shares, nor the director, supervisor or employee of the top 5 institutional shareholders.
(6) Not the director, supervisor, manager of the specific company or institute having financial or business relationship with the company, nor the shareholders holding more than 5% of the company’s shares.
(7) Not the professional who offers business, legal, accounting or consulting services to the company or its affiliated enterprises, nor the proprietor, partner, director, supervisor, manager and their spouses of the business entity solely invested or partnered by the company.
(8) Not the spouse nor a relative within two degrees of lineal consanguinity of an individual. (9) Free of any of the behaviors as defined in Article 30 of Company Act. (10) Not a governmental officer, juridical person or its representative as defined in Article 27 of Company Act.

(2) President, Vice President, Junior V.P., and Department Heads April 30, 2009
Shareholding Shareholding of spouse and minor
Shares held by other persons in their name
Executives who are spouses or second consanguinity Title Name Date Elected
Shares % Shares % Shares %
Experience (Education) Current position
with other companies
Title Name Relation
CEO Lin Xu-ting 11/29/2005 5,138,322 4.80 - - - - President of the company/Student of National Open University
The Chairman of the company
Special assistant to the
Chairman V.P.
Lin Ruo-ping
Wang Jia-hong
Father/ daughter
cousin-in-law
President Jiang Zhen-wen 07/06/2007 55,969 0.05 12,883 0.01 - - Vice general manager of COMPEQ/ Chemical Institute of Fu Jen Catholic University
- - - -
Vice President Wang Jia-hong 06/01/2006 465,143 0.43 2,950 0.01 - -
Manager of Topoint / Graduate of the accounting department of Soochow University
- - - -
Plant Director Huang Yin-ming 05/08/2006 131,659 0.13 13,869 0.01 - -
Manager of ASE Inc. / Graduate of the materials science and engineering department of Feng Chia University
- - - -
R&D Director Chen Zhao-yang 02/01/2002 117,899 0.11 - - - - Manager of Topoint / Graduate of Minghsin Junior College. - - - -
Financial Manager Ko Li-ching 06/26/2008 1,119 0.00 - - - -
Junior manager of Taiwan International Securities / Graduate of the accounting department of Soochow University
- - - -
Audit Manager Lin Rong-le 09/16/2002 6,185 0.00 - - - -
Financial manager of Sampo Group / Graduate of the statistics department of National Cheng Kung University
- - - -
- 11 -

(3) Remuneration of Directors, Supervisors, President, and Vice President A. Remuneration of Directors
Unit: NT$1000/1000 shares Remuneration Compensation earned as employee of TOP or of TOP’s consolidated entities
Base Compensation(A)
Severance Pay(B) (Note3)
Bonus to directors(C) (Note1) Allowances(D)
Total Remuneration(A+B+C+D)as
a % of 2008 Net income Salary(E) Severance Pay (F) Employee profit sharing (G) Exercisable
employee stock options(H)
Total compensation as a
% of 2008 Net income(Note2)
Compensation Received from Non-consolidated affiliates
From TOP
From all consolidated
entities
Title Name
From TOP
From all consolidated
entities From TOP
From all consolidated
entities From TOP
From all consolidated
entities From TOP
From all consolidated
entities From TOP
From all consolidated
entities From TOP
From all consolidated
entities From TOP
From all consolidated
entities Cash Stock Cash Stock
From TOP
From all consolidated
entities From TOP
From all consolidated
entities
Chairman Lin Xu-ting Director Liu Rong-rong
Director
Representative of China
development Industrial Bank: CC
Chang
Director UMC Capital
Corporation: DC Cheng
Independent director Lo Tsung-ming
Independent director Ko Po-cheng
Independent director Pai Jung-sheng
- - - - 2,373 2,373 102 102 0.96% 0.96% 5,702 7,601 - - 1,000 - 1,000 - - - 3.55% 4.29% -
Note 1:As passed in the board meeting on March 17, 2009 for 2008 annual earnings distribution, NT$3,489,954 is for remuneration of directors and supervisors and NT$17,449,768 for employee bonus. As of the annual report publication date, this
resolution made in the board meeting has yet to be resolved by shareholders in the shareholders’ meeting. The distributed amounts shown above were calculated according to last year’s distribution ratio. Note 2: Income after Income Tax is less by Bonus to employees. Note 3: Total Severance Pay to TOP’s directors in 2008 was $0.
Remuneration Bracket
2008
Total Remuneration(A+B+C+D) Total Compensation (A+B+C+D+E+F+G) Remuneration to directors From TOP From all consolidated entities From TOP From all consolidated entities
Below $2,000,000 Lin Xu-ting , Liu Rong-roung, China Development Industrial Bank, UMC Capital Corporation, Lo Tsung-ming , Ko Po-cheng , Pai Jung-sheng
Lin Xu-ting , Liu Rong-roung, China Development Industrial Bank, UMC Capital Corporation, Lo Tsung-ming , Ko Po-cheng, Pai Jung-sheng
Liu Rong-roung, China Development Industrial Bank, UMC Capital Corporation, Lo Tsung-ming, Ko Po-cheng, Pai Jung-sheng
Liu Rong-roung, China Development Industrial Bank, UMC Capital Corporation, Lo Tsung-ming , Ko Po-cheng,
$2,000,000 ~ $5,000,000 - - -
$5,000,000 ~ $10,000,000 - - Lin Xu-ting Lin Xu-ting $10,000,000 ~ $15,000,000 - - - - $15,000,000 ~ $30,000,000 - - - $30,000,000 ~ $50,000,000 - - - - $50,000,000 ~ $100,000,000 - - - - Over $100,000,000 - - - - Total amount 7 7 7 7
- 12 -

B. Remuneration for supervisors Unit: NT$1000/1000 shares
2008
Base Compensation(A) Severance Pay(B) (Note3)
Bonus to supervisors (C) (Note1) Base Compensation(A)
Total Remuneration(A+B+C+D)as a % of 2008 Net income
(Note2) Title Name From TOP
From all consolidated
entities From TOP
From all consolidated
entities From TOP
From all consolidated
entities From TOP
From all consolidated
entities From TOP
From all consolidated
entities
Compensation Received from
Non-consolidated affiliates
Supervisor Chen Ken-ching
Independent supervisor
Liang Shwu-jian
Independent supervisor
Niu Cheng-chie
- - - - 1,117 1,117 46 46 0.45% 0.45% -
Note 1:As passed in the board meeting on March 17, 2009 for 2008 annual earnings distribution, NT$3,489,954 is for remuneration of directors and supervisors and NT$17,449,768 for employee bonus. As
of the annual report publication date, this resolution made in the board meeting has yet to be resolved by shareholders in the shareholders’ meeting. The distributed amounts shown above were calculated according to last year’s distribution ratio.
Note 2: Income after Income Tax is less by Bonus to employees. Note3: Total Severance Pay to TOP’s supervisors in 2008 was $0.
Remuneration Bracket
2008
Total Remuneration(A+B+C+D) Remuneration to supervisors
From TOP From all consolidated entities
Below $2,000,000 Chen Ken-ching, Liang Shwu-jian, Niu Cheng-chie Chen Ken-ching, Liang Shwu-jian, Niu Cheng-chie $2,000,000 ~ $5,000,000 - -
$5,000,000 ~ $10,000,000 - -
$10,000,000 ~ $15,000,000 - -
$15,000,000 ~ $30,000,000 - -
$30,000,000 ~ $50,000,000 - -
$50,000,000 ~ $100,000,000 - -
Over $100,000,000 - -
Total amount 3 3
- 13 -

C. Remuneration for President and V.P. Unit: NT$1,000/1,000 shares
Salary(A) Severance Pay(B)
(Note3) Rewards and special
payments, etc. (C) Bonuses and Allowances(D)
(Note1)
Total Remuneration(A+B+C+D)as
a % of 2008 Net income (Note2)
Exercisable employee stock options
From TOP
From all consolidated entities
Title (Note1) Name
From TOP
From all consolidated
entities From TOP
From all consolidated
entities From TOP
From all consolidated
entities Cash Stock Cash Stock From TOP
From all consolidated
entities From TOP
From all consolidated
entities
Compensation Received from
Non-consolidated affiliates
Chairman Lin Xu-ting
President Jiang Zhen-wen
President of the new product
business div.
Huang Li-qiang
Vice President
Wang Jia-hong
9,745 11,083 - - 10,448 13,246 3,000 - 3,000 - 8.97% 10.59% - - -
Note 1:As passed in the board meeting on March 17, 2009 for 2008 annual earnings distribution, NT$3,489,954 is for remuneration of directors and supervisors and NT$17,449,768 for employee bonus. As
of the annual report publication date, this resolution made in the board meeting has yet to be resolved by shareholders in the shareholders’ meeting. The distributed amounts shown above were calculated according to last year’s distribution ratio.
Note 2: Income after Income Tax is less by Bonus to employees. Note3: Total Severance Pay to TOP’s President and V.P. in 2008 was $0, that pensions funded according to applicable law. In 2008 was NT$308,502. Grades of remuneration
2008 Grades of the remuneration for the company’s general managers and vice general managers
From TOP From all consolidated entities
Below $2,000,000 - -
$2,000,000 ~ $5,000,000 Huang Li-qiang Huang Li-qiang $5,000,000 ~ $10,000,000 Lin Xu-ting, Jiang Zhen-wen, Wang Jia-hong Lin Xu-ting, Jiang Zhen-wen, Wang Jia-hong $10,000,000 ~ $15,000,000 - -
$15,000,000 ~ $30,000,000 - -
$30,000,000 ~ $50,000,000 - -
$50,000,000 ~ $100,000,000 - -
Over $100,000,000 - -
Total amount 4 4
- 14 -

- 15 -
D. Name of managers who received dividend and the distribution of dividend Apri l 30, 2009
Unit: NT$1,000
Title Name Stock Dividend
Cash Dividend (Note1)
Total Ratio of total
amount to net income (%) (Note2)
Chairman & CEO Lin Xu-ting
President Jian Zhen-wen
President of the new product business div.
Huang Li-qiang
Vice President Wang Jia-hong
Plant Director Huang Yin-ming
R&D Director Chen Zhao-yang
Managers
Finance & Accounting Manager
Ko Li-ching
- 4,660 4,660 1.80%
Note 1:As passed in the board meeting on March 17, 2009 for 2008 annual earnings distribution, NT$3,489,954 is for remuneration of directors and supervisors and NT$17,449,768 for employee bonus. As of the annual report publication date, this resolution made in the board meeting has yet to be resolved by shareholders in the shareholders’ meeting. The distributed amounts shown above were calculated according to last year’s distribution ratio.
Not 2: Income after Income Tax is less by Bonus to employees.
(1) Analysis of the ratio of the total remuneration for the directors, supervisors, general managers and vice general managers of the company and its consolidated statement companies in the recent two years to after-tax net profit, and description of remuneration payment policies, standards, combinations, procedure to determine the remuneration and the correlation with operating performance:
Y e a r
Total remuneration of directors, supervisors, general managers and vice general managers
Ratio of the preceding remuneration to after-tax n e t p r o f i t
Rem u ne r a t i on pa ym en t po l i c i es , standards, combinations, procedure to determine the remuneration and the correlation with operation performance
2007 42,934 thousand 8.34% (Note1)
2008 26,831 thousand (Note2)
10.38% (Note3) (Note1)
Note 1: The remuneration for directors and supervisors is regulated according to the
dividend distribution policy stipulated in the company’s constitution, in which the annual earning distribution status shall be submitted to the board of directors for discussion before being sent to the shareholders’ meeting for resolution. The remuneration for general managers shall be released according to the company’s performance evaluation system.
Note 2:As passed in the board meeting on March 17, 2009 for 2008 annual earnings distribution, NT$3,489,954 is for remuneration of directors and supervisors and NT$17,449,768 for employee bonus. As of the annual report publication date, this resolution made in the board meeting has yet to be resolved by shareholders in the shareholders’ meeting. The distributed amounts shown above were calculated according to last year’s distribution ratio.
Note 3: Income after Income Tax is less by Bonus to employees.

- 16 -
3. Business management (1) Board of Directors
The attendance of Directors for 9(A) Board Meetings in 2008:
Title Name Attendance (B) Proxy
Frequency of attendance (%)(B/A)
Remarks
Chairman Lin Xu-ting 9 0 100 -
D i r e c t o r
Representative of China
Development Industrial Bank:
Chang Cheng-chiu
5 1 56 -
D i r e c t o r Liu Rong-rong 0 3 0 -
D i r e c t o r
Representative of UMC Capital Corporation D.C. Cheng
5 3 56 -
Independent D i r e c t o r Lo Tsung-Ming 7 2 78 -
Independent D i r e c t o r Ko Po-cheng 8 1 89 -
Independent D i r e c t o r Pai Jung-sheng 5 0 83
Date Elected: 2008.6.13
Attendance of 6th
Remarks: 1. For the events stated in SEC Article 14.3 and other opposing or qualified opinion of
independent directors that are recorded or declared in writing, the date, term, the content of the case, independent director’s opinion, and the company’s response to the director’s opinion must be stated in details: N/A
2. The name of the directors who have excused themselves from the meeting due to a conflict of interest, the name of the directors, the content of the case, the reason for the conflict of interest, and the voting must be stated in details: N/A
3. The goal for improving the function of the board of directors (e.g. establishing the audit committee and enhancing information transparency, etc.) and execution evaluation: Other than placing Three independent directors, and according to the “rules of board
meeting procedure”, which was attendance of Directors to enhance their operating efficiency and reinforce their decision making capacity.
- 17 -
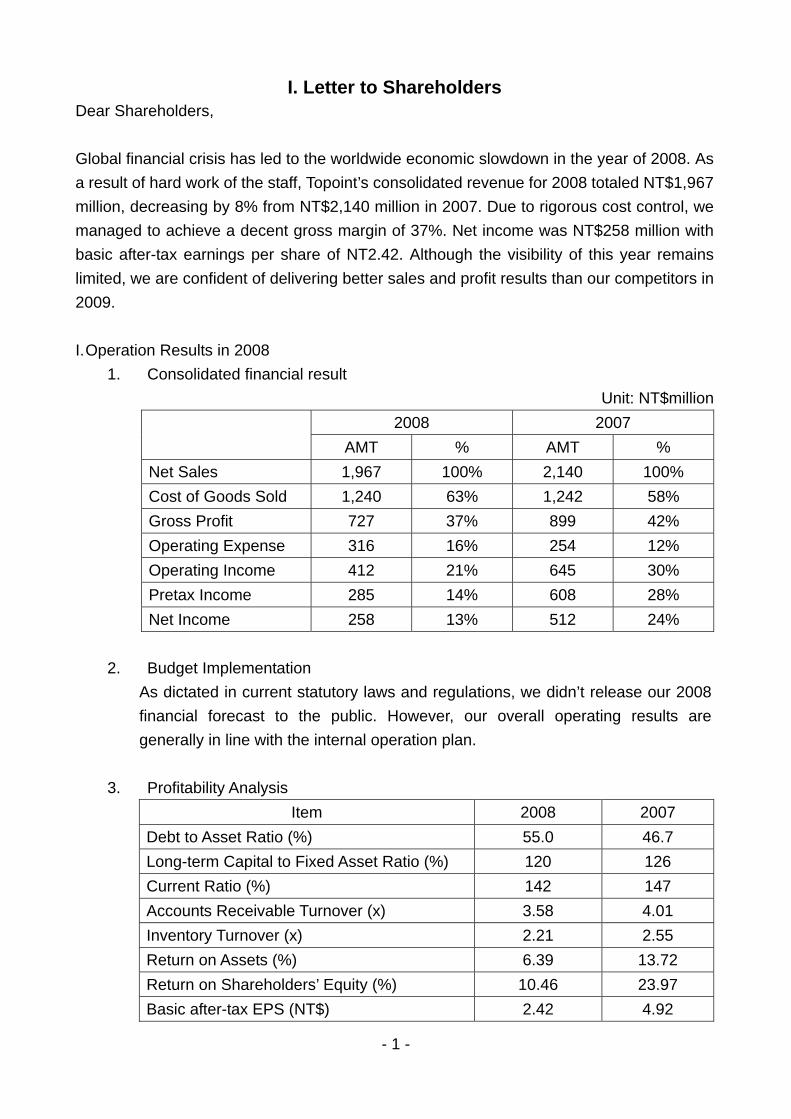
(2) Board of Supervisors
The attendance of Directors for 9(A) Board Meetings in 2008:
Title Name Attendance (B)
Proxy Frequency of
attendance (%)(B/A) Remarks
Supervisors Chen Ken-ching 9 100
Independent Supervisors Liang Shwu-jian 5 56
Independent Supervisors Niu Cheng-chie 7 78
Remarks:
1. The formation and responsibility of the supervisors:
(1) Communication among the employees and shareholders of the company:
The company’s supervisors use periodical or non-periodical meetings and
shareholders’ meetings to communicate with the company’s employees and
shareholders.
(2) Communication among the audit Manager and CPA of the company:
The company’s supervisors use periodical or non-periodical meetings with the
company’s audit manager and CPA.
2. If supervisors have opinion from the meeting that are recorded or declared in writing,
the date, term, the content of the case, supervisor’s opinion, and the company’s
response to the supervisor’s opinion must be stated in details: N/A

- 18 -
(3) Corporate governance and the deviation from the Rules Governing Listed & OTC
corporate governance and the causes
Item Operation
Deviation from the rules
Governing Listed &
OTC corporate governance and
the causes 1. The company’s equity structure
and shareholders’ equity (1)The way that the company
handles suggestions and disputes with shareholders.
(2)The status that the company gets hold of the list of the company’s major active shareholders and the final controllers of the company’s major shareholders.
(3)The mechanism for company establishment, risk control of its affiliated enterprises, and fire wall establishment.
(1)The company has a spokesman (Lin Rong-le), a deputy spokesperson (Lin Ruo-ping) and the stock affairs division.
(2) The company has entrusted a stock affairs agency (the stock affairs agency division of Taiwan International Securities Group) and has exclusive stock affairs personnel to serve shareholders.
(3) The company has laid down the regulations for trading operation with its affiliated enterprises, and for surveillance of its subsidiaries.
None
2. Constitution of the board of directors and its function
(1)The status of placing independent directors.
(2)To periodically review the independence status of the certified public accountants
(1) The company places three independent directors (Lo Tsung-Ming, Ko Po-cheng and Pai Jung-sheng )
(2) In compliance with statutory regulations, the company’s board of directors periodically evaluates the independent status of its certified public accountants.
None
3. The status for the establishment of communication channel with related parties.
The company setup Investor Relations on its website to periodically release the company’s business and financial information. In addition, an e-mail address is also available for shareholders to contact the company.
None
4. To make information public (1)The company uses its own
website to disclose its financial status and company
(1) The address of the company’s website is:
www.topoint.tw The company has already
None

- 19 -
Item Operation
Deviation from the rules
Governing Listed &
OTC corporate governance and
the causes governance information
(2) The company also uses other information disclosure ways (e.g. establishment of English website, designation of exclusive personnel to collect and disclose the company’s information, fulfillment of spokesperson system, and posting prospectus seminar process on the company’s website, etc.)
posted its governance information on the website. Viewers may also use the website to link to the Market Observation Post System for enquiry of the company’s financial and business information.
(2) The company has its spokesperson system which is used to collect and disclose information and as the bridge to communicate with outsiders.
None
5. The operation of the function committees set for the function of nomination or remuneration determination.
None None
6. If the company has corporate governance rules stipulated according to the “rules governing Listed/ OTC corporate governance, “please state the variation of the business operation from the rules: The corporate governance rules instituted by the company and their spirit have all been included in the company’s internal control system. The new entrants are all requested to follow the internal control system in their oriental training. At the same time, the “rules of shareholders’ meeting procedure”, “rules of board meeting procedure” and “director and supervisor election regulations” have all been laid down. The board of directors passed the “director, supervisor and manager moral code” on April 25, 2008 and sent it to the shareholders’’ meeting for resolution.
7. Other in formation that helps understand the corporate governance ( for example, advanced study of directors and supervisors, attendance of directors and supervisors for board meeting, enforcement of risk management policy and risk measurement standards, protection for consumers and customers, director’s excusing himself/herself from a case involving conflict of interest, liability insurance acquired for directors and supervisors, and corporate social responsibilities): (1) Advanced study of directors and supervisors: Please go to the corporate governance
section of the “Market Observation Post System” on http://newmops .tse.com.tw. (2) The risk management/measurement and customers protection policy are defined in
the company’s internal control system, and executed according to the regulations. (3) The directors and supervisors attend of the board when the trustee like fords to
a trustee office row bill have excused themselves and benefit that not join the vote.
(4) Liability insurance is acquired for directors and supervisors according to the articles of Incorporation.

- 20 -
Item Operation
Deviation from the rules
Governing Listed &
OTC corporate governance and
the causes 8. If there is an internal evaluation report or an independent appraisal report furnished on
corporate governance, the internal (external) performance evaluation report must be furnished with the nonconformities (or suggestions) and corrective actions detailed: The company assisted “Asia Pacific Industry Analysis Association (APIAA)” in training its members with industrial technology, market information analysis, consultation competence, so as to enhance our country’s industrial competitiveness. In addition, the company also donated fire-fighting equipment to the voluntary fire brigade of Shulin City Office. As a whole, the company is dedicated to a variety of public welfare activities in an attempt to contribute to society. (4) Please state the systems and measures of the company in fulfilling corporate social
responsibility (for example, human rights, employee’s welfare, environmental protection, community watch, relationship with suppliers, and related party’s rights): The company sponsored “TPCA (Taiwan Printed Circuit Association)” to establish industry technology and market information service. Furthermore, the company also sponsored “Phoenix Hope Engineering Education Foundation” to care for education and cultivate talents. The company believes in the operating concepts of devotes by each public welfare activity, carries out the enterprise back coupling society function.
(5) Enquiry of corporate governance rules and related regulations: Please go to the
corporate governance section of the “Market Observation Post System”。
(6) The information to help investors more aware of how the company’s corporate
governance is operated: a. Please go to “Investor Relations” of company’s website www.topoint.tw
b. Advanced study the governance rules of Mangers:
Title Name Date Organizing unit Curriculum Time
Audit Manger Lin Rong-le 2008 .11 .25 TWSE The Corporate Governance and Prohibition against Insider Trading
3hr
(7) Execution of internal control system:
a. Internal control declaration: Please refer to P. 51 in the annual report for details b. Entrustment of CPA to audit internal control system: N/A

- 21 -
(8) The punishments applied to the company and its employees due to law violation, the punishments applied by the company to its internal employee due to violation of internal control system, major drawbacks and improvement in the recent year and the current year as of the annual report publication date: As regulated by the company, other than including the violation of internal control system in the rating of personnel annual performance evaluation, the company has also given a detailed account of the punishments, major drawbacks and expected improvement deadline in each audit report. At the same time, the audit unit has continued to track the improvement status and make records. The major drawbacks had been corrected in the recent year and the current year as of the annual report publication date.
(9) Major resolutions made in shareholders’ meetings and board meetings in the recent year and the current year as of the annual report publication date: A. The company had the 2008 general shareholders meeting held with the
following resolution reached (06/13/2008): (a) Recognized 2007 final account statements. (b) Recognized 2007 earnings distribution
To distribute $2.7859/share of cash dividends and give 119.3981 shares/1000 shares of scrip dividends. The board of directors is authorized to adjust the ensuing change to be caused by the change in shareholder’s stock dividend/cash dividend rate resulting from the outstanding shares which are influenced by the change of capitalization.
(c) Passed the company’s issue of new shares from capital increase by 2007 earnings and employee bonus recapitalization
(d) Passed the revision of the company’s “endorsement guarantee regulations” (e) Passed the revision of the company’s “derivatives trading procedure” (f ) Passed the revision of the company’s “Articles of Incorporation ” (g) Passed the revisions of the Mainland China investment cap amount. (h) Passed the elect one Independent Director. (i) Passed the release the non-competition restriction of Independent director
elected as an individual. As approved by Financial Supervisory Commission, Executive Yuan with doc. no. jin-guan-zeng (1) 0970033324 on July 3, 2008,the company set July 25, 2008 as the based day for the release of the common stock’s cash dividends and capital-increased stock dividends. The dividends would be released on September 17, 2009 on which the trading of the stock dividends could also begin in the TSMC market.
B. Board meetings Date Contents
1.Jan 29, 2008 1. Approved the suspension of capital increase by cash.
2.Mar. 7, 2008 1. Approved the 2007 Profit Distribution Proposal. Cash dividends of NT$265,972,982(NT$2.7859 per share) Stock dividends of NT$113,988,410(119.3981 shares for
each 1,000 shares owned) 2.Approved to convene the 2008 Regular Shareholders’

- 22 -
Date Contents
Meeting. 3. July 10, 2008 1. Approved the record date for common share dividend.
4. Aug. 28,2008 1. Approved the Financial Statements of first half year of 2. Approved capital increase from earning of its subsidiary (Shanghai Topoint Precision Technology Company)
5. Mar. 17, 2009 1. Approved the financial Statements and Business Report of 2008.
2. Approved the 2008 Profit Distribution Proposal. Cash dividends of NT$10,586,193( NT$0.0988 per share) Stock dividends of NT$95,275,730(88.99 shares for each
1,000 shares owned) 3. Approved the election of directors and supervisors. 4. Approved the release of non-competition restriction of
directors elected as an individual. 5. Approved the amendment of Company’s “Articles of
Incorporation”. 6. Approved the amendment of Company’s “Endorsement and
Guarantee Procedure” & “External Lending Procedure” & “Derivatives Transaction Procedure”.
7. Approved to convene the 2009 Regular Shareholders’ Meeting.
(10) The directors or supervisors who have objected to the resolutions reached by the
board of directors and the objections are recorded or declared in writing in the most recent years and up to the date of the annual report printed: N/A
(11) The resignation or discharge of personnel who are responsible for financial
statements in the most recent years and up to the date of the annual report printed.
Title Name Employment
date Dismissal date Reasons of resignation or discharge
Financial manager
Lien Zhen-huei Aug. 3, 2000 Jun. 26, 2008 Leave Without Pay
4. CPAs Fees: N/A.

- 23 -
5. CPA’s Information: (1) Regarding former CPA:
Replacement date Approved by the board of directors on Jun. 26, 2008.
R e p l a c e m e n t r e a s o n s
The CPA certifying the company’s 2008 financial statements were Xie Jian-xin and Wu En-ming at Deloittee & Touche – Taiwan. However, due to the firm’s internal task transfer and arrangement, the company’s 2007 financial statements were certified by CPA Xie Jian-xin andChen Zhao-mei.
Please explain whether the termination or refusal of the commission is initiated by t h e e n t r u s t e d o r C PA .
The party Status
CPA Entrustor
Took initiative in terminating the commission
Refusal (discontinuation) of the commission
Not applicable
The opinions on the auditing reports in the recent two years and reasons, except the issue of unqualified opinions.
For the modified non-qualified opinions, the company has adopted the newly released SFAS no. 34 “Accounting for the Financial Instruments”, no. 36 “Financial Instruments: disclosure and presentation”, and the articles which have been modified as from Jan. 1, 2006following the release of preceding articles.
Accounting principle or practice
Disclosure of financial reports
Auditing range and steps Yes
Others No √
Different opinions with the issuer:
Why Not applicable. Other disclosure items: (The items required to be disclosed as per item 4, subparagraph 1 of article 11 in regulations governing the preparation of financial reports by securities issuers.)
N/A
(2) Regarding successor CPA:
Name of the firm Deloittee & Touche – Taiwan Names of CPA Xie Jian-xin and Chen Zhao-mei
Date of commission As passed by the board of directors on June 26, 2008
Items and results of the consultation made before the commission for the possible opinions on the accounting process method or accounting principle and the financial reports of specific transactions
N/A
The written opinions from the successor CPA against the ones from the former CPA. N/A

- 24 -
(3) The response made by former CPA for the issues l isted in item 3 of
subparagraph 1 of art icle 22 of “regulations governing the preparation of f inancial reports by securit ies issuers”: N/A
6. If the Chairman, President, and financial or accounting manager of the company who had worked for the independent auditor or the related party in the most recent year, the name, title, and the term with the independent auditor or the related party must be disclosed: N/A
7. Information on Net Change in Shareholding and Net Chang in Shares Pledged by Directors, Supervisors, Department Heads, and Shareholders 10% shareholding or more: (1) Information on Net Change in Shareholding and Net Change in Shares Pledged by
Directors, Supervisors, Department Heads and Shareholders Unit: share
2007 As of April 30
Title Name Net change in Shareholding
Net change in Share
Pledged Net change in Shareholding
Net change in Share Pledged
Chairman Lin Xu-ting 348,067 1,500,000 - -
Director UMC Capital Corporation 201,909 - - -
Director China Development Industrial Bank 762,937 - - -
Independent director Lo Tsung-ming 251 - - -
Supervisor Chen Gen-qing 138,621 - - - Independent supervisor Liang Shwu-jian 7,704 - - -
Independent supervisor Niu Cheng-chie 2,119 - - -
President Jiang Zhen-wen 5,969 - - - V.P. Wang Jia-hong (134,387) (250,000) - -
Plant Director Huang Yin-ming (4,624) - (40,000) - R&D Director Chen Zhao-yang (46,865) - (24,000) -
Financial Manager Ko Li-ching 1,119 - - -
(2) The information of the related party who was the corresponding party of the equity
transfer: N/A
(3) The information of the related party who was the corresponding party of the equity pledge: N/A
8. The relation of the top ten shareholders as defined by Finance Standard Article 6: N/A
- 25 -
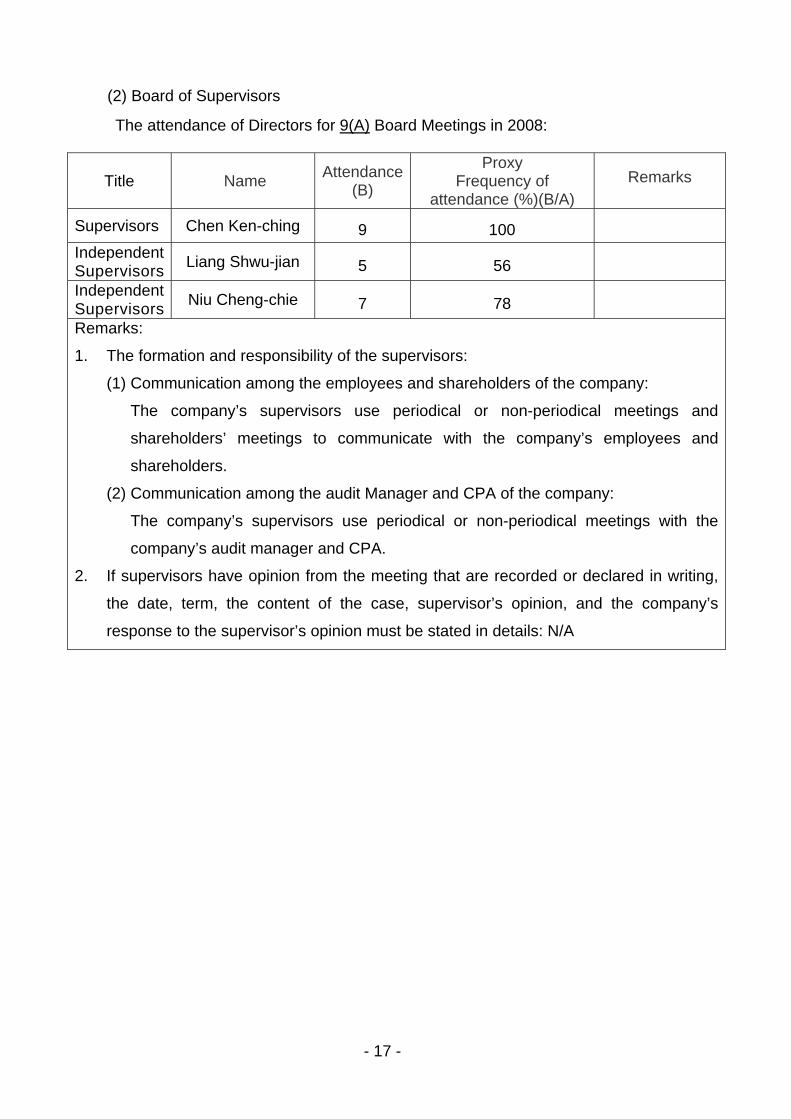
9. Investment form Directors, Supervisors, Managers and directly or indirectly controlled businesses:
Unit: Share
The company’s investment
Inves tment made by directors, supervisors, m a n a g e r s a n d t h e businesses directly or indirectly controlled by the c o m p a n y
Total investment Trans-investment
business
Shares Shareholding ratio Shares Shareholding
ratio Shares Total
shareholding ratio
Topoint Technology
Co.,Ltd.(B.V.I) 3,130 100% - - 3,130 100%
Warpspeed Corporation(B.V.I) 50,000 100% - - 50,000 100%
Topoint Japan Co., Ltd. 312 52% - 312 52%
Shanghai Topoint Precision Tool Co.,
Ltd. - - - 100% - 100%

- 26 -
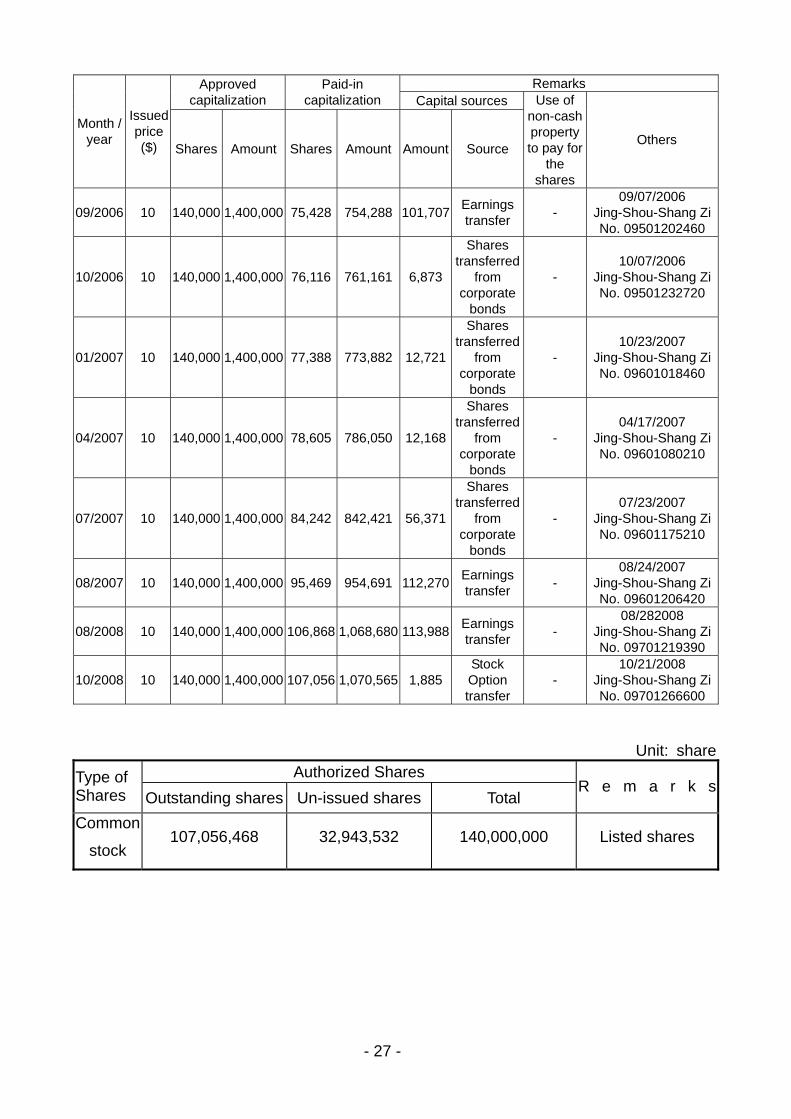
IV. Stock subscription 1. Capital and shares:
(1) Stock capital Unit: NT$1,000/1,000 shares
Remarks Approved capitalization
Paid-in capitalization Capital sources
Month / year
Issued price ($) Shares Amount Shares Amount Amount Source
Use of non-cash property to pay for
the shares
Others
4/1996 10 1,500 15,000 1,500 15,000 15,000Cash capital
increase -
04/12/1996 1996 Jien (3) Geng Zi
No. 48510
5/1997 10 6,000 60,000 3,250 32,500 17,500Cash capital
increase-
02/23/1998 1998 Jien (3) Jia Zi
No. 124692
6/1998 10 20,000 200,000 9,920 99,200 49,20017,500
Cash capital
increaseCapital surplus transfer
- 11/18/1998
1998 Jien (3) Jia Zi No. 259480
9/1999 10 20,000 200,000 13,852 138,253 20,80018,253
Cash capital
increaseEarnings transfer
- 10/21/1999
Jing (1999) Shang Zi No. 08813853
5/2000 23 49,000 490,000 27,300 273,000 120,00014,747
Cash capital
increase, earnings
and capital surplus transfer
- 06/28/200
Jing (2000) Shang Zi No. 089121529
05/2002 10 49,000 490,000 34,000 340,000 67,000
Earnings and capital
surplus transfer
- 09/19/2001
Jing (2001) Shang Zi No. 0901372890
11/2002 20 49,000 490,000 39,000 390,000 50,000Cash capital
increase -
01/03/2002 Jing (2001) Shang Zi
No. 09001523010
12/2003 10 49,000 490,000 41,000 410,000 20,000Cash capital
increase -
12/29/2003 Jing-Shou-Zhong Zi No. 09233192270
08/2004 10 42,693 426,930 42,693 426,930 16,930 Earnings transfer -
10/05/2004 Jing-Shou-Zhong Zi No. 09332806590
10/2004 16.8 70,000 700,000 48,393 483,930 57,000Cash capital
increase -
12/29/2004 Jing-Shou-Zhong Zi No. 09333262600
09/2005 10 70,000 700,000 55,258 552,581 68,651
Earnings and capital
surplus transfer
- 09/16/2005
Jing-Shou-Shang Zi No. 09401183300
06/2006 10 140,000 1,400,000 65,258 652,581 100,000Cash capital
increase-
06/20/2006 Jing-Shou-Shang Zi
No 09501118760
- 27 -
Remarks Approved capitalization
Paid-in capitalization Capital sources
Month / year
Issued price ($) Shares Amount Shares Amount Amount Source
Use of non-cash property to pay for
the shares
Others
09/2006 10 140,000 1,400,000 75,428 754,288 101,707 Earnings transfer -
09/07/2006 Jing-Shou-Shang Zi No. 09501202460
10/2006 10 140,000 1,400,000 76,116 761,161 6,873
Shares transferred
from corporate
bonds
- 10/07/2006
Jing-Shou-Shang Zi No. 09501232720
01/2007 10 140,000 1,400,000 77,388 773,882 12,721
Shares transferred
from corporate
bonds
- 10/23/2007
Jing-Shou-Shang Zi No. 09601018460
04/2007 10 140,000 1,400,000 78,605 786,050 12,168
Shares transferred
from corporate
bonds
- 04/17/2007
Jing-Shou-Shang Zi No. 09601080210
07/2007 10 140,000 1,400,000 84,242 842,421 56,371
Shares transferred
from corporate
bonds
- 07/23/2007
Jing-Shou-Shang Zi No. 09601175210
08/2007 10 140,000 1,400,000 95,469 954,691 112,270 Earnings transfer -
08/24/2007 Jing-Shou-Shang Zi No. 09601206420
08/2008 10 140,000 1,400,000 106,868 1,068,680 113,988 Earnings transfer -
08/282008 Jing-Shou-Shang Zi No. 09701219390
10/2008 10 140,000 1,400,000 107,056 1,070,565 1,885Stock Option transfer
- 10/21/2008
Jing-Shou-Shang Zi No. 09701266600
Unit: share Authorized Shares Type of
Shares Outstanding shares Un-issued shares Total R e m a r k s
Common
stock 107,056,468 32,943,532 140,000,000 Listed shares

- 28 -
(2) Status of shareholders April 30, 2009
Status of shareholders Q’ty
Government agencies
Financial institutions
Other institutional investors
DomesticNatural Persons
Foreign institutional
& Natural Persons
Total
Number of shareholders 0 16 32 6,253 25 6,326
Shareholding 0 22,875,057 15,040,358 54,318,494 14,822,559 107,056,468Shareholding ratio 0% 21.37% 14.05% 50.74% 13.84% 100.00%
(3) Status of Shareholding Distributed
Face value per share: $10 April 30, 2009
Classification Number of shareholder Shareholding Shareholding Ratio(%)
1-999 1,605 407,884 0.3810
1000-5,000 3,175 6,946,041 6.4882
5,001-10,000 673 5,094,632 4.7588
10,001-15,000 278 3,404,390 3.1800
15,001-20,000 142 2,576,710 2.4069
20,001-30,000 165 4,137,114 3.8644
30,001-40,000 78 2,696,438 2.5187
40,001-50,000 44 2,057,614 1.9220
50,001-100,000 72 4,978,614 4.6505
100,001-200,000 44 6,211,964 5.8025
200,001-400,000 17 4,899,565 4.5766
400,001-600,000 7 3,351,647 3.1307
600,001-800,000 3 2,185,265 2.0412
800,001-1000,000 3 2,747,463 2.5664
1000,001 以上 20 55,361,127 51.7121
Total 6,326 107,056,468 100

- 29 -
(4) Roster of Major shareholders: April 30, 2009
Shareholding Shareholder’s Name
Shareholding
Shareholding ratio
China Development Industrial Bank 7,152,796 6.68%
TLC Capital Co., Ltd. 5,185,253 4.84%
Lin Xu-ting 5,138,322 4.80% Contracted Customer Investment Account of KGI Asia under the trusteeship of Standard
Chartered Bank. 5,041,031 4.71%
Account of Cathay Greater China Fund 4,277,006 4.00%
Rui Zhan Investment Co., Ltd. 3,626,791 3.39% Account of Cathay Small & Medium Capital
Fund 3,417,522 3.19%
Account of CITC Marathon Fund 3,025,129 2.83%
Lin Liu-ze 2,910,710 2.72%
2,311,878 2.16% (5) Market price, net value, earnings, dividend per share and related information in the
recent two years. . Unit: NT$/share
Year Item
2007 2008 As of April 30,2009
Highest 123.00 66.00 27.30 Lowest 63.60 12.80 14.20 Market price
per share Average 85.94 38.90 19.35 Pre-distribution 25.83 23.16 23.77(note 1)NAV Post-distribution 19.81 (note 2) --
Weighted average shares 104,662,000 106,907,000 107,056,468EPS EPS (pre-adjustment)
(post-adjustment) 5.52 4.92
2.42 (note 2)
0.20(note 1)--
Cash dividend 2.786 (note 2) -- Stock dividend from retained earnings 1.194 (note 2) -- Scrip
issue Stock dividend from capital reserve -- (note 2) -- DPS
Accumulated dividends having yet to be paid -- -- --
P/E 17.47 (note 2) -- Dividend ratio 21.59 (note 2) -- Analysis of
ROI Cash dividend yield 3.24% (note 2) --
Note 1:The NAV and EPS shown above are the data certified by the CPA as of the 1st quarter of 2009.
Note 2: Subject to the approval of the annual shareholders meeting.

- 30 -
(6) Execution of Dividend Policy a. Given the fact that the company is in its growing period and taking its
future development, f inancial structure and shareholders’ equity into account, the company has concurrently released stock and cash dividends, in which the cash dividend shall not be lower than 10% of the total shareholder bonus released in the current year.
b. The dividends planned to be distributed this year are as below: (the proposal has
been passed by the board of directors, and planned to be submitted to the shareholders’ meeting for discussion) As passed in the board meeting on March 17, 2009 for 2008 earnings distribution, the company plans to distribute the stock dividend at $0.8899 per share and cash dividend at $0.0988 per share. (It is planned to request shareholders to authorize the board of directors to adjust the ensuing change to be caused by the change in shareholder’s stock dividend/cash dividend rate resulting from the outstanding shares which are influenced by the change of capitalization).
(7) Impact of the proposed stock dividend in shareholders meeting on business performances and EPS: Not Applicable Note: The Company did not have financial forecast proposed up to the date of the annual report printed.
(8) Employee bonuses and remuneration of directors and supervisors
a. The ratio or range of employee bonuses and remuneration of directors and supervisors stated in the corporate constitution: If there is surplus in the company’s annual final account, the surplus shall be first used to pay tax and cover past losses, followed by appropriating 10% of the remaining surplus as the legal reserve. Then, a special surplus reserve may be set aside as needed. If there is still a balance left, it can be added to the earnings accumulated from past years, and if it is resolved in the shareholders’ meeting, the accumulated earnings can be used for the shareholder bonus, employee bonus and director/supervisor remuneration, in which the employee bonus shall be over 1% and below 25%.
b. Information of the employee bonus and director/supervisor remuneration passed
by the board of directors: 1) The amounts of the employee cash bonus, stock bonus and
director/supervisor remuneration planned to be distributed are as below: As approved by the board of directors on March 17, 2009, it is expected to distribute $17,449,768 of employee cash bonuses and $3,489,954 of director/supervisor remuneration for 2008.
2) The shares of employee stock bonuses planned to be distributed and their ratio to the increased capital from earnings transfer: N/A
3) Recounted EPS after recommended distribution of dividend to employees and remuneration to directors and superiors is NT$2.42.
c. The actual distributions of dividend to employees and remuneration to directors and supervisors with retained in 2007:

- 31 -
Resolved in shareholders meeting on
June 13,2008
Resolved by board of
directors on March
26,2007
Difference
Distribution status: Employee cash bonus 69,505,000 69,505,000 - Employee stock bonus
Shares - - - Amount - - - Ratio to the outstanding shares at the end of 2007
- - -
Director/supervisor remuneration $13,901,000 $13,901,000 -
Information of EPS Original EPS $5.52 $5.52 - EPS taking bonuses and remuneration into account $4.63 $4.63 -
(9) Treasury stock: N/A

- 32 -
2. Corporate bonds: N/A 3. Preferred stock: N/A 4. ADR/GDR: N/A 5. Employee stock option certificates :
(1) The handling status as of the annual report publication date, and the influence on shareholders’ equity:
April 30, 2009 Cat. of employee
stock option certificates
1st time (phase) Employee stock option
certif icate
2nd time (phase) Employee stock option
certif icate Date approved by the competent authority March 29, 20069 Dec. 13, 2007
Issue date Apr. 7, 2006 Dec. 18, 2007
Issued units 5,520 5,000
Ratio of the shares eligible for subscription to total issued shares
5.16% 4.67%
Share subscription period
For Apr. 7, 2006 through Apr. 7, 2011
For Dec. 18, 2007 through Dec. 18, 2012
Fulfillment method The common stock newly issued by the company
The common stock newly issued by the company
Restriction on subscription and ratio
(%)
Two years of seniority: 50%;
Three years of seniority: 75%;
Four years of seniority:100%
Two years of seniority: 50% ;
Three years of seniority: 75%;Four years of seniority:100%
Shares acquired 188,500 -
Amount of executed subscription shares 6,113,055 -
Unexecuted subscription shares 3,911,000 4,234,000
The unexecuted subscription share
price 32.43 56.60
The ratio of the unexecuted
subscription shares to total issued shares
(%)
3.65% 3.95%
Influence on shareholders’ equity
The issue of employee stock option certificates may create common interests between the company and its shareholders. Furthermore, the issued shares have only very trivial impact on equity dilution, so no significant influence will be made on shareholders’ equity
The issue of employee stock option certificates may create common interests between the company and its shareholders. Furthermore, the issued shares have only very trivial impact on equity dilution, so no significant influence will be made on shareholders’ equity

- 33 -
(2) Acquisition and subscription status of the managers acquired the employee stock option certificates, and the employees who
acquired top 10 employee stock options, in which the subscription amount is more than NT$30 million as of the annual report publication date:
April 30, 2009 Executed Not yet to be executed
Title Name
Acquired subscr ipt
ion shares
Rat io of acquired
subscr ipt ion shares
to total issued shares
Executed subscr ipt ion shares
Executed subscription price
Amount of executed subscription shares
Ratio of the executed
subscription shares to total issued
shares
Unexecuted subscr ipt ion shares
Unexecuted subscription share price
Amount of unexecuted subscription
shares
Ratio of unexecuted subscription shares to total issued shares
CEO Lin Xu-ting
President Jiang Zhen-wen
Vice President Wang Jia-hong
Plant Director Huang Yin-ming
Managerial personnel
R&D Director Chen Zhao-yang
1,460 1,300
1.36% 1.21% - - - - 1,460
1,300 32.43 56.6
47,348 73,580
1.36% 1.21%
6. Merger and acquisition (including merger, acquisition, and split): N/A 7. Fund implementation plan:
Up to the last quarter before the printing of the financial statements, outstanding equity issuance or marketable security subscription or the completed equity issuance or subscribed marketable security without success: Not applicable. Up to the last quarter before the printing of the financial statements, equity issuances were completed successfully.

- 34 -
V. Overview of business operation 1. Principal activities
(1) Scope of Business ①. Major Business the Company has Engaged
i. Manufacture and sales of micro-drill bits exclusively for printed circuit boards ii. Manufacture and sales of digital drilling machines exclusively for printed
circuit boards iii. Manufacture and sales of the peripheral facilities for the process of printed
circuit boards iv. General export/import trading and agency businesses
②. Major products and their ratios in the company’s total businesses
Unit: NT$thousand 2007 2008 Business
items Amount of sales
% in revenue
Amount of sales
% in revenue
Drill bit 1,057,566 68.45 768,300 66.96 Router bit 265,404 17.18 172,386 15.02
Others 222,119 14.37 206,768 18.02 Total 1,545,089 100 1,147,454 100
③. Major Products of the Company
Product Specification Micro size Below 0.25mm
Drill bit Mini size 0.30mm~0.45mm
Micro size 0.50 mm~0.75mm Mini size 0.80mm~3.175mm Router bit
Large size Over 3.175mm
④. New Products under Development i. Development of micro drills continuously ii. Development of micro routers continuously iii. Development of high aspect ratio drills and longer lifetime cutting tools
(2) Industry Overview ①. Industry Status and Development
Drills are one of critical material applied to the PCB manufacturing process. PCB market was affected by worldwide financial crisis in 2008. According to IEK survey, global PCB production value was US$43.1 billion in 2008, representing 2.7% decline compared with 2007. IEK also estimates global PCB production value in 2009 at US$41.3 billion, down 4.1% from 2008, and it will not recover until 2010.

44.3
43.1
41.3
43.4
45.2
47.5
3.8%
‐2.7%
‐4.1%
4.8%
4.3%5.1%
‐6%
‐4%
‐2%
0%
2%
4%
6%
38.0
40.0
42.0
44.0
46.0
48.0
2007 2008(e) 2009(f) 2010(f) 2011(f) 2012(f)
Global PCB Production Value
Production Value(US$ billion) Growth Rate(%)
Data source:IEK(2008/12), compiled by the company China has taken the lead to have 28% share among PCB production countries in 2008. Its production value is US12.1 billion with 0.9% growth. In 2009, China market will be also impacted by global economic crisis but the decline will be less than worldwide average level. Its production value is estimated to be US$11.8 billion, down 2.4% compared with 2008. Current production are mainly low-end products (e.g. traditional PCBs), but the percentage of mid-to-high end products (e.g. HDI and IC substrate) will gradually increase in China. Japan account for 23% of global PCB production value. High-end HDI, IC substrates, and flexible boards are produced domestically in Japan, and the rest products are moving to the production base in South-East Asia. Taiwan takes 14% of global production value in 2008. PCB manufacturers in Taiwan are approaching higher HDI technology level, higher layer, and substrates. In the year 2009, the percentage of major production countries is projected to at the similar level as the previous year.
China, 28%
Taiwan, 14%
Japan, 23%
US, 13%
Korea, 9%
others, 13%
2008 Major PCB Production Region
Data source:IEK(2008/12), compiled by the company Micro-size drills are mainly applied to IC substrates. According to IEK, the global production value of IC substrates in 2008 was US$8.03 billion representing an annual growth of 8.82%. As estimated, IC substrates production value would reach US$8.15 and US$8.55 billion in 2009 and 2010 respectively. New applications (e.g. netbook, game console, LCD TV) drive the growth of IC substrate is superior to the overall PCB industry.
- 35 -

6.87 18.0%
7.4%8.8%
1.5%5.0%
18.0%
7.4%8.8%
1.5%5.0%
7.38 8.03 8.15 8.55
0%
5%
10%
15%
20%
‐1.00 2.00 3.00 4.00 5.00 6.00 7.00 8.00 9.00
2006 2007 2008(e) 2009(f) 2010(f)
Global IC Substrate Production Value
0%
5%
10%
15%
20%
‐1.00 2.00 3.00 4.00 5.00 6.00 7.00 8.00 9.00
2006 2007 2008(e) 2009(f) 2010(f)
Global IC Substrate Production Value
Production Value(US$ billion) Growth Rate(%)
Data source:IEK(2008/11), compiled by the company IC substrates are carriers for ICs of all kinds of electronic products. The following table explains the relations between substrate types and end applications. Flip Chip substrates will be the main stream for high end packaging. This trend will also bring demand for micro-size drills.
Current and Future Substrate Types of Different Applications
Application Current Substrate Type Product Trend
Future Substrate
Type
Computer FC Intel’s 45nm process Chipset integration Low cost NB
FC
Communication CSP
High-end cellular phone (smart phone)
Cell phone chip move to 65nm process
FC CSP
Consumer BGA Pixel and transfer speed
request from family digital peripheral devices
FC
Data source:IEK(2008/11), compiled by the company
②. Correlations among Upstream, Midstream and Downstream Industries Upstream Midstream Downstream
Tungsten carbide
Drills PCB manufacturers
③. Product Development i. The market has continued rolling out “thinner and smaller” products, which has made the twin-high (high function and high speed) the mainstream. At the same time, the industry has also continued to develop products with high frequency, high speed and multiple IO chips. As a result, the design of PCB has to be developed towards the attributes of high hole density, finer line width/space, and multiple electrical components. Hence, the demand for drilling quality has become more critical.
- 36 -
- 37 -
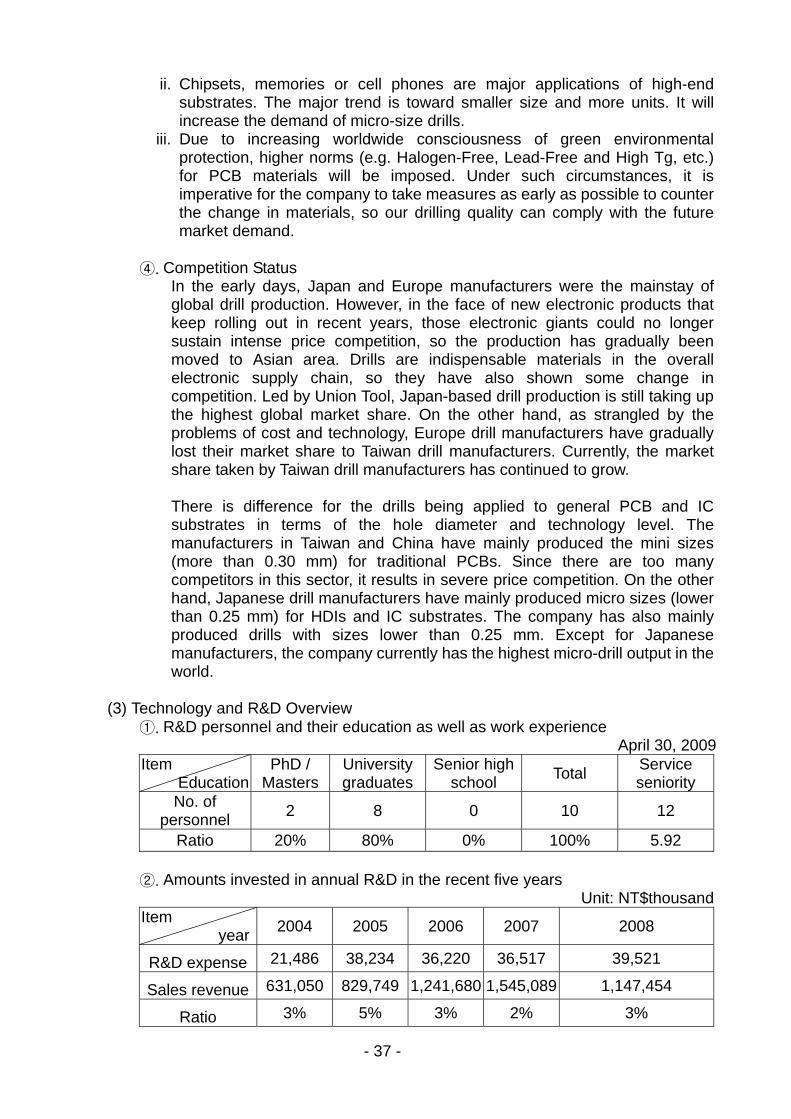
ii. Chipsets, memories or cell phones are major applications of high-end substrates. The major trend is toward smaller size and more units. It will increase the demand of micro-size drills.
iii. Due to increasing worldwide consciousness of green environmental protection, higher norms (e.g. Halogen-Free, Lead-Free and High Tg, etc.) for PCB materials will be imposed. Under such circumstances, it is imperative for the company to take measures as early as possible to counter the change in materials, so our drilling quality can comply with the future market demand.
④. Competition Status
In the early days, Japan and Europe manufacturers were the mainstay of global drill production. However, in the face of new electronic products that keep rolling out in recent years, those electronic giants could no longer sustain intense price competition, so the production has gradually been moved to Asian area. Drills are indispensable materials in the overall electronic supply chain, so they have also shown some change in competition. Led by Union Tool, Japan-based drill production is still taking up the highest global market share. On the other hand, as strangled by the problems of cost and technology, Europe drill manufacturers have gradually lost their market share to Taiwan drill manufacturers. Currently, the market share taken by Taiwan drill manufacturers has continued to grow. There is difference for the drills being applied to general PCB and IC substrates in terms of the hole diameter and technology level. The manufacturers in Taiwan and China have mainly produced the mini sizes (more than 0.30 mm) for traditional PCBs. Since there are too many competitors in this sector, it results in severe price competition. On the other hand, Japanese drill manufacturers have mainly produced micro sizes (lower than 0.25 mm) for HDIs and IC substrates. The company has also mainly produced drills with sizes lower than 0.25 mm. Except for Japanese manufacturers, the company currently has the highest micro-drill output in the world.
(3) Technology and R&D Overview ①. R&D personnel and their education as well as work experience
April 30, 2009 Item
Education PhD /
Masters University graduates
Senior high school Total Service
seniority No. of
personnel 2 8 0 10 12
Ratio 20% 80% 0% 100% 5.92
②. Amounts invested in annual R&D in the recent five years Unit: NT$thousand
Item year 2004 2005 2006 2007 2008
R&D expense 21,486 38,234 36,220 36,517 39,521
Sales revenue 631,050 829,749 1,241,680 1,545,089 1,147,454
Ratio 3% 5% 3% 2% 3%

- 38 -
③. The products and technology successfully developed
2004 Development and mass production of 0.075mm drills
2005 Development and mass production of 2mm shank drills
2006 Development and mass production of 2 blade router type of BOC routing. Development and trial production of 0.05mm drills.
2007 Development and trial production of composite 2mm shank drills.Development and mass production of new generation composite material.
2008 Development and mass production of composite 2mm shank drills. Development and trial production of 0.03mm drills.
④. Long and Short-term Business Development Plans i. Short-term Plan
a. Marketing Strategy Continuously increase market share from tier-1 clients in China
and Taiwan. Profoundly develop the Japan, European and US market. Build up comprehensive customer service and technology
supporting system, to provide integrated resolutions according to clients demand in a timely basis.
b. Production Strategy To keep the production across the straits flexible and agile
considering lowest cost and gaining optimal production and sales benefits.
To execute various projects to enhance output performance, improve production yield, and control every item of production cost.
c. R&D Strategy To develop drills with higher aspect ratio and longer lifetime in
order to form higher entry barrier. To develop drills applicable to the use of green laminate material
and grasp the trend of technology development.
ii. Long-term Plan a. Continue to devote its efforts to pursue the balance of the markets
(Taiwan, China, Japan, Korea, Europe and US) and the applications (Computer, Communication and Consumer products) and being the leading drill manufacturer of the world.
b. Continue to seek any opportunity of strategic alliances to enforce the company’s competitive capacity.
c. Continue to develop and promote high value-added cutting tools.

- 39 -
2. Market analysis and the condition of sale and production
(1) Market Analysis ①. Sales Breakdown by Region
Unit: NT$thousand 2008 2007
Region Year Amount
of sales % in revenue Amount of sales % in revenue
Domestic sales 825,239 53.41% 650,891 56.72% China 440,139 28.49% 317,472 27.67% Korea 258,246 16.71% 158,312 13.80% Japan 15,751 1.02% 7,653 0.67% Others 5,714 0.37% 13,126 1.14%
Export sales
Sub-total 719,850 46.59% 496,563 43.28% Total 1,545,089 100% 1,147,454 100%
②. Market Share
According to the company’s estimation, global drill demand of hot season (highest utilization of the year) is about 88 million pieces per month. The company’s global market share was 17% according to its monthly average sales volume is 15 million pieces in the same period. In terms of market share, the company is the 2nd largest drill manufacturer throughout the world.
③. The Status of Future Market Demand and Supply and its Growth
i. Demand Side With the trend of electronic products being thinner and smaller with multi-function, circuit layout miniaturization has naturally turned out to be a related trend. Thus, the growth of the annual demand for drills is equivalent to (the growth rate of PCB/IC substrates) X (the growth rate of layout density). As estimated by Prismark, the compound growth rate of global IC substrates for 2008 through 2013 would be about 3.7%. By multiplying it with the growth rate of layout density, the annual growth rate of drill demand is estimated to be around 10%.
ii. Supply Side
Total monthly capacity of top six drill suppliers which take over 80% of global shares is around 93 million pieces at the end of 2008. In 2009, there is no capacity expansion plan among drill manufacturers. It will be helpful for the balance of demand and supply situation when the market demand recover.
④. Competition Niche and Advantages/Disadvantages for the Future
Development and Solutions

- 40 -
SWOT Analysis Strength Weakness
1. Key technologies for micro-drill: the company accurately follows the development trend of IC substrates to become the only local manufacturer capable of giving mass production of 0.075mm products. Its technology level is at the same level with Japanese suppliers.
2. Good cost control ability: The company perfects its processing management system, uses automatic processing technology, accumulates its micro-drill mass production scale, enhances cost control efficiency and utilizes the edge of material cost to present its competitiveness.
3. Comprehensive customer base: Given that the existing clients are worldwide well-known manufacturers and the orders placed by them are very stable, the company will continue to develop new clients in the markets of Taiwan and China.
1. Influence of the condition of electronic supply chain and dependence on PCB cutting tool sales.
2. High proportion of sales is from Taiwan, China and Korea. Now the company is strengthening its business in the rest of overseas markets.
3. Main raw material of the company’s products is tungsten carbide. The company’s bargaining power is relatively weak because of its characteristic of rareness. In the event of huge and drastic hike of raw material, the company’s material cost will be affected.
Opportunity Threat 1. New generation of electronic
products and technology, like smart phones and high-end substrates, will increase the demands of micro drills.
2. New clients development in the Japan, Europe, and US market will bring sales and profit to the company.
1. Severe price competition for the low-end products in the industry is likely to result in vicious competition in the market.
Solutions 1. To strengthen the company’s global marketing and distribution
deployment to develop tier 1 clients in Japan, Europe and US market. 2. To expedite R&D and give mass production of the drills with high aspect
ratio. In order to use the high performance drills, more precision mass production technology shall be equipped. Thus, the manufacturers using our advanced drills can be more competitive than their rivals in the industry because it requires a higher threshold to have their competitors simulate the required skills.
3. To strengthen process management capability, enhance the yield rate and effectively reduce the production cost.
4. To develop new type of raw material, and further reduce the company’s material cost.

(2) Major Applications and Production Process of the Main Products ①. Major Applications of the Main Products
Item Major Functions Major Applications
Drills
Used to open through-holes for interlayer of IC substrate, HDI,
traditional PCB and FPC Routers Used to cut printed circuit board
Computer:PC, notebook, server Communication: cell phones, PDA Consumer: TV, digital camera, game console, DVD, set-top box
②. Production process
③. Supply Status of Major Materials The major material of the company’s products is tungsten carbide. Its material features and quality stability are the major concern of the company in purchase. The company has established good relationship with its suppliers, hence the supply has kept normal and stable.
Major material Suppliers Supply status
Tungsten carbide Japan-based Mitsubishi
Japan-based Sumitomo Good
④. Major Customers with over 10%net sales and Suppliers with over 10% total
purchases of the last two fiscal years: a. Material supplier list
Unit: NT$1,000 2007 2008
Name Amount
Ratio to annual
purchase net
amount (%)[%]
Relationship with the issuer
Name Amount
Ratio to annual
purchase net
amount (%)[%]
Relationship with the issuer
Sumitomo 160,676 28.38% N/A Sumitomo 139,349 31.99% N/A Mitsubishi 115,467 20.40% N/A Mitsubishi 85,720 19.68% N/A Reasons for the change in increase or decrease: Percentage of changes is under 10%.
- 41 -

b. List of major clients Unit: NT$1,000
2007 2008
Name Amount
Ratio to annual
net sales turnover
(%)
Relationship with the issuer
Name Amount
Ratio to annual
net sales turnover
(%)
Relationship with the issuer
Client A 440,139 28.49% Subsidiary Client A 315,993 27.54% SubsidiaryClient B 198,885 12.87% N/A N/A N/A N/A N/A Client D 158,153 10.24% N/A N/A N/A N/A N/A
Reasons for the change in increase or decrease: Three of my customers possessed over 10% of sales in 2007, while the ratio of the main customers was between 5% and 9% in 2008 because of considering the operating risk.
⑤. Output values in the recent two years Unit: NT$1,000/1,000pcs.
- 42 -
2007 2008 Year/output value Major products
Production capacity Output Output
value Production
capacity Output Output value
Precision drills 65,161 64,280 633,482 65,161 59,074 568,423Precision milling cutters 9,277 9,076 146,841 9,277 7,462 85,570
Total 74,438 73,356 780,323 74,438 66,536 653,993 ⑥. Sales turnovers in the recent two years
Unit: NT$1,000/1,000 pcs 2007 2008
Domestic sales Export sales Domestic sales Export sales
Year/sales turnover
Major products v o l u m e v a l u e Volume V a l u e Volume V a l u e Volume v a l u e
Precision drills 32,235 598,820 28,395 458,746 30,441 486,168 21,189 282,132
Precision milling cutter 6,900 218,909 1,134 46,495 6,074 157,048 462 15,338
Others 705 7,510 42,845 214,609 808 7,675 30,613 199,093
Total 39,840 825,239 72,374 719,850 37,323 650,891 52,264 496,563

- 43 -
3. Status of employees:
Year 2006 2007 2009 as of April 30Indirect 90 76 73 Direct 236 120 121 Number of
employees Total 326 196 194
Average age 31.1 32.2 32.7 Average service years 2.98 4.15 4.4
PhD 0% 0% 0% Master 2.5% 2.7% 3.1% College 40.5% 42.9% 43.1%
Senior high school graduate 48.2% 47.3% 46.7%
Education distribution
ratio senior high school
and Below 8.9% 7.1% 7.1%
4. Expenditure on Environmental Protection:
(1) To elaborate on the amount the company spent on loss (including compensation) and punishment caused by environmental pollution for the recent two years and the current year as of the annual report publication date, and disclose the counter measures (including improvement measures) and possible disbursements (covering the estimated amounts of possible losses, punishments and compensation caused by not taking counter measures. If the amounts can not be appropriately estimated, please state why): N/A
(2) Influence of RoHS:
As confirmed by the Industrial Development Bureau of Ministry of Economic Affairs as per doc. Guang-Dian-Zi no. 09500240130 dated March 29, 2006, the company is free from the restriction of RoHS requested by EU for hazardous substances.
5. Employee / Employer relation:
(1) Employee’s working environment and personal safety
i.To institute the guidelines of safety and health operation ii. To non-periodically hold safety and health education seminars iii. To post warning signs
(2) Appraisal of employee’s behavior and morality
i. To institute “behavior code” for directors, supervisors and managers to follow. ii. To institute “employee reward and punishment management regulations” for
employees to follow. In the event requiring giving a boost and punishment to an employee, the regulations shall be applied as the standards.
iii. Additionally, employee performance evaluation standards have also been specifically laid down, so employees will know how to comply with the behavior expected by the company.

- 44 -
(3) Employee welfare
To value its employees and take good care of them, the company has set employee recreation areas, and offered extra life and medical insurance to protect its employees, in which the field personnel are given higher benefit limits of accident insurance.
There is an employee welfare committee set in the company to plan a variety of employee welfare activities. Other than holding employee traveling and other recreational activities, the company also sends gifts or prizes for marrying and child birth cases and gives education subsidies, consolation money, holiday benefits and birthday gifts, etc. to its employees.
(4) Employee advanced studies and training
By instituting the “implementation and management procedure of education training”, the company has conducted a variety of training courses as scheduled, so the employees across the board can be capable of taking on the tasks. In order to ensure the efficiency of the training, the training system is divided into: internal and external training courses and accreditation appraisal. The company has given language, oriental and on-the-job training to its employees, aggressively trained their own lecturers from within, and encouraged its employees to self study. It is anticipated that, by cultivating professional talents in the company through the training system and encouraging employee’s persistent self-studies, employees’ quality will be enhanced and the working efficiency will be boosted. At the same time, the company has also brought out the knowledge management system and hoped that, through the knowledge management platform, more talents will be quickly nurtured, technology can be enhanced and experiences can be forever passed along, This company 97 year conduct each kind of training program altogether 32 school grade orders, the curriculum hour altogether 583.5 hours, the participation curriculum staff reaches 567 people, the education and training expense 157,000 dollar . The curriculum altogether divides into 5 broad headings, the curriculum category with carries out the condition to be as follows:
Item class hour people Specialized kind of training 16 207 306
Management training 1 42 21 New person training 2 132 22 Computer training 10 32.5 37 Laborer safety and health training 3 170 181
Total 32 583.5 567
(5) Employee’s retirement system
The company follows chapter 6 of Labor Standard Law to implement employee retirement related affairs. It has monthly contributed employee pension reserves as regulated in the old system and labor pension as regulated in the new system.

- 45 -
(6) Labor relations Since its establishment, the company has valued employee’s welfare, interests and rights, so its labor relationship has kept amicable. The company has periodically met with its employees, encouraged employees to submit proposals and set suggestion boxes for employees to reflect their opinions, in order to have good interaction and build harmonious labor relations.
(7) Were there any labor disputes resulting in the loss or possible loss of the company in the recent year and the current year as of the annual report publication date? If so, what is the loss or estimated loss amount? Are there any counter measures to be taken? If the amount can not be appropriately estimated, please state why: The labor dispute has been settled in May 2008. An agreement was signed to terminate the employment relationship between the subject employee and the company on May 15th, 2008, and the company has disbursed NT$ 256,149 in the settlement. .
6. Important agreements (including supply and sales contracts, technical corporation contracts, engineering contracts, long-term loan contracts, and the important contracts which may influence shareholders’ equity)
Contract
characteristics The interested
party Contract start and
end dates Major content Restriction
Long-term loan contract
China Development
Industrial Bank
2005.12.28 ~
2012.4.27 Installments N/A
Long-term loan contract
Taiwan Cooperative
Bank
2004.5.27 ~
2014.9.24 Installments N/A
Long-term loan contract
Syndicated loan - Industrial Bank of Taiwan, etc.
2008.8.25 ~
2011.8.25 Installments N/A

VI. Financial information
1. Condensed balance sheet and Income statement of the last f ive years A. Condensed Balance Sheet
Unit: NT$ Thousands Condensed Balance Sheet of f iscal year
2004~2008 Year
Item 2004 2005 2006 2007 2008
As of March 31, 2009
(Audited by CPAs)
Current Assets 578,883 668,293 997,918 1,183,344 1,254,899 946,523
Funds&investments 197,897 373,928 587,712 1,078,436 1,353,866 1,588,328
Fixed Assets 481,875 828,123 1,469,448 1,901,401 1,734,551 1,686,260
Intangible Assets - - - - - -
Other Assets 20,918 29,478 52,283 20,565 55,904 49,359
Total Assets 1,279,573 1,899,822 3,107,361 4,183,746 4,399,220 4,270,470Before allocation 322,410 535,309 840,756 1,042,632 571,680 496,495Current
Liabilities After allocation 336,782 624,906 - - - -
Long-term Liabilities 193,491 381,541 535,020 767,432 1,263,211 1,146,725
Other Liabilities 7,716 6,911 21,823 109,470 85,369 82,022Before allocation 523,617 923,761 1,717,658 1,841,537 1,920,260 1,725,242Total
Liabilities After allocation 537,989 1,013,358 - - - -
Capital Stock 483,930 552,581 773,882 954,692 1,070,566 1,070,566
Capital surplus 182,431 175,172 619,648 841,477 845,705 845,705Before allocation 106,398 243,909 603,314 680,757 398,461 419,945Retained
earnings After allocation 30,633 - - - - -Unrealized gain on financial instruments - - - 932 - 4,992
Cumulative translation adjustements (16,803) 4,399 18,742 65,673 164,228 204,020
Before allocation 755,956 976,061 - 2,466,088 2,478,960 2,545,228Total
shareholders’ equity After allocation 741,584 886,464 - - - -
- 46 -
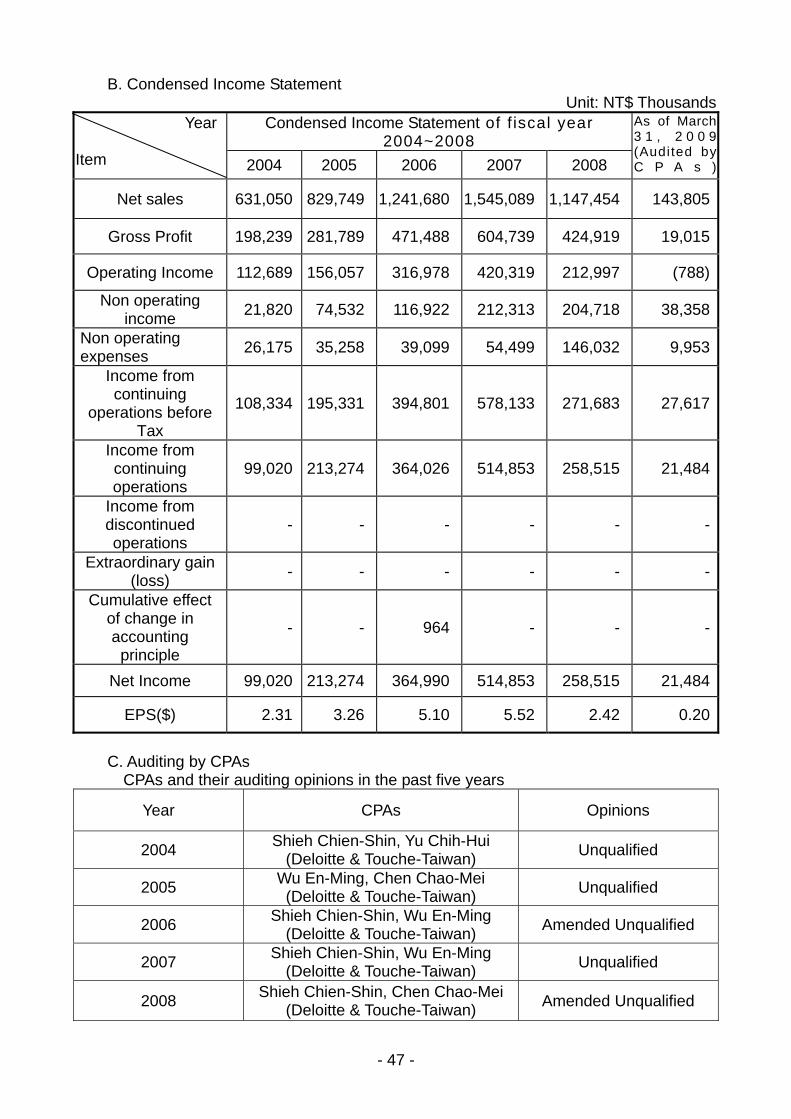
B. Condensed Income Statement Unit: NT$ Thousands
Condensed Income Statement of f iscal year 2004~2008
Year Item 2004 2005 2006 2007 2008
As of March 3 1 , 2 0 0 9(Audited by C P A s )
Net sales 631,050 829,749 1,241,680 1,545,089 1,147,454 143,805
Gross Profit 198,239 281,789 471,488 604,739 424,919 19,015
Operating Income 112,689 156,057 316,978 420,319 212,997 (788)
Non operating income 21,820 74,532 116,922 212,313 204,718 38,358
Non operating expenses 26,175 35,258 39,099 54,499 146,032 9,953
Income from continuing
operations before Tax
108,334 195,331 394,801 578,133 271,683 27,617
Income from continuing operations
99,020 213,274 364,026 514,853 258,515 21,484
Income from discontinued operations
- - - - - -
Extraordinary gain (loss) - - - - - -
Cumulative effect of change in accounting principle
- - 964 - - -
Net Income 99,020 213,274 364,990 514,853 258,515 21,484
EPS($) 2.31 3.26 5.10 5.52 2.42 0.20
C. Auditing by CPAs
CPAs and their auditing opinions in the past five years
Year CPAs Opinions
2004 Shieh Chien-Shin, Yu Chih-Hui (Deloitte & Touche-Taiwan) Unqualified
2005 Wu En-Ming, Chen Chao-Mei (Deloitte & Touche-Taiwan) Unqualified
2006 Shieh Chien-Shin, Wu En-Ming (Deloitte & Touche-Taiwan) Amended Unqualified
2007 Shieh Chien-Shin, Wu En-Ming (Deloitte & Touche-Taiwan) Unqualified
2008 Shieh Chien-Shin, Chen Chao-Mei (Deloitte & Touche-Taiwan) Amended Unqualified
- 47 -

2. Financial analysis in the past f ive years
Financia l analys is in the past f ive years Year
Item 2003 2004 2005 2006 2007
As of March 31, 2009 (Audited by CPAs)
Ratio of liabilities to assets 40.92 48.62 41.11 41.06 43.65 40.40 Financial structure (%) Ratio of long-term capital to fixed
assets 197.03 163.94 160.94 170.17 215.74 218.94
Current Ratio 179.55 124.84 138.47 140.75 219.51 190.64
Quick Ratio 143.23 94.76 89.12 99.90 145.47 116.03 Solvency (%)
Times interest Earned Ratio 11.98 20.23 14.64 18.88 6.9 3.78 Account Receivables Turnover (times) 2.62 2.51 3.30 3.25 2.5 2.02 Days sales in accounts receivable 139.10 145.23 110.71 112.24 146.20 180.30
Inventory Turnover (times) 3.82 3.89 2.96 2.74 1.93 1.50 Account Payable Turnover (times) 7.74 6.13 7.82 9.25 11.03 23.09
Average days in sales 95.58 93.88 123.22 133.32 189.15 243.48
Fixed Assets Turnover (times) 1.31 1.00 0.84 0.81 0.66 0.34
Operating ability
Total Assets Turnover(times) 0.49 0.44 0.40 0.37 0.26 0.13
Ratio of Return on assets (%) 9.11 13.90 15.38 14.73 6.82 2.67 Ratio of Return on shareholders’ equity (%) 14.72 24.63 26.02 23.97 10.46 3.42
Operating income 23.29 28.24 41.64 44.03 19.90 -0.29 Ratio to issued
capital stock (%) Income
before tax 22.39 35.35 51.87 60.56 25.38 10.32
Profit ratio (%) 15.69 25.70 29.39 33.32 22.53 14.94
Profitability
EPS ($) 2.31 3.86 5.10 5.52 2.42 0.20
Cash flow ratio (%) 53.11 19.46 30.28 51.16 72.56 25.12
Cash flow adequacy ratio (%) 29.67 36.01 34.76 36.64 40.47 35.27 Cash Flows (%)
Cash reinvestment ratio (%) 12.47 5.40 4.85 6.09 3.49 2.93
Degree of operating leverage 2.70 2.44 2.06 1.94 3.19 -84.48 Balance
Degree of financial leverage 1.10 1.07 1.09 1.08 1.27 0.07
- 48 -

Explantions for significant changes (over20%) in operating results include: (1) Solvency
A、 Current ratio and quick ratio increase is mainly due to short loans repayment and the unused long-term loan.
B、 Times interest earned ratio decrease is mainly due to the additional long-term loan created the increase of the interest expenses and the financial storm resulted in the decrease of the net profit.
(2) Profitability and Operating ability The revenues and profit dropped because the financial storm of the fourth quarter in 2008 brought about
the global economic recession (3) Cash Flows The Syndicated loan in 2008 formed the reduction of the current liability. At the same time, the reduction
of the current liability and the increase of long investment led to that the changes of cash flow ratio and cash reinvestment ratio reached to above 20%.
(4) The ratio of long-term capital to fixed assets grew because of the increase of long-term loan. (5) That degree of operating leverage increases was mainly due to the decrease of operating profit. Note1:Equations:
1. Financial structure (1)Ratio of liabilities to assets=Total liabilities/Total assets (2)Ratio of long-term capital to fixed assets= (Net Shareholder’s equity + Long-term liabilities) / Net fixed
assets. 2. Debt-paying ability (1)Current Ratio=Current assets/Current liabilities (2)Quick Ratio= (Current assets-Inventory-Prepaid expense) /Current liabilities (3)Times interest Earned Ratio= Net profit before tax and interest expense/interest expense
3. Operating ability (1) Receivables (Including accounts receivable and the notes receivable due to operation) turnover ratio= Net
sales/Average receivables (including accounts receivable and the notes receivable due to operation) balance
(2)Average cash receiving days=365/Turnover rate of total assets. (3) Inventory Turnover Ratio=Cost of sales/Average amount of inventory (4)Payables (including accounts payable and the notes payable due to operation) turnover ratio= Cost of
sales/Average Payables (including accounts payable and the notes payable due to operation) balance (5)Average period of sales=365/Inventory Turnover Ratio (6)Ratio of Fixed Assets Turnover=Net sales/Net fixed assets (7)Ratio of Total Assets Turnover=Net sales/Total assets
4. Profitability (1)Return on assets = [gain and loss after tax + interest expense× (1-ax ratio)]/ Average Total assets (2)Return on shareholders’ equity=gain and loss after tax/Average Net shareholders’ equity. (3)Net profit margin=gain and loss after tax/Net sales (4)EPS= (Net income -Preferred dividend) /weighted average number of issued shares (Note4)
5. Cash Flows (1)Cash flow ratio=Operating net Cash Flows/Current liabilities (2) Net Cash flow adequacy ratio = the past five years’ operating net Cash Flows/ the past five years’ (capital
expense+ inventory increasing amount+ cash dividend). (3)Ratio of cash reinvestment= (Operating net Cash Flows- cash dividend) / (Gross fixed assets+ Long-term
investment+ other financial assets+ operating capital) (Note5) 6. Balance: (1)Degree of Operating leverage= (Net operating income- operating cost and expense changes) /
Operating income (Note6) (2) Degree of Financial leverage=Operating income / (Operating income-interest expense)
Note2: The notice items for calculating EPS are as follows: 1. Based on weighted average common shares, not the weighted average number of issued shares. 2. For capitalization with cash or Treasury stock trade, the stock circulation must be included for
consideration to calculate weighted average stock shares. 3. For capitalization with retained earnings and additional paid-in capital, the earnings per share
calculated semi-annually and annually must be adjusted retroactively and proportionally to the capitalization but without considering the issuance period of the capitalization.
4. If preferred stock shares are nonconvertible and cumulative, the dividend of the year (whether it is distributed or not) should be deducted from net income or added to the net loss. If preferred stock
- 49 -

shares are not cumulative, preferred stock dividend should be deducted from net income if there is any but it needs not be added to net loss if there is any.
Note3: The notice items for cash flow analysis are as follows: 1. Net cash flow from operating activity meant for the net cash inflow from operating activity on the
Statement of Cash Flow. 2. Capital expenditure meant for the cash outflow of capita investment annually. 3. Increase of inventory is counted only when ending inventory exceeds beginning inventory. If the ending
inventory is decreased, it is booked as zero value. 4. Cash dividend includes the amount for common stock and preferred stock. 5. Gross fixed assets meant for the total fixed assets before deducting the cumulative depreciation.
Note4: Issuers are to have operating cost and operating expenses classified into the category of fixed and variable. If the classification of operating cost and operating expense involves estimation or discretional judgment, it must be made reasonably and consistently.
3. Supervisor’s Report in the past five years:Please refer to P. 51 in the annual report for
details. 4. Financial statements in the most recent years: Please refer to P.52~P.91 in the annual
report for details. 5. Consolidated financial difficulties of the Company and related party on the Company’s
financial position: Please refer to P. 92~97 in the annual report for details. 6. Impact of financial difficulties of the Company and related party on the Company’s
financial position: N/A
- 50 -

Topoint Technology Co., Ltd.
Supervisor’s Report
The 2007 consolidated financial statements, business report, and remuneration of the company and its subsidiaries has been audited and certified by the CPAs: Shieh Chien-Shin, and Chen Chao-Mei of Deloitte & Touche-Taiwan. The supervisors have reviewed and audited the above-mentioned issued documents, composed and presented by the Board of Directors. It is concluded that the said documents are presented fairly; therefore, the Supervisor’s Report is hereby issued in accordance with Article 219 of Company Law.
Sincerely yours,
2009 Shareholder ’s Meeting of TOP
Supervisor: Chen Ken-Ching
Independent supervisor: Liang Shwu-Jian
Independent supervisor: Niu Cheng-Chie
March 17, 2009
- 51 -

- 53 -
INDEPENDENT AUDITORS’ REPORT The Board of Directors and Stockholders Topoint Technology Co., Ltd. We have audited the accompanying balance sheets of Topoint Technology Co., Ltd. (the “Corporation”) as of December 31, 2008 and 2007 and the related statements of income, changes in stockholders’ equity and cash flows for the years then ended. These financial statements are the responsibility of the Corporation’s management. Our responsibility is to express an opinion on these financial statements based on our audits. We conducted our audits in accordance with the Rules Governing the Audit of Financial Statements by Certified Public Accountants and auditing standards generally accepted in the Republic of China. Those rules and standards require that we plan and perform the audit to obtain reasonable assurance about whether the financial statements are free of material misstatement. An audit includes examining on a test basis, evidence supporting the amounts and disclosures in the financial statements. An audit also includes assessing the accounting principles used and significant estimates made by management, as well as evaluating the overall financial statement presentation. We believe that our audits provide a reasonable basis for our opinion. In our opinion, the financial statements referred to in the first paragraph present fairly, in all material respects, the financial position of Topoint Technology Co., Ltd. as of December 31, 2008 and 2007 and the results of its operations and its cash flows for the years then ended, in conformity with the Guidelines Governing the Preparation of Financial Reports by Securities Issuers, requirements of the Business Accounting Law and Guidelines Governing Business Accounting relevant to financial accounting standards, and accounting principles generally accepted in the Republic of China. As stated in Note 3 to the financial statements, on January 1, 2008, the Corporation adopted Interpretation 2007-052 issued by the Accounting Research and Development Foundation of the Republic of China, which requires companies to recognize bonuses paid to employees, directors and supervisors as compensation expenses. These bonuses were previously recorded as appropriations from earnings.

- 54 -
We have also audited the consolidated financial statements of the Corporation and subsidiaries as of and for the years ended December 31, 2008 and 2007 and have issued a modified unqualified opinion thereon in our report dated February 20, 2009. February 20, 2009
Notice to Readers The accompanying financial statements are intended only to present the financial position, results of operations and cash flows in accordance with accounting principles and practices generally accepted in the Republic of China and not those of any other jurisdictions. The standards, procedures and practices to audit such financial statements are those generally accepted and applied in the Republic of China. For the convenience of readers, the auditors’ report and the accompanying financial statements have been translated into English from the original Chinese version prepared and used in the Republic of China. If there is any conflict between the English version and the original Chinese version or any difference in the interpretation of the two versions, the Chinese-language auditors’ report and financial statements shall prevail.

- 55 -
TOPOINT TECHNOLOGY CO., LTD. BALANCE SHEETS DECEMBER 31, 2008 AND 2007 (In Thousands of New Taiwan Dollars, Except Par Value) 2008 2007 2008 2007 ASSETS Amount % Amount % LIABILITIES AND STOCKHOLDERS’ EQUITY Amount % Amount % CURRENT ASSETS CURRENT LIABILITIES
Cash (Note 4) $ 428,579 10 $ 96,074 2 Short-term loans (Note 11) $ - - $ 50,000 1Financial assets at fair value through profit or loss (Notes 2 and 5) 423 - 1,790 - Commercial paper, net (Note 12) - - 29,982 1Available-for-sale financial assets (Notes 2 and 6) 18,251 - 8,030 - Financial liabilities at fair value through profit or loss (Notes 2 and 5) 47 - - -Notes receivable (Note 2) 10,753 - 23,083 1 Notes payable 10,733 - 51,606 1Accounts receivable (Notes 2 and 7) 203,918 5 283,348 7 Accounts payable 22,039 - 30,805 1Notes and accounts receivable - related parties (Note 20) 114,434 3 278,400 7 Notes and accounts payable - related parties (Note 20) - - 1,030 -Other financial assets 1,383 - 7,351 - Income tax payable (Notes 2 and 17) 31,530 1 58,366 1Inventories, net (Notes 2 and 8) 376,147 9 326,460 8 Accrued expenses (Notes 2, 18 and 20) 123,402 3 127,198 3Prepayments 1,837 - 16,962 - Balance payable - machinery and equipment 2,712 - 176,396 4Deferred income tax assets (Notes 2 and 17) 45,303 1 93,504 2 Deferred income (Note 2) 28,017 1 25,285 1Certificates of deposits - restricted (Note 21) 53,864 1 48,300 1 Long-term loans - current portion (Notes 13, 20 and 21) 351,640 8 289,995 7Other current assets 7 - 42 - Other current liabilities 1,560 - 1,515 -
Total current assets 1,254,899 29 1,183,344 28 Total current liabilities 571,680 13 842,178 20
LONG-TERM EQUITY INVESTMENTS (Notes 2 and 9) 1,353,866 31 1,078,436 26 LONG-TERM LOANS, NET OF CURRENT PORTION (Notes 13, 20 and 21) 1,263,211 29 767,432 18PROPERTY, PLANT AND EQUIPMENT (Notes 2, 10 and 21)
Cost OTHER LIABILITIES Land 75,652 2 75,652 2 Deferred income tax liabilities (Notes 2 and 17) - - 23,766 1Buildings and equipment 259,329 6 253,422 6 Deferred income (Note 2) 85,369 2 84,282 2Machinery and equipment 1,790,847 40 1,678,716 40 Transportation equipment 2,778 - 1,620 - Total other liabilities 85,369 2 108,048 3Office equipment 2,672 - 2,672 - Miscellaneous equipment 35,345 1 34,629 1 Total liabilities 1,920,260 44 1,717,658 41
Total cost 2,166,623 49 2,046,711 49 Less: Accumulated depreciation 437,049 10 317,858 8 STOCKHOLDERS’ EQUITY
1,729,574 39 1,728,853 41 Capital stock, NT$10.00 par value; authorized - 140,000 thousand Construction in progress and prepayments for equipment 4,977 - 172,548 4 shares; issued and outstanding - 107,057 thousand shares in 2008
and 95,469 thousand shares in 2007 1,070,566 24 954,692 23Net property, plant and equipment 1,734,551 39 1,901,401 45 Capital surplus
Additional paid-in capital from share issuance in excess of par value 845,705 19 841,477 20OTHER ASSETS Retained earnings
Refundable deposits 5,282 - 14,774 1 Legal reserve 123,143 3 71,658 2Deferred income tax assets (Notes 2 and 17) 45,021 1 - - Special reserve 16,803 - 16,803 -Miscellaneous (Notes 2 and 18) 5,601 - 5,791 - Unappropriated earnings 258,515 6 514,853 12
Total retained earnings 398,461 9 603,314 14Total other assets 55,904 1 20,565 1 Other equity adjustments
Cumulative translation adjustments 164,228 4 65,673 2 Unrealized gain on financial instruments - - 932 - Total other equity adjustments 164,228 4 66,605 2 Total stockholders’ equity 2,478,960 56 2,466,088 59 TOTAL $ 4,399,220 100 $ 4,183,746 100 TOTAL $ 4,399,220 100 $ 4,183,746 100 The accompanying notes are an integral part of the financial statements. (With Deloitte & Touche audit report dated February 20, 2009)

- 56 -
TOPOINT TECHNOLOGY CO., LTD. STATEMENTS OF INCOME YEARS ENDED DECEMBER 31, 2008 AND 2007 (In Thousands of New Taiwan Dollars, Except Earnings Per Share) 2008 2007 Amount % Amount % SALES (Note 20) $ 1,165,162 102 $ 1,560,853 101 LESS: SALES RETURNS 10,006 1 14,794 1 SALES DISCOUNTS AND ALLOWANCES 7,702 1 970 - NET SALES 1,147,454 100 1,545,089 100 COST OF SALES (Note 20) 726,400 63 944,254 61 GROSS PROFIT BEFORE REALIZED PROFIT ON
INTERCOMPANY TRANSACTIONS 421,054 37 600,835 39 REALIZED PROFIT ON INTERCOMPANY
TRANSACTIONS (Note 2) 3,865 - 3,904 - GROSS PROFIT 424,919 37 604,739 39 OPERATING EXPENSES
Marketing and selling 53,186 5 69,073 5General and administrative 119,215 10 78,830 5Research and development 39,521 3 36,517 2
Total operating expenses 211,922 18 184,420 12
OPERATING INCOME 212,997 19 420,319 27 NONOPERATING INCOME AND GAINS
Equity in net income of investees 176,875 16 191,583 13Income from sale of scraps 12,985 1 7,974 1Gain on disposal of property, plant and equipment 9,956 1 4,830 -Interest income 1,652 - 715 -Gain from valuation of financial assets 423 - 1,790 -Gain on sale of investments, net 219 - 3 -Others 2,608 - 5,418 -
Total nonoperating income and gains 204,718 18 212,313 14
NONOPERATING EXPENSES AND LOSSES
Losses on inventory valuation and obsolescence 64,752 6 12,356 1Interest expenses (Note 20) 45,793 4 29,596 2Loss on impairment of available-for-sale financial
assets 31,621 3 - -(Continued)

- 57 -
TOPOINT TECHNOLOGY CO., LTD. STATEMENTS OF INCOME YEARS ENDED DECEMBER 31, 2008 AND 2007 (In Thousands of New Taiwan Dollars, Except Earnings Per Share) 2008 2007 Amount % Amount %
Exchange loss, net $ 1,651 - $ 5,310 -Loss on disposal of property, plant and equipment 468 - 1,564 -Loss from valuation of financial liabilities 47 - - -Others 1,700 - 5,673 1
Total nonoperating expenses and losses 146,032 13 54,499 4
INCOME BEFORE INCOME TAX 271,683 24 578,133 37 INCOME TAX EXPENSE (Notes 2 and 17) 13,168 1 63,280 4 NET INCOME $ 258,515 23 $ 514,853 33 2008 2007 Before Tax After Tax Before Tax After Tax EARNINGS PER SHARE (Note 16)
Basic $ 2.54 $ 2.42 $ 5.52 $ 4.92Diluted $ 2.50 $ 2.38 $ 5.28 $ 4.70
The accompanying notes are an integral part of the financial statements. (With Deloitte & Touche audit report dated February 20, 2009) (Concluded)

- 58 -
TOPOINT TECHNOLOGY CO., LTD. STATEMENTS OF CHANGES IN STOCKHOLDERS' EQUITY YEARS ENDED DECEMBER 31, 2008 AND 2007 (In Thousands of New Taiwan Dollars, Except Dividends Per Share) Capital Surplus Additional Paid-in Capital Unrealized Capital Stock Issued and from Share Bond Cumulative Gain (Loss) on Outstanding Capital Issuance in Conversion Retained Earnings (Note 14) Translation Financial Total Shares Collected in Excess of Option Unappropriated Adjustments Instruments Stockholders' (Thousands) Amount Advance Par Value (Notes 2 and 23) Legal Reserve Special Reserve Earnings (Note 2) (Notes 2 and 6) Equity BALANCE, JANUARY 1, 2007 76,116 $ 761,161 $ 12,721 $ 596,038 $ 23,610 $ 35,159 $ 16,803 $ 365,633 $ 18,742 $ - $ 1,829,867 Appropriation of prior year’s earnings
Legal reserve - - - - - 36,499 - (36,499 ) - - - Stock dividend - NT$1.146 per share 8,871 88,710 - - - - - (88,710 ) - - - Cash dividend - NT$2.674 per share - - - - - - - (206,990 ) - - (206,990 ) Bonus to employees 2,356 23,560 - - - - - (23,560 ) - - - Remuneration to directors and supervisors - - - - - - - (9,874 ) - - (9,874 )
Capital collected in advance 1,272 12,721 (12,721 ) - - - - - - - - Conversion of convertible bond 6,854 68,540 - 245,439 (23,610 ) - - - - - 290,369 Net income in 2007 - - - - - - - 514,853 - - 514,853 Translation adjustments on long-term equity investments - - - - - - - - 46,931 - 46,931 Unrealized gain on financial instruments - - - - - - - - - 932 932 BALANCE, DECEMBER 31, 2007 95,469 954,692 - 841,477 - 71,658 16,803 514,853 65,673 932 2,466,088 Appropriation of prior year’s earnings
Legal reserve - - - - - 51,485 - (51,485 ) - - - Stock dividend - NT$1.194 per share 11,399 113,989 - - - - - (113,989 ) - - - Cash dividend - NT$2.786 per share - - - - - - - (265,973 ) - - (265,973 ) Bonus to employees - - - - - - - (69,505 ) - - (69,505 ) Remuneration to directors and supervisors - - - - - - - (13,901 ) - - (13,901 )
Net income in 2008 - - - - - - - 258,515 - - 258,515 Issuance of stock due to the exercise of stock options 189 1,885 - 4,228 - - - - - - 6,113 Translation adjustments on long-term equity investments - - - - - - - - 98,555 - 98,555 Unrealized loss on financial instruments - - - - - - - - - (932 ) (932 ) BALANCE, DECEMBER 31, 2008 107,057 $ 1,070,566 $ - $ 845,705 $ - $ 123,143 $ 16,803 $ 258,515 $ 164,228 $ - $ 2,478,960 The accompanying notes are an integral part of the financial statements. (With Deloitte & Touche audit report dated February 20, 2009)

- 59 -
TOPOINT TECHNOLOGY CO., LTD. STATEMENTS OF CASH FLOWS YEARS ENDED DECEMBER 31, 2008 AND 2007 (In Thousands of New Taiwan Dollars) 2008 2007 CASH FLOWS FROM OPERATING ACTIVITIES
Net income $ 258,515 $ 514,853 Adjustments to reconcile net income to net cash provided
by operating activities: Provision for doubtful accounts 3,482 389 Depreciation and amortization 188,633 158,877 Loss on impairment of available-for-sale financial
assets 31,621 - Gain on sale of investments, net (219 ) (3 )Loss on inventory valuation 12,980 6,885 Loss on inventory obsolescence 51,772 5,471 Equity in net income of investees (176,875 ) (191,583 )Realized gain on intercompany transactions (3,865 ) (3,904 )Net gain on disposal of property, plant and equipment (9,488 ) (3,266 )Gain from valuation of financial assets (423 ) (1,790 )Loss from valuation of financial liabilities 47 - Provision for reversed pension costs (2,513 ) (1,431 )Deferred income tax (20,586 ) 3,466 Interest expenses on bonds payable - 1,594 Net changes in operating assets and liabilities
Financial assets at fair value through profit or loss 1,790 - Notes receivable 12,330 9,855 Accounts receivable 79,430 (110,362 )Notes and accounts receivable - related parties 163,966 (35,100 )Other financial assets 7,362 12,968 Inventories (114,439 ) (5,484 )Prepayments 15,125 5,728 Other current assets 35 259 Overdue receivables (3,482 ) (389 )Notes payable (40,873 ) (5,145 )Accounts payable (8,766 ) 8,733 Notes and accounts payable - related parties (1,030 ) (1,178 )Income tax payable (26,836 ) 23,083 Accrued expenses (2,953 ) 39,493 Other current liabilities 45 (1,923 )
Net cash provided by operating activities 414,785 430,096
CASH FLOWS FROM INVESTING ACTIVITIES
Acquisition of available-for-sale financial assets (142,848 ) (7,142 )Proceeds from disposal of available-for-sale financial
assets 100,293 47 Acquisition of property, plant and equipment (317,150 ) (657,065 )Proceeds of the disposal of property, plant and equipment 139,827 187,138 Decrease from refundable deposits 9,492 4,920
(Continued)

- 60 -
TOPOINT TECHNOLOGY CO., LTD. STATEMENTS OF CASH FLOWS YEARS ENDED DECEMBER 31, 2008 AND 2007 (In Thousands of New Taiwan Dollars) 2008 2007
Decrease (increase) in certificates of deposits - restricted $ (5,564 ) $ 18,733 Increase in miscellaneous assets (506 ) (1,668 )Acquisition of long-term equity investments - (252,210 )
Net cash used in investing activities (216,456 ) (707,247 )
CASH FLOWS FROM FINANCING ACTIVITIES
Net decrease in short-term loans (50,000 ) (164,073 )Net decrease in commercial paper (29,982 ) (60,009 )Increase in long-term loans 1,206,000 855,940 Repayment of long-term loans (648,576 ) (185,347 )Cash dividends paid (265,973 ) (206,990 )Bonus to employees paid (69,505 ) - Remuneration to directors and supervisors paid (13,901 ) (9,874 )Proceeds from exercise of employee stock options 6,113 -
Net cash provided by financing activities 134,176 229,647
NET INCREASE (DECREASE) IN CASH 332,505 (47,504 ) CASH, BEGINNING OF YEAR 96,074 143,578 CASH, END OF YEAR $ 428,579 $ 96,074 SUPPLEMENTAL CASH FLOW INFORMATION
Interest paid $ 46,062 $ 30,662 Less: Interest capitalized 245 1,902 Interest paid excluding capitalized interest $ 45,817 $ 28,760 Income tax paid $ 60,590 $ 36,731
NONCASH FINANCING ACTIVITIES
Current portion of long-term loans $ 351,640 $ 289,995 Conversion of convertible bonds $ - $ 290,369
CASH PAID FOR PROPERTY ACQUISITION
Increase in properties $ 143,466 $ 788,642 Net decrease (increase) in payables on equipment 173,684 (130,888 )Capitalized interest on convertible bonds - (689 )Cash paid $ 317,150 $ 657,065
The accompanying notes are an integral part of the financial statements. (With Deloitte & Touche audit report dated February 20, 2009) (Concluded)

- 61 -
TOPOINT TECHNOLOGY CO., LTD. NOTES TO FINANCIAL STATEMENTS YEARS ENDED DECEMBER 31, 2008 AND 2007 (In Thousands of New Taiwan Dollars, Unless Stated Otherwise) 1. ORGANIZATION AND OPERATIONS Topoint Technology Co., Ltd. (the “Corporation”) was incorporated in 1996. It manufactures and markets
micro-drills for printed circuit boards (PCBs), numerically controlled drilling machines for PCBs and peripheral equipment used in PCB manufacture. On May 10, 2000, the Securities and Futures Commission (SFC) approved the Corporation’s application to become a public company. Since December 21, 2004, the Corporation’s shares have been traded on the GreTai Securities Market (over-the-counter securities exchange). Later, when the Corporation’s shares ceased to be traded over the counter, the Corporation’s shares became listed on the Taiwan Stock Exchange on January 21, 2008.
As of December 31, 2008 and 2007, the Corporation had 196 and 326 employees, respectively. 2. SUMMARY OF SIGNIFICANT ACCOUNTING POLICIES Basis of Presentation The accompanying financial statements have been prepared in conformity with the Guidelines Governing
the Preparation of Financial Reports by Securities Issuers, Business Accounting Law, Guidelines Governing Business Accounting, and accounting principles generally accepted in the Republic of China (ROC). In preparing financial statements in conformity with these guidelines and principles, the Corporation is required to make certain estimates and assumptions that could affect the amounts of allowance for doubtful accounts;inventory devaluation;property, plant and equipment depreciation;pension, bonuses to employees and remuneration to directors and supervisors; etc. Actual results could differ from these estimates.
For the convenience of readers, the accompanying financial statements have been translated into English
from the original Chinese version prepared and used in the ROC. If these is any conflict between the English version and the original Chinese version or any difference in the interpretation of the two version, the Chinese-language auditors’ report and financial statements shall prevail.
The Corporation’s significant accounting policies are summarized as follows: Current/Noncurrent Assets and Liabilities Current assets are cash and those assets held for trading or to be converted to cash, sold or consumed within
one year from the balance sheet date. Current liabilities are obligations due within one year from the balance sheet date. All other assets and liabilities are classified as noncurrent.
Financial Instruments at Fair Value Through Profit or Loss Financial instruments at fair value through profit or loss include financial assets or financial liabilities
classified as held for trading and financial instruments that are designated on initial recognition as at fair value through profit or loss, with direct instrument acquisition costs expensed as incurred. After initial recognition, financial instruments are remeasured at fair value, with the changes in fair value recognized in as gain or loss. A regular purchase or sale of financial assets is recognized and de-recognized using settlement date accounting.

- 62 -
Derivative financial instruments that need not be subject to hedge accounting are classified as financial assets when their fair value exceeds zero and are classified as financial liabilities when their fair value is lower than zero.
For forward contracts, the valuation method is used to determine their fair value. Available-for-sale Financial Assets Available-for-sale financial assets are initially recognized at fair value plus direct asset acquisition costs.
At each balance sheet date after the initial recognition, available-for-sale financial assets are remeasured at fair value, with changes in fair value recognized in equity until the financial assets are disposed of. On asset disposal, the cumulative gain or loss previously recognized in equity is included in gain or loss for the year. All regular purchases or sales of financial assets are recognized and de-recognized on a settlement date basis.
The fair value bases of available-for-sale financial assets are similar to those of financial instruments at fair
value through profit or loss. Cash dividends are recognized on the ex-dividend date; however, dividends distributed from the
pre-acquisition earnings are treated as a reduction of investment cost. Stock dividends received are not recognized as investment income but are recorded as an increase in the number of shares. The total number of shares after the increase is used to recalculate the cost per share.
An impairment loss is recognized when there is objective evidence that the financial asset is impaired.
Any decrease in impairment loss on an equity instrument classified as available for sale is recognized directly under equity.
Revenue Recognition, Accounts Receivable and Allowance for Doubtful Accounts Sales are recognized when titles to products and risks of ownerships are transferred to customers because
the earning process has been completed or substantially completed and revenue is realized or realizable. Sales are determined at fair value, taking into account business and quantity discounts agreed upon by the Corporation and customer. The imputed interest rate is not included in calculating fair value because the fair value of receivables approximates the nominal amount of payments and sales transactions are frequent.
Allowance for doubtful accounts is provided on the basis of a review of the collectibility of receivables. Inventories Inventories are stated at the lower of weighted-average cost or market value (net realizable value or
replacement cost). Long-term Equity Investments Accounted for by the Equity Method Under the equity method, long-term investments are stated at cost on the acquisition date and subsequently
adjusted for the Corporation’s equity in the investee’s net income or net loss. Any cash dividends received from investees are accounted for as a reduction of the carrying value of the related investments.
Stock dividends received from an investee are accounted for as increases in the number of shares held and
are not recognized as investment income. The costs of equity investments sold are determined using the weighted-average method. An impairment loss is recognized when there are objective evidences of the recoverable amount of an asset
becoming less than its carrying amount.

- 63 -
Property, Plant and Equipment Property, plant and equipment are stated at cost less accumulated depreciation. Major additions or
betterments are capitalized, while maintenance and repairs are expensed currently. Depreciation expense is calculated using the straight-line method over service lives estimated as follows
(plus one year to represent estimated salvage value): buildings, 3 to 50 years; machinery and equipment, 3 to 10 years; transportation equipment, 3 to 5 years; office equipment, 3 years; and miscellaneous equipment, 3 to 7 years. Property, plant and equipment still in use beyond their originally estimated service lives are depreciated over their newly estimated service lives.
During property construction, interest charges for borrowings used to finance the construction are
capitalized and debited to fixed assets. When property, plant and equipment are retired or disposed of, the related cost and accumulated
depreciation are removed from the accounts, and any gains or losses are recognized as nonoperating income or expenses.
Impairment losses are recognized when the carrying values of property, plant and equipment exceed their
recoverable amounts on the balance sheet date. If the recoverable amount increases, the increase in carrying value is recognized as gain. However, this increase should not exceed the carrying value that would have been determined (net of depreciation) had no impairment loss been recognized for the asset in prior years.
Convertible Bonds For convertible bonds issued on or after January 1, 2006, the liability and equity components should be
identified. The liability component (excluding the embedded non-equity derivatives) is measured at amortized cost using the effective interest method, while the embedded non-equity derivatives are measured at fair value. The carrying amount of the equity component is calculated by deducting the fair value of the liability component from the fair value of the convertible bonds as a whole.
The book value approach is used to account for bond conversion by the bondholders. Under this method,
no gain or loss on bond conversion is recorded, but the shares resulting from the bond conversion and related accounts are transferred to capital and capital surplus.
Deferred Income Unrealized gains or losses from downstream transactions with equity-method investees are deferred at the
percentage of the Corporation’s equity interest in the investee if the Corporation has no controlling power over the investees. Unrealized gains or losses on sales to investees over which the Corporation has a controlling power are totally eliminated. Gains or losses arising from equipment purchases from equity-method investees are eliminated and recognized over the estimated remaining useful life of the equipment.
Compensatory Stock Options Employee stock options granted on or after January 1, 2008 are accounted for under Statement of Financial
Accounting Standards No. 39 - “Share-based Payment.” Employee stock options granted between January 1, 2004 and December 31, 2007 were accounted for under
the interpretations issued by the Accounting Research and Development Foundation (ARDF). Until 2007, the Corporation used the intrinsic value method, under which compensation cost was recognized on a straight-line basis over the vesting period.
- 64 -
Based on Interpretation 96-330 issued by ARDF in December 2007, the compensation cost remains the same if the revised plan meets the related criteria stated in this interpretation. Otherwise, the revised plan would replace the original plan and the Corporation should calculate the incremental compensation cost using the intrinsic value method and amortize this cost over the vesting period.
Pension Costs Pension costs under the defined benefit plan are recognized in accordance with actuarial reports.
Unrecognized net transition obligation is amortized within 25 years. Prior service cost and pension gain (loss) are amortized using the straight-line method over the average remaining service years of employees. Pension costs under the defined contribution plan are recognized in accordance with the amount of required contributions by the Corporation during the employees’ service period.
Income Tax The Corporation accounts for income tax using the inter-period allocation method. Under this method,
deferred income tax is recognized for investment tax credits and tax consequences of differences between financial statement carrying amounts and their respective tax bases. A valuation allowance is recognized if evidence indicates that it is more likely than not that a portion or the entire deferred tax asset will not be realized. A deferred tax asset or liability is classified as current or noncurrent according to the classification of the related asset or liability. However, if a deferred asset or liability cannot be related to an asset or liability in the financial statements, it is classified as current or noncurrent on the basis of the expected reversal date of the temporary difference.
Tax credits for purchases of machinery, equipment and technology, research and development expenditures,
and personnel training expenditures are recognized using the flow-through method. Adjustments of prior years’ tax liabilities are added to or deducted from the current year’s tax expense. Income tax (10%) on the undistributed earnings is recorded as expense in the year when the stockholders resolve to retain the earnings.
Foreign-currency Transactions Foreign-currency transactions are recorded in New Taiwan dollars at the rates of exchange in effect when
the transactions occur. Gains or losses from settling foreign-currency assets and liabilities at prevailing rates are credited or charged to current income. Year-end balances of foreign-currency assets and liabilities are restated at the prevailing exchange rates, and the resulting differences are credited or charged to current income. However, differences pertaining to foreign-currency long-term stock investments accounted for by the equity method are reported as cumulative translation adjustments under stockholders’ equity.
3. ACCOUNTING CHANGE In March 2007, the Accounting Research and Development Foundation issued Interpretation 2007-052,
which requires companies to recognize bonuses paid to employees, directors and supervisors as compensation expenses beginning January 1, 2008. These bonuses were previously recorded as appropriations from earnings. This accounting change resulted in decreases of $15,310 thousand in net income and of NT$0.14 in after income tax basic earnings per share for 2008.

- 65 -
4. CASH 2008 2007 Cash on hand $ 641 $ 694 Checking accounts and demand deposits 156,700 62,132 Foreign-currency demand deposits 55,198 33,248 Time deposits, annual yield rate - 0.35%-1.77% 216,040 - $ 428,579 $ 96,074 5. FINANCIAL ASSETS AND LIABILITIES AT FAIR VALUE THROUGH PROFIT OR LOSS December 31 2008 2007 Financial assets held for trading Forward exchange contracts $ 423 $ 1,790 Financial liabilities held for trading Forward exchange contracts $ 47 $ - The Corporation used derivative contracts in 2008 and 2007 to manage exposures due to exchange rate
fluctuations. The Corporation’s hedge strategy is to use instruments with negative correlation to the values of the hedged
items. Forward exchange contracts as of December 31, 2008 and 2007 were as follows:
Currency Maturity Due Contract Amount
(in Thousands) December 31, 2008 Forward exchange contracts - sell US$/NT$ 2009.1.5-2009.3.20 US$2,830/NT$93,062 December 31, 2007 Forward exchange contracts - buy NT$/CHF 2008.3.18-2008.5.20 NT$98,879/CHF3,500 Net gains (losses) on financial assets held for trading were $6,744 thousand in 2008 and $(739) thousand in
2007. 6. AVAILABLE-FOR-SALE FINANCIAL ASSETS December 31 2008 2007 Domestic mutual funds $ 10,000 $ - Quoted domestic stocks 8,251 8,030 $ 18,251 $ 8,030 The Corporation evaluated the carrying value of available-for-sale assets in 2008. This evaluation resulted
in the recognition of an impairment loss of $31,621 thousand on these assets in 2008.

- 66 -
Movements of unrealized gain (loss) on financial instruments were as follows: December 31 2008 2007 Balance, beginning of year $ 932 $ - Reported as a separate component of stockholders’ equity (32,334 ) 932 Recognized in earnings 31,402 - Balance, end of year $ - $ 932 7. ACCOUNTS RECEIVABLE In 2008, the Corporation used nonrecourse maturity factoring by selling to a bank its accounts receivable
amounting to $33,732 thousand. As of December 31, 2008, all of the receivables on the factored accounts had been received by the
Corporation. 8. INVENTORIES 2008 2007 Merchandise $ 7,597 $ 9,486 Finished goods 98,510 65,200 Work in process 15,685 67,188 Raw materials 225,038 150,130 Supplies 60,930 53,089 407,760 345,093 Less: Allowance for inventory losses 31,613 18,633 $ 376,147 $ 326,460 9. LONG-TERM EQUITY INVESTMENTS 2008 2007 % of % of Carrying Owner- Carrying Owner- Value ship Value ship Unlisted companies Topoint Technology Co., Ltd. (B.V.I.) $ 1,351,716 100 $ 1,076,003 100 Warpspeed Corporation (B.V.I.) 1,405 100 1,433 100 Topoint Japan Co., Ltd. 745 52 1,000 52 $ 1,353,866 $ 1,078,436

- 67 -
The Corporation invested indirectly in Shanghai Topoint Precision Technology Co., Ltd. through Topoint Technology Co., Ltd. (B.V.I.). Warpspeed Corporation (B.V.I.) was incorporated in 2001 to engage in international trading. The Corporation invested $4,337 thousand to obtain a 52% equity interest in Topoint Japan Co., Ltd., which sells electronic components.
The investees’ financial statements for the same reporting periods as those of the Corporation, which were
used to calculate the carrying values of the investments, had all been audited by the Corporation’s independent auditors, except those of Topoint Japan Co., Ltd. The Corporation believes that, had Topoint Japan Co., Ltd.’s financial statements been audited, any resulting adjustments would have had no material effect on the Corporation’s financial statements.
All accounts of the Corporation’s subsidiaries were included in the Corporation’s consolidated financial
statements of 2008 and 2007.
On December 10, 2008 and January 20, 2009, the Corporation’s board of directors resolved to make capital transfers Topoint Technology Co., Ltd. (B.V.I.), and these transfers totaled US$7,800 thousand. Topoint Technology Co., Ltd. (B.V.I.) resolved to transfer US$8,000 thousand to the capital stock of Shanghai Topoint Precision Technology Co., Ltd. As of February 20, 2009, the date of the accompanying independent auditors’ report, the registration of these transfers with the Investment Commission of the Ministry of Economic Affairs had been completed.
10. PROPERTY, PLANT AND EQUIPMENT Accumulated depreciation consisted of: 2008 2007 Buildings $ 54,286 $ 34,336 Machinery and equipment 360,381 268,432 Transportation equipment 862 1,619 Office equipment 1,464 833 Miscellaneous equipment 20,056 12,638 $ 437,049 $ 317,858 Depreciation expenses were $186,273 thousand in 2008 and $155,811 thousand in 2007. Interest charges of $245 thousand in 2008 and $2,591 thousand in 2007 were capitalized at interest rates of
3.25% to 3.28% and 2.34% to 2.73%, respectively. 11. SHORT-TERM LOANS 2008 2007 Unsecured loans - annual interest of 2.51-2.80% $ - $ 50,000 12. COMMERCIAL PAPER Commercial paper with one-year maturities were issued under guarantees by commercial institutions.
These were issued at discount rates of 2.07% as of December 31, 2007.

- 68 -
13. LONG-TERM LOANS December 31, 2008
Current Portion
Long-term Loans Total
Credit bank Syndicated loan - Industrial Bank of Taiwan, etc. $ 133,333 $ 766,667 $ 900,000 Taiwan Cooperative Bank 134,527 320,072 454,599 China Development Industrial Bank 83,780 176,472 260,252 $ 351,640 $ 1,263,211 $ 1,614,851 December 31, 2007
Current Portion
Long-term Loans Total
Credit bank Taiwan Cooperative Bank $ 108,497 $ 318,998 $ 427,495 China Development Industrial Bank 66,633 260,252 326,885 Chinatrust Commercial Bank 7,577 130,000 137,577 E.Sun Bank 55,455 58,182 113,637 Hsinchu International Bank 33,333 - 33,333 Industrial Bank of Taiwan 18,500 - 18,500 $ 289,995 $ 767,432 $ 1,057,427 a. Syndicated loan - Industrial Bank of Taiwan, etc.: On August 15, 2008, the Corporation obtained an unsecured loan of $900,000 thousand from a banking
syndicate comprising the Industrial Bank of Taiwan, Chinatrust Commercial Bank, Taipei Fubon Commercial Bank, Chang Hwa Bank, Hua Nan Bank, Mega International Commercial Bank and Cathay United Bank. Related information as of December 31, 2008 is as follows:
Credit LineAmount to
be Paid Interest
Rate Repayment Unsecured loan - type A $ 400,000 $ 400,000 2.67% Interest and principal are repayable
semiannually from February 2009 to August 2011
Unsecured loan - type B 500,000 500,000 2.82% Interest and principal amount are due in August 2011
Under the loan agreement, certain financial ratios based on audited annual consolidated financial
statements of the Corporation must be in accordance with the criteria stated in the agreements. b. Taiwan Cooperative Bank: Secured loan; repayable monthly from June 2004 to September 2014;
annual interest - 2.93% in 2008 and 3.24%-3.58% in 2007; c. China Development Industrial Bank: Secured loan; repayable quarterly from December 2006 to April
2012; under the loan agreement, certain financial ratios based on audited annual consolidated financial statements of the Corporation must be in accordance with the criteria stated in the agreements; annual interest - 2.38%-3.43% in 2008 and 3.43%-3.55% in 2007;
d. Chinatrust Commercial Bank: Unsecured loan; repayable monthly from March 2005 to February 2009;
fully repaid in 2008; annual interest - 2.50%-2.89% in 2007;

- 69 -
e. E.Sun Bank: Unsecured loan; repayable quarterly from May 2006 to May 2010; fully repaid in 2008;
annual interest - 2.96%-3.10% in 2007; f. Hsinchu International Bank (HIB): Loan contract with HIB turned over to Standard Chartered Bank
(Taiwan) (SCB) when HIB merged with SCB in July 2007; unsecured loan; repayable quarterly from February 2006 to November 2008; annual interest - 2.70% in 2007;
g. Industrial Bank of Taiwan: Unsecured loan; repayable quarterly from June 2006 to December 2008;
fully repaid in June 2008; annual interest - 3.22% in 2007. 14. STOCKHOLDERS’ EQUITY As of December 31, 2008, the Corporation’s Article of Incorporation stipulated that the Corporation’s total
authorized capital should be $1,400,000 thousand, or a total of 140,000 thousand shares with NT$10.00 par value. The Corporation’s board of directors is entitled either to issue these shares in batches or to make a one-time issuance of all the shares. Of the authorized capital, $300,000 thousand, or a total of 30,000 thousand shares, should be reserved for an employee stock option plan, preferred stock with warrant, and bonds with warrants attached. As of December 31, 2008, the Corporation’s paid-in capital was $1,070,566 thousand.
The Corporation’s Articles of Incorporation provide that legal reserve should be set aside at 10% of annual
net income, less any accumulated deficit. The remainder of this income should be appropriated as follows: a. Remuneration of 3% (maximum) to directors and supervisors; b. Bonuses of 1% to 25% to employees; and c. The remainder, together with the unappropriated earnings of prior years, to be distributed to the
stockholders. These appropriations should be approved by the stockholders in, and given effect to in the financial
statements of, the year following the year of earnings generation. The Corporation is currently in a growth phase. To meet the requirements for present and future
operational expansion and to satisfy the stockholders’ need for cash inflow, the Corporation’s dividend policy states that dividends will be in the form of shares and/or cash, with cash dividends to be at least 10% of total dividends.
Based on past experience, the bonus to the Corporation’s employees and the remuneration to directors and
supervisors for 2008 was calculated at 14% and 3%, respectively, of net income net of the 10% deduction for legal reserve.
If a bonus estimate differs from the amount approved by the stockholders, the difference is recorded in the
year of stockholders’ resolution as a change in accounting estimate. If bonus shares are resolved to be distributed to employees, the number of shares is determined by dividing
the amount of bonus by the closing price (after considering the effect of cash and stock dividends) of the shares of the day preceding the stockholders’ meeting.
Under the relevant law, capital surplus resulting from long-term equity investments should not be used for
any purpose. In addition, other components of capital surplus may be used only for transfer to capital or for offsetting deficit. This transfer should be made within certain limits.

- 70 -
Under the Company Law, legal reserve should be appropriated until the accumulated reserve equals the Corporation’s authorized capital. The reserve may only be used to offset deficit. When the reserve reaches 50% of the Corporation’s paid-in capital, up to 50% of the reserve may be transferred to capital.
As of February 20, 2009, the date of the accompanying independent auditors’ report, the board of directors
had not yet approved the proposal on the distribution of the 2008 earnings. Information on the appropriation of earnings, including the bonus to employees and remuneration to directors and supervisors, can be accessed through the Market Observation Post System on the Web site of the Taiwan Stock Exchange Corporation.
The appropriations from the 2007 and 2006 earnings were approved by the stockholders on June 13, 2008
and June 15, 2007, respectively, as follows: Appropriation of
Earnings and Capitalization of
Capital Surplus Earnings Per Share 2007 2006 2007 2006 Legal reserve $ 51,485 $ 36,499 Stock dividends 113,989 88,710 $1.194 $1.146 Cash dividends 265,973 206,990 2.786 2.674 Employee bonus 69,505 23,560 Remuneration to directors and supervisors (cash) 13,901 9,874 The actual distribution of the 2007 earnings as bonuses to employees and remuneration to directors and
supervisors was as follows: Actual Proposed Distribution Distribution Approved by
the Approved by the Board of
Stockholders Directors Difference a. Appropriation 1) Employee bonus: Cash $69,505 $69,505 - 2) Employee bonus: Stock a) Shares - b) Amounts - c) Percentage of outstanding shares - 3) Directors and supervisors’ remuneration 13,901 13,901 - b. Earnings per share (New Taiwan dollars) 1) Basic earnings per share $5.52 $5.52 - 2) Imputed earnings per share $4.63 $4.63 -

- 71 -
15. COMPENSATORY STOCK OPTIONS
Effective Date Resolution Date
Thousand Units
Exercise Price (in New Taiwan Dollars)
2006.03.29 2006.04.07 5,520 $32.43 (original price - $57.20) 2007.12.13 2007.12.18 5,000 56.60 (original price - $68.20)
10,520 Each option represented 10 common shares of the Corporation. The term of these options is five years.
These options may be exercised after two years from the grant date. Under the terms of the stock option plan, if the number of the Corporation’s common shares changes, the exercise price will be revised.
The Corporation’s stock options in 2008 and 2007 are summarized as follows: 2008 2007.12.18 Issued 2006.04.07 Issued Weighted-average Weighted-average Thousand Exercise Price Thousand Exercise Price Units (in Dollars) Units (in Dollars) Outstanding units, beginning of year 5,000 $ 68.20 5,110 $ 39.09 Granted units - - - - Exercised units - - (189 ) 32.43 Canceled units (744 ) 59.31 (442 ) 37.13 Outstanding units, end of year 4,256 56.60 4,479 32.43 Exercisable units, end of year - - 2,177 32.43 2007 2007.12.18 Issued 2006.04.07 Issued Weighted-average Weighted-average Thousand Exercise Price Thousand Exercise Price Units (in Dollars) Units (in Dollars) Outstanding units, beginning of year - $ - 5,240 $ 46.76 Granted units 5,000 68.20 - - Exercised units - - - - Canceled units - - (130 ) 43.22 Outstanding units, end of year 5,000 68.20 5,110 39.09 Exercisable units, end of year - - - -

- 72 -
Stock options outstanding as of December 31, 2008 are summarized as follows: Exercisable Stock Outstanding Stock Options as of Options as of December 31, 2008 December 31, 2008 Weighted- Weighted- Weighted- average average average Remaining Exercise Exercise Thousand Contractual Price Thousand Price Exercise Price Units Life(Years) (in Dollars) Units (in Dollars) $ 56.60 4,256 2.26 years $ 56.60 - $ - 32.43 4,479 3.96 years 32.43 2,177 32.43 No compensation cost under the intrinsic value method was recognized for 2008 and 2007.
Had the Corporation used the fair value method, the pro forma net income and basic and diluted earnings per share (EPS) of the Corporation in 2008 and 2007 would have been as follows:
2008 2007 New Taiwan Dollars New Taiwan Dollars Net income Actual $ 258,515 thousand $ 514,853 thousand Pro forma $ 221,956 thousand $ 490,729 thousand EPS - basic Actual $ 2.42 $ 5.52 Pro forma $2.08 $5.26 EPS - diluted Actual $2.38 $5.25 Pro forma $2.04 $5.00 Had the Black-Scholes pricing model been used to calculate compensation cost using the fair value method,
the assumptions would have been as follows: 2007.12.18 Issued 2006.04.07 Issued Assumptions Expected dividend yield - - Risk-free interest rate 2.43% 1.82% Expected duration 3.875 years 4 years Expected volatility 44.35% 30.25% Weighted-average fair value (in dollars) $25.17 $15.22

- 73 -
16. EARNINGS PER SHARE The numerators and denominators used in calculating earnings per share (EPS) were as follows: Weighted- average Earnings Per Amounts (Numerator) Number of Share (Dollars) Income Outstanding Income Before Shares Before Income
Tax Net
Income (Denominator;
Thousands) Income
Tax Net
Income 2008 Basic EPS Net income of common stockholders $ 271,683 $ 258,515 106,907 $ 2.54 $ 2.42 Effect of dilutive potential common stock Compensatory stock options - - 984 Bonus to employees - - 826 Diluted EPS Income available to common stockholders (including effect of dilutive potential common stock) $ 271,683 $ 258,515 108,717 $ 2.50 $ 2.38 2007 Basic EPS Net income of common stockholders $ 578,133 $ 514,853 104,662 $ 5.52 $ 4.92 Effect of dilutive potential common stock Unsecured convertible bonds in Taiwan 1,594 1,195 2,206 Compensatory stock options - - 2,834 Diluted EPS Income available to common stockholders (including effect of dilutive potential common stock) $ 579,727 $ 516,048 109,702 $ 5.28 $ 4.70 The Accounting Research and Development Foundation issued Interpretation 2007-052, which requires
companies to recognize bonuses paid to employees, directors and supervisors as compensation expenses beginning January 1, 2008. These bonuses were previously recorded as appropriations from earnings. If the bonus to employees will be in the form of cash or shares, the Corporation should presume that the entire amount of the bonus will be settled in shares and the resulting potential shares should be included in the weighted average number of shares outstanding used in the calculation of diluted EPS if the shares have a dilutive effect. The number of shares is estimated by dividing the entire amount of the bonus by the closing price of the shares at the balance sheet date. The dilutive effect of the potential shares needs to be included in the calculation of diluted EPS until the stockholders resolve the number of shares to be distributed to employees at their meeting in the following year.
The average number of shares outstanding used for EPS calculation was adjusted retroactively for the
issuance of stock dividends. Because of this adjustment, the basic net income per share before and after income tax in 2007 decreased from NT$6.20 to NT$5.52 and from NT$5.52 to NT$4.92, respectively, and the diluted net income per share before and after income tax in 2007 decreased from NT$5.90 to NT$5.28 and from NT$5.25 to NT$4.70, respectively.

- 74 -
17. INCOME TAX a. The reconciliation of income tax on pretax accounting income at statutory rate and income tax expense -
current was as follows: 2008 2007 Tax on pretax accounting income at statutory rate (25%) $ 67,911 $ 144,523 Adjusted for: Tax-free income (45,619 ) (53,256 ) Permanent differences 7,870 402 Temporary differences 4,828 14,710 Investment tax credit (3,306 ) (47,952 ) Income tax expense - current $ 31,684 $ 58,427 Income tax expense - current minus the prepaid tax as of December 31, 2008 and 2007 was shown
under income tax payable. b. Income tax expense consisted of the following: 2008 2007 Income tax expense - current $ 31,684 $ 58,427 Prior year’s income tax adjustments 2,070 1,387 Deferred income tax (20,586 ) 3,466 Income tax expense $ 13,168 $ 63,280 c. Deferred income tax assets (liabilities) consisted of the following: December 31 2008 2007 Current Investment tax credits $ 32,448 $ 82,542 Allowance for inventory losses 7,903 4,658 Deferred unrealized gain, net 7,002 6,319 Provision for doubtful accounts 64 - Unrealized exchange losses (gains) (2,020 ) 432 Gain on valuation of financial assets, net (94 ) (447 ) Net deferred income tax assets $ 45,303 $ 93,504 Noncurrent Investment tax credits $ 65,699 $ - Deferred unrealized gain 21,337 21,064 Equity in net income of investees (41,356 ) (44,589 ) Accrued pension cost (659 ) (241 ) Net deferred income tax assets (liabilities) $ 45,021 $ (23,766 )

- 75 -
As of December 31, 2008, the unused investment tax credits were as follows: Total Tax Unused Tax Year of Item Credits Credits Expiration Machinery and equipment $ 58,099 $ 35,786 2010 Machinery and equipment 28,659 28,659 2011 Machinery and equipment 5,393 5,393 2012 92,151 69,838 Research and development 9,666 9,666 2010 Research and development 9,331 9,331 2011 Research and development 8,424 8,424 2012 27,421 27,421 Training 100 100 2010 Training 636 636 2011 Training 152 152 2012 888 888 $ 120,460 $ 98,147 Under Article 5 of the “Regulations Governing the Application of Profit-seeking Enterprise Income Tax
Exemption to Capital Increase of the Manufacturing Industry and the Technological Services Industry,” which took effect on March 20, 2003, for the Corporation’s investment plan of expanding its capacity to produce micro drills and micro routers, the Corporation is exempted for five years from the profit-seeking enterprise income tax on the increased income as a result of this expansion. The exemption period is from January 1, 2005 to December 31, 2009. The calculation of the tax-exempt income is based on the “Guidelines Governing the Calculation of the Profit-seeking Enterprise’s Income Tax Exemption on the Capital Increase of the Manufacturing Industry and the Technological Services Industry.”
Income tax returns through 2006 had been examined and cleared by the tax authorities. d. Information on the Imputation Income Tax System is as follows: December 31 2008 2007 Balances of the imputation credit account $ 154 $ 1,909 The estimated and actual ratios of imputation tax credits to undistributed earnings as of December 31,
2008 and 2007 were 12.26% and 12.11%. The credit available for allocation to the stockholders is calculated on the basis of the balance of ICA on
the date of dividend distribution. Thus, the estimated rate as of December 31, 2008 may differ from the actual rate depending on the ICA balance on the dividend distribution date.
e. Under the Integrated Income Tax System, which took effect on January 1, 1998, resident stockholders
are allowed a tax credit for the income tax paid by the Corporation on earnings generated since 1998. An imputation credit account is maintained by the Corporation for such income tax and the tax credit allocated to each stockholder.
f. The Corporation’s earnings as of December 31, 2008 and 2007 did not include earnings generated until
1997.

- 76 -
18. PENSION PLAN Pension expense recognized under the defined contribution plan required under the Labor Pension Act (the
“Act”) was $8,550 thousand in 2008 and $7,981 thousand in 2007. Accrued pension liabilities under the defined contribution plan, which were accounted for as accrued expenses, amounted to $579 thousand and $1,422 thousand as of December 31, 2008 and 2007, respectively.
Under the Labor Standards Law, which was promulgated earlier than the Act, the Corporation set up a
defined benefit plan, which provides benefits based on length of service and average basic salaries or wages of the last six months before retirement. Before September 1, 2007, the Corporation made monthly contributions to a retirement fund equal to 2% of salaries and wages. The fund is administered by the employees’ pension plan committee and deposited in the committee’s name in the Bank of Taiwan. However, the Corporation decided to stop contributing to the fund because the fund had reached an amount enough to meet the Corporation’s pension obligations. The registration with the Taipei County Government of the cessation of pension fund contributions was completed on September 1, 2007.
Other information on the defined benefit pension plan is as follows: a. Pension cost components 2008 2007 Service cost $ - $ 83 Interest cost 346 305 Expected return on plan assets (314 ) (281 ) Amortization 154 (83 ) Curtailment gain (1,856 ) - Net pension cost $ (1,670 ) $ 24 b. Reconciliation of the fund status of the plan and accrued pension cost December 31 2008 2007 Benefit obligation Vested benefit obligation $ 145 $ 188 Non-vested benefit obligation 8,495 7,989 Accumulated benefit obligation 8,640 8,177 Additional benefits based on future salaries 2,094 1,735 Projected benefit obligation 10,734 9,912 Fair value of plan assets (13,027 ) (12,576 ) Funded status (2,293 ) (2,664 ) Unrecognized net transition obligation (198 ) (480 ) Unrecognized net benefit 198 2,521 Prepaid pension (classified under other assets - miscellaneous) $ (2,293 ) $ (623 ) c. Vested benefit $ 156 $ 208 d. Actuarial assumptions Discount rate 2.5% 3.5% Future salary increase rate 1.0% 1.0% Expected rate of return on plan assets 2.5% 2.5%

- 77 -
e. Contributions and payments 2008 2007 Contributions $ - $ 1,663 Payments $ - $ - 19. PERSONNEL, DEPRECIATION AND AMORTIZATION EXPENSES 2008 Operating Operating Cost Expense Total Personnel expenses Payroll $ 158,487 $ 100,949 $ 259,436 Labor and health insurance 10,066 3,185 13,251 Pension 6,267 613 6,880 $ 174,820 $ 104,747 $ 279,567 Depreciation $ 176,096 $ 10,177 $ 186,273 Amortization $ 883 $ 1,477 $ 2,360 2007 Operating Operating Cost Expense Total Personnel expenses Payroll $ 152,096 $ 59,897 $ 211,993 Labor and health insurance 9,502 2,826 12,328 Pension 5,956 2,049 8,005 $ 167,554 $ 64,772 $ 232,326 Depreciation $ 147,974 $ 7,837 $ 155,811 Amortization $ 1,075 $ 1,991 $ 3,066 20. RELATED-PARTY TRANSACTIONS a. The Corporation’s related parties were as follows: Related Party Relationship with the Corporation China Development Industrial Bank Director and stockholder Warpspeed Corporation (B.V.I.) Subsidiary Topoint Technology Co., Ltd. (B.V.I.) Subsidiary Topoint Japan Co., Ltd. Subsidiary Shanghai Topoint Precision Technology Co., Ltd. Subsidiary of Topoint Technology Co., Ltd. (B.V.I.)

- 78 -
b. Significant transactions with the related parties were as follows: 2008 2007 Amount % Amount % For the year Sales Warpspeed Corporation (B.V.I.) $ 315,993 28 $ 440,139 28 Topoint Japan Co., Ltd. - - 17 - $ 315,993 28 $ 440,156 28 Purchase of materials Warpspeed Corporation (B.V.I.) $ 63 - $ 48,142 9 Interest expense China Development Industrial Bank $ 10,360 23 $ 6,472 22 At end of year Notes and accounts receivable - related parties Warpspeed Corporation (B.V.I.) Accounts receivable $ 62,620 55 $ 190,531 68 Receivables on equipment 44,352 39 85,226 31 Payment on behalf of others 7,462 6 2,626 1 114,434 100 278,383 100 Topoint Japan Co., Ltd. - - 17 - $ 114,434 100 $ 278,400 100 Interest payable (accrued expenses) China Development Industrial Bank $ 103 - $ 154 - Notes and accounts payable - related parties Warpspeed Corporation (B.V.I.) $ - - $ 1,030 100 Current portion of long-term loans China Development Industrial Bank $ 83,780 24 $ 66,633 23 Long-term loans China Development Industrial Bank $ 176,472 14 $ 260,252 34 In 2008 and 2007, the Corporation sold some of its property, plant and equipment to Warpspeed
Corporation (B.V.I.) at their net book values of $121,889 thousand and $198,791 thousand, respectively, with selling prices of $139,506 thousand and $272,355 thousand, respectively. The gains on these sales of $17,617 thousand in 2008 and $73,564 thousand in 2007 will be amortized over the service lives of the property, plant and equipment sold.

- 79 -
The overdue receivables from Warpspeed Corporation (B.V.I.), shown as follows, were regarded as interest-free financing:
2008 2007
Name
Maximum Balance for the Period
Ending Balance
Maximum Balance for the Period
Ending Balance
Warpspeed Corporation (B.V.I.) $ - $ - $ 12,920 $ - Except for the selling price, purchase cost and other payment terms of the transactions with Warpspeed
Corporation (B.V.I.) and Topoint Japan Co., Ltd., the terms and conditions of related-party transactions were similar to those for third parties.
c. Compensation of directors, supervisors and management personnel: Year Ended December 31 2008 2007 Salaries $ 13,383 $ 21,347 Incentives 10,448 9,187 Bonus 3,000 12,400 $ 26,831 $ 42,934 The compensation of directors, supervisors and management personnel for the year ended December 31,
2007 included the bonuses appropriated from earnings for 2007, which were approved by stockholders in their annual meeting held in 2008.
21. ASSETS PLEDGED OR MORTGAGED The following assets had been pledged or mortgaged as collaterals for short-term and long-term bank loans: December 31 2008 2007 Net property, plant and equipment $ 1,422,910 $ 1,389,098 Certificates of deposits - restricted 53,864 48,300 $ 1,476,774 $ 1,437,398 Of the above pledged certificates of deposits, collaterals amounting to $53,864 thousand and $24,932 were
used to guarantee loans of Shanghai Topoint Precision Technology Co., Ltd. in 2008 and 2007, respectively. 22. SIGNIFICANT COMMITMENTS AS OF DECEMBER 31, 2008 a. Unused letters of credit amounted to about $4,872 thousand. b. The Corporation guaranteed bank loans of $542,501 thousand of Shanghai Topoint Precision
Technology Co., Ltd. and $98,400 thousand of Topoint Technology Co., Ltd. (B.V.I.)

- 80 -
23. OTHERS On February 17, 2006, the Corporation issued five-year unsecured zero coupon domestic convertible bonds
with an aggregate face value of $400,000 thousand, each with a face value of $100 thousand. The Corporation separated the bond conversion option from the put option in accordance with the Statement of Financial Accounting Standards No. 36 - “Disclosure and Presentation of Financial Instruments” and recognized the equity and liability components accordingly. The initially recognized amount of the liability was $364,515 thousand, with an effective rate of 2.32%. This amount was evaluated at fair value on February 17, 2006, including the amortized transaction costs of $4,614 thousand. The equity component amounted to $30,485 thousand, which was included in capital surplus - bond conversion option. This amount was at the initial total fair value of the bonds minus the fair value of the liability account, including the amortized transaction cost of $386 thousand.
As of December 31, 2007, all bondholders had exercised their put options; the liability and equity
components had been converted into common shares and paid-in capital in excess of par value. 24. FINANCIAL INSTRUMENTS a. Fair value of financial instruments: December 31 2008 2007 Carrying Carrying Amount Fair Value Amount Fair Value Nonderivative financial instruments Assets: Cash $ 428,579 $ 428,579 $ 96,074 $ 96,074 Available-for-sale financial assets 18,251 18,251 8,030 8,030 Notes receivable 10,753 10,753 23,083 23,083 Accounts receivable 203,918 203,918 283,348 283,348 Notes and accounts receivable - related parties 114,434 114,434 278,400 278,400 Other financial assets 1,383 1,383 7,351 7,351 Certificates of deposits - restricted 53,864 53,864 48,300 48,300 Long-term equity investments accounted for by the equity method 1,353,866 1,354,356 1,078,436 1,079,112 Refundable deposits 5,282 5,282 14,774 14,774 Liabilities: Short-term loans - - 50,000 50,000 Commercial paper, net - - 29,982 29,982 Notes payable 10,733 10,733 51,606 51,606 Accounts payable 22,039 22,039 30,805 30,805 Notes and accounts payable - related parties - - 1,030 1,030 Income tax payable 31,530 31,530 58,366 58,366 Accrued expenses 123,402 123,402 127,198 127,198 Balance payable - machinery and equipment 2,712 2,712 176,396 176,396 Current portion of long-term loans 351,640 351,640 289,995 289,995 Long-term loans 1,263,211 1,263,211 767,432 767,432
(Continued)

- 81 -
December 31 2008 2007 Carrying Carrying Amount Fair Value Amount Fair Value Financial derivatives are classified in accordance with the geographic location of the trading transaction In Taiwan Financial assets $ 423 $ 423 $ 1,790 $ 1,790 Financial liabilities 47 47 - -
(Concluded) b. The Corporation uses the following methods and assumptions to estimate the fair values of its financial
instruments: 1) For financial instruments, except those mentioned in (2) and (3) below, the carrying values reported
in the balance sheet approximate their fair values because of their short maturities. 2) The fair values of financial assets at fair value through profit or loss and available-for-sale financial
assets are based on quoted prices. The fair value of long-term investments is based on the net asset value of the investment.
3) The fair value of long-term loans is estimated using the present value of future cash flows
discounted by the interest rates the Corporation may obtain for similar loans. c. The fair values of financial instruments were as follows:
Amount Based on Quoted
Market Price Amount Determined Using Valuation Techniques
December 31,
2008 December 31,
2007 December 31,
2008 December 31,
2007 Assets: Financial assets at fair value through profit or loss $ - $ - $ 423 $ 1,790 Available-for-sale financial assets 18,251 8,030 - -Liabilities Financial liabilities at fair value through profit or loss - - 47 -
d. In 2008 and 2007, there was a gain of $376 thousand and $1,790 thousand on financial assets at fair
value through profit or loss because of the change in fair value estimated by using a valuation technique. e. Financial risks 1) Market risk The Corporation’s available-for-sale assets were publicly traded securities, with fair values that are
affected by changes in market prices. Since the Corporation carefully chooses its investments, there is no significant market risk. In addition, the Corporation uses forward exchange contracts to offset the exchange rate fluctuations of net assets, net liabilities or firm commitments. Thus, no significant market risk is anticipated.

- 82 -
2) Credit risk The Corporation is exposed to credit risk on the default by counter-parties to forward contracts.
Contracts with positive fair values at the balance sheet date are evaluated for credit risk. As a result, no material losses resulting from counter-party defaults are anticipated.
3) Liquidity risk The Corporation’s available-for-sale financial instruments are publicly traded in an active market
and can be sold in the market at their fair values. In addition, the Corporation has enough operating capital to meet cash demand. Thus, no significant demand for extra cash is expected.
25. ADDITIONAL DISCLOSURES Following are the additional disclosures required by the Securities and Futures Bureau, Financial
Supervisory Commission for the Corporation and its investees: a. Financing provided: Table 1 (attached) b. Endorsement/guarantee provided: Table 2 (attached) c. Marketable securities held: Table 3 (attached) d. Marketable securities acquired and disposed of at costs or prices of at least NT$100 million or 20% of
the paid-in capital: None e. Acquisition of individual real estates at costs of at least NT$100 million or 20% of the paid-in capital:
None f. Disposal of individual real estates at prices of at least NT$100 million or 20% of the paid-in capital:
None g. Total purchase from or sale to related parties amounting to at least NT$100 million or 20% of the
paid-in capital: Table 4 (attached) h. Receivables from related parties amounting to at least NT$100 million or 20% of the paid-in capital:
Table 5 (attached) i. Names, locations, and related information of investees on which the Corporation exercises significant
influence: Table 6 (attached) j. Derivative financial transactions: 1) The Corporation held or issued derivative financial instruments in 2008 and 2007: Notes 5 and 24. 2) Shanghai Topoint Precision Technology Co., Ltd. (STPT) derivative contracts in 2008 and 2007 to
manage exposures due to exchange rate fluctuations. STPT’s hedge strategy was to use instruments with negative correlation to the values of the hedged items.

- 83 -
STPT’s forward exchange contracts as of December 31, 2008 were as follows:
Currency Maturity Due Contract Amount
(in Thousands) December 31, 2008 Forward exchange contracts - buy US/CHF 2009.01.15-2009.04.03 US$4,600/CHF4,808 Net gains on forward exchange contracts held for trading were $1,671 thousand in 2008. STPT had no forward exchange contracts as of December 31, 2007. a) Market risk STPT uses forward exchange contracts to hedge against adverse exchange rate fluctuations of
net assets, net liabilities or firm commitments. Thus, no significant market risk is anticipated. b) Credit risk STPT is exposed to credit risk on the default by counter-parties and third parties to forward
contracts. Contracts with positive fair values at the balance sheet date are evaluated for credit risk. As a result, no material losses resulting from counter-party defaults are anticipated.
c) Liquidity risk STPT uses forward exchange contracts to hedge against adverse exchange rate fluctuations of
net assets, net liabilities or firm commitments. In addition, it has enough operating capital to meet cash demand. Thus, no significant demand for extra cash is expected.
k. Investment in Mainland China
1) Name of the investees in Mainland China, main businesses and products, paid-in capital, method of investment, information on inflow or outflow of capital, percentage of ownership, investment income or loss, ending balance of investment, dividends remitted by the investee, and the limit of investment in Mainland China: Table 7 (attached)
2) Significant direct or indirect transactions with the investee company, prices, payment terms, and
unrealized gain or loss: a) Amount and percentage of sales; the balance and percentage of related accounts payables:
None b) Amount and percentage of purchase; the balance and percentage of related accounts receivables:
Table 8 (attached) c) Gain (loss) on and amounts of assets: Table 8 (attached) d) The balance and purpose of note endorsement/guarantee provided or collateral security pledged:
Table 2 (attached) e) Maximum balance for the period, ending balance, interest rate and amount of financing
provision: Table 1 (attached) f) Other transactions which have significant influence over current year’s gain or loss or financial
status: None

- 84 -
26. SEGMENT INFORMATION a. Industry segment information: The Corporation operates in a single industry: The manufacture and
sale of printed circuit boards (PCBs), numerically controlled drilling machines for PCBs and peripheral equipment used in PCB manufacture.
b. Geographic information: The Corporation has no foreign operations. c. Export sales Geographic Area 2008 2007 Asia $ 483,437 $ 714,614 Europe 13,126 5,235 $ 496,563 $ 719,849 d. Major customers 2008 2007 Percentage Percentage of of Amount Net Sales Amount Net Sales Master dealer - A $ 315,993 28 $ 440,139 28 Master dealer - B 109,652 10 85,660 6 $ 425,645 38 $ 525,799 34

- 85 -
TABLE 1 TOPOINT TECHNOLOGY CO., LTD. AND INVESTEES FINANCING PROVIDED YEAR ENDED DECEMBER 31, 2008 (In Thousands of New Taiwan Dollars and U.S. Dollars, Unless Stated Otherwise)
Collateral
No. Financing Company Name Counter-Party
Financial Statement Account
Maximum Balance for the Period
Ending Balance Interest Rate Financing
Reasons Transaction
Amount
Reason for Short-term Financing
Allowance for Bad Debt Item Value
Financing Limit for
Each Borrowing Company (Note 1)
Financing Company’s Financing Amount Limits
(Note 2)
1 Topoint Technology Co., Ltd. (B.V.I.)
Shanghai Topoint Precision Technology Co., Ltd.
Other receivables US$3,000 US$3,000 4.72% Short-term financing
$ - Operating turnover
$ - - $ - $495,792 $991,584
Note 1: The maximum financing allowed for a single party is limited to 20% of the net value of Topoint Technology Co., Ltd. as of December 31, 2008. Note 2: The maximum total financing provided is limited to 40% of the net value of Topoint Technology Co., Ltd. as of December 31, 2008.

- 86 -
TABLE 2 TOPOINT TECHNOLOGY CO., LTD. AND INVESTEES ENDORSEMENT/ GUARANTEE PROVIDED YEAR ENDED DECEMBER 31, 2008 (In Thousands of New Taiwan Dollars, U.S. Dollars and Swiss Franc, Unless Stated Otherwise)
Counter-party
No. Endorsement/ Guarantee Provider Name
Nature of Relationship
Limits on Each Counter-party's Endorsement/
Guarantee Amounts (Note 2)
Maximum Balance for the Period Ending Balance
Value of Collaterals Property, Plant, or
Equipment (Note 3)
Ratio of Accumulated Amount of Collateral to Net Equity of the
Latest Financial Statement
Maximum Collateral/Guarantee Amounts Allowable
(Note 2)
0 Topoint Technology Co.,
Ltd. (the “Corporation”) Shanghai Topoint Precision
Technology Co., Ltd. (Note 1) $ 743,688 $ 674,294
(US$20,960) $ 542,501
(US$16,540) $ 53,864 22% $ 1,239,480
0 Topoint Technology Co.,
Ltd. (the “Corporation”) Topoint Technology Co., Ltd.
(B.V.I.) (Note 1) 743,688 98,400
(US$3,000) 98,400
(US$3,000) - 4% 1,239,480
Note 1: Subsidiary. Note 2: The maximum total endorsement/guarantee provided is limited to 50% of the net value of the Corporation as of December 31, 2008. The maximum endorsement/guarantee provided for a single partly is limited to 30% of the net value of
the Corporation as of December 31, 2008. Note 3: The collaterals provided by the Corporation are $6,886 in demand deposits and $46,978 in time deposits.

- 87 -
TABLE 3 TOPOINT TECHNOLOGY CO., LTD. AND INVESTEES MARKETABLE SECURITIES HELD DECEMBER 31, 2008 (In Thousands of New Taiwan Dollars and U.S. Dollars, Unless Stated Otherwise)
December 31, 2008 Holding Company Name Marketable Securities Type and Name
Relationship with the Holding
Company Financial Statement Account Shares
(Thousands) Carrying Value Percentage of Ownership
Market Value/ Net Asset Value Note
Topoint Technology Co., Ltd. Mutual funds IBT Ta Chong Bond Fund - Available-for-sale financial assets 742,291 $ 10,000
(Note 1) - $ 10,000
Stock Key Ware Electronics Co., Ltd. - Available-for-sale financial assets 4,275,000 39,827
(Note 1) 3 8,251
Topoint Technology Co., Ltd. (B.V.I.) Subsidiary Long-term equity Investments accounted for by the equity method
3,130 1,351,716 100 1,352,206 Notes 2 and 3
Warpspeed Corporation (B.V.I.) Subsidiary Long-term equity investments accounted for by the equity method
50,000 1,405
100 1,405 Note 2
Topoint Japan Co., Ltd. Subsidiary Long-term equity investments accounted for by the equity method
312 745 (Note 4)
52 745 Note 4
Topoint Technology Co., Ltd. (B.V.I.) Share certificates Shanghai Topoint Precision Technology Co., Ltd. Subsidiary Long-term equity investments accounted
for by the equity method - US$ 40,567 100 US$ 40,567 Note 2
Note 1: The carrying value was the original cost, which was not marked to market. Note 2: Based on audited financial statements. Note 3: The difference between carrying value and net asset value was an unrealized profit of $490 thousand from upstream intercompany transactions. Note 4: Investment gains (losses) recognized were calculated from the unaudited financial statements.

- 88 -
TABLE 4 TOPOINT TECHNOLOGY CO., LTD. AND INVESTEES TOTAL PURCHASE FROM OR SALE TO RELATED PARTIES AMOUNTING TO AT LEAST NT$100 MILLION OR 20% OF THE CAPITAL YEAR ENDED DECEMBER 31, 2008 (In Thousands of New Taiwan Dollars and U.S. Dollars, Unless Stated Otherwise)
Transaction Details Abnormal Transaction Note/Account Payable or Receivable Company Name
(Note 2) Related Party Nature of Relationship Purchase/ Sale Amount % to Total
(Note 2) Payment Terms Unit Price Payment Terms Ending Balance(Note 1)
% to Total(Note 2)
Topoint Technology Co., Ltd. (the “Corporation”)
Warpspeed Corporation (B.V.I.)
Subsidiary Sale $ 315,993 28 Based on mutual agreement Based on mutual agreement
Based on mutual agreement
$ 62,620 19
Warpspeed Corporation (B.V.I.)
Topoint Technology Co., Ltd. (the “Corporation”)
Parent company Purchase 315,993 100 Based on mutual agreement Based on mutual agreement
Based on mutual agreement
(62,620 ) 55
Warpspeed Corporation (B.V.I.)
Shanghai Topoint Precision Technology Co., Ltd.
Subsidiary of Topoint Technology Co., Ltd. (B.V.I.)
Sale 315,993 100 Based on mutual agreement Based on mutual agreement
Based on mutual agreement
(62,620 ) 55
Shanghai Topoint Precision Technology Co., Ltd.
Warpspeed Corporation (B.V.I.)
Subsidiary of Topoint Technology Co., Ltd. (B.V.I.)
Purchase 315,993 36 Based on mutual agreement Based on mutual agreement
Based on mutual agreement
(62,620 ) 23
Note 1: The amounts refer to the receivables and payables on sales and purchases. Note 2: The rate is calculated in accordance with individual financial statements of the company.

- 89 -
TABLE 5 TOPOINT TECHNOLOGY CO., LTD. AND INVESTEES RECEIVABLES FROM RELATED PARTIES AMOUNTING TO AT LEAST NT$100 MILLION OR 20% OF THE PAID-IN CAPITAL DECEMBER 31, 2008 (In Thousands of New Taiwan Dollars and U.S. Dollars, Unless Stated Otherwise)
Accounts Receivable - Related Parties Overdue Company Name Related Party Nature of Relationship Account Ending Balance Turnover
Rate Amount Actions Taken
Amounts Collected in Subsequent
Period
Allowance for Bad Debts
Topoint Technology Co., Warpspeed Corporation (B.V.I.) Subsidiary Accounts receivable $ 62,620 2.50 $ - - $ 57,559 $ - Ltd. Receivables on
equipment 44,352 - -
Payment on behalf of others
7,462 - 3,471
Warpspeed Corporation Shanghai Topoint Precision Subsidiary of Topoint Accounts receivable 62,620 2.50 - - 57,559 - (B.V.I.) Technology Co., Ltd. Technology Co., Ltd. (B.V.I.) Receivables on
equipment 44,352 - -
Payment on behalf of others
7,462 - 3,471

- 90 -
TABLE 6 TOPOINT TECHNOLOGY CO., LTD. AND INVESTEES NAMES, LOCATIONS, AND OTHER INFORMATION OF INVESTEES ON WHICH THE COMPANY EXERCISES SIGNIFICANT INFLUENCE YEAR ENDED DECEMBER 31, 2008 (In Thousands of New Taiwan Dollars and U.S. Dollars, Unless Stated Otherwise)
Investment Amount Balance as of December 31, 2008 Investor Company Investee Company Location Main Businesses and Products Dec. 31, 2008 Dec. 31, 2007 Shares Percentage of
Ownership Carrying
Value (Note 2)
Net Income (Loss) of the
Investee
Investment Gain (Loss)
(Note 2) Topoint Technology Co., Ltd. Topoint Technology Co., Ltd. (B.V.I.) British Virgin Islands International investment $ 647,032 $ 647,032 3,130 100 $ 1,351,716 $ 177,146 $ 177,332
(Note 1) Warpspeed Corporation (B.V.I.) British Virgin Islands International trade 1,569 1,569 50,000 100 1,405 (28 ) (28 ) Topoint Japan Co., Ltd. Japan Selling electronic components 4,337 4,337 312 52 745 (825 ) (429 ) Topoint Technology Co., Ltd. (B.V.I.) Shanghai Topoint Precision Technology Co., Ltd. Mainland China Manufacturing and selling precision equipment and
measurement facilities 647,032 ( US$ 19,500 )
647,032 ( US$ 19,500 )
- 100 1,330,598 ( US$ 40,567 )
177,161 ( US$ 5,619 )
177,161 ( US$ 5,619 )
Note 1: Investment gain is the investee’s net income of $177,146 thousand minus unrealized profits of $186 thousand from upstream intercompany transactions. Note 2: The investees’ financial statements used as basis for calculating investment gains(losses) recognized had all been audited, except those of Topoint Japan Co., Ltd.

- 91 -
TABLE 7 TOPOINT TECHNOLOGY CO., LTD. AND INVESTEES INVESTMENT IN MAINLAND CHINA YEAR ENDED DECEMBER 31, 2008 (In Thousands of New Taiwan Dollars and U.S. Dollars, Unless Stated Otherwise)
Investment Flows
Investee Company Name
Main Businesses and Products
Total Amount of Paid-in
Capital (Note 1)
Investment Type (e.g., Direct or Indirect)
Accumulated Outflow of Investment
from Taiwan as of
Jan. 1, 2008
Outflow Inflow
Accumulated Outflow of Investment
from Taiwan as of
Dec. 31, 2008
% Ownership of Direct or
Indirect Investment
Investment Gain (Loss)
(Note 2)
Carrying Value as of
Dec. 31, 2008(Note 2)
Accumulated Inward
Remittance of Earnings as of Dec. 31, 2008
Shanghai Topoint Precision
Technology Co., Ltd. Manufacturing and selling
precision equipment and measurement facilities
$ 829,116 ( US$ 25,100 )
Indirect: through an investment company registered in a third region
$ 647,032 ( US$ 19,500 )
$ - $ - $ 647,032 ( US$ 19,500 )
100 $ 177,161 ( US$ 5,619 )
$ 1,330,598 ( US$ 40,567 )
$ -
Accumulated Investment in
Mainland China as of Dec. 31, 2008
Investment Amounts Authorized by Investment
Commission, MOEA(Note 3)
Upper Limit on Investment Net Asset Value × 40%
(Note 4)
$647,032 (US$19,500)
$1,135,349 (US$34,800)
$1,487,376
Note 1: Including the capitalization of retained earnings of US$5,600 of Shanghai Topoint Precision Technology Co., Ltd., in 2007. Note 2: Investment gains (losses) were recognized on the basis of the investee’s financial statements audited by the CPA of the Corporation. Note 3: Investment amounts authorized by Investment Commission, MOEA included the capitalization of retained earnings of US$11,800 thousand. Note 4: According to the Investment Commission under the Ministry of Economic Affairs, the Corporation’s issued capital is between $80,000 thousand and $5,000,000 thousand, and the upper limit on the Corporation’s investment is at the
higher of 60% of the capital or $80,000 thousand.

- 92 -
TABLE 8 TOPOINT TECHNOLOGY CO., LTD. AND INVESTEES SIGNIFICANT TRANSACTIONS WITH THE INVESTEE COMPANY IN MAINLAND CHINA YEAR ENDED DECEMBER 31, 2008 (In Thousands of New Taiwan Dollars and U.S. Dollars, Unless Stated Otherwise)
Note/Accounts Payable or Receivable No. Investor Company Investee Company Transaction Details Amount
% to Total of Sales or
Purchase Deferred Gain Ending Balance % to Total Note
0 Topoint Technology Co., Shanghai Topoint Precision Sales $ 315,993 28 $ 3,865 $ 62,620 19 Note 1 Ltd. (the “Corporation”) Technology Co., Ltd. Sale of property, plant and
equipment 139,506 - 17,617 44,532 14 Note 1
Payment on behalf of others - - - 7,462 2 Notes 1 and 2
Note 1: The Corporation’s transaction with Shanghai Topoint Precision Technology Co., Ltd. was made indirectly through Warpspeed Corporation (B.V.I.). The prices and payment terms were based on mutual agreement. Note 2: The transaction refers to the Corporation’s purchase of new parts, material and supplies for Shanghai Topoint Precision Technology Co., Ltd.

- 93 -
TOPOINT TECHNOLOGY CO., LTD. CONSOLIDATED BALANCE SHEETS DECEMBER 31, 2008 AND 2007 (In Thousands of New Taiwan Dollars, Except Par Value) 2008 2007 2008 2007 ASSETS Amount % Amount % LIABILITIES AND STOCKHOLDERS’ EQUITY Amount % Amount % CURRENT ASSETS CURRENT LIABILITIES
Cash (Note 2 and 4) $ 673,073 12 $ 328,539 7 Short-term loans (Note 12) $ 175,316 3 $ 94,400 2Financial assets at fair value through profit or loss (Notes 2 and 5) 2,193 - 1,790 - Commercial paper, net (Note 13) - - 29,982 1Available-for-sale financial assets (Notes 2 and 6) 18,251 - 8,030 - Financial liabilities at fair value through profit or loss (Notes 2 and Notes receivable (Note 2) 33,392 1 28,820 1 5) 47 - - -Accounts receivable (Notes 2 and 7) 430,574 8 607,751 13 Notes payable 10,733 - 51,606 1Other financial assets(Notes 7) 50,269 1 26,804 1 Accounts payable 72,165 - 90,236 2Inventories, net (Notes 2 and 8) 654,289 12 466,739 10 Income tax payable (Notes 2 and 18) 35,311 1 78,664 2Prepayments 7,891 - 18,712 - Accrued expenses (Notes 2, 19 and 21) 176,283 3 193,179 3Deferred income tax assets (Notes 2 and 18) 47,788 1 93,504 2 Balance payable - machinery and equipment 364,859 7 213,466 4Certificates of deposits - restricted (Note 22) 53,864 1 48,300 1 Long-term loans - current portion (Notes 13, 20 and 21) 547,785 10 356,176 8Other current assets 4 - 104 - Other current liabilities 1,775 - 2,243 -
Total current assets 1,971,588 36 1,629,093 35 Total current liabilities 1,384,274 25 1,109,952 24
LONG-TERM LOANS, NET OF CURRENT PORTION (Notes 14, 21
and 22)
1,642,095 30 1,023,806 22PROPERTY, PLANT AND EQUIPMENT (Notes 2, 9 and 22)
Cost OTHER LIABILITIES Land 75,652 2 75,652 2 Guarantee deposits 164 - 1,039 - Buildings and equipment 329,555 6 318,283 7 Deferred income tax liabilities (Notes 2 and 17) - - 23,766 1Machinery and equipment 3,746,717 40 2,646,020 40 Total other liabilities 164 - 24,805 1Transportation equipment 9,230 - 7,094 - Office equipment 6,117 - 5,174 - Total liabilities 3,026,533 55 2,158,563 47Miscellaneous equipment 46,784 1 40,246 1
Total cost 4,214,055 77 3,092,469 67 STOCKHOLDERS’ EQUITY Less: Accumulated depreciation 1,078,628 20 718,691 17 Capital stock, NT$10.00 par value; authorized - 140,000 thousand
3,135,427 57 2,310,778 50
shares; issued and outstanding - 107,057 thousand shares in 2008 and
Construction in progress and prepayments for equipment 303,828 5 453,046 10 95,469 thousand shares in 2007 1,070,566 20 954,692 21 Capital surplus
Net property, plant and equipment 3,439,255 62 2,763,824 60 Additional paid-in capital from share issuance in excess of par value 845,705 15 841,477 18 OTHER ASSETS Retained earnings
Refundable deposits 6,752 - 18,905 - Deferred expenses(Notes 2,10 and 22) 44,187 1 44,147 1 Legal reserve 123,143 2 71,658 2Deferred income tax assets (Notes 2 and 18) 38,948 1 - - Special reserve 16,803 - 16,803 -Certificates of deposits - restricted (Note 11) 3,158 - 168,978 4 Unappropriated earnings 258,515 5 514,853 11Miscellaneous (Notes 2 and 19) 2,293 - 627 - Total retained earnings 398,461 7 603,314 13
Other equity adjustments Total other assets 95,338 2 232,657 5 Cumulative translation adjustments 164,228 3 65,673 1
Unrealized gain on financial instruments - - 932 - Total other equity adjustments 164,228 3 66,605 1 Equity attributable to shareholders of the parent 2,478,960 45 2,466,088 53 Minority interest 688 - 923 - Total stockholders’ equity 2,479,648 45 2,467,011 53 TOTAL $ 5,506,181 100 $ 4,625,574 100 TOTAL $ 5,506,181 100 $ 4,625,574 100 The accompanying notes are an integral part of the financial statements. (With Deloitte & Touche audit report dated February 20, 2009)

- 94 -
TOPOINT TECHNOLOGY CO., LTD. CONSOLIDATED STATEMENTS OF INCOME YEARS ENDED DECEMBER 31, 2008 AND 2007 (In Thousands of New Taiwan Dollars, Except Earnings Per Share) 2008 2007 Amount % Amount % SALES $ 1,985,063 101 $2,146,226 100 LESS: SALES RETURNS 10,006 1 5,232 - SALES DISCOUNTS AND ALLOWANCES 7,702 - 958 - NET SALES 1,967,355 100 2,140,036 100 COST OF SALES 1,239,941 63 1,241,522 58 GROSS PROFIT 727,414 37 898,514 42 OPERATING EXPENSES
Marketing and selling 105,512 5 88,572 4General and administrative 170,498 9 128,688 6Research and development 39,521 2 36,517 2
Total operating expenses 315,531 16 253,777 12
OPERATING INCOME 411,883 21 644,737 30 NONOPERATING INCOME AND GAINS
Foreign exchange gain, net 32,193 2 16,986 1Income from sale of scraps 12,985 1 12,167 1Interest income 5,413 - 3,116 -Gain from valuation of financial assets 2,094 - 1,790 -Gain on sale of investments, net 219 - 3 -Gain on disposal of property, plant and equipment 23 - - -Others 9,215 - 6,515 -
Total nonoperating income and gains 62,142 3 40,577 2
NONOPERATING EXPENSES AND LOSSES
Interest expenses 87,219 5 45,596 2Losses on inventory valuation and obsolescence 64,500 3 14,893 1Loss on impairment of available-for-sale financial
assets 31,621 2 - -
(Continued)

- 95 -
TOPOINT TECHNOLOGY CO., LTD. CONSOLIDATED STATEMENTS OF INCOME YEARS ENDED DECEMBER 31, 2008 AND 2007 (In Thousands of New Taiwan Dollars, Except Earnings Per Share) 2008 2007 Amount % Amount %
Loss on disposal of property, plant and equipment 485 - 1,597 -Loss from valuation of financial liabilities 47 - - -Loss on impairment of idle assets - - 9,949 1 Others 5,229 - 5,782 -
Total nonoperating expenses and losses 189,101 10 77,817 4
INCOME BEFORE INCOME TAX 284,924 14 607,497 28 INCOME TAX EXPENSE (Notes 2 and 18) 26,805 1 95,776 4 NET INCOME $ 258,119 13 $ 511,721 24 ATTRIBUTABLE TO: Shareholders of the parent $ 258,515 13 $ 514,853 13 Minority interests ( 396) - ( 3,132) - $ 258,119 13 $ 511,721 24 2008 2007 Before Tax After Tax Before Tax After Tax EARNINGS PER SHARE (Note 17)
Basic $ 2.67 $ 2.42 $ 5.80 $ 4.92Diluted $ 2.62 $ 2.38 $ 5.55 $ 4.70
The accompanying notes are an integral part of the financial statements. (With Deloitte & Touche audit report dated February 20, 2009) (Concluded)

96
TOPOINT TECHNOLOGY CO., LTD. CONSOLIDATED STATEMENTS OF CHANGES IN STOCKHOLDERS' EQUITY YEARS ENDED DECEMBER 31, 2008 AND 2007 (In Thousands of New Taiwan Dollars, Except Dividends Per Share) Capital Surplus Unrealized Capital Stock Issued and Additional Bond Cumulative Gain (Loss) on Outstanding Capital Paid-in Capital Conversion Retained Earnings (Note 15) Translation Financial Total
Shares Collected in
from Share Issuance in Excess of Option Unappropriated Adjustments Instruments Minority Stockholders'
(Thousands) Amount Advance Par Value (Notes 2 and 25) Legal Reserve Special Reserve Earnings (Note 2) (Notes 2 and 6) Interests Equity BALANCE, JANUARY 1, 2007 76,116 $ 761,161 $ 12,721 $ 596,038 $ 23,610 $ 35,159 $ 16,803 $ 365,633 $ 18,742 $ - $ - $ 1,829,867 - Appropriation of prior year’s earnings
Legal reserve - - - - - 36,499 - (36,499 ) - - - -Stock dividend - NT$1.146 per share 8,871 88,710 - - - - - (88,710 ) - - - -Cash dividend - NT$2.674 per share - - - - - - - (206,990 ) - - - (206,990 )Bonus to employees 2,356 23,560 - - - - - (23,560 ) - - - -Remuneration to directors and supervisors - - - - - - - (9,874 ) - - - (9,874 )
Seting up the subsidiary company - - - - - - - - - - 4,003 4,003 Capital collected in advance 1,272 12,721 (12,721 ) - - - - - - - - - Conversion of convertible bond 6,854 68,540 - 245,439 (23,610 ) - - - - - - 290,369 Net income in 2007 - - - - - - - 514,853 - - ( 3,132) 511,721 Translation adjustments - - - - - - - - 46,931 - 52 46,983 Unrealized gain on financial instruments - - - - - - - - - 932 - 932 BALANCE, DECEMBER 31, 2007 95,469 954,692 - 841,477 - 71,658 16,803 514,853 65,673 932 923 2,467,011 Appropriation of prior year’s earnings
Legal reserve - - - - - 51,485 - (51,485 ) - - - -Stock dividend - NT$1.194 per share 11,399 113,989 - - - - - (113,989 ) - - - -Cash dividend - NT$2.786 per share - - - - - - - (265,973 ) - - - (265,973 )Bonus to employees - - - - - - - (69,505 ) - - - (69,505 )Remuneration to directors and supervisors - - - - - - - (13,901 ) - - - (13,901 )
Net income in 2008 - - - - - - - 258,515 - - ( 396) 258,119 Issuance of stock due to the exercise of stock options 189 1,885 - 4,228 - - - - - - - 6,113 Translation adjustments - - - - - - - - 98,555 - 161 98,716 Unrealized loss on financial instruments - - - - - - - - - (932 ) - (932 ) BALANCE, DECEMBER 31, 2008 107,057 $ 1,070,566 $ - $ 845,705 $ - $ 123,143 $ 16,803 $ 258,515 $ 164,228 $ - $ 688 $ 2,479,648 The accompanying notes are an integral part of the financial statements. (With Deloitte & Touche audit report dated February 20, 2009)

- 97 -
TOPOINT TECHNOLOGY CO., LTD. CONSOLIDATED STATEMENTS OF CASH FLOWS YEARS ENDED DECEMBER 31, 2008 AND 2007 (In Thousands of New Taiwan Dollars) 2008 2007 CASH FLOWS FROM OPERATING ACTIVITIES
Net income $ 258,119 $ 511,721 Adjustments to reconcile net income to net cash provided
by operating activities: Provision for doubtful accounts 6,380 3,621 Depreciation and amortization 288,458 209,468 Loss on impairment of available-for-sale financial
assets 31,621 - Loss on impairment of idle assets - 9,949 Gain on sale of investments, net (219 ) (3 ) Loss on inventory valuation 12,728 9,422 Loss on inventory obsolescence 51,772 5,471 Net loss on disposal of property, plant and equipment 462 1,597 Gain from valuation of financial assets (2,094 ) (1,790 ) Loss from valuation of financial liabilities 47 - Provision for reversed pension costs (2,513 ) (1,431 ) Deferred income tax (17,201 ) 3,466 Interest expenses on bonds payable - 1,594 Net changes in operating assets and liabilities
Financial assets at fair value through profit or loss 1,790 - Notes receivable (4,572) 4,118 Accounts receivable 173,768 (213,148 ) Notes and accounts receivable - related parties - 835 Other financial assets (23,465) (5,942 ) Inventories (252,505) 27,314 Prepayments 10,821 4,262 Other current assets 100 190 Overdue receivables (3,482 ) (389 ) Notes payable (40,873 ) (5,145 ) Accounts payable (18,071 ) 34,444 Notes and accounts payable - related parties - (14,067 ) Income tax payable (43,353 ) 37,972 Accrued expenses (16,053 ) 78,180 Other current liabilities (468 ) (1,194 )
Net cash provided by operating activities 411,197 700,515
CASH FLOWS FROM INVESTING ACTIVITIES
Acquisition of available-for-sale financial assets (142,848 ) (7,142 ) Proceeds from disposal of available-for-sale financial
assets 100,293 47 Acquisition of property, plant and equipment (693,075 ) (881,800 ) Proceeds of the disposal of property, plant and equipment 321 569 Decrease from refundable deposits 12,153 7,095
(Continued)

- 98 -
TOPOINT TECHNOLOGY CO., LTD. CONSOLIDATED STATEMENTS OF CASH FLOWS YEARS ENDED DECEMBER 31, 2008 AND 2007 (In Thousands of New Taiwan Dollars) 2008 2007
Decrease (increase) in certificates of deposits - restricted 160,256 (149,388 ) Increase in Deferred expenses (724 ) (16,987 ) Decrease (increase) in miscellaneous assets 4 ( 4 )
Net cash used in investing activities (563,620 ) (1,047,610 )
CASH FLOWS FROM FINANCING ACTIVITIES
Increase (decrease) in short-term loans 80,916 (144,723 ) Net decrease in commercial paper (29,982 ) (60,009 ) Increase in long-term loans 1,506,305 1,101,489 Repayment of long-term loans (696,407 ) (265,278 ) Decrease in guarantee deposits (875 ) - Cash dividends paid (265,973 ) (206,990 ) Bonus to employees paid (69,505 ) - Remuneration to directors and supervisors paid (13,901 ) (9,874 ) Proceeds from exercise of employee stock options 6,113 - Increase in minority interests - 4,003
Net cash provided by financing activities 516,691 418,618
NET INCREASE IN CASH 364,268 71,523 CASH, BEGINNING OF YEAR 328,539 263,880 EFFECT OF EXCHANGE RATE CHANGES ON CASH AND CASH EQUIVALENTS (19,734 ) ( 6,864 ) CASH, END OF YEAR $ 673,073 $ 328,539 SUPPLEMENTAL CASH FLOW INFORMATION
Interest paid $ 86,669 $ 46,456 Less: Interest capitalized 245 1,902 Interest paid excluding capitalized interest $ 86,424 $ 44,554 Income tax paid $ 80,939 $ 49,395
NONCASH FINANCING ACTIVITIES
Current portion of long-term loans $ 547,785 $ 356,176 Conversion of convertible bonds $ - $ 290,369
CASH PAID FOR PROPERTY ACQUISITION
Increase in properties $ 844,468 $ 1,040,353 Net decrease (increase) in payables on equipment (151,393 ) (157,864 ) Capitalized interest on convertible bonds - (689 ) Cash paid $ 693,075 $ 881,800
The accompanying notes are an integral part of the financial statements. (With Deloitte & Touche audit report dated February 20, 2009) (Concluded)

- 99 -
VII. Review of financial position, management performance and risk management 1. Financial position
A. Financial status comparison analysis Unit: Thousands
Difference Year Item 2008 2007 Amount % Current assets $1,254,899 $1,183,344 71,555 6.05Fixed assets 1,734,551 1,901,401 (166,850) (8.78)Other assets 55,904 20,565 35,339 171.84Total assets 4,399,220 4,183,746 215,474 5.15Current liabilities 571,680 840,756 (269,076) (32.00)Long-term liabilities 1,263,211 767,432 495,779 64.60Other liabilities 85,369 109,470 (24,101) (22.02)Total liabilities 1,920,260 1,717,658 202,602 11.80Common stock 1,070,566 954,692 115,874 12.14Capital surplus 845,705 841,477 4,228 0.50Retained earnings 398,461 603,314 (204,853) (33.95)Total shareholders’ equity 2,478,960 2,466,088 12,872 0.52
Note: (1)Other assets increase is mainly due to the increase of deferred income tax
assets in 2008. (2)Current liabilities decrease is mainly due to the decrease of equipment
accounts payable in 2008. (3)Long-term liabilities increase is mainly due to the increase of long-term bank
loans in 2008. (4)Other liabilities decrease is mainly due to decrease of deferred income tax
liabilities in 2008. (5)The stocks increase is mainly due to the capital increase by retained earnings
in 2008. (6)Retained earnings decrease is mainly due to cash dividends paid in 2008.

- 100 -
2. Management performance
A. Comparison of business performance Unit: NT$ Thousands
YearItem 2008 2007 Amount
change Ratio change
(%) Net operating income $1,147,454 $1,545,089 (397,635) (25.74)Operating cost 726,400 944,254 (217,854) (23.07)Gross profit 424,919 604,739 (179,820) (29.74)Operating expense 211,922 184,420 27,502 14.91Operating income 212,997 420,319 (207,322) 49.32Non-operating income and gain 204,718 212,313 (7,595) (3.58)Non-operating expense and loss 146,032 54,499 91,533 168Net income before tax 271,683 578,133 (306,450) (53.00)Income tax expense(gain) 13,168 63,280 (50,112) (79.20)Net income 258,515 514,853 (256,338) (49.79)Analysis of financial ratio change: (1) Sales revenue decrease is mainly due to financial storm of the fourth quarter in
2008 , creates the global economic recession, sends the sales drop result. (2) Sales cost decrease is mainly due to financial storm of the fourth quarter in 2008,
creates the global economic recession, sends sales cost drop result. (3) For gross margin decrease, please refer to B. Analysis of Gross profit. (4) Operating income dropped due to gross margin reduced and the costs of employee
bonus and director compensation raised. (5) Non-operating expense and loss increase is mainly due to loss on impairment of
available-for-sale financial assets and losses on inventory valuation and obsolescence in 2008.
(6) Net income before tax decrease is mainly due to operating income reduced and Non-operating expense and loss to increase the result.
(7) Income tax expense decrease is mainly due to decrease of net income in 2008. (8) Net income decrease is mainly due to decrease of Net income before tax in 2008.
B. Analysis of Gross profit Unit: NT$ Thousands
Root cause Item Change amount Price Cost Sales Quantity
Gross margin (179,820) (148,898) 62,162 11,891 (104,975)
Remark
1. The sales price in 2008 decreased 7.41% compared with 2007, and is mainly due to the 14.74% decrease in the sales price of drills.
2.The cost price decrease in 2008 is mainly due to the production quantity increase of 2,679,000 from the production of 5,550,000 in 2007 in small tip braze.
3.The mixed sales difference increases are due to the high gross profit in the sales ratio increase of 57% in 2008 from 54% in 2007.
4.The quantity difference increase is mainly due to economic cycle , the total sales quantity decrease 19.81% cause by drill sales decrease 14.84%.

- 101 -
C. KPI Industry-specific Key Performance Indicator (KPI):
Market Share (%) 17%
Production Yield Rate (%) 92.2%
Production Utilization (%) 81%
3. Analysis of Cash Flows
A. Liquidity analysis of the last two years
YearItem 2008 2007 Fluctuation ratio
%
Cash flow ratio 72.56 51.16 41.83
Cash adequacy ratio 40.47 36.64 5.41%
Cash reinvestment ratio 3.49 6.09 (25.57%) Analysis of financial ratio change: (1) Cash flow ratio increase is mainly due to 2008’s long-term bank loans repayment current liabilities, creates the cash flow ratio change to reach above 20%. (2)Cash reinvestment ratio decrease is mainly due to 2008’s long-investmentincreased result cash reinvestment ratio change to reach above 20%.
B. Analysis of cash liquidity in one year Unit:NT$ Thousands
Beginning cash balance
Remedial measures for the expected insufficient
cash
Expected net cash flow from operating activity of the year
Expected cash
outflow of the year
Expected cash
surplus (deficit) Investing
activity Financing
activity
428,579 306,941 701,647 33,873 - - Remedial measures for the expected insufficient cash and liquidity analysis: N/A
4. Impact of major capital expenditure on finance and business: N/A

- 102 -
5. Policies, reasons for gain or loss and action plan in regard to investment plans in current year and the next year:
Invested company
Holding Amount
(Thousand dollars)
Policy Major reason of gains and
losses
Improvement plan
Future investment plan
Topoint Technology
Co., Ltd.(B.V.I)
1,351,716
The company is an offshore subsidiary established with an investment in Mainland China
Investment income recognized in equity method
N/A N/A
Warpspeed Corporation
(B.V.I.) 1,405
The company is an offshore subsidiary established with international trade.
Investment loss recognized in equity method
N/A N/A
Topoint Japan Co., Ltd. 745
The company is a subsidiary for sell ing electronic components
Investment loss recognized in equity method
N/A N/A
KEY WARE ELECTRONICS
CO., LTD 8,251 Long-term
investment
Available-for-sale f inancial assets
N/A N/A
Shanghai Topoint
Precision Technology Company
1,330,598
Indirect investment in the good market development potential of Mainland China.
Excellent operating status
N/A N/A

- 103 -
6. Risk Management (1) Organization structure of r isk management:
Name Responsibil i ty
High-ranked management level (CEO, president)
-Establish risk management decision and structure -Ensure the effectiveness of r isk management policy
Chairman’s Office
-Implement risk management policy -Coordinate the risk management interaction and communication between cross departments -Organize the implementation results of r isk management activity -Assist and supervise the risk management activit ies of the branches
Headquarters and the various departments
-Implement daily r isk management activit ies -Self-evaluate the process of r isk controlactivity
(2) Risk Factors
①. Management of Economy Risk: the impact of changes of recent annual interest rate and exchange rate, and inflation on company income and future countermeasures:
a. Interest rate: The Company’s interest expenses in 2008 and 2007 are respectively $45,793,000 and $29,596,000, which is due to turnover growth and capacity expansion, and having bank loans to cover the operation capital. The company is in accordance with the fund demand and received a more favorable market loan financing interest rate and fund raising pathway, and has the most effective fund scheduling to reduce the interest expense.
b. Exchange rate: The Company’s exchange profit in 2008 and 2007 are respectively $1,651,000 and $5,310,000, which are 0.775% and 1.26% of the operating income ratio, therefore, the exchange profit does not have a significant influence on company profit. In exchange rate fluctuations, the company closely monitors the changes in foreign exchange rate, the foreign currency assets and liabilities adopted long-term foreign exchange risk hedging trading strategy to reduce currency exchange risk.
c. Inflation: There is no significant influence on the company’s profit due to inflation this year.
d. Future corresponding measures: The Company has grasped the changing situation of the upstream raw material price to reduce the impact on the company profit due to the raw material cost difference.
The economic risks control is responsible by the finance department. ②. Management of Finance Risk: transactions of high risk, high leverage investment, loan funds to others, endorsement, and derivatives commodity:
a. Transactions of high risk or high leverage investment: N/A. b. The company has set up “loan funds to others”, “endorsement” and “transaction
of derivatives commodity”, etc. operation measures to be the base of the operation. Transactions of loaning funds to others is due to the invested subsidiary having the demand for short-term financing, therefore, until the end of December 31, 2007, the balance of loan funds to others is NT$0. The

- 104 -
balance of endorsement for subsidiaries, due to business relations, is NT$319,446,000 till the end of December 31, 2007. The purpose of transactions with a long-term foreign exchange contract is to hedge risk trading, until the end of the third season of 2007, the total amount of the abatement contract is 3,500,000 Swiss francs.
The finance risks control is responsible by the finance department. ③. Future R&D plans and expected R&D investment expense
The future research and development still focuses on micro drills (0.03mm), the expected investment amount is about 3% of the operating revenue. This will help to cope with the industrial technology demand to increase the development of Flipchip drill performance and DDRII tools.
④. The impact of change in major policies, and laws, in Taiwan, and abroad, upon the financial standing of the company and the countermeasures: In accordance with the implementation of Financial Accounting Standards No.34 and No.36, the company has met the relevant laws and regulations; therefore, there is no significant impact on the company’s financial operation. The operations of the company have all followed the relevant laws and regulations, and noticed the policy direction and corresponded with the strategy appropriately; therefore, the company can always effectively correspond and grasp the domestic and international important policy and legal changes.
⑤. The impact of change in technology and industry upon the financial standing of the company and the countermeasures:
The company always attaches great attention to the relevant technology changes of the industry to grasp the market trend and assess the impact it may cause to the company operations.
⑥. The impact of change in corporate image upon corporate risk management and the countermeasures:
Since the establishment of the company, it has been actively strengthening internal management, improving management quality and effectiveness, continuing to follow and implement various corporate governance requirements, setting up independent directors and supervisors, and appointing relevant experts to provide timely advice to reduce the occurrence of risks and the impact of risks to the company.
⑦. Expected benefit(s) and possible risk(s) for M&A activities: N/A ⑧. Expected profit and possible risk of plant expansion: N/A ⑨. Purchase and sales risks and the countermeasures: The Company sought to
scatter suppliers or customers to reduce its risk caused by excessive concentration.
⑩. The impact upon and potential risks for the company due to a significant transfer and the impact upon and potential risks for the company due to a significant transfer and change in shareholding of the directors and supervisors or major shareholders holding over 10%: N/A
⑪. The impact of change in management and its potential risks: N/A ⑫. Litigation and non-litigation matters:
a. The company’s major legal issues, non-legal issues, or administrative lawsuits settled or in pending: N/A
b. The related party’s major legal issues, non-legal issues, or administrative lawsuits settled or in pending:
i. The director- China Development Industrial Bank was the director and supervisor of Cheng I Co., Ltd. (herein as Cheng I Co.) in 1998, and was accused of falsifying Cheng I Co.’s financial statements and

- 105 -
prospectus and has resulted in investment losses by He Jin-Xia, etc. 389 people, therefore, the amount of $71,018,000 was requested (51 plaintiffs settled out of court for the amount of $69,780,000), and China Development Industrial Bank is jointly and severally liable. Taipei District Court dismissed the plaintiff’s claim on November 30, 2006; the plaintiff filed an appeal, which is currently being processed in the Taiwan High Court.
ii. China Development Industrial Bank sold overseas investment using the whole batch method, and dealt with China Development Asset Management Corporation splits, due to it not establishing an appropriate internal control or not having the implementation properly done, according to Paragraph 1, Article 45-1 of Bank Law, the CDIB was fined $10,000,000 in December, 2006. CDIB filed an appeal, which was rejected. Currently administrative litigation has been filed.
iii. Hong Cheng Venture Capital and its representative, Cheng Tun-Chien was accused of assisting UMC to assist He Jian Technology in Suzhou, which was involved in the crime of Criminal Code Offenses of Breach of Trust and the breach of Commercial Account Law on January 9, 2006 by the prosecutors of Hsinchu District Court. The Hsinchu District Court acquitted the first instance with a not-guilty verdict on October 26, 2007. The prosecutor has filed an appeal, which is currently being processed in the Taiwan High Court.
⑬. Other major risks and countermeasures:
a. Market risk
The Corporation’s available-for-sale assets were publicly traded securities, with fair values that are affected by changes in market prices. Since the Corporation carefully chooses its investments, there is no significant market risk. In addition, the Corporation uses forward exchange contracts to offset the exchange rate fluctuations of net assets, net liabilities or firm commitments. Thus, no significant market risk is anticipated.
b. Credit risk The Corporation is exposed to credit risk on the default by counter-parties to
forward contracts. Contracts with positive fair values at the balance sheet date are evaluated for credit risk. As a result, no material losses resulting from counter-party defaults are anticipated.
c. Liquidity risk The Corporation’s available-for-sale financial instruments are publicly traded
in an active market and can be sold in the market at their fair values. In addition, the Corporation has enough operating capital to meet cash demand. Thus, no significant demand for extra cash is expected.
The Other major risks control is responsible by the finance department.
7. Other important matters: N/A

VIII. Special Disclosures
1. Information of Affi l iated Firms
A. Affiliates Consolidated Business Report
(1) Organization chart
Topoint Technology Co., Ltd.
Topoint Technology Co., Ltd. (B.V.I.)
Shanghai Topoint Precision Technology Company
Warpspeed Corporation (B.V.I.)
100%
100%
100%
Topoint Japan Co., Ltd.
52%
(2) Basic information
Name of the invested company Area Major business Paid-up capital
Unit: NT$ Thousands
Topoint Technology Co., Ltd.(B.V.I.)
British Virgin Islands
International Investment 829,116
Warpspeed Corporation (B.V.I.)
British Virgin Islands International Trade 1,569
Topoint Japan Co., Ltd. Japan Sales of electronic components 8,340
Shanghai Topoint Precision Technology Company China
The production and sales of precision cutting tools and
automatic measuring tools
829,116
(3) The shareholder ’s information presumed to have control and
subordination: N/A
(4) The industry covered by the overall aff i l iates operating business
The operating business of the company and its aff i l iated enterprises
include the R&D, manufacture, and sales of dri l ls, etc.
- 106 -

- 107 -
(5) Affi l iated enterprises directors, supervisors, and presidents
Share holding Company Name Posit ion Name/Representative Amount %
Topoint Technology Co., Ltd.(B.V.I.)
Major Shareholder
Topoint Technology/ Lin Shu-Ting 3,130 100%
Warpspeed Corporation
(B.V.I.)
Major Shareholder
Topoint Technology/ Chiang Chen-Wen 50,000 100%
Topoint Japan Co., Ltd. Director Topoint Technology/
Lin Shu-Ting 312 52%
Director Lin Shu-Ting - - Director Wang Chia-Hong - -
Shanghai Topoint Precision
Technology Company Director Chen Shiu-Tao - -
B. Affi l iates Consolidated Financial Statements: See P.92~P.97
The aff i l iates of Topoint Technology Co., Ltd., which should have been
included in the combined financial statements of Topoint Technology
and its aff i l iates, as of 2008 (from January 1, 2008 to December 31,
2008), based on the “Principles and Guidelines for Preparation of the Affiliates
Consolidated Business Report, Affiliates Consolidated Financial Statements, and the
Report.”, are the same as those included in the consolidated financial statements of
Topoint Technology and its subsidiaries as of 2008, prepared under the Statement of
Financial Accounting Standards No.7. The information required to be disclosed in
the consolidated financial statements has already been disclosed in the above
consolidated financial statements. Consequently, there is no need to prepare a
separate consolidated financial statement of Topoint Technology and its affiliates.
C. Affiliation Report: N/A
2. Subscription of marketable securities privately in the most recent years: N/A
3. The stock shares of the company held or disposed by the subsidiaries in the most recent
years: N/A
4. Supplementary disclosures:
A. The status of financial information disclosure relevant personnel receiving relevant
certifications from the authorities:
The company’s internal auditors have received the Securities & Futures Institute’s
corporate internal control basic capacity test qualification certificates on January 15,

- 108 -
2008. The certificate number is: (96) Cheng Chin Chi Tse Cheng Tze No.
3610600731.
B. The Boards to approved of the enactment of Major information Procedures on Apr.21,
2009, and announcement of all employees, executive officers, directors and
supervisors.
4. Occurrence of events defined in Securities Transaction Law Article 36.2.2 that has
great impact on shareholder’s equity or security price in the most years and up to the
date of the report printed: N/A

- 109 -
TOPOINT TECHNOLOGY CO., LTD.
Chairman: Xu-Ting Lin


![d ] v€¦ · EPSON Easy Photo Print Photo Print ladi stock DOI ladi stock 002 ladi stock stock ladi stock 005 ladi stock DDE ladi stock 007 stock DDB ladi stock DDS ladi stock 010](https://img.dokumen.tips/doc/110x75/5f06f3837e708231d41a8cef/d-v-epson-easy-photo-print-photo-print-ladi-stock-doi-ladi-stock-002-ladi-stock.jpg)