Embed Size (px)
Citation preview

Oral Abstracts
101. Serial Quantification of Targeted FumagillinTherapy Using avb3-Targeted ParamagneticNanoparticles in Early Atherosclerosis at 1.5 T
Patrick M. Winter, PhD,1 Anne M. Morawski, BS,1 SheltonD. Caruthers, PhD,2 Thomas D. Harris, PhD,3 Grace Hu,PhD,1 Ralph W. Fuhrhop,1 Huiying Zhang, MD,1 John S.Allen, BS,1 Elizabeth K. Lacy, BS,1 Todd A. Williams, BS,1
Samuel A. Wickline, MD,1 Gregory M. Lanza, MD, PhD.11Cardiology, Washington University, St. Louis, MO, USA,2Philips Medical Systems, Cleveland, OH, USA, 3Bristol-Myers Squibb Medical Imaging, Billerica, MA, USA.
Introduction: The severity or propensity of atherosclerosisin asymptomatic patients may be indirectly estimated by thecirculating concentrations of inflammatory markers or lipo-proteins. However, circulating biomarkers are confoundedby many factors and cannot accurately delineate the spatialdistribution or total burden of atherosclerosis within thevasculature. Angiogenesis is an integral feature in theprogression of atherosclerosis and the development ofvulnerable plaques. The avb3-integrin is a selective signatureof angiogenic endothelium, which can be used to characterizethe neovascular demand of expanding intramural plaques. Inthe present study, we utilized avb3-targeted perfluorocarbonnanoparticles to deliver fumagillin, an anti-angiogenic ther-apy, and to quantify its effectiveness with serial, noninvasivemolecular imaging.
Methods: Male New Zealand White rabbits were fed a0.25% cholesterol diet for 75 days. Transverse black-bloodMRI (TR/TE = 380/11 ms) of the thoracic aorta wasperformed with a clinical 1.5 T magnet (NT Intera withMaster Gradients, Philips Medical Systems, Best, Nether-lands) using a quadrature birdcage coil (250 by 250 mm in-plane resolution and 5 mm slice thickness). Images werecollected before and four hours after peripheral injection ofavb3-targeted paramagnetic nanoparticles (1 ml/kg) incorpo-rating 0 (n = 18) or 0.2 mole% (n = 18) fumagillin, 30 mole%Gd-DTPA-bisoleate, and 0.1 mole% vitronectin peptidomi-
metic antagonist covalently coupled to phospholipids in theouter surfactant layer. Following baseline treatment, half therabbits within each treatment group remained on the high-cholesterol diet while the remainder was switched to normalrabbit chow. All animals were imaged weekly with avb3-targeted paramagnetic nanoparticles (no drug) over the nextfour weeks to quantify neovascular avb3-integrin expressionin the aorta. MRI signal enhancement was calculated fromT1w intensities measured before and after paramagneticnanoparticle injection using a semi-automated image seg-mentation program.
Results: At baseline, MRI signal enhancement among allfat-fed rabbits across the entire descending thoracic aorta was23.9 ± 3.7% and did not differ (p > 0.05) between fumagil-lin-treated (25.2 ± 4.9%) and no drug (22.2 ± 6.0%) groups.Discontinuation of the hyperlipidemic diet did not impact(p > 0.05) neovascular contrast levels in the fumagillin-treated or control rabbits. Preinjection MR scans revealed noweek-to-week carry-over of contrast enhancement from theavb3-targeted paramagnetic nanoparticles. Moreover, weeklyadministration of avb3-targeted nanoparticles elicited no anti-angiogenic effect. One week after fumagillin treatment, MRIenhancement was significantly lower, 5.5 ± 2.7%, in fuma-gillin treated animals versus control rabbits, 21.7 ± 4.7%(*p < 0.05), independent of diet. By four weeks, completerecrudescence of the neovasculature was noted amonganimals injected with the single dosage of fumagillin16.3 ± 3.0% in reference to the no drug control rabbits(17.8 ± 2.5%, p > 0.05).
Conclusions: Molecular imaging with MRI provided anon-invasive means to detect early atherosclerosis and seriallymonitor anti-angiogenic therapy using a clinical 1.5 Tscanner. A single-dose of fumagillin-bearing nanoparticlesinduced an acute anti-neovascular response regardless of thepost-treatment diet (high-cholesterol versus normal rabbitchow) that recrudesced after one month. avb3-targetedparamagnetic nanoparticles had no week-to-week residualT1w contrast and repeated injections elicited no therapeuticeffect. These results suggest that avb3-targeted nanoparticlescan provide repeated assessment of angiogenesis withoutimpacting the underlying pathophysiology and withoutcumulative enhancement effects.
102. In Vivo Magnetic Resonance Imaging ofAtherosclerotic Plaque Inflammation inApolipoprotein E Deficient Mice
David E. Sosnovik, MD,1 Matthias Nahrendorf, MD,2
George Dai, PhD,2 Farouc Jaffer, MD, PhD,1 Chris Farrar,
Journal of Cardiovascular Magnetic Resonance (2005) 1, 3–90
Copyright D 2005 Taylor & Francis Inc.
ISSN: 1097-6647 print / 1532-429X online
DOI: 10.1081/JCMR-200048619
1097-6647 D 2005 Taylor & Francis Inc. 3Order reprints of this article at www.copyright.rightslink.com

PhD,2 Ralph Weissleder, MD, PhD.2 1Cardiology, Massa-chusetts General Hospital, Charlestown, MA, USA, 2Radi-iology, Massachusetts General Hospital, Charlestown, MA,USA.
Introduction: Apolipoprotein E deficient (ApoE�/�) miceare a biologically important model of atherosclerosis, and arefrequently used to identify new therapeutic targets and toassess the efficacy of novel anti-atherosclerosis therapies.The role of inflammation in the development of atheroscle-rotic plaques, strokes and acute coronary syndromes is nowwell recognized. However, studies of plaque inflammationin ApoE�/� mice have been hampered by the inability toimage the inflammatory process in these mice in-vivo. Thepurpose of this study was thus to determine whether a dual-modality magneto-optical iron oxide agent (CLIO-Cy5.5)could be used to image atherosclerotic plaque inflammationin ApoE�/� mice, in vivo.
Methods: In-vivo MR imaging was performed on 4ApoE�/� mice (ages 24–28 weeks, high cholesterol dietfor 12–16 weeks) 24 hours after the injection CLIO-Cy5.5(15 mg/kg) into their tail veins. ECG and respiratory-gatedT2* weighted gradient echo cines were obtained on a 9.4 Thorizontal bore scanner with the following parameters: FOV30 mm, slice thickness 1 mm, matrix 200 � 200, NEX 4.Each cine consisted of 16 frames per RR interval resultingin a TR of 7–8 ms. Images at echo times of 2.7 ms and
4.7 ms were acquired in the long axis of the thoracic aorta,and in the short axis of the aortic arch. The mice were theneuthanized, the aorta was dissected and embedded in agarfor ex-vivo MRI in a vertical bore 14 T magnet (gradients950 mT/m). T2* weighted gradient echo images whereacquired with a slice thickness of 0.5 mm, in-plane reolution100 � 100 um, a TR of 200 ms, 16 NEX, and TEs of 3 msand 6 ms. Following MR imaging, the aorta was sectionedfor near infrared fluorescence (NIRF) microscopy and im-munofluorescence staining for the MAC3 macrophageantigen. The identical MR and optical imaging protocolwas repeated in a control ApoE�/� mouse injected withnormal saline, and in a wildtype mouse injected with theCLIO-Cy5.5 probe.
Results: Regions of negative signal enhancement wereseen along the aortic root, the lesser curvature of the aorticarch and at the origins of the great vessels in the ApoE�/�
mice that received the CLIO-Cy5.5 probe (Figure 1A and B)but not in the control mice. NIRF microscopy confirmed thepresence of CLIO-Cy5.5 in the regions demonstratingnegative MR signal enhancement, which are also known tobe sites prone to the development of atherosclerosis inApoE�/� mice. Co-localization of the NIRF signal fromCLIO-Cy5.5 with the MAC3 immunofluorescence signalconfirmed that the presence of CLIO-Cy5.5 in the athero-sclerotic lesions was due to uptake by plaque macrophages(Figure 1C and D).
Discussion: The results of this study demonstrate that highresolution MRI following the administration of superpara-magnetic nanoparticles can be used to image the degree ofplaque inflammation in-vivo in a murine model of athero-sclerosis. The fluorescent properties of the dual modalityCLIO-Cy5.5 probe permit precise and specific localization ofiron oxide using NIRF microscopy, and demonstratecolocalization of iron oxide and plaque macrophages. Thisapproach should allow the degree of plaque inflammation inmice to be quantified serially and non-invasively, and couldbe used to assess the efficacy of new anti-inflammatoryatherosclerotic therapies.
103. In Vivo Thrombus Detection with MagneticResonance Imaging: A Comparative Study Using aFibrin-Targeted Contrast Agent and Gd-DTPA
Marc Sirol, MD, Juan J. Badimon, PhD, Valentin Fuster, MD,PhD, Zahi A. Fayad, PhD. Cardiovascular Institute, MountSinai School of Medicine, New York, NY, USA.
Introduction: Arterial thrombosis plays a critical role inclinical manifestation of cardiovascular diseases. Therefore,the ability of detecting the presence of thrombosis has asignificant clinical implication for both, diagnostic andguidance of therapy. Feasibility of thrombus detection byMRI has been already demonstrated using non-contrast
Figure 1. A: in vivo and B: ex vivo MRI. Arrows point at regionswith negative signal enhancement caused by CLIO-Cy5.5 withinplaques at the lesser curvature and the aortic root. C: fluorescentCy5.5 signal and D: Texas red immunofluorescence staining ofmacrophage antigen MAC3 merged with dapi stain for nuclei at400 � magnification. C and D were obtained from the same slide.Arrows point at 2 macrophages that took up CLIO-Cy5.5.
Oral Abstracts4
enhanced MRI. Recent advances in the field of molecularimaging have led to the development of novel paramagneticand superparamagnetic targeted MR contrast agents that bindexclusively to atherosclerotic plaque components.
Purpose: We sought to test a novel gadolinium labeledfibrin-targeted peptide, EP-2104R (EPIX Medical Inc.) forthrombus detection in a rabbit model of carotid thrombosis.Thereafter, we compared this thrombus-enhancing contrastagent to a conventional gadolinium chelate (Gd-DTPA) for itspotential to enhance contrast between thrombus, blood, andsurrounding tissues.
Methods: Carotid artery thrombus was induced by externalinjury and blood stasis in 12 New Zealand Whtie rabbits.MRI was performed in a 1.5 T MRI system, before andimmediately after EP-2104R injection. T1-weighted MRimages were acquired using both a 2D fast spin-echo and a3D fast gradient-echo sequences. MR imaging parametersincluded: repetition time (TR) and echo time (TE) of 400/7ms; receiver bandwidth (BW) = ± 42 KHz; echo-trainlength = 16; slice thickness = 2 mm; no slice gap; field-of-view (FOV) = 8 cm; acquisition matrix 256 � 256; numberof signal average = 4; double-inversion preparatory pulsesinversion time (TI) = 350 ms; and chemical fat suppressionpulse. Gd-DTPAwas injected (50 mmolGd/kg) the next day inthe same animal, and images were acquired using the samesequences with a careful registration. Different thrombus agewere assessed. From the day of thrombus induction (Acute),after a week, two weeks up to four weeks after thrombusformation. Histopathologic analyses of the thrombi weresystematically performed.
Results: This model consistently produced an occlusivefibrin-rich thrombus in all animals (n = 12) according topathology. Detection of arterial thrombi was achieved in allcases after EP-2104R injection. Thrombus contrast-to-noiseratio (CNR) was dramatically increased after EP-2104Rinjection compared to pre-contrast imaging (P < 0.001). Gd-DTPA was not usefull for thrombus detection. A decrease ofthrombus CNR was observed after Gd-DTPA injection due toperivascular enhancement of the surrounding tissue (muscle).The bar graph depicts the trend of thrombus CNR before andafter EP-2104R and Gd-DTPA injection respectively. A trendin decrease of thrombus CNR was observed with oldest
thrombi (> 3 weeks), corresponding to a progressivethrombus organization, where fibrin was gradually replacedby colagen matrix (P = .082).
Conclusions: We demonstrated the feasibility of a fibrin-targeted MR contrast agent for detection of unorginized andorginized thrombi in vivo. We showed the superiority of EP-2104R for thrombus detection and assessement of thrombuscomposition compared to conventional gadolinium chelates(Gd-DTPA). Potential application includes thrombus detec-tion in patients with unstable angina and stroke.
104. Spatial and Temporal Characterization of MRIContrast Enhancement in Atherosclerotic Lesions withGadolinium Texaphyrin Complexes
Henning Steen,1 Matthias Stuber, PhD,2 Subroto Chatterjee,PhD,3 Joao A. C. Lima, MD,4 Al Lardo, PhD.5 1Cardiology,Universitat Heidelberg, Heidelberg, Germany, 2Radiology,Johns Hopkins, Baltimore, MD, USA, 3Pediatrics, JohnsHopkins, Baltimore, MD, USA, 4Cardiology, Johns Hopkins,Baltimore, MD, USA, 5Cardiology, Johns Hopkins, Baltimore,MD, USA.
Introduction: Atherosclerosis lesions can be visualized non-invasively by high resolution magnetic resonance imaging(MRI). Further discrimination of plaque morphology maybe possible using contrast agents that preferentially bindto specific plaque components and thereby improve MRIsignal to noise and contrast to noise ratios (SNR, CNR).Gadolinium-based texaphyrin complexes (Gd Tex, Pharma-cyclics, Inc.) that are water-soluble but significantly lipophilicmay potentially be used as molecular imaging contrast agentsthat may selectively localize in atheromatous plaque.
Purpose: The purpose of this studywas to characterize pref-erential and selective plaque uptake kinetics of a number ofGd Tex complexes in a rabbit model of severe atherosclerosis.
Methods: Aortic wall SNR-and CNR dynamics of threeGd Tex complexes with varying degrees of lipid bindingaffinity (PCI-0160,-0210,-0400, 2 mg/dl) were investigated inWatanabe rabbits (focal aortic injury and high-cholesterol dietfor 8 weeks) on a 1.5T-MRI-System (Philips Medical).Multiple sub-renal ECG-gated fat-saturation aortic 3D-black-blood Fast-Spin-Echo vessel wall images (TR = 3 RR,TE = 10.5 ms, TI pre/post = 400/270 ms, FOV = 76 mm,in-plane resolution = 250 mm) were acquired pre and postadministration of Gd Tex (10 mg/dl i.v. per animal) and every10 minutes over 120 minutes. SNR and CNR over time werecharacterized using a semi-automated analysis algorithm.
Results: High quality vessel wall imaging was achievedin all animals. At 60 minutes post-contrast, T1-SNR in-creased for all three agents [PC-160 = 50 to 54 (8%), PC-210 = 54 to 64 (20%), PC400 = 36 to 62 (75%)] and CNRincreased for two agents [PC-160 = 41 to 44 (6%), PC210(unchanged), PC400 = 32 to 45 (43%)]. At 120 minutes
5Oral Abstracts
post contrast, enhancement of the plaque and its lipid core(LC) is demonstrated with partial protrusion into the lumen(Fig. 1, arrow) that was not appreciable at baseline.
Conclusions: Gadolinium-containing texaphyrin molecu-lar contrast agents preferentially enhance aortic atheroscle-rotic plaque and increase both T1 SNR and CNR in a rabbitmodel of severe atherosclerosis. The degree of lipid bindingof these compounds can be modified to selectively targetspecific plaque constituents, which may have implications forimproved plaque characterization and non-invasive diseasescreening of rupture prone plaque.
105. CMR Detection of VCAM-1 Expression inActivated Human Endothelial Cells with TargetedSPIO Nanoparticles
Szilard Voros,1 Brett R. Blackman, PhD,2 Dongfeng Pan,PhD,3 Craig H.Meyer, PhD,2 Ian J. Sarembock,MD,1Walter J.Rogers, PhD.3 1Cardiology, University of Virginia, Charlottes-ville, VA, USA, 2Biomedical Engineering, University ofVirginia, Charlottesville, VA, USA, 3Radiology, University ofVirginia, Charlottesville, VA, USA.
Introduction: In-vivo visualization of molecular processeswould have major implications in early diagnosis ofatherosclerosis as well as in in-vivo testing of pharmacologicagents designed for prevention and treatment.
Purpose: We sought to develop and validate a targetedmolecular magnetic resonance imaging platform using amonoclonal antibody as targeting ligand and small paramag-netic iron oxide (SPIO) as the reporter for the detection ofvascular cell adhesion molecule 1 (VCAM-1) expression onactivated human umbilical vein endothelial cells.
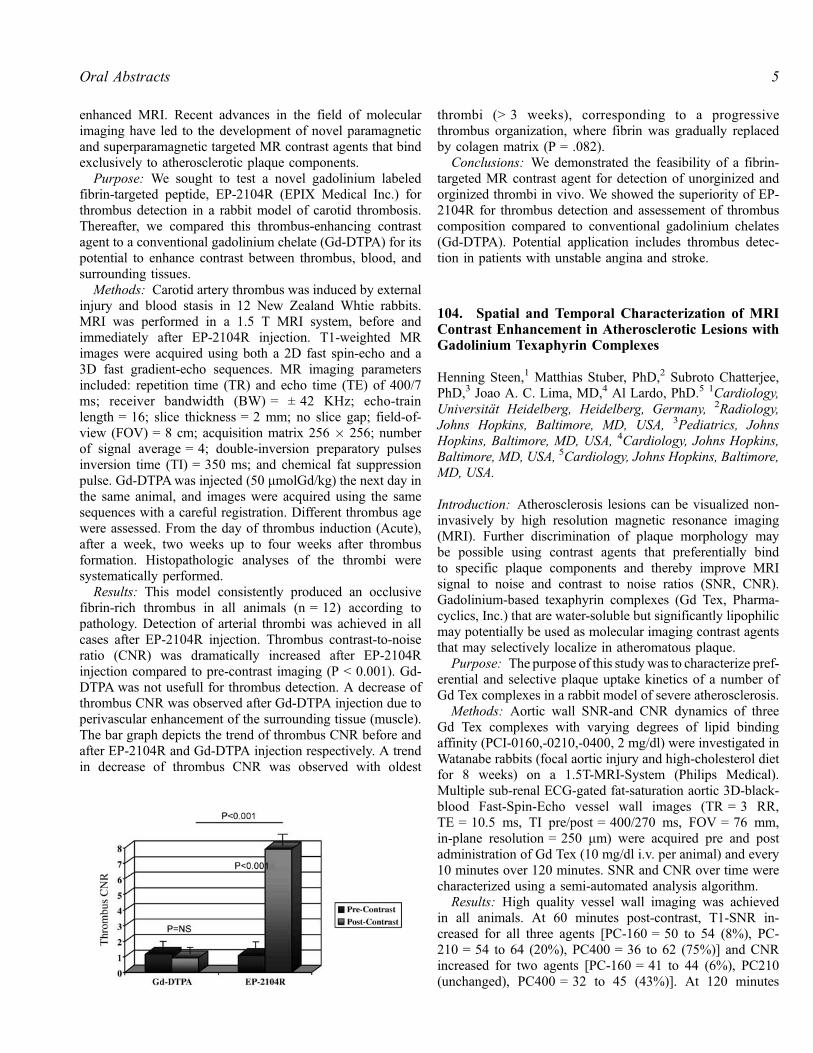
Methods: SPIO was chosen as the MR reporter probegiven its high sensitivity due to susceptibility effects.Targeted SPIO (tSPIO) was prepared by conjugation ofanti-VCAM-1 antibody to its dextran coating, using imine-bond chemistry. Human umbilical vein endothelial cells(HUVECs) were plated on plastic cover slips, were grown toconfluence and were activated by 1000 IU of TNF-a. Cellswere incubated with 3 different doses of SPIO or tSPIO (7.84mg/ml [1 � ], 78.4 mg/ml [10 � ] and 156.8 mg/ml [20 � ]).MR imaging of cells was performed on a 1.5 T clinicalimaging system (Siemens Sonata). Gradient recalled echopulse sequences with 3 different weightings were used tocreate increasing sensitivity for the presence of iron (T1: TR/TE 100/5 ms, T2*: TR/TE 500/20 ms and 500/40 ms). Otherimaging parameters included FoV 150 mm, matrix320 � 320, slice thickness 4 mm, number-of-averages 6.For semiquantitative analysis, binary maps were created withsignal intensity (SI) below 2 and 4 SD for each sequence andthe area of SI below the threshold was computed. Afterimaging, the presence of VCAM-1 expression was confirmedon HUVECs by immunohistochemistry (O) and the presenceof iron particles was confirmed by Luna’s iron stain (B) andscanning electron microsopy (C).
Results: tSPIO (D-L) but not SPIO (A) bound to VCAM-1expressing HUVECs. Area of signal loss on binary mapsincreased with increasing T2 weighting and with increasingconcentration of tSPIO for each pulse sequence (D: T1, 1 � ;
Figure 1.
Oral Abstracts6

E: T2 TR20, 1 � , F: T2 TR 40, 1 � , G: T1, 10 � ; H:T2 TR20, 10 � ; I: T2 TR40, 10 � ; J: T1, 20 � ; K: T2TR20, 20 � ; L: T2 TR40, 20 � ). Binary map of T2*images (TE = 20 ms) with 2 SD distinguished different dosesbest (M, N).
Conclusions: We demonstrate for the first time that ourstrategy of CMR visualization of VCAM-1 targeted SPIO is arobust technique for the detection of VCAM-1 expression onactivated HUVECs. This approach is now ready to be appliedfor in-vivo detection of molecular imaging of atherosclerosis.
106. Molecular MRI of Left Atrial Thombi in aSwine Model Using EP-2104R
Elmar Spuentrup, MD,1 Bernd Fausten, MD,1 Sylvia Kinzel,VD,1 Andrea J. Wiethoff, PhD,2 Rene M. Botnar, PhD,3
Edward C. Parsons Jr., PhD,2 Philip B. Graham, PhD,2
Stephan Haller, MD,1 Marcus Katoh, MD,1 Warren J.Manning, MD,3 Thomas Busch, MD,1 Rolf W. Gunther,MD,1 Arno Buecker, MD.1 1RWTH-Aachen, Aachen, Ger-many, 2EPIX Pharmaceuticals, Inc., Cambridge, MA, USA,3Beth Israel Deaconess Medical Center and Harvard MedicalSchool, Boston, MA, USA.
Introduction: The detection of left cardiac masses andespecially thrombi is important in patients with thrombem-bolic diseases such as stroke, and potentially thrombogenicdiseases, such as atrial fibrillation (AF) and heart failure.Since even small clots may be the origin of embolism, highlysensitive detection of clots would be advantageous. Further,accurate exclusion of clot is required prior to cardioversion inpatients with atrial fibrillation.
Purpose: The aim of this study was to investigate a newMRI fibrin-specific contrast agent (EP-2104R, EPIX Phar-maceuticals, Cambridge, MA, USA) for molecularly targetedimaging of left atrial clots.
Methods: Chronic human thrombi were surgicallyimplanted in the left atrial appendage in swine (n = 5). MRIwas performed using a navigator-gated, free-breathing and
cardiac triggered 3D inversion-recovery black-blood gradient-echo sequence before and after systemic administration of 4.0mmol/kg EP-2104R. Images were analyzed by two inves-tigators and contrast-to-noise ratio was calculated. Locationof clots was proven by autopsy and Gadolinium (Gd)concentration in the clots was assessed post-mortem by ICP.
Results: Prior to contrast administration thrombi were notvisible on black-blood MR images. After EP-2104R admin-istration, all atrial clots were selectively enhanced (Figure 1),with a high contrast-to-noise ratio (CNR clot/blood = 29.7 ±8.0). Gd-concentration in the clots averaged 74 ± 45 mM.(Average clot size = 243 ± 133 mg).
Conclusion: The fibrin-specific MR contrast agent EP-2104R allows for selective, high contrast visualization of leftatrial clots through molecular targeted MRI, even withrelatively low concentration (< 100 mM) of fibrin. The agentis thus promising for the detection of small clots in the leftatrial appendage, and may be helpful to differentiate amongclot, neoplasm or appositional thrombi on masses whencompared to conventional MR-imaging techniques or otherimaging modalities.
107. Non-invasive In Vivo ‘‘Histology’’: VisualizingSingle Immune Cells in Acute Allograft RejectionAfter Heterotopic Heart Transplantation withMicrometer-Sized Iron Oxide Containing Particles
Yijen L. Wu, PhD, Lesley Foley, BS, T. Kevin Hitchens, PhD,John B. Williams, PhD, Qing Ye, MD, Chien Ho, PhD.Pittsburgh NMR Center for Biomedical Research, CarnegieMellon University, Pittsburgh, PA, USA.
Introduction: In vivo cell tracking with MRI provides meansfor observing biological processes and monitoring cell ther-apy in vivo. We have previously demonstrated that acuteallograft rejection after heart transplantation can be non-invasively visualized by in vivo labeling of immune cells,primarily macrophages, with nanometer-sized ultrasmalldextran-coated iron-oxide (USPIO) particles. The extent ofMR signal changes correlated well with the rejection grade.However, nanometer-sized USPIO is much smaller comparedto the size of a cell. It requires loading many particles and it isunlikely to resolve individual cells in vivo.
Purpose: We explore the possibility of using the muchbigger micrometer-sized (0.98 mm) iron oxide particle, Bangsparticles, to track individual immune cells with in vivolabeling. Bangs particles are styrene/divinyl benzene polymermicrospheres that contain magnetite core as well as afluorescent dye.
Methods:
1. Animal model: We use an abdominal heterotopic workingheart and lung transplantation model in rats with DA toBN transplantation pairs.Figure 1.
7Oral Abstracts

2. MRI methods: EKG and respiration gated T2*-weightedcine imaging on Bruker AVANCE 4.7-T system was usedfor in vivo imaging with the in-plane resolution of 156mm. High-resolution 3D imaging is performed at 11.7 Twith voxel size: 46.8 mm � 46.8 mm � 93.8 mm.
3. Iron oxide particle labeling: Immune cells, mostly macro-phages, are labeled in vivo by direct intravenous injectionof USPIO or Bangs particles 1 day prior to MRI scans.
Results: Distinct punctate areas of high contrast can beseen in the transplanted allograft heart (Fig. 1A and B) andlung (Fig. 1C) 1 day after Bangs particle administration atpost-operational day (POD) 6. This dotted pattern can be seenas early as 2 hours after Bangs particle administration. WithUSPIO labeling, accumulation of immune cells, primarilymacrophages, in the rejecting sites can be readily seen(Fig. 2C). However, although the darkening is regional, thereis no punctate blackening contrast seen as with Bangsparticles. The isografts show no detectable signal changes(Fig. 2B).
Each ‘‘dot’’ of high contrast with Bangs particle labelingcould possibly represent a single cell, or even a singleparticle, for the background gradient generated by iron oxideparticles can propagate as large as 50 times of the radius. Thiscan be better depicted with high resolution MR microscopy at11.7-Tesla (Fig. 3). With about 50 mm resolution, discreteblack dots can be seen throughout the heart with Bangsparticle labeling (Fig. 3A, D), and the size of the black dotsranges from 50 to 150 mm. On the other hand, even with this
high resolution, the allograft labeled with USPIO (Fig. 3Cand F) still show smeared, but not punctate, pattern. Thepunctate pattern with Bangs particle labeling is not due torandom interstitial deposition of iron oxide particles, butuptake of the particles into cells. Electron micrograph revealsthe uptake iron is within membrane bound vesicles.
Conclusions: Our preliminary results indicate that moresensitive contrast agent, such as Bangs particles, providespotential for monitoring single cells in vivo. With better celllabeling strategies, much better methodologies can bedeveloped that are not only important and useful for detectingorgan rejection, but also for many other biological processed.
108. Recombinant HDL-like Nanoparticles, a SpecificContrast Agent for MRI of Atherosclerotic Plaques
Juan C. Frias, PhD,1 Kevin Jon Williams, MD,2 Edward A.Fisher, MD, PhD,3 Zahi A. Fayad, PhD.1 1Cardiology, MountSinai School of Medicine, New York, NY, USA, 2ThomasJefferson University, Philadelphia, PA, USA, 3Cardiology,New York University School of Medicine, New York, NY, USA.
Atherosclerosis remains a major health problem in the US,with significant morbidity and mortality. The early detectionof atherosclerosis may direct therapies to prevent this disease.The ability to image the presence or biological activity ofspecific molecules (‘‘molecular imaging’’) in atheroscleroticplaques in vivo would be of considerable interest. Most of theavailable paramagnetic magnetic resonance (MR) contrastagents are not capable of delivering a large amount ofgadolinium (Gd3+) ions to induce a large MR signal. Here, wepresent a high-density lipoprotein HDL-like nanoparticlecontrast agent that selectively targets atherosclerotic plaques.In order to match the results found by MRI with confocalfluorescent microscopy, a fluorecent phospholipid was alsoincluded in the formulation of the contrast agent.
Figure 1. Allograft heart (A, B) and lung (C) 20 hours post-Bangsparticle administration.
Figure 2. In vivo macrophage accumulation at POD 6 (A) Allograftwith Bangs particle (B) Isograft with USPIO (C) Allograft withUSPIO.
Figure 3. MR microscopy at 11.7 T(A, D) allograft with Bangsparticles at POD 7 (B, E) isograft with USPIO at POD 7 (C, F)allograft with USPIO at POD 6. (A–C) short-axis view (D–F) long-axis view.
Oral Abstracts8
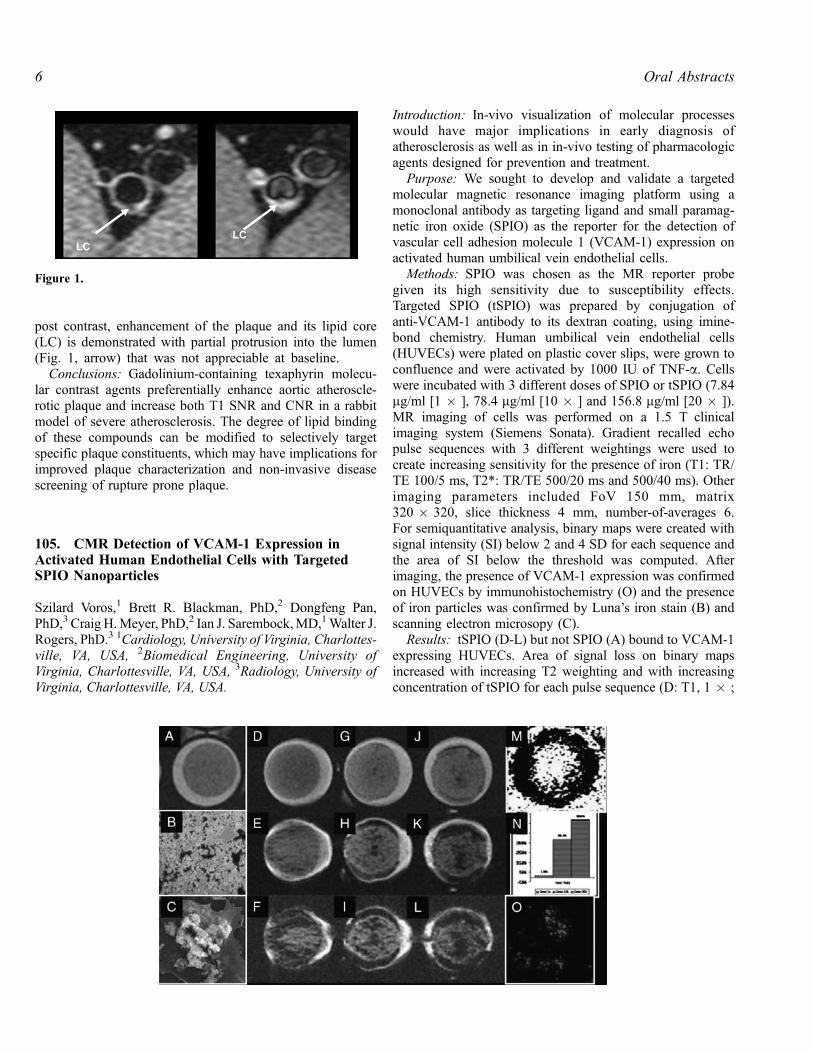
Genetically engineered mice were used as models ofhuman atherosclerosis and were in vivo imaged. Thereconstituted HDL contrast agent (rHDL) was injected via atail vein catheter. Sequential MRI showed that the contrastagent localized predominantly at the atherosclerotic plaque by24 hours after injection. Furthermore, by 48 hours afterinjection, the intensity of the plaque decreased to a valuesimilar to that observed for the plaque immediately afterinjection. Importantly, the enhancement was also related toplaque composition as in another group of animals theenhancement was found to be at its maximun at 72 hours postinjection (Figure 1). Histopathological analysis of the plaquerevealed that the animals that showed enhancement at 24hours had a smaller content of lipids but a higher number ofcells in the intima compared to those that showed enhance-ment at 72 hours.
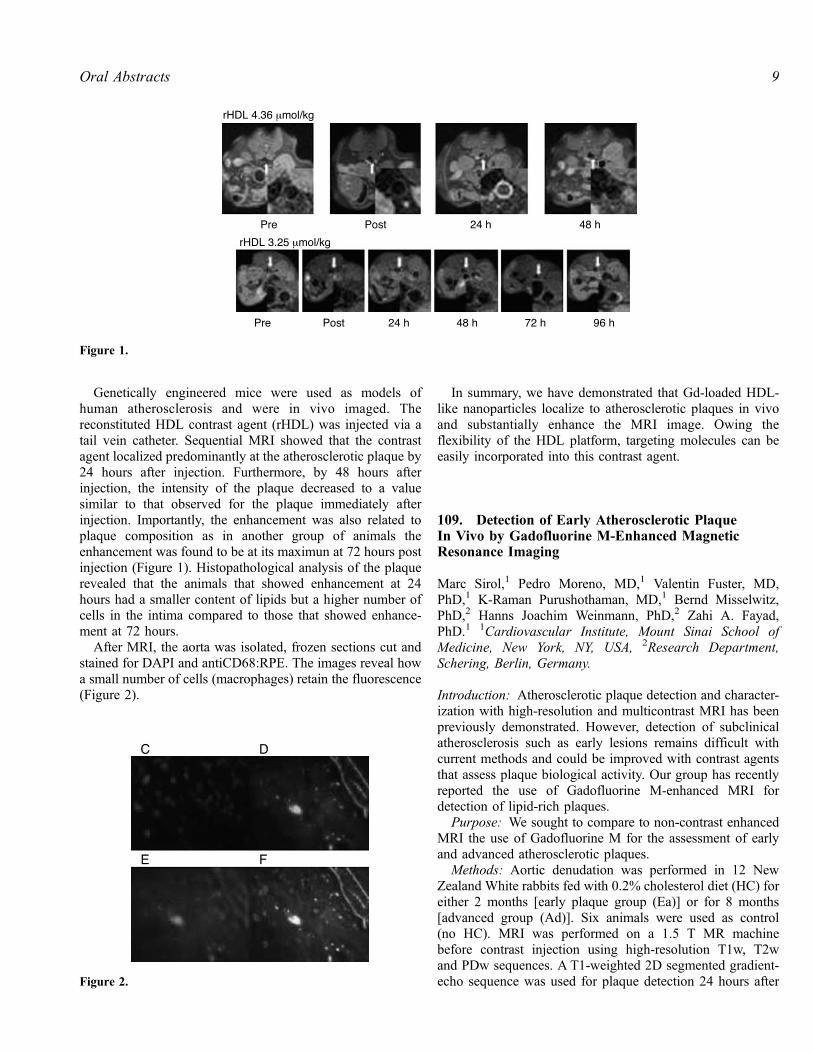
After MRI, the aorta was isolated, frozen sections cut andstained for DAPI and antiCD68:RPE. The images reveal howa small number of cells (macrophages) retain the fluorescence(Figure 2).
In summary, we have demonstrated that Gd-loaded HDL-like nanoparticles localize to atherosclerotic plaques in vivoand substantially enhance the MRI image. Owing theflexibility of the HDL platform, targeting molecules can beeasily incorporated into this contrast agent.
109. Detection of Early Atherosclerotic PlaqueIn Vivo by Gadofluorine M-Enhanced MagneticResonance Imaging
Marc Sirol,1 Pedro Moreno, MD,1 Valentin Fuster, MD,PhD,1 K-Raman Purushothaman, MD,1 Bernd Misselwitz,PhD,2 Hanns Joachim Weinmann, PhD,2 Zahi A. Fayad,PhD.1 1Cardiovascular Institute, Mount Sinai School ofMedicine, New York, NY, USA, 2Research Department,Schering, Berlin, Germany.
Introduction: Atherosclerotic plaque detection and character-ization with high-resolution and multicontrast MRI has beenpreviously demonstrated. However, detection of subclinicalatherosclerosis such as early lesions remains difficult withcurrent methods and could be improved with contrast agentsthat assess plaque biological activity. Our group has recentlyreported the use of Gadofluorine M-enhanced MRI fordetection of lipid-rich plaques.
Purpose: We sought to compare to non-contrast enhancedMRI the use of Gadofluorine M for the assessment of earlyand advanced atherosclerotic plaques.
Methods: Aortic denudation was performed in 12 NewZealand White rabbits fed with 0.2% cholesterol diet (HC) foreither 2 months [early plaque group (Ea)] or for 8 months[advanced group (Ad)]. Six animals were used as control(no HC). MRI was performed on a 1.5 T MR machinebefore contrast injection using high-resolution T1w, T2wand PDw sequences. A T1-weighted 2D segmented gradient-echo sequence was used for plaque detection 24 hours afterFigure 2.
Figure 1.
9Oral Abstracts

50 mmol/kg Gadofluorine M (Schering AG) injection (i.v.).The sequence parameters were as follow: TR/TE = 300/4 ms;flip angle = 20�; BW = ± 230 Hz/pixel; Nex = 16; slicethickness = 2.0 mm; FOV = 12 cm; matrix 256 � 256;number of segments = 15. Histopathological analyses usinghematoxylin and eosin (H&E) stain and Masson’s trichromeelastin stain (CME) were systematically performed.
Results: Plaque enhancement was successful after injec-tion in both Ea and Ad group. Contrast-to-noise ratio (CNR)24 hours after Gadofluorine M injection was significantlyhigher in Ad group compared to Ea group (P< 0.01). Noenhancement was seen in the control animals. AHAclassification revealed type II and III plaque in Ea group,and type Va and Vc plaque in Ad group (P< 0.001). Pre-contrast MRI using multicontrast technique was not able toidentify atherosclerotic plaques in the Ea group compared tothe Ad group (P< 0.001).
Conclusions: We demonstrate the successful use ofGadofluorine M for early plaque detection compared tonon-contrast enhanced MRI. Early lesions could be differen-tiated from advanced plaque according to CNR values afterGadofluorine injection. This approach may be useful in theassessment of atherosclerotic burden in patients at differentstages of the disease.
110. Detection of Macrophage Infiltration WithinAtherosclerotic Plaques as Positive and NegativeContrast by USPIO MRI: Ex Vivo Rabbit Study
Masahiro Terashima, MD, PhD,1 Charles H. Cunningham,PhD,2 Takayasu Arai, MD,1 Paula M. Jacobs, PhD,3 Phillip C.Yang, MD,1 John M. Pauly, PhD,2 Steven M. Conolly, PhD,2
Michael V. McConnell, MD, MSEE.1 1Division of Cardio-vascular Medicine, Stanford University, Stanford, CA, USA,2Department of Electrical Engineering, Stanford University,Stanford, CA, USA, 3Advanced Magnetics, Inc., Cambridge,MA, USA.
Introduction: Inflammation, including macrophage infiltra-tion, is an important feature of vulnerable atheroscleroticplaques. The ultra-small superparamagnetic iron oxide(USPIO) agent ferumoxtran-10 has been shown to be takenup by macrophages in animal and human atherosclerosis, butdetection by MR has relied on imaging areas of signal loss.
Purpose: 1) To study a novel off-resonance MRIsequence, which generates positive contrast of iron oxidecontrast agents, and 2) to investigate the distribution offerumoxtran-10 within the vessel wall, in a balloon-injuredrabbit atherosclerosis model.
Methods: Seven New Zealand White rabbits underwentaortic balloon injury and high-fat diet for 14 or 26 weeks toinduce atherosclerotic plaques and then were sacrificed. Five
days prior to sacrifice, 25 mgFe/kg ferumoxtran-10 (Combi-dex1, Advanced Magnetics, Inc.) was given intravenously.The aorta was removed and underwent perfusion fixation,followed by ex vivo MRI and then histology. MRI wasperformed on a 1.5 T whole-body scanner (GE Signa CV/i)equipped with high-performance gradients (40 mT/m, 150 T/m/ms) using a standard 3-inch surface coil. The positivecontrast off-resonance sequence utilized a spectrally selectiveRF pulse to null on-resonance water (by 120 dB) in order todetect the off-resonance water adjacent to the USPIO-ladencells (TR/TE = 800/14 ms, FOV = 8 cm, Matrix = 256 �128, NEX = 1, offset of � 600 Hz, projection image). Forcomparison, a standard 3D fast gradient-echo sequence wasperformed to visualize the negative contrast T2* effect (TR/TE = 19.1/7.3 ms, NEX = 1, FOV = 8 cm, slice thickness =2.0 mm, Flip angle = 30, Matrix = 512 � 512, in-plane spa-tial resolution = 156 um).
Results: In all rabbits, USPIO-laden areas of the rabbitaorta were seen on MRI as bright signal using the off-resonance sequence, which corresponded to areas of signalloss using the gradient-echo sequence (Figure 1). Histolog-ically, plaque USPIO uptake was noted to be high in thesmaller macrophages localized to the subendothelial area ofthe plaque. The larger lipid-laden foamy macrophages hadmore limited USPIO uptake, particularly in comparison totheir plaque volume (Figure 2).
Conclusions: MRI in conjunction with USPIO can detectplaque macrophage infiltration using a novel positive contrastoff-resonance sequence. Interestingly, there appear to bedifferences in the extent of iron uptake based on the type ofplaque macrophage. These findings may help in furtherdeveloping MR imaging approaches for the detection ofplaque inflammation.
Figure 1. MR images of ex vivo rabbit aorta. A) Conventionalgradient-echo image of an atherosclerotic aortic arch in rabbits withsignal loss in areas of iron oxide uptake. B) Off-resonance image ofthe same specimen with a positive contrast effect seen.
Oral Abstracts10

111. 3-Dimensional Quantification of AtheroscleroticInjury with MRI Molecular Imaging
Tillmann Cyrus, MD, PhD, Shelton D. Caruthers, PhD, JohnS. Allen, BS, Todd Williams, BS, Ralph Fuhrhop, Thomas D.Harris, PhD, Veronica Glattauer, PhD, Jerome Werkmeister,PhD, John A. Ramshaw, PhD, Samuel A. Wickline, MD,Gregory M. Lanza, MD, PhD. Cardiology, WashingtonUniversity, Saint Louis, MO, USA.
Background: Development of interventional MRI is a rap-idly progressing field marked by the development of newcatheters and stents. In contradistinction to classic x-rayangiography, MRI uniquely offers angiography in conjunc-tion with high-resolution characterization of vascular athero-sclerotic changes and wall morphology. In this study, targetednanoparticles are used to define and quantify the spatialdistribution of intramural biochemical signatures in extracel-lular matrix and on smooth muscle cells exposed by balloonoverstretch injury.
Methods and Results: Carotid arteries of 12 domesticpigs were subjected to balloon stretch injury using atranscutaneous approach through the right femoral artery.Using the same femoral artery sheath, a double-balloonmethod was implemented to expose the injured arterialsegments to paramagnetic nanoparticles targeted specificallyto avb3-integrin or collagen III in the injured vessel wall. Ineach pig, one carotid received molecularly targeted nano-particles and the contralateral vessel received either non-targeted nanoparticles or placebo. Carotid arteries underwent
T1-weighted MRI at 1.5 T to define contrast enhancementof vascular injury. Routine time-of-flight MR angiogramswere indistinguishable between control and targeted vesselsegments and did not reveal evidence of the underlyingstretch-induced microfractures. However, avb3-integrin tar-geted and collagen III targeted paramagnetic nanoparticlesdelivered locally penetrated the wall and followed along themicrofractures of the injury. Both formulations providedsignificant contrast enhancement and allowed for determi-nation not only of the volume but also the pattern of thevascular injury. The contrast-to-noise ratio of avb3-integrintargeted nanoparticles (13.8 ± 5.2) was 4-fold greater(p < 0.05) than the collagen III-targeted formulations(3.3 ± 0.3), suggesting a greater retention of the integrin-targeted agent. The estimated length and volume of mural
Figure 2. Histological examination. A) Perl’s iron staining demonstrates iron-containing macrophages seen preferentially in thesubendothelial area of the plaque (magnified in B), but not in the large lipid-laden foamy macrophages (magnified in C). D) RAM-11immunohistochemistry confirms the abundant plaque macrophages.
11Oral Abstracts
microvascular injuries did not differ between the collagen III-and integrin-targeted carotids, which averaged 31 ± 5 mmand 955 ± 234 mm3, respectively. Interestingly, the averagelength of injury was greater than 50% longer than the balloonsize (20 mm). Contrast enhancement was not appreciated inthe control vessels.
Conclusions: Molecular imaging with avb3-integrin-tar-geted or collagen III-targeted nanoparticles enables the non-invasive 3-dimensional characterization of arterial lesionswith MRI. These agents extend the diagnostic and therapeuticpotential opportunities of interventional MR in the setting ofadvanced atherosclerotic disease.
112. Intracellular SodiumMRIDuring Acute RegionalMyocardial Ischemia and Reperfusion
Maurits A. Jansen, PhD, Marcel G.J. Nederhoff, MSc,Cees J.A. van Echteld, PhD. CardioNMR Laboratory, HeartLung Center Utrecht, University Medical Center, Utrecht,The Netherlands.
Introduction: Late enhancement MRI is rapidly becomingthe new gold standard for assessment of myocardial viability.However, several false positives have been reported, mostlikely related to edema. As an alternative we have suggested23Na chemical shift imaging (CSI) because of the rapidchanges of intracellular [Na+] ([Na+]i) during ischemia andreperfusion of viable myocardium. We have previouslyshown that imaging of intra- and extracellular sodium issuperior to total sodium imaging in identifying the affectedzone in chronic myocardial infarction (Jansen et al., 2004a).Furthermore, we found a very good correlation between Na+i-image intensity at the end of global low flow ischemia andrecovery of rate pressure product at the end of reperfusion ofisolated rat hearts (Jansen et al., 2004b). This shows that Na+i-image intensity can predict the ability of myocardial tissue torecover after ischemia.
Purpose: To investigate the potential of 23Na CSI in acuteregional ischemia and reperfusion in isolated rat hearts.
Methods: Data were acquired using a Bruker AVANCE400 spectrometer. Rat hearts were perfused using a dual-perfusion cannula (Avkiran and Curtis, 1991), whichallowed independent perfusion of both sides of the heart.To assess the area at risk, one side of the heart wasperfused with a Gd-DTPA-BMA-containing perfusate and aT1-weighted
1H-image was acquired after 15 min. Next,the contrast agent was omitted and the shift reagentTmDOTP5- was included in the perfusate on both sides toseparate the intra- and extracellular sodium resonance.Subsequently, acquisition-weighted 23Na-CSI (16 � 16,FOV 20 � 20 mm, slice thickness 5 mm, voxel size 7.8ml, 5 min/scan) was performed during control perfusion,ischemia of only the left side of the heart for 40 min (flowto the other side remained unaltered) and reperfusion. Atthe end of the experiment, the right side of the heart wasperfused with methylene blue to determine the area at riskfor histology. Thereafter, the whole heart was perfusedwith 1% triphenyltetrazolium chloride (TTC) to stain theviable tissue.
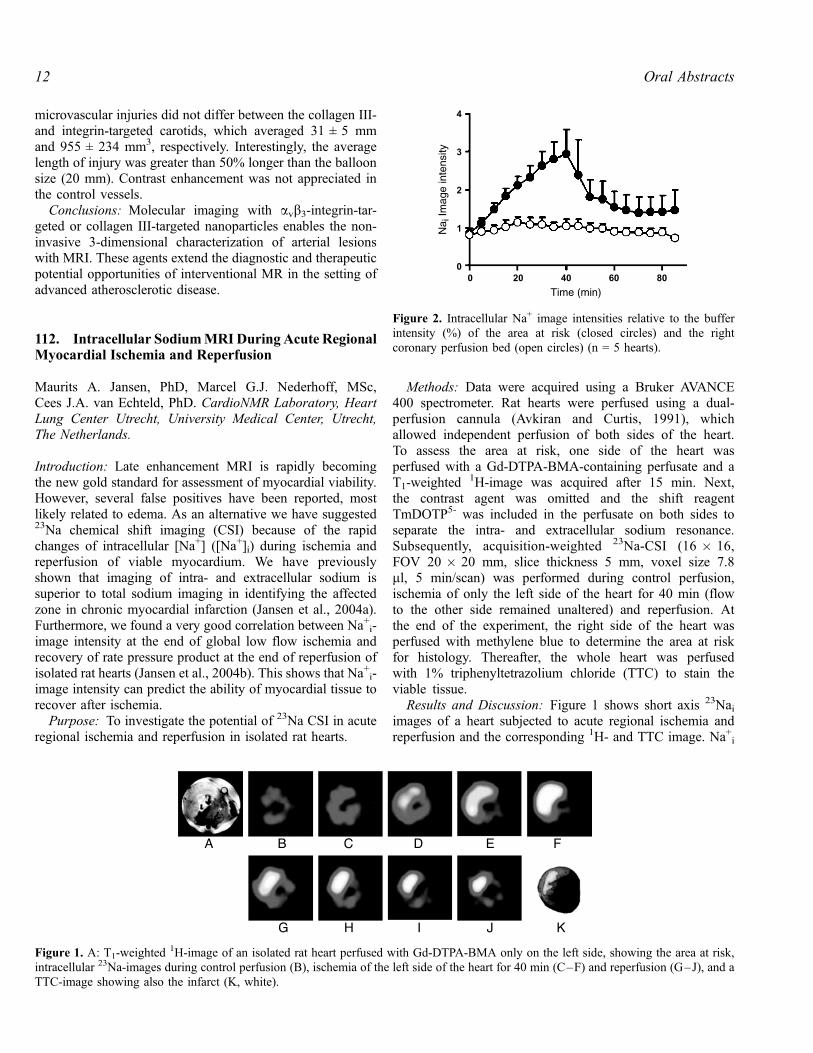
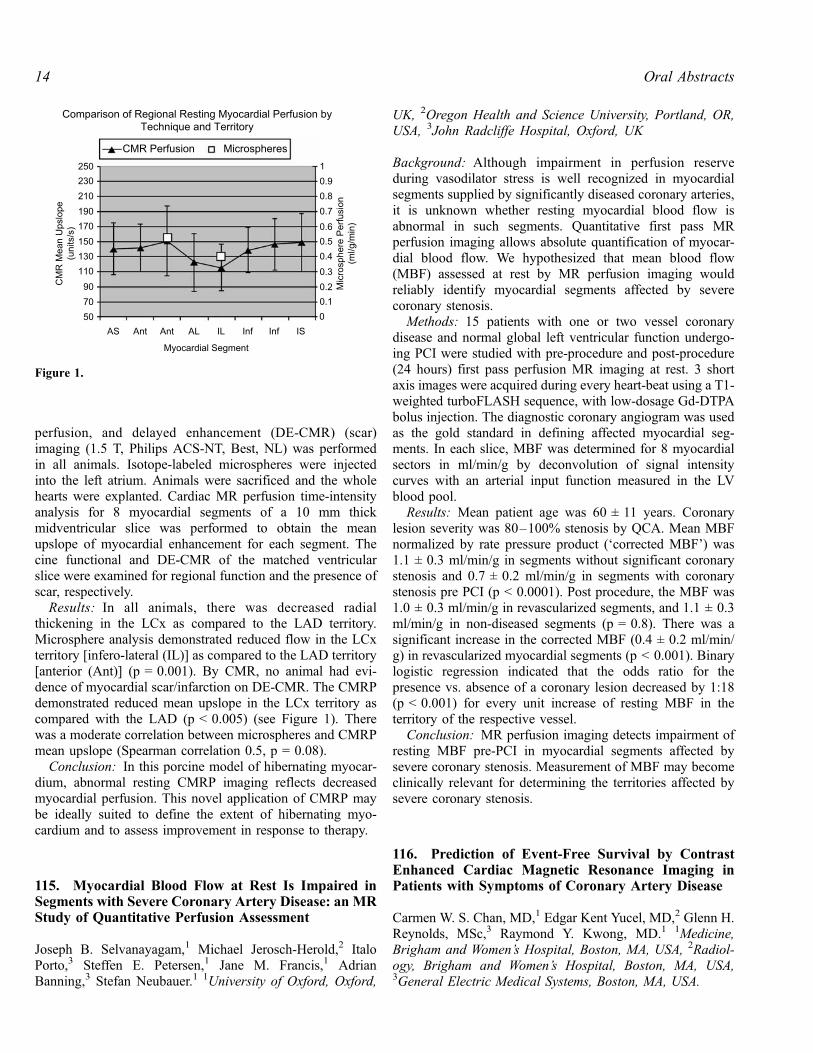
Results and Discussion: Figure 1 shows short axis 23Naiimages of a heart subjected to acute regional ischemia andreperfusion and the corresponding 1H- and TTC image. Na+i
Figure 1. A: T1-weighted1H-image of an isolated rat heart perfused with Gd-DTPA-BMA only on the left side, showing the area at risk,
intracellular 23Na-images during control perfusion (B), ischemia of the left side of the heart for 40 min (C–F) and reperfusion (G–J), and aTTC-image showing also the infarct (K, white).
Figure 2. Intracellular Na+ image intensities relative to the bufferintensity (%) of the area at risk (closed circles) and the rightcoronary perfusion bed (open circles) (n = 5 hearts).
Oral Abstracts12

was already visible during control perfusion. Nai-imageintensity increased significantly during ischemia of the leftside to 345 ± 75% while that of the right side remainedunaltered (Figure 2). During reperfusion, Nai-image intensityreturned to normal in 2 of the 5 hearts. Total23Na imageintensity remained unaltered during the entire protocol in bothsides of the heart. The area on the Nai-image at the end ofischemia with increased Nai-intensity correlated well with theunstained area on the TTC-image (R = 0.73).
Conclusion: These data demonstrate that intracellular23Na-CS-imaging is a promising tool for assessment ofmyocardial viability.
REFERENCES
Avkiran, M., Curtis, M. J. (1991). Am. J. Physiol. 261:H2082–H2090.
Jansen, M. A., Nederhoff, M. G. J., van Echteld, C. J. A. (2004a). J. Cardiovasc.
Magn. Res. 6(1):318.
Jansen, M. A., van Emous, J. G., Nederhoff, M. G. J., van Echteld, C. J. A.
(2004b). Circulation. in press.
113. Prognostic Value of High-Dose DobutamineStress MRI in Coronary Artery Disease: Long-termFollow-Up of Cardiac Events in Patients NotUndergoing Revascularization
Peter Hunold, MD,1 Markus Jochims, MD,2 Oliver Bruder,MD,2 Kai-Uwe Waltering, MD,1 Walter O. Schuler, MD,2
Thomas Schlosser, MD,1 Jorg Barkhausen, MD.1 1Departmentof Diagnostic and Interventional Radiology, UniversityHospital, Essen, Germany, 2Department of Cardiology,Elisabeth Hospital, Essen, Germany.
Introduction: Cardiac Stress MRI using high-dose dobut-amine (DS-MRI) has been established as a reliable techniquefor the assessment of myocardial ischemia in coronary arterydisease (CAD). Beyond the detection of ischemia and theprediction of functional recovery in patients with ischemicglobal or regional dysfunction after revascularization, littleis known about the prognosis of patients suffering fromischemic dysfunction.
Purpose: To evaluate the utility of high-dose dobutaminestress MRI for the assessment of cardiac prognosis in patientswith suspected coronary artery disease.
Methods: High-dose DS-MRI was successfully performedin 384 patients (288 male, 96 female; mean age, 64) withclinically suspected CAD. All examinations were performedon a 1.5 T MR System (Magnetom Sonata; SiemensMedical Solutions; Erlangen, Germany) using a segmentedsteady-state free precession sequence (TrueFISP, TR, 3ms; TE 1.5 ms; FA 60�). A dobutamine/atropine stressprotocol (dobutamine: 10, 20, 30, and 40 mg/kg*min and upto 1 mg of atropine) was used until 85% of the age-predicted heart rate was achieved (220-age). The DS-MRI
examinations were evaluated by an experienced radiologistand a cardiologist in consensus. Myocardial ischemia wasdefined by new or worsening wall motion abnormalitiesunder stress in more than one myocardial segment. Clinicalfollow-up was performed for at least 12 months (mean 16months), and the occurrence of major adverse cardiac events(cardiac death, myocardial infarction, unstable anginarequiring hospitalization and coronary arterial revasculariza-tion) was determined.
Results: In 153 patients, coronary catheter angiographywas performed, and DS-MRI yielded a sensitivity of 86% andspecificity of 88% for the detection of coronary arterystenosis > 70%. 64 of these 153 patients were scheduled forimmediate revascularization and, thus, excluded from thefollow-up study. Therefore, a clinical long-term follow-upcould be performed in 320 patients. In 49 patients, wallmotion abnormalities were detected at DS-MRI. Of these 49patients, 12 (24.5%) had major adverse cardiac events duringthe follow-up time frame, whereas only 23 of 271 patients(8.5%) without wall motion abnormalities had major adversecardiac events within the follow-up period.
Conclusions: High-dose dobutamine stress MRI is arobust and accurate diagnostic test for the assessment ofmyocardial ischemia. Beyond the detection and quantificationof myocardial ischemia, DS-MRI can be used to forecastmajor adverse cardiac events in patients with known orsuspected coronary artery disease.
114. Abnormal Rest Cardiac MR Perfusion IdentifiesHibernating Myocardium in a Porcine Model ofChronic Myocardial Ischemia
Evan Appelbaum, Kraig V. Kissinger, MS, RT, AudreyRosinberg, MD, Pierre Voisine, MD, Thomas H. Hauser, MD,Roger J. Laham, MD, Warren J. Manning, MD, Susan B.Yeon, MD, JD. Cardiology, BIDMC, Brookline, MA, USA.
Background: The identification of chronically underper-fused, hypocontractile (hibernating) myocardium is an im-portant predictor of myocardial recovery following coronaryrevascularization. Resting first-pass cardiac MR perfusion(CMRP) imaging has been used to identify microvascularobstruction (MO) after acute myocardial infarction, howeverits value in the identification of hibernating myocardiumis unknown.
Hypothesis: CMRP correlates with microspheres in de-tecting resting perfusion abnormalities in chronic myocar-dial ischemia.
Methods: 15 Yorkshire pigs underwent cardiac MR(CMR) and coronary angiography(XRA) 3 weeks aftersurgical placement of an ameroid constrictor on the proximalleft circumflex artery (LCx). Ameroid closure was confirmedin all 15 pigs by XRA. Cine functional, first-pass rest
13Oral Abstracts
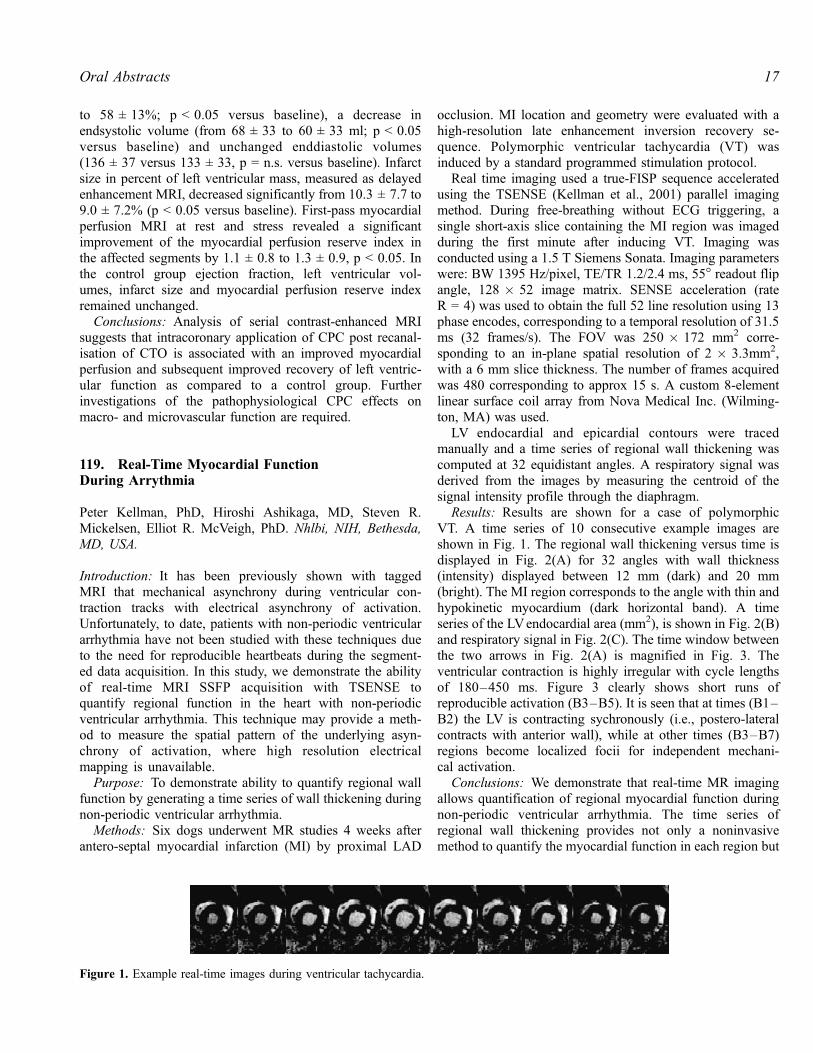
perfusion, and delayed enhancement (DE-CMR) (scar)imaging (1.5 T, Philips ACS-NT, Best, NL) was performedin all animals. Isotope-labeled microspheres were injectedinto the left atrium. Animals were sacrificed and the wholehearts were explanted. Cardiac MR perfusion time-intensityanalysis for 8 myocardial segments of a 10 mm thickmidventricular slice was performed to obtain the meanupslope of myocardial enhancement for each segment. Thecine functional and DE-CMR of the matched ventricularslice were examined for regional function and the presence ofscar, respectively.
Results: In all animals, there was decreased radialthickening in the LCx as compared to the LAD territory.Microsphere analysis demonstrated reduced flow in the LCxterritory [infero-lateral (IL)] as compared to the LAD territory[anterior (Ant)] (p = 0.001). By CMR, no animal had evi-dence of myocardial scar/infarction on DE-CMR. The CMRPdemonstrated reduced mean upslope in the LCx territory ascompared with the LAD (p < 0.005) (see Figure 1). Therewas a moderate correlation between microspheres and CMRPmean upslope (Spearman correlation 0.5, p = 0.08).
Conclusion: In this porcine model of hibernating myocar-dium, abnormal resting CMRP imaging reflects decreasedmyocardial perfusion. This novel application of CMRP maybe ideally suited to define the extent of hibernating myo-cardium and to assess improvement in response to therapy.
115. Myocardial Blood Flow at Rest Is Impaired inSegments with Severe Coronary Artery Disease: an MRStudy of Quantitative Perfusion Assessment
Joseph B. Selvanayagam,1 Michael Jerosch-Herold,2 ItaloPorto,3 Steffen E. Petersen,1 Jane M. Francis,1 AdrianBanning,3 Stefan Neubauer.1 1University of Oxford, Oxford,
UK, 2Oregon Health and Science University, Portland, OR,USA, 3John Radcliffe Hospital, Oxford, UK
Background: Although impairment in perfusion reserveduring vasodilator stress is well recognized in myocardialsegments supplied by significantly diseased coronary arteries,it is unknown whether resting myocardial blood flow isabnormal in such segments. Quantitative first pass MRperfusion imaging allows absolute quantification of myocar-dial blood flow. We hypothesized that mean blood flow(MBF) assessed at rest by MR perfusion imaging wouldreliably identify myocardial segments affected by severecoronary stenosis.
Methods: 15 patients with one or two vessel coronarydisease and normal global left ventricular function undergo-ing PCI were studied with pre-procedure and post-procedure(24 hours) first pass perfusion MR imaging at rest. 3 shortaxis images were acquired during every heart-beat using a T1-weighted turboFLASH sequence, with low-dosage Gd-DTPAbolus injection. The diagnostic coronary angiogram was usedas the gold standard in defining affected myocardial seg-ments. In each slice, MBF was determined for 8 myocardialsectors in ml/min/g by deconvolution of signal intensitycurves with an arterial input function measured in the LVblood pool.
Results: Mean patient age was 60 ± 11 years. Coronarylesion severity was 80–100% stenosis by QCA. Mean MBFnormalized by rate pressure product (‘corrected MBF’) was1.1 ± 0.3 ml/min/g in segments without significant coronarystenosis and 0.7 ± 0.2 ml/min/g in segments with coronarystenosis pre PCI (p < 0.0001). Post procedure, the MBF was1.0 ± 0.3 ml/min/g in revascularized segments, and 1.1 ± 0.3ml/min/g in non-diseased segments (p = 0.8). There was asignificant increase in the corrected MBF (0.4 ± 0.2 ml/min/g) in revascularized myocardial segments (p < 0.001). Binarylogistic regression indicated that the odds ratio for thepresence vs. absence of a coronary lesion decreased by 1:18(p < 0.001) for every unit increase of resting MBF in theterritory of the respective vessel.
Conclusion: MR perfusion imaging detects impairment ofresting MBF pre-PCI in myocardial segments affected bysevere coronary stenosis. Measurement of MBF may becomeclinically relevant for determining the territories affected bysevere coronary stenosis.
116. Prediction of Event-Free Survival by ContrastEnhanced Cardiac Magnetic Resonance Imaging inPatients with Symptoms of Coronary Artery Disease
Carmen W. S. Chan, MD,1 Edgar Kent Yucel, MD,2 Glenn H.Reynolds, MSc,3 Raymond Y. Kwong, MD.1 1Medicine,Brigham and Women’s Hospital, Boston, MA, USA, 2Radiol-ogy, Brigham and Women’s Hospital, Boston, MA, USA,3General Electric Medical Systems, Boston, MA, USA.
Figure 1.
Oral Abstracts14

Introduction: Myocardial delayed enhancement (MDE) bycontrast enhanced cardiac MRI (CMRI) characterizes abnor-mal myocardium from various diseases. Prognostication ofserious cardiac events by MDE, relative to clinical predictors,in patients with symptoms of coronary artery disease (CAD)is not known.
Purpose: To determine the prediction of event-free sur-vival by MDE in patients presented with symptoms of CAD.
Methods: Two hundred and eight-four patients (192 M,mean age 58) presented with symptoms of CAD were re-ferred to undergo CMRI for assessment of myocardial via-bility or detection of myocardial infarction. Clinical historyand ECG were obtained at the time of CMRI. Successfulcontact was achieved in 279 patients (98%). Adverse eventswere defined by death, acute myocardial infarction (MI),unstable angina, and decompensated heart failure requiringhospitalization. Three patients could not perform CMRI dueto claustrophobia. Twenty-seven patients had a history ofCAD and underwent successful coronary revascularizationwithin 60 days prior to CMRI, were excluded from survivalanalysis. The remaining 257 patients formed the study cohort.Patients who underwent successful coronary revascularization
subsequent to study entry at time of CMRI were censored onthe day of coronary revascularization. Univariate hazard ratioanalysis was used to identify significant clinical predictors ofadverse events. Survival curves were performed by theKaplan Meier method and were compared by log-rank testsfor significance. A multivariable Cox proportional hazardregression model with a stepwise forward selection was usedto include the strongest predictors into the model.
Results: Over a mean follow-up of 13.8 months (range6–33 months), 54 (21%) adverse events occurred including30 deaths, 3 acute MI, and 21 unstable angina or decom-pensated congestive heart failure. Results of the univariateanalysis are shown in Table 1. Kaplan Meier curves andresults of the log-rank test were illustrated in Figure 1.Presence of MDE was associated with the highest hazardratio of 5.75 (C.I. 2.88–11.5, p < 0.0001) to the developmentof adverse events. By the multivariable Cox regression model,MDE remained the strongest predictor after adjustment forage, global left ventricular function, prior MI, hypertension,diabetes, and abnormal ECG (Adjusted hazard ratio 3.99,CI 1.67–9.57, p < 0.002).
Conclusions: Myocardial characterization by CMRIstrongly predicts adverse cardiac events in patients withsymptoms of CAD. Prognostication by this technique extendsbeyond the risk prediction by the strongest known factorssuch as age, global left ventricular function, prior MI,hypertension, diabetes, and ECG findings.
117. Combined Use of Adenosine Stress PerfusionMRI and Multislice CT Coronary Angiographyfor Detecting Hemodynamically Significant CoronaryArtery Disease
Okan Ekinci, MD,1 Thorsten Dill, MD,2 Ali Rad,2 JochenHansel, MD,2 Matthias Rau, MD,2 Christian W. Hamm, MD,PhD.2 1Cardiology, German Clinic of Diagnostic, Wiesbaden,Germany, 2Cardiology, Kerckhoff Heart Center, BadNauheim, Germany.
Table 1. Univariate analysis of prediction of adverse events
Hazard ratio Lower limit of 95% CI Upper limit of 95% CI p-Value
Age> 45 men 2.59 1.11 6.05 0.03> 55 womenGender 1.08 0.61 1.92 NSHypertension 2.04 1.18 3.54 0.01Diabetes 2.56 1.48 4.43 0.0008Hypercholesterolemia 1.90 1.05 3.46 0.03Global LV EF < 60% by CMRI 2.18 1.20 3.96 0.01History of Prior MI 3.19 1.85 5.50 < 0.0001CAD on ECG 1.38 1.09 1.74 0.008Myocardial delayed enhancement on CMRI 5.75 2.81 10.59 < 0.0001
Figure 1.
15Oral Abstracts

Introduction: Contrast-enhanced angiography of coronaryarteries using the newest generation of multi-detectorcomputed tomography (CTA) allows detection of bothcalcified and non-calcified coronary artery lesions. On theother hand it is still difficult to assess the grade of stenosis,especially if calcified or mixed plaques are present. Thismakes ruling out hemodynamic significance of borderlinestenoses by CTA impossible. The grade of stenosis issystematically overestimated, leading often to unnecessaryx-ray angiographies.
Purpose: Adenosine stress perfusion MRI is a recentlyintroduced method for myocardial perfusion imaging. Weinvestigated the potential of this novel method as an addi-tional diagnostic tool for assessing hemodynamic significanceof coronary artery stenoses detected by CT angiography.
Methods: 200 consecutive patients (pts, 171 male, 59 ±13 y) with no known coronary artery disease underwentcalcium-scoring analysis and CT coronary angiography(Siemens Sensation Cardiac 16, rotation time 370 ms, colli-mation 0.75 mm, slice width 1 mm). ECG-triggered CTimage acquisition was done after bolus injection of 1 mL/kgbw Iomerone (Imeron 400, Altana Pharma, Germany) at 4 mL/s and 20 mL saline flush.
68 (34%) pts with borderline stenosis or [moderate butdiffuse] or [heavy but circumscript] calcification whichmade stenosis graduation difficult, underwent additionallyadenosine stress MRI (Siemens Sonata, 1.5 T). Afteracquisition of functional cine images in standard orienta-tions, 140 mg/kg body weight adenosine was applied for6 min. After two minutes of infusion, contrast enhancedfirst-pass myocardial perfusion image acquisition was startedusing a ECG-gated breath-hold TrueFISP perfusion se-quence with 3 slices (60 acquisitions) in short axisorientation and application of 0.1 mmol/kg body weightGd-DTPA at 4 mL/s (Magnevist, Schering, Germany).Contrast bolus was chased with 20 mL of saline. Viabilityimaging for detecting areas of delayed hyperenhancementwas done using a 3D-FLASH inversion recovery sequencewith TI 270–300 ms, typically 10-15 min after perfusionimaging. Perfusion imaging at rest was performed finally,especially to rule out susceptebility artifacts.
Results: Out of 68 pts 49 (72%) had diffuse calcification ofcoronary vessels below or within the 75th percentile, 19(28%) exceeded the age related threshold. Mean coronarycalcium score according to Agatston was 280 ± 251.
Stress MRI revealed regional subendocardial perfusiondeficit in 10 out of 68 pts. 2 of these patients showed sub-endocardial myocardial scar. All segments showing perfusiondeficits could be assigned to CT-detected stenoses.
Additional X-ray coronary angiography was done in allpatients with MR detected perfusion deficits. Among others—8 corresponding stenoses ranging from 60–85% (4 LAD, 2CX, 2 RCA) were seen and could be treated by angioplasty. 1occluded side branch (corresponding to a subendocardialinfarction) was found and not interventionally treated.
58 out of 68 pts had no myocardial perfusion deficit or de-layed hyperenhancement and could be treated conservatively.
Conclusions: Multislice CT only is not sufficient todiagnose hemodynamic significance of coronary arterystenoses. Adenosine stress MRI after CTA enables adequateclinical decision making in patients with borderline stenosesor diffuse or circumscript calcified coronary arteries byassessment of hemodynamic significance.
CT and stress MRI provide complementary data andcombined use leads to less radiation exposure by preventingunnecessary X-ray angiographies.
118. Serial Magnetic Resonance Imaging for theAssessment of Myocardial Perfusion, Left VentricularFunction, and Infarct Size After Application ofBlood-Derived Progenitor Cells in RecanalisedChronic Coronary Total Occlusions
Holger Thiele, Karsten Lenk, Sandra Erbs, Volker Adams,Stephan Gielen, Axel Linke, Gerhard Schuler, RainerHambrecht. Cardiology, University of Leipzig-Heart Center,Leipzig, Germany.
Introduction: Magnetic resonance imaging (MRI) is anexcellent diagnostic tool for serial assessment of changes inleft ventricular function, infarct size and myocardial perfu-sion. Circulating progenitor cells (CPC) injected intracoro-nary improve myocardial perfusion and function after acutemyocardial infarction as shown by MRI. If similar effectscan be achieved in chronic total occlusions (CTO), has notbeen studied.
Purpose: Aim of this randomised, placebo-controlled,double-blind study was to evaluate the impact of CPCs onmyocardial perfusion, infarct size and left ventricular functionassessed by MRI after successful recanalisation of a CTO.
Methods: So far 26 patients with reperfused CTO wererandomised to either CPC’s or inactive serum (control), whichwere infused into the target vessel. Patients underwent MRimaging on a 1.5 Tesla MR tomograph at baseline and at 3months follow-up. For the assessment of left ventricularfunction cine loops of the complete heart in short andhorizontal long-axis planes were acquired using a steady-statefree precession technique (TR/TE/flip = 3.2/1.2/60). Addi-tionally, delayed enhancement images covering the wholeventricle were acquired 10–20 min after a double-bolus ofGadolinium-BOPTA (Gadovist, Schering, Germany) using a3 D inversion recovery gradient echo sequence (TR/TE/flip2.8/1.1/15) with the inversion time adapted to null normalmyocardium. Infarct size was determined as the percentage ofthe left ventricular mass. Furthermore, first-pass perfusionimages were acquired with a hybrid TFE-EPI sequence at restand stress using adenosine at standard dose.
Results: Serial MRI revealed a significant increase in leftventricular ejection fraction in the CPC group (from 51 ± 14
Oral Abstracts16
to 58 ± 13%; p < 0.05 versus baseline), a decrease inendsystolic volume (from 68 ± 33 to 60 ± 33 ml; p < 0.05versus baseline) and unchanged enddiastolic volumes(136 ± 37 versus 133 ± 33, p = n.s. versus baseline). Infarctsize in percent of left ventricular mass, measured as delayedenhancement MRI, decreased significantly from 10.3 ± 7.7 to9.0 ± 7.2% (p < 0.05 versus baseline). First-pass myocardialperfusion MRI at rest and stress revealed a significantimprovement of the myocardial perfusion reserve index inthe affected segments by 1.1 ± 0.8 to 1.3 ± 0.9, p < 0.05. Inthe control group ejection fraction, left ventricular vol-umes, infarct size and myocardial perfusion reserve indexremained unchanged.
Conclusions: Analysis of serial contrast-enhanced MRIsuggests that intracoronary application of CPC post recanal-isation of CTO is associated with an improved myocardialperfusion and subsequent improved recovery of left ventric-ular function as compared to a control group. Furtherinvestigations of the pathophysiological CPC effects onmacro- and microvascular function are required.
119. Real-Time Myocardial FunctionDuring Arrythmia
Peter Kellman, PhD, Hiroshi Ashikaga, MD, Steven R.Mickelsen, Elliot R. McVeigh, PhD. Nhlbi, NIH, Bethesda,MD, USA.
Introduction: It has been previously shown with taggedMRI that mechanical asynchrony during ventricular con-traction tracks with electrical asynchrony of activation.Unfortunately, to date, patients with non-periodic ventriculararrhythmia have not been studied with these techniques dueto the need for reproducible heartbeats during the segment-ed data acquisition. In this study, we demonstrate the abilityof real-time MRI SSFP acquisition with TSENSE toquantify regional function in the heart with non-periodicventricular arrhythmia. This technique may provide a meth-od to measure the spatial pattern of the underlying asyn-chrony of activation, where high resolution electricalmapping is unavailable.
Purpose: To demonstrate ability to quantify regional wallfunction by generating a time series of wall thickening duringnon-periodic ventricular arrhythmia.
Methods: Six dogs underwent MR studies 4 weeks afterantero-septal myocardial infarction (MI) by proximal LAD
occlusion. MI location and geometry were evaluated with ahigh-resolution late enhancement inversion recovery se-quence. Polymorphic ventricular tachycardia (VT) wasinduced by a standard programmed stimulation protocol.
Real time imaging used a true-FISP sequence acceleratedusing the TSENSE (Kellman et al., 2001) parallel imagingmethod. During free-breathing without ECG triggering, asingle short-axis slice containing the MI region was imagedduring the first minute after inducing VT. Imaging wasconducted using a 1.5 T Siemens Sonata. Imaging parameterswere: BW 1395 Hz/pixel, TE/TR 1.2/2.4 ms, 55� readout flipangle, 128 � 52 image matrix. SENSE acceleration (rateR = 4) was used to obtain the full 52 line resolution using 13phase encodes, corresponding to a temporal resolution of 31.5ms (32 frames/s). The FOV was 250 � 172 mm2 corre-sponding to an in-plane spatial resolution of 2 � 3.3mm2,with a 6 mm slice thickness. The number of frames acquiredwas 480 corresponding to approx 15 s. A custom 8-elementlinear surface coil array from Nova Medical Inc. (Wilming-ton, MA) was used.
LV endocardial and epicardial contours were tracedmanually and a time series of regional wall thickening wascomputed at 32 equidistant angles. A respiratory signal wasderived from the images by measuring the centroid of thesignal intensity profile through the diaphragm.
Results: Results are shown for a case of polymorphicVT. A time series of 10 consecutive example images areshown in Fig. 1. The regional wall thickening versus time isdisplayed in Fig. 2(A) for 32 angles with wall thickness(intensity) displayed between 12 mm (dark) and 20 mm(bright). The MI region corresponds to the angle with thin andhypokinetic myocardium (dark horizontal band). A timeseries of the LVendocardial area (mm2), is shown in Fig. 2(B)and respiratory signal in Fig. 2(C). The time window betweenthe two arrows in Fig. 2(A) is magnified in Fig. 3. Theventricular contraction is highly irregular with cycle lengthsof 180–450 ms. Figure 3 clearly shows short runs ofreproducible activation (B3–B5). It is seen that at times (B1–B2) the LV is contracting sychronously (i.e., postero-lateralcontracts with anterior wall), while at other times (B3–B7)regions become localized focii for independent mechani-cal activation.
Conclusions: We demonstrate that real-time MR imagingallows quantification of regional myocardial function duringnon-periodic ventricular arrhythmia. The time series ofregional wall thickening provides not only a noninvasivemethod to quantify the myocardial function in each region but
Figure 1. Example real-time images during ventricular tachycardia.
17Oral Abstracts

also the onset of wall thickening and thinning, whichcorresponds to the timing of mechanical activation anddeactivation, respectively.
REFERENCE
Kellman, P., et al. (2001). MRM 45:846–852.
120. MR Phase Contrast Velocity Mapping for theAssessment of Regional Function of the SystemicVentricle in Patients with Transposition of theGreat Arteries
Oliver Wieben, PhD,1 Bernd Jung, MS,1 Petra Mehwald,MD,2 Thorsten Bley, MD,3 Deniz Kececioglu, MD,2 JurgenHennig, PhD.1 1Department of Diagnostic Radiology-MedicalPhysics, University Hospital Freiburg, Freiburg, Germany,2Department of Congenital Heart Disease/Pediatric Cardiol-ogy, University Hospital Freiburg, Freiburg, Germany,
3Department of Diagnostic Radiology, University HospitalFreiburg, Freiburg, Germany.
Introduction: Although an actuarial survival of 75% after25-years has been reported (Oechslin et al., 2000), the verylong-term ability of the right ventricle to support the sys-temic circulation remains unknown. Several studies havedescribed abnormalities in the RV function of such patients.However, functional parameters for assessing the need forsurgical interventions such as conversion to arterial switchor transplantation or drug therapies have not been identi-fied yet. MR Phase contrast (PC) velocity mapping (Marklet al., 2002) is an objective method to quantify segmental
Figure 2. (A) Regional wall thickening vs. time, (B) LV area, (C) respiratory signal.
Figure 3. Regional wall thickening for several beats.
Figure 1.
Oral Abstracts18

myocardial wall motion and was used in this study to evaluateregional function of the systemic ventricle in patients that hadundergone a Senning procedure.
Methods: PC measurements with in-plane velocity encod-ing were performed in short axis views of 5 patients (15–22years) which had a Senning operation as newborns. A spoiledgradient echo sequence with black blood preparation andfirst-order flow compensation in read- and phase encodingdirection for the reduction of flow artifacts was implementedon a 1.5 T Sonata system (Siemens Medical Solutions,Erlangen, Germany) Image acquisition parameters were asfollow: TE/TR = 4.5/6.2 ms, flip angle = 15�, FOV = 300mm � 400 mm, acquisition matrix = 256 � 96, venc = 20cm/s. A temporal resolution of 49–87 ms was achieved withview sharing such that full in-plane velocity information ofthe beating heart was obtained in 13–22 heartbeats within asingle breath-hold measurement. The right ventricular wallwas manually segmented from the magnitude images andradial and tangential velocities were calculated for each ofthose pixels. The segmented RV was divided into 24 angularareas for which radial velocities were averaged and correlatedto a reference time course based on the shape of the waveform(Markl et al., 2002). Positive correlation values correspond tosimilar or hypokinetic motion patterns, while values near zerodescribe akinetic motion and negative values expressdyskinetic RV waveforms. The flow analysis and visualiza-tion was perfomed with a customized software tool written inMatlab (The Mathworks).
Results: All five patients showed a dyskinetic motionpattern of the ventricular wall. Figure 1 contains arepresentative example displaying the radial velocities of amid-ventricular slice where red color represents contraction ofthe myocardium and blue color the expansion. The septummoves toward the LV wall while the RV free wall contractsduring systole (A) and moves back during early diastole (B)while the RV free wall expands. Figure 1C shows thedifferences in the temporal evolutions of the radial velocitiesin the segments of the RV free wall (thick) and the septum(thin). This dyskinetic motion is also displayed in the color-coded correlation plots of radial velocities for various slicelocations and the summarizing bullseye plot in Figure 2A andB, covering the heart from base to apex.
Conclusion: This pilot study demonstrated the feasibilityof PC velocity mapping for the analysis of regional RV
function in patients with transposition of the great arteries. Itwas shown, in agreement with Fogel et al. (1995), that themotion patterns of the systemic RV in Senning patients differsignificantly from those of the normal human LV, where thecontraction of the ventricular wall and the septum occursimultaneously. Further investigations with more patients invarious stages of the remodeling process of the RV ventricleare warranted in order to understand the significance ofthese abnormalities and to assess potential benefits for thera-peutic decisions.
REFERENCES
Fogel, M., et al. (1995). Circulation 92:219–230.
Markl, M., et al. (2002). J. Magn. Reson. Imaging 15:642–653.
Oechslin, E., et al. (2000). Thorac. Cardiovasc. Surg. 48:233–237.
121. Temporal Evolution of Myocardial Dysfunctionin Mice After Reperfused Myocardial Infarction: A3D Deformation Analysis Combined with DelayedEnhancement Infarct Imaging
Alistair A. Young, PhD,1 Brent A. French, PhD,2 ZequanYang, PhD,2 Brett R. Cowan, MbChB,3 Wesley D. Gilson,PhD,2 Stuart S. Berr, PhD,2 Christopher M. Kramer, MD,2
Frederick H. Epstein, PhD.2 1Anatomy with Radiology,University of Auckland, Auckland, New Zealand, 2Radiology,University of Virginia, Charlottesville, VA, USA, 3Medicine,University of Auckland, Auckland, New Zealand.
Introduction: The mouse animal model is increasingly beingused to investigate both the genetics and pharmacologictherapy of left ventricular (LV) remodeling after myocardialinfarction (MI). Local changes in contractile function (strain)after MI can be quantified using 2D and 3D magneticresonance (MR) tagging (Epstein et al., 2002; Young et al.,2004). However, to date, the 3D deformation pattern of themouse heart has not been described with respect to the 3Dextent of the region of infarction.
Purpose: 1) To extend a previously described method of3D modeling of LV dysfunction (Young et al., 2004) to aregional analysis with regard to infarcted and noninfarctedareas of interest. 2) To develop tools to construct a 3D modelof the infarcted area from multislice delayed enhancement(DE) infarct imaging. 3) To report 3D deformation parameterswith respect to infarcted and noninfarcted areas over the first28 days following MI.
Methods: Five C57BL/6 mice were used in this study,which was approved by the Institutional Animal Care and UseCommittee. MI was surgically induced by 60 min occlusionof the left anterior descending coronary artery followed byreperfusion as described previously (Epstein et al., 2002).MRI was performed on a 4.7 T Varian scanner using aFigure 2.
19Oral Abstracts

custom-made birdcage RF coil. Mice were imaged atbaseline, and at 1, 7 and 28 days after MI. The MR protocolincluded: 1) localizer scanning; 2) short-axis (8 slices) andlong-axis (4 slices) imaging with black-blood myocardialtagging; 3) high flip-angle (60�) DE infarct imaging after IPinjection of 0.4 mmol/kg Gd-DTPA. Three dimensionaldisplacements of the tags were tracked in all images and a3D finite element model of the LV was used to reconstruct the3D deformation and strain, as described previously (Younget al., 2004). The finite element model was used to reconstruct3D deformation and strain using 16 regional segments. Gd-enhanced areas were mapped onto the Day 1 heart models,and infarcted segments were defined as those with > 50%enhancement. In addition, areas of enhancement wereoutlined on multislice short axis DE images, and the infarctedregion was indicated by a 3D bounding region on a polarbullseye projection map. The infarct zone was then mappedonto the FE model, so that the boundary points becomematerial points which move with the deformation of the heart.The 3D material boundary was then used to calculate regionalstrains on the basis of infarcted region (within the boundary)or noninfarcted region (outside the infarct boundary).
Results: Figure 1 (left) shows the finite element model ofthe LVat end systole on Day 1, where + signs denote the edgeof the infarct at end-diastole, crosses denote principal strainsand color denotes maximal shortening (blue � 0.2, red 0.0).The graph (Figure 1, right) reports principal 3D strain ininfarcted and non-infarcted segments over time after MI. MIcaused a permanent loss of principal 3D strain in infarctedsegments. In non-infarcted segments, 3D strain was signifi-cantly depressed on Day 1 post-MI, and then recovered tobaseline levels at Days 7 and 28.
Conclusions: This study illustrates how 3D analyses ofmyocardial infarction from multislice DE imaging can be
combined with strain information from multislice MRtagging, and applied in mice to study LV dysfunction post-MI. These quantitative tools will prove useful in determiningthe effects of genetic manipulation and/or pharmacologictherapy on LV remodeling.
REFERENCES
Epstein, F. H., et al. (2002). Magn. Reson. Med. 48:399–403.
Young, A. A., et al. (May 2004). Proc. ISMRM, 1792, Kyoto.
122. Matched Cine DENSE and Contrast-EnhancedCMR Identify Heterogeneity of Function inNoninfarcted Regions After Myocardial Infarction
Frederick H. Epstein,1 Nicholas C. Nacey, BS,2 Szilard Voros,MD,2 Xiaodong Zhong, MS,1 Elizabeth A. Cowart, MS,1
Christopher M. Kramer, MD.3 1Radiology and BiomedicalEngineering, University of Virginia, Charlottesville, VA, USA,2Medicine, University of Virginia, Charlottesville, VA, USA,3Radiology and Medicine, University of Virginia, Charlottes-ville, VA, USA.
Introduction: Cine displacement-encoded imaging usingstimulated echoes (cine DENSE) is a new technique forquantitation of intramyocardial displacement and strainwith high spatial resolution and automated analysis aftermanual LV segmentation (Kim et al., 2004). While strainanalysis of cine DENSE has been validated vs. myocardialtagging in normal volunteers (Kim et al., 2004), thistechnique has not yet been evaluated in patients withischemic heart disease.
Figure 1.
Oral Abstracts20

Purpose: To demonstrate the feasibility of applying cineDENSE in patients with myocardial infarction (MI) andsubsequently test the hypothesis that matched cine DENSEand delayed contrast-enhanced CMR could identify hetero-geneity of function within noninfarcted regions.
Methods: Thirteen patients (age 53 ± 9, 10 male) withreperfused first MI (5 anterior, 8 inferior, troponin 86 ± 136,week 6 ± 6 post-MI) underwent cine SSFP, cine DENSE, andcontrast-enhanced inversion-recovery gradient echo CMR ona 1.5 T Siemens Sonata. In addition, 6 normal subjectsunderwent cine DENSE and cine SSFP imaging. The cineDENSE sequence used in this study employed single-echoSSFP for signal generation as described previously (Cowartet al., 2004), instead of using multishot EPI (Kim et al.,2004). Specific cine DENSE parameters included FOV =
360 mm, matrix = 128 � 96, slice thickness = 8 mm, TR =3.8 ms, TE = 1.9 ms, flip angle = 25�, segments = 16,cardiac phases = 12–16, and displacement encoding fre-quency = 0.44 rad/mm. Matched cine DENSE, SSFP, andcontrast-enhanced images were acquired in 2–3 short-axisplanes. Multiphase DENSE images were analyzed offlineusing custom-written software developed in MATLAB. Foreach cardiac phase, a 2D displacement map and 2D myo-cardial strain maps were automatically computed from phase-reconstructed DENSE images after manual segmentation ofthe LV from a magnitude-reconstructed DENSE image. The2D strain tensor was computed for each 4-pixel neighborhoodof myocardium using finite element methods. Next, regionsof hyperenhancement on matched contrast-enhanced imageswere used to define infarcted (hyperenhanced), adjacent (2 cm
Table 1. Regional circumferential strain (Ecc)
Normal subjects Patients infarct Patients adjacent Patients remote
Ecc �0.19 ± 0.02 �0.03 ± 0.04* �0.08 ± 0.04*,# �0.17 ± 0.04#,y
*p < 0.05 vs. normal subjects.#p < 0.05 vs. infarct.yp < 0.05 vs. adjacent.
Figure 1.Matched images from a patient with inferior myocardial infarction. Cine SSFP is shown in (A), delayed contrast enhanced CMR isshown in (B), a DENSE displacement map is shown in (C), and a second principal strain map is shown in (D). The location of the wallmotion defect agrees with and extends beyond the region of delayed hyperenhancement.
21Oral Abstracts

border zone), and remote zones. Mean circumferential strain(Ecc) was then computed for the three distinct zones byapplying the zone classifications to the strain maps. Significantdifferences in strain between the three zones from MI patientsand between normal volunteers was assessed by one-wayanalysis of variance.
Results: Example data demonstrating inferior wall MIwith subendocardial hypenhancement is shown in Figure 1.Specifically, the end systolic phase from cine SSFP is shownin (A), subendocardial delayed hyperenhancement is shownin (B), an end-systolic DENSE displacement map is shown in(C), and an end-systolic DENSE second principal strain mapis shown in (D). Cine DENSE displacement movies clearlydepicted the temporal evolution of reduced intramyocardialmotion within regions of delayed hyperenhancement andabnormal regional twist patterns around the border zones ofthe infarcts. Data summarizing circumferential strain innormal subjects and patients post-MI are provided in Table 1.
Conclusions: This is the first demonstration that cineDENSE can be used to quantify myocardial displacement andstrain at high spatial resolution in patients with MI. Matchedcine DENSE and contrast-enhanced CMR detect dysfunctionwithin adjacent noninfarcted myocardium post-MI. Together,these techniques could prove useful in the testing of efficacyof novel therapies in patients with MI.
REFERENCES
Cowart, E. A., Gilson, W. D., Kramer, C. M., Epstein, F. H. (2004). Imaging 3D
myocardial motion with cine SSFP DENSE. Proc. Int. Soc. Magn. Reson.
2660.
Kim, D., Gilson, W. D., Kramer, C. M., Epstein, F. H. (2004). Myocardial tissue
tracking with two-dimensional cine displacement-encoded MR imaging:
development and initial evaluation. Radiology 230:862–871.
123. Comparison of Peak Velocities in the AscendingAorta Detected by k-t BLAST Accelerated MR-FVEand Echocardiography
Christof Baltes,1 Michael Schacht Hansen,2 Jeffrey Tsao,PhD,3 Sebastian Kozerke, PhD,1 Klaas P. Pruessmann, PhD,1
Erik M. Pedersen, PhD,2 Peter Boesiger, PhD.1 1Institute forBiomedical Engineering, University and ETH Zurich, Zurich,Switzerland, 2MR-Centre, Skejby Hospital, Aarhus UniversityHospital, Aarhus, Denmark, 3Novartis Institutes for BioMed-ical Research, Inc. (NIBRI), Cambridge, MA, USA.
Introduction: For quantifying aortic valve stenosis, MRphase-contrast (PC) velocity measurements have beencompared to echocardiography as the clinical standard routine(Caruthers et al., 2003). Although a good correlation betweenMR and echocardiography was found, PC measurementstended to underestimate the actual peak velocities. Fourier
velocity encoding (FVE) (Moran, 1984) allows accurate peakvelocity determination, but standard FVE scans are usuallynot applicable in cardiac applications due to their longacquisition times.
In this project, the FVE data collection was accelerated byup to 16-fold using the k-t BLAST framework. In phantomexperiments, non-accelerated and accelerated FVE measure-ments were compared to ultrasound, to validate the accuracyof peak velocity detection. Initial in-vivo results wereacquired in the ascending aorta of a healthy volunteer, forwhich data from single breath-hold FVE scans werecompared to echocardiography.
Methods: Acquiring high resolution FVE data leads tolong acquisition times due to the additional encoding alongone or more velocity dimensions. For natural objects, theraw FVE data typically exhibit a significant correlation intime, space and velocity (Fig. 1A). This correlation can beexploited to accelerate the data collection using the k-t BLASTapproach (Fig. 1B) (Hansen et al., 2004; Tsao et al., 2003).
In phantom experiments, the accuracy of the acceleratedFVE scans was investigated by comparing the determined peakvelocities with results from Doppler ultrasound. Forthis purpose, physiological, pulsatile flows were generated intubes with inner diameters of 8 mm and 20 mm and varyingdegrees of area stenosis (0%, 25%, 50%, 75%, 90%) resultingin peak velocities from 30 to 550 cm/s. MR scans were per-formed on a Philips Intera 1.5 T system with the follow-ing parameters: FOV: 58 mm � 230 mm, resolution:0.9 � 0.9 � 5mm3, TE/TR: 4.0–7.1/12.0ms.Non-angulated,
Figure 1. A) Sparse signal distribution in x-v-t space and incorresponding x-v-f space B) Non-accelerated and accelerated dataacquisition and the corresponding reconstruction scheme accordingto the k-t BLAST framework.
Oral Abstracts22

pulsed wave Doppler measurements were performed using astandard General Electric Vivid 7 system.
In order to enable single breath-hold acquisitions in theascending aorta, the spatial in-plane resolution of theaccelerated FVE scans was reduced. To evaluate the effectof the larger image voxel on the peak velocity detection, theexperiments were repeated with the following settings: FOV:227 � 330 mm, resolution: 2.6 � 2.6 � 5 mm3, TE/TR:3.0–6.0/5.2–7.3 ms. In addition, peak velocities were
determined with MR-PC velocity mapping (FOV: 58 � 230mm, resolution: 0.4 � 0.4 � 5 mm3, TE/TR: 4.3–5.3/12.0ms, 2 averages).
In-vivo FVE data were collected in the ascending aorta ofa healthy volunteer using acceleration factors 8 and 16 andcompared to echocardiography.
Results: A good agreement of the peak velocities detectedwith Doppler ultrasound and non-accelerated MR-FVE wasfound (Fig. 2A). Accelerated FVE (Fig. 2B) underestimatedthe peak velocities only slightly (� 10%) in the range from30 to 350 cm/s, while significant underestimation (> 10%)occurred over 350 cm/s. Figure 2C shows peak velocities overtime measured in a 20 mm tube with 75% stenosis using low-resolution MR-FVE and conventional MR-PC. Even withlarger voxel volumes, the peak velocities detected withaccelerated MR-FVE stayed within 10% of the values fromthe high-resolution, non-accelerated scan, while standardMR-PC exceeds the 10% limit (Fig. 3).
Figure 2. A) Bland-Altman graph comparing peak velocitiesdetected by Doppler ultrasound (US) against non-accelerated MR-FVE (FVE). B) Comparison of normalized peak velocities at peaksystole detected using accelerated MR-FVE against reference value(= mean of ultrasound and non-accelerated MR-FVE).
Figure 3. Peak velocity measurement in the ascending aorta of ahealthy volunteer: A) Comparison of Doppler ultrasound (back-ground) and 8-fold accelerated MR-FVE (white line). Detected peakvelocity at peak systole: 104 cm/s using 8-fold accelerated MR-FVEand 108 cm/s using ultrasound. B) Ultrasound compared to 8-foldand 16-fold accelerated MR-FVE acquired in one single breath-holdof 21s and 17s, respectively.
23Oral Abstracts

In in-vivo measurements in the ascending aorta, Dopplerultrasound and 8-fold and 16-fold accelerated MR-FVEcompared well resulting in peak velocities at peak systoleof 104/100 cm/s [MR-FVE (8-/16-fold)] and 109 cm/s(ultrasound), respectively.
Discussion: In this work, the acquisition time of MR-FVE measurements was drastically reduced using the k-tBLAST framework.
Phantom experiments showed that peak velocities detectedby accelerated FVE scans remained accurate (deviation:� 10%) below 350 cm/s. Above 350 cm/s, significantdeviations occur due to the temporal low-pass filteringresulting from the k-t BLAST reconstruction. Even low-resolution FVE scans deviated less than 10% and weresuperior to PC velocity mapping.
Initial in-vivo experiments showed promise for accuratedetection of peak velocities within a clinically relevanttimeframe using k-t BLAST accelerated MR-FVE.
REFERENCES
Caruthers, S. D., et al. (2003). Circulation 108:2236–2243.
Hansen, M. S., et al. (2004). Proc. ESMRMB (146).
Moran, P. R. (1984). MRM 1(4):197–203.
Tsao, J., et al. (2003). MRM 50(5):1031–1042.
124. Cardiac-Output Measurement in 5 SecondsUsing Ungated Spiral Phase-Contrast
Jong B. Park,1 Bob S. Hu,2 Juan M. Santos,1 Krishna S.Nayak,3 Girish Narayan,4 Dwight G. Nishimura.1 1ElectricalEngineering, Stanford University, Stanford, CA, USA,2Cardiovascular Medicine, Palo Alto Medical Foundation,Stanford, CA, USA, 3Electrical Engineering, University ofSouthern California, Los Angeles, CA, USA, 4CardiovascularMedicine, Stanford University, Stanford, CA, USA.
Introduction: Cardiac output (CO) is a key indicator forassessing all cardiovascular diseases. However, no reliablenon-invasive method exists for measuring CO dynamically. Atechnique called ungated spiral phase-contrast (USPC) hasbeen shown to rapidly measure accurate volume flow rateswithout cardiac-synchronization in peripheral arteries. In thiswork, we modified USPC for successful CO application. Tensubjects including one patient with patent ductus arteriosus(PDA) were scanned.
Purpose: To show that USPC can be a fast and robust MRImethod for measuring CO.
Methods: USPC uses spiral readouts and temporal aver-aging for calculating through-plane-direction time-averagedvolume flow. To accurately measure CO at the ascendingaorta (AA), following modifications were made to USPC:short 480us RF-pulse, 10 degree flip, axial imaging slice atthe iso-center, 24 cm FOV, 2 mm spatial resolution, and short
TR of 12 ms with N = 12 interleaved spiral readouttrajectories. The short RF-pulse, low flip angle, andimaging-slice orientation were chosen to minimize possibleerrors from AA flow itself and from gradients. Compared tothe original USPC, FOV, spatial resolution, TR, and N aretailored to AA (highly pulsatile flow and larger vessel size),while keeping the high temporal sampling rate of flow-encodings (i.e., using the short TR).
Triggered real-time steady-state-free-precession (RT-SSFP)imaging is used as the gold standard. RT-SSFP can measureleft-ventricle (LV) stroke-volumes, which can be then usedto indirectly compute CO in subjects without regurgitantflow at the aortic valve. With RT-SSFP, cardiac-gated movieloops of 10 slices covering LV are acquired in breath-holds of10 R–R intervals.
For each subject, USPC and RT-SSFP are repeated 3 and 2times, respectively. The total scan-times were 5 seconds withUSPC and 10–20 heartbeats with RT-SSFP. With the PDApatient, the cardiac-catheterized Fick method was also used asa reference. In a 28-second continuous scan, the data isaveraged with 5-second window to produce temporallyresolved CO.
Oral Abstracts24
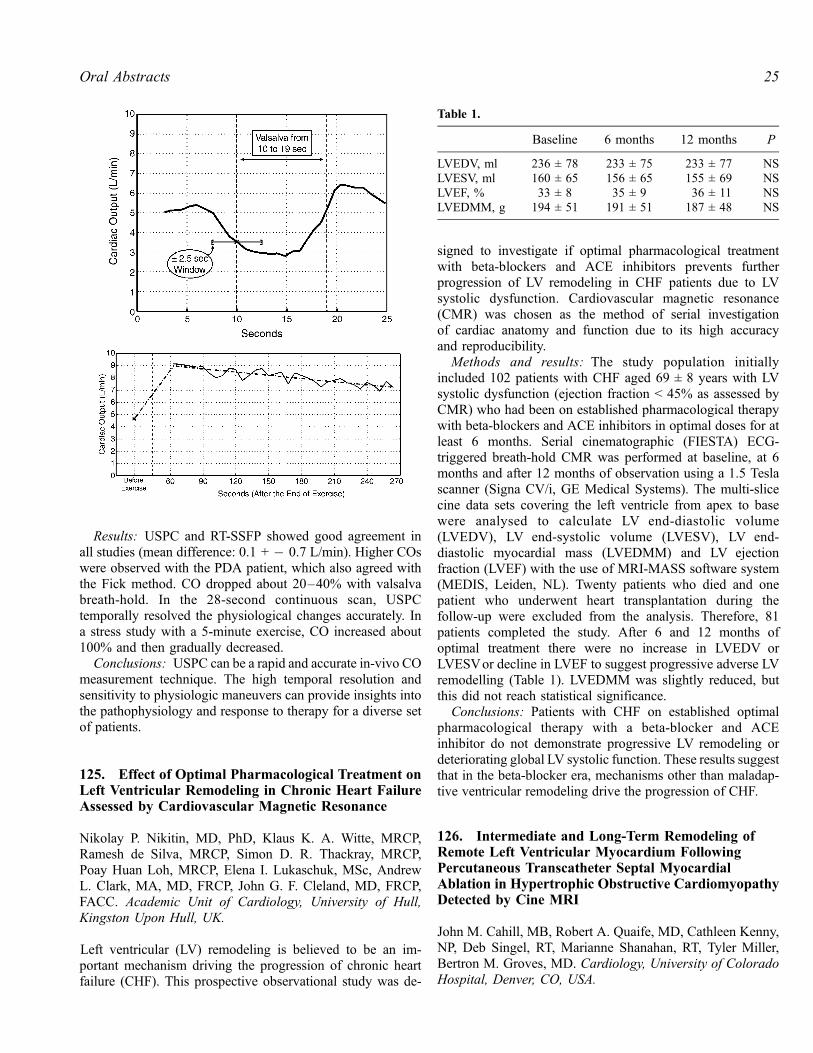
Results: USPC and RT-SSFP showed good agreement inall studies (mean difference: 0.1 + � 0.7 L/min). Higher COswere observed with the PDA patient, which also agreed withthe Fick method. CO dropped about 20–40% with valsalvabreath-hold. In the 28-second continuous scan, USPCtemporally resolved the physiological changes accurately. Ina stress study with a 5-minute exercise, CO increased about100% and then gradually decreased.
Conclusions: USPC can be a rapid and accurate in-vivo COmeasurement technique. The high temporal resolution andsensitivity to physiologic maneuvers can provide insights intothe pathophysiology and response to therapy for a diverse setof patients.
125. Effect of Optimal Pharmacological Treatment onLeft Ventricular Remodeling in Chronic Heart FailureAssessed by Cardiovascular Magnetic Resonance
Nikolay P. Nikitin, MD, PhD, Klaus K. A. Witte, MRCP,Ramesh de Silva, MRCP, Simon D. R. Thackray, MRCP,Poay Huan Loh, MRCP, Elena I. Lukaschuk, MSc, AndrewL. Clark, MA, MD, FRCP, John G. F. Cleland, MD, FRCP,FACC. Academic Unit of Cardiology, University of Hull,Kingston Upon Hull, UK.
Left ventricular (LV) remodeling is believed to be an im-portant mechanism driving the progression of chronic heartfailure (CHF). This prospective observational study was de-
signed to investigate if optimal pharmacological treatmentwith beta-blockers and ACE inhibitors prevents furtherprogression of LV remodeling in CHF patients due to LVsystolic dysfunction. Cardiovascular magnetic resonance(CMR) was chosen as the method of serial investigationof cardiac anatomy and function due to its high accuracyand reproducibility.
Methods and results: The study population initiallyincluded 102 patients with CHF aged 69 ± 8 years with LVsystolic dysfunction (ejection fraction < 45% as assessed byCMR) who had been on established pharmacological therapywith beta-blockers and ACE inhibitors in optimal doses for atleast 6 months. Serial cinematographic (FIESTA) ECG-triggered breath-hold CMR was performed at baseline, at 6months and after 12 months of observation using a 1.5 Teslascanner (Signa CV/i, GE Medical Systems). The multi-slicecine data sets covering the left ventricle from apex to basewere analysed to calculate LV end-diastolic volume(LVEDV), LV end-systolic volume (LVESV), LV end-diastolic myocardial mass (LVEDMM) and LV ejectionfraction (LVEF) with the use of MRI-MASS software system(MEDIS, Leiden, NL). Twenty patients who died and onepatient who underwent heart transplantation during thefollow-up were excluded from the analysis. Therefore, 81patients completed the study. After 6 and 12 months ofoptimal treatment there were no increase in LVEDV orLVESVor decline in LVEF to suggest progressive adverse LVremodelling (Table 1). LVEDMM was slightly reduced, butthis did not reach statistical significance.
Conclusions: Patients with CHF on established optimalpharmacological therapy with a beta-blocker and ACEinhibitor do not demonstrate progressive LV remodeling ordeteriorating global LV systolic function. These results suggestthat in the beta-blocker era, mechanisms other than maladap-tive ventricular remodeling drive the progression of CHF.
126. Intermediate and Long-Term Remodeling ofRemote Left Ventricular Myocardium FollowingPercutaneous Transcatheter Septal MyocardialAblation in Hypertrophic Obstructive CardiomyopathyDetected by Cine MRI
John M. Cahill, MB, Robert A. Quaife, MD, Cathleen Kenny,NP, Deb Singel, RT, Marianne Shanahan, RT, Tyler Miller,Bertron M. Groves, MD. Cardiology, University of ColoradoHospital, Denver, CO, USA.
Table 1.
Baseline 6 months 12 months P
LVEDV, ml 236 ± 78 233 ± 75 233 ± 77 NSLVESV, ml 160 ± 65 156 ± 65 155 ± 69 NSLVEF, % 33 ± 8 35 ± 9 36 ± 11 NSLVEDMM, g 194 ± 51 191 ± 51 187 ± 48 NS
25Oral Abstracts

Introduction: Percutaneous Transcatheter Septal Myocar-dial Ablation (PTSMA) has been shown to reduce leftventricular outflow (LVOT) gradient in patients withhypertrophic obstructive cardiomyopathy (HOCM) and leadsto symptomatic improvement with reduction in NYHA classin many cases. Recent data suggest that geographicalvariations in infarct position within the interventricularseptum (IVS) may affect LV remodeling and outcome,depending upon infarct location of the right, left or transmuralseptal regions.
Purpose: To establish the contribution of remote LVremod-eling to reduction in LV mass in the intermediate and longterm following successful (transmural or left-septal) PTSMA.
Methods: As part of an ongoing study, cardiac MRI studieswere performed pre-PTSMA and at 3 and 12 monthsfollowing the procedure. LV mass, ejection fraction (EF),end-diastolic (EDV) and end-systolic (ESV) volumes werecalculated from True FISP gated, single breath-hold cineimages in the short axis plane using a 1.5-T magnet. Atfollow-up studies, a bolus of 0.1 mmol/Kg of Gadolinium-DTPAwas administered, with infarct size and position withinthe IV septum (transmural, left septal or right septal) assessedusing a segmented inversion-recovery turboFLASH sequencein short and long axis views with delayed contrastenhancement at 10 minutes and appropriate TI correction.
Using ARGUS software (Siemens Medical), baseline shortaxis slices were mounted on a split-screen viewer beside thecorresponding follow-up study and the corresponding con-trast-enhanced infarct short-axis 8 mm slices.
Epicardial and endocardial borders were traced by manualplanimetry. To correct for thinning in the region of theinfracted target area, we reprocessed the post-PTSMA studies,this time following the pre-PTSMA endo- and epicardialborder contours, using baseline septal thickness and visualprompts as a guide.
LV mass and volumes derived from this correctivetechnique were compared to the pre-PTSMA data, with anyreduction from baseline in mass observed being attributed toremote LV remodeling. Baseline values were compared to3-month (intermediate) and 12 month (long-term) data withand without correction for thinning and volume loss in theinfarct zone.
Results: Of 51 PTSMA procedures in 44 patients, MRIdata at baseline and follow-up were available in 20. Of these,5 cases resulted in infarction of the right septum only, with 2of these requiring repeat PTSMA for optimal symptomaticimprovement. This group is not included in the resultspresented in this abstract. Successful PTSMA resulted in asignificant reduction in LV outflow tract gradient in the other15 cases (77 ± 42 to 17 ± 12 mmHg, p < 0.001), thereforeintermediate data were available in 15 patients and long-termdata in 8.
Absolute LV mass was significantly reduced (281 ± 96 to225 ± 79 g, p = 0.0003) at 3 months, even after correction forinfarct thinning (281 ± 96 to 251 ± 86 g, n = 15, p = 0.008),
with further mass reduction from 3 to 12 months (245 ± 86 to229 ± 70 g, n = 8, p = 0.08).
No significant changes were noted in LV volumes or LVEFat 3-month follow-up (LVEF 73 ± 7 to 70 ± 3%, p = ns; EDV70 ± 15 to 72 ± 18 ml, p = ns; ESV 22 ± 7 to 22 ± 7 ml,p = ns) or at 1 year. Infarct volume was smaller as determinedby delayed contrast enhancement between 3 and 12 monthfollow up studies (13.1 ± 6.1 ml to 8.7 ± 3 ml, p = 0.02).
Conclusions: Following successful PTSMA, reduction inLV mass is significantly more than could be accounted for byinfarct thinning alone, suggesting remote LV remodelingwhich continues beyond 3 months.
127. Human Infarct Resorption Patterns andLong-Term Ventricular Remodeling FollowingMyocardial Infarctions of Varying Size
Paula Tejedor, MD, Edwin Wu, MD, Chiara Bucciarelli-Ducci, MD, Daniel C. Lee, MD, Preeti Kansal, MD, James C.Carr, MD, Thomas A. Holly, MD, Francis J. Klocke, MD,Robert O. Bonow, MD. Northwestern University, Chicago,IL, USA.
Introduction: Limitation of acute myocardial infarct size isthe goal of all reperfusion therapies in order to improve long-term outcome. Accurately measuring acute infarct and non-infarct sizes is necessary to monitor the potential of futuretherapeutic interventions. Contrast enhanced MRI (ceMRI)has the ability to identify the extent of acute and chronicmyocardial infarcts (MI). This long-term, clinical studydescribes the pattern of infarct healing and its effects onventricular remodeling in humans after a MI.
Methods: We studied 56 subjects using cine and ceMRIwithin 7 days and 218 ± 174 days following an acute MI. 48of the 56 subjects presented with an ST segment elevation MI.All subjects underwent emergent or urgent revascularizationand had documented elevation in cardiac enzymes. Delayed,contrast-enhanced images were obtained using an inversion-recovery, segmented turboFlash sequence following gadolin-ium contrast. Images were obtained 15 to 20 minutesfollowing hand-bolus injection. The inversion time(TI = 250–350 ms) was progressively optimized to nullnormal myocardium. Left ventricular ejection fraction (EF),left ventricular mass and thickness of remote, non-infarctedmyocardium were measured. Infarct areas were analyzed fortransmural thickness, endocardial length, and infarct mass asa percentage of total LV mass. The radial extent of theinfarction was expressed as a fraction of the remote wallthickness, and the endocardial circumferential ratio was thelength of the short-axis endocardial hyperenhancement overthe full endocardial circumference.
Results: The mean initial EF was 42 ± 12% (range from17% to 55%). The mean EF during the follow-up
Oral Abstracts26

examination improved to 47 ± 13% (p = 0.03). The initialinfarct mass represented 27 ± 22% of the total LV mass,and it decreased to 21 ± 17% (p < 0.001) in the follow-upstudies. Decreases in infarct size varied inversely with infarctsize (y = 0.184 Ln(x) � 0.057, r = 0.6). The radial trans-mural extent also decreased by 26 ± 43% (from 90 ± 30% to63 ± 32%; p < 0.001); however, the endocardial circumfer-ential ratio did not significantly change (2.6 ± 7%; p = 0.3).Although the initial percent of infarct mass correlated withthe initial EF (r = 0.73), there was a stronger correlationbetween the initial infarct percent and final EF (r = 0.81,see Fig. 1).
Conclusions: Over a wide range of infarct sizes, the size ofthe acute myocardial infarct predicts the follow-up EF afterinfarct healing has occurred. As the size of the initial infarctincreases, the EF declines. The improvement of EF likelyrepresents improvement in dysfunctional, but viable‘‘stunned’’ myocardium. Additionally, infarct sizes systemat-ically decrease following a reperfused acute MI. The degreeof decrease is greater transmurally than circumferentially andvaries inversely with the initial infarct size.
128. Left Ventricular Remodelling in DilatedCardiomyopathy with and without Evidence of LateGadolinium Enhancement
Ravi Assomull, Jonathan Lyne, Dudley Pennell, SanjayPrasad. CMR Unit, Royal Brompton Hospital, London, UK.
Introduction: Late gadolinium enhancement cardiovascularmagnetic resonance imaging (LGE-CMR) shows a patchy,midwall pattern in approximately 25% of patients with aclinical diagnosis of idiopathic dilated cardiomyopathy. Thepattern of late enhancement in this group correlates well withthe distribution of fibrosis seen in post-mortem specimens.
Purpose: In patients with non-ischaemic dilated cardio-myopathy, to assess whether there is adverse remodelling inthose patients with late enhancement compared to those withno evidence of late enhancement.
Methods: The scans of 33 consecutive patients with dilatedcardiomyopathy (DCM) were analysed. Patients who hadclinical evidence of ischaemic heart disease or had coronaryangiograms showing flow-limiting lesions were excluded.Overall, 22 patients (66%, 15 male, mean age 51 ± 19 years)showed no late enhancement whilst 11 (33%, 9 male, mean age40 ± 11 years) displayed midwall late enhancement. Leftventricular dimensions (including LV mass and mass index) aswell as left ventricular ejection fraction (LVEF) were comparedbetween the two groups using a 2 sample independent t-test.Right ventricular parameters were similarly compared.
Results: DCM patients with late enhancement had asignificantly higher LVend diastolic volume index (LVEDVI)when compared to patients without late enhancement(166 ± 50 ml/m2 vs. 124 ± 36 ml/m2 respectively,p = 0.009). The LV end systolic volume index (LVESVI)was also significantly higher in the late enhancement group(118 ± 56 ml/m2 vs. 81 ± 39 ml/m2 respectively, p = 0.04).
Mean LV mass in the late enhancement group was alsosignificantly higher than in the non-enhancement group(251 ± 87 g vs. 198 ± 52 g, p = 0.03) as was LV mass index(123 ± 25.4 g/m2 vs. 103 ± 26 g/m2, p = 0.04). There was nodifference in LVEF between the two groups (30.2 ± 13.5%vs. 36.1 ± 12.4%, p = 0.22). RV volumes and EF werecomparable between the two groups.
Conclusions: Whilst the pattern of midwall late enhance-ment seen in DCM with LGE-CMR is now well documented,very little is know of its clinical significance. Our findingshows a significant difference in the LV dimensions betweenthe enhancement and non-enhancement DCM groups.Patients with DCM and midwall late enhancement hadsignificantly larger LV volumes and mass than patients withno enhancement, reflecting adverse remodelling. This did notresult however in poorer function. Potential explanations arethat mid-wall fibrosis is a feature of more severe leftventricular disease or conversely that this reflects a differingunderlying aetiology and pathologic process that results ingreater LV volumes. Further work is required to understandthe temporal onset of late enhancement and its correlationwith clinical outcome.
129. Bradykinin B2 Receptor Does Not Mediate theAnti-remodeling Effects of the Angiotensin II Type 2Receptor Following Myocardial Infarction
David C. Isbell,1 Szilard Voros, MD,1 Zequan Yang, MD,PhD,2 Mark Conaway, PhD,3 Joseph M. Dimaria, BA,4 StuartS. Berr, PhD,4 Brent A. French, PhD,4 Frederick H. Epstein,PhD,4 Rene Jack Roy,4 Robert M. Carey, MD,1 ChristopherM. Kramer, MD.1 1Medicine, University of Virginia, Char-lottesville, VA, USA, 2Biomedical Engineering, University ofVirginia, Charlottesville, VA, USA, 3Health EvaluationSciences, University of Virginia, Charlottesville, VA, USA,4Radiology, University of Virginia, Charlottesville, VA, USA.
Figure 1.
27Oral Abstracts

Introduction: Left ventricular (LV) remodeling followinglarge anterior myocardial infarction (MI) often results incongestive heart failure. Angiotensin II (Ang II) has beenrecognized as an important mediator of LV remodeling,largely through its promotion of vascoconstriction, cellularhypertrophy, and interstitial fibrosis. While Ang II type 1receptors (AT2-1) promote remodeling, type 2 receptors(AT2-R), which are upregulated following myocardial injury,appear to attenuate this process as demonstrated in murinemodels of AT2-R overexpression (AT2-R OX) after anteriorMI. Furthermore, recent evidence suggests that the cardio-protective effects of AT1-R antagonism are in fact facilitatedthrough the AT2-R. Mechanisms underlying the benefit ofAT2-R OX in the heart have yet to be fully elucidated. Wehypothesized that the beneficial effects of AT2-R OX aremediated by the bradykinin B2 receptor (B2-R).
Methods: Twenty seven transgenic (TG) AT2-R OX miceand 11 wild type mice all on a C57Bl/6 background werestudied. Thirteen of the 27 AT2-R OX were also knockout forB2-R (B2-R KO) after several generations of crossbreeding(AT2-R OX/B2-R KO). All were studied by Cardiac MRI atbaseline (day 0) and days 1 and 28 post-MI induced by 1 hourof occlusion of the left anterior descending artery followed byreperfusion. Short axis images from apex to base were used tocompare LV mass index (LVMI), end-diastolic and end-systolic volume indices (EDVI, ESVI), and ejection fraction
(EF). Imaging was performed on a Varian 200/400 Inova 4.7T MRI system with Magnex gradients and a custom-built 2.5cm birdcage receiver coil. A 2D fast, low-angle shot(FLASH) sequence was used to obtain orthogonal long-axisimages. Six to 8 short-axis slices were acquired, each 1 mmthick. Prior to imaging on day 1, 0.3 mmol/L Gd-DTPA wasinfused intraperitoneally for the purpose of infarct sizing.Echo time was 3.9 ms and the TR adjusted continuously toobtain 14–16 equally spaced phases during each cardiaccycle. A 20 degree flip angle was used in all but the contrast-enhanced images where a 60 degree flip angle was used toimprove T1 weighting. Three signal averages were usedresulting in an acquisition time of approximately 4 minutesper slice and total imaging time of 30 to 45 minutes permouse. All images were quantitatively analyzed by a blindedobserver using the ARGUS (Siemens Medical Systems)image analysis program.
Results: At baseline prior to MI, EDVI and ESVI werelower and EF and LVMI higher in AT2-R OX compared toAT2-R OX/B2-R KO and WT mice respectively (Table 1,Figures 1 and 2). Infarct size was similar between the threegroups (41.4 ± 3.1 in AT2-R OX, 35.8 ± 1.6 in AT2-R OX/B2-R KO, and 40.9 ± 1.5% in WT, P = NS). Whencontrolled for baseline differences, no differences wereobserved at day 28 between AT2-R OX and AT2-R OX/B2-R KO mice in any measured parameter; however, EDVI and
Table 1.
AT2OX AT2OX/BKO Wild type P value
EDVI Day 0 1.46 ± 0.10 1.81 ± 0.10 1.77 ± 0.05 < 0.01Day 28 2.56 ± 0.23 2.51 ± 0.08 3.72 ± 0.17 < 0.01
LVMI Day 0 2.92 ± 0.19 3.01 ± 0.05 2.68 ± 0.07 < 0.02Day 28 3.66 ± 0.25 3.48 ± 0.07 3.79 ± 0.10 NS
Figure 1.
Oral Abstracts28

ESVI were lower and EF higher in both transgenic goups thanin WT mice (Table 1, Figures 1 and 2). LVMI did not differbetween groups at day 28 (Table 1).
Conclusion: The bradykinin B2 receptor does appear tohave a role in the smaller cavity size and supranormalfunction observed at baseline in AT2-R overexpressedanimals. However, attenuation of post-infarct remodeling byoverexpression of AT2-R is not directly mediated via thebradykinin B2 receptor.
130. CMR Demonstrates Reduced Post-infarct LeftVentricular Remodeling in Mice with iNOS Inhibition
Frederick H. Epstein, PhD,1 Zequan Yang, MD, PhD,2 R.Jack Roy,3 Yaqin Xu, MD, PhD,2 Stuart S. Berr, PhD,1 BrentA. French, PhD.2 1Radiology and Biomedical Engineering,University of Virginia, Charlottesville, VA, USA, 2BiomedicalEngineering, University of Virginia, Charlottesville, VA, USA,3Radiology, University of Virginia, Charlottesville, VA, USA.
Introduction: CMR of knockout mice has previously dem-onstrated the detrimental role of inducible nitric oxide syn-thase (iNOS) in post-infarct left ventricular (LV) remodeling
(Gilson et al., 2003). Specifically, it was shown that iNOSknockout mice exhibit reduced end systolic volume (ESV)and wall thickness and increased ejection fraction (EF) at 7and 28 days after a large anterior myocardial infarction (MI)compared to wild-type (WT) mice (Gilson et al., 2003).
Purpose: The purpose of the present study was to test thehypothesis that similar reductions in post-infarct LV remod-eling could be pharmacologically conferred upon WT mousehearts by selective iNOS inhibition.
Methods: Ten untreated WT mice and 5 WT mice treatedwith 1400W (Alexis Biochemicals, San Diego, CA), a highlyselective iNOS inhibitor, were studied by CMR before and at1, 7, and 28 days after experimental MI. MI was induced by a1 hour occlusion of the LAD followed by reperfusion. 1400Wwas administered (1.25 mg/kg-hr) starting 1 hour post-reperfusion until day 14 post-MI using implanted Alzet microosmotic pumps (Model 1002, Durect Corp, Cupertino CA).CMR studies included 1) localizer scanning, 2) 6–8 short-axis slices of black-blood cine imaging to cover the entireheart, and, 3) at day 1, 6–8 gadolinium-enhanced short-axisinversion recovery slices. Gd-DTPA was infused after cineimaging through an indwelling IP line. All imaging wasperformed on a 4.7 T scanner using custom-built birdcage orLitz RF coils. All images had a field of view of 2.56 cm, amatrix size of 128 � 128, and a zero-filled spatial resolutionof 0.1 � 0.1 mm2. Myocardial volumes, EF, and thecircumferential extent of post-infarct wall thinning (wallthickness < 0.5 mm) were measured from the cine images.Day 1 infarct size was measured as percent of LV mass fromthe gadolinium-enhanced images.
Results: Gadolinium enhanced CMR demonstrated similarday 1 infarct sizes in treated and untreated WT mice(38.7 ± 9.4% vs. 36.8 ± 4.5%, p = NS). These infarct sizeswere not different than those in the prior study (Gilson et al.,2003) using iNOS knockout mice (35.2 ± 4.2%, p = NS).Example mid-ventricular end-systolic images at day 28 areshown in Figure 1 illustrating the effect of iNOS. Specifically,LV cavity dilatation and circumferential wall thinning areseen in the untreated WT mouse (Figure 1A). In contrast,preservation of cavity size and confinement of wall thinningto the anterior segment are seen in the 1400W-treated mouse(Figure 1B). Figure 1C shows a day 28 iNOS knockoutmouse from the prior study with an appearance similar to the
Figure 2.
Figure 1. Mid-ventricular short axis images 28 days post-MI of (A) an untreated WT mouse, (B) a WT mouse treated with 1400W, and(C) an iNOS knockout mouse. Reduced cavity size and circumferential extent of wall thinning are evident in (B) and (C).
29Oral Abstracts
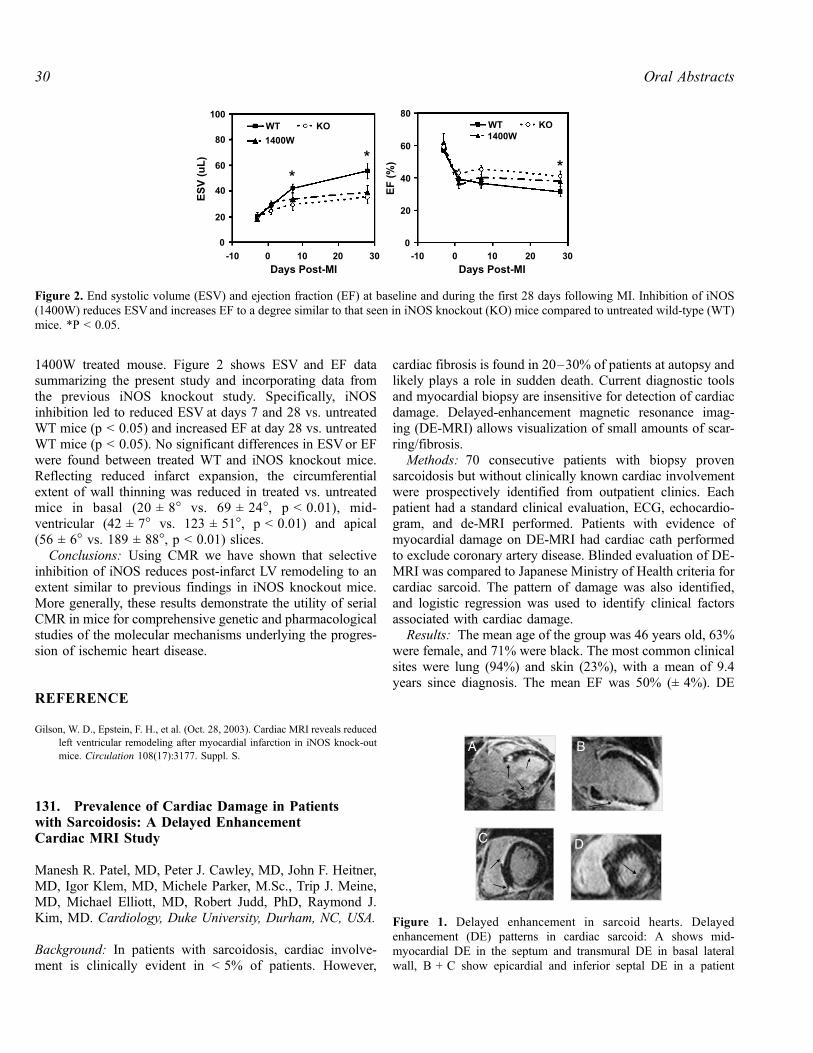
1400W treated mouse. Figure 2 shows ESV and EF datasummarizing the present study and incorporating data fromthe previous iNOS knockout study. Specifically, iNOSinhibition led to reduced ESV at days 7 and 28 vs. untreatedWT mice (p < 0.05) and increased EF at day 28 vs. untreatedWT mice (p < 0.05). No significant differences in ESVor EFwere found between treated WT and iNOS knockout mice.Reflecting reduced infarct expansion, the circumferentialextent of wall thinning was reduced in treated vs. untreatedmice in basal (20 ± 8� vs. 69 ± 24�, p < 0.01), mid-ventricular (42 ± 7� vs. 123 ± 51�, p < 0.01) and apical(56 ± 6� vs. 189 ± 88�, p < 0.01) slices.
Conclusions: Using CMR we have shown that selectiveinhibition of iNOS reduces post-infarct LV remodeling to anextent similar to previous findings in iNOS knockout mice.More generally, these results demonstrate the utility of serialCMR in mice for comprehensive genetic and pharmacologicalstudies of the molecular mechanisms underlying the progres-sion of ischemic heart disease.
REFERENCE
Gilson, W. D., Epstein, F. H., et al. (Oct. 28, 2003). Cardiac MRI reveals reduced
left ventricular remodeling after myocardial infarction in iNOS knock-out
mice. Circulation 108(17):3177. Suppl. S.
131. Prevalence of Cardiac Damage in Patientswith Sarcoidosis: A Delayed EnhancementCardiac MRI Study
Manesh R. Patel, MD, Peter J. Cawley, MD, John F. Heitner,MD, Igor Klem, MD, Michele Parker, M.Sc., Trip J. Meine,MD, Michael Elliott, MD, Robert Judd, PhD, Raymond J.Kim, MD. Cardiology, Duke University, Durham, NC, USA.
Background: In patients with sarcoidosis, cardiac involve-ment is clinically evident in < 5% of patients. However,
cardiac fibrosis is found in 20–30% of patients at autopsy andlikely plays a role in sudden death. Current diagnostic toolsand myocardial biopsy are insensitive for detection of cardiacdamage. Delayed-enhancement magnetic resonance imag-ing (DE-MRI) allows visualization of small amounts of scar-ring/fibrosis.
Methods: 70 consecutive patients with biopsy provensarcoidosis but without clinically known cardiac involvementwere prospectively identified from outpatient clinics. Eachpatient had a standard clinical evaluation, ECG, echocardio-gram, and de-MRI performed. Patients with evidence ofmyocardial damage on DE-MRI had cardiac cath performedto exclude coronary artery disease. Blinded evaluation of DE-MRI was compared to Japanese Ministry of Health criteria forcardiac sarcoid. The pattern of damage was also identified,and logistic regression was used to identify clinical factorsassociated with cardiac damage.
Results: The mean age of the group was 46 years old, 63%were female, and 71% were black. The most common clinicalsites were lung (94%) and skin (23%), with a mean of 9.4years since diagnosis. The mean EF was 50% (± 4%). DE
Figure 2. End systolic volume (ESV) and ejection fraction (EF) at baseline and during the first 28 days following MI. Inhibition of iNOS(1400W) reduces ESVand increases EF to a degree similar to that seen in iNOS knockout (KO) mice compared to untreated wild-type (WT)mice. *P < 0.05.
Figure 1. Delayed enhancement in sarcoid hearts. Delayedenhancement (DE) patterns in cardiac sarcoid: A shows mid-myocardial DE in the septum and transmural DE in basal lateralwall, B + C show epicardial and inferior septal DE in a patient
Oral Abstracts30

identified cardiac damage in 17 (24%) of patients, comparedto 8 (14%) by the Japanese Ministry of Health criteria forcardiac sarcoid, p = 0.0005. A majority of the patients withDE 14/17 (88%) had a non-CAD pattern, mid-myocaridaland/or epicardial (Fig. 1).
Conclusion: DE-MRI identified cardiac damage in 24%of patients with sarcoidosis, a rate similar to autopsy studiesand significantly higher than standard clinical criteria. Thepattern of scarring on MRI was often found to be mid-myocardial and epicardial.
132. Myocardial Scarring in Beta ThalassemiaMajor by Late Gadolinium-Enhanced MagneticResonance Imaging: Correlation with IronOverload and ECG-Changes
Alessia Pepe, MD,1 Fortunato Sorrentino, MD,2 AlessandroPingitore, MD,1 Vincenzo Positano, PhD,1 Daniele DeMarchi,1 Paolo Rigano, MD,3 Lorella Pitrolo, MD,4 LilianaCuccia, MD,5 Massimo Midiri, MD,6 Massimo Lombardi,MD.1 1MRI Lab, CNR, Clinical Physiology Institute, Pisa,Italy, 2Department of Radiology, University of Palermo,Palermo, Italy, 3Department of Haematology, V. CervelloHospital, Palermo, Italy, 4Department of Pediatrics, VillaSofia Hospital, Palermo, Italy, 5Department of Pediatrics, G.Di Cristina ARNAS Hospital, Palermo, Italy, 6Department ofHaematology, University of Palermo, Palermo, Italy.
Introduction: In beta thalassemia major (TM) cardiac dis-orders are the most common cause of death. Myocardialfibrosis has been shown in autopsy.
Purpose: Aim of this study was 1) to determine in patients(pts) with beta TM whether myocardial scarring can bedetected by late gadolinium-enhanced Magnetic ResonanceImaging (MRI); 2) to correlate the presence of myocardialscarring with iron overload and electrocardiographic changes.
Methods: 38 beta TM pts (12 male; 26 ± 8 yy) wereenrolled. MRI studies were performed on a 1.5 T scanner(GE, USA). Myocardial fibrosis was determined by lategadolinium-enhanced MRI. Images were evaluated by avisual assessment of two independent observers and by asemi-automatic post-processing software tool for objectivepixel quantification. Iron overload was determined by agradient T2-star (T2*) multi-echo sequence on three parallelshort axis views (basal-medium-apical) of left ventricle. Cinedynamic images in short axis of the left ventricle were alsoobtained to evaluate regional function by qualitative analysis.Twelve lead Electrocardiogram (ECG) was performed in 30patients before the MRI study.
Results: Scarring was present in 15 patients (40%),contrast to noise ratio resulted 1.8. The scarring waspredominantly patchy. Out of the 15 pts with scar, 11(73%) had two or more foci of scarring. Out of the 36 areas of
scarring, 19 (53%) involved the interventricular septum.Scarring did not followed coronary distribution. No asynergicsegments were detectable. Myocardial fibrosis did notsignificantly affect the T2* value (fibrosis 27 ± 10 ms vs.no-fibrosis 26 ± 12, p = 0.2). A significant correlation wasfound between the presence of myocardial scarring and ECGchanges (atrio-ventricular block, right bundle-branch block,ST segment depression, T wave inversion, abnormal Q-wavesor decreased R waves) (chi-square 8,3; p = 0.007). Thesensitivity, specificity, negative predictive value and positivepredictive value of ECG in detecting myocardial scarringwere 90%, 63%, 92% and 58%, respectively.
Conclusions: Myocardial scarring is detectable in asignificant percentage of patients with beta TM. Myocar-dial scarring did not correlate with iron overload. ECGchanges showed a significant accuracy to predict myocar-dial scarring.
133. Baseline Findings of a CMR Driven RandomizedControlled Trial of Iron Chelation Therapy inThalassaemia Major
Mark A. Tanner, MBBS,1 Mark A.Westwood, MBBS,1 RenzoGalanello,2 Dudley J. Pennell, MD.1 1Cardiac MR Unit, RoyalBrompton Hospital, London, UK, 2Haematology Department,Ospedale Microcitemico, Cagliari, Sardinia, Italy.
Introduction: Beta thalassaemia major (TM) is a hereditaryanaemia affecting 60,000 births worldwide each year.Survival is dependent upon lifelong blood transfusionsresulting in iron overload. Cardiac siderosis can result in aprogressive dilated cardiomyopathy which accounts for over70% of all deaths in TM. Yet this cardiomyopathy is bothtreatable and potentially reversible. Conventional treatmentwith the parenteral iron chelator desferrioxamine (DSF)improves morbidity and mortality but prognosis remainspoor and it has been reported that 66% of treated patientshave cardiac iron loading. More recently, the oral ironchelator deferiprone (L1) has been demonstrated to removecardiac iron and it has been proposed that in combination withDSF it may have an additive or synergistic effect. Thevalidated CMRT2* technique allows rapid, non-invasive, andreproducible quantification of tissue iron and is therefore wellsuited to assess the response to new therapies which mayimprove outcome in TM.
Purpose: To report the baseline data from a randomisedcontrolled trial comparing DSF and placebo (monotherapy)with DSF and the oral chelator, L1 (combination therapy),which has cardiac T2* as the primary outcome measure.
Methods: Mobile CMR scanner (1.5 T Siemens Sonata)was transported to Cagliari, Italy. The cardiac T2* wasassessed in 167 patients with TM aged 18–42 (30 ± 5.3 years).Those patients with cardiac iron loading (T2* < 20 ms) were
31Oral Abstracts
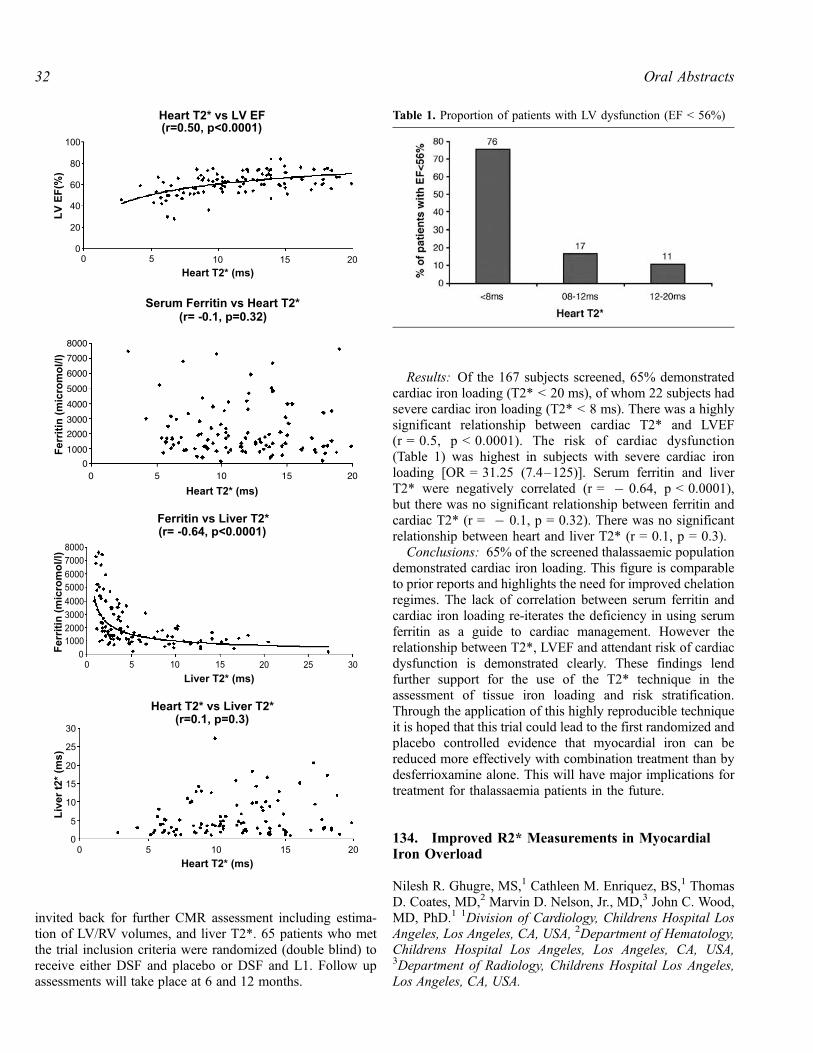
invited back for further CMR assessment including estima-tion of LV/RV volumes, and liver T2*. 65 patients who metthe trial inclusion criteria were randomized (double blind) toreceive either DSF and placebo or DSF and L1. Follow upassessments will take place at 6 and 12 months.
Results: Of the 167 subjects screened, 65% demonstratedcardiac iron loading (T2* < 20 ms), of whom 22 subjects hadsevere cardiac iron loading (T2* < 8 ms). There was a highlysignificant relationship between cardiac T2* and LVEF(r = 0.5, p < 0.0001). The risk of cardiac dysfunction(Table 1) was highest in subjects with severe cardiac ironloading [OR = 31.25 (7.4–125)]. Serum ferritin and liverT2* were negatively correlated (r = � 0.64, p < 0.0001),but there was no significant relationship between ferritin andcardiac T2* (r = � 0.1, p = 0.32). There was no significantrelationship between heart and liver T2* (r = 0.1, p = 0.3).
Conclusions: 65% of the screened thalassaemic populationdemonstrated cardiac iron loading. This figure is comparableto prior reports and highlights the need for improved chelationregimes. The lack of correlation between serum ferritin andcardiac iron loading re-iterates the deficiency in using serumferritin as a guide to cardiac management. However therelationship between T2*, LVEF and attendant risk of cardiacdysfunction is demonstrated clearly. These findings lendfurther support for the use of the T2* technique in theassessment of tissue iron loading and risk stratification.Through the application of this highly reproducible techniqueit is hoped that this trial could lead to the first randomized andplacebo controlled evidence that myocardial iron can bereduced more effectively with combination treatment than bydesferrioxamine alone. This will have major implications fortreatment for thalassaemia patients in the future.
134. Improved R2* Measurements in MyocardialIron Overload
Nilesh R. Ghugre, MS,1 Cathleen M. Enriquez, BS,1 ThomasD. Coates, MD,2 Marvin D. Nelson, Jr., MD,3 John C. Wood,MD, PhD.1 1Division of Cardiology, Childrens Hospital LosAngeles, Los Angeles, CA, USA, 2Department of Hematology,Childrens Hospital Los Angeles, Los Angeles, CA, USA,3Department of Radiology, Childrens Hospital Los Angeles,Los Angeles, CA, USA.
Table 1. Proportion of patients with LV dysfunction (EF < 56%)
Oral Abstracts32
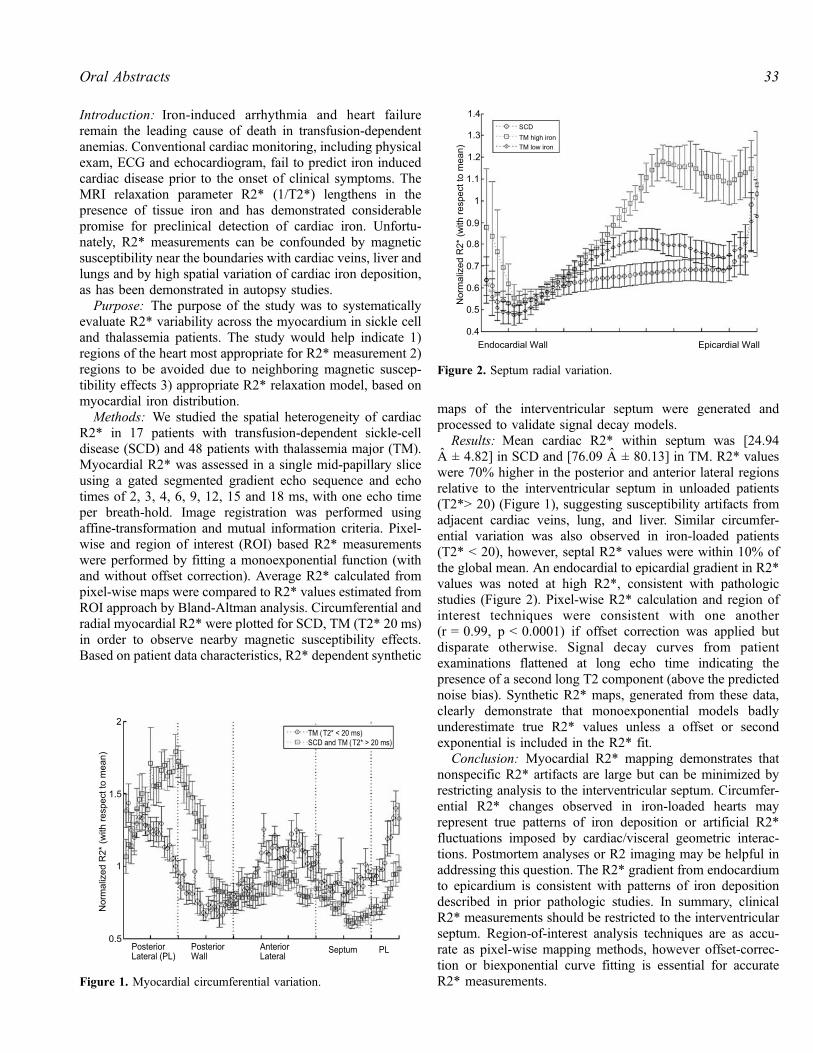
Introduction: Iron-induced arrhythmia and heart failureremain the leading cause of death in transfusion-dependentanemias. Conventional cardiac monitoring, including physicalexam, ECG and echocardiogram, fail to predict iron inducedcardiac disease prior to the onset of clinical symptoms. TheMRI relaxation parameter R2* (1/T2*) lengthens in thepresence of tissue iron and has demonstrated considerablepromise for preclinical detection of cardiac iron. Unfortu-nately, R2* measurements can be confounded by magneticsusceptibility near the boundaries with cardiac veins, liver andlungs and by high spatial variation of cardiac iron deposition,as has been demonstrated in autopsy studies.
Purpose: The purpose of the study was to systematicallyevaluate R2* variability across the myocardium in sickle celland thalassemia patients. The study would help indicate 1)regions of the heart most appropriate for R2* measurement 2)regions to be avoided due to neighboring magnetic suscep-tibility effects 3) appropriate R2* relaxation model, based onmyocardial iron distribution.
Methods: We studied the spatial heterogeneity of cardiacR2* in 17 patients with transfusion-dependent sickle-celldisease (SCD) and 48 patients with thalassemia major (TM).Myocardial R2* was assessed in a single mid-papillary sliceusing a gated segmented gradient echo sequence and echotimes of 2, 3, 4, 6, 9, 12, 15 and 18 ms, with one echo timeper breath-hold. Image registration was performed usingaffine-transformation and mutual information criteria. Pixel-wise and region of interest (ROI) based R2* measurementswere performed by fitting a monoexponential function (withand without offset correction). Average R2* calculated frompixel-wise maps were compared to R2* values estimated fromROI approach by Bland-Altman analysis. Circumferential andradial myocardial R2* were plotted for SCD, TM (T2* 20 ms)in order to observe nearby magnetic susceptibility effects.Based on patient data characteristics, R2* dependent synthetic
maps of the interventricular septum were generated andprocessed to validate signal decay models.
Results: Mean cardiac R2* within septum was [24.94A ± 4.82] in SCD and [76.09 A ± 80.13] in TM. R2* valueswere 70% higher in the posterior and anterior lateral regionsrelative to the interventricular septum in unloaded patients(T2*> 20) (Figure 1), suggesting susceptibility artifacts fromadjacent cardiac veins, lung, and liver. Similar circumfer-ential variation was also observed in iron-loaded patients(T2* < 20), however, septal R2* values were within 10% ofthe global mean. An endocardial to epicardial gradient in R2*values was noted at high R2*, consistent with pathologicstudies (Figure 2). Pixel-wise R2* calculation and region ofinterest techniques were consistent with one another(r = 0.99, p < 0.0001) if offset correction was applied butdisparate otherwise. Signal decay curves from patientexaminations flattened at long echo time indicating thepresence of a second long T2 component (above the predictednoise bias). Synthetic R2* maps, generated from these data,clearly demonstrate that monoexponential models badlyunderestimate true R2* values unless a offset or secondexponential is included in the R2* fit.
Conclusion: Myocardial R2* mapping demonstrates thatnonspecific R2* artifacts are large but can be minimized byrestricting analysis to the interventricular septum. Circumfer-ential R2* changes observed in iron-loaded hearts mayrepresent true patterns of iron deposition or artificial R2*fluctuations imposed by cardiac/visceral geometric interac-tions. Postmortem analyses or R2 imaging may be helpful inaddressing this question. The R2* gradient from endocardiumto epicardium is consistent with patterns of iron depositiondescribed in prior pathologic studies. In summary, clinicalR2* measurements should be restricted to the interventricularseptum. Region-of-interest analysis techniques are as accu-rate as pixel-wise mapping methods, however offset-correc-tion or biexponential curve fitting is essential for accurateR2* measurements.Figure 1. Myocardial circumferential variation.
Figure 2. Septum radial variation.
33Oral Abstracts

135. Impaired Aortic Properties in Patients withChronic Heart Failure as Assessed by CardiovascularMagnetic Resonance
Nikolay P. Nikitin, MD, PhD, Poay Huan Loh, MRCP,Ramesh de Silva, MRCP, Justin Ghosh, MRCP, Elena I.Lukaschuk, MSc, Andrew L. Clark, MA, MD, FRCP,John G. F. Cleland, MD, FRCP, FACC. Academic Unit ofCardiology, University of Hull, Kingston Upon Hull, UK.
Aortic properties change with age and in cardiac disease.In patients with chronic heart failure (CHF) it may con-tribute to patients’ symptoms. In this study we used cardio-vascular magnetic resonance (CMR) to assess the size anddistensibility of the ascending and descending aorta in CHFpatients with impaired and preserved left ventricular (LV)systolic function and compared it with younger and oldernormal subjects.
Methods: The study population included 209 patients withsigns and symptoms of compensated CHF (NYHA functionalclass II or III). One hundred and forty patients (aged 69 ± 10years) who had LV systolic dysfunction (LV ejection fraction< 45%) formed Group I, and 69 patients (aged 69 ± 11 years)with preserved LV systolic function (LV ejection fraction� 45%) formed Group II. The control population included 14older volunteers aged 66 ± 14 years (Group III) and 21younger subjects aged 32 ± 4 years (Group IV) with noknown cardiac disease. The subjects underwent cine CMR ona 1.5 T Signa CV/i GE Medical Systems scanner tocharacterise LV function and to assess cross-sectional areasand distensibility of the ascending aorta (AA) and thedescending aorta (DA).
Results: There were no differences in age between groupsI, II and III. Systolic blood pressure was significantly(p < 0.05) higher in group II (142 ± 30 mm Hg) and GroupIII (144 ± 29 mm Hg) as compared with Group IV (120 ± 8mm Hg). Systolic blood pressure in Group I was 129 ± 22mm Hg. Diastolic blood pressures were not significantlydifferent between the groups (77 ± 13, 81 ± 17, 82 ± 13 and75 ± 8 mm Hg respectively). The distensibility index (DI)of the AA and the DA was closely correlated with age
(r = � 0.67 and � 0.68 respectively) in the entire studygroup. Maximal and minimal cross-sectional areas of the AAand the DA and corresponding DI indices in the 4 studygroups are shown in Table 1. Aortic size increased and aorticdistensibility declined with age. CHF patients (Groups I andII) demonstrated aortic dilatation and increased stiffnesscompared to both younger and older groups of normalvolunteers. Aortic distensibility was slightly less reduced inthe group of patients with preserved LV systolic function thanin the group of patients with impaired LV function but this didnot reach statistical significance.
Conclusions: Patients with CHF show impaired elasticproperties of the ascending and the descending aorta.Diminished aortic distensibility is present in patients withboth impaired and preserved LV systolic function.
136. Regional Differences in Systolic and DiastolicFunction in Arrhythmogenic Right VentricularDysplasia/Cardiomyopathy Using MagneticResonance Imaging
Chandra S. Bomma, MD,1 Darshan Dalal, MD, MPH,1
Harikrishna Tandri, MD, MRCP,1 Kalpana R. Prakasa, MD,1
Khurram Nasir, MD, MPH,1 Ariel Roguin, MD,1 CrystalTichnell, MGC,1 Cynthia James, PhD,1 Joao A.C. Lima, MD,MBA,1 Hugh Calkins, MD,1 David A. Bluemke, MD, PhD.21Division of Cardiology (Department of Medicine), JohnsHopkins University School of Medicine, Baltimore, MD, USA,2Department of Radiology, Johns Hopkins University Schoolof Medicine, Baltimore, MD, USA.
Introduction: Arrhythmogenic right ventricular dysplasia/cardiomyopathy (ARVD/C) is characterized by abnormali-ties in right ventricular (RV) structure and function, aswell as the development of ventricular arrhythmias. His-tological evidence of left ventricle (LV) disease on autopsyhas been reported to be as high as 70%. Early ARVD/C isa regional disorder and regional abnormalities of RV func-tion have not been quantitatively evaluated in ARVD/Cusing MRI.
Table 1.
AA area
max (cm2)
AA area
min (cm2)
DA area
max (cm2)
DA area
min (cm2)
DI (AA)
(10�3 mm Hg�1)
DI (DA)
(10�3 mm Hg�1)
Group I 8.61 ± 2.07y,z 8.07 ± 1.99y,z 5.16 ± 1.16z 4.81 ± 1.11y,z 1.36 ± 0.77y,z 1.52 ± 0.8y,z
Group II 8.91 ± 2.45y,z 8.28 ± 2.36y,z 5.21 ± 1.48z 4.80 ± 1.40y,z 1.52 ± 1.07y,z 1.66 ± 1.17y,z
Group III 7.10 ± 2.07*,#z 6.44 ± 1.95*,#,z 4.43 ± 1.12z 4.00 ± 1.11*,#,z 2.15 ± 1.01z 2.51 ± 1.4z
Group IV 5.34 ± 1.15*,#,y 4.35 ± 0.94*,#,y 3.37 ± 1.03*,#,y 2.72 ± 0.86*,#,y 5.43 ± 1.97*,#,y 5.55 ± 1.55*,#,y
yp < 0.05 vs. group 3.zp < 0.05 vs. group 4.*p < 0.05 vs. group 1.#p < 0.05 vs. group 2.
Oral Abstracts34

Purpose: The aim of this study was to quantitativelyevaluate right and left global and regional function in pa-tients with ARVD/C compared to control subjects usingcine MRI.
Methods: The study included 14 patients with ARVD/Cand 18 age-matched normal subjects. Cine gradient echosequences were acquired using steady state free precession(SSFP) imaging. Right and left ventricle volumes weredetermined by contouring the endocardium on each slice,summing the slices and multiplying by the slice thickness(Simpson’s rule) and interslice gap. Peak filling rates (PFR)and peak ejection rates (PER) of the RV and LV wereassessed globally and regionally at basal, mid cavity, andapical regions.
Results: All global functional indices (PFR, PER andEF) of the RV were markedly reduced in ARVD/C patientscompared to normal subjects. In the presence of normal sys-
tolic function, global LV diastolic dysfunction as evidencedby marked reduction in PFR was observed in ARVD/Cpatients vs. normal subjects [320 ml (264, 368) vs. 411 ml(359, 447) P = 0.001]. There was significant RV systolic anddiastolic dysfunction at the basal region in the ARVD/Cpatients compared with normal subjects, with markedreduction in PER (P < 0.001) and PFR (P < 0.001). Regionaldiastolic dysfunction was present at the basal region of LVin ARVD/C patients, with reduced PFR [92 ml (85, 135) vs.119 ml (98, 133) ARVD/C patients vs. controls respectively,P = 0.035] (Fig. 1).
Conclusions: The RVof patients with ARVD/C has globaland regional systolic as well as diastolic dysfunction.Regional RV dysfunction is most severe at the RV base.Finally, LV diastolic dysfunction may also be present, inconcordance with established reports of histological involve-ment of the LV in ARVD/C.
Figure 1. Global functional indices in ARVD/C patients and normal subjects.
35Oral Abstracts

137. CMR Follow Up of Patients with ARVC
Sven Plein, Deoraj Y. Zamvar, MD, Mohan U. Sivananthan,MD. Cardiac MRI Unit, Leeds General Infirmary, Leeds, UK.
Introduction: Cardiac Magnetic Resonance (CMR) Imagingcan detect morphological and functional abnormalities of theright ventricle (RV) in patients with Arrhythmogenic RightVentricular Cardiomyopathy (ARVC). ARVC is a progressivedisease, but MRI follow up of patients with ARVC has not yetbeen reported.
Purpose: To assess morphologiacl and functional changeson CMR imaging on serial follow up of patients with ARVC.
Methods: 14 patients (mean age 42 years, 9 male) withARVC fulfilling the Task Force of the Working Group onCardiomyopathies were studied. All underwent CMR imag-ing annually for between 2 and 6 years. The MRI protocolconsisted of axial T1 and T2 weighted and fat-suppressedspin echo images as well as axial gradient echo cines, axialcines with myocardial tissue tagging and velocity-encodedimaging of tricuspid flow. All data were analysed in a blindedfashion by two experienced observers. Morphologically, fivecriteria were evaluated: the presence of intramyocardial fat,wall thinning, aneurysms or outpouchings, dilatation anddyskinesia. Functional analysis included the calculation of RVvolumes and ejection fraction and E/A ratios of tricuspid flow.Comparison was made between the first and the last MRIscan for each patient.
Results: One patient died during follow-up, two patientsunderwent implantation of a cardioverter-defibrillator. Meanfollow-up was 41 months. On morphological criteria, 4 pa-tients showed clear signs of deterioration between the firstand the last MRI study. On the first study, patients showed amean of 2.6 morphological abnormalities (7 fat, 8 thinning, 6outpouching, 7 dilatation and 6 dyskinesia), increasing to amean of 3.1 abnormalities on the last follow up study. In onepatient an abnormal contraction of the left ventricle wasreported. On functional analysis, EF was lower on follow-up in9 patients. The mean EF reduced from 54% to 49% (p < 0.05).E/A ratios of tricuspid flow also reduced, but not significantly.
Conclusion: Serial CMR imaging can demonstrate pro-gression of morphological and functional abnormalities inpatients with ARVC.
138. Combined Contrast-Enhanced and T2-WeightedCardiovascular Magnetic Resonance AccuratelyDetects Acute Myocarditis
Hassan Abdel-Aty,1 Philipp Boye,1 Anja Zagrosek,1 RalfWassmuth,1 Andreas Kumar,1 Daniel Messroghli,1 PetraBock,1 Rainer Dietz,1 Matthias G. Friedrich,2 JeanetteSchulz-Menger.1 1Cardiology, Franz-Volhard-Klinik, ChariteCampus Buch, Universitatsmedizin Berlin, Berlin, Germany,2Department of Cardiac Sciences, University of Calgary,Foothills Hospital, Calgary, AB, Canada.
Background: Acute myocarditis is difficult to diagnose.CMR provides various means to visualize inflammatorychanges of the myocardium. A comprehensive CMR approachthat combines different pulse sequences and uses clear-cutdiagnostic criteria would be desirable. We sought to iden-tify the diagnostic performance of contrast-enhanced andT2-weighted cardiovascular magnetic resonance (CMR) indetecting acute myocarditis.
Methods: We investigated 25 patients hospitalized foracute myocarditis as defined by clinical criteria, ECGchanges and serum markers of acute myocardial injury inthe absence of significant coronary artery disease as definedby coronary angiography (18 males, 44 ± 17 years, time aftermyocarditis onset = 6 ± 4 days) and 23 healthy volunteers(13 males, 29 ± 10 years). CMR studies included the fol-lowing sequences: 1) T2-weighted triple inversion recovery,2) T1-weighted spin echo before and shortly after contrastinjection and 3) Inversion recovery-gradient echo 10 minutesafter contrast injection. Qualitative and quantitative imageanalysis was performed for: 1) Focal and global (in relation toskeletal muscle) T2 signal intensity, 2) Global myocardialrelative enhancement (GRE) and 3) Areas of late gadoliniumenhancement (LGE).
Results: Global myocardial T2 SI was significantly higherin patients than in volunteers (2.3 ± 0.4 vs. 1.7 ± 0.4;p < 0.0001). A cutoff value of 1.9 has a sensitivity of 84%and a specificity of 74% to identify the disease (area underthe curve = 0.884, p < 0.0001). Moderate (Spearman corre-lation coefficient = 0.42) significant correlation was foundbetween global T2 and troponin levels (p = 0.035). 8 patientshad focal areas of high T2 signal as well and these patientshad significantly higher peak CK levels (781.6 ± 695.4 vs.254.5 ± 173.1; p = 0.014). GRE was significantly higher inpatients compared to volunteers (6.8 ± 4.0 vs. 3.7 ± 2.3;p < 0.001). A cutoff value of 4.0 has a sensitivity of 80% anda specificity of 73% to identify myocarditis (area under thecurve = 0.773, p < 0.001). The sensitivity and specificity ofLGE were 44% and 100% respectively. LGE was alwayslocated in the epicardial or mid portion of the ventricular wallbut never within the sub-endocardium. When data from thethree sequences were combined together (considering cutoffvalues of 1.9 and 4.0 for T2 and GRE together with thepresence of LGE), the sensitivity rose to 100%.
Conclusion: Combining the high sensitivity of T2-weighted and global (early) myocardial enhancement withthe excellent specificity of focal (late) gadolinium enhance-ment provides an imaging approach with excellent overalldiagnostic performance to detect acute myocarditis.
139. Influencing Factors Measuring Left VentricularFunction and Morphology by MRI-Is MRI theGolden Standard?
Henning Steen,1 Dave Bluemke, MD, PhD,2 Ellen Flynn,3
Joao A. C. Lima, MD.4 1Cardiology, Universitat Heidelberg,
Oral Abstracts36

Heidelberg, Germany, 2Radiology, Johns Hopkins, Balti-more, MD, USA, 3Cardiology, Johns Hopkins, Baltimore,MD, USA, 4Cardiology, Johns Hopkins, Baltimore, MD,USA.
Introduction: Cardiovascular reference parameters like LVmass (LVM), end-diastolic-/systolic volume (ED-/ESV) arestrong predictors of cardiovascular morbidity and mortality.Accurate measurement is crucial for applied imagingtechniques wherein MRI is considered golden standard.
Purpose: We hypothesized that although MRI-intra-ob-server variability is excellent, different contouring techniqueslead to substantial measurement errors.
Methods: Using two different contouring techniques(CT-I = including papillary muscles and epicardial chemicalshift artifact, CT-II = excluding aforementioned structures;Fig. 1) LV-short axes state-of-the-art MR-images (SSFP-sequence) of 10 Diabetes-II patients from an ongoing trialwere randomly contoured by one observer for EDV-, ESV-,EF-, LVM measurement.
Intra-observer variability was analyzed using Pearson’sCorrelation Coefficient.
Results: For CT-1, ESV was significantly higher(66.37 ± 20.81 vs. 47.68 ± 19 ml, p = 0.03) and EF(54.61 ± 5.81 vs. 62.9 ± 7.7%), EDM (109.05 ± 16.44 vs.130.53 ± 20.26 g) were significantly lower (p < 0.01) whencompared to CT-2. EDV was insignificantly elevated
(144.49 ± 35.4 vs. 124.52 ± 31.93). Intra-observer variabilitywas low (2%).
Conclusions: According to its low intra-observer variabil-ity MRI is considered golden standard of cardiac function andmorphology, however different contouring techniques poten-tially lead to considerable measurement errors on cardiovas-cular parameters especially for LVM but less pronounced forLV volumes.
140. MRI to Predict the Presence of Q Waves onthe ECG
Theodorus A. M. Kaandorp,1 Jeroen J. Bax, MD,2 Hildo J.Lamb, MD,1 Eric E. Viergever, MD,2 Eric Boersma,3 DonPoldermans, MD,3 Ernst van der Wall, MD,2 Albert de Roos,MD.1 1Radiology, Leiden University Medical Center, Leiden,The Netherlands, 2Cardiology, Leiden University MedicalCenter, Leiden, The Netherlands, 3Cardiology, Erasmus MC,Rotterdam, The Netherlands.
Introduction: Studies have demonstrated that Q waveinfarctions frequently have non-transmural scar formation,whereas non-Q wave infarctions may have transmural scars.The precise pathophysiological substrate underlying the Qwaves remains unclear. MRI is the preferred technique toevaluate patients with infarction, since information can be
Figure 1.
37Oral Abstracts
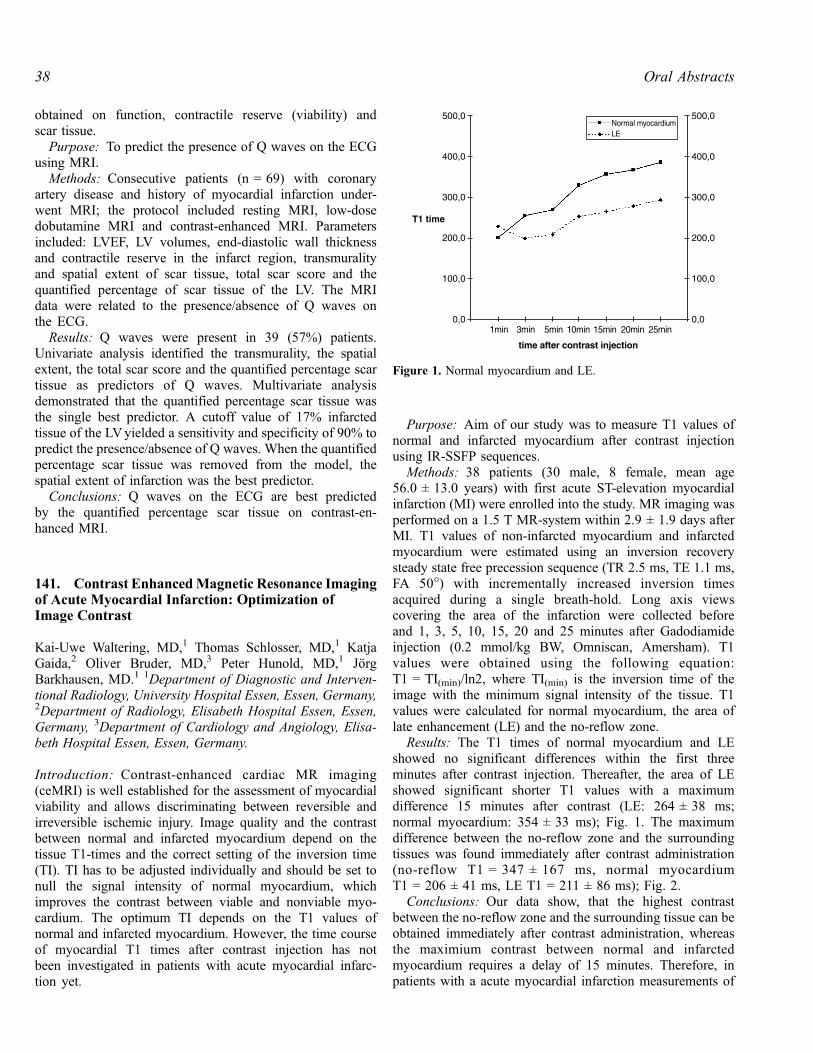
obtained on function, contractile reserve (viability) andscar tissue.
Purpose: To predict the presence of Q waves on the ECGusing MRI.
Methods: Consecutive patients (n = 69) with coronaryartery disease and history of myocardial infarction under-went MRI; the protocol included resting MRI, low-dosedobutamine MRI and contrast-enhanced MRI. Parametersincluded: LVEF, LV volumes, end-diastolic wall thicknessand contractile reserve in the infarct region, transmuralityand spatial extent of scar tissue, total scar score and thequantified percentage of scar tissue of the LV. The MRIdata were related to the presence/absence of Q waves onthe ECG.
Results: Q waves were present in 39 (57%) patients.Univariate analysis identified the transmurality, the spatialextent, the total scar score and the quantified percentage scartissue as predictors of Q waves. Multivariate analysisdemonstrated that the quantified percentage scar tissue wasthe single best predictor. A cutoff value of 17% infarctedtissue of the LVyielded a sensitivity and specificity of 90% topredict the presence/absence of Q waves. When the quantifiedpercentage scar tissue was removed from the model, thespatial extent of infarction was the best predictor.
Conclusions: Q waves on the ECG are best predictedby the quantified percentage scar tissue on contrast-en-hanced MRI.
141. Contrast EnhancedMagnetic Resonance Imagingof Acute Myocardial Infarction: Optimization ofImage Contrast
Kai-Uwe Waltering, MD,1 Thomas Schlosser, MD,1 KatjaGaida,2 Oliver Bruder, MD,3 Peter Hunold, MD,1 JorgBarkhausen, MD.1 1Department of Diagnostic and Interven-tional Radiology, University Hospital Essen, Essen, Germany,2Department of Radiology, Elisabeth Hospital Essen, Essen,Germany, 3Department of Cardiology and Angiology, Elisa-beth Hospital Essen, Essen, Germany.
Introduction: Contrast-enhanced cardiac MR imaging(ceMRI) is well established for the assessment of myocardialviability and allows discriminating between reversible andirreversible ischemic injury. Image quality and the contrastbetween normal and infarcted myocardium depend on thetissue T1-times and the correct setting of the inversion time(TI). TI has to be adjusted individually and should be set tonull the signal intensity of normal myocardium, whichimproves the contrast between viable and nonviable myo-cardium. The optimum TI depends on the T1 values ofnormal and infarcted myocardium. However, the time courseof myocardial T1 times after contrast injection has notbeen investigated in patients with acute myocardial infarc-tion yet.
Purpose: Aim of our study was to measure T1 values ofnormal and infarcted myocardium after contrast injectionusing IR-SSFP sequences.
Methods: 38 patients (30 male, 8 female, mean age56.0 ± 13.0 years) with first acute ST-elevation myocardialinfarction (MI) were enrolled into the study. MR imaging wasperformed on a 1.5 T MR-system within 2.9 ± 1.9 days afterMI. T1 values of non-infarcted myocardium and infarctedmyocardium were estimated using an inversion recoverysteady state free precession sequence (TR 2.5 ms, TE 1.1 ms,FA 50�) with incrementally increased inversion timesacquired during a single breath-hold. Long axis viewscovering the area of the infarction were collected beforeand 1, 3, 5, 10, 15, 20 and 25 minutes after Gadodiamideinjection (0.2 mmol/kg BW, Omniscan, Amersham). T1values were obtained using the following equation:T1 = TI(min)/ln2, where TI(min) is the inversion time of theimage with the minimum signal intensity of the tissue. T1values were calculated for normal myocardium, the area oflate enhancement (LE) and the no-reflow zone.
Results: The T1 times of normal myocardium and LEshowed no significant differences within the first threeminutes after contrast injection. Thereafter, the area of LEshowed significant shorter T1 values with a maximumdifference 15 minutes after contrast (LE: 264 ± 38 ms;normal myocardium: 354 ± 33 ms); Fig. 1. The maximumdifference between the no-reflow zone and the surroundingtissues was found immediately after contrast administration(no-reflow T1 = 347 ± 167 ms, normal myocardiumT1 = 206 ± 41 ms, LE T1 = 211 ± 86 ms); Fig. 2.
Conclusions: Our data show, that the highest contrastbetween the no-reflow zone and the surrounding tissue can beobtained immediately after contrast administration, whereasthe maximium contrast between normal and infarctedmyocardium requires a delay of 15 minutes. Therefore, inpatients with a acute myocardial infarction measurements of
Figure 1. Normal myocardium and LE.
Oral Abstracts38

the no-reflow zone should be performed immediately aftercontrast injection, whereas the area of LE should be assessedabout 15 minutes after contrast injection.
142. Resolution of Microvascular Obstruction OccursWithin Days of an Acute Myocardial Infarction
Timothy S.E. Albert, MD, Manesh R. Patel, MD, BurkhardSievers, MD, Michele A. Parker, MS, Michael D. Elliott, MD,Raymond J. Kim, MD, Robert M. Judd, PhD.Medicine, DukeUniversity Medical Center, Durham, NC, USA.
Introduction: Microvascular obstruction (MO) can occurafter acute myocardial infarction (AMI) and is felt toindependently predict poor outcomes. Because of this thereis currently an interest in developing devices and therapiesthat will decrease the size and extent of MO after AMI.
Since infarct assessment by delayed-enhancement cardiacMRI (DE-CMR) is being considered as an endpoint inAMI clinical trials we felt it important to determine thepredictors of MO in a large, well characterized cohort ofAMI patients.
Methods: AMI patients were eligible for inclusion if theyhad a clinically confirmed first time MI, no history of priorPCI or CABG, and were imaged using routine DE-CMR (10min post injection of 0.1–0.2 mmol/kg of gadolinium) within14 days of their infarct. A subset of patients had follow upDE-CMR at a chronic time point using a similar protocol inorder to better evaluate the influence of infarct age on MO.All analyses of infarct size and MO were done by two blindedreaders after combining and randomizing the acute andchronic scans. Infarct size and transmural extent were scoredusing a 17-segment model, while MO was identified by thepresence of hypoenhancement surrounded by hyperenhance-ment (HE).
Results: 96 pts (age 56 ± 13 yrs, median peak CK-MB142 ng/ml, 68% STEMI, 44% anterior MI) were imaged4 ± 3 days (mean ± SD) after MI. MO was present in 43 pts(45%). On a per patient basis the prevalence of MO increasedsignificantly with increasing infarct size and increasingnumber of segments with HE > 75% (TRANS) (both,p < 0.0001 for trend). There was an inverse relationshipbetween the prevalence of MO and infarct age in days (d) inthe AMI period: 60% at 1–2 d, 47% at 3–4 d, 33% at 5–7 d,and 27% at 8–14 d (p < 0.02) (see Figure 1). In the 43 ptswith follow up DE-CMR (37% of which had MO in the AMIperiod, median infarct age 151 d, range 44 d–423 d) no MOwas present. Multivariate analysis, which included infarct sizeas a variable, revealed that the number of segments withTRANS (p < 0.0001) and infarct age in the AMI period(p = 0.013) were the strongest predictors of the presenceof MO.
Conclusion: Over half of all pts with AMI have MOwithin 1–2 days of infarct. This number decreases rapidlywithin the first 2 weeks, with complete disappearance of MOin chronic infarcts. The rapid time course of MO’s resolutionunderscores the importance of considering infarct age in MRIstudies of AMI.
143. Infarct Size Is an Independent Predictor ofMortality in Patients with Coronary Artery Disease
Rishi Kaushal,1 David Fieno, MD,2 Michael Radin, MD,3
Emanuel Shaoulian, MD,4 Jagat Narula, MD,4 Jeffrey Gold-berger, MD,5 Alan Kadish, MD,5 Kalyanam Shivkumar, MD,PhD,1 David Bello, MD.4 1David Geffen School of Medicineat UCLA, Los Angeles, CA, USA, 2Medicine, Cedars-SinaiMedical Center, Los Angeles, CA, USA, 3Pacific CoastImaging, Irvine, CA, USA, 4Medicine, University of Californiaat Irvine, Irvine, CA, USA, 5Medicine, Northwestern Univer-sity, Chicago, IL, USA.
Figure 2. No reflow and LE.
Figure 1.
39Oral Abstracts

Introduction: Cardiac magnetic resonance imaging (CMRI)can accurately determine infarct size. Prior studies usingindirect methods to assess infarct size have shown thatpatients with larger myocardial infarctions (MI) have a worseprognosis than those with a smaller MI.
Purpose: This study sought to assess the prognosticsignificance of infarct size by CMRI.
Methods: Cine and contrast MRI were performed inpatients with coronary artery disease (CAD) undergoingroutine cardiac evaluation.
Results: 100 patients (mean age 66 ± 11 years, 87% male,diabetes 23%, hypertension 49%, prior MI 62%, meanejection fraction (EF) 34 ± 13%) underwent CMRI. Meanfollow-up was 25 ± 18 months after MRI, during which time15 patients died. Cox regression was used to estimate the riskof death associated with traditional risk factors, heart failuresymptoms, EF, angiographic severity of CAD, and extent ofinfarct size. Presence of MI based on CMRI was present in91% of patients. The only two significant univariatepredictors of death (all-cause) were evidence of infarct> 15% of LV mass and extent of LV dysfunction based onEF (p < 0.05); female gender, extent of CAD, prior history ofMI, hypertension, and diabetes were not significant. Onmultivariate analysis, extent of MI (> 15% of LV mass) basedon CMR was the best independent predictor of death(p = 0.01) with the adjusted relative risk for extent of MIbeing 9.9 (95% CI 1.6–63), Figure 1.
Conclusions: The extent of MI identified by CMRI is anindependent predictor of death in patients with CAD.
144. Prognostic Value of Delayed Contrast-EnhancedCardiovascular Magnetic Resonance in Patients AfterReperfused Acute Myocardial Infarction
Matthias Regenfus, MD,1 Christian Schlundt,1 CarolinStingl,1 Johannes von Erffa,1 Robert Krahner,1 Michaela
Schmidt,2 Werner Adler,1 Birgit Pucher,1 Janice Hegewald,1
Werner G. Daniel.1 1Medical Clinic II, FAU Erlangen-Nurnberg, Erlangen, Germany, 2Siemens Medical Solutions,Erlangen, Germany.
Introduction: Delayed contrast-enhanced cardiovascularmagnetic resonance (DE-CMR) can be used to assess myo-cardial viability, its value for assessment of prognosis afterreperfused acute myocardial infarction (MI) is not known.
Purpose: We investigated whether DE-CMR is ableto determine cardiac prognosis in patients after reperfusedacute MI.
Methods: 102 patients (pts) with left ventricular (LV)dysfunction (EF 42 ± 8%) were examined on a 1.5 T scan-ner within 6 ± 3 (4–10) days of an reperfused acute MI.Cine and DE-CMR (10 min after injection of 0.15 mmol/kgGd-DTPA) was acquired and scored for regional wallthickening and contrast enhancement (HE) using a 17-segment model. Segments were considered to be viable ifshowing < 25% HE. LV ejection fraction (EF) wasdetermined by planimetry. Serial clinical follow-up wasobtained in all patients (mean follow-up 2.5 ± 1.3 years)regarding occurence of cardiac death, death attributable toany cause, MI, myocardial revascularization, and unstableangina or congestive heart failure requiring hospitalization.Patient-related and CMR data were analyzed in a multivar-iate Cox regression model.
Results: Among the 102 patients, there were 11 cardiacdeaths and reinfarctions in the follow-up period, additionallythere were 26 patients with myocardial revascularization orhospitalization due to unstable angina or congestive heartfailure. Patients with events at follow-up showed signifi-cantly lower EF (45.3 ± 12.7 vs. 37.7 ± 14.3, p = 0.006)than patients without events. In patients with cardiac deathsor reinfarction, the dysfunctional area by CMR (0.65 vs.0.48, p = 0.08) and the dysfunctional but viable area byCMR (0.16 vs. 0.27, p = 0.008) was significantly higherthan in patients without such events. By multivariateanalysis EF (hazard ratio 0.98, CI 0.95 to 1.0, p = 0.03)and the dysfunctional but viable area by CMR (hazard ratio1.4, CI 0.9 to 3.0, p = 0.04) were related to occurence offuture events independent of the presence of risk factors forcoronary arterosclerosis.
Conclusions: In patients after reperfused acute MI, DE-CMR can be used to forecast major adverse cardiac events.
145. Delayed Enhancement Cardiac MagneticResonance Imaging Detects Acute Right VentricularMyocardial Infarction
Andreas Kumar, MD,1 Hassan Abdel-Aty, MD,1 IlkaKriedemann,1 Jeanette Schulz-Menger, MD,1 C. MichaelGross, MD,1 Rainer Dietz, MD,1 Matthias G. Friedrich,
Figure 1. Survival curve for patients with infarct mass � 15% and> 15% of LV mass.
Oral Abstracts40

MD, FESC.2 1Cardiology, Charite Franz-Volhard-Klinik,Humboldt University, Berlin, Germany, 2Department ofCardiovascular Sciences, University of Calgary, Calgary,AB, Canada.
Background: Right ventricular infarction (RVI) is a seriouscomplication of acute inferior myocardial infarction. Delayedenhancement cardiac magnetic resonance imaging (CMR)accurately detects acute left ventricular infarction. We inves-tigated the utility of delayed enhancement CMR for the de-tection of acute RVI.
Methods: We examined 41 consecutive patients (31 male,age 54 ± 11 years) with acute inferior myocardial infarctiondefined by ECG criteria. All underwent a physical examina-tion for the presence of a triad of hypotension, clear lungsounds and jugular venous distension, an ECG for ST-elevation � 0.1 mV in the V4r right precordial lead, anechocardiogram for right ventricular dilatation and wallmotion abnormalities, and X-ray coronary angiography forthe definition of the culprit lesion. After successful coronaryreperfusion (reperfusion time 9.7 h ± 6.8 h, thrombolysisn = 3, percutaneous coronary intervention n = 38), allpatients underwent a CMR examination 3.2 ± 2.2 days afteronset of symptoms. We used a 1.5 T system (Signa CV/I,General Electric, USA), and the ‘‘delayed enhancement’’sequence (inversion recovery gradient echo 10 min afterapplication of 0.2 mmol/kg Gadolinium-DTPA, TR 7.1 ms,TE 3.1 ms, TI optimized to null remote myocardium 200–300 ms, matrix 256 � 192) was applied in short axis slices ofthe right and left ventricular myocardium. The studies wereevaluated by two blinded observers for the presence ofdelayed enhancement in the right ventricular wall. In theabsence of a single accepted gold standard for the detection ofRVI in vivo, the results of the CMR study were compared to ascore combining all non-CMR methods. That score rated thepatient ‘‘positive’’ for RVI, when any one or more of the non-CMR methods were positive for RVI as described above. The
results of the CMR study were also compared to each of thenon-CMR methods alone.
Results: In our study population with acute inferiormyocardial infarcts, delayed enhancement CMR showedRVI in 22 patients (example: Figure 1) and was negativefor RVI in 19 patients (example: Figure 2).
When CMR was compared to the combined non-CMRmethods for the detection of RVI, it reached a sensitivity of85%, a specificity of 76%, a positive predictive value of 77%and a negative predictive value of 84% (standard of truth: � 1non-CMR methods as positive for RVI). CMR detected all butone patient, in whom at least two non-CMR methods werepositive for RVI (sensitivity 88%).
Even when CMR was compared to each other technique(clinical triad, ECG V4r, and echocardiography) alone, thesensitivities for the detection of acute RVI were 88%, 83%and 88%, and the negative predictive values were 95%, 89%and 95%, respectively.
Furthermore, patients positive for RVI by CMR hadsignificantly more proximal RCA lesions than patientsnegative for RVI by CMR (n = 12 vs. n = 4, p < 0.05), andthey spent significantly more time on the Intensive Care Unit(3.9 ± 1,4 days vs. 2.9 ± 0.9 days, p < 0.05).
Conclusion: Delayed enhancement CMR yields highsensitivity and negative predictive values for the detectionof RVI in acute inferior myocardial infarction and thus couldbe used to exclude RVI in these patients.
146. Detection of Right Ventricular Infarction byCardiac Magnetic Resonance Imaging
D. Ian Paterson, MD, Alex Natanzon, MD, Breno Pessanha,MD, Andrew E. Arai, MD. Laboratory of Cardiac Energetics,National Institutes of Health, Bethesda, MD, USA.
Background: Right ventricular (RV) involvement in acuteinferior wall myocardial infarction (IMI) is difficult toFigure 1.
Figure 2.
41Oral Abstracts

diagnose with conventional techniques. However, clinicallydetected RV infarction has been shown to be associated withworse prognosis.
Hypothesis: We hypothesized that cardiac MRI (CMR)will detect clinically unsuspected right ventricular involve-ment in patients with acute IMI.
Methods: 45 consecutive patients (36 male, mean age 60)with first-time acute IMI underwent CMR in a communityhospital. Imaging consisted of steady state free precessioncine MRI (FIESTA) and contrast-enhanced inversion-recov-ery fast gradient-recalled echo for infarct detection. Left andright ventricular volumes, ejection fractions (EF) and regionalwall motion abnormalities were specifically evaluated. Read-ers blinded to the CMR results performed chart reviews on allpatients. Outcomes measured included in-hospital mortalityand length of stay.
Results: Right ventricular involvement was detected byCMR (RV + /CMR) in 10 of 45 patients with acute IMI butwas only clinically suspected in 2 (p = 0.01). RV delayedenhancement was present in 8 and RV wall motionabnormalities in an additional 2. 9 of these 10 patientsunderwent echocardiography however an RVabnormality wasrevealed in only 1 case. Older age (p = 0.03) and diabetes(p = 0.054) were more common in the RV + /CMR groupthan the RV-/CMR group. Mean blood pressure at presenta-tion, peak cardiac enzyme rise and the presence of STelevation were similar in both groups. At cardiac catheteri-zation, the prevalence of significant stenoses of the proxi-mal or mid right coronary artery as well as the rate ofangioplasty and stent deployment were also similar betweenRV + /CMR and RV-/CMR patients. CMR revealed similarLVEF, left ventricular volume and right ventricular volumebut RVEF was significantly decreased in the RV + /CMRgroup (52% vs. 60%, p < 0.001). Length of stay was similarin both groups, 2.6 days vs. 3 days, and all patients survivedto discharge.
Conclusions: RV involvement associated with acute IMIwas detected 5 times more often by CMR than was clinicallysuspected. However, outcome in these subclinical RV infarctsdoes not appear worse.
147. Differences of Late Gd-DTPA Kinetics andPartition Coefficient in Normal, Stunned andNecrotic Myocardium in Patients with AcuteMyocardial Infarction
Christoph Klein, MD,1 Thaiz Ruberti, MD,1 Stephan G.Nekolla, PhD,2 Bernhard Schnackenburg, PhD,3 Eike Nagel,MD,1 Eckart Fleck, MD.1 1Cardiology, German HeartInstitute Berlin, Berlin, Germany, 2Nuklearmedizin, Klinikumrechts der Isar der TU Muenchen, Muenchen, Germany,3Philips Medical Systems, Hamburg, Germany.
Introduction: Contrast enhanced magnetic resonance candistinguish between stunned and infarcted myocardium.
Purpose: Aim of the study was to investigate themechanism of enhancement by determining T1 relaxationkinetics of blood, normal, stunned and infarcted myocardiumover time and calculate the partition coefficient (pc).
Methods: 22 patients with acute myocardial infarctionwere examined with a 1.5 Tesla scanner (Intera, Philips,Netherlands) 4 ± 3 days after the acute event and interven-tional revascularisation. Infarcted [with and without micro-vascular obstruction (MVO)], stunned and normalmyocardium were defined in the inversion recovery (15–20min post contrast) and cine technique (normal: normal wallmotion + no enhancement; stunned: abnormal wall motion +no enhancement; infarcted: abnormal wall motion + enhance-ment; MVO: hypoenhancement within enhanced area). T1values were calculated (Look-Locker) before and 5 to 40minutes after 0.2 mmol/kg body weight Gd-DTPA for bloodand myocardium. The pc was calculated by the equationpc = deltaR1myocardium/deltaR1blood.
Results: T1 was different (p < 0.0001) between normal,stunned and infarcted myocardium over the whole periodafter (Fig. 1), but not before contrast application. Significantdifferences between blood and infarcted myocardium did notexist at 20 min after contrast. Time course of the partitioncoefficient is shown in Fig. 2. There is steady statedistribution of Gd-DTPA in normal and stunned myocardium,however pc in stunned mayocardium is significantlyincreased compared to normal (p < 0.05). Enhanced areasand areas with MVO show an altered pattern suggesting areduced wash-in/wash-out kinetic.
Conclusions: In patients with acute infarction 1) stunnedmyocardium exhibits an higher pc than uneffected myocar-dium, possibly due to edema and/or partial necrosis, 2)infarcted and stunned myocardium can be distinguished byT1 weighted techniques between 5 and 40 minutes, 3) areaswith MVO have a reduced contrast wash-in kinetic and4) delayed enhancement is mainly due to an increased par-tition coefficient, but also shows an altered contrast wash-inand -out kinetic despite complete revascularisation.
Figure 1.
Oral Abstracts42
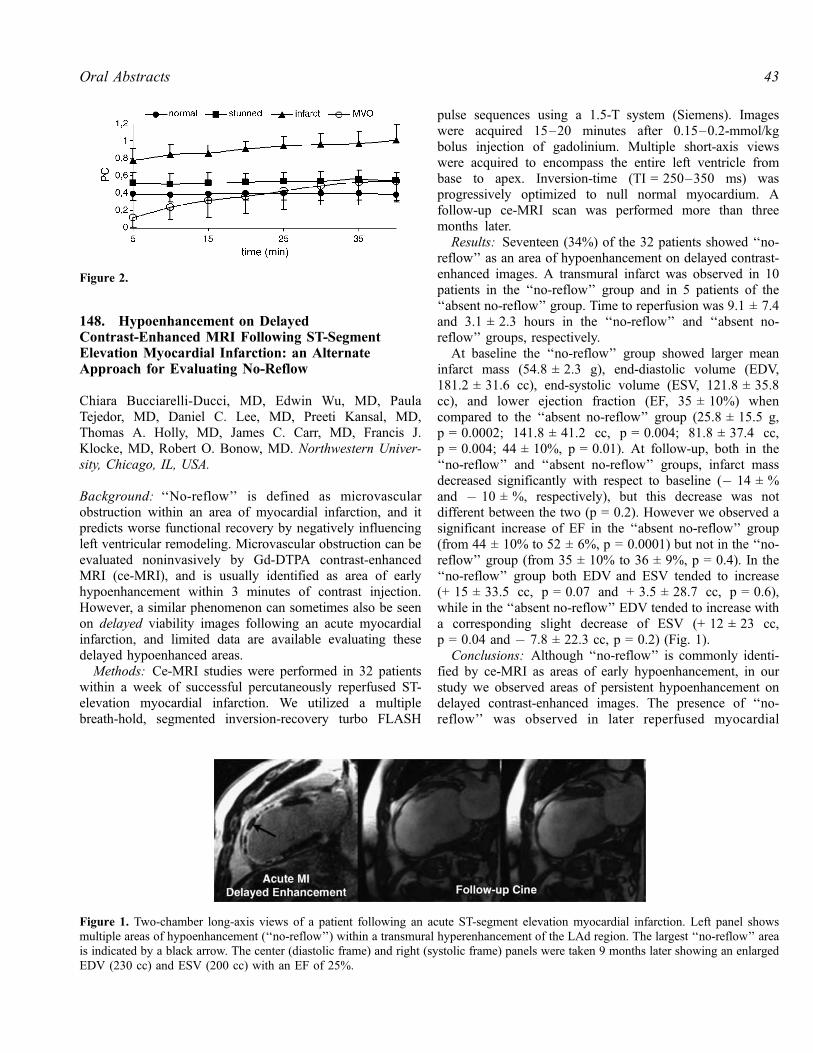
148. Hypoenhancement on DelayedContrast-Enhanced MRI Following ST-SegmentElevation Myocardial Infarction: an AlternateApproach for Evaluating No-Reflow
Chiara Bucciarelli-Ducci, MD, Edwin Wu, MD, PaulaTejedor, MD, Daniel C. Lee, MD, Preeti Kansal, MD,Thomas A. Holly, MD, James C. Carr, MD, Francis J.Klocke, MD, Robert O. Bonow, MD. Northwestern Univer-sity, Chicago, IL, USA.
Background: ‘‘No-reflow’’ is defined as microvascularobstruction within an area of myocardial infarction, and itpredicts worse functional recovery by negatively influencingleft ventricular remodeling. Microvascular obstruction can beevaluated noninvasively by Gd-DTPA contrast-enhancedMRI (ce-MRI), and is usually identified as area of earlyhypoenhancement within 3 minutes of contrast injection.However, a similar phenomenon can sometimes also be seenon delayed viability images following an acute myocardialinfarction, and limited data are available evaluating thesedelayed hypoenhanced areas.
Methods: Ce-MRI studies were performed in 32 patientswithin a week of successful percutaneously reperfused ST-elevation myocardial infarction. We utilized a multiplebreath-hold, segmented inversion-recovery turbo FLASH
pulse sequences using a 1.5-T system (Siemens). Imageswere acquired 15–20 minutes after 0.15–0.2-mmol/kgbolus injection of gadolinium. Multiple short-axis viewswere acquired to encompass the entire left ventricle frombase to apex. Inversion-time (TI = 250–350 ms) wasprogressively optimized to null normal myocardium. Afollow-up ce-MRI scan was performed more than threemonths later.
Results: Seventeen (34%) of the 32 patients showed ‘‘no-reflow’’ as an area of hypoenhancement on delayed contrast-enhanced images. A transmural infarct was observed in 10patients in the ‘‘no-reflow’’ group and in 5 patients of the‘‘absent no-reflow’’ group. Time to reperfusion was 9.1 ± 7.4and 3.1 ± 2.3 hours in the ‘‘no-reflow’’ and ‘‘absent no-reflow’’ groups, respectively.
At baseline the ‘‘no-reflow’’ group showed larger meaninfarct mass (54.8 ± 2.3 g), end-diastolic volume (EDV,181.2 ± 31.6 cc), end-systolic volume (ESV, 121.8 ± 35.8cc), and lower ejection fraction (EF, 35 ± 10%) whencompared to the ‘‘absent no-reflow’’ group (25.8 ± 15.5 g,p = 0.0002; 141.8 ± 41.2 cc, p = 0.004; 81.8 ± 37.4 cc,p = 0.004; 44 ± 10%, p = 0.01). At follow-up, both in the‘‘no-reflow’’ and ‘‘absent no-reflow’’ groups, infarct massdecreased significantly with respect to baseline (� 14 ± %and � 10 ± %, respectively), but this decrease was notdifferent between the two (p = 0.2). However we observed asignificant increase of EF in the ‘‘absent no-reflow’’ group(from 44 ± 10% to 52 ± 6%, p = 0.0001) but not in the ‘‘no-reflow’’ group (from 35 ± 10% to 36 ± 9%, p = 0.4). In the‘‘no-reflow’’ group both EDV and ESV tended to increase(+ 15 ± 33.5 cc, p = 0.07 and + 3.5 ± 28.7 cc, p = 0.6),while in the ‘‘absent no-reflow’’ EDV tended to increase witha corresponding slight decrease of ESV (+ 12 ± 23 cc,p = 0.04 and � 7.8 ± 22.3 cc, p = 0.2) (Fig. 1).
Conclusions: Although ‘‘no-reflow’’ is commonly identi-fied by ce-MRI as areas of early hypoenhancement, in ourstudy we observed areas of persistent hypoenhancement ondelayed contrast-enhanced images. The presence of ‘‘no-reflow’’ was observed in later reperfused myocardial
Figure 2.
Figure 1. Two-chamber long-axis views of a patient following an acute ST-segment elevation myocardial infarction. Left panel showsmultiple areas of hypoenhancement (‘‘no-reflow’’) within a transmural hyperenhancement of the LAd region. The largest ‘‘no-reflow’’ areais indicated by a black arrow. The center (diastolic frame) and right (systolic frame) panels were taken 9 months later showing an enlargedEDV (230 cc) and ESV (200 cc) with an EF of 25%.
43Oral Abstracts

infarctions that were larger, more frequently transmural andhad more compromised systolic function and increasedvolumes. We postulate that the presence of ‘‘no-reflow’’ ondelayed contrast-enhanced images is related to absentpenetration of contrast into the infarct core due tomicrovascular obstruction.
149. Risk Assessed by Framingham and MyocardialPerfusion Measured by MRI Selects Patients forCoronary Artery Angiography: the NHLBI-SponsoredWomen’s Ischemia Syndrome Evaluation(WISE) Study
Mark Doyle, PhD,1 Gerald M. Pohost, MD,2 Leslee J. Shaw,3
Eduardo Kortright,4 Diane A. Vido,1 Sheryl F. Kelsey,5 B.Delia Johnson,5 William J. Rogers,6 Steven E. Reis,7 MarianB. Olson,7 Barry L. Sharaf,8 C. Noel Bairey-Merz,9 SunilMankad, MD,1 Robert W. W. Biederman, MD.1 1AlleghenyGeneral Hospital, Pittsburgh, PA, USA, 2University ofSouthern California, Los Angeles, CA, USA, 3ACRI, Atlanta,GA, USA, 4University of New Orleans, New Orleans, LA,USA, 5Graduate School of Public Health, Epidemiology DataCenter, Pittsburgh, PA, USA, 6University of Alabama atBirmingham, Birmingham, AL, USA, 7University of Pitts-burgh Medical Center, Pittsburgh, PA, USA, 8Rhode IslandHospital, Providence, RI, USA, 9Cedars-Sinai ResearchInstitute, Los Angeles, CA, USA.
Introduction: In women with suspected myocardial ische-mia, most events occur above an intermediate Framinghamscore (Adult Treatment Panel III, ATP III). However, withinthis group, quantitative coronary angiography (QCA) iden-tifies few women with severe disease. Thus, risk estimatesbased upon historical and risk factor measures aresuboptimal guides in women, and improved testing criteriaare required.
Hypothesis: We hypothesize that risk stratification com-bining ATP III and a global myocardial perfusion index(GMPi) calculated from magnetic resonance imaging (MRI)better identify patients at high risk of major adversecardiovascular events (MACE) who would benefit fromQCA testing.
Methods: Women (133), mean age 57.7 ± 11.3 yrs, withsuspected myocardial ischemia and a mean ATP III score of9.8 ± 10.0 underwent QCA. Resting MRI was performed andGMPi calculated. Follow-up was conducted (38 ± 14months) to monitor MACE: death or myocardial infarction.Step-wise Cox regression modeling was used to determineindependent predictors of MACE.
Results: There were 10 MACE (7%) and 21% of thepopulation had a � 50% lesion in one epicardial coronaryartery. By Cox modeling, ATP III score and GMPi wereindependently predictive of MACE (p < 0.005). An ATP III
score � 10 (intermediate risk) identified 38% of patientsand 80% of events (event rate not different betweenintermediate and high-risk groups). Combining ATP III� 10 and GMPi in the lower two quartiles identified 20%of the population and 70% of MACE, risk ratio 9.2 and95% confidence interval 2.54–33.11. The QCA severityscore was not different between high and low-risk groups(14.50 ± 10.17 vs. 11.65 ± 10.01, p = 0.3). However, itwas predictive of MACE in the high-risk but not low-risk group.
Conclusions: Women with suspected ischemia were riskstratified by the ATP III score and GMPi (by MRI). Patientswith no risk variables (33%) remained event-free, those withone risk variable (47%) experienced low events, and thosewith both risk variables (20%) experienced 70% of events.Within the high-risk group, QCA severity score furtherstratified risk. The combined ATP III and GMPi risk variablesidentified patients who would potentially benefit from QCAand effectively would have excluded those who would notbenefit from QCA.
150. Arrhythmic Risk Stratification in theMADIT-II Population
Sunil T. Mathew, MD, Nathaniel Reichek, MD, WilliamSchapiro, BS, RT, David Hoch, MD, Stuart Schecter,MD, Joseph Levine, MD. St. Francis Hospital, Roslyn,NY, USA.
Introduction: In the MADIT-II study, patients with clinicalleft ventricular ejection fraction (LV EF) � 30% and priormyocardial infarction had lower mortality with defibrillatortherapy (ICD). However, the reliability of clinical EF has notbeen determined in this setting. Ventricular arrhythmiainducibility (+ EPS) is also a risk factor in this populationand may relate to infarct size. We used CMR to evaluateclinical EF, CMR LV EF and volumes and infarct size inpatients meeting MADIT II criteria.
Methods: CMR was performed in 43 patients (meanage = 66 ± 12 y, 3F) with clinical EF � 30% and infarction> 1 month previously but no revascularization within < 3months. Short axis TrueFISP cine imaging provided 3D LVvolumes (MEDIS MASS) and infarcts were sized (n = 38) aspercent LV mass using delayed hyperenhancement imagingafter 0.2 mmol/kg gadolinium chelate. Clinical and CMR EFwere compared with correlation and Bland-Altman limits ofagreement techniques. Receiver operating characteristic(ROC) curves for a combined end-point of inducibility ofventricular tachycardia with programmed stimulation (+ EPS)plus early arrhythmic events in noninducibility withprogrammed stimulation (� EPS) and non-EPS patientswere assessed for clinical and CMR EF, volume indices andinfarct size.
Oral Abstracts44

Results: Inducibility was present in 28/34 EPS patients,while 4/9 non-EPS patients had events and ICD within < 5months. Clinical EF derived from 2D echo (n = 31),radionuclide studies (n = 4) or invasive ventriculography(n = 7). Median interval from clinical EF to CMR was 17days, but limits of agreement were similar in studies done thesame day, < 14 days or > 14 days apart. Clinical EFcorrelated weakly with CMR EF (r = 0.37) and 13/43(30%) subjects had CMR EF> 30% despite clinicalEF � 30%. Limits of agreement were wide: + 15 to � 30EF %. Significant associations with the combined endpointwere found for CMR EF (AUC = 0.71, p < 0.04), end-systolic volume index (AUC 0.80, p < 0.0001) and LV mass/volume ratio (AUC 0.73 P < 0.005) but not clinical EF orinfarct size (AUC = 0.67, AUC = 0.58, both p = NS).
Conclusions: In MADIT-II patients clinical EF is inac-curate. Lower CMR EF and mass/volume ratio and higherend-systolic volume index are associated with higherarrhythmic risk but clinical EF and infarct size are not.CMR may provide improved risk stratification amongMADIT-II patients.
151. Pulmonary Vein Diameter Reduction inEarly Magnetic Resonance Angiography AfterRadiofrequency Ablation: Prognostic Significancefor Development of Severe Stenosis
Okan Ekinci,1 Alexander Berkowitsch, PhD,2 Thomas Neu-mann, MD,3 Harald Greiss, MD,2 Heinz-Friedrich Pitschner,MD,2 Christian W. Hamm, MD, PhD,2 Thorsten Dill, MD.21Cardiology, German Clinic of Diagnostic, Wiesbaden,Germany, 2Cardiology, Kerckhoff Heart Center, Bad Nauheim,Germany, 3Cardiology, Justus Liebig University of Giessen,Giessen, Germany.
Introduction: Arrhythmogenic myofibrills located at theorifice of pulmonary veins can trigger atrial fibrillation.Radiofrequency ablation (RFCA) around the ostia ofpulmonary veins is done in patients with atrial fibrillationbeing refractory to medical treatment. Reduction of initialostial PV diameter was found in patients directly afterradiofrequency ablation. Furthermore, development of steno-ses was reported in up to 10% of patients within a period ofone year after ablation.
Purpose: Aim of this study was to investigate prognosticsignificance of the relative reduction of PV diameter(RRPVD) assessed by magnetic resonance imaging at nextday after the procedure for development of severe PV stenosisduring long term follow up.
Methods: Sixty four consecutive patients (mean age/SD = 53/10 years; 24 female) with highly symptomatic anddrug refractory atrial fibrillation were enrolled in thestudy. The diameter of PV were evaluated using MR
angiography one day prior to and one day after theablation procedure. The further follow-up was by MRangiography every three months after the procedure. MRangiography was done using a non-gated contrast enhancedFISP-3D sequence and an i.v. bolus injection of 20 mLGadolinium-DTPA. Using 3D reconstruction (MPR), theostial PV diameter were measured.
Severe PV stenosis was defined as a diameter reduction> 70% of the initial ostial PV diameter. RRPVD was analyzedas dichotomized variable using cutoff determined by themethod of maximizing the log-rank test statistic.
Results: A total of 228 PV were treated in studypatients. The mean RRPVD at early control was 8% withSD = 14%. Severe stenosis was found in 13 PV withinfollow up (mean/SD = 6.5/4.6 months). The optimal cutoffpoint was found at RRPVD = 25%. The Kaplan-Meieranalysis confirmed strong association of RRPVD � 25%with long term development of PV stenosis (p < .0001;sensitivity = 42%; specificity = 90%). RRPVD was alsotested in multivariate Cox regression model whichrevealed RRPVD to be strongest predictor for developmentof severe PV stenosis (p < .0001; HR = 4.97). Thecumulative energy amount per PV was predictive ascontinuous variable (p < .001), but was not predictive afterthe dichotomization.
Conclusion: Relative reduction of the initial ostial PVdiameter � 25%, observed by MR angiography at the nextday after the procedure is a strong independent predictor fordevelopment of severe PV stenosis. Patients should routinelyundergo MR angiography for assessment of pulmonary veindiameters, early after RFCA of PV.
152. Myocardial Perfusion in Patients with CardiacSyndrome X Assessed with Cardiovascular MagneticResonance and Positron Emission Tomography
Andrew G. Elkington,1 Heiko Kindler (Joint first author),2
Ornella E. Rimoldi, PhD,2 Peter Collins, MD,3 Paolo G.Camici, PhD,2 Dudley J. Pennell, MD.1 1CMR Unit, RoyalBrompton and Harefield NHS Trust, London, UK, 2MRCClinical Sciences Centre, Imperial College, London, UK,3Department of Cardiology, Royal Brompton and HarefieldNHS Trust, London, UK.
Introduction: Cardiac Syndrome X (CSX) patients havetypical angina, abnormal exercise ECG, and normal coro-nary angiography.
Controversy exists on whether the chest pain results frommicrovascular dysfunction and ischaemia which might besubendocardial.We used cardiovascular magnetic resonance(CMR) and state-of-the-art positron emission tomography(PET) to measure transmural myocardial perfusion in CSXand controls (CON).
45Oral Abstracts

Methods: CSX patients were recruited from the Women’sHeart Disease clinic at the Royal Brompton Hospital.Myocardial perfusion was assessed by both CMR and PETin 10 CSX (9 females, 57 ± 9 years) and 10 matched controls(9 females, 49 ± 9 years p = ns) at rest and during adenosinestress (140 mg/kg/min).
The mean time between CMR and PET studies was 10 ±12 weeks. The CMR study was performed first in all cases.
Patients with hypertension, diabetes mellitus, left ventric-ular hypertrophy, left bundle branch block and minimalcoronary artery disease were excluded.
CMR: All studies were performed on a 1.5T scanner(Siemens, Sonata). For each study, we used a bolus ofgadolinium (Magnevist, Schering, 0.1 mmol/kg, 7 ml/s) and ahybrid EPI sequence, 2 (pixel size 2.1 � 2.1 mm, TR 6.2 ms,TE 1.3 ms, 196 ms image time) with 3 short axis slices.
All images were analysed off-line using dedicated software(CMRtools, London, UK). Myocardial perfusion reserveindex (MPRi) was calculated in the subendocardium (ENDO)and subepicardium (EPI) as adenosine/resting perfusion byFermi deconvolution.
PET: All studies were performed on an EXACT 3D (CTIPET Systems, Knoxville) with reconstructed spatial resolutionof 4.5 � 4.5 � 4.2 mm FWHM using H215O. Absolutesubendocardial and subepicardial perfusion (ml/min/g) andthe ENDO- and EPI MPR were calculated.
Results: PET absolute perfusion and MPR: ENDO-perfusion was lower in CSX than in controls both at rest(0.98 ± 0.35 vs. 1.26 ± 0.50, p < 0.001) and during adeno-sine (2.79 ± 1.12 vs. 3.45 ± 1.55, p < 0.001) although MPRwas comparable (3.05 ± 1.59 vs. 3.18 ± 1.0, p = 0.57).
EPI-perfusion at rest (0.92 ± 0.29 vs. 0.89 ± 0.34,p = 0.50), during adenosine (2.81 ± 1.16 vs. 2.61 ± 1.08,p = 0.22) and MPR (3.24 ± 1.39 vs. 3.24 ± 1.62 p = 0.9)were comparable in CSX and controls.
CMR Myocardial perfusion reserve index:MPRi was lowerin CSX compared to controls in both ENDO (2.39 ± 0.79 vs.2.69 ± 0.74, P = 0.009) and EPI (2.59 ± 0.89 vs.2.96 ± 1.06, P = 0.01).
Conclusions: In CSX compared to controls, absoluteENDO perfusion measured by PET is lower (at rest andstress) although MPR is comparable to that in controls.
The MPRi measured by CMR is lower in both layers inCSX compared to controls. Whether these transmural differ-ences of perfusion in CSX have a pathophysiologicalrelevance remains to be determined.
153. The Relationship Between Myocardial IronDeposition and Left Ventricular Dysfunction inThalassemia Using CardiovascularMagnetic Resonance
Mark A. Westwood, Lisa J. Anderson, Mark A. Tanner,Dudley J. Pennell. CMR Unit, Royal Brompton Hospital,London, UK.
Introduction: Beta thalassemia major (TM) is the com-monest inherited genetic disorder worldwide, where the longterm outlook is still poor. The majority of deaths are due tothe sequelae of cardiac iron overload resulting from themultiple transfusions required from birth. The recentdevelopment of validated cardiovascular magnetic resonance(CMR) T2* imaging for the first time allows assessment ofmyocardial iron loading. However, the frequency of leftventricular (LV) dysfunction for a given myocardial T2*value is not known. This would be useful by allowing a betterattribution of risk of significant LV dysfunction developing ina given patient, which is known to carry a mortality of 50%.By using a large cohort of T2* assessments it may be possibleto evaluate this.
Purpose: To assess the relationship between LV dysfunc-tion and myocardial iron loading in TM.
Methods: 972 CMR assessments on 470 patients with TM(and no other known pathology) were performed at the RoyalBrompton Hospital in London between May 1999 andDecember 2003. In each case myocardial T2* and leftventricular ejection fraction (LVEF) were calculated. Formyocardial T2* values < 20msec (rounded down to thenearest whole number) were taken to indicate significantmyocardial iron loading. For LVEF, values < 56% were takento indicate significant LV dysfunction. For each myocardialT2* value, the number of assessments where the LVEF <56% was determined and hence the percentage of assessmentswere there was evidence of LV dysfunction could be cal-culated. These results were then plotted as graphs (Figures 1and 2).
Results: In 586 assessments there was significant myocar-dial iron loading (i.e., myocardial T2* < 20msec) and in 99of the cases there was evidence of LV dysfunction (i.e.,LVEF < 56%.) The number of patients with LV dysfunctionfor each T2* value is shown in Figure 1, and the percentageof patients with LV dysfunction is shown in Figure 2. Themajority of patients with an LV dysfunction had myocardial
Figure 1.
Oral Abstracts46

T2* values < 8msec (60 out of 99 patients.) The frequency ofLV dysfunction generally decreases as there is less myocar-dial iron loading (i.e., an increasing myocardial T2* value.) Itis worth noting that no patient with a myocardial T2* > 20msec had an LVEF < 56%.
Conclusions: That as myocardial iron loading increases(as assessed by a decreasing myocardial T2* value) theoccurrence of LV dysfunction increases (as assessed byLVEF). In the most severely iron loaded (myocardial T2*4msec) the risk of significant LV dysfunction is nearly70%. This further validates the use of myocardial T2* imagingin the assessment of tissue iron loading and allows anestimation of the risk to a patient with a given myocardialT2* value.
154. Cardiac Magnetic Resonance Characterizationof Patients with Pheochromocytoma
W. Patricia Ingkanisorn, MD, Sriram Padmanabhan, MD,Federico Mordini, MD, Andrew E. Arai, MD. NHLBI,Laboratory of Cardiac Energetics, National Institutes ofHealth, Bethesda, MD, USA.
Background: Pheochromocytoma is a tumor that releasesexcess catecholamines episodically. Thus, intermittent hyper-tension and increased heart rate are common physiologicchanges associated with this diagnosis. Other cardiovascularmanifestations of pheochromocytoma include myocardialinfarction (MI), myocarditis, and dilated cardiomyopathy.Cardiac magnetic resonance (CMR) is a technique that hashigh accuracy and reproducibility of left ventricular structureand function. In addition, abnormal gadolinium delayed en-hancement has been observed in MI, myocarditis, variouscardiomyopathies, and other infiltrative processes.
We hypothesized that CMR imaging of pheochromocyto-ma patients would detect occult abnormal delayed enhance-ment patterns, as well as demonstrate differences in leftventricular structure and function when compared with CMRimaging of a group of healthy volunteers.
Methods: CMR was performed prospectively on 18patients with known pheochromocytoma and a controlgroup of 11 normal volunteers. Cine function, restingperfusion, and gadolinium delayed enhancement wereperformed. Resting heart rate and blood pressure wererecorded prior to each study. All imaging was performed ona GE 1.5 T, CV/i scanner. Left ventricular (LV) indices suchas stroke volume, ejection fraction, total mass, and maximalwall thickness were measured and compared between thetwo groups.
Results: Ten of the 18 pheochromocytoma patients had ahistory of hypertension. None of the normal volunteers hadknown hypertension. Multiple variables were comparedbetween the 18 pheochromocytoma patients and the 11normal volunteers. Two of the pheochromocytoma group hadmildly decreased global LV systolic function; however, therewere no statistically significant differences between the twogroups when comparing age, LV ejection fraction (EF), LVend diastolic mass/BSA, maximal LV wall thickness, systolicblood pressure (BP), diastolic BP, or heart rate. Table 1summarizes the findings.
Within the pheochromocytoma group, there were nofindings of gadolinium delayed enhancement of the myocar-dium. Two of the pheochromocytoma patients were found tohave extracardiac masses, both adjacent to the left atrium, and
Figure 2.
Table 1.
Pheochromocytoma Normal p value
Age 45 ± 14 yrs 46 ± 7 yrs 0.94LV EF 64 ± 7 62 ± 3 0.37LV end-diastolic mass/BSA 40 ± 9 g/m2 40 ± 17 g/m2 0.91Maximal LV wall thickness 11 ± 2 mm 11 ± 2 mm 0.85Systolic BP 123 ± 17 mm 135 ± 11 mm 0.26Diastolic BP 77 ± 10 mm 89 ± 9 mm 0.07Heart rate 68 ± 13 bpm 70 ± 13 bpm 0.74
Results reported as mean ± one standard deviation.
47Oral Abstracts

two patients had mediastinal masses. Of interest, 28% of thepheochromocytoma patients had prominent lipomatous hy-pertrophy of the interatrial septum.
In the normal volunteer group, one subject was found tohave an atypical mid-wall delayed enhancement pattern. Noneof the normal volunteers had any cardiac or intrathoracicmasses. Only 8% of the normal volunteer group hadlipomatous hypertrophy of the interatrial septum.
Conclusion: Despite the known physiological effects ofexcess circulating catecholamine levels, this study found nostatistically significant differences in left ventricular systolicstructure and function between 18 consecutively enrolledpheochromocytoma patients and 11 normal volunteers. Therealso were no clinically silent myocardial infarctions. Thus,myocardial infarction associated with pheochromocytomamay represent late stage disease or the combined effects ofexcess catecholamines in patients with either vulnerableplaques or concomitant severe coronary artery disease. Ofunknown significance was the finding of prominent lipoma-tous hypertrophy of the interatrial septum in almost 1/3 of thepheochromocytoma patients.
155. Prevalence and Structural Risk Factors for LeftVentricular Thrombus in Patients with SystolicDysfunction as Assessed by Cardiac MRI
Han W. Kim, MD,1 Jonathan W. Weinsaft, MD,2 Igor Klem,MD,2 Anna Lisa Crowley, MD,2 Rhoda Brosnan, MD,2
Thomas Todoran, MD,2 John Heitner, MD,2 Eric Velazquez,MD,2 Michelle Parker, MS, RN,2 Michael Elliott, MD,2
Robert M. Judd, PhD,2 Raymond J. Kim, MD.2 1Cardiology,Cornell University, New York, NY, USA, 2Cardiology, DukeCardovascular Magnetic Resonance Center, Durham, NC,USA.
Background: Delayed enhancement MRI (DE-MRI) offerstissue characterization that accurately identifies the presenceand extent of myocardial scarring and has the potential to besuperior to cine MRI for detecting left ventricular thrombus(LVT). We used DE-MRI to evaluate the prevalence andstructural risk factors for LVT and to compare LVT detectionrate with cine MRI in a broad population of patients withsystolic dysfunction.
Methods: We prospectively enrolled consecutive pts withsystolic dysfunction (EF � 45%) referred for cardiac MRI.Cine and DE-MRI were scored via a 17 segment model toquantify wall motion abnormalities (WMA), myocardial scarbased on hyperenhancement (HE), and the presence of LVT.Studies were read by two independent observers blinded topatient history and clinical diagnosis.
Results: 535 pts were studied (age 60 ± 15, 66% M, 61%HTN, 30% DM). 65% had ischemic cardiomyopathy byclinical criteria. DE-MRI identified LVT in 42 pts (7.8%). Theprevalence of LVT was 10.8% (n = 37) in pts with ischemic
cardiomyopathy (n = 37) and 2.7% (n = 5) in patients withnon-ischemic cardiomyopathy (p = 0.001). Cine MRI failedto identify LVT in 23% of cases detected by DE-MRI(p = 0.03). 98% of LVT identified by DE-MRI were adjacentto myocardium with scar. In multivariate analysis includingseveral clinical and imaging parameters, only extent of scar(RR 1.4, CI 1.2–1.5, p < 0.0001) and severity of WMA (RR1.1, CI 1.0–1.3, p = 0.02) were independent predictors ofLVT. The figure demonstrates the additive effects of LV scarburden to severity of segmental wall motion abnormalities onthe prevalence of LVT.
Conclusions: The prevalence of LVT by DE-MRI isdependent on the etiology of systolic dysfunction andincludes a high proportion of pts missed by cine MRI.Myocardial scar burden predicts LVT independent of theseverity of contractile dysfunction and may be a useful indexfor determination of thrombotic risk.
156. MR Imaging of Atherosclerosis in Aorta andCarotid Arteries of Patients with Acute Ischemic Stroke
Venkatesh Mani, PhD, Silvia H. Aguiar, MD, Karen B.Weinshelbaum, Katheleen E. Burger, David M. Brown, MD,Vitalii V. Itskovich, PhD, Juan Gilberto S. Aguinaldo, MD,Valentin Fuster, MD, PhD, Zahi A. Fayad, PhD. Mount SinaiSchool of Medicine, New York, NY, USA.
Introduction: The prevalence of Atherosclerosis in thearterial system may be different based on the risk of acuteischemic stroke (AIS).
Purpose: The aim of this study was to test the hypothesisthat atherosclerotic profile in Acute Ischemic Stroke (AIS)Patients is different using black blood CMR.
Methods: 14 patients with AIS (aged 64.3 ± 8.6 years,range, 42.8% females) and age/gender-matched controls(n = 13) with similar cardiovascular risk distribution asdetermined by their 10-year risk profile using FraminghamScore underwent high-resolution black-blood MRI of theaorta and carotid arteries using rapid extended coveragedouble inversion recovery turbo spin echo sequence [Maniet al., 2004) (Figure 1(A)]. For each subject, cross-sectionalimages of the aorta (n = 36 to 48) and carotids (n = 12 to 24)were analyzed. Total examination time was less than 1 hour.Average arterial wall area (AWA), a plaque index obtained bynormalizing the AWA with respect to body surface area (PI)for both aorta (PIA) and carotids (PIC), average wall thick-ness (AWT), and maximal wall thickness (MWT) were mea-sured for each resulting image.
Results: There was no significant difference between thepatients with AIS and controls with respect to age, gender,mean cholesterol values, 10-year risk percentiles, BMI andtraditional cardiovascular risk factors, AWA and PIC. AWTand MWT of both carotid and aorta were higher in AIS
Oral Abstracts48

subjects than in controls (2.3 ± 0.7 vs. 2.1 ± 0.6 mm,p = 0.0407). Aortic AWA was not significantly differentbetween AIS subjects and controls (174.8 ± 42.9 vs.160.0 ± 52.7, p = 0.22). However, normalized to bodysurface area, i.e. the PIA of AIS subjects was significantlyhigher than controls (8.64 ± 2.2 vs. 7.23 ± 1.78, p = 0.047).
Conclusions: This pilot study shows that MRI can be usedto determine atherosclerotic profile in AIS patients and thatAWT, MWT and PI is higher in patients with AIS. Thismethod may establish a basis for future population studieson clinical screening and monitoring of patients at high riskfor AIS.
REFERENCE
Mani, V., Itskovich, V. V., Szimtenings, M., Aguinaldo, J. G. S., Samber, D. D.,
Mizsei, G., Fayad, Z. A. (2004). Rapid extended coverage (REX) simul-
taneous multislice black blood vessel wall imaging. Radiology 23:281–
288.
157. MR Delayed Enhancement Imaging in PostCardiac Transplant Patients at Yearly Review
Richard E. Slaughter, MBBS, FRACR,1 Wendy E. Strugnell,BSc,1 Andrew John Galbraith, BMedSc, MBBS, FRACP,2
Lora Medoro, MBBS.1 1Cardiovascular MRI ResearchCentre, Prince Charles Hospital, Brisbane, Australia,2Department of Cardiology, Prince Charles Hospital,Brisbane, Australia.
Introduction: Coronary artery disease involves both largeand small coronary vessels and is the main limitation to
survival following cardiac transplantation. Cardiac damageat the time of transplantation, episodes of rejection andcoronary artery disease may all result in myocardialfibrosis. Delayed enhancement imaging has the potentialto demonstrate areas of myocardial fibrosis. This may behelpful in the understanding and management of thispatent group.
Purpose: To determine the incidence and nature ofdelayed myocardial enhancement in post cardiac trans-plant patients.
Method: 42 post cardiac transplant patients referred forannual MRI assessment were reviewed. MR imaging wasperformed on a GE Medical Systems 1.5 Tesla SignaTwinspeed system with a 4-element cardiac phased arraycoil. Steady state free precession (SSFP) cine MR imagingseries were acquired to provide functional assessment of theventricles. Delayed enhancement imaging was performed inthe vertical long axis, horizontal long axis and short axisorientations using a segmented inversion recovery fastgradient echo sequence. Images were acquired 8–15minutes after administration of 0.2 mmol/kg of gadolini-um-DTPA, using an inversion time of 200–250 ms.
Autopsy results were available in one case and were cor-related with the MR findings.
Results: Areas of delayed myocardial enhancement werepresent in 16 of the 42 patients. Enhancement pattern fell into3 groups:
1. Typical ischaemic type post infarct scarring (7 patients)2. Patchy small areas of enhancement occurring at various
locations in the myocardium and often not in a coronaryartery distribution (6 patients)
3. Diffuse subendocardial enhancement (3 patients)
Typical ischaemic infarction in these patients most likelyresults from silent ischaemia due to transplant vasculopathy.
Figure 1.
49Oral Abstracts

It is possible that some of the small areas of patchyenhancement may also be the result of small vessel diffusecoronary artery disease. In some patients, episodes of rejec-tion were documented and this may be a causative factor.
Diffuse subendocardial fibrosis was present in 3 patients,all of whom were more than 10 years post transplantation.The nature of this process is not fully understood. Autopsyin one patient demonstrated extensive subendocardial fi-brosis and fibrosis in the atrial septum which correlatedwell with the MR findings. Some epicardial fibrosis wasalso present.
Conclusion: Delayed myocardial enhancement imaging inpost cardiac transplant patients may demonstrate areas ofprevious silent ischaemic infarction, patchy small areas ofenhancement of unknown aetiology and diffuse subendocar-dial fibrosis in long standing post transplant hearts.Correlation with treatment, episodes of rejection and coronaryartery anatomy may provide more understanding of the natureof these abnormalities.
158. Value of T2-Weighted-, First-Pass-Enhancementand Cine-MRI to Differentiate Between Acuteand Chronic Myocardial Infarction
Gunnar K. Lund,1 Alexander Stork,2 Kai Mullerleile,1 MartinPaul Bansmann,2 Achim Barmeyer,1 Gerhard Adam,2 ThomasMeinertz.1 1Cardiology, Herzzentrum, Hamburg, Germany,2Diagnostic and InterventionalRadiology,Hamburg,Germany.
Delayed enhancement (DE) magnetic resonance imaging(MRI) is a validated tool to detect and to size myocardialinfarction (MI). However, presence of DE does not dif-ferentiate between acute MI (AMI) and chronic MI (CMI),which is a clinically important question. Edema on T2w-MRI is usually found in AMI, whereas wall thinning oncine-MRI is typical for CMI. Furthermore, microvascularobstruction (MO) visualized on first-pass-enhancement(FPE)-MRI is mainly observed after AMI. The purpose ofthis study was to assess the diagnostic accuracy of myo-cardial edema on T2w-MRI, presence of MO on FPE-MRI,and wall thinning on cine-MRI to differentiate between AMIand CMI.
Material and Methods: 50 patients were imaged at 1.5 T5.0 ± 3.3 days and 7.9 ± 2.7 months after AMI using T2w-,FPE-, DE- and cine-MRI. FPE- and DE-MRI were performedduring and after injection of 0.1 mmol/kg Gd-DTPA. Allimages were acquired on identical short-axis planes. In ablinded consensus-reading edema on T2w-MRI, MO onFPE -MRI and wall-thinning on cine-MRI were graded aspresent or absent. Sensitivity and specificity of these im-aging findings were calculated to differentiate between AMIand CMI.
Results: DE was present in all patients in the acute andchronic state. The sensitivity and specificity to differentiatebetween AMI and CMI were 96% and 98% for edema, 58%and 80% for MO, 92% and 40% for absence of wall-thinning,respectively. Edema was more sensitive to detect AMI thanpresence of MO (P < 0.0001) and edema on T2w-MRI wasmore specific for AMI than absence of wall-thinning(p < 0.0001).
Conclusion: Presence or absence of edema can reliablydifferentiate between AMI and CMI and is superior topresence of MO or absence of wall-thinning. In presence ofdelayed enhancement T2w-MRI may be helpful to estimatethe age of the infarction.
159. Clinical Safety of Cardiac MRI Prior toDischarge in Patients with Acute MyocardialInfarction and Coronary Artery Stenting withBoth Bare Metal and Drug-Eluting Stents
Manesh R. Patel, Timothy S. E. Albert, MD, Emily Honeycutt,MBI, Linda K. Shaw, PhD, Michael H. Sketch, MD, MichaelElliott, MD, Robert M. Judd, PhD, Raymond J. Kim, MD,David E. Kandzari, MD. Cardiology, Duke University,Durham, NC, USA.
Background: Magnetic resonance imaging (MRI) is gen-erally felt to be safe in patients with coronary stents onceendothelialization has occurred, approximately 6–8 weeks.There is limited data on the clinical safety of cardiac MRI(CMR) in acute myocardial infarction (AMI) patients earlyafter coronary stent placement. With the introduction ofdrug-eluting stents (DES) into routine clinical care andincreased interest in using cardiac MRI in AMI clinical trials,safety data are needed on early CMR after coronary stentingin AMI patients.
Methods: Patients with AMI and coronary stenting whounderwent CMR prior to discharge and controls matched forage, sex, diabetes, and MI type (ST-segment elevation-STEMI vs. NSTEMI) were identified from the DukeCardiovascular Disease Databank. Statistical analysis wasperformed on the rate of death and any revascularizationwithin 30-days using logistic regression modeling.
Results: 66 patients with acute AMI had 97 stents (39%DES) placed. Cardiac MRI was performed prior to dis-charge, median 3 days post stenting. The median age was56 years, 24% were diabetic, and 71% had STEMI. 124control patients matched for these variables who were alive atday 4 after AMI were identified, see Table 1. Revasculari-zation occurred in 5 (4%) control patients and 1 (1.5%) MRIpatient at 30 days (p = 0.35). Death or revascularizationoccurred in 7 (5.6%) of control patients as compared to 1(1.5%) MRI patient at 30-days (p = 0.18; 95% confidenceinterval 0 to 4.5%).
Oral Abstracts50

Conclusion: Cardiac MRI appears to be safe whenperformed early after acute MI and coronary stenting. Therisk of death or any revascularization is low and similar topatients who do not undergo cardiac MRI.
160. Contrast Enhanced Magnetic ResonanceImaging: A Novel Approach for Identifying theInfarct Related Artery in Patients with Non-STElevation Myocardial Infarction
John F. Heitner, Igor Klem, MD, Manesh Patel, MD, J KevinHarrison, MD, Peter J. Cawley, MD, Jeffrey Washam, MD,Jonathan W. Weinsaft, MD, Anna Lisa Crowley, MD,Michele Parker, MD, Christopher K. Dyke, MD, ThomasM. Todoran, MD, Michael Elliott, MD, Robert M. Judd, PhD,Michael H. Sketch Jr., MD, Raymond J. Kim, MD. DukeUniveristy, Durham, NC, USA.
Background: Patients with non-ST elevation myocardial in-farction (NSTEMI) often havemulti-vessel disease and/or non-occlusive stenosis. Thus, determining the infarct related artery(IRA) using coronary angiography in NSTEMI patients can bedifficult. Contrast enhanced magnetic resonance imaging (ce-MRI) has the ability to identify small areas of myocardialnecrosis. The purpose of this study was to define whether ce-MRI improves the diagnostic ability of cardiac catheterizationin identifying the IRA in patients with NSTEMI.
Methods: Patients with no prior history of coronary arterydisease admitted to the coronary care unit with NSTEMIunderwent ce-MRI prior to cardiac catheterization. Imageswere interpreted by readers blinded to patient care relateddecisions. The interventional cardiologists were blinded toresults of the ce-MRI and documented each coronary vesselterritory on a 17-segment model and assigned the IRA. Thece-MRI was interpreted blinded to angiography and alsoevaluated using this 17-segment model. The IRAwas definedas the artery that supplied the territory with sub-endocardialinfarction by ce-MRI. Ce-MRI was considered indeterminateif there was no evidence of infarction by ce-MRI or if therewas > 1 coronary artery territory of infarction.
Results: Thirty patients, mean age 59.7 years, 53%female, were studied. Ten patients had insignificant coronaryartery disease (< 50% epicardial stenosis) by cardiaccatheterization, 4 had 1-vessel disease, 7 had 2-vesseldisease, and 9 had 3-vessel disease. Fifteen patientsunderwent revascularization (PCI, n = 8; CABG, n = 7).Cardiac catheterization identified the IRA in 16 of the 30(53%) patients. Ce-MRI identified the IRA in a signifi-cantly larger number of patients 26 of 30 (87%), p < 0.0074.Of the 4 patients that were ineterminate by ce-MRI, 3 weredue to inability to visualize the infarct and 1 was due toinfarct in more than one coronary vascular territory. Theaddition of infarct location by ce-MRI identified the IRA in11 of the 14 patients in which the IRA could not bedetermined by cardiac catheterization alone. Two patientsunderwent PCI of an artery that was not the IRA by ce-MR.
Conclusion: Ce-MRI identified the IRA in significantlymore patients than cardiac catheterization. Use of ce-MRIto identify IRA in NSTEMI patients may be a novelapproach to help guide appropriate coronary revasculariza-tion strategies.
161. Changes in Left Atrial Geometry and FunctionAfter Left Atrial Ablation
Meyer M. Thomas, MD, Robert L. Eisner, PhD, Susan Eder,David B. Delurgio, MD, Fernando V. Mera, MD, AnitaBhandiwad, MD, Angel R. Leon, MD. The Carlyle FraserHeart Center, Emory Crawford Long Hospital, Atlanta,GA, USA.
Background: Left atrial (LA) linear radiofrequency (RF)ablation has been shown to be effective in the elimination ofatrial fibrillation (AF). While previous magnetic resonanceimaging (MR) studies have investigated LA volume changesas a result of AF ablation, there is limited, if any, MR dataon the effect of this procedure on LA function. Because ofthe extensive radiofrequency LA lesions produced duringthis procedure, there is a concern that AF ablation mayadversely affect LA function. Therefore, we sought to
Table 1. AMI patients with stents and MRI vs. No-MRI
Baseline characteristics Total N = 190 Control No-MRI N = 124 MRI performed N = 66 P-value ++
Age (median-yrs) 57 58 57 0.597Diabetes mellitus 40 (21%) 24 (19.4%) 16 (24.2%) 0.431Myocardial infarction characteristics
ST-segment elevation MISTEMI 133 (70%) 86 (69.3%) 47 (71.2%) 0.790Number of stents (% DES) 294 197 (10.2%) 97 (39.2%)Outcomes 30-days
Revascularization 6 (3.2%) 5 (4.0%) 1 (1.5%) 0.344Death 2 (1.1%) 2 (1.6%) 1 (1.5) 0.299Death or revascularization 8 (4.2%) 7 (5.6%) 1 (0.1.5%) 0.177
51Oral Abstracts

determine the effects of LA linear ablation on atrial functionand remodeling by measuring changes in atrial ejectionfraction (EF), peak atrial contraction velocity (A-wave) andLA volume changes.
Methods: Eleven patients with AF underwent LA ablation.Cardiac MR and contrast-enhanced MR angiography (CE-MRA) were performed at baseline and three months postablation (Philips 1.5T Intera CV).
Sequences: 1) Cine-MR of the left atrium in the short axis(ECG-gated, Balanced Turbo Field Echo, TR 3.0, TE 3.1, 8–10 mm slice thickness) 2) Phase velocity mapping (ECG-gated, TR 5.4, TE 3.0, 8 mm slice thickness, 20 phases) in ashort axis plane perpindicular to mitral valve in-flow in theleft ventricle 3) CE-MRA (3D MRA, TR 4.6, TE 1.4).
Analysis: All analyses were performed using EasyVisionsoftware (Philips Medical Systems). LA volume wasmeasured from the CE-MRA. In addition, for the six patientsthat were in sinus rhythm (SR) during both the pre- and post-
MR scans, an atrial ejection fraction (EF) was calculated fromthe maximal atrial volume (after atrial filling) and the minimalatrial volume (after active atrial contraction) obtained on cine-MR images. For these patients in SR, we also measured themaximal A-wave velocity (representing active atrial contrac-tion) from the phase velocity mapping.
Results: Changes in LA volumes and EF before and afterablation for individual patients are shown in Table 1. Mostpatients (9 of 11) had a significant decrease in LA volumeafter ablation. In the six patients in whom EF could becalculated, five of the six had a decrease in LA EF after AFablation. However, all six patients had a decrease in atrialfunction as measured by A-wave velocity (mean velocitypre-ablation 26 cm/s (+ / � 13) and post-ablation 14 cm/s(+ / � 4), p = 0.03). A representative mitral inflow velocitycurve for Patient 3 is shown in Figure 1.
Conclusions: 1) In most patients, LA linear RF ablationresults in a reduction in LA volumes. However, this apparent
Table 1. Changes in LA volume, LA EF, and A-wave velocity before and after AF ablation
Patient
LA
volume
Pre, ml
LA
volume
Post, ml
Volume
change (%)
LA EF
Pre, %
LA EF
Post, %
EF
% change
A-wave
velocity
Pre
(cm/s)
A-wave
velocity
Post
(cm/s)
A-wave
velocity
% Change
1 116 101 �13% 40 43 +8 18 12 �202 72 95 +32% 54 40 �26 29 17 �413 99 76 �23% 48 34 �29 20 14 �304 83 104 +25% 46 35 �24 12 7 �425 94 92 �2% 45 40 �11 28 13 �546 92 63 �32% 46 37 �20 48 18 �637 71 53 �25% N/A N/A – N/A N/A –8 115 89 �23% N/A N/A – N/A N/A –9 72 67 �7% N/A N/A – N/A N/A –10 81 73 �10% N/A N/A – N/A N/A –11 136 124 �9% N/A N/A – N/A N/A –MEAN 94
(+/� 21)85(+/� 21)
�8%(+/� 20)( p = 0.13)
52(+/� 14)
38(+/� 3)
�17%(+/� 14)( p = 0.10)
26(+/� 13)
14(+/� 4)
�37%(+/� 16)( p = 0.03)
Changes in LA volume before and after LA ablation. In patients in sinus rhythm during both exams (Patients 1–6), changes in LA EF and A-wave
velocity was also calculated.
Figure 1. Mitral inflow velocity curves pre- and post-ablation for patient 3. A-wave velocity decreased from 20 cm/s to 14 cm/s.
Oral Abstracts52

positive remodeling did not translate into improved atrialfunction as measured by LA EF and active atrial contactionvelocities (A-wave). In fact, our data indicates that atrialfunction may actually worsen as a result of the extensivelesions produced with LA ablation. 2) Using Cine-MR andphase velocity mapping of mitral inflow, MR imaging is auseful tool to measure left atrial function, especially beforeand after AF ablation.
162. Pulmonary Hypertension: Comparison BetweenPulmonary-Aortic Transit Time Measured by CardiacMagnetic Imaging and Right Heart Catheterization
Martin R. Goyenechea, MD,1 Javier Sanz, MD,1 SantoDellegrottaglie, MD,1 Roxana Sulica, MD,1 Valentin Fuster,MD, PhD,1 Sanjay Rajagopalan, MD,1 Michael Poon, MD.21The Zena and Michael A. Wiener Cardiovascular Institute/Mount Sinai Medical School, New York, NY, USA, 2CabriniMedical Center, New York, NY, USA.
Introduction: Right heart catheterization (RHC) is the goldstandard for diagnosis and assessment of therapeutic responsein pulmonary hypertension (PH). However, it is an invasiveprocedure and is associated with significant risks. Non-invasive parameters that could serve as potential surrogatesfor pulmonary hemodynamics and outcome could be valuablein this disease.
Purpose: The aim of this study is to compare RHChemodynamic measurements with pulmonary-aortic transittime (PATT) as determined by cardiac magnetic resonance(CMR) time-resolved pulmonary angiography in patientswith PH.
Methods: 48 patients with suspected PH (43 women,5 men; age range 24–88 years) underwent CMR includinga left anterior oblique contrast enhanced time resolved 3Dangiogram of the aorta and pulmonary arteries. RHC wasperformed within one week. Using a dedicated workstationfor post-processing, circular regions of interest were drawnin the main pulmonary artery and the ascending aorta.Signal intensity-time curves were generated and the PATTwas calculated measuring the time interval between the peaksignal intensity in the pulmonary artery and in the aorta.
Results: Of the 48 patients, 41 were confirmed to have PH(mean pulmonary artery pressure > 25 mm Hg at rest or 30mm Hg with exercise) by RHC. There was a strong negativecorrelation between pulmonary artery oxygen saturation(PAOS) and PATT (r = � 0.76, P< 0.0001). There was amoderate correlation between PATT and pulmonary vascularresistance index (r = 0.53, P< 0.0001). No significantcorrelation was noted between PATT and mean or systolicpulmonary pressures.
Conclusion: PAOS is a reliable indicator of cardiac indexand a strong predictor of clinical outcome in patients with PH.
Our results demonstrated that PATT correlates negatively withPAOS and positively with pulmonary vascular resistanceindex. Thus PATT as determined by CMR time-resolvedpulmonary angiography may be used as a noninvasivediagnostic technique for assessing and predicting outcomeof this frequently undiagnosed disease.
163. Submillimeter Spatial-ResolutionContrast-Enhanced MRA of the Carotid ArteriesUsing Ferumoxytol in Humans
Vu M. Mai,1 Sean Tutton, MD,1 Wei Li, MD,1 LindaPierchala, BS,2 Belinda S. Y. Li, PhD,3 Ying Wu, MD,1
Pottumarthi V. Prasad, PhD,1 Joel Meyer, MD,1 William J.Ankenbrandt, MD,1 Robert R. Edelman, MD.1 1Radiology,Evanston Northwestern Healthcare and Feinberg School ofMedicine, Northwestern University, Evanston, IL, USA,2Radiology, Evanston Northwestern Healthcare, Evanston,IL, USA, 3Applied Science Laboratory Central, GE Health-care, Evanston, IL, USA.
Purpose: To study the feasibility of very high-resolu-tion CE-3DMRA of the extracranial carotid artery (CA)using ferumoxytol.
Introduction: Current first-pass methods for CE-3DMRAof the CA suffer from limited spatial resolution. This problemcan be overcome using nearly isotropic, very high-resolutionMRA with ferumoxytol.
Methods and Subjects: Ferumoxytol (Advanced MagneticsInc., Boston, MA), an iron oxide blood pool contrast agentwith a plasma half-life of 14 hours, was used to obtain veryhigh-resolution MRA of the extracranial CA. Studies wereperformed with IRB approval and informed, written consent.A dosage of 4 mg/kg diluted to 7.5 mg/ml was infused at 2 cc/sec. All studies were performed on a 1.5 T system (GEMedical Systems, Milwaukee, WI) equipped with TwinSpeedgradients and a 4-channel neurovascular coil and a 4-channelcarotid coil. A series of 10 subjects (6 volunteers and 4patients, 4 male/6 female, average age of 51.1) were studied.First-pass imaging was performed using a temporally-resolved TRICKS acquisition with the neurovascular coil.This was followed by an optimized very high-resolution3DMRA sequence using the following parameters: TR/TE of4.9 msec/1.4 msec, sampling BW of 83 kHz, FOV 26 cm,matrix size of 512 � 512, 1 NEX, and interpolated partitionthickness of 0.8 mm. The in-plane spatial resolution was0.5 mm � 0.5 mm. An axial 3D volume of 128 partitionscovering the circle of Willis through the extracranial carotidbifurcation was acquired in approximately 5.5 min. Inaddition, a 3DMRA with lower in-plane resolution (1.0mm � 1.0 mm, i.e. a matrix of 256 � 256) as well as a pre-contrast axial 2D TOF MRA with an in-plane resolution of1.0 mm � 2.0 mm were acquired. We then changed to the
53Oral Abstracts

carotid coil, and repeated the 3DMRA acquisitions at theaforementioned spatial resolutions. The volume location wascentered on the bifurcation of the CA. In addition, we alsoacquired 3DMRA at isotropic voxel resolution of 0.4mm � 0.4 mm � 0.4 mm from 5 of the 10 subjects (3volunteers and 2 patients).
Multiplanar and maximum intensity reconstructions wereperformed. SNR of blood, muscle, and fat and CNR of bloodrelative to muscle and fat were measured in the source image ofmultiplanar reconstructions. Each source image was selectedat level immediately before the carotid arteries bifurcated.
Results: No adverse events occurred. Very high-resolutionMR angiograms showed improved delineation of the CAcompared with first-pass images, steady-state images acquiredat 256 � 256, and 2D TOF MRA. Oblique multiplanarreconstructions eliminated venous overlap and providedexcellent delineation of the carotid bifurcations from ahealthy and a patient volunteer with confirmed partialstenoses (Fig. 1). The average SNR and CNR from allsubjects listed in Table 1 show that very high-resolution CE-3DMRA of the extracranial CA using ferumoxytol is feasibleand can be useful in measuring the degree of stenosis.
Conclusion: Limitation of spatial resolution of currentfirst-pass methods for CE-3DMRA of the CA can beovercome using nearly isotropic, very high-resolution MRA
with ferumoxytol. The method has the potential to improvethe accuracy and precision of measurements of carotid arterydisease compared with current MRA methods.
164. Real-Time Guidance Strategy for PulmonaryVein Ablations: Is XMR A Feasible Approach?
Sanjeet Hegde, MBBS, MRCPCH,1 Kawal Rhode, PhD,2
P. Lambiase, MBBS, MRCP,3 M. Sermesant, PhD,2 D. Hill,PhD,2 J. Gill, MBBS, MRCP,3 Reza Razavi, MBBS, MRCP,MD.1 1Imaging Sciences/Pediatric Cardiology, King’s Col-lege London, London, UK, 2Imaging Sciences, King’s CollegeLondon, London, UK, 3Cardiology, St. Thomas’ Hospital,London, UK.
Introduction: Hybrid XMR interventional suites with X-rayand Magnetic Resonance (MR) imaging facilities offer thepotential to carry out catheter interventions using a combi-nation of the imaging techniques.
Hypothesis: XMR guided intervention combining MRthree-dimensional anatomical images with conventional x-ray fluoroscopic images facilitates interventional cardiaccatheterisation and radio-frequency ablation.
Methods: Imaging: Two MR scans were performed, onewas a multislice volume (typically 512 � 512 matrix, 40slices, resolution = .68 � . 68 � 1.4 mm3, TR = 4.3 ms,TE = 1.4 ms, flip angle = 40�) to localise a skin marker andthe other was a Gadolinium enhanced magnetic resonanceangiography (typically 512 � 512 matrix, 50 slices, reso-lution = .84 � .84 � 1.8 mm3, TR = 3.8 ms, TE = 1.2 ms,flip angle = 40�) of the relevant anatomy was performedin all patients and volume rendering of the pulmonaryveins obtained.
Procedure: Following MR acquisition patients weremoved to the x-ray end of the suite were optical trackingwas used to determine the transformation matrices relatingMR and x-ray image coordinates thus allowing real-timeimage fusion.
We applied the XMR technique to guide pulmonary veinablation in ten patients (n = 10) with atrial fibrillation. Duringthe procedure, the guidance system displayed the MR derivedanatomical surface overlaid onto the x-ray images of the
Figure 1. Shown are the right carotid arteries at isotropic resolutionof 0.4 mm � 0.4 mm � 0.4 mm from a normal volunteer (left) anda patient with partially stenosed carotid artery (right).
Table 1. The average snr and cnr and their standard deviations from all volunteers of 3dmra data acquired with neurovascular and carotidcoils at different in-plane spatial resolutions (b-blood, m-muscle, f-fat)
Coil Matrix
SNR CNR
B M F B-M B-F
Neurovascular 256 � 256 55.5 ± 26.7 7.9 ± 2.7 24.6 ± 11.0 47.7 ± 24.4 30.9 ± 20.1512 � 512 15.2 ± 3.7 3.4 ± 0.8 8.6 ± 2.8 11.8 ± 3.0 6.6 ± 2.6
Carotid 256 � 256 211.3 ± 85.7 22.1 ± 7.1 121.4 ± 55.9 189.2 ± 86.9 89.9 ± 43.8512 � 512 69.2 ± 24.2 9.0 ± 3.1 47.3 ± 24.3 60.1 ± 25.4 21.9 ± 13.2
Oral Abstracts54

catheters being used. The view selection mode of theguidance system was also used at times to orientate thec-arm to gain the appropriate x-ray view. Registration errorswere shown to be clinically acceptable for alignment ofimages of the heart and the great vessels.
Results: The interventionalists were able to employ theXMR technique to guide a 16 electrode helical ablationcatheter (Revelation Helix, Cardima, CA, USA) into threepulmonary veins (right upper, left upper and left lower) tocarry out electrical isolation in all cases. Figure 1 shows theguidance system overlay when the delivery catheter wasplaced in the left lower pulmonary vein.
Conclusion: This technique offers a distinct advantageover conventional approach by way of superior anatomicalvisualisation of the left heart allowing easier guidance ofcatheters into the pulmonary veins. We were also able tochoose working x-ray views without the administration of anyadditional x-ray dose by moving the c-arm until theanatomical overlay was suitably positioned. We havedemonstrated that our technique can be successfully used toguide cardiac electrophysiology procedures.
165. Cartesian Self-Gated Cine MRI: InitialClinical Experience
David N. Sandman, MD,1 James C. Carr, MD,1 JohnSalanitri, MD,1 Mark E. Crowe, MS,1 Randall R. Kroeker,PhD,2 Andrew C. Larson, PhD,1 F. Scott Pereles, MD,1
Orlando P. Simonetti, PhD.2 1Department of Radiology,Feinberg School of Medicine, Northwestern University,Chicago, IL, USA, 2Siemens Medical Solutions, Chicago,IL, USA.
Introduction: ECG-gating requires additional patient prepa-ration time, is susceptible to RF and magnetic interference,and is ineffective in a significant percentage of patients(Wozney et al., 1990). More recently, self-gating techniqueshave been described using either radial (Larson et al., 2004)
or conventional Cartesian (Crowe et al., 2004) k-spacesampling to potentially eliminate the need for externalphysiological signal monitoring. Self-gated cine with Carte-sian sampling avoids the streak artifacts of radial imaging,and was recently shown to have equivalent image quality toECG gated cine in a sample of healthy volunteers (Croweet al., 2004). The purpose of this study is to demonstrate theclinical effectiveness of the self-gated cine sequence in asample of patients referred for clinical cardiac MRI exams.
Methods: The sequence: This technique is a modifiedretrospectively gated TrueFISP cine sequence that acquires ashort second echo after the readout and phase gradients haverewound. The peak amplitude of the second echo varies inproportion to the average signal in the image, which isexpected to change in synchrony with the cardiac cycle. Aband-pass filter (0.2 Hz–3 Hz pass-band) is applied to theecho-peak information to remove noise, and a peak-detectionalgorithm determines the trigger times.
Experimental Setup: Three to five slices, including shortand long-axis views, were obtained in 9 patients (6 female, 3male, 21–92 years [mean 56 years]) for a total of 40measurements. ECG and self-gated image series were
Figure 1.
Table 1. Results of data analysis
Mean single-plane
ejection fraction
Mean
overall image
quality score
Mean
artifact
score
ECG-gating 55.35 (n = 19) 3.67 (n = 40) 0.55 (n = 40)
Self-gating 56.11 (n = 19) 3.56 (n = 40) 0.72 (n = 40)
P-value 0.13 0.07 < 0.001
The differences in ejection fractions and overall image quality were not
statistically significant (p > 0.05). Artifact differences were significant
though both mean scores were less than 1, signifying a less than
‘‘minimal’’ artifact score.
Figure 1. This self-gated, Cartesian True FISP sequence uses a shortsecond echo to acquire the central k-space information necessary toderive a gating signal.
55Oral Abstracts
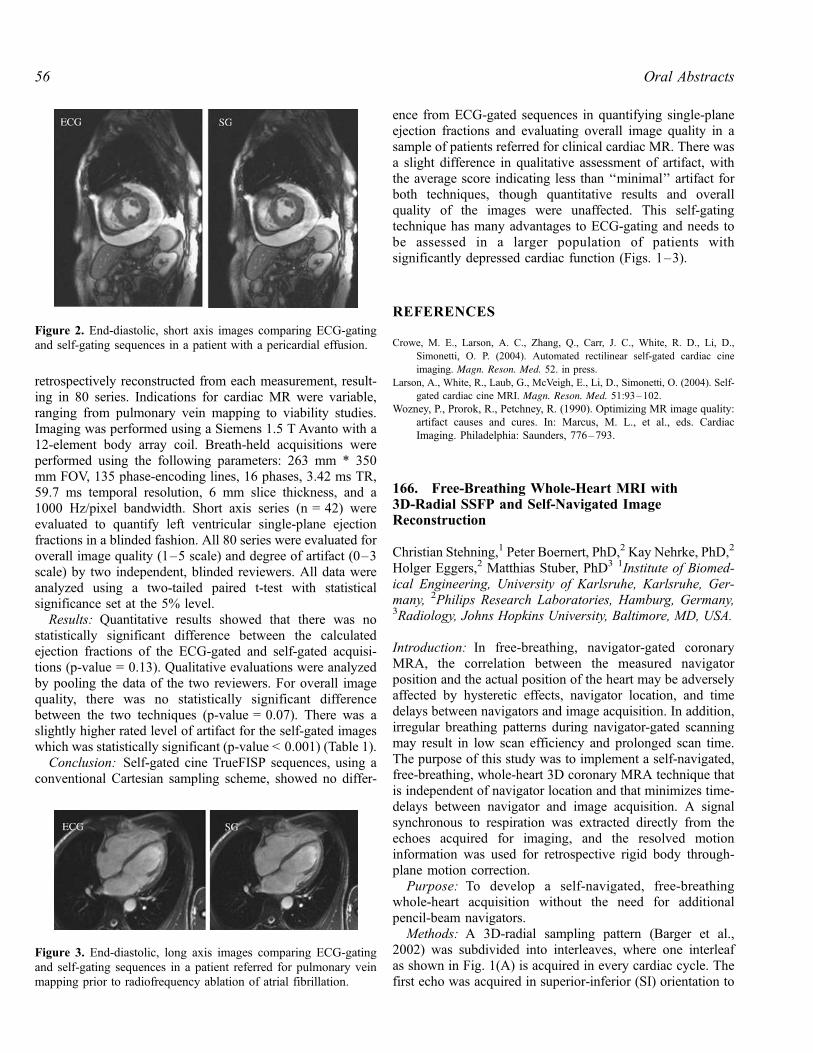
retrospectively reconstructed from each measurement, result-ing in 80 series. Indications for cardiac MR were variable,ranging from pulmonary vein mapping to viability studies.Imaging was performed using a Siemens 1.5 T Avanto with a12-element body array coil. Breath-held acquisitions wereperformed using the following parameters: 263 mm * 350mm FOV, 135 phase-encoding lines, 16 phases, 3.42 ms TR,59.7 ms temporal resolution, 6 mm slice thickness, and a1000 Hz/pixel bandwidth. Short axis series (n = 42) wereevaluated to quantify left ventricular single-plane ejectionfractions in a blinded fashion. All 80 series were evaluated foroverall image quality (1–5 scale) and degree of artifact (0–3scale) by two independent, blinded reviewers. All data wereanalyzed using a two-tailed paired t-test with statisticalsignificance set at the 5% level.
Results: Quantitative results showed that there was nostatistically significant difference between the calculatedejection fractions of the ECG-gated and self-gated acquisi-tions (p-value = 0.13). Qualitative evaluations were analyzedby pooling the data of the two reviewers. For overall imagequality, there was no statistically significant differencebetween the two techniques (p-value = 0.07). There was aslightly higher rated level of artifact for the self-gated imageswhich was statistically significant (p-value < 0.001) (Table 1).
Conclusion: Self-gated cine TrueFISP sequences, using aconventional Cartesian sampling scheme, showed no differ-
ence from ECG-gated sequences in quantifying single-planeejection fractions and evaluating overall image quality in asample of patients referred for clinical cardiac MR. There wasa slight difference in qualitative assessment of artifact, withthe average score indicating less than ‘‘minimal’’ artifact forboth techniques, though quantitative results and overallquality of the images were unaffected. This self-gatingtechnique has many advantages to ECG-gating and needs tobe assessed in a larger population of patients withsignificantly depressed cardiac function (Figs. 1–3).
REFERENCES
Crowe, M. E., Larson, A. C., Zhang, Q., Carr, J. C., White, R. D., Li, D.,
Simonetti, O. P. (2004). Automated rectilinear self-gated cardiac cine
imaging. Magn. Reson. Med. 52. in press.
Larson, A., White, R., Laub, G., McVeigh, E., Li, D., Simonetti, O. (2004). Self-
gated cardiac cine MRI. Magn. Reson. Med. 51:93–102.
Wozney, P., Prorok, R., Petchney, R. (1990). Optimizing MR image quality:
artifact causes and cures. In: Marcus, M. L., et al., eds. Cardiac
Imaging. Philadelphia: Saunders, 776–793.
166. Free-Breathing Whole-Heart MRI with3D-Radial SSFP and Self-Navigated ImageReconstruction
Christian Stehning,1 Peter Boernert, PhD,2 Kay Nehrke, PhD,2
Holger Eggers,2 Matthias Stuber, PhD3 1Institute of Biomed-ical Engineering, University of Karlsruhe, Karlsruhe, Ger-many, 2Philips Research Laboratories, Hamburg, Germany,3Radiology, Johns Hopkins University, Baltimore, MD, USA.
Introduction: In free-breathing, navigator-gated coronaryMRA, the correlation between the measured navigatorposition and the actual position of the heart may be adverselyaffected by hysteretic effects, navigator location, and timedelays between navigators and image acquisition. In addition,irregular breathing patterns during navigator-gated scanningmay result in low scan efficiency and prolonged scan time.The purpose of this study was to implement a self-navigated,free-breathing, whole-heart 3D coronary MRA technique thatis independent of navigator location and that minimizes time-delays between navigator and image acquisition. A signalsynchronous to respiration was extracted directly from theechoes acquired for imaging, and the resolved motioninformation was used for retrospective rigid body through-plane motion correction.
Purpose: To develop a self-navigated, free-breathingwhole-heart acquisition without the need for additionalpencil-beam navigators.
Methods: A 3D-radial sampling pattern (Barger et al.,2002) was subdivided into interleaves, where one interleafas shown in Fig. 1(A) is acquired in every cardiac cycle. Thefirst echo was acquired in superior-inferior (SI) orientation to
Figure 2. End-diastolic, short axis images comparing ECG-gatingand self-gating sequences in a patient with a pericardial effusion.
Figure 3. End-diastolic, long axis images comparing ECG-gatingand self-gating sequences in a patient referred for pulmonary veinmapping prior to radiofrequency ablation of atrial fibrillation.
Oral Abstracts56

sense respiratory motion using a center-of-mass approach(Larson et al., 2004) [‘‘navigator projection’’, Fig. 1(B)]. Thesequence was implemented on a commercial 1.5 Tesla MRsystem (Philips Intera) equipped with a 5-element cardiacphased array coil. A bright-blood sequence (steady state freeprecession, SSFP) was used. To suppress signal from thestatic anterior chest wall, a regional saturation (REST) slabwas applied prior to sampling. The following sequenceparameters were used: a/2-TR/2 start-up pulse; 20 dummycycles; 32 readouts per RR-interval; a = 60�; matrix: 2563;FOV: (300 mm)3; voxel size: (1.17 mm)3; TR/TE: 4.2/2.1 ms;16384 readouts, receiver bandwidth 781 Hz/pixel. Formotion-corrected image reconstruction, the echoes measuredin each cardiac cycle were modulated with a linear phase ink-space, which is determined by the SI-shift measured usingthe navigator projections and the azimuthal angle of thecurrent readout.
To visualize the coronary vessels, the isotropic image dataset was reformatted off-line. The images obtained with theself-navigated image reconstruction were compared to theresults obtained using conventional prospective pencil-beamnavigator tracking.
Results: A motion-corrected image using the conventionalpencil-beam navigator for respiratory tracking is shown inFig. 2(A), while a motion-corrected image using the self-navigated image reconstruction is displayed in Fig. 2(B). Onboth images, the proximal right coronary artery (RCA) isvisualized. However, the vessel appears with better delinea-tion and contrast when self-navigation is used. Some resid-ual motion artifacts (blurring and streaking) are present inboth images.
Discussion: This preliminary in-vivo study has shown thatusing the proposed 3D-radial acquisition scheme withnavigator projections, a signal synchronous to respirationcan directly be extracted from the image data, and canbe used for retrospective respiratory motion correction. The
motion information is obtained from a projection throughthe heart instead of the diaphragmatic position, which mayeliminate potential hysteretic effects, and a minimal delaybetween the measurement of respiratory motion and theimage acquisition is obtained. With this technique, the imagequality was improved when compared to images obtainedusing a pencil-beam navigator for tracking. Residual motionartifacts primarily originate from static structures (e.g.anterior chest wall) in the imaged volume. However, thisis a limitation of navigator tracking using pencil beamsas well.
Conclusion: A fast, free-breathing whole-heart 3D coro-nary MRI technique with isotropic spatial resolution andintrinsic suppression of respiratory motion artifacts wasimplemented on a commercial MRI system. No additionalpencil-beam navigators were neccessary, and the methodpermits the use of magnetization preparation pulses withoutcompromising the performance of respiratory motion detec-tion and -correction.
REFERENCES
Barger, A. V., et al. (2002). MRM 48:. 297–305.
Larson, A. C., et al. (2004). MRM 51:. 93–102.
167. Intraindividual Comparison of Coronary MRAngiography and Coronary CT Angiography inCalcified Coronary Segments
Murat Ozgun,1 Michael Rink,1 Andreas Hoffmeier, MD,2
Rene M. Botnar, PhD,3 Walter Heindel, MD,1 RomanFischbach, MD,1 David Maintz, MD.1 1Department ofDiagnostic Radiology, University of Muenster, Muenster,Germany, 2Department of Cardiothoracic Surgery, Universityof Muenster, Muenster, Germany, 3Beth Israel DeaconessMedical Center, Cardiovascular Division, Boston, MA, USA.
Figure 2. In vivo experiment. A reformatted view of the RCAfrom a volumetric acquisition obtained with navigator tracking (A)and with self-navigated image reconstruction (B). LV = leftventricle, RV = right ventricle, PA = pulmonary artery, RCA =right coronary artery.
Figure 1. 3D Radial sampling with navigator projection. Theacquisition of k-space is divided into interleaves, of which one isshown (A). The black solid line is the first echo, which is oriented inSI-direction. The respiration-induced bulk cardiac motion wasextracted in-vivo from the 1D-FT of this echo [navigator projection,(B)] using a center-of-mass approach. The measured respiration-induced SI-shift of the heart is plotted as a solid curve in (B).
57Oral Abstracts

Introduction: Coronary MR Angiography (CMRA) andCoronary CT Angiography (CTA) are alternative modalitiesfor noninvasive coronary angiography.
Purpose: To investigate the effect of calcifications on theinterpretability of luminal stenosis using Turbo-Field-Echo(TFE) and Steady-State-Free-Precession (SSFP) coronaryMRA sequences in comparison to multidetector-row CTA.
Methods: 21 patients with known CAD were examinedwith a navigator (NAV) gated and corrected free-breathing3D-segmented-gradient-echo (TFE) CMRA sequence (in-plane resolution 0.7 � 0.7 mm), a 3D-SSFP-CMRA se-quence (inplane resolution 1 � 1 mm) and 16-slice coronaryCTA (in-plane resolution ca. 0.3 � 0.3 mm). CMRA wasperformed either in transverse orientation for the left (5segments: LM, LAD prox., LAD mid., CX prox., Cx mid.) orin a double oblique plane along the right coronary arterysystem (prox., mid. and distal segment). Segment-basedanalysis for the detection stenoses larger than 50% wasperformed and compared to results of the goldstandardconventional x-ray coronary angiography (XA). For calcifi-cation grading, each calcified plaque’s mass was measuredusing a standard calcium scoring tool. Segments with relevantartery stenoses in XA were divided into four groups (A–D)according to their mass of calcification: group A was notevaluable in CTA because of severe calcification, group Bhigh-grade calcification (> 25 mg CaHA), group C with amass of 10–24.99 mg CaHA and group D with low mass (0–9.99 mgCaHA) (Fig. 1).
Results: Of 168 possible segments, 26 were calcified, hada relevant stenosis and were imaged by all three modalities. 9segments were not evaluable because of severe calcificationin CTA (group A, mean calcification 41.24 ± 28 mg CaHA).
Of these, 4/6 were accurately diagnosed by SSFP, 3 segmentswere not evaluable due to poor image quality. With the TFEsequence accuracy was 2/4 with 5 segments not evaluable.For the other groups the accuracy for the detection of relevantartery stenoses in calcified segments were: group B included7 segments (mean calcification 44.24 ± 18.85 mg CaHA):CTA accuracy 6/7, SSFP: 5/7, TFE: 2/3 with 4 excludedsegments because of insufficient image quality. Group Cincluded 10 segments (mean calcification 17.42 mgCaHA ± 4.38 mg): CTA accuracy 8/10, SSFP: 6/9, 1segment not evaluable, TFE: 5/9, 1 segment not evaluable.Group D included 9 segments (mean calcification 1.49 ± 2.9mg CaHA): CTA accuracy 7/9, SSFP: 8/9, TFE: 5/7, 2excluded segments.
Conclusions: In segments with severe calcifications notinterpretable with CTA, MRA might provide additionalinformation. SSFP seemed to be superior for the detection orexclusion of coronary stenosis in comparison to TFE. For allthree groups with segments interpretable by CTA, CTA offeredsuperior accuracy compared to both CMRA sequences.
168. Feasibility of Single Breath-Hold Whole HeartCoverage Coronary MRA Using Highly AcceleratedParallel Imaging with a 32-Channel MR System
Thoralf Niendorf, PhD,1 Christopher J. Hardy, PhD,2 RandyO. Giaquinto,2 Patrick Gross, PhD,2 Harvey Cline, PhD,2
Robert D. Darrow,2 Shmuel Cohen, MAB,3 Sanjay Joshi,4
Gontran Kenwood, PhD,2 Neil M. Rofsky, MD,3 Daniel K.Sodickson, PhD, MD.3 1GE Healthcare Technologies,Applied Science Laboratory, Department of Radiology,Beth Israel Deaconess Medical Center, Harvard MedicalSchool, Boston, MA, USA, 2GE Global Research Center,Niskayuna, NY, USA, 3Department of Radiology, Beth IsraelDeaconess Medical Center, Harvard Medical School,Boston, MA, USA, 4GE Healthcare Technologies, Waukesha,WI, USA.
Introduction: Clinical 3D MRA applications are generallyrestricted to thin targeted slabs due to the competingconstraints of acquisition time, signal-to-noise ratio (SNR)and spatial resolution. Alternatively, the use of large imagingvolumes supports the visualization of tortuous segments ofthe coronary arteries using free breathing techniques (Weberet al., 2003). The use of many element coil arrays inconjunction with order-of-magnitude accelerated parallelimaging offers the potential for baseline SNR improvements,enhancements in the immunity to physiological motion andfundamental scan time reductions. It also affords the use ofheretofore inaccessible comprehensive imaging volumes forsingle breath-hold whole heart coverage CMRA.
Purpose: This study demonstrates the feasibility of wholeheart coverage CMRA using parallel imaging with two-dimensional accelerations (net acceleration as high as 16-fold)
Figure 1. High-grade stenosis of proximal right coronary artery asproven in XA. CTA shows severe calcification, degree of stenosisnot assessable. Both MRA sequences (TFE, SSFP) nicely depictthe stenosis.
Oral Abstracts58

with a 32-channel coil array/receiver system withoutexceeding clinically acceptable breath-hold times. Thisapproach may render localizer scans obsolete and enhancepatient comfort by substantially reducing otherwise prohib-itive examination times.
Methods: Our 32-channel parallel array consisted of two4 � 4 arrays on separated clamshell formers measuringapproximately 40 cm (Hardy et al., 2003; Zhu et al., 2004).A 32-channel acquisition system including multiple sets ofsystem electronics (GE Medical Systems, Waukesha, WI,USA) was employed for signal transmission/reception. A 3DSSFP pulse sequence was customized to synchronize theprospectively ECG gated data acquisition for all 32 channels.CMRA was conducted on normal volunteers. 3D SSFP wasperformed using: FOV = 40 cm, data matrix = 256 � 256,TE = 1.9 ms, TR = 3.7 ms. Data acquisition is completed in asingle heartbeat for each acquired slice partition (Niendorf etal., 2004). Net acceleration factors of 8 (4 � 2) to 16 (4 � 4)were applied for 2D acceleration distributed to both phaseencoding directions. For single breath-hold whole heartcoverage CMRA large 3D axial slabs consisting of up to120 slice partitions covering a S-I volume of 12 cm wereacquired (interpolated voxel size of (0.8 � 0.8 � 1.0) mm3).Images were reconstructed using the generalized encodingmatrix approach (Sodickson et al., 2001).
Results: Highly accelerated large-volume CMRA is com-pared with traditional thin-slab CMRA in Figure 1. Theapplication of 8-fold (4 � 2) accelerated parallel imagingin conjunction with 3D SSFP revealed high image qualityas demonstrated in Fig. 1A. The origin, proximal and moredistal segments of the RCA are clearly visible for the highlyaccelerated large volume approach (Fig. 1A). For com-parison Fig. 1B depicts the image quality derived with theunaccelerated conventional approach using restricted targetedslab acquisition. As shown in Fig. 2 clear delineation of the
proximal segment of the RCA is still preserved for large-volume scans at acceleration factors as high as 16 (4 � 4),though available SNR becomes progressively challenging asacceleration increases. Note, the 16-fold accelerated dataset(Fig. 2B) also used a reduced slice thickness compared withthe 8-fold accelerated data set (Fig. 2A), which alsocontributed to the SNR degradation.
Conclusions: Our initial experience suggests that singlebreath-hold CMRA with a 32-channel system is feasible andmay provide benefits for clinical coronary MRA. Thereported highly accelerated parallel imaging acquisitionstrategies enable whole heart coverage CMRA acquisitionswith otherwise unattainable scan times. This holds thepromise to extend the capabilities of breath-hold CMRAfrom multiple targeted slabs to single large volumes allowingcomprehensive coverage. Highly accelerated robust singlebreath-hold whole heart coverage CMRA also promisesfurther scan time reduction compared to free-breathingtechniques. This, in turn, may enable integration of CMRAinto a comprehensive cardiac examination for the detection ofheart disease while improving both operator convenience andpatient comfort. In conclusion, significant improvements inSNR may be expected with the use of many-element arraystailored to fields of view generally used in cardiac MRI.Consequently, future studies including clinical comparisonsare planned with prototype 32-element cardiac arrays.
REFERENCES
Hardy, C. J., et al. (2003). ISMRM Proc. 471.
Niendorf, T., et al. (2004). ISMRM Proc. 1876.
Sodickson, D. K., et al. (2001). Med. Phys. 28:. 1629.
Weber, O., et al. (2003). MRM 50:. 1223.
Zhu, Y., et al. (2004). MRM. in press.
Figure 1. RCA images (MIP, 3 mm slice thickness) obtained fromsingle breath-hold scans of the same subject using (A) acomprehensive volume acquisition (12 cm S-I coverage) togetherwith 8-fold (4 � 2) accelerated parallel imaging and (B) anunaccelerated small targeted slab acquisition. Images were acquiredusing a 32 element RF-coil array. The origin, proximal and distalportion of the RCA are visualized in the raw data sets obtained forboth large volume and the targeted slab acquisition.
Figure 2. Zoomed RCA images (MIP, 3 mm slice thickness)obtained from 25 sec. breath-hold scans using (A) 8-fold accelerated(4 � 2, 60 slices, slice thickness = 2 mm) and (B) 16-foldaccelerated (4 � 4, 120 slices, slice thickness = 1 mm) parallelimaging. Note the clear delineation of the proximal segment of theRCA for both scans (A, B) but also the increase in the noiseamplification when advancing towards very high accelerationfactors of much as 16 (4 � 4) (B).
59Oral Abstracts
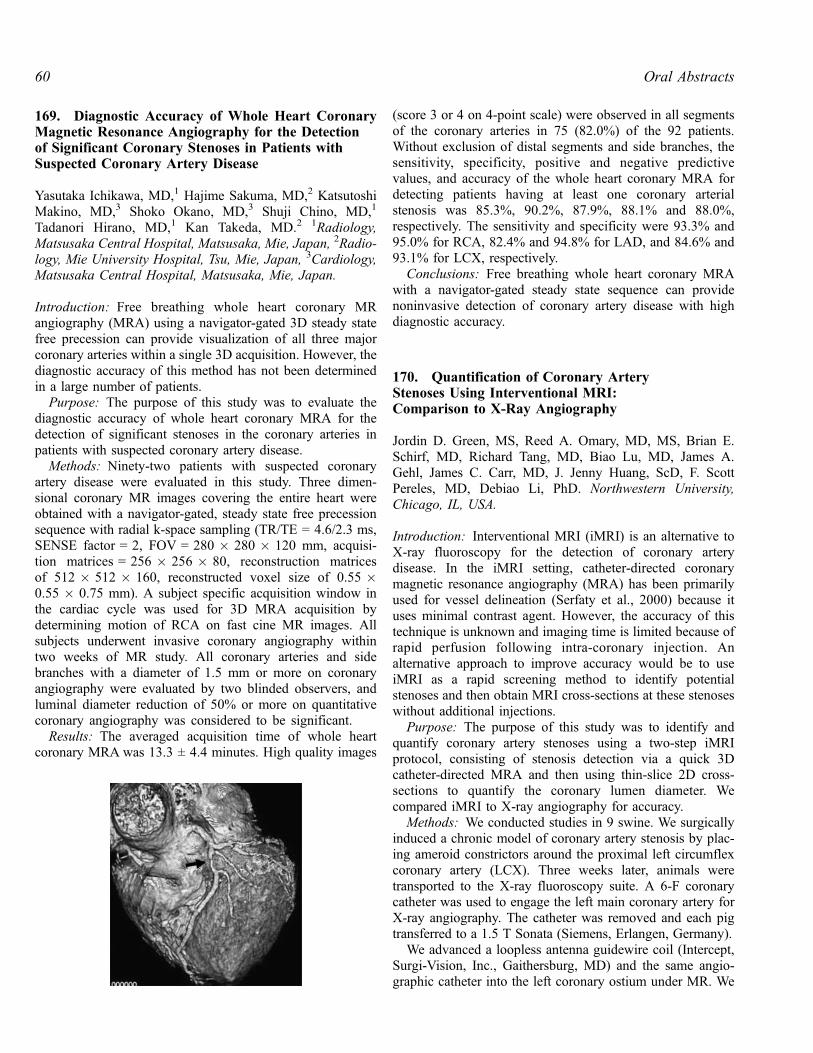
169. Diagnostic Accuracy of Whole Heart CoronaryMagnetic Resonance Angiography for the Detectionof Significant Coronary Stenoses in Patients withSuspected Coronary Artery Disease
Yasutaka Ichikawa, MD,1 Hajime Sakuma, MD,2 KatsutoshiMakino, MD,3 Shoko Okano, MD,3 Shuji Chino, MD,1
Tadanori Hirano, MD,1 Kan Takeda, MD.2 1Radiology,Matsusaka Central Hospital, Matsusaka, Mie, Japan, 2Radio-logy, Mie University Hospital, Tsu, Mie, Japan, 3Cardiology,Matsusaka Central Hospital, Matsusaka, Mie, Japan.
Introduction: Free breathing whole heart coronary MRangiography (MRA) using a navigator-gated 3D steady statefree precession can provide visualization of all three majorcoronary arteries within a single 3D acquisition. However, thediagnostic accuracy of this method has not been determinedin a large number of patients.
Purpose: The purpose of this study was to evaluate thediagnostic accuracy of whole heart coronary MRA for thedetection of significant stenoses in the coronary arteries inpatients with suspected coronary artery disease.
Methods: Ninety-two patients with suspected coronaryartery disease were evaluated in this study. Three dimen-sional coronary MR images covering the entire heart wereobtained with a navigator-gated, steady state free precessionsequence with radial k-space sampling (TR/TE = 4.6/2.3 ms,SENSE factor = 2, FOV = 280 � 280 � 120 mm, acquisi-tion matrices = 256 � 256 � 80, reconstruction matricesof 512 � 512 � 160, reconstructed voxel size of 0.55 �0.55 � 0.75 mm). A subject specific acquisition window inthe cardiac cycle was used for 3D MRA acquisition bydetermining motion of RCA on fast cine MR images. Allsubjects underwent invasive coronary angiography withintwo weeks of MR study. All coronary arteries and sidebranches with a diameter of 1.5 mm or more on coronaryangiography were evaluated by two blinded observers, andluminal diameter reduction of 50% or more on quantitativecoronary angiography was considered to be significant.
Results: The averaged acquisition time of whole heartcoronary MRA was 13.3 ± 4.4 minutes. High quality images
(score 3 or 4 on 4-point scale) were observed in all segmentsof the coronary arteries in 75 (82.0%) of the 92 patients.Without exclusion of distal segments and side branches, thesensitivity, specificity, positive and negative predictivevalues, and accuracy of the whole heart coronary MRA fordetecting patients having at least one coronary arterialstenosis was 85.3%, 90.2%, 87.9%, 88.1% and 88.0%,respectively. The sensitivity and specificity were 93.3% and95.0% for RCA, 82.4% and 94.8% for LAD, and 84.6% and93.1% for LCX, respectively.
Conclusions: Free breathing whole heart coronary MRAwith a navigator-gated steady state sequence can providenoninvasive detection of coronary artery disease with highdiagnostic accuracy.
170. Quantification of Coronary ArteryStenoses Using Interventional MRI:Comparison to X-Ray Angiography
Jordin D. Green, MS, Reed A. Omary, MD, MS, Brian E.Schirf, MD, Richard Tang, MD, Biao Lu, MD, James A.Gehl, James C. Carr, MD, J. Jenny Huang, ScD, F. ScottPereles, MD, Debiao Li, PhD. Northwestern University,Chicago, IL, USA.
Introduction: Interventional MRI (iMRI) is an alternative toX-ray fluoroscopy for the detection of coronary arterydisease. In the iMRI setting, catheter-directed coronarymagnetic resonance angiography (MRA) has been primarilyused for vessel delineation (Serfaty et al., 2000) because ituses minimal contrast agent. However, the accuracy of thistechnique is unknown and imaging time is limited because ofrapid perfusion following intra-coronary injection. Analternative approach to improve accuracy would be to useiMRI as a rapid screening method to identify potentialstenoses and then obtain MRI cross-sections at these stenoseswithout additional injections.
Purpose: The purpose of this study was to identify andquantify coronary artery stenoses using a two-step iMRIprotocol, consisting of stenosis detection via a quick 3Dcatheter-directed MRA and then using thin-slice 2D cross-sections to quantify the coronary lumen diameter. Wecompared iMRI to X-ray angiography for accuracy.
Methods: We conducted studies in 9 swine. We surgicallyinduced a chronic model of coronary artery stenosis by plac-ing ameroid constrictors around the proximal left circumflexcoronary artery (LCX). Three weeks later, animals weretransported to the X-ray fluoroscopy suite. A 6-F coronarycatheter was used to engage the left main coronary artery forX-ray angiography. The catheter was removed and each pigtransferred to a 1.5 T Sonata (Siemens, Erlangen, Germany).
We advanced a loopless antenna guidewire coil (Intercept,Surgi-Vision, Inc., Gaithersburg, MD) and the same angio-graphic catheter into the left coronary ostium under MR. We
Oral Abstracts60

then performed MRA using 3D thick-partition magnetization-prepared SSFP with intra-coronary injection of dilutedgadolinium. Once the stenosis was localized, we acquired2D SSFP cross-section images at and proximal to the stenosiswithout contrast injection.
Typical sequence parameters for 3D contrast-enhancedMRA: TR/TE/flip angle = 3.8 ms/1.5 ms/70�, 2 partitionsinterpolated to 4, partition thickness = 10 mm, reso-lution = 1.1 � 0.8 mm2; for 2D cross-section imaging: TR/TE/flip angle = 3.8 ms/1.7 ms/65�, slice thickness = 2 mm,resolution = 0.8 � 0.8 mm2, 4 signal averages.
We calculated percent stenosis for each of the three datasets (X-ray angiography, 3D contrast-enhanced MRA, 2Dcross-sectional MRI) using full width at half maximum(FWHM) criteria. MRA data sets were used to screen subjectsfor the presence of CAD. At all sites that MRA detected astenosis of � 30%, we performed subsequent cross-sectionalMRI. 30% was chosen because it was assumed that the errorfor MRA is at least as great as the error for X-ray angiography[up to 20%, (Key et al., 1987] and a 50% stenosis isconsidered clinically significant. To compare the ability ofX-ray fluoroscopy and cross-sectional MRI to quantify CAD,we measured agreement between percent stenosis valuesusing the intra-class correlation coefficient (ICC). Alpha wasset to 0.05.
Results: X-ray angiography was successfully performed in9/9 pigs. Under MR, the coronary ostium was successfullyengaged in 8/9 pigs. 3D catheter-directed MRAwas performedin the 8 animals where catheterization was successful. A per-cent stenosis of � 30% was detected in 8/8 pigs. This data set
was then used to plan MR cross-sections of the LCX (Fig. 1).In the one animal where the coronary ostium was not engaged,the pre-contrast LCX localizer was used to plan the proximaland stenosis cross-sections. Cross-sectional MRI was com-pared to X-ray fluoroscopy in all surgically prepared animals(Fig. 2). The ICC was 0.955 (p < 0.05).
Conclusion: The combination of catheter-directed MRAand cross-sectional MRI successfully identifies andquantifies coronary artery stenoses in swine. This two-stepiMRI approach may be useful for future MRI-guidedcoronary interventions.
REFERENCES
Key, H., et al. (1987). Br. J. Radiol. 60:. 1083–1088.
Serfaty, J.-M., et al. (2000). Radiology 217:. 290–295.
171. Coronary MRA at 3.0 Tesla Compared to 1.5Tesla: Initial Results in Patients with SuspectedCoronary Artery Disease
Matthias Hackenbroch, MD,1 Carsten Meyer,1 AlexandraSchmiedel,1 Jurgen Gieseke,1 Claus Tiemann,2 Hans Schild,1
Torsten Sommer.1 1Radiology, University of Bonn, Bonn,Germany, 2Cardiology, University of Bonn, Bonn, Germany.
Introduction: The recent development of 3.0 T MR systemswith whole-body volume radio-frequency (RF) coils anddedicated phased array coil technology has led to an increasedinterest in high-field cardiac imaging, and preliminaryexperience with cardiac imaging at 3.0 T and higher fieldstrengths has been reported.
Purpose: To evaluate prospectively the feasibility, imagequality and accuracy of coronary MRA at 3.0 T in patientswith suspected coronary artery disease and to compare
Figure 1. Coronary angiograms with corresponding MRI cross-sections. A) X-ray angiography. Stenosis is present in the proximalLCX (arrowhead). B) MIP of a 3D catheter-directed MRA, used toplan MRI cross sections proximal to the stenosis (arrow, C) and atthe stenosis (arrowhead, D).
Figure 2. Percent stenosis measured using cross-sectional MRI vs.X-ray. Dark line represents perfect agreement. Correlation betweenthe two methods was outstanding, with ICC = 0.955 (p < 0.05).
61Oral Abstracts

prospectively these results with coronary MRA data acquiredat 1.5 T.
Methods: 18 patients (11 men, 7 women, mean age: 63years, range: 45–76 years) with suspected coronary arterydisease, who were scheduled to undergo elective x-raycoronary angiography were included. For coronary MRA at3.0 T and 1.5 T, a Vector-ECG gated three-dimensionalsegmented k-space gradient echo imaging sequence wascombined with real time respiratory navigator gating andtracking. Signal-to-noise ratios (SNR), contrast-to-noise ratios(CNR), scores of image quality and sensitivity/specificity inthe detection of coronary artery stenosis on a segment-to-segment basis were assessed at 3.0 T and 1.5 T. Data wereanalysed for statistical differences using the Wilcoxonmatched pairs test and the McNemar test.
Results: The average increase in SNR at 3.0 T with respectto coronary MRA at 1.5 T was 29.5% for the left coronaryartery (LCA) and 31.2% for the right coronary artery (RCA)(p < 0.001) and the average increase in CNR was 21.8%for the LCA and 23.5% for the RCA. (p < 0.001). Scoresof image quality (p = 0.77) and diagnostic accuracy in thedetection of coronary artery stenoses (sensitivity and speci-ficity: 82% and 89% at 3.0 T vs. 82% and 88% at 1.5 T,respectively; p > 0.99) were equal at both field strengths.
Conclusions: Coronary MRA at 3.0 T is feasible inpatients with suspected coronary artery disease, providing asignificant increase in SNR and CNR although currenttechniques do not result in significantly improved imagequality and diagnostic accuracy in comparison to imagingat 1.5 T.
172. Coronary Angiography In Vivo EmployingPASADENA 13C and 1H Magnetic Resonance Imaging
Thao T. Tran, BS,1 Pratip Bhattacharya, PhD,1 Alexander P.Lin, BS,1 Kent Harris, PhD,1 Daniel Weitekamp, PhD,2 BrianD. Ross, MD, PhD.1 1Cardiac MR Unit, Huntington MedicalResearch Institutes, Pasadena, CA, USA, 2California Insti-tutes of Technology, Pasadena, CA, USA.
Introduction: Coronary angiography can be performed withproton cardiovascular magnetic resonance imaging (1HcvMRI), with contrast agents such as gadolinium (Gd), butis often difficult to reconstruct and visualize due to underlyingproton signal from cardiac tissue. 13C MRI, which will nothave background proton signal, may yield a more completeanalysis of coronary imaging that can currently be achievedby Gd-enhanced 1H cvMRI. The PASADENA (parahydrogenand synthesis allow dramatically enhanced nuclear alignment)method has been successfully utilized to polarize the 1H and13C atoms in several molecules (Bhattacharya et al., 2004;Bowers and Weitekamp, 1987; Johansson et al., 2004)providing an increase in signal to several thousand times that
of its original state. These PASADENA molecules or agentsare likely to be much more versatile than traditional Gd, sothat successful 13C MRI could then be adapted to providehigh contrast coronary angiography.
Aims: The aim of the present work has been todemonstrate the potential of using 1H and 13C cvMRIaiming for real time visualization of the coronary arterieswith PASADENA reagents. In order to achieve that, wefirst aim to determine the feasibility of coronaryangiography with PASADENA reagents using 1H cvMRIin vivo. Our second aim was to achieve 13C cvMRI invivo. Our final aim was to combine the 13C cvMRI andPASADENA reagents in vivo to provide high-contrast 13Ccoronary angiography.
Methods: Experimental work was performed in pig heartthat was harvested and injected with Heparin to preventcoagulation and perfused using the Langendorff technique.All MRI exams were done on a 1.5 T clinical scanner (GELX) and reagents were injected using a power injector(Medrad). Initial fSPGR 1H scans were used as localizers to
Figure 1. Left ventricle with Gad. enhancement, non-ECG gated.
Figure 2. Left ventricle with PASADENA reagent enhancement,non-ECG gated.
Oral Abstracts62

select optimal projection angle for the 13C scans. The heartwas then imaged in vivo using three different sequences andtwo different reagents: 1) standard 1H MRA with Gd (as thecurrent gold standard), ECG-gated 2) standard 1H FIESTAwith a) Gd and b) PASADENA reagent to enhance thevessels, non ECG-gated; 3) 13C FIESTA with a) 13C reagentand b) PASADENA reagent, non-ECG gated.
Results:1H MRI results demonstrated successful imaging ofboth Gd and PASADENA reagent (Figures 1 and 2). Thesignal increase due to the PASADENA effect in 1H wasexpected to be of relatively low yield compared to the1,000 � magnification in 13C MRI. In addition, the 1HPASADENA cvMRI and 1H MRA scans suffer from the samebackground signal problem for proton imaging. 13C cvMRIovercomes this problem by imaging solely the 13C signal asdemonstrated by successful 13C imaging of 13C reagent. The13C signal enhancement of PASADENA reagent combinedwith 13C imaging provided high contrast coronary arteryimages. These images can then be overlayed over protonimages using a contrasting color scheme that allows coronaryartery images to be readily distinguished from cardiac tissueand other physiology (Fig. 3).
Conclusion: Our results demonstrate that smart PASA-DENA contrast agents may be used to visualize coronaryarteries during dynamic cardiac MRI to provide greatercontrast and better visualization than current 1H MRAtechniques. Together with the pioneering in vivo demon-stration of parahdyrogen enhanced 13C cardiac MRI byGolman et al. (Johansson et al., 2004), these results indicatethe potential for a new generation of CVMR method.Furthermore, the flexibility of PASADENA reagents allowsfor ‘‘smarter’’ imaging of coronary arteries as well asincreased signal.
REFERENCES
Bhattacharya, P., Harris, K., Lin, A., Weitekamp, D. P., Ross, B. D. (2004).
ESMRMB Abstract #236.
Bowers, C. R., Weitekamp, D. P. (1987). J. Am. Chem. Soc. 109:. 5541–5542.
Johansson, E., Magnusson, P., Chai, C. M., Petersson, J. S., et al. (2004).
ESMRMB Abstract #117.
173. Multi-slice Dark-Blood TSE Carotid Imaging at3T with Regional Saturation and Rapid ExtendedCoverage—A Feasibility Study
Ioannis Koktzoglou, MS,1 Yiu-Cho Chung, PhD,2 VenkateshMani, PhD,3 Timothy J. Carroll, PhD,1 Gabor Mizsei, MS,3
Orlando Simonetti, PhD,2 Zahi A. Fayad, PhD,3 DebiaoLi, PhD.1 1Departments of Biomedical Engineering and Ra-diology, Northwestern University, Chicago, IL, USA, 2Sie-mens Medical Solutions, Chicago, IL, USA, 3Imaging ScienceLaboratories, Mount Sinai School of Medicine, New York,NY, USA.
Introduction: Turbo spin-echo (TSE) imaging of the carotidbifurcation at 1.5 T has been used to detect and characterizecarotid atherosclerotic plaque. Characterization of carotidplaque, however, requires relatively high resolution imagingwhich limits attainable signal-to-noise ratio (SNR). MRimaging at 3 T may help improve SNR or allow for higherresolution imaging (Hinton et al., 2003). Nonetheless, highRF power deposition of TSE imaging may limit imagingefficiency and/or coverage. Work is needed to optimizecarotid wall imaging protocols at 3 T.
Purpose: This work sought to evaluate the feasibility ofdark-blood TSE carotid artery wall imaging at 3.0 T bycomparing two rapid multi-slice imaging sequences.
Materials and Methods: Four healthy volunteers (2 males,2 females, mean age = 41 years) were imaged on a wholebody 3.0 T scanner (Magnetom Trio, Siemens MedicalSolutions) with a maximum gradient amplitude of 40 mT/mand a maximum slew rate of 200 mT/m/ms. An in-house four
Figure 3. Heart with Gad., imaged using MRA sequence, ECG-gated.
Figure 1. In-vivo PDW and T2W dark blood images of the carotidartery walls (arrows) acquired with the RSAT and REX sequences.
63Oral Abstracts

channel phased-array carotid coil (consisting of two left andtwo right channels) was used for signal reception. In eachvolunteer, 12 cross-sectional slices through the carotidbifurcation were imaged using TSE. Two magnetizationpreparation methods were used to suppress the blood signal.The first method applied two regional saturation (RSAT)bands (50 mm) before data acquisition of each slice duringeach TR, 10 mm above and below the imaging slices. Thesecond method was a rapid extended coverage (REX) se-quence in which four double inversion recovery blocks wereapplied before data acquisition within every TR (Mani et al.,2004). Fat saturated proton density-weighted (PDW) andT2-weighted (T2W) imaging was performed with both se-quences with the following imaging parameters: FOV = 12 �12 cm2, matrix = 256 � 256, SL = 3 mm, slice gap = 10%,TR = 4 s, TE = 10 ms (PDW), TE = 50 ms (T2W), ETL = 9,bandwidth = 200 Hz/pixel, NEX = 2, imaging time = 3’55@per scan. Refocusing flip angle was SAR (specific absorptionrate) limited, with the RSATand REX sequences employing anaverage of 165� and 167�, respectively.
Signal intensities were measured in the left and rightcarotid artery wall and lumen. A paired samples t-test wasused to determine significant differences in wall SNR andwall-lumen CNR between the two acquisitions.
Results: Twelve-slice dark-blood T2W and PDW imagingof the carotid bifurcation was achieved in all volunteers withthe RSAT and REX sequences. SAR levels were about thesame for the two protocols. Representative images from bothimaging techniques are shown in Figure 1. Carotid artery wallwas clearly depicted with excellent lumen and fat signal sup-pression. Mean wall SNR and wall-lumen CNR in all acquiredimages are given in Table 1. No significant differences in SNRand CNR were found with PDW imaging, however, statisticalsignificance (p < 0.05) was achieved in the T2W images.
Conclusion: Despite increased SAR levels at 3.0 T, multi-slice TSE imaging of the carotid bifurcation was possible.Excellent image quality was achieved with both the RSATand REX sequences, yielding comparable image appearances,SNR and CNR. Patient studies are needed to assess the utilityof the two sequences for carotid plaque detection andcharacterization at 3 T.
REFERENCES
Hinton, D., et al. (2003). ISMRM 11th Annual Meeting, 176.
Mani, V., et al. (2004). Radiology 232:281–288.
174. MR and CT Imaging of Patients withAtherosclerotic Aortic Plaque and Evaluation ofNew MR Methods
Daisy Chien, PhD, David Fieno, MD, PhD, Rola Saouaf,MD, Damini Dey, PhD, Ling De Yang, MD, Heidi Gransar,MS, Louise Thomson, MD, John Friedman, MD, DanielBerman, MD. Cedars-Sinai Medical Center, Los Angeles,CA, USA.
Introduction: MR has been established as a reliable nonin-vasive tool to evaluate atherosclerotic plaque. The method ofchoice has been 2D dark blood techniques which havegenerated good results but can be time consuming. Ourhypothesis is that 3D imaging may improve the ability toevaluate patients with atherosclerosis and to more effectivelycover an extended area of interest such as the aorta.
Purpose: To evaluate a new 3D approach based on steadystate free precession (SSFP) for plaque imaging, to compare itwith the established 2D technique, and to correlate with CT inpatients with aortic atherosclerotic plaque.
Methods: We evaluated 12 patients (6 men and 6 women,55–79 years old) with known atherosclerosis indicated bytheir CT studies. Standard 2D MR images were acquired withT1, T2, and proton density weighting, each acquired in asingle breathhold. Two 3D SSFP methods were assessed. Thenon-breathhold (3DnBH) method acquired 80 slices in < 5minutes of scan time. The breathhold (3DBH) acquired 12slices in a single breathhold. The smallest pixel size was 0.35mm � 0.5 mm and the slice thickness was 3 mm.
Signal-to-noise measurements of the vessel wall versus thebackground were made comparing 2D, 3DnBH, and 3DBH.The MR images were examined and graded side by side by3 expert readers according to: 1) image quality, 2) plaquemargin definition, 3) plaque characterization, and 4) theability to visualize plaque calcification. The CT images wereexamined at the same level as the MR acquisitions.
Results: Signal-to-noise measured was 4.5 ± 1.5, 8.0 ±2.0, and 14.0 ± 3.8 for the 2D, 3DBH, and 3DnBH methodsrespectively. Fig. 1 shows the image acquired using 2D, 3Dbreathhold, 3D non-breathhold, and EBCT at the same levelin a 74 year old patient.
In the category of plaque delineation and plaque charac-terization, the 3D images had up to 200% improvement ingrade when compared with the 2D images (P < 0.05).Furthermore, the calcified region was inconspicuous in 88%of the lesions and was missed in 70% of the lesions in thedark blood images. Comparisons with CT showed that 3Dbright blood imaging was correct in identifying the calcifiedregion in every lesion.
Conclusion: 3D MR imaging was performed for the firsttime to evaluate plaque burden in the thoracic aorta. The 3Dmethods demonstrated significantly improved results inplaque definition, plaque characterization, and visualizationof calcification when compared with the established 2D
Table 1. Mean SNR and CNR measurements
RSAT REX n p-Value
PDW SNR 28.9 ± 9.0 29.1 ± 9.2 96 0.75T2W SNR 18.2 ± 5.8 17.0 ± 6.5 96 0.04PDW CNR 22.8 ± 8.1 22.7 ± 8.5 96 0.86T2W CNR 13.8 ± 5.2 12.4 ± 5.9 96 < 0.01
Oral Abstracts64

technique. Furthermore, the 3D non-breathhold technique istime-effective and can cover the complete thoracic aorta withno slice gap in < 5 minutes of scan time.
175. Interactive Real-Time Magnetic Resonance-Guided Atrial Septal Puncture and AtrialBalloon Septostomy Are Feasible in Swine
Amish N. Raval, MD,1 Parag V. Karmarkar, MSc,2 MichaelA. Guttman, MSc,3 Cengizhan Ozturk, MD, PhD,1 RanilDeSilva, MD, PhD,1 Ronnier J. Aviles, MD,1 Elliot R.McVeigh, PhD,3 Ergin Atalar, PhD,4 Robert J. Lederman,MD.1 1Cardiovascular Branch, National Heart Lung andBlood Institute/National Institutes of Health, Bethesda, MD,USA, 2Johns Hopkins University, Baltimore, MD, USA,3Laboratory of Cardiac Energetics, National Heart Lungand Blood Institute/National Institutes of Health, Bethesda,MD, USA, 4Johns Hopkins University, Baltimore, MD, USA.
Introduction: Atrial septal puncture (ASP) guided by xrayfluoroscopy (XRF) is an initial step in many procedures,including atrial balloon septostomy (ABS). Compared toXRF, interactive real-time magnetic resonance imaging (IR-MRI) using modified interventional devices offers superiortissue imaging without ionizing radiation exposure, which isharmful in children.
Purpose: To determine if ASP and ABS are feasible usingan IR-MRI platform.
Methods: 10 healthy swine (21–60 kg) underwent IR-MRIguided ASP/ABS. Active ASP needles were inserted into 6F/10F dilator and introducer sheaths with passive tip markers.Incrementally sized 8–18 mm balloon catheters inflated with5 mM Gd-DTPA were passed over an active wire for ABSafter successful ASP. Interactive, simultaneous multi-slice,rapid SSFP image acquisition/reconstruction was performedin the XMR suite at NHLBI.
Results: ASP was successful in 10/10 animals. ABS wassuccessfully achieved in 4/5 animals. In one case, inadvertentcontrast staining of the septum caused image distortion andprocedure termination. Following ABS, a left to right shuntof 1.5:1 was measured invasively. Figures 1A and 1Bdemonstrate active needle and balloon/active wire across theinter-atrial septum.
Conclusions: ASP and ABS are feasible using an IR-MRIinterventional platform. Further imaging and device develop-ment toward future clinical application are warranted.
176. Chronic Total Peripheral Artery OcclusionRecanalization Using Interactive Real-TimeMagnetic Resonance Imaging Guidance IsFeasible in a Swine Model
Amish N. Raval, MD,1 Parag V. Karmarkar, MSc,2
Cengizhan Ozturk, PhD,1 Michael A. Guttman, MSc,3
Minnan Xu,2 Ranil DeSilva, MD, PhD,1 Ronnier J. Aviles,MD,1 Alexander J. Dick, MD,1 Venkatesh K. Raman, MD,1
Elliot R. McVeigh, PhD,3 Ergin Atalar, PhD,2 Robert J.Lederman, MD.1 1Cardiovascular Branch, National HeartLung and Blood Institute/National Institutes of Health,Bethesda, MD, USA, 2Johns Hopkins University, Baltimore,MD, USA, 3Laboratory of Cardiac Energetics, NationalHeart Lung and Blood Institute/National Institutes of Health,Bethesda, MD, USA.
Introduction: Conventional x-ray fluoroscopic guided chronictotal arterial occlusion (CTO) recanalization requires sig-nificant operator experience, prolonged fluoroscopic time,
Figure 1. A) Standard 2D, B) breathhold 3D (showing 1 image out of 12 contiguous slices), and C) non-breathhold 3D (showing 1 imageout of 80 contiguous slices) acquired in a patient with atypical chest pain. D) The EBCT calcium scan confirms 2 major areas of calcification(areas of low signal intensity) that are clearly seen in the 3D but are less conspicuous in the 2D images.
Figure 1.
65Oral Abstracts
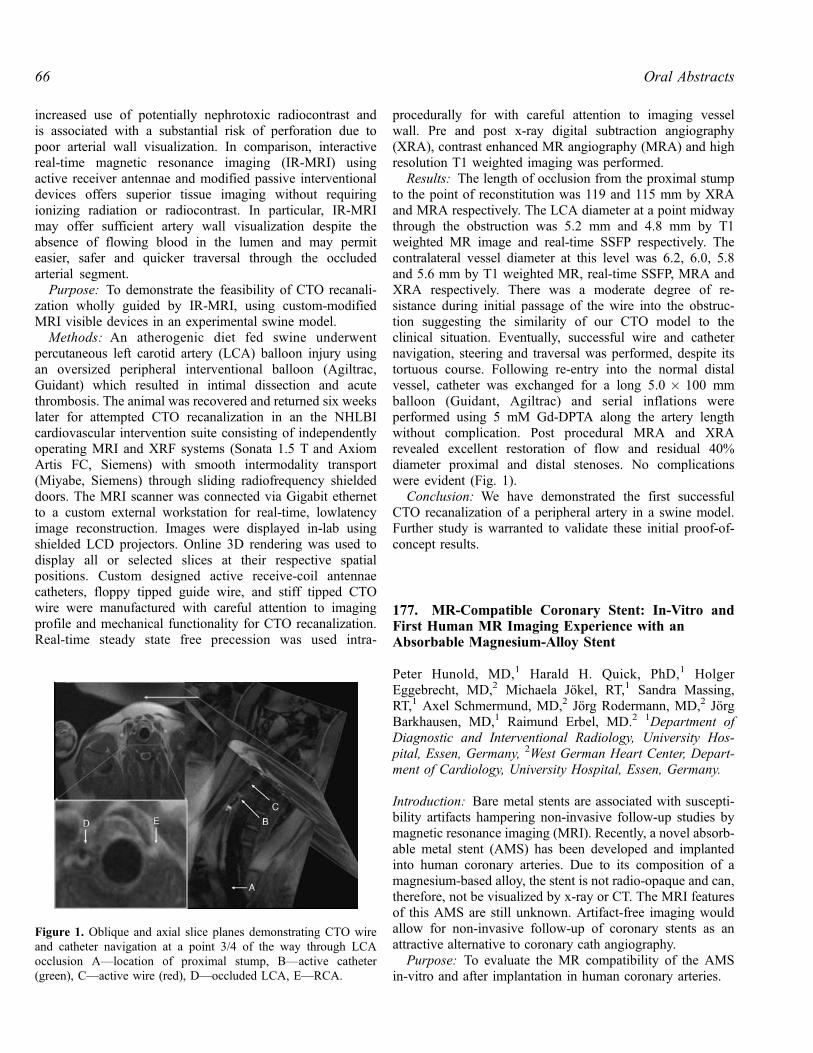
increased use of potentially nephrotoxic radiocontrast andis associated with a substantial risk of perforation due topoor arterial wall visualization. In comparison, interactivereal-time magnetic resonance imaging (IR-MRI) usingactive receiver antennae and modified passive interventionaldevices offers superior tissue imaging without requiringionizing radiation or radiocontrast. In particular, IR-MRImay offer sufficient artery wall visualization despite theabsence of flowing blood in the lumen and may permiteasier, safer and quicker traversal through the occludedarterial segment.
Purpose: To demonstrate the feasibility of CTO recanali-zation wholly guided by IR-MRI, using custom-modifiedMRI visible devices in an experimental swine model.
Methods: An atherogenic diet fed swine underwentpercutaneous left carotid artery (LCA) balloon injury usingan oversized peripheral interventional balloon (Agiltrac,Guidant) which resulted in intimal dissection and acutethrombosis. The animal was recovered and returned six weekslater for attempted CTO recanalization in an the NHLBIcardiovascular intervention suite consisting of independentlyoperating MRI and XRF systems (Sonata 1.5 T and AxiomArtis FC, Siemens) with smooth intermodality transport(Miyabe, Siemens) through sliding radiofrequency shieldeddoors. The MRI scanner was connected via Gigabit ethernetto a custom external workstation for real-time, lowlatencyimage reconstruction. Images were displayed in-lab usingshielded LCD projectors. Online 3D rendering was used todisplay all or selected slices at their respective spatialpositions. Custom designed active receive-coil antennaecatheters, floppy tipped guide wire, and stiff tipped CTOwire were manufactured with careful attention to imagingprofile and mechanical functionality for CTO recanalization.Real-time steady state free precession was used intra-
procedurally for with careful attention to imaging vesselwall. Pre and post x-ray digital subtraction angiography(XRA), contrast enhanced MR angiography (MRA) and highresolution T1 weighted imaging was performed.
Results: The length of occlusion from the proximal stumpto the point of reconstitution was 119 and 115 mm by XRAand MRA respectively. The LCA diameter at a point midwaythrough the obstruction was 5.2 mm and 4.8 mm by T1weighted MR image and real-time SSFP respectively. Thecontralateral vessel diameter at this level was 6.2, 6.0, 5.8and 5.6 mm by T1 weighted MR, real-time SSFP, MRA andXRA respectively. There was a moderate degree of re-sistance during initial passage of the wire into the obstruc-tion suggesting the similarity of our CTO model to theclinical situation. Eventually, successful wire and catheternavigation, steering and traversal was performed, despite itstortuous course. Following re-entry into the normal distalvessel, catheter was exchanged for a long 5.0 � 100 mmballoon (Guidant, Agiltrac) and serial inflations wereperformed using 5 mM Gd-DPTA along the artery lengthwithout complication. Post procedural MRA and XRArevealed excellent restoration of flow and residual 40%diameter proximal and distal stenoses. No complicationswere evident (Fig. 1).
Conclusion: We have demonstrated the first successfulCTO recanalization of a peripheral artery in a swine model.Further study is warranted to validate these initial proof-of-concept results.
177. MR-Compatible Coronary Stent: In-Vitro andFirst Human MR Imaging Experience with anAbsorbable Magnesium-Alloy Stent
Peter Hunold, MD,1 Harald H. Quick, PhD,1 HolgerEggebrecht, MD,2 Michaela Jokel, RT,1 Sandra Massing,RT,1 Axel Schmermund, MD,2 Jorg Rodermann, MD,2 JorgBarkhausen, MD,1 Raimund Erbel, MD.2 1Department ofDiagnostic and Interventional Radiology, University Hos-pital, Essen, Germany, 2West German Heart Center, Depart-ment of Cardiology, University Hospital, Essen, Germany.
Introduction: Bare metal stents are associated with suscepti-bility artifacts hampering non-invasive follow-up studies bymagnetic resonance imaging (MRI). Recently, a novel absorb-able metal stent (AMS) has been developed and implantedinto human coronary arteries. Due to its composition of amagnesium-based alloy, the stent is not radio-opaque and can,therefore, not be visualized by x-ray or CT. The MRI featuresof this AMS are still unknown. Artifact-free imaging wouldallow for non-invasive follow-up of coronary stents as anattractive alternative to coronary cath angiography.
Purpose: To evaluate the MR compatibility of the AMSin-vitro and after implantation in human coronary arteries.
Figure 1. Oblique and axial slice planes demonstrating CTO wireand catheter navigation at a point 3/4 of the way through LCAocclusion A—location of proximal stump, B—active catheter(green), C—active wire (red), D—occluded LCA, E—RCA.
Oral Abstracts66

Methods: In an in-vitro study, expanded as well asunexpanded AMS (Biotronik, Berlin, Germany) were exam-ined in a water bath phantom using a 1.5 Tesla MR-scanner(Sonata, Siemens, Erlangen, Germany) with different sequen-ces. A comparison with standard bare metal stents in termsof visibility and artifacts was performed by visual analysis.As part of the first-in-man trial, 5 patients (age: 39–72 yrs,3 male/2 female) underwent AMS implantation. MR coronaryangiography (MRCA) was performed the day before and 3to 4 days after implantation using two different sequences:a) a segmented steady-state free precession sequence withoutcontrast material (TrueFISP) and b) contrast-enhancedMRCA with a segmented inversion-recovery 3D gradient-echo sequence (FLASH). Both sequences were applied duringbreath-hold with a navigator-based slice follow option.Images were compared in terms of visibility of the stentedcoronary artery lumen and artefacts.
Results: In the in-vitro study, the stents could be visualizedby MRI. The magnesium-alloy stent did not producerecognizable susceptibility artifacts allowing for unhampereddetailed evaluation of the stent lumen in the water bath.Conversely, the bare metal stents showed the typical material-dependent susceptibility artifacts rendering evaluation of thestent lumen impossible. In the patients, all coronary arteriescould be delineated before AMS implantation with bothdescribed techniques. After AMS implantation thecorresponding parts of the stented coronary arteries (2 �RCA, 1 � LAD, 2 � LCX) could also be visualized byMRCA. The artifact-free visualization allowed for evaluationof the stented lumen without image quality loss (Fig. 1).
Conclusions: MR imaging of a novel absorbable magne-sium-alloy stent was performed demonstrating artifact-freevisualization of the stent in-vitro and after implantation incoronary arteries. MRCA yielded diagnostic images of thestented artery lumen without quality loss. This may providethe basis for non-invasive follow-up studies of coronarystent patency.
178. MR Fluoroscopy for Delivery of Non-ionicDysprosium-DTPA-BMA Into Scarred Myocardium
Maythem Saeed, DVM, PhD,1 Alastair Martin, PhD,2 OliverWeber, PhD,1 Charles B. Higgins, MD,1 David Saloner,PhD,1 Randal Lee, MD, PhD.3 1Radiology, University ofCalifornia San Francisco, San Francisco, CA, USA,2Radiology, Philips Medical Systems, San Francisco, CA,USA, 3Medicine, University of California San Francisco,San Francisco, CA, USA.
Introduction: Our recent MR study has demonstrated thepotential of Vistarem (a blood pool agent) in discriminatingacutely infarcted myocardium from scar tissue. The scartissue appears bright on Dotarem-enhanced MRI, but notVistarem. The ability of MR to localize and discriminatemyocardial status makes it a suitable modality for the admin-istration of drug, gene or stem cell therapies. Since positiveenhancement is utilized to delineate infarcted myocardium,we propose that negative enhancement is the appropriatemechanism for monitoring these therapies.
Purpose: To demonstrate the feasibility of MR fluorosco-py in guiding the delivery of nonionic extracellular T2* MRcontrast medium Dysprosium-DTPA-BMA in a swine modelof chronic myocardial infarction.
Methods: Experiments were performed in 4 pigs subjectedto 2 hrs coronary artery occlusion followed by reperfusion.Eight weeks after infarction, the animals were imaged using1.5 T MR scanner (Philips Medical Systems, Netherlands).Scar tissue was identified by intravenous administration of0.026 mmol/kg Vistarem (P792; blood pool MR contrastmedium) or by 0.1 mmol/kg Dotarem (Gd-DOTA; extracel-lular MR contrast medium) (Guerbet Group, France) in con-junction with inversion recovery gradient echo MRI.
The guiding catheter and injecting needle (MRI-modifiedStiletto 2, Boston Scientific Corporation) were adapted toserve as MRI receiver coils in parallel with surface coils. Anadditional receiver coil was added to the Stiletto needle tip togenerate a high intensity signal on a separate receiver channel(Dick et al., 2003).
The advancement of the endovascular catheter to ascendingaorta and then to the LV was monitored using an MRfluoroscopic pulse sequence (bFFE). The imaging parametersfor the bFFE were: TE 1.89 ms, TR 3.8 ms, flip angle 60�,slice thickness 5 mm, FOV 200 mm, scan matrix 144 � 144,temporal resolution 500 ms in continuous imaging. Dyspro-sium-DTPA-BMA (0.4–1.0 ml, 0.5 M, Nycomed AmershamImaging) was injected into the rim of Dotarem-enhancedregion. The injection was monitored using MR fluoroscopy.Gradient echo MRI sequences were used to visualize themyocardial deposition of the Dysprosium-chelate. Bloodpressure, heart rate and oxygen saturation were measuredduring the intervention.
Results: Sequentially administration of Vistarem andDotarem provided valuable information on the status of
Figure 1. Contrast-enhanced FLASH MRCA of the RCX arteryin a male patient. A shows the coronary artery before AMSimplantation presenting an intermediate stenosis of the proximalsegment (arrow). B After AMS implantation, no artifacts aredepictable, the stent lumen can well be visualized and shows alumen gain compared to the stenosis before.
67Oral Abstracts

infarcted myocardium. The scar tissue was clearly recognizedas bright region on Dotarem, but not Vistarem. The scar tissuedefined by Dotarem was used as a target and was evident onbFFE images as a region of modest enhancement relative tothe normal myocardium.
LV catheterization via arterial access was feasible under3D MR fluoroscopy. The tip of the catheter appeared brighton MRI and the catheter could be manipulated within theventricle to select different targets (Fig. 1). Once appropri-ately positioned, the injection and consequence of thedeposition of Dysprosium-chelate could be monitored onMRI. The procedure of catheterization and intramyocardialinjection of Dysprosium took less than 30 min. Successfulintramyocardial injection was confirmed by the persistentof myocardial signal loss. The failure of intramyocardialinjection was confirmed by the brief signal loss of LVcamber blood. Dysprosium-chelate caused signal loss of theDoraterm-enhanced region (Fig. 1). Catheter navigation andintramyocardial injection of Dysprosium-DTPA-BMAcaused no significant changes in blood pressure, heart rateor oxygen saturation. Postmortem evaluation showed thatthere was no evidence of vascular, valvular or endocardi-al damage.
Conclusion: The procedure of catheterization and intra-myocardial injection is safe and without homodynamic sideeffects. Endocardial delivery of potential low molecularagents is feasible under MR-guidance. Nonionic Dysprosi-um-DTPA-BMA can be mixed with potential cells duringdelivery to ensure intramyocardial injection and to elimi-nate the long-term effects of intracellular iron on stem cellsor myoblasts.
ACKNOWLEDGMENTS
This study was supported by grants from NIH (RO1HL07295)and Philips Medical System, Best, The Netherlands.
REFERENCE
Dick, A. J., et al. (2003). Circulation 108:. 2899–2904.
179. Prevalence of Incidental Non-cardiac FindingsDetected by Cardiac MRI
Kai-Uwe Waltering, MD,1 Thomas Schlosser, MD,1 OliverBruder, MD,2 Mahnaz Mohammad Sadeghi, MD,1 PeterHunold, MD,1 Jorg Barkhausen, MD.1 1Department ofDiagnostic and Interventional Radiology, University HospitalEssen, Essen, Germany, 2Department of Cardiology andAngiology, Elisabeth Hospital Essen, Essen, Germany.
Introduction: Vast improvements in MR hard- and softwarehave resulted in a considerable increase in the number of MRexams focussing on the heart. Cardiac MR is now routinelyused for the assessment of myocardial function at rest andstress and for detection and characterization of scar tissue inpatients with coronary artery disease. However, cardiacexams cover parts of several other organs of the thorax andthe upper abdomen and, therefore, incidental findings maywell become increasingly apparent.
Purpose: Aim of this study was to evaluate the num-ber of incidental non-cardiac finding during cardiacMR examinations.
Figure 1.
Figure 1. 76 yo male patient referred for Dobutamin stress MR. Aright hilar mass (A) and a pulmonary lesion (B) was incidentallydetected. Contrast enhanced CT (C, D) confirmed the MR findings.
Oral Abstracts68

Methods: From April 2002 to December 2003, 1359patients underwent cardiac MRI on a 1.5 T MR system fordetection of myocardial ischemia n = 638, assessment ofmyocardial viability n = 479, assessment of cardiac masses orthrombi n = 139 and assessment of myocarditis or cardio-myopathies n = 103. The standard imaging protocol includeda proton-density weighted dark-blood prepared half-Fouriersingle-shot turbo spin-echo (HASTE, TR 2RR, TE 23 ms, FA160�) sequence in axial orientation covering the entire chestin a single breath-hold, steady-state free precession cinesequences (TR 3 ms, TE 1.5 ms, FA 60�) in standard long andshort axes orientations and inversion recovery gradient echosequences (TR 8 ms, TE 4 ms, TI 180–160 ms, FA 20�) in thesame orientation. All relevant non-cardiac findings unknownprior to MR imaging were recorded.
Results: A total of 124 relevant clinical findings weredetected in 118 patients. 49 thoracic pathologies wererecorded including pulmonary lesions suspected for bronchialcarcinoma or metastases n = 23, hilar masses n = 9 (Fig. 1),enlarged mediastinal lymph nodes n = 12 and mediastinalmasses n = 5. Additionally, 47 vascular variants or patholo-gies (dilation or aneurysm of the thoracic aorta n = 37, rightaortic arch n = 1, aberrant right subclavian artery n = 4,pulmonary emboli n = 3, persistent left superior vena cavan = 1, vena cava thrombus n = 1) were detected. 28 relevantfindings were located in the upper abdomen including non-cystic liver lesions n = 25 (Fig. 2), renal cell carcinoman = 1, hydronephrosis n = 1 and spinal metastases n = 1. 78patients were referred to additional diagnostic procedureswhich confirmed the MR findings in 85% of the cases,whereas 46 patients were referred for follow-up examinations.
Conclusions: Incidental non-cardiac findings can fre-quently be detected during contrast enhanced cardiac MRI
using standard imaging protocols. This suggests that inves-tigators using cardiac MRI have to focus on all visualizedorgans to make sure that all information provided by theexamination is taken into account. Therefore physiciansreporting cardiac MR studies have to focus on all visualizedorgans and should be trained in cross-sectional anatomy andthe MR appearance of non-cardiac diseases.
180. Demonstration and Prediction of the PotentialReversible Nature of Thinned Myocardium by CMR
Olga James, MD,1 Han W. Kim, MD,2 Jonathan Weinsaft,MD,2 Edwin Wu, MD,3 Michael Elliott, MD,2 Mark Zenker,MD,1 Michele A. Parker, MS,2 Robert O. Bonow, MD,3
Robert M. Judd, PhD,2 Raymond J. Kim, MD,2 Dipan J.Shah, MD.1 1Nashville Cardiovascular Magnetic ResonanceInstitute, Brentwood, TN, USA, 2Duke Cardiovascular Mag-netic Resonance Center, Durham, NC, USA, 3NorthwesternUniversity Feinberg School of Medicine, Chicago, IL, USA.
Introduction: Clinical dogma states that thinned myocardiumlacks viability and cannot improve function after revascular-ization. In contradiction, a recent study using delayed en-hancement (DE) MRI showed substantial viability in somethinned akinetic regions. The prevalence, amount, and clinicaland imaging predictors of viability and improvement inthinned myocardium are unknown.
Methods: We prospectively enrolled 1055 consecutivepatients with stable coronary artery disease who were referredfor viability assessment by CMR at 3 different institutions.All images were reviewed to identify patients with large areaof thinned myocardium [> 5% LV with end-diastolic wallthickness (EDWT) � 5.5 mm]. In patients with thinnedmyocardium, cine MRI was quantitatively analyzed todetermine the EDWT and systolic wall thickening (SWT) inthe thinned region, and the LV ejection fraction (LVEF). The% viability in the thinned region was planimetered from DE-MRI; the presence of Q waves was determined from 12-leadECG’s; and the extent of collaterals and stenosis in thecoronary artery supplying the thinned region was determinedby review of coronary angiograms. A cohort of patients whounderwent revascularization returned for repeat cine MRI todetermine if the presence of viability on the initial DE-MRIwould be a predictor of improvement.
Results: Of the 1055 patients enrolled, we identified 196patients (age 64 ± 12, 79% M, LVEF 33 ± 11%) with largeregions of akinetic thinned myocardium (35 ± 15% of LV).Substantial viability (> 50% of the region) was found in 36patients (18%). While the presence of angina, CHFsymptoms, CHF duration, NYHA class, extent of angio-graphic collateral, electrocardiographic Q waves were similarbetween patients with and without substantial viability;patients with substantial viability had greater severity ofcoronary stenosis (98 ± 14% vs. 81 ± 32%, p = 0.003) and
Figure 2. 64 yo male patient referred for the assessment ofmyocardial viability. A focal liver lesion was incidentally detected(A, B). Contrast enhanced CT (C) and contrast enhanced liver MR(D) confirmed a metastasis of pancreatic cancer.
69Oral Abstracts

EDWT (4.53 ± 0.73 vs. 4.11 ± 0.85 mm, p = 0.006). Followup imaging was performed in 40 of the 76 patients thatunderwent revascularization (12 patients with and 28 withoutsubstantial viability). After revascularization patients withsubstantial viability had marked increase in SWT(3.3 ± 13.2% vs. 32.1 ± 16.4%, p < 0.001) and EDWT(4.40 ± 0.59 vs. 7.55 ± 1.08, p < 0.001), whereas thosewithout substantial viability had no significant change inSWT (0.1 ± 8.5% vs. 3.0 ± 6.9%, p = 0.08) and EDWT(4.53 ± 0.64 vs. 4.64 ± 0.74, p = 0.16), see Figure 1. Onmultivariate analysis the only independent predictors ofincrease in SWT were % SWT at baseline (p = 0.008) and% viability in the thinned region (p < 0.001). The onlyindependent predictors of increase in EDWT were %LVthinned (p = 0.04) and % viability in the thinned region(p < 0.001).
Conclusion: Up to 18% of patients with thinned akineticmyocardium have substantial viability. Revascularization ofthese patients results in improvement in systolic wallthickening and reversal of diastolic wall thinning. The %viability in the thinned region based on DE-MRI is thestrongest independent predictor of both improvement infunction and reversal of wall thinning.
181. Comparison of Contrast Enhanced MagneticResonance Imaging to Positron Emission Tomographywith F-18 Fluorodeoxyglucose and Rb-82 for theDetection of Myocardial Viability Using LeftVentricular Bullseye Analysis
Robert Eisner, PhD,1 Thomas Meyer, MD,1 Steven Sigman,MD,1 Susan Eder, ARRT(MR),1 James Streeter, BS(CNMT),1
Randolph Patterson, MD,1 Roderic Pettigrew, MD, PhD.21Carlyle Fraser Heart Center, Emory Crawford LongHospital, Atlanta, GA, USA, 2National Institute of BiomedicalImaging and Bioengineering, National Institutes of Health,Bethesda, MD, USA.
Introduction: Results from previous comparisons of con-trast enhanced magnetic resonance imaging (CEMRI) andpositron emission tomography with F-18 fluorodeoxyglu-cose (PET FDG) for detection of viable myocardium havebeen complicated by methodologies that use segmentalanalyses applied at a limited number of slice positions.Utilizing a large number of myocardial segments theseanalyses are made difficult by the inherent differences inspatial and contrast resolution. Acquisition differences relatedto the lack of respiratory and cardiac gating in PET furthercomplicate comparisons.
Purpose: Present a left ventricular bullseye analysisthat takes into consideration coronary arterial territories(CATs) to provide a simplified presentation of CEMRI in aclinically useful manner and to validate CEMRI detectionof viability using a similar PET bullseye technique as areference standard.
Methods: 30 patients had MRI and ungated PET-FDG/restRb-82 studies performed within 24 hours.
PET: Rest Rb-82 images were acquired on POSITRONsystem 180–200 seconds [200 second acquisition] following40–60 mCi Rb-82 infusion. After 30–60 minutes glucoseloading, FDG images were acquired 45 minutes following 10mCi FDG injection. PET bullseye displays were generatedfrom maximal count circumferential profiles on short axisslices. PET Rb-82 defect region was defined as < 2.5SD fromnormal and the defect region was mapped to FDG bullseye.PET ‘‘scar’’ (match) and ‘‘viable’’ (mismatch) in defectregion were defined as < 50% and > 50% maximum FDGcounts, respectively.
MRI: 3D breath hold IR-TFE short axis slice acquisitions atmid-diastole were performed on Philips 1.5 T Intera CV 10–20 minutes following gadolinium injection. CEMRI ‘‘scar’’wall thickness bullseyes (MRI SCAR in Figure 1) weregenerated from manual edge drawing encompassing hyper-enhanced regions on short axis slices, and CEMRI ‘‘viability’’wall thickness bullseyes (MRI VIABILITY) were generatedfrom edge drawings that excluded the hyperenhancementregions. To facilitate a clinically relevant comparison, CEMRI‘‘scar’’ was defined as a region where thickness ofsubepicardial viable rim < 3 mm (blue region in MRIFigure 1.
Oral Abstracts70

VIABILITY bullseye) in region of CEMRI hyperenhance-ment. CEMRI bullseyes were rotated to align with PETbullseyes in standard orientation. In a blinded manner,CEMRI was compared to PET 1) for each patient and 2)using a 17 segment bullseye model which was coalesced into4 bullseye regions based on CATs.
Results: One PET FDG study could not be evaluatedbecause it had too few counts and another showed anindeterminate FDG uptake pattern. CEMRI identified areas ofscar or viability as defined by PET match or mismatch in 27/28 patients. For the CAT analysis, sensitivity for CEMRI todetect PET defined scar was 92% (47/51) and specificity was98% (60/61). The only patient inconsistency had a matchedPET defect with a corresponding 5 mm thick CEMRIhyperhancement but with a 5 mm thick subepicardial rimthat was > 3 mm cut-off for CEMRI ‘‘scar’’. There were 4other discordant regions: 3 were related to small spillover oflarge non-viable areas into adjacent CATs, and one was asmall matched PET defect which was in a slightly differentbullseye position than the CEMRI hyperenhancement. 7/10PET mismatched regions showed no hyperenhancement and3/10 showed subendocardial hyperenhancement.
Conclusions: 1) Analysis of CEMRI using a bullseye tech-nique provides a clinically useful left ventricular display rec-ognizing coronary arterial territories, and is easily comparedto the corresponding PET bullseye images. 2) CEMRI hasexcellent agreement with clinical PET interpretations for theregional determination of myocardial scar. 3) CEMRI andPET results concur in 27/28 patients with subepicardial viablerim cut-off < 3 mm for MRI ‘‘scar’’ and 28/28 patients withsubepicardial viable rim cut-off < 5 mm in hyperenhancedregion. 4) CEMRI defines the relative extent of underlying
subendocardial scar in PET mismatch regions not resolvedby PET.
182. Myocardial Viability Assessment by Contrast-Enhanced MRI Before CABG Surgery—Impact ofLate Enhancement Extent in MRI on CoronaryGraft Flow
Peter Hunold, MD,1 Parwis Massoudy, MD,2 ThomasSchlosser, MD,1 Claudia Bohm, MD,2 Jorg Forkel, MD,2
Sandra Massing, RT,1 Jorg Barkhausen, MD.1 1Department ofDiagnostic and Interventional Radiology, University Hospi-tal, Essen, Germany, 2West German Heart Center, Depart-ment of Thoracic and Cardiovascular Surgery, UniversityHospital, Essen, Germany.
Introduction: Contrast-Enhanced cardiac MRI (CE-MRI) hasbeen established for myocardial viability assessment using thelate enhancement (LE) concept. It has been proven to reliablydetect myocardial scar and predict functional left ventricular(LV) outcome after revascularization in patients withocclusive coronary artery disease (CAD). Coronary arterybypass graft (CABG) flow measured by Doppler sonographyduring surgery has been shown to predict graft patency. Graftvessels supplying areas of scar with a corresponding lowerperfusion are prone to occlusion. CE-MRI might, therefore,predict the probability of functional outcome and, addition-ally, graft patency after CABG surgery.
Purpose: To determine the relation between myocardialLE in CE-MRI and intraoperative graft flow in CAD
Figure 1.
71Oral Abstracts

patients with severely impaired LV function undergoingCABG surgery.
Methods: Thirty-three consecutive CAD patients withimpaired LV function (mean EF, 29%) underwent CE-MRIusing the LE technique before CABG surgery. LE scans wereacquired 8–15 min after administration of 0.2 mmol/kg BWof Gd-DTPA (MagnevistTM, Schering, Germany) using aninversion-recovery TurboFLASH sequence (TR, 8 ms; TE, 4ms; FA, 25�; TI, 200–260 ms). The entire LV was covered bylong axis and contiguous short axis scans (thickness, 8 mm).Myocardial scar extent was evaluated using a LE score 1–4(score 1, no LE; 2, LE < 50% of wall thickness; 3, LE > 50%;4, transmural LE) based on the AHA 17-segment model.A mean score was calculated for each coronary vesselterritory (RCA, LAD, LCX). Intraoperative graft flow wasdetermined by Doppler sonography. Flow in grafts supplyingvessel territories with a score 1 or 2 (group A) was comparedto flow in grafts supplying vessel territories with a score � 3(group B) which are not expected to improve functionafter revascularization.
Results: Of the 99 vessel territories, 89 yielded score 1 or 2(group A), 10 score � 3 (group B). In group A, 68 of 89, andin group B, 9 of 10 territories were grafted using leftintrathoracic artery (LITA) or venous grafts. Mean LITA graftflow was 54 ± 6 in group A and 28 ± 11 cc/min in group B(p < .04). Mean vein graft flow was 74 ± 6 and 42 ± 8 cc/min in groups A and B, respectively (p < .05). After a meanfollow-up period of 21 ± 2 months, survival and mean EFwere 84% and 36 ± 3% (preop 31 ± 2%) in group A and 88%and 31 ± 3% (preop 28 ± 1%) in group B.
Conclusions: In patients with impaired LV functionundergoing CABG, graft flow to vessel territories with no orlittle scar tissue is higher than flow to vessel territorieswith more than 50% scar tissue as shown by CE-MRI.Since sufficient flow is a prerequisite for graft patency,the long-term prognosis of those grafts may be better. MRI,therefore, might predict graft patency. However, interme-diate-term survival and functional benefit was comparable inboth groups.
183. CMR Contrast-Enhanced Study ofDilated Cardiomyopathy
Sandra Pujadas, MD, Francesc Carreras, MD, Antoni Bayes-Genis, MD, Marta Camprecios, MD, Vicenc Brossa, MD,Sonia Mirabet, MD, Ruben Leta, MD, Guillem Pons-Llado, MD. Cardiology, Hospital de Sant Pau, Barcelona,Spain.
Introduction and purpose: A unique feature of cardiovascu-lar magnetic resonance (CMR) is that it allows, by means ofthe delayed contrast-enhancement (DCE) technique, an invivo detection of myocardial scar due to necrosis and, also, of
myocardial focal fibrosis non-ischemic in origin. Severalstudies have shown different degrees and patterns ofmyocardial DCE in dilated cardiomyopathy (DCM) thoughtto be due to focal fibrosis. To further increase the body ofinformation on the subject, the present study was aimed todescribe the presence and distribution of focal myocardialfibrosis in a series of patients with idiopathic dilatedcardiomyopathy (DCM).
Methods: Thirty consecutive patients (26 males; mean age50 ± 12) with DCM were studied by CMR using a PhilipsIntera 1.5 T system. Patients were included only if they had anormal coronary angiogram. Steady-state free-precessioncine-MR and DCE images were acquired in short-axis slicesfrom the atrioventricular ring to the apex. All the images wereanalysed on a dedicated software (MEDIS Mass), where leftventricular end-diastolic (LVEDV) and end-systolic (LVESV)volumes, and ejection fraction (LVEF) were calculated.
Results: 73% (22/30) of patients did not show any kind ofDCE. In the remaining 27% (8/30) the following DCEdistribution patterns were observed: 1) midwall myocardialstriae, in 3 cases (10%); 2) focal in the RV-LV junction, in 2cases (6%); 3) transmural, in 2 cases (6%). No significantdifferences were found when comparing the group showingDCE with the one without it, regarding LVEDV (276 ± 75 vs.247 ± 108 ml, respectively; P = 0.42), LVESV (205 ± 82 vs.169 ± 112 ml, respectively; P = 0.36) or LVEF (29 ± 11%vs. 35 ± 16%, respectively; P = 0.20).
Conclusions: Most patients (73%) with idiopathic DCMdo not show DCE at CMR, while it is present in 27%,presumably due to focal myocardial fibrosis, fairly distinct inlocation and distribution, in most of the cases, from that seenin patients with a previous myocardial necrosis. Therefore,this technique could be useful as a noninvasive tool fordifferential diagnosis of idiopathic vs. ischemic DCM. Thepresence of DCE in patients with DCM does not seem toimply a higher degree of impairment of left ventricularmorphological or functional features.
184. Detection of Intraventricular Thrombi byContrast Enhanced Magnetic Resonance Imagingof the Heart
Okan Ekinci, MD,1 Thorsten Dill, MD,2 Alexander Kluge,MD,2 Anja Deetjen, MD,2 Jochen Hansel, MD,2 Christian W.Hamm, MD.2 1Cardiology, German Clinic of Diagnostic,Wiesbaden, Germany, 2Cardiology, Kerckhoff Heart Center,Bad Nauheim, Germany.
Introduction: The presence of an intracardiac thrombusdenotes an increased risk of both embolism and death.Echocardiography is known to be the gold standard fordetecting intracardiac thrombi, but especially if located in theleft or right ventricular apex, they might be overseen.
Oral Abstracts72
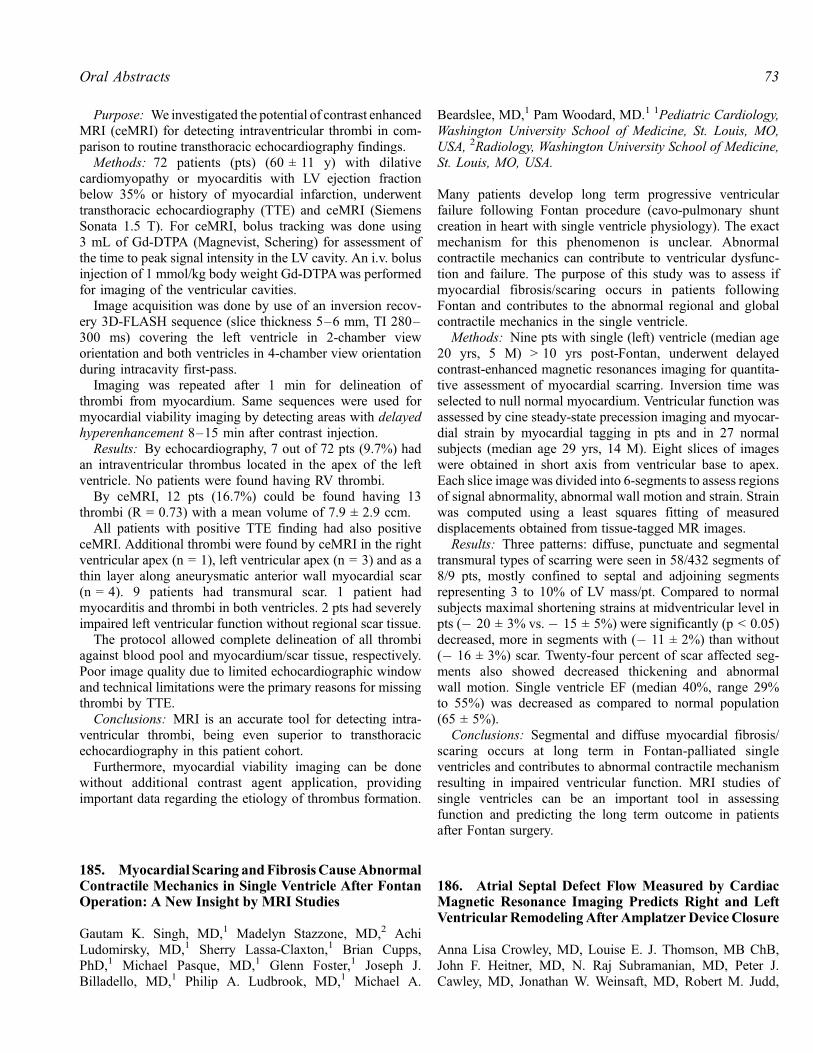
Purpose: We investigated the potential of contrast enhancedMRI (ceMRI) for detecting intraventricular thrombi in com-parison to routine transthoracic echocardiography findings.
Methods: 72 patients (pts) (60 ± 11 y) with dilativecardiomyopathy or myocarditis with LV ejection fractionbelow 35% or history of myocardial infarction, underwenttransthoracic echocardiography (TTE) and ceMRI (SiemensSonata 1.5 T). For ceMRI, bolus tracking was done using3 mL of Gd-DTPA (Magnevist, Schering) for assessment ofthe time to peak signal intensity in the LV cavity. An i.v. bolusinjection of 1 mmol/kg body weight Gd-DTPAwas performedfor imaging of the ventricular cavities.
Image acquisition was done by use of an inversion recov-ery 3D-FLASH sequence (slice thickness 5–6 mm, TI 280–300 ms) covering the left ventricle in 2-chamber vieworientation and both ventricles in 4-chamber view orientationduring intracavity first-pass.
Imaging was repeated after 1 min for delineation ofthrombi from myocardium. Same sequences were used formyocardial viability imaging by detecting areas with delayedhyperenhancement 8–15 min after contrast injection.
Results: By echocardiography, 7 out of 72 pts (9.7%) hadan intraventricular thrombus located in the apex of the leftventricle. No patients were found having RV thrombi.
By ceMRI, 12 pts (16.7%) could be found having 13thrombi (R = 0.73) with a mean volume of 7.9 ± 2.9 ccm.
All patients with positive TTE finding had also positiveceMRI. Additional thrombi were found by ceMRI in the rightventricular apex (n = 1), left ventricular apex (n = 3) and as athin layer along aneurysmatic anterior wall myocardial scar(n = 4). 9 patients had transmural scar. 1 patient hadmyocarditis and thrombi in both ventricles. 2 pts had severelyimpaired left ventricular function without regional scar tissue.
The protocol allowed complete delineation of all thrombiagainst blood pool and myocardium/scar tissue, respectively.Poor image quality due to limited echocardiographic windowand technical limitations were the primary reasons for missingthrombi by TTE.
Conclusions: MRI is an accurate tool for detecting intra-ventricular thrombi, being even superior to transthoracicechocardiography in this patient cohort.
Furthermore, myocardial viability imaging can be donewithout additional contrast agent application, providingimportant data regarding the etiology of thrombus formation.
185. Myocardial Scaring andFibrosisCauseAbnormalContractile Mechanics in Single Ventricle After FontanOperation: A New Insight by MRI Studies
Gautam K. Singh, MD,1 Madelyn Stazzone, MD,2 AchiLudomirsky, MD,1 Sherry Lassa-Claxton,1 Brian Cupps,PhD,1 Michael Pasque, MD,1 Glenn Foster,1 Joseph J.Billadello, MD,1 Philip A. Ludbrook, MD,1 Michael A.
Beardslee, MD,1 Pam Woodard, MD.1 1Pediatric Cardiology,Washington University School of Medicine, St. Louis, MO,USA, 2Radiology, Washington University School of Medicine,St. Louis, MO, USA.
Many patients develop long term progressive ventricularfailure following Fontan procedure (cavo-pulmonary shuntcreation in heart with single ventricle physiology). The exactmechanism for this phenomenon is unclear. Abnormalcontractile mechanics can contribute to ventricular dysfunc-tion and failure. The purpose of this study was to assess ifmyocardial fibrosis/scaring occurs in patients followingFontan and contributes to the abnormal regional and globalcontractile mechanics in the single ventricle.
Methods: Nine pts with single (left) ventricle (median age20 yrs, 5 M) > 10 yrs post-Fontan, underwent delayedcontrast-enhanced magnetic resonances imaging for quantita-tive assessment of myocardial scarring. Inversion time wasselected to null normal myocardium. Ventricular function wasassessed by cine steady-state precession imaging and myocar-dial strain by myocardial tagging in pts and in 27 normalsubjects (median age 29 yrs, 14 M). Eight slices of imageswere obtained in short axis from ventricular base to apex.Each slice image was divided into 6-segments to assess regionsof signal abnormality, abnormal wall motion and strain. Strainwas computed using a least squares fitting of measureddisplacements obtained from tissue-tagged MR images.
Results: Three patterns: diffuse, punctuate and segmentaltransmural types of scarring were seen in 58/432 segments of8/9 pts, mostly confined to septal and adjoining segmentsrepresenting 3 to 10% of LV mass/pt. Compared to normalsubjects maximal shortening strains at midventricular level inpts (� 20 ± 3% vs.� 15 ± 5%) were significantly (p < 0.05)decreased, more in segments with (� 11 ± 2%) than without(� 16 ± 3%) scar. Twenty-four percent of scar affected seg-ments also showed decreased thickening and abnormalwall motion. Single ventricle EF (median 40%, range 29%to 55%) was decreased as compared to normal population(65 ± 5%).
Conclusions: Segmental and diffuse myocardial fibrosis/scaring occurs at long term in Fontan-palliated singleventricles and contributes to abnormal contractile mechanismresulting in impaired ventricular function. MRI studies ofsingle ventricles can be an important tool in assessingfunction and predicting the long term outcome in patientsafter Fontan surgery.
186. Atrial Septal Defect Flow Measured by CardiacMagnetic Resonance Imaging Predicts Right and LeftVentricularRemodelingAfter Amplatzer DeviceClosure
Anna Lisa Crowley, MD, Louise E. J. Thomson, MB ChB,John F. Heitner, MD, N. Raj Subramanian, MD, Peter J.Cawley, MD, Jonathan W. Weinsaft, MD, Robert M. Judd,
73Oral Abstracts
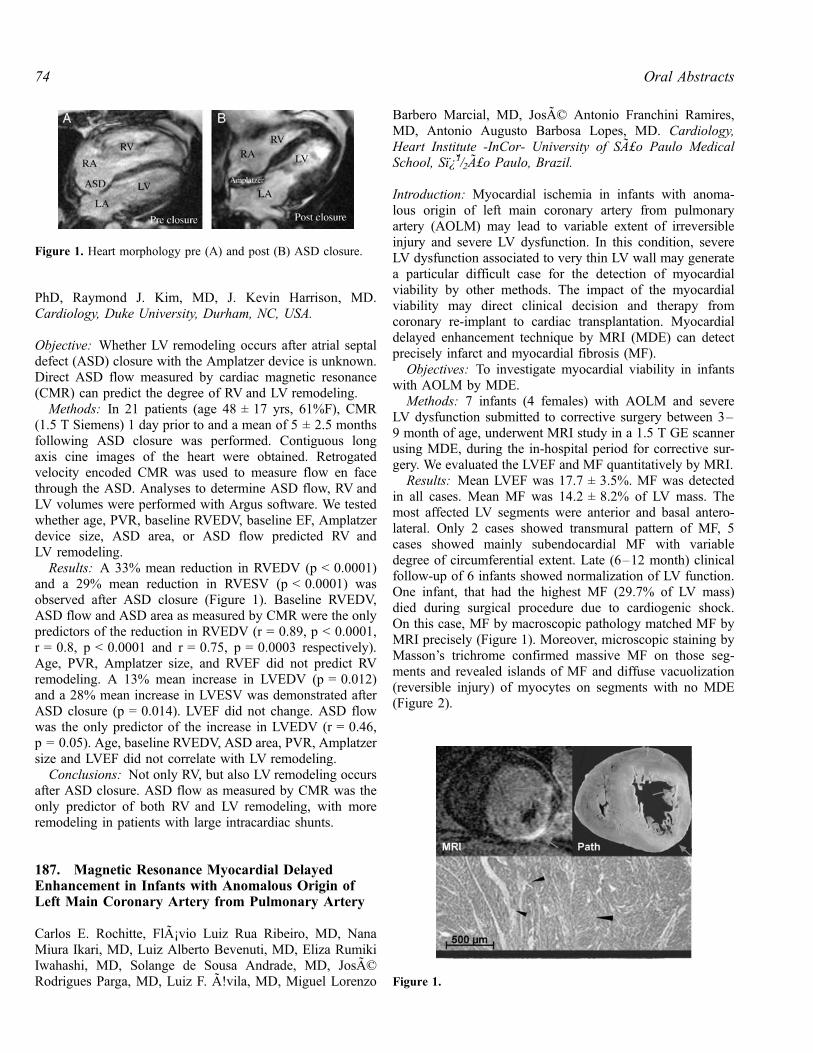
PhD, Raymond J. Kim, MD, J. Kevin Harrison, MD.Cardiology, Duke University, Durham, NC, USA.
Objective: Whether LV remodeling occurs after atrial septaldefect (ASD) closure with the Amplatzer device is unknown.Direct ASD flow measured by cardiac magnetic resonance(CMR) can predict the degree of RV and LV remodeling.
Methods: In 21 patients (age 48 ± 17 yrs, 61%F), CMR(1.5 T Siemens) 1 day prior to and a mean of 5 ± 2.5 monthsfollowing ASD closure was performed. Contiguous longaxis cine images of the heart were obtained. Retrogatedvelocity encoded CMR was used to measure flow en facethrough the ASD. Analyses to determine ASD flow, RV andLV volumes were performed with Argus software. We testedwhether age, PVR, baseline RVEDV, baseline EF, Amplatzerdevice size, ASD area, or ASD flow predicted RV andLV remodeling.
Results: A 33% mean reduction in RVEDV (p < 0.0001)and a 29% mean reduction in RVESV (p < 0.0001) wasobserved after ASD closure (Figure 1). Baseline RVEDV,ASD flow and ASD area as measured by CMR were the onlypredictors of the reduction in RVEDV (r = 0.89, p < 0.0001,r = 0.8, p < 0.0001 and r = 0.75, p = 0.0003 respectively).Age, PVR, Amplatzer size, and RVEF did not predict RVremodeling. A 13% mean increase in LVEDV (p = 0.012)and a 28% mean increase in LVESV was demonstrated afterASD closure (p = 0.014). LVEF did not change. ASD flowwas the only predictor of the increase in LVEDV (r = 0.46,p = 0.05). Age, baseline RVEDV, ASD area, PVR, Amplatzersize and LVEF did not correlate with LV remodeling.
Conclusions: Not only RV, but also LV remodeling occursafter ASD closure. ASD flow as measured by CMR was theonly predictor of both RV and LV remodeling, with moreremodeling in patients with large intracardiac shunts.
187. Magnetic Resonance Myocardial DelayedEnhancement in Infants with Anomalous Origin ofLeft Main Coronary Artery from Pulmonary Artery
Carlos E. Rochitte, FlA¡vio Luiz Rua Ribeiro, MD, NanaMiura Ikari, MD, Luiz Alberto Bevenuti, MD, Eliza RumikiIwahashi, MD, Solange de Sousa Andrade, MD, JosADRodrigues Parga, MD, Luiz F. A!vila, MD, Miguel Lorenzo
Barbero Marcial, MD, JosAD Antonio Franchini Ramires,MD, Antonio Augusto Barbosa Lopes, MD. Cardiology,Heart Institute -InCor- University of SA£o Paulo MedicalSchool, Sı¿1/2A£o Paulo, Brazil.
Introduction: Myocardial ischemia in infants with anoma-lous origin of left main coronary artery from pulmonaryartery (AOLM) may lead to variable extent of irreversibleinjury and severe LV dysfunction. In this condition, severeLV dysfunction associated to very thin LV wall may generatea particular difficult case for the detection of myocardialviability by other methods. The impact of the myocardialviability may direct clinical decision and therapy fromcoronary re-implant to cardiac transplantation. Myocardialdelayed enhancement technique by MRI (MDE) can detectprecisely infarct and myocardial fibrosis (MF).
Objectives: To investigate myocardial viability in infantswith AOLM by MDE.
Methods: 7 infants (4 females) with AOLM and severeLV dysfunction submitted to corrective surgery between 3–9 month of age, underwent MRI study in a 1.5 T GE scannerusing MDE, during the in-hospital period for corrective sur-gery. We evaluated the LVEF and MF quantitatively by MRI.
Results: Mean LVEF was 17.7 ± 3.5%. MF was detectedin all cases. Mean MF was 14.2 ± 8.2% of LV mass. Themost affected LV segments were anterior and basal antero-lateral. Only 2 cases showed transmural pattern of MF, 5cases showed mainly subendocardial MF with variabledegree of circumferential extent. Late (6–12 month) clinicalfollow-up of 6 infants showed normalization of LV function.One infant, that had the highest MF (29.7% of LV mass)died during surgical procedure due to cardiogenic shock.On this case, MF by macroscopic pathology matched MF byMRI precisely (Figure 1). Moreover, microscopic staining byMasson’s trichrome confirmed massive MF on those seg-ments and revealed islands of MF and diffuse vacuolization(reversible injury) of myocytes on segments with no MDE(Figure 2).
Figure 1. Heart morphology pre (A) and post (B) ASD closure.
Figure 1.
Oral Abstracts74

Conclusion: Myocardial delayed enhancement by MRIcan detect myocardial fibrosis in infants with anomalousorigin of left main coronary artery from pulmonary artery andprovide critical information on myocardial viability tomanage therapy (corrective surgery vs. heart transplant).
188. Initial Experience with 3 Tesla Cardiac MRIStudies for Small Infants and Children:The Advantages and Problems
Michael Silberbach, MD,1 Katherine Hopkins, MD,2 WilliamJ. Woodward, RT,2 Erwin Schwarz, RT,2 Michael Jerosch-Herold, PhD,2 David J. Sahn, MD.1 1Pediatric Cardiology,Oregon Health & Science University, Portland, OR, USA,2Diagnostic Radiology, Oregon Health & Science University,Portland, OR, USA.
Introduction/purpose: While we have expected that theopportunity to study our pediatric patients at 3 Tesla fieldstrength would offer better implementation of a numberof pulse sequences and improved diagnostic capability, littleexperience has been reported at 3 Tesla for pediatric car-diac studies.
Methods: We studied 35 patients with congenital heartdisease (CHD) aged 2 days–19 years, with diagnosesincluding TOF, VSD, PAPVR aortic area and systemicvenous anomalies. We used a 3 Tesla Philips system with aphased-array coil with anterior and posterior elements,allowing parallel image acquisition in older patients and a 2element flexible surface coil for infants.
Results: Use of fast field echo (FFE) produced artifact-free, high-resolution cine images to evaluate anatomy andfunction and T1-weighted single-shot survey imaging. S/Nratio for single-shot T1-weighted imaging of contrastenhancement at 3 T was high enough for use of parallelacquisition techniques (SENSE) with acceleration factors of2; echo times of approx. 1 ms. High quality angio or per-fusion images were obtained without appearance of suscep-tibility artifacts during peak contrast enhancement. 2D and 3Dgadolinium angiographic sequences were also shortened withparallel acquisitions. In small infants, MRI tagging with 6 mmtag-line spacing and 2 mm in-plane resolution allowedcoverage of the entire cardiac cycle with less tag-line fadingthan at 1.5 T. FFE with steady state free procession (SSFP)was more prone to flow and chemical shift (fat/water or air/tissue) artifacts than FFE without SSFP. Image susceptibilityartifacts with SSFP could only be partially avoided byshimming over the heart, and only standard FFE routinelyyielded diagnostic cine images for infants.
Conclusions: Early experience suggests significant advan-tages for 3 T MRI in children with CHD.
189. Normal Aortic Compliance and Left VentricularMass Late After Repair of Aortic Coarctation
Isabelle F. Vonder Muhll, Lorna Swan, Mustafa Kraidly,Michael Gatzoulis, Philip Kilner. Cardiovascular Mag-netic Resonance Unit, Royal Brompton Hospital, London,UK.
Introduction: After surgical repair, patients with coarctationof the aorta (COA) have been reported to have an increasedrisk of late atherosclerotic cardiovascular events. The factorsmediating this increase in risk are likely multifactorial.Impaired arterial compliance and left ventricular hypertrophyhave been implicated, although the degree to which theincreased risk can be ascribed to arterial hypertension aloneis unclear.
Purpose: We sought to determine if impaired aorticcompliance and left ventricular hypertrophy could bedemonstrated by cardiac magnetic resonance (CMR) imagingin the absence of arterial hypertension in adult patients lateafter repair of aortic coarctation.
Methods: Patients with repaired COAwho had no residualhemodynamic lesions and without arterial hypertension(n = 23 [9 female], 31 ± 8 years of age) were selected forassessment by CMR (Siemens Sonata whole-body 1.5 T
Figure 2.
75Oral Abstracts

scanner) and compared to age and sex matched normalcontrols (n = 20 [9 female], 33 ± 7 years of age). Highresolution cine imaging was used to estimate regionalcompliance of the ascending aorta, calculated as the changein volume of the aortic segment over the cardiac cycle,divided by aortic pulse pressure measured non-invasively.Left ventricular mass was determined at end diastole bystandard cine imaging of the left ventricle in short axis.
Results: CMR imaging in the COA patients confirmed noresidual aortic obstruction at the site of previous coarctationrepair. A bicuspid aortic valve was present in 14/23 COApatients, with mild aortic regurgitation in five of these. Theremainder of patients and controls had no significant aorticvalve disease. Systolic blood pressure was within normallimits in the COA patients, but higher than control subjects(see Table 1). The ascending aortic compliance was notsignificantly impaired in COA patients (see Table 1). At amedian of 22 years (range 5–35) after repair of COA, leftventricular mass indexed to body surface area was notelevated in patients compared to controls (see Table 1).
Conclusions: Patients with repaired COA with no residualhemodynamic lesions and without arterial hypertension havenormal aortic pulsatile hemodynamics and do not suffer fromleft ventricular hypertrophy. These findings suggest that anyincrease in risk of atherosclerotic complications late afterCOA repair is more likely to be mediated by hypertensionthan intrinsic impairment of arterial compliance in therepaired coarcted aorta.
190. Variability in Secondary Flow Patterns in theAorta of Single Ventricle Patients After BidirectionalCavo-Pulmonary Connection
Mark A. Fogel, MD, Suzanne Durning, Gil Wernovsky, MD,Avrum Pollock, MD, Nicolson Susan, MD. PediatricCardiology, Children’s Hospital of Philadelphia, Philadel-phia, PA, USA.
Introduction: We have previously demonstrated that primaryflow profiles in the descending aorta (DAo) skew posteriorlyin pts who have undergone an aortic to pulmonary
anastomosis and in those who have not. It is not knownwhether secondary flow profiles are affected by an aorticreconstruction (recon). Flow profiles are important incardiovascular energetics, organ perfusion and future devel-opment of atherosclerosis.
Purpose: To determine secondary flow patterns in patientsafter bidirectional cavopulmonary connection.
Methods: 10 single ventricle pts (7 recon, 3 no recon) afterhemiFontan (age 2.2 ± .5 yrs) underwent MRI blood (bolus)tagging in the DAo. The tag was placed parallel to thedirection of blood flow and the twist of the tag was measuredrelative to stationary structures over the DAo cross-section(see images).
Results: In 2/7 pts with recon, DAo flow twistedcounterclockwise and the others twisted clockwise. In singleleft ventricles with Damus-Kaye-Stansel procedures (N = 2),1 Dao was clockwise and the other was counterclockwise. Inthe 3 pts without recon, one pt twisted clockwise while 2twisted counterclockwise. Maximum twist, whether clock-wise and counterclockwise was 43–47 degrees occurring275 ± 30 milliseconds after the R wave.
Conclusions: Unlike primary flow patterns in the DAo,secondary flow patterns in recon and non-recon aortas arevariable, twisting both clockwise and counterclockwise. Thisinformation may be useful when planning future modifica-tions of aortic recons.
191. Cardiac Magnetic Resonance Imaging inCongenital Heart Disease Using Free Breathingwith Deep Sedation
Emily A. Wessler, MD,1 Barry A. Love, MD,1 Karen I.Norton, MD,2 Frank Macaluso,2 James C. Nielsen, MD.11Pediatric Cardiology, Mount Sinai Hospital, New York, NY,USA, 2Radiology, Mount Sinai Hospital, New York, NY, USA.
Background: Cardiac magnetic resonance imaging (CMRI)has become a valuable non-invasive tool for evaluatingstructure, function, and flow rates in congenital heart disease.General anesthesia is commonly used in infants and smallchildren because of the cooperation required for accurateimaging. An alternative approach utilizing deep sedation and
Table 1.
CoA Controls p
Systolic bloodpressure (mmHg)
124 ± 17 114 ± 17 0.04
Diastolic bloodpressure (mmHg)
70 ± 12 66 ± 11 0.21
Ascending aorticcompliance(mL/mmHg)
16.4 ± 7.5 18.9 ± 7.4 0.27
Left ventricularmass index (g/m sq.)
77 ± 15 72 ± 10 0.14
<
Oral Abstracts76

imaging during free-breathing may be advantageous in somepatients. We sought to determine the accuracy of deepsedation free-breathing CMRI data using catheter obtaineddata as the reference standard.
Methods: From June 2003 until June 2004, 17 deep seda-tion CMRI were performed using chloral hydrate (80 mg/kg)with no adverse events. There was 1 failed sedation whichwas repeated with success. Nine patients (mean age 1.2 ±0.6 years) had cardiac catheterization data available. Indexedpulmonary (Qp) and systemic (Qs) blood flow were measuredusing a standard segmented k-space phase contrast sequence(TR 6.8–7.8 msec, TE 3.2–3.4 msec, VPS 2, NEX 3, FOV20–26 cm, slice thickness 5–6 mm, matrix 256 � 128, BW31.3 kHz, flip angle 20). Qp and Qs were determined by theFick method using invasive oximetry and estimated oxygenconsumption. Pearson’s correlation coefficient (R) and theBland-Altman method of agreement were used to evaluate theaccuracy of the CMRI data. All data are presented asmean ± SD or as median (range).
Results: Median time between CMRI and catheterizationwas 27 days (� 3 to 317 days). The mean heart rate duringthe CMRI and the catheterization were 106 ± 21.4 and122.5 ± 21.7 beats per minute (bpm), respectively. The meandifference in heart rate was � 16 ± 14.5 bpm. The patients’physiology included cavopulmonary anastomosis (N = 4), noshunting (N = 3), and left-to-right shunting (N = 2) with arange for CMRI Qp/Qs of 0.49–3.3 and for catheter obtainedQp/Qs of 0.46–2.8.
Variable R Mean differenceLimits of agreement
(mean ± 2SD)
Qp 0.89 � 0.46 L/min/m2 � 3.0 to 2.1 L/min/m2
Qs 0.79 � 1.0 L/min/m2 � 4.1 to 2.1 L/min/m2
Qp/Qs 0.96 + 0.2 � 0.48 to 0.89
Conclusion: CMRI using free breathing and deep sedationis safe and reliable, and for flow ratio (Qp/Qs) there is goodagreement compared with oximetry. The relatively pooragreement found between CMRI and catheterization data forabsolute flow (Qp and Qs) is not surprising given the inherentvariability of cardiac output over time, the differentphysiologic states during data acquisition (deep sedationversus general anesthesia), the known error with assumedoxygen consumption in young subjects, and the non-simultaneous comparison.
192. CMR Assessment of Pulmonary Regurgitationand Right Ventricular Function After Repair ofTetralogy of Fallot
Karen G. Ordovas, MD, Mei-Han Wu, MD, Gautham P.Reddy, MD, M.P.H., Charles B. Higgins, MD. Radiology,UCSF, San Francisco, CA, USA.
Introduction: Pulmonary regurgitation is one of the mostimportant sequela after surgical correction of tetralogy ofFallot and is one of the determinants of long term clinicaloutcome. Several prior studies have used volumetric cine MRand phase-contrast cine MR to evaluate severity of pulmonaryregurgitation and right ventricular volumes and function inthese patients (1,2). Traditionally, the major parameter used inevaluating right ventricular (RV) function has been ejectionfraction. Pulmonary valve replacement has been shown toimprove ventricular function in these patients as assessed byCMR (3). Consequently, it is important to determine the needfor and timing of valve replacement.
The purpose of this study was to evaluate CMR measure-ments of RV volumes and function that can indicatediminished RV ventricular function in order to provide anindication for valve replacement.
Patients and Methods: We evaluated 14 patients withsurgically corrected tetralogy of Fallot with pulmonaryregurgitation who had undergone MRI studies over a twoyear period. Time since surgical correction varied from 2.5months to 53 years. Pulmonary regurgitant volume, pulmo-nary regurgitant fraction , RVend-diastolic volume (RVEDV),RV end-systolic volume (RVESV), RV stroke volume(RVSV) and RV ejection fraction (total RVEF) werecalculated from short-axis cine-MR images. Severe tricuspidregurgitation was excluded in all patients throught echocar-diography. In the presence of regurgitation, the use of ejectionfraction to assess ventricular function is complicated by thefact that much of the stroke volume is related to regurgitantvolume. As an alternative, we assessed the effective (forward)RVEF , calculated by dividing the difference between rightventricular stroke volume and pulmonary regurgitant volumeby the right ventricular end-diastolic volume (RVSV-pulmo-nary regurgitant volume/RVEDV). End-diastolic volume andend-systolic volume indexes (EDVi, ESVi) were calculatedbased on the body surface area. Correlation coeficient wasassessed to measure the correlation of pulmonary regurgitantfraction with total RVEF and effective RVEF. ANOVA wasuse to compare EDVi with effective RVEF and total RVEF. Acut-off of 180 ml/m2 for RVEDi was used to categorizethe sample.
Results: A strong correlation between pulmonary regur-gitant fraction and effective RVEF (r = 0.81, p = 0.001) wasidentified. There was no significant correlation betweenpulmonary regurgitant fraction and total RVEF. The meaneffective RVEF in the group of patients with REDVi less then180 ml/m2 was 30.3% ± 9.8%, while in the patients withREDVi greater than 180 ml/m2, the mean effective RVEF was17.2% ± 4.4% (p = 0.016). The sample size was not largeenought to evaluate any correlation between time sincesurgical procedure and RV function.
Conclusion: Calculation of total RVEF in patients withpulmonary regurgitation is probably not usefull because of theconfounding effect of pulmonary regurgitant volume. Effec-tive (forward) RVEF provides a better indication of RVfunction in this setting and is inversely related to regurgitant
77Oral Abstracts
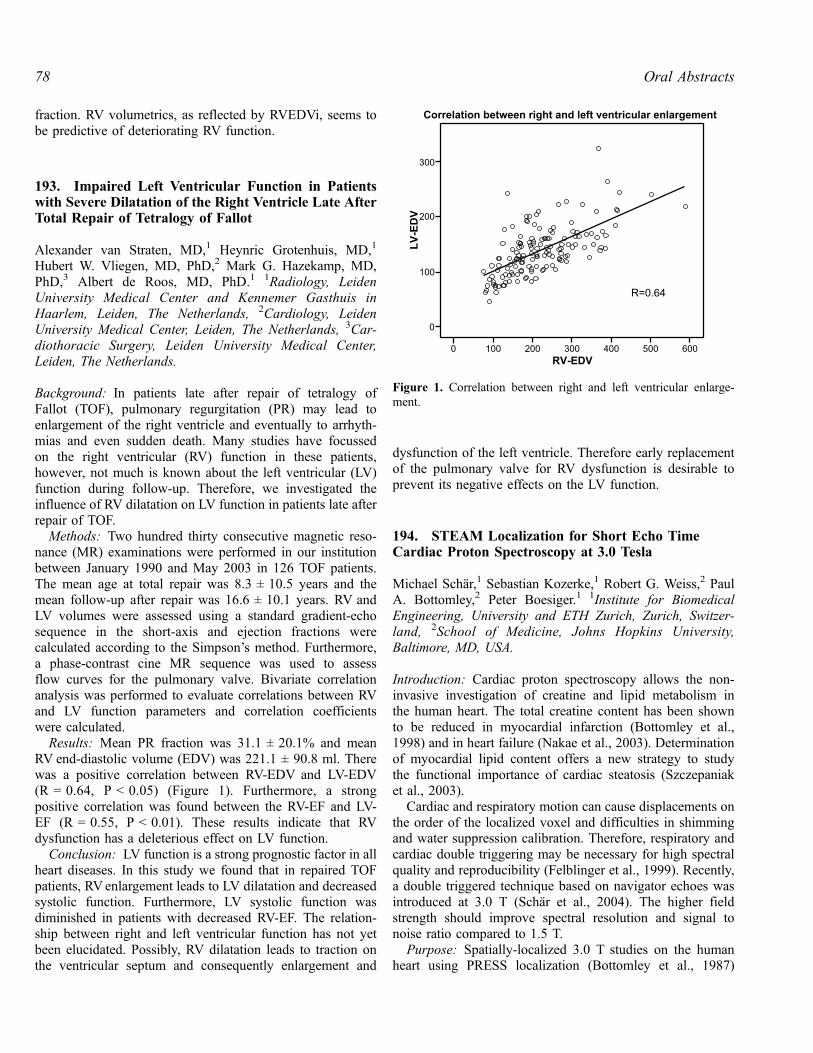
fraction. RV volumetrics, as reflected by RVEDVi, seems tobe predictive of deteriorating RV function.
193. Impaired Left Ventricular Function in Patientswith Severe Dilatation of the Right Ventricle Late AfterTotal Repair of Tetralogy of Fallot
Alexander van Straten, MD,1 Heynric Grotenhuis, MD,1
Hubert W. Vliegen, MD, PhD,2 Mark G. Hazekamp, MD,PhD,3 Albert de Roos, MD, PhD.1 1Radiology, LeidenUniversity Medical Center and Kennemer Gasthuis inHaarlem, Leiden, The Netherlands, 2Cardiology, LeidenUniversity Medical Center, Leiden, The Netherlands, 3Car-diothoracic Surgery, Leiden University Medical Center,Leiden, The Netherlands.
Background: In patients late after repair of tetralogy ofFallot (TOF), pulmonary regurgitation (PR) may lead toenlargement of the right ventricle and eventually to arrhyth-mias and even sudden death. Many studies have focussedon the right ventricular (RV) function in these patients,however, not much is known about the left ventricular (LV)function during follow-up. Therefore, we investigated theinfluence of RV dilatation on LV function in patients late afterrepair of TOF.
Methods: Two hundred thirty consecutive magnetic reso-nance (MR) examinations were performed in our institutionbetween January 1990 and May 2003 in 126 TOF patients.The mean age at total repair was 8.3 ± 10.5 years and themean follow-up after repair was 16.6 ± 10.1 years. RV andLV volumes were assessed using a standard gradient-echosequence in the short-axis and ejection fractions werecalculated according to the Simpson’s method. Furthermore,a phase-contrast cine MR sequence was used to assessflow curves for the pulmonary valve. Bivariate correlationanalysis was performed to evaluate correlations between RVand LV function parameters and correlation coefficientswere calculated.
Results: Mean PR fraction was 31.1 ± 20.1% and meanRV end-diastolic volume (EDV) was 221.1 ± 90.8 ml. Therewas a positive correlation between RV-EDV and LV-EDV(R = 0.64, P < 0.05) (Figure 1). Furthermore, a strongpositive correlation was found between the RV-EF and LV-EF (R = 0.55, P < 0.01). These results indicate that RVdysfunction has a deleterious effect on LV function.
Conclusion: LV function is a strong prognostic factor in allheart diseases. In this study we found that in repaired TOFpatients, RV enlargement leads to LV dilatation and decreasedsystolic function. Furthermore, LV systolic function wasdiminished in patients with decreased RV-EF. The relation-ship between right and left ventricular function has not yetbeen elucidated. Possibly, RV dilatation leads to traction onthe ventricular septum and consequently enlargement and
dysfunction of the left ventricle. Therefore early replacementof the pulmonary valve for RV dysfunction is desirable toprevent its negative effects on the LV function.
194. STEAM Localization for Short Echo TimeCardiac Proton Spectroscopy at 3.0 Tesla
Michael Schar,1 Sebastian Kozerke,1 Robert G. Weiss,2 PaulA. Bottomley,2 Peter Boesiger.1 1Institute for BiomedicalEngineering, University and ETH Zurich, Zurich, Switzer-land, 2School of Medicine, Johns Hopkins University,Baltimore, MD, USA.
Introduction: Cardiac proton spectroscopy allows the non-invasive investigation of creatine and lipid metabolism inthe human heart. The total creatine content has been shownto be reduced in myocardial infarction (Bottomley et al.,1998) and in heart failure (Nakae et al., 2003). Determinationof myocardial lipid content offers a new strategy to studythe functional importance of cardiac steatosis (Szczepaniaket al., 2003).
Cardiac and respiratory motion can cause displacements onthe order of the localized voxel and difficulties in shimmingand water suppression calibration. Therefore, respiratory andcardiac double triggering may be necessary for high spectralquality and reproducibility (Felblinger et al., 1999). Recently,a double triggered technique based on navigator echoes wasintroduced at 3.0 T (Schar et al., 2004). The higher fieldstrength should improve spectral resolution and signal tonoise ratio compared to 1.5 T.
Purpose: Spatially-localized 3.0 T studies on the humanheart using PRESS localization (Bottomley et al., 1987)
Figure 1. Correlation between right and left ventricular enlarge-ment.
Oral Abstracts78

resulted in longer echo times TE (� 40 msec) than earlierwork at 1.5 T because of the reduced maximum amplitude(B1max) of the radio-frequency excitation pulses and the needfor strong crusher gradients. The purpose of this study was toreduce TE by applying a STEAM localization technique(Frahm et al., 1987).
Methods: STEAM localization was implemented allowingshort echo times when using the whole body coil forexcitation. STEAM (90�-TE/2-90�-TM-90�-TE/2-acquisition;TM the mixing time) has an inherent shorter TE than PRESSas magnetization does not undergo any T2 decay during TMbecause it is stored in the longitudinal direction. The shorterTE comes at the cost of loosing half of the initially excitedmagnetization. The use of 90� instead of 180� pulses with thelimited B1max leads to shorter excitation pulses reducing TEeven further. The shorter pulses allow stronger spatialselective gradients and, therefore, reduce the chemical shiftselective artifact.
In-vivo measurements were performed in a healthyvolunteer on a 3.0 T Intera whole body MR system (PhilipsMedical Systems, Best, The Netherlands) using a circularsurface coil. Cardiac triggering was performed using a vector-ECG. A mid-ventricular short-axis cine was acquired todetermine the trigger delay for least motion in mid-diastole.Second order shimming and frequency determination wasbased on B0-mapping. For STEAM volume placing, short-axis and long-axis views were measured using the calculatedshim and frequency settings (Figure 1).
For the spectroscopy scan, the navigator echo excitationwas applied after the chemical shift-selective water suppres-sion to minimize the time delay between the navigatoracquisition and the actual data collection, which led todegraded water suppression. Outer volume suppression wasapplied in all six directions. The parameters for thespectroscopy measurement were: TE: 20 ms,TM: 20 ms,bandwidth: 2000 Hz, 1024 data points, repetition time: atleast 3500 ms, position: supine, and averages: 128 resulting ina scan time of less than 10 minutes assuming a navigatorefficiency of 50%.
The 128 spectra were phased based on the residual waterpeak, averaged, zero filled to 2048 data points andexponentially filtered with 10 Hz.
Results: Figure 2 shows a spectrum from a 14 � 25 � 30mm3 volume in the septum. Peaks from methylene protons(Cr2) of creatine/phosphocreatine (Cr), trimethylammoniumcompounds (TMA), methyl protons (Cr3) of Cr, and lipidscan be observed.
Conclusions: STEAM localization was implemented andcombined with the navigator based double triggered cardiacspectroscopy protocol at 3.0 T and allowed reduction of echotimes to 20 ms. Initial results show the potential of thetechnique to acquire high quality spectra from human cardiacmuscle in-vivo.
REFERENCES
Bottomley, P. A., et al. (1987). Ann. N.Y. Acad. Sci. 508:. 333–348.
Bottomley, P. A., et al. (1998). Lancet 351:. 714–718.
Felblinger, J., et al. (1999). MRM 42:. 903–910.
Frahm, J., et al. (1987). JMR 72:. 502–508.
Nakae, I., et al. (2003). JACC 42:. 1587–1593.
Schar, M., et al. (2004). MRM 51:. 1091–1095.
Szczepaniak, L. S., et al. (2003). MRM 49:. 417–423.
195. In vivo Magnetic Resonance Imaging ofInflammation in Myocardial Infarct Mouse Model
Takayasu Arai,1 Anthony D. Caffarelli, MD,2 Joan M. Greve,MS,3 Paula M. Jacobs, PhD,4 Robert C. Robbins, MD,2
Michael V. McConnell , MD,1 Phill ip C. Yang,MD.1 1Department of Medicine, Division of CardiovascularMedicine, Stanford University, School of Medicine, Stanford,CA, USA, 2Department of Cardiothoracic Surgery, Stanford
Figure 2. STEAM proton spectrum measured at an echo time of 20ms from a 10.5 ml volume in the septum of the same healthyvolunteer as shown in Figure 1.
Figure 1. Short-axis (A) and long-axis (B) views at mid-diastole toposition the STEAM volume (black box) measured during free-breathing using navigator respiratory motion correction identical tothe subsequent spectroscopy measurement.
79Oral Abstracts

University, School of Medicine, Stanford, CA, USA, 3Depart-ment of Radiology, Stanford University, School of Medi-cine, Stanford, CA, USA, 4Advanced Magnetics, Cambridge,MD, USA.
Introduction: A reliable method for imaging the inflam-matory changes induced by myocardial infarction (MI) hasnot been established. However, it is well known the presenceof inflammatory process in the area of MI. Feasibility of invivo magnetic resonance (MR) imaging using ultra-smallparamagnetic iron oxide (USPIO) agents to detect post-MIinflammatory changes was tested.
Methods: 129Sv/J mice underwent LAD ligation to induceMI (n = 9) or sham operation (n = 3). On post-MI day #6, theUSPIO agent ferumoxtran-10 (Combidexa, Advanced Mag-netics, 10 mg Fe/kg) was injected via tail vein. Twenty-fourhours following the injection, MR imaging using an EKG-gated and respiratory monitored gradient-echo sequence (TR20 ms, TE 2.5 ms, FOV 30 mm, matrix 128 � 128, slicethickness 1 mm and flip angle 60�) was performed at 4.7 Tusing a 15 cm horizontal bore magnet (Oxford Instruments)with GE Techron Gradients (12 G/cm) and a volume coil withan inner diameter of 3.5 cm (Varian Inc.). The explantedhearts were sliced along the short-axis plane at 4-micrometerthickness and then fixed in 10% formalin. The sections werestained with macrophage-specific antigen F4/80 and Prussianblue for iron.
Results: As shown in Figure 1, T2* dephasing effect dueto ferumoxtran-10 particles taken up by macrophages homingto the infarct territory was detected by in vivo MR in 7 out of9 MI animals but not in sham-operated animals. Using a16-segment analysis (American Society of Echocardiogra-
phy), a strong anatomical correlation was demonstratedbetween the MR and histology images of the ferumoxtran-10-laden macrophages in the infarct region (r = 0.784,p < 0.005). Histologically, iron particles were identified onlyin the area of infarct using Prussian blue (Figure 2). The areaof infarct contains significant number of macrophages stainedwith F4/80. Significantly fewer macrophages can be noticedin the non-infarct area as shown in Figure 3.
Conclusions: In vivo MR imaging of ferumoxtran-10particles taken up by macrophages allows accurate as-sessment of the inflammatory process following myocar-dial infarction.
196. Selective Cerebral Overexpression of GrowthHormone Alters Cardiac Function, Morphology,Energy Metabolism and Catcholamines inTransgenic Mice
Mohammad Bohlooly, PhD,1 Entela Bollano, MD, PhD,2
Reza Mobini, PhD,2 Bassam Soussi, PhD,2 Jan Thornell, MD,PhD,2 Elmir Omerovic, MD, PhD.2 1AstraZeneca R&D,Molndal, Sweden, 2Sahlgrenska University Hospital, Wallen-berg laboratory, Gothenburg, Sweden.
Introduction: Growth hormone (GH) has important regula-tory effects on cardiac morphology and function both duringnormal development as well as in pathophysiological settingssuch as myocardial infarction (MI) and congestive heartfailure (CHF). energy metabolism.
Purpose: The aims of this study were to evaluate theeffects of selective overexpression of GH in the brain oncardiac morphology, function, interaction between GH andsympathetic nervous system (SNS) as well as on cardiacand brain.
Methods: Transgenic mice with selective GH overexpress-sion in the brain under control of the glial fibrillary acidicprotein promoter (GFAP-bGH, n = 15) were created andcompared to genetically matched non-transgenic littermatecontrols (C, n = 15). Cardiac morphology and function wereevaluated in vivo using transthoracic echocardiogra-phy during resting and stress conditions induced pharmaco-logically by dopamine (D) and isoprtenolol (ISO). Myocardial
Figure 1. Ferumoxtran-10 signal in the anterior to antero-lateralinfarct region as shown by a signal void (white arrows).
Figure 2. (A) Ferumoxtran-10 in the anterior infarct territory (bluebox) shown by Prussian Blue stain (black arrow). (B) High-power(20�) of ferumoxtran-10 in the infarct region (black arrow).
Figure 3. (A) High-power image (15�) of the macrophage-specificstain in the area of infarct. (B) High-power image (15�) of themacrophage-specific stain in the non-infarct territory.
Oral Abstracts80

and brain energy metabolism were evaluated noninvaseivelyusing in vivo volume-selective phosphorus magnetic reso-nance spectroscopy (31P MRS). Myocardial content ofnoradrenaline (NA) was analyzed by means of HPLC.
Results: Compared to the C animals, the bGH mice haveshow several differences in the cardiac phenotype. Systolic(fractional shortening) and diastolic function (E/Awave ratio)was disturbed in the GFAP-bGH mice (p < 0.05). During thedopamine stress, there was chronotropic insufficiency in thebGH group (p < 0.01) while no difference was observed inresponse to isoprotenolol. Left ventricular dimensions wereincreased in GFAP-bGH mice (p < 0.05). There was no diff-erence in body weight, heart weight and brain weight. Myo-cardial content of noradrenaline was lower in the GFAP-bGHgroup (p < 0.05). PCr/ATP ratio was higher in the brain(2.98 ± 0.14 v. 2.15 ± 0.14, p < 0.05) and lower in the heart(1,59 ± 0,07 v. 1,96 ± 0,04, p < 0.05) in the GFAP-bGHmice.
Conclusions: Selective cerebral overexpression of GHresults in marked alterations of cardiac function, morphologyand metabolism in transgenic mice. Decreased myocardialcontent of catecholamines in GFAP-bGH mice suggestscomplex interaction between GH and sympathetic nervoussystem that my be involved in altered cardiovascularphenotype of the GFAP-bGH mice.
197. Obesity is Associated with Abnormal MyocardialEnergetics as Detected by Cardiovascular MagneticResonance Spectroscopy
Monique R. Robinson,1 Michaela Scheuermann-Freestone,1
Andrew Blamire,2 David Manners,3 Kieran Clarke,4 StefanNeubauer.1 1Cardiovascular Medicine, University of OxfordCentre for Clinical Magnetic Resonance Research, Oxford-shire, UK, 2Wolfson Research Centre, Institute for Ageing andHealth, Newcastle General Hospital, UK, 3Dipartimento diMedicina Clinica e Biotecnologia Applicata, Universita diBologna, Italy, 4University of Oxford, University Laboratoryof Physiology, Oxfordshire, UK.
Introduction: Decreased phosphocreatine (PCr)/adenosinetriphosphate (ATP) ratios reflect abnormal cardiac metabo-lism and have been demonstrated in heart failure and diabetes,where they correlate negatively with increased circulatingfree fatty acid (FFA) concentrations. Obesity predisposes toheart failure.
Purpose: We hypothesized that obese individuals, in theabsence of hypertension, diabetes and insulin resistancewould show deranged myocardial energetics, and that theseenergetic changes would be closely associated with theadipokine leptin, and FFA levels.
Methods: Using 31P magnetic resonance spectroscopy(MRS) on a 2 T MR scanner, we measured cardiac energetics(PCr/ATP) in sixteen normotensive asymptomatic obeseadults, mean body mass index (BMI) 31.2 kg/m2, and eleven
age- and sex- matched controls. Using a 1.5 T MR scanner,cardiac function was assessed and measurements taken forend diastolic volume (EDV), end systolic volume (ESV),stroke volume (SV), ejection fraction (EF), and leftventricular mass (LVM). LVM was corrected for height andlog transformed to better approximate a normal distribution
Figure 1. Cardiac 13P MR spectra of lean compared with an obesesubject.
Figure 2. Graph showing correlation of FFA with PCR/ATP.
81Oral Abstracts

(LnLVM). Fasting leptin, glucose, insulin, C-reactive protein,lipids and FFA levels were measured. Insulin resistance wasassessed by HOMA.
Results: The obese group were insulin sensitive but hadsignificantly higher free fatty acid (0.64 ± 0.06 vs.0.42 ± 0.05 mmol/L, p < 0.05) and leptin (30.5 ± 3.9 vs.8.0 ± 1.1 ng/ml, p < 0.001) levels, compared to the leangroup. There was no significant difference for EDV, ESV, SVor EF between the obese and control groups but LnLVM wassignificantly increased in the obese (144 ± 9.3 vs. 112 ± 11.0g, p = 0.04). PCr/ATP ratios were significantly decreased inthe obese group (1.81 ± 0.6 vs. 2.26 ± 0.08, p < 0.001). PCr/ATP negatively correlated with BMI (r = � 0.56, p < 0.05),fat mass (r = � 0.58, p < 0.05), leptin (r = � 0.47,p < 0.05) and FFA (� 0.55, p < 0.05). No correlation wasobserved between PCr/ATP and other measured metabolites.Multiple linear regression analysis demonstrated thatFFA levels were the strongest predictors of cardiac energet-ics in uncomplicated obesity (Regression coefficients� 6.41 � 10� 4, 95% confidence intervals � 0.001 to0.000, p = 0.018) (Figures 1 and 2).
Conclusions: In the absence of other cardiovascular riskfactors, obesity is associated with deranged myocardial me-tabolism. The energetics abnormalities in this subpopulationmay precede abnormal contractile function and explain theincreased risk of the development of heart failure in obesity.
198. Lipid Identification by Image-Guided (1H)Proton Magnetic Resonance Spectroscopy ofHuman Carotid Atherosclerosis
Frederick L. Ruberg, MD,1 Jason Viereck, MD, PhD,2 YeQiao,2 Joseph Loscalzo, MD, PhD,1 James A. Hamilton,
PhD.2 1Evans Department of Medicine, Section of Cardiol-ogy, Whitaker Cardiovascular Institute, Boston UniversitySchool of Medicine, Boston, MA, USA, 2Department ofPhysiology and Biophysics, Boston University School ofMedicine, Boston, MA, USA.
Introduction: Commonly employed modalities utilized toimage atherosclerosis, such as invasive catheterization,incompletely identify specific plaque components. Magneticresonance imaging (MRI) offers greatly improved soft tissueresolution and can noninvasively characterize certain plaquemorphologic components, however imaging features ofplaque lipid remain incompletely defined. Image-guidedproton (1H) magnetic resonance spectroscopy (MRS) permitsacquisition of high-resolution spectra from discrete volumesof tissue (or voxels) localized by an MR image, and thusmay offer a complimentary technique to detect and quantifyplaque lipid.
Purpose: As the predominant component of plaque lipid ischolesteryl ester, which is readily identified by MRS, wehypothesized that image-guided proton MRS would confirmthe presence of lipid in selected regions of human athero-sclerotic plaque thought to contain lipid by MRI.
Methods: Human carotid plaque specimens (n = 4) wereobtained following carotid endarterectomy, maintained at37�C, and imaged by MRI at high-field (11.7 T) utilizingstandard T1 and T2 weighted spin-echo protocols. Imagequality was sufficient to permit microscopic resolution ofplaque components. The generation of a polar map fromthe ratio of T2/T1 weighted image intensities providedguidance for voxel selection, with lipid-rich regions of plaquedefined as those that were T1 intense relative to T2. ProtonMRS spectra (TR 500 ms, TE 16 ms, NEX 600) wereacquired from 1 mm3 voxels, localized to plaque regions that
Figure 1.
Oral Abstracts82

appeared either lipid-rich (n = 4) or lipid-poor (n = 4) byintensity mapping.
Results: Spectra obtained from a priori identified lipid-richregions permitted identification of the methyl and methyleneresonances of cholesteryl ester, whereas spectra from lipid-poor regions did not demonstrate these resonances (seeFigure 1). To permit semi-quantitative comparison of spectraldata from different plaque specimens, the integrated intensityof the peak lipid methylene resonance from each spectrum wasdivided by the integral of the water peak. The calculated lipid:water ratio of lipid-rich regions was 0.49 ± 0.04 vs. 0.13 ±0.05 for lipid-poor regions (p = 0.00001). Histologic analysis,including polarized light-microscopy, confirmed the presenceof lipid in the regions identified by both MRI and MRS.
Conclusions: The application of image-guided protonMRS accurately identified lipid in selected regions ofatherosclerotic plaque as small as 1 mm3 at high-fieldstrength (11.7 T). When applied at lower field-strengths, thistechnique may also permit both detection and quantificationof lipid in selected plaque regions noninvasively and thusmay be applied to future in vivo studies.
199. Obesity is Associated with Abnormal SkeletalMuscle Energetics—A Magnetic ResonanceSpectroscopy Study
Monique R. Robinson,1 David Manners,2 Michaela Scheuer-mann-Freestone,1 Kieran Clarke,3 Stefan Neubauer.1 1Car-diovascular Medicine, University of Oxford Centre forClinical Magnetic Resonance Research, Oxfordshire, UnitedKingdom, 2Universita di Bologna, Dipartimento di MedicinaClinica e Biotecnologia Applicata, Bologna, Italy, 3Universityof Oxford, University Laboratory of Physiology, Oxfordshire,UK.
Introduction: Obesity is associated with metabolic abnor-malities and when complicated by insulin resistance anddiabetes, abnormal skeletal muscle energetics. The adipocyte-derived hormone, leptin, is elevated in obesity, and has beenassociated with deranged skeletal muscle metabolism incachectic patients.
Purpose: We hypothesised that insulin-sensitive obesepatients have abnormal skeletal muscle energetics secondaryto hyperleptinaemia.
Methods: Using 31P magnetic resonance spectroscopy(MRS) on a 2 T system, 78 overweight and obese patients(mean body mass index (BMI) 34.2 kg/m2) and 19 age- andsex-matched controls (mean BMI 23.8 kg/m2) were exam-ined. Rest, exercise and recovery skeletal muscle energeticsprofiles of the right gastrocnemius muscle were analysed forconcentrations of phosphocreatine (PCr), adenosine triphos-phate (ATP) and inorganic phosphate (Pi). Fasting glucose,insulin and leptin were measured and relative insulinresistance (IR) was assessed using HOMA.
Results: Insulin sensitivity was normal in the obese groupbut leptin was significantly higher in the obese (29.1 ± 2.0 vs.7.9 ± 0.7 ng/ml, p < 0.001). Both groups exercised forsimilar durations but the phosphorylation potential in theobese (expressed as its inverse for better approximation to anormal distribution (1/pot), a measure of the energy availableto the muscle fibres, was half that of the lean group at rest(6.9 ± 0.4 vs. 11.2 ± 1.2 � 106, p < 0.001). Obese subjectsalso had significantly slower PCr recovery half times(44.2 ± 1.9 vs. 30.4 ± 2.5 s, p < 0.001). Vmax, an indicatorof the maximal rate of mitochondrial ATP synthesis, was alsodecreased in the obese. 1/pot correlated negatively with leptin(r = � 0.3, p < 0.05), as did the initial rate of PCr formation(r = � 0.3, p < 0.05).
BMI also negatively correlated with 1/pot (r = �0.3,p < 0.001) and the initial rate of PCr formation (r = �0.4,p < 0.05).
Further, leptin showed a progressive increase across theBMI categories from overweight to Class III obesity, whichwas matched by decreasing phosphorylation potential andinitial rate of PCr formation and increasing Vmax, and halftime recovery for PCr.
Conclusions: Obesity is a risk factor for abnormalskeletal muscle energetics after exercise, with diminishedoxidative phosphorylation capacity. The abnormalities seenwere associated with elevated leptin levels. Decreasing fatmass, thereby lowering leptin, might reduce skeletalmuscle metabolic derangement early in the pathophysiol-ogy of obesity.
200. P31 MRS and Delayed Recovery ofPhosphocreatine After Exercise: A NewDiagnostic Test for Peripheral Arterial Disease?
David C. Isbell, MD,1 Stuart S. Berr, PhD,2 Alicia Toledano,PhD,3 Frederick H. Epstein, PhD,2 Craig H. Meyer, PhD,4
Jennifer Hunter, BSN,2 Nancy L. Harthun, MD,5 Walter J.Rogers, PhD,2 Christopher M. Kramer, MD.1 1Medicine,University of Virginia, Charlottesville, VA, USA, 2Radiology,University of Virginia, Charlottesville, VA, USA, 3BrownUniversity, Providence, RI, USA, 4Biomedical Engineering,University of Virginia, Charlottesville, VA, USA, 5Surgery,University of Virginia, Charlottesville, VA, USA.
Introduction: Peripheral arterial disease (PAD) is character-ized by inadequate blood flow to the lower extremities as aconsequence of atherosclerotic vascular disease. Despite agrowing incidence, PAD remains underdiagnosed, under-treated, and understudied. Non-invasive modalities employedfor the diagnosis of PAD have a number of limitations,including inaccuracy among patients with aorto-iliac disease,diabetes mellitus, collateralized territories, and heavilycalcified vessels. Angiography, long considered the goldstandard, is limited to visualizing the vascular lumen and
83Oral Abstracts

exposes patients to ionizing radiation and nephrotoxiccontrast agents. With each of these techniques, macrovascularabnormalities are interpreted as a surrogate marker of tissueischemia, largely ignoring adaptations in cellular metabolismand within the microvasculature that develop during theevolution of vascular insufficiency. Clearly, new diagnostictools that focus on the end-organ impact of PAD are neededto enhance our understanding, monitor disease progression,and objectively evaluate response to therapy.
We hypothesized that 31phosphorus (31P) magnetic reso-nance spectroscopy (MRS) could identify metabolic evi-dence for ischemia during recovery from exercise in calfmuscle. 31P MRS facilitates the exploration of musclemetabolism at a subcellular level. The purpose of this studywas to develop and test a technique for determiningphosphocreatine (PCr) recovery time in patients with es-tablished PAD compared to normal subjects exercising in theMRI environment.
Methods: We studied 12 normal subjects (3 male, age 41 ±12, mean ± S.D.) and 16 patients with PAD and claudication(10 male, age 66 ± 10, ankle-brachial index 0.62 ± 0.14).Normal subjects and PAD patients exercised one leg toexhaustion while supine in a 1.5 Tesla Siemens Sonata MRscanner using a custom-built plantar flexion exerciseergometer. 31P-spectra were acquired using a single-pulse,surface coil-localized, free induction decay (FID) acquisitionlocalized to the mid-calf. FIDs were multiplied by anexponential with a linewidth of 110 Hz and zero-filled from1024 to 2048 points prior to Fourier transformation. Twentyfive signal averages at a repetition time of 550 ms wereacquired over 15 seconds. Two acquisitions over 30 secondswere performed prior to the end of exercise and 18acquisitions at the end of exercise (270 seconds). All spectrawere phase and baseline corrected followed by integration ofspectral peaks using a Lorentzian lineshape to estimaterelative levels of PCr. The rate of recovery of PCr wascalculated by exponential fit of the data beginning at the endof exercise.
Results: Normal subjects exercised on average 4.0 ±2.0 minutes and PAD 2.5 ± 0.6 minutes (p < 0.05). Despite
shorter exercise time in PAD patients, the recovery rate ofPCr was 38 ± 16 seconds in normal subjects and 133 ±111 seconds in PAD (p = 0.0001, Fig. 1).
Conclusion: MRS of PCr recovery is a sensitive marker ofsymptomatic PAD, clearly distinguishing patients fromnormals, and may be a method to quantify response totherapy. Future studies will quantify effect of medical andinterventional therapies on PCr recovery.
201. Multi-contrast Delayed Enhancement Imagingfor Improved Detection of Subendocardial Infarcts
Peter Kellman, PhD,1 Yiu-Cho Chung, PhD,2 Orlando P.Simonetti, PhD,2 Elliot R. McVeigh, PhD,1 Andrew E. Arai,MD.1 1NIH/NHLBI, Bethesda, MD, USA, 2Siemens MedicalSolutions, Chicago, IL, USA.
Introduction: Delayed enhancement imaged using an inver-sion-recovery sequence exhibits excellent contrast betweeninfarcted and normal myocardium; however, the contrastbetween the MI and the blood pool is frequently suboptimal.Since a large fraction of infarctions caused by coronaryartery disease are subendocardial, it is often difficult toassess the precise size of the infarct or to detect smallinfarcts. The T2 of blood is significantly longer than eitheracute or chronic MI. The proposed Multi-COntrast DelayedEnhancement (MCODE) imaging method produces a seriesof images with both T1 and T2 weightings which providesboth excellent contrast between normal and infarcted myo-cardium, and between blood and MI. This enhances de-tection of the infarcted region and improves infarctmeasurement accuracy.
Purpose: To demonstrate that multi-contrast delayedenhancement imaging of myocardial infarction improvescontrast between MI and blood pool.
Methods: The MCODE imaging method produces sepa-rate images with T1 and T2-weighting. Both images areacquired during the same breath-hold at the same cardiac
Figure 1.
Oral Abstracts84

phase and are therefore registered, which is critical todiscriminate subendocardial MI. Both single-shot trueFISPand turboFLASH sequences are being evaluated. For thesingle-shot trueFISP sequence, T2 weighting is achievedusing a large flip angle readout after magnetization re-covery, whereas the segmented turboFLASH sequence usesa T2 preparation.
The sequences were implemented on a Siemens Sonata 1.5 Tscanner. Results are shown for the single-shot phase-sensitiveinversion-recovery (PSIR) trueFISP sequence. The multi-contrast sequence required a single 3 heartbeat acquisition toacquire T1-weighted (IR image), PSIR reference, and T2-weighted images at the same cardiac phase in mid-diastole. AB1-weighted phased-array combined phase-sensitive recon-struction method was used (Kellman et al., 2002.
N = 6 patients with chronic MI were imaged approximate-ly 20 minutes after administering a double dose of Gd-DTPA.CNR between MI and blood were measured.
Results: A scatter plot of signal intensities for MI, blood,and normal myocardium regions (Fig. 1) shows how T2may be used to separate blood and MI despite similarity inT1 weighted intensities. The measured MI-to-blood CNR(m ± sd) was better in the T2-weighted image than T1-weighted image (15.7 ± 8.5 vs. 4.4 ± 3.9, N = 6, P = 0.009).Short axis images for a patient with chronic MI are shown inFig. 2. The MI and normal myocardium are easily discernedin (a) while the MI and blood are easily discerned in (b).Fig. 2(c) displays a ratio image which enhances the MI-to-blood contrast. Alternatively, the endo and epi contours maybe traced on (b) and copied to (a) (not shown) as an effectivemeans of visualization and detection. Long axis images froma second patient are shown in Fig. 3 illustrating enhanceddetection of a small sub-endocardial MI. The MI indicated byarrow might easily be missed in the T1-weighted image (a)but is easily distinguished from the blood pool by comparisonwith T2-weighted image (b).
Conclusions: Multi-COntrast Delayed Enhancement(MCODE) imaging provides a significant improvement inthe ability to detect subendocardial MI by providing a T2weighted image with high contrast between blood and MI.MCODE improves both the detection and sizing of MI andhas the potential to image edema allowing differentiation ofacute vs. chronic MI.
REFERENCE
Kellman, P., et al. (2002).MRM 47:. 372–383.
Figure 1. T1 and T2-weighted signal intensities in MI, blood, andnormal myocardium regions illustrating the discrimination of theMCODE method.
Figure 2. (a) T1-weighted, (b) T2-weighted, and (c) ratio image illustrating improved MI-to-blood contrast.
Figure 3. (a) T1-weighted, (b) T2-weighted, and (c) ratio image illustrating improved MI-to-blood contrast.
85Oral Abstracts

202. Characterizing Radial Undersampling Artifactsfor Cardiac Applications
Dana C. Peters,1 Pratik Rohatgi,2 Rene M. Botnar,1 Susan B.Yeon,1 Kraig V. Kissinger,1 Warren J. Manning.1 1Cardiology,Beth Israel Deaconess Medical Center, Boston, MA, USA,2Biomedical Engineering Department, University of Michi-gan-Ann Arbor, Ann Arbor, MI, USA.
Introduction: Undersampled radial MR imaging has beenshown to provide images displaying good visual quality withundersampling factors of 2 to 8. However, exact character-ization of the impact of the artifacts on image quality hasnot been well assessed, since the artifact pattern dependson anatomy.
Purpose: To characterize artifacts patterns, and the artifactsignal as a percent of the image signal, for short-axis, long-axis, and right coronary artery (RCA) images.
Methods: 5 healthy subjects were scanned (all female,average age 26 ± 5) on a 1.5 T Gyroscan ACS-NT (PhilipsMedical Systems, Best, NL). High SNR (> 100) short-axisand long-axis images were obtained, using standard radialprotocols (Shankaranarayanan et al., 2001), but acquiring32 signal averages with navigator-gating (balanced SSFP,256 � 256 Np, 32 cm FOV, TR/TE/q = 4.2/2.1/60�, 10 mmslice, 48 views per heart-beat). The protocol for RCA imaging(Leiner, 2004) (36 cm FOV, 368 � 368 Np, TR/TE/q = 5.5/2.2/110�, T2prep, fat saturation, diastolic window, 48 viewsper heart-beat) was modified to employ 2D imaging with a 10mm thick slice, and 32 averages. All magnitude images(Fig. 1A) were subjected to reprojection and then back-projection (using Matlab) at various numbers of projectionsbetween 60 and 320 Np. The artifact was isolated by sub-tracting an image backprojected at fully sampled Np valuefrom undersampled images (Fig. 1B). The artifact signal, inpercent, was defined as the square-root of all artifact signalsquared, divided by the square-root of all signal squared. Totalartifact signal was measured using full and reduced spatialresolution. The artifact power at each undersampling level wasaveraged among volunteers. Phantom experiments (notshown) demonstrated that this projection/backprojection
method is accurate and agreement with true artifact is within1%. For an individual volunteer, maps of the artifact power ina block regional fashion (32 � 32 pixel blocks) were createdto exhibit the artifacts (Fig. 1C).
In five volunteers, RCA scans were acquired by reducingthe number of projections, using Np = 288, 144, 112, 90, butmaintaining scan time (and therefore SNR), by increasingpartition-encodings. Image quality was scored subjectively bya reader blinded to the undersampling level. The 3D volumeswere prepared to mask signal outside of the heart, and con-tain the same number of slices. The grading was performedby an experienced reader (1.0 = uninterpretable 2.0 = good3.0 = very good 4.0 = excellent) and total length wasmeasured (Etienne et al., 2002).
Results: Figure 1 shows a short-axis image, the artifactimage (60 Np) and the artifact signal map. Figure 2 shows theartifact powers in percent vs. Np, for the RCA and short-axisimages, for full and half resolution. Artifacts from long-axisimages were similar to the short-axis. Table 1 presents themeasurements of visible lengths, and the subjective scorings,for the progressively undersampled RCA images.
Figure 2. The total artifact signal, in % of the total image signal,from 360 to 60 Np, for short-axis and RCA images, for full andhalved resolution images.
Figure 1. A) Short-axis image. B) Undersampling pattern (Np = 60). C) Color map of artifact signal, with object edges outlined, with ascale from 2 to 8%.
Oral Abstracts86

Conclusions: The artifact pattern in cardiac applicationscan be characterized. The small standard deviations in Fig. 2indicate consistent artifact levels among subjects, that arelower for reduced spatial resolution. Figs. 1B–C show thatartifact appears predominantly outside of the heart. The studyof the RCA shows that the visible length decreases only forNp = 96, but subjective assessment of quality declines forNp < 144. Further investigation is required to interpret theartifact metric, to determine the maximum acceptable levelof undersampling.
REFERENCES
Etienne, A., et al. (2002). Magn. Reson. Med. 48(4):658–666.
Leiner, T. (2004). ISMRM 705.
Shankaranarayanan, A., et al. (2001). Radiology 221(3):827–836.
203. Assessment of Labeled Mesenchymal Stem CellBiodistribution and Homing in a Canine Model ofMyocardial Infarction by MRI and SPECT/CT
Wesley D. Gilson, PhD,1 Mitsuaki Tatsumi, MD,1 ThomasG. K. Foo, PhD,1 Hunter Chen, MS,1 Danielle Fritzges,1
Mark F. Pittenger, PhD,2 Randell G. Young, DVM,2
Michelle Marcelino, BS,2 Ben M. Tsui, PhD,1 Richard L.Wahl, MD,1 Jeff W. M. Bulte, PhD,3 Dara L. Kraitchman,DVM, PhD.1 1Department of Radiology, Johns HopkinsUniversity, Baltimore, MD, USA, 2Osiris Therapeutics, Inc,Baltimore, MD, USA, 3Department of Radiology and
Institute for Cell Engineering, Johns Hopkins University,Baltimore, MD, USA.
Introduction: Bone marrow-derived mesenchymal stem cells(MSC) may be therapeutically beneficial in the context ofmyocardial infarction (MI) as these cells have been shown tohome to sites of injury. Noninvasively tracking the movementof the cells following an intravenous (iv) injection isimportant in understanding the dynamics of MSC homingand biodistribution. Previous methods have been developed tolabel MSCs with iron oxide particles (Kraitchman et al., 2003;Hill et al., 2003) and radiotracers such as 111-Indium oxine(Chin et al., 2003; Gao et al., 2001) for noninvasive imagingby MRI and SPECT, respectively.
Purpose: This study aims to assess the temporal biodis-tribution and homing of labeled MSCs following iv injectionin a canine model of acute myocardial infarction (MI) usingMRI and SPECT/CT.
Methods: Mongrel dogs (n = 6 MI, n = 1 no MI) under-went a 90-minute closed-chest balloon coronary occlusionfollowed by reperfusion. Allogeneic MSCs, co-labeled with111-Indium oxine and ferumoxides-poly-L-lysine, wereinjected iv at 72 hours post-MI. Serial whole body SPECT/CT (Millenium VH/Hawkeye, GE) and cardiac MRI (1.5 TSigna, GE) scans were performed immediately (d0), 24 hrs(d1), and 4–7 days post-injection (d4–d7). Cardiac MRI scansincluded short- and long-axis multislice fast gradient echo(FGRE) images, and short-axis T1 and T2 maps. T1 mapswere acquired using an inversion recovery fast spin-echosequence with inversion times from 50 to 500 ms inincrements of 50 ms and TR/TE = 7.3/3.2 ms. T2 mappingused a multislice FGRE sequence with TR = 21.5 ms andTE ranging from 2.3 to 18.3 ms. Delayed contrast-enhanced(DCE) MRI was also performed for infarct detection.SPECT emission data were processed using iterative tech-niques and fused with CT images for visualization andanalysis. Infarct size was determined from DCE images.FGRE images were examined for the presence of signalvoids from SPIO-labeled cells. T1 and T2 maps were eval-uated for focal changes in tissue characteristics. Following
Table 1. Results of grading RCA images in 5 volunteers withdifferent Np values
Np = 288 Np = 144 Np = 112 Np = 96
R = 368/Np 1.3 2.5 3.3 3.8Visual score 3.8 ± 0.4 2.9 ± 0.5 2.0 ± 0 1.8 ± 1RCA length(cm)
10.5 ± 3 10.1 ± 3 10.4 ± 3 9.7 ± 3
Figure 1.
87Oral Abstracts

humane euthanasia, tissue was collected for gamma countingand histology. Histology included co-staining with PrussianBlue (PB) and acid phosphatase (AP) for iron and macro-phages, respectively.
Results: Infarct size by DCE MRI was 19 ± 8%. MSCuptake based on d0 SPECT images was greatest in the lungsand redistributed to the liver and spleen by d1 (Figure 1).Significant focal uptake corresponding to the MI occurred inthree dogs at d1 with diffuse uptake seen in all MI dogs atd4–d7. Tissue gamma counts in infarcted myocardium weresignificantly higher than in noninfarcted tissue (P < 0.01),while no regional variation in uptake or tissue counts waspresent in the noninfarcted dog. However, neither T1 maps,T2 maps, or FGRE images were able to detect MSC popu-lations in the heart at any time points. Histology revealedMSCs (positive for PB and negative for AP) in the lungs,liver, spleen, and infarcted tissue. No MSCs were identifiedin the kidneys or noninfarcted myocardium.
Conclusions: MSCs were initially trapped in the pulmo-nary bed but redistributed primarily to the liver and spleenwithin 24 hrs post-injection. MSC localization to injuredmyocardium following iv injection in a canine model of MIwas detectable by noninvasive SPECT/CT but not MRI.Intravascular administration of MSCs may be useful forcardiac cellular therapy.
REFERENCES
Chin, B. B., Nakamoto, Y., Bulte, J. W. M., et al. (2003). Nucl. Med. Commun.
24:1149–1154.
Gao, J., Dennis, J. E., Muzic, R. F., et al. (2001). Cells Tissues Organs 169:12–
20.
Hill, J. M., Dick, A. J., Raman, V. K., et al. (2003). Circulation 108:1009–1014.
Kraitchman, D. L., Heldman, A. W., Atalar, E., et al. (2003). Circulation
107:2290–2293.
204. Myocardial Strain-Rate Improvements AfterTransmyocardial Fluoroscopic Delivery ofFeridex-Labeled Mesenchymal Stem Cells in AcuteCanine Myocardial Infarction
Asif Mahmood,1 Jeff W. M. Bulte,2 Izlem Izbudak,1 ParagKarmarkar,1 Ray C. Boston,3 Allen Jeong Keel,1 DanielleFritzges,1 Ana Victoria Soto,1 Michelle Marcelino,4 RandellG. Young,4 Mark F. Pittenger,4 Dara L. Kraitchman.11Department of Radiology, Johns Hopkins University,Baltimore, MD, USA, 2Department of Radiology and Institutefor Cell Engineering, Johns Hopkins University, Baltimore,MD, USA, 3School of Veterinary Medicine, University ofPennsylvania, Kennett Square, Pennsylvania, PA, USA,4Osiris Therapeutics, Inc, Baltimore, MD, USA.
Introduction: Remodeling of the left ventricle after acutemyocardial infarction (AMI) leading to heart failure is a major
cause of morbidity and mortality. Preventing remodeling andrestoring contractile function has been the focus of newcellular therapy including the use of bone marrow-derivedmesenchymal stem cells (MSCs).
Purpose: The purpose of this study was to determine theefficacy of targeted MR-labeled MSCs (MR-MSCs) in acanine AMI model as defined by improvements in cardiaccontractile function measured serially by MRI.
Methods: Mongrel dogs (25–30 kgs, n = 11) were sub-jected to a 90-minute closed-chest coronary artery occlusionfollowed by reperfusion to create an AMI. MSCs wereisolated from bone marrow and magnetically labeled with 25mg Fe/ml Feridex and 375 ng/ml poly-L-lysine for 24 h priorto injection under MR fluoroscopy (1.5 T GE Signa scanner).In five dogs, MR-MSCs (3–15 � 107 cells) delivery wasperformed 72 h post-MI. Infarcted myocardium was identifiedusing delayed contrast-enhanced (DCE) MRI. Using a customMR-compatible, steerable guide injection catheter, MR-MSCsinjections were targeted adjacent to the MI. A real-timeimaging sequence with interactive scan plan acquisition wasused to guide left ventricular (LV) catheterization as well asMSC injection.
In all dogs, DCE and tagged MRI were serially obtained at1, 2, 4, and 8-weeks post-injection to evaluate MI size andregional function, respectively. MI size and location wasdetermined using full-width half-maximum (FWHM) thresh-olding criteria on DCE-MRI. Subendocardial circumferentialstrain (ECC) was determined in 30 regions of the taggedMR images (i.e., 6 circumferential regions in 5 base to apexslices) in each animal using HARP analysis custom soft-ware (Diagnosoft, Inc., Baltimore). The regions were furthergrouped into three categories according to infarction statusbased on DCE-MRI [i.e., normal (nl), adjacent (adj) to infarct,or infarcted (inf)].
Systolic strain rate (SSR) was determined by a linear re-gression of subendocardial ECC versus time during systole.SSR, where more negative strain represents improved con-traction, was compared between animals, infarction cate-gories, and imaging sessions. Percent improvement is theratio of SSR change relative to baseline. The changes in thestrain rate over 8 weeks as a response to therapy weredetermined using a feasible generalized least squares of thecross-sectional time series and compared to control MI dogsthat did not receive MR-MSCs. Values are expressed asmean ± SEM; P < 0.01 was considered statistically signifi-cant (Figs. 1 and 2).
Results: SSR in all three categories of MR-MSC-treatedanimals improved from 72 hours post-MI to 8 weeks (Nl:� 1.3 ± 0.06 vs. � 2.0 ± .05*, Adj: � .92 ± 0.07 vs.� 1.86 ± 0.05*, Inf: � 1.04 ± 0.05 vs. � 1.5 ± 0.05*,*p < 0.001). By contrast, SSR did not improve in controlanimals (Nl: � 1.14 ± 0.03 vs. � 1.13 ± 0.03, Adj:� 1.2 ± 0.03 vs. � 1.3 ± 0.04, Inf: � 0.9 ± 0.03 vs.� 1.04 ± 0.03, p = NS). Regression analysis revealed im-provement (p < 0.001) in all categories over the 8-week
Oral Abstracts88

period in treated animals compared to controls. MI size(as percent of LV mass) decreased significantly in control(19.3 ± 9% vs. 8.1 ± 2%) and MR-MSC-treated (20.0 ± 5%vs. 8.9 ± 2%) animals but was not different between groups.
Conclusions: Cellular therapy with MSCs early after AMIdemonstrated regional improvements in function, regardlessof MI size, in normal, peri-infarcted, and infarcted myocar-dium over 2 months when compared to non-treated animals.These preclinical studies lend promise to the use of directintramyocardial injections of MSCs as a therapeutic option infuture patient trials.
205. Angiotensin II Type 2 Receptor OverexpressionAdds to Knockout of the Type 1a Receptor inthe Attenuation of Post-Infarction Remodeling,Independent of Blood Pressure
Szilard Voros,1 Zequan Yang, MD,2 Joseph DiMaria,BA,3 Stuart S. Berr, PhD,3 Frederick H. Epstein, PhD,3
Brent A. French, PhD,2 Robert M. Carey, MD,4 ChristopherM. Kramer, MD.1 1Cardiology, University of Virginia,Charlottesville, VA, USA, 2Biomedical Engineering, Uni-versity of Virginia, Charlottesville, VA, USA, 3Radiology,
Figure 2. Infarction zone based on DCE MR images (A) shows a larger region of contractile dysfunction in pseudocolor map of ECC(B) at72 hours. No contraction is shown as green, with myocardial stretching in red, and normal myocardial contraction as blue. Eight weeks post-MI, the infarction size is reduced (C) with improved myocardial function (D). With MR-MSCs (hypointense lesion, E) in an area showingimprovements in contractility.
Figure 1. Percent improvement ratio at 8 weeks post-infarction between categories, based on infarction status, in MR-MSC treated andcontrol dogs, (*p < 0.01).
89Oral Abstracts

University of Virginia, Charlottesville, VA, USA, 4Universityof Virginia, Charlottesville, VA, USA.
Introduction: CMR is an important tool in the evaluation ofpharmacologic and genetic factors that alter post-MI LVremodeling. Cardiac overexpression of the angiotensin II type2 receptor (AT2-R) or knockout of the AT1a-R limits post-infarction remodeling, but their additive value is unknown.
Purpose: The contribution of blood pressure (BP)lowering of AT1a-R knockout in the setting of AT2-Roverexpression is unknown. We sought to determine therole of BP lowering of AT1a-R knockout in the setting ofAT2-R overexpression.
Methods: Two groups of mice on C57Bl/6 backgroundunderwent MI by 1 hour occlusion and reperfusion ofthe LAD; 1) Systemic AT1a-R knockout mice (AT1KO,n = 6) and 2) cardiac overexpression of AT2-R and systemicAT1a-R knockout (AT2OX-AT1KO, n = 10). Weekly systol-ic blood pressure (BP) and heart rate were measured. ECG-gated cardiac MRI was performed at baseline and on days1,7, and 28 post-MI, using a 4.7 T imaging system (Varian200/400 Inova MRI). Mice were anesthetized with 1%isoflurane and body temperature was maintained at 37�C.An ECG-triggered multi-phase FLASH cine sequence (12–14 phases/cardiac cycle) was performed in the short-axisorientation, covering the heart from base to apex (6–8 contiguous slices) (TR 8 ms [ � 90%of R–R interval], TE3.1–3.9 ms, flip angle 20� [without contrast; baseline, day 7and 28] and 60� [with contrast; day 1], slice thickness 1mm, field of view [FOV] 2.56 cm, matrix 128 � 128).Endo- and epicardial borders were planimetered to deter-mine end-diastolic volume and end-systolic volume indexedto body weight (ESVI, EDVI) and ejection fraction (EF).
Twenty minutes after injecting 0.3 mM/kg gadolinium-DTPA, infarct size (IS) was measured on day 1 cine imagesas the mass of hyperenhanced myocardium, expressed as%LV mass. EDVI , ESVI, and EF were compared by 2-wayANOVA; average BP and infarct size were compared byunpaired t-test between groups.
Results: Infarct size was similar between groups (34 ± 5%in AT1KO and 38 ± 6% in AT2OX-AT1KO, p = NS). BPaveraged over 4 weeks in AT1KO was significantly lowerthan in AT2OX-AT1KO (88 ± 15 mmHg vs. 99 ± 17 mmHg,p = 0.012). EDVI and ESVI at Day 0 were similar betweengroups (Table 1). By Day 28, ESVI was significantly lower inAT2OX-AT1KO than in AT1KO despite lower BP in AT1KO(Table 1). EF fell in parallel in the 2 groups (62 ± 3% to46 ± 4% in AT1KO and 70 ± 3% to 54 ± 3% in AT2OX-AT1KO; p = NS).
Conclusions: AT2-R overexpression further attenuatespost-MI LV remodeling in AT1a-R knockout mice and thisis independent of BP lowering. Direct tissue effects of theAT2-R pathway might partially mediate the benefits ofpharmacologic AT1-R blockade post-MI.
Table 1. EDVI and ESVI on Days 0 and 28
Group Day 0 Day 28
EDVI (ml/g) AT1KO 1.80 ± 0.12 2.51 ± 0.15AT2OX-AT1KO 1.81 ± 0.11 2.14 ± 0.12
ESVI (ml/g) AT1KO 0.69 ± 0.10 1.36 ± 0.12*
AT2OX-AT1KO 0.55 ± 0.10 1.02 ± 0.10*,y
*p < 0.002 vs. Day 0.yp = 0.04 vs. AT1KO.
Oral Abstracts90


![SERVER-SERVICE-.-&-'-4 VS L S [mm] m [kg] 10 731 26 15 731 31 21 1097 60 30 1097 68 40 1097 79 55 1097 101 75 1097 116 100 1097 141 120 1097 159 150 1097 178 180 1097 205 230 1097](https://img.dokumen.tips/doc/110x75/60e3e5ccb6de2b4b6238da20/server-service-4-vs-l-s-mm-m-kg-10-731-26-15-731-31-21-1097-60-30.jpg)
![BULK POWDER SAMPLING PROCEDURES [1097] BULK POWDER...682 〈1097〉 Bulk Powder Sampling Procedures / General Information USP 35 SAMPLING THEORY AND TERMINOLOGY where](https://img.dokumen.tips/doc/110x75/5e7c89b507f9cc684a5af89c/bulk-powder-sampling-procedures-1097-bulk-powder-682-1097-bulk-powder.jpg)