Embed Size (px)
Citation preview

2005 Annual Report
Office of the
Chief Medical Examiner
State of Maryland
DAVID R. FOWLER, M.D. CHIEF MEDICAL EXAMINER JACK M. TITUS, M.D. DEPUTY CHIEF MEDICAL EXAMINER MARY G. RIPPLE, M.D. DEPUTY CHIEF MEDICAL EXAMINER BARRY LEVINE, PH D. TOXICOLOGIST
STATE OF MARYLAND OFFICE OF THE CHIEF MEDICAL EXAMINER
FORENSIC MEDICINE CENTER
111 PENN STREET
BALTIMORE, MARYLAND 21201-1020 PHONE (410) 333-3250
FAX (410) 333-3063
POST MORTEM EXAMINERS COMMISSION SANFORD A. STASS, M.D. - Chairman BROOKS JACKSON, M.D. – Vice Chairman
JOSHUA SHARFSTEIN, M.D. S. ANTHONY McCANN SUPERINTENDENT THOMAS E. HUTCHINS
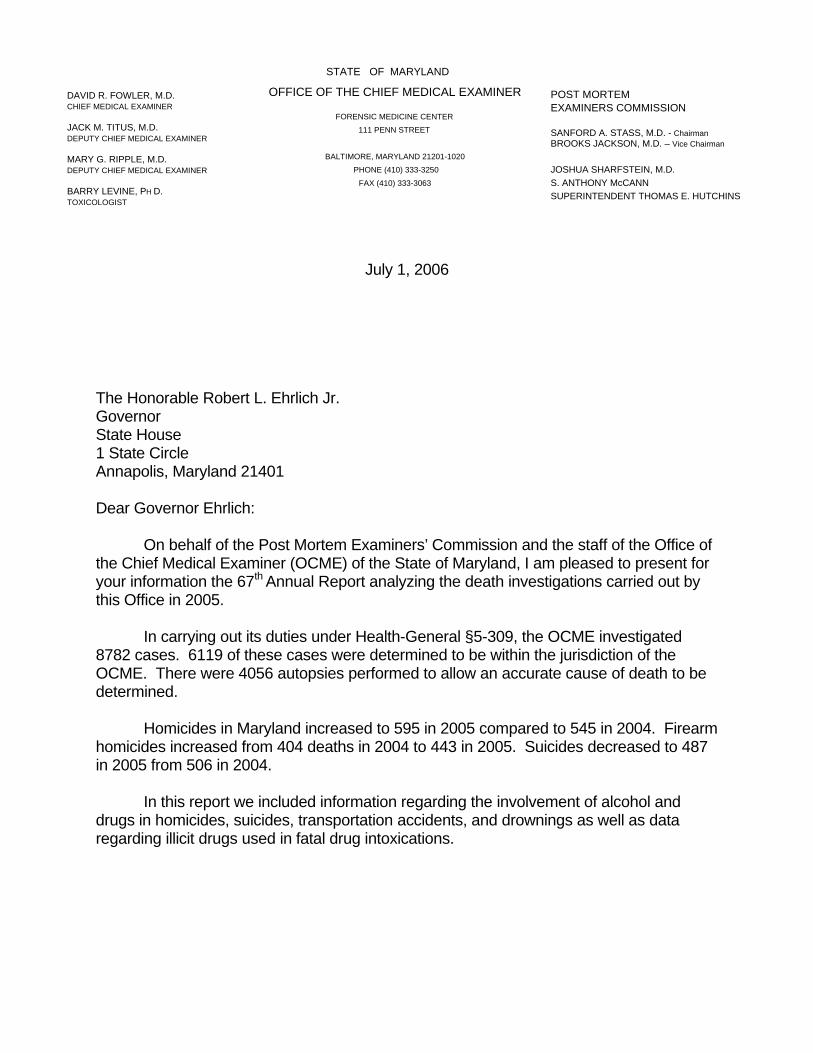
July 1, 2006 The Honorable Robert L. Ehrlich Jr. Governor State House 1 State Circle Annapolis, Maryland 21401 Dear Governor Ehrlich: On behalf of the Post Mortem Examiners’ Commission and the staff of the Office of the Chief Medical Examiner (OCME) of the State of Maryland, I am pleased to present for your information the 67th Annual Report analyzing the death investigations carried out by this Office in 2005. In carrying out its duties under Health-General §5-309, the OCME investigated 8782 cases. 6119 of these cases were determined to be within the jurisdiction of the OCME. There were 4056 autopsies performed to allow an accurate cause of death to be determined. Homicides in Maryland increased to 595 in 2005 compared to 545 in 2004. Firearm homicides increased from 404 deaths in 2004 to 443 in 2005. Suicides decreased to 487 in 2005 from 506 in 2004. In this report we included information regarding the involvement of alcohol and drugs in homicides, suicides, transportation accidents, and drownings as well as data regarding illicit drugs used in fatal drug intoxications.

The Honorable Robert L. Ehrlich Jr. July 1, 2006 Page 2 The information developed in this report is being shared with various programs at the local, state and federal levels. This office provides assistance not only on a short or occasional basis, but also participates in ongoing projects as well. A few of the many requests for data and statistics were received from: Health Care for the Homeless, Inc., Carroll County Drug Task Force, The Maryland State Medical Society Maternal and Child Health Committee, Uniformed Services University of the Health Sciences Environmental and Occupational Health Division, Johns Hopkins University School of Hygiene and Public Health – Department of Epidemiology and School of Nursing, Center for Substance Abuse Research (CESAR), Child Fatality Review Board, Maryland Department of Transportation, Maryland Department of Labor, Licensing and Regulation, Alcohol and Drug Abuse, Capital Gazette, Homeland News, The Baltimore Sun for Anne Arundel County, Office of Public Health Anne Arundel County, Harford County Department of Community Services, Harford County Sheriff’s Office, Maryland State Police, Health Quest, Harborview Medical Center, Worcester County Health Department, The Carroll County Public School System, Maryland Department of Health and Mental Hygiene, National Drug Intelligence Center, Washington Post Newspaper, Baltimore Sun Newspaper, Federal Bureau of Investigation (FBI), Baltimore City Health Department, Baltimore Examiner Newspaper, Department of Justice, Consumer Product Safety Commission, and the University of Maryland National Study Center. Respectfully submitted,
David R. Fowler, M.D. Chief Medical Examiner DRF/skw

Table of Contents Cases Reported to OCME: Action Taken. ............................................................................................................... 1 Autopsied .................................................................................................................. 2 Manner of Death .......................................................................................................... 3 Manner of Death: Classified by Sex.......................................................................................................... 4 Classified by Race........................................................................................................ 4 Medical Examiner Cases: Cause and Manner of Death........................................................................................ 5 A Three-Year Comparison ........................................................................................... 7 Manner and Jurisdiction. .............................................................................................. 8 Type and Jurisdiction ................................................................................................... 8 Toxicologic Testing: Percentage of Cases Positive for Alcohol and/or Drugs.............................................. 9 Drug Abuse Deaths: By Jurisdiction (3-Year Comparison) ......................................................................... 10 Undetermined Manner Only....................................................................................... 11 Homicide Deaths: Cause of Death .......................................................................................................... 12 A Five-Year Comparison............................................................................................ 13 Deaths by Age............................................................................................................ 14 Gunshot Wound Deaths: A Five-Year Comparison............................................................................................ 15 Sudden Infant Death Syndrome: A Five-Year Comparison............................................................................................ 16 Classified by Age........................................................................................................ 17 Classified by Race and Sex. ...................................................................................... 17 Suicide Deaths: Cause of Death ......................................................................................................... 18 Youth Suicides ........................................................................................................... 19 Deaths by Age ........................................................................................................... 20 Transportation Deaths: Classified by Activity .................................................................................................. 21 Type of Vehicle........................................................................................................... 22 Classified by Age........................................................................................................ 23 Alcohol/Drug Results.................................................................................................. 24 Alcohol Levels in Cases Testing Positive .................................................................. 25

Cases Reported to OCME - 2005Action Taken
1105
4056
646
2663
22587
0
500
1000
1500
2000
2500
3000
3500
4000
4500
Autopsy Field Inspection Approval Decline Inspection atOCME
Inquiry
8782 Total Cases
-1-

2005 Medical Examiner Cases Autopsied*
*One case was classified as "not applicable"
Homicide** 59215%
Undetermined71518%
Accident92223%
Natural147436%
Suicide3529%
Total Cases Autopsied - 4056-2-
** Three homicides were not autopsied due to final disposition prior to Medical Examiner notification.
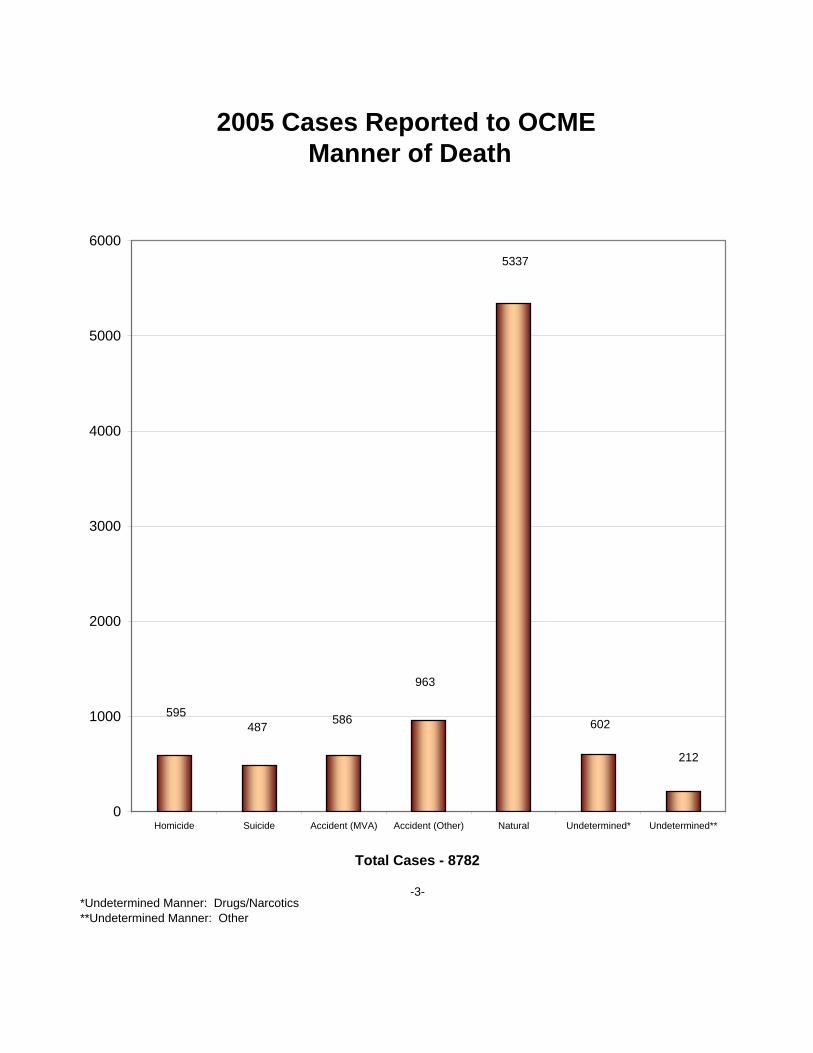
2005 Cases Reported to OCME Manner of Death
5337
212
602
963
586487595
0
1000
2000
3000
4000
5000
6000
Homicide Suicide Accident (MVA) Accident (Other) Natural Undetermined* Undetermined**
Total Cases - 8782
-3-*Undetermined Manner: Drugs/Narcotics**Undetermined Manner: Other

Manner of Death - 2005
0
500
1000
1500
2000
2500
3000
3500
Classified by Sex
Male 3085 1024 515 388 412 126
Female 2250 525 79 99 190 44
Unknown 2 0 1 0 0 42
Natural Accident Homicide Suicide Drug Abuse Undetermined
Other Undetermined
0
500
1000
1500
2000
2500
3000
-4-
Classified by Race
White 2710 1037 89 386 370 82
Black 2497 405 456 75 220 72
Asian 39 18 9 11 3 2
Other 91 89 41 15 8 13
Unknown 0 0 0 0 1 43
Natural Accident Homicide Suicide Drug Abuse Undetermined
Other Undetermined

Medical Examiner Cases – 2005 Cause and Manner of Death
Cause of Death
Manner of Death
Total
Natural Homicide Suicide Accident Undeter-mined
Infectious disease AIDS Other
40 64
- -
- -
- -
- -
40 64
Malignant neoplasms (Cancer) 325 - - - - 325Endocrine and metabolic disease Diabetes Other
63 3
- -
- -
- -
- -
63 3
Mental Disorders Alcohol abuse Other
62 3
- -
- -
- -
- -
62 3
Nervous system disease Meningitis Seizure disorder Other
9 27 47
- - -
- - -
- - -
- 4 -
9 31 47
Circulatory system disease Hypertensive cardiovascular disease Arteriosclerotic cardiovascular disease Cardiac arrhythmia Cardiomyopathy Pulmonary embolism Cerebrovascular disease Aneurysm Hemorrhage Other
416 3378
100 46 77 16 35
101 57
- - - - - - - - -
- - - - - - - -
- - - -
16 - - -
- - - - - - - -
416 3378
100 46 93 16 35
101 57
Respiratory system diseases Respiratory distress syndrome Pneumonia Chronic obstructive pulmonary disease Asthma Other
10 108
5 26 86
- - - - -
- - - - -
- - - - -
- - - - -
10 108
5 26 86
Digestive system disease Fatty liver Cirrhosis Gastrointestinal hemorrhage Other
4 56 31 30
- - - -
- - - -
- - - -
- - - -
4 56 31 30
Congenital anomalies 6 - - - - 6Perinatal conditions 13 - - - - 13Ill-defined conditions Sudden Infant Death Syndrome Other
15 11
- -
- -
- -
- 46
15 57
-5-

Cause of Death
Manner of Death
Total Natural Homicide Suicide Accident Undeter-
mined
Traumatic injury Head/Chest injuries Multiple injuries Blunt force Gunshot wound Sharp force/cutting Fracture Other trauma
- - - - - - -
10 5
33 443
74 - -
- 27
- 216
13 - -
323 639
3 1 -
70 1
- 12
- 5 - - -
333 683
36 665
87 70
1Poisoning Alcohol intoxication Drug intoxication/abuse Alcohol and drug intoxication Carbon monoxide Cocaine intoxication Cocaine and alcohol intoxication Cocaine and narcotic intoxication Narcotic intoxication Narcotic and alcohol intoxication Inhalant intoxication
- - - - - - -
7 - -
- - - - - - - - - -
2
45 5
7 - - -
12 2 4
2 2 -
9 1 - - 1 1 -
9
81 12
- 60
5 97
309 40
1
13
128 17 16 61
5 97
329 43
5Asphyxiation Airway obstruction/Aspirated stomach content Hanging Smoke inhalation Strangulation/Asphyxiation Suffocation Drowning Unspecified type of asphyxia
- - - - - - -
- - 1
25 - - -
- 115
- 22
- 5 -
24 4
53 46
- 64
-
- - - 9 - 9 -
24 119
54 102
- 78
-Hypothermia - - - 46 - 46Hyperthermia - - - 43 1 44Thermal injury (Burns) - 1 3 6 1 11Electrocution - - 1 6 - 7Other non-natural cause - 3 8 188 73 272Other natural cause 60 - - - - 60Unknown cause - - - - 5 5Non-human remains - - - - 35 35Accident during surgery - - - - - -TOTAL 5337 595 487 1549 814 8782
-6-

Manner of Death - 3 Year Comparison Medical Examiner Cases: Manner of Death, Maryland 2005
Manner of Death Number %
Natural ....................................................................................................................................... 5337 60.8
Homicide ................................................................................................................................... 595 6.8
Suicide ....................................................................................................................................... 487 5.5
Accident..................................................................................................................................... 1549 17.6
Undetermined ............................................................................................................................ 814 9.3
Total ...........................................................................................................................................
8782
100.0*
Medical Examiner Cases: Manner of Death, Maryland 2004
Manner of Death Number %
Natural ....................................................................................................................................... 5107 60.6
Homicide ................................................................................................................................... 545 6.5
Suicide ....................................................................................................................................... 506 6.0
Accident..................................................................................................................................... 1464 17.4
Undetermined ............................................................................................................................ 807 9.6
Total ...........................................................................................................................................
8429
100.0*
Medical Examiner Cases: Manner of Death, Maryland 2003
Manner of Death Number %
Natural ....................................................................................................................................... 4954 59.1
Homicide ................................................................................................................................... 556 6.6
Suicide ....................................................................................................................................... 491 5.9
Accident..................................................................................................................................... 1494 17.8
Undetermined ............................................................................................................................ 892 10.6
Total ...........................................................................................................................................
8387
100.0*
*Because of rounding, percentages do not necessarily total 100.
-7-

County Natural Accident Homicide Suicide Undetermined TOTALAllegany 107 46 1 13 11 178Anne Arundel 234 79 13 49 62 437Baltimore County 415 164 28 71 111 789Calvert 73 15 2 5 5 100Caroline 11 10 0 2 2 25Carroll 86 38 2 19 11 156Cecil 43 28 8 13 14 106Charles 37 41 4 15 4 101Dorchester 17 15 2 2 4 40Frederick 83 55 3 23 18 182Garrett 25 11 0 4 1 41Harford 175 48 3 21 30 277Howard 72 25 5 16 13 131Kent 17 6 1 3 1 28Montgomery 204 111 18 56 51 440Prince George's 1204 235 171 49 75 1734Queen Anne's 13 8 2 7 3 33St. Mary's 48 17 2 13 17 97Somerset 10 5 1 2 5 23Talbot 30 13 2 4 5 54Washington 96 55 4 19 19 193Wicomico 113 47 5 11 12 188Worcester 41 14 0 5 7 67Baltimore City 2183 463 318 65 333 3362TOTAL 5337 1549 595 487 814 8782
County Autopsy OCMEInspections
FieldInspections Inquiry Approval Decline TOTAL
Allegany 74 5 49 2 26 22 178Anne Arundel 264 5 84 1 28 55 437Baltimore County 427 30 140 10 70 112 789Calvert 43 0 18 1 6 32 100Caroline 11 1 10 0 2 1 25Carroll 87 2 38 3 12 14 156Cecil 73 1 18 1 6 7 106Charles 68 3 23 0 5 2 101Dorchester 27 1 2 0 4 6 40Frederick 98 6 38 2 30 8 182Garrett 20 1 9 0 4 7 41Harford 131 7 76 1 11 51 277Howard 80 3 27 1 6 14 131Kent 12 0 8 0 4 4 28Montgomery 275 4 60 14 48 39 440Prince George's 721 19 171 7 52 764 1734
Type and Jurisdiction
Manner and Jurisdiction
Medical Examiner Cases - 2005

2005 Toxicology Testing# of Cases Positive for Alcohol and/or
Drugs (Percentage of the Manner of Death)
301(19%)
127(26%)
190(32%)
55 (4%)
35(7%)
90(15%)
0
50
100
150
200
250
300
350
Homicides (595) Suicides (487) Accidents (1549)
Manner of Death
-9-
Alcohol Drugs

Drug Abuse Deaths 3 Year Comparison by Jurisdiction
0
50
100
150
200
250
300
350
2003 16 46 130 4 3 16 13 11 3 15 2 38
2004 11 49 100 6 2 16 18 11 3 16 1 19
2005 10 58 102 4 0 14 14 5 4 19 1 24
AlleganyAnne
ArundelBaltimore Co Calvert Caroline Carroll Cecil Charles Dorchester Frederick Garrett Harford
0
50
100
150
200
250
300
350
-10-
2003 22 1 43 52 3 5 3 5 11 8 10 331
2004 14 0 38 54 3 4 2 3 14 13 11 300
2005 13 0 43 57 2 13 3 5 16 12 5 273
Howard Kent MontgomeryPrince
George'sQueen Anne's
St. Mary's Somerset Talbot Washington Wicomico WorcesterBaltimore
City

2005 Drug Abuse Deaths Undetermined Manner
82
12
309
40
60
5
97
0
50
100
150
200
250
300
350
Drug Drugs &Alcohol
Narcotics Narcotics &Alcohol
Cocaine Cocaine &Alcohol
Narcotics &Cocaine
Total Cases - 605
-11-
Narcotics include Heroin, Morphine, Methadone, PhencyclidineDrugs include Prescription Medications

3
0
19
15
6
2
74
33
443
0 50 100 150 200 250 300 350 400 450
Total Deaths - 595
-12-
Other
Child Abuse
Asphyxiation
Head/Multiple Injuries
Strangulation/Suffocation
Smoke Inhalation
Sharp Force
Blunt Force
Firearms
2005 Homicide Deaths Cause of Death
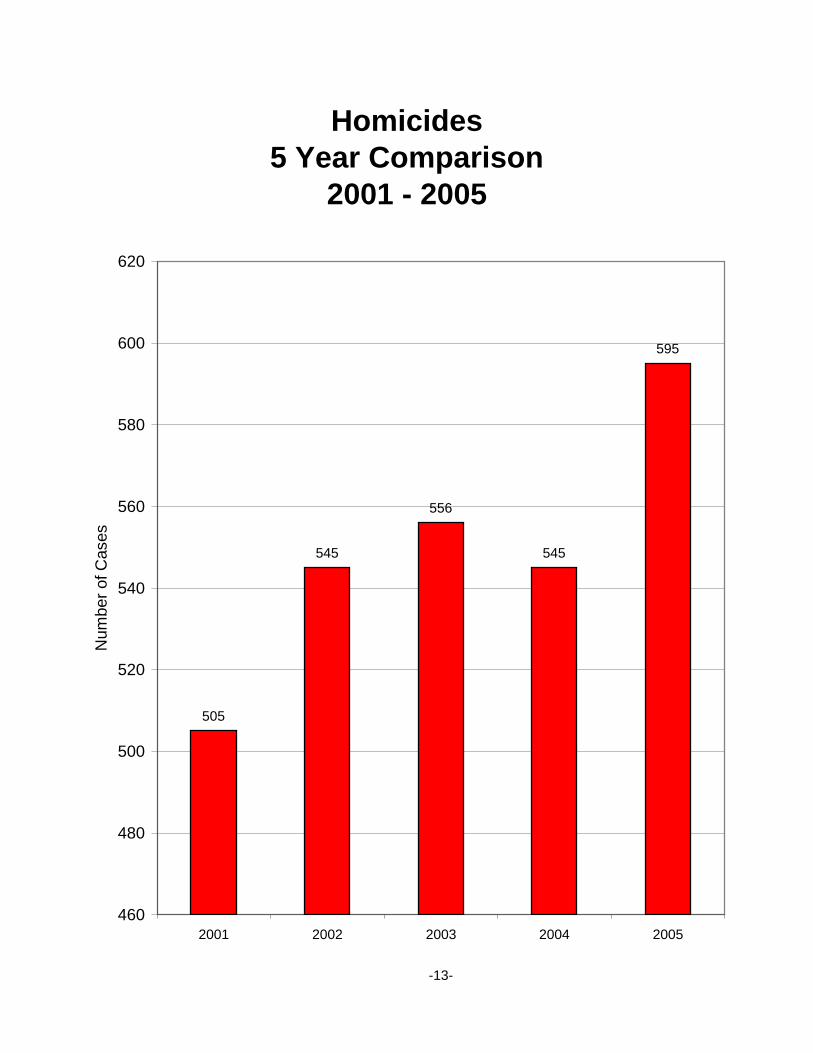
Homicides 5 Year Comparison
2001 - 2005
505
545
556
545
595
460
480
500
520
540
560
580
600
620
2001 2002 2003 2004 2005
-13-
Num
ber o
f Cas
es

10
116
131
93
65
43
46
31
17
17
7
6
4
5
3
1
0 20 40 60 80 100 120 140
Total Deaths - 595
-14-
0-14
15-20
21-25
26-30
31-35
36-40
41-45
46-50
51-55
56-60
61-65
66-70
71-75
76-80
Over 80
Age Unknown
Age
Gro
up
2005 HomicidesDeaths by Age

0
50
100
150
200
250
300
350
400
450
-15-
Firearm Deaths 2001 - 2005
2001 1 368 220 4
2002 0 374 233 2
2003 0 410 233 3
2004 2 404 244 1
2005 1 443 215 5
Accident Homicide Suicide Undetermined
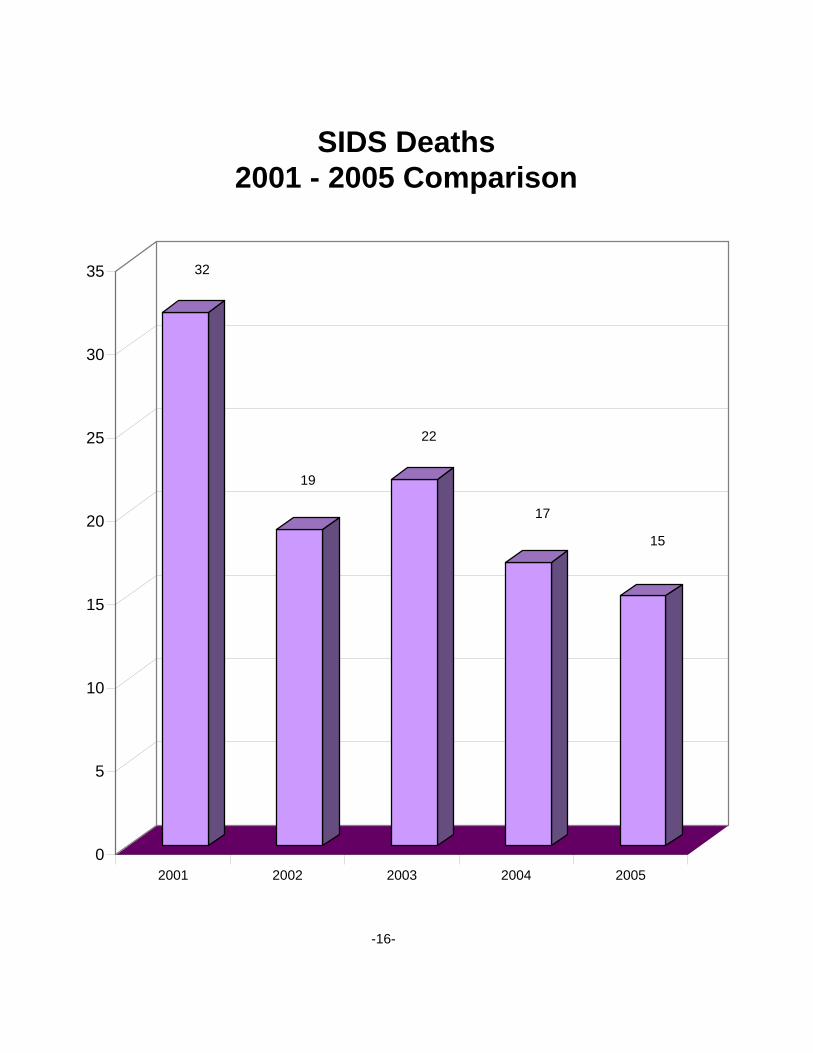
32
19
22
17
15
0
5
10
15
20
25
30
35
2001 2002 2003 2004 2005
-16-
SIDS Deaths2001 - 2005 Comparison

Sudden Infant Death Syndrome2005
3
1
7
2
0
1
0
1
0 0 0 00
1
2
3
4
5
6
7
1 2 3 4 5 6 7 8 9 10 11 12Age in Months
Total of 15 Deaths
Classified by Age
Classified by Sex
Male (7)
47%Female
(8)53%
Classified by Race
Other (2)
13%Black
(7)47%
White (6)
40%
-17-

Sudden Unexplained Death In Infancy 2005
20
13
1
6
23
0 01
0 0 002468
101214161820
1 2 3 4 5 6 7 8 9 10 11 12Age in Months
Total of 46 Deaths
Classified by Age
Classified by Sex
Male (31)67%
Female(15)33%
Classified by Race
Other(5)
11%
Black(28)61%
White (13)28%
-17A-

2005 Suicide Deaths Classified by Cause of Death
12
27
115
216
58
5
13
7
12
22
0 50 100 150 200 250
Others
Multiple injuries
Hanging
Firearms
Drug Intoxication
Drowning
Cutting/Stab Wounds
Carbon Monoxide
Narcotic Intoxication
Asphyxia
Total Cases - 487
-18-

2005 Youth Suicides 25 Years of Age and Under
0
1
0
4
1
66
4 4
9
7 7 7
8
9
0
1
2
3
4
5
6
7
8
9
10
11 12 13 14 15 16 17 18 19 20 21 22 23 24 25
AgeTotal Cases - 73
-19-

35
38
39
43
48
63
52
38
19
19
19
29
19
26
0 10 20 30 40 50 60 70
Total Deaths - 487
-20-
10 thru 20
21-25
26-30
31-35
36-40
41-45
46-50
51-55
56-60
61-65
66-70
71-75
76-80
Over 80
2005 Suicide Deaths by Age

382
110
89
2 3
0
50
100
150
200
250
300
350
400
Drivers Passengers Pedestrians Bicyclists Pilots
*Includes motor vehicles, boats, planes. bicycles, and trains
Total Cases - 586
-21-
2005 Transportation Accidents* Classified by Activity

2005 Transportation Deaths Type of Vehicle
4
9
99
1
325
77
8
4
5
37
3
11
3
0 50 100 150 200 250 300 350
Other
Watercraft
Trucks/Vans
Trains
Passenger Cars
Motorcycles
Motorbikes
Farm Vehicles
4-Wheelers
Sports Utility Vehicles
Buses
Bicycles
Aircraft
Total Cases - 586
-22-

7
9
12
62
82
36
58
50
47
34
38
30
19
25
23
15
24
14
1
0 10 20 30 40 50 60 70 80 90
Total Cases - 586
-23-
0-5
6-10
11-15
16-20
21-25
26-30
31-35
36-40
41-45
46-50
51-55
56-60
61-65
66-70
71-75
76-80
81-85
Over 85
Age Unknown
2005 Transportation DeathsBy Age

2005 Transportation Accidents Alcohol/Drug Results
102(27%)
33(30%)
27(30%)
0(0%)
1(33%)
83(22%)
19(17%)
27(30%)
1(50%) 0
(0%)
190(50%)
41(37%) 35
(39%)
0(0%)
2(67%)
7(2%)
17(15%)
0(0%)
1(50%) 0
(0%)0
20
40
60
80
100
120
140
160
180
200
Drivers (382) Passengers (110) Pedestrians (89) Bicyclists (2) Pilots (3)
586 Transportation Deaths
-24-
Alcohol Positive Drugs Positive
Alcohol & Drugs Negative No Tests Performed

26(16%)
24(15%)
28(17%)
26(16%)
31(19%)
17(10%)
6(4%)
2(1%)
3(2%)
0
5
10
15
20
25
30
35
.01-.05 .06-.09 .10-.15 .16-.19 .20-.25 .26-.29 .30-.35 .36-.39 .40+
586 Transportation Deaths 338 Negative for Alcohol 85 No Testing Performed
-25-
2005 Transportation DeathsBlood Alcohol Concentration in 163 Cases
33%* Tested Positive
*Percent based on total cases tested for alcohol