Embed Size (px)
DESCRIPTION
2003 Analyst/ Investor Conference Savannah, Georgia November 17-19, 2003. Forward-Looking Statements. - PowerPoint PPT Presentation
Citation preview
2003 Analyst/Investor Conference
Savannah, Georgia
November 17-19, 2003
2003 Analyst/Investor Conference 2
Forward-Looking Statements
Statements contained in this presentation that include company expectations or predictions of the future are forward-looking statements intended to be covered by the safe harbor provisions of the Securities Act of 1933 and the Securities Exchange Act of 1934. It is important to note that the actual results of company earnings could differ materially from those projected in any forward-looking statements. For additional information refer to AGL Resources’ Securities and Exchange Commission filings.
Seeking Value…Every Day
Paula G. RosputChairman, President and Chief Executive Officer
2003 Analyst/Investor Conference 4
We Set Four Goals for 2003
• Strengthen ATG financially
• Grow around existing assets
• Execute flawlessly
• Demonstrate compelling proposition for all stakeholders
2003 Analyst/Investor Conference 5
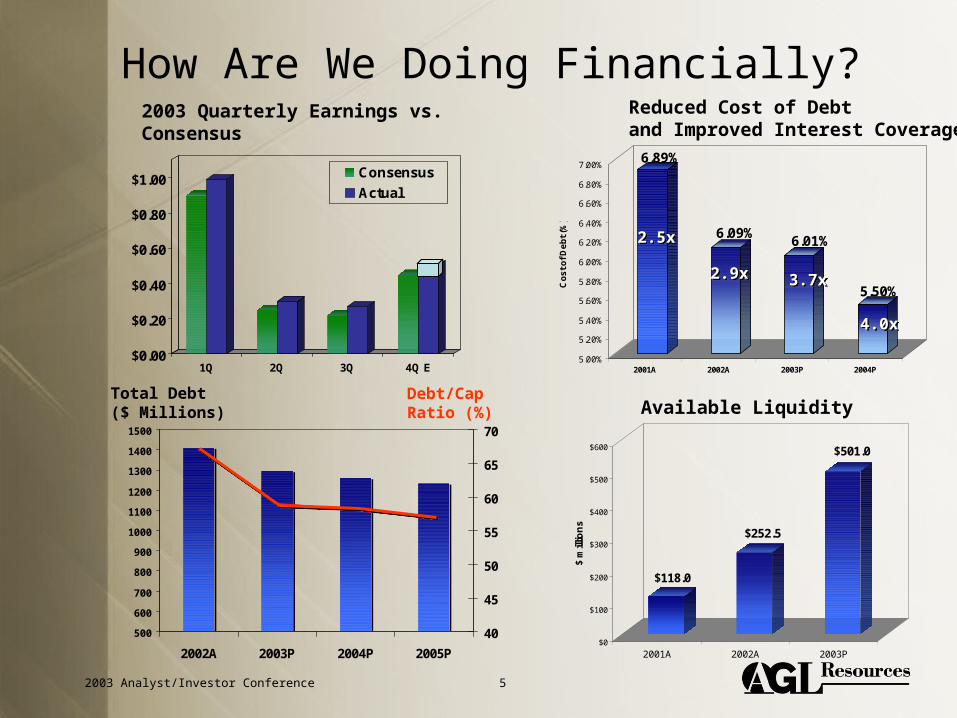
How Are We Doing Financially?
500
600
700
800
900
1000
1100
1200
1300
1400
1500
2002A 2003P 2004P 2005P
40
45
50
55
60
65
70
Total Debt($ Millions)
Debt/CapRatio (%)
6.89%
6.09%6.01%
5.50%
5.00%
5.20%
5.40%
5.60%
5.80%
6.00%
6.20%
6.40%
6.60%
6.80%
7.00%
Co
st
of
De
bt
(%)
2001A 2002A 2003P 2004P
Reduced Cost of Debt and Improved Interest Coverage
$118.0
$252.5
$501.0
$0
$100
$200
$300
$400
$500
$600
$ m
illio
ns
2001A 2002A 2003P
Available Liquidity
$0.00
$0.20
$0.40
$0.60
$0.80
$1.00
1Q 2Q 3Q 4Q E
Consensus
Actual
2003 Quarterly Earnings vs. Consensus
2.5x2.5x
2.9x2.9x 3.7x3.7x
4.0x4.0x
2003 Analyst/Investor Conference 6
Asset Rationalization
• Sale of former headquarters property
• Purchase of Dynegy’s interest in SouthStar
• Sale of Heritage/US Propane interests
2003 Analyst/Investor Conference 7
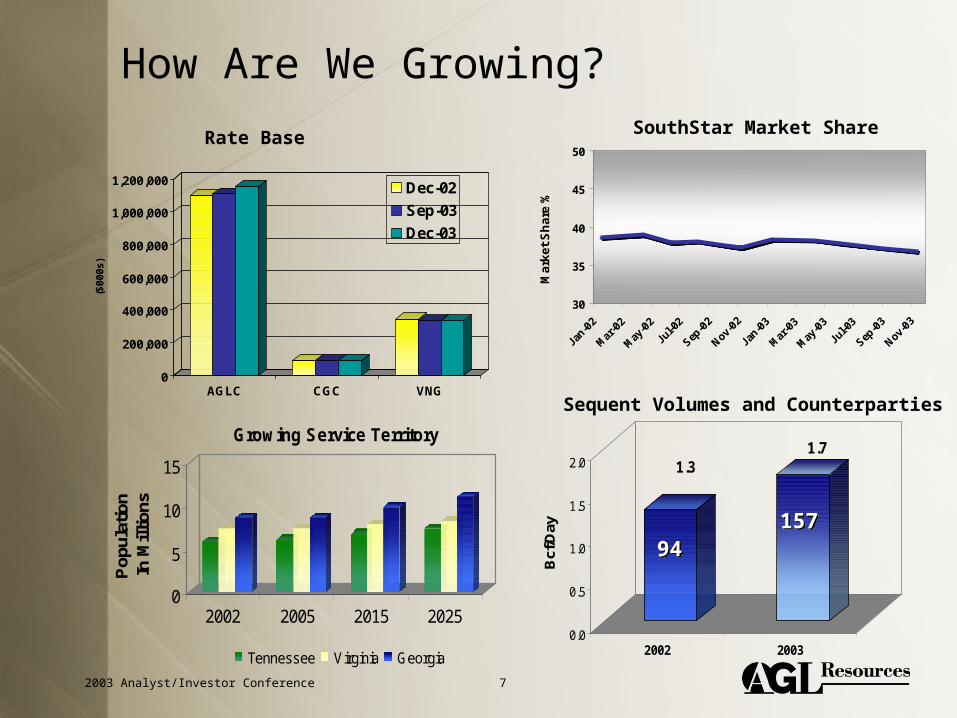
How Are We Growing?
0
200,000
400,000
600,000
800,000
1,000,000
1,200,000
($0
00
s)
AGLC CGC VNG
Dec-02
Sep-03
Dec-03
Rate Base SouthStar Market Share
1.31.7
0.0
0.5
1.0
1.5
2.0
Bcf
/Day
2002 2003
0
5
10
15
Pop
ulat
ion
In
Mill
ions
2002 2005 2015 2025
Growing Service Territory
Tennessee Virginia Georgia
Sequent Volumes and Counterparties
9494157157
30
35
40
45
50
Jan-0
2
Mar
-02
May
-02
Jul-0
2
Sep-0
2
Nov-0
2
Jan-0
3
Mar
-03
May
-03
Jul-0
3
Sep-0
3
Nov-0
3
Ma
rke
t S
ha
re %
2003 Analyst/Investor Conference 8
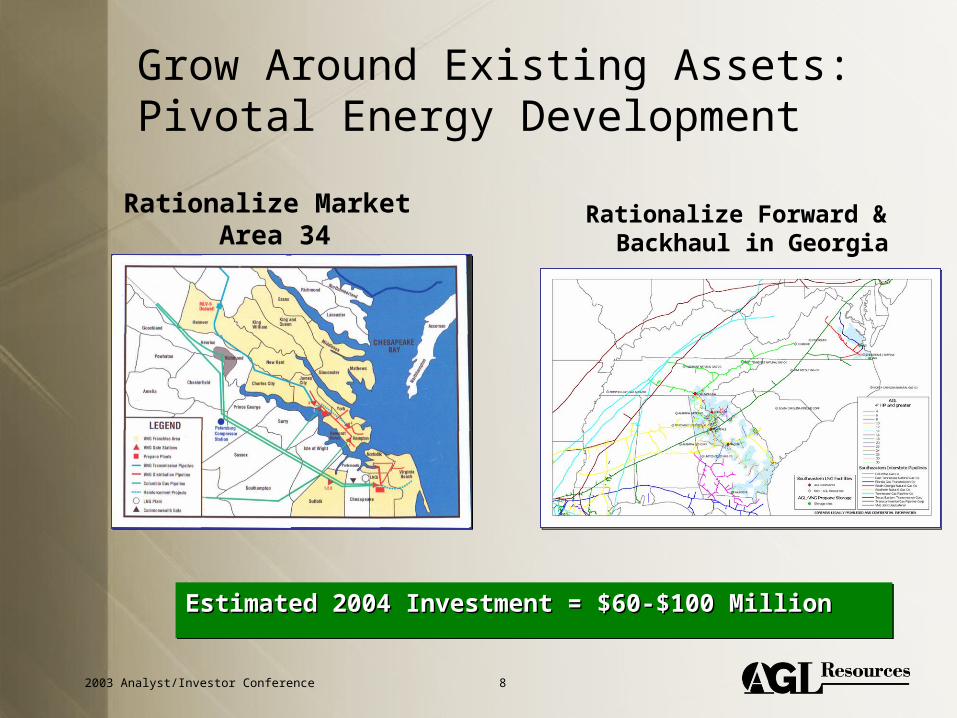
Grow Around Existing Assets:Pivotal Energy Development
Rationalize Market Area 34
Rationalize Forward & Backhaul in Georgia
Estimated 2004 Investment = $60-$100 MillionEstimated 2004 Investment = $60-$100 MillionEstimated 2004 Investment = $60-$100 MillionEstimated 2004 Investment = $60-$100 Million
2003 Analyst/Investor Conference 9
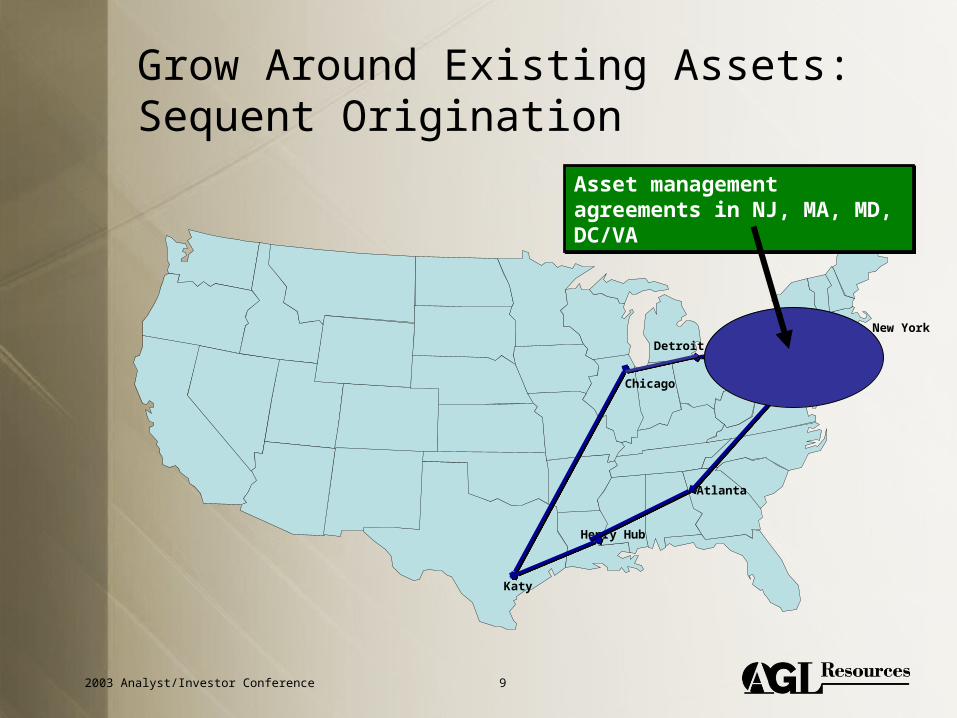
New York
Henry Hub
Chicago
Atlanta
Katy
Grow Around Existing Assets:Sequent Origination
Asset management agreements in NJ, MA, MD, DC/VAAsset management agreements in NJ, MA, MD, DC/VA
Detroit
2003 Analyst/Investor Conference 10
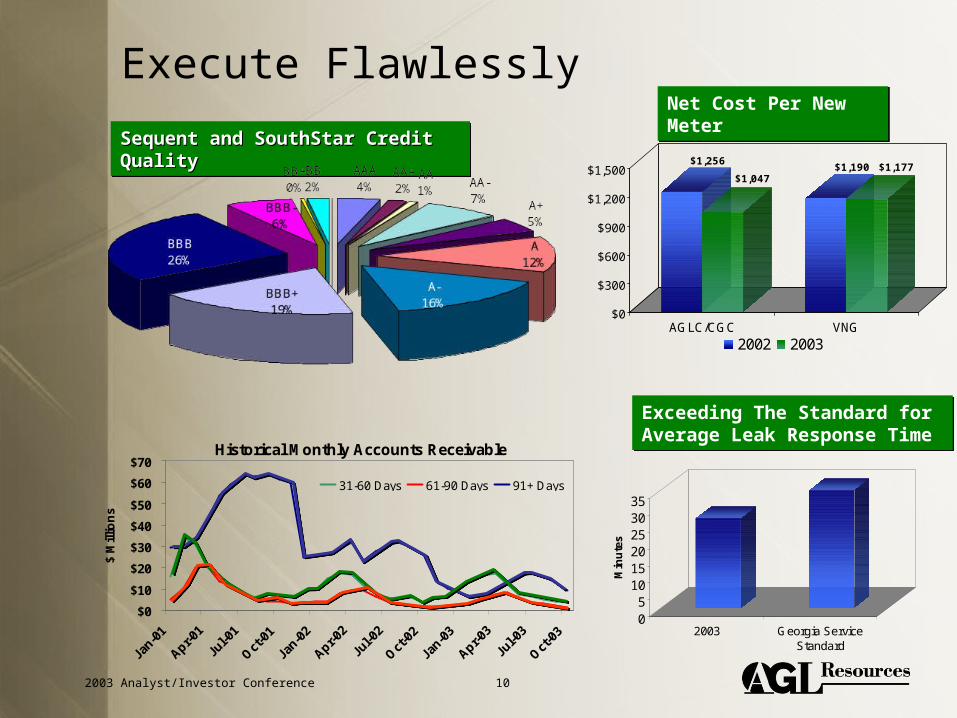
Execute Flawlessly
$1,256
$1,047$1,190 $1,177
$0
$300
$600
$900
$1,200
$1,500
AGLC/CGC VNG
2002 2003
Net Cost Per New MeterNet Cost Per New Meter
Sequent and SouthStar Credit QualitySequent and SouthStar Credit QualitySequent and SouthStar Credit QualitySequent and SouthStar Credit Quality
05
101520253035
Min
ute
s2003 Georgia Service
Standard
Exceeding The Standard for Average Leak Response TimeExceeding The Standard for Average Leak Response Time
Historical Monthly Accounts Receivable
$0
$10
$20
$30
$40
$50
$60
$70
Jan-0
1
Apr-01
Jul-0
1
Oct
-01
Jan-0
2
Apr-02
Jul-0
2
Oct
-02
Jan-0
3
Apr-03
Jul-0
3
Oct
-03
$ M
illio
ns
31-60 Days 61-90 Days 91+ Days
2003 Analyst/Investor Conference 11
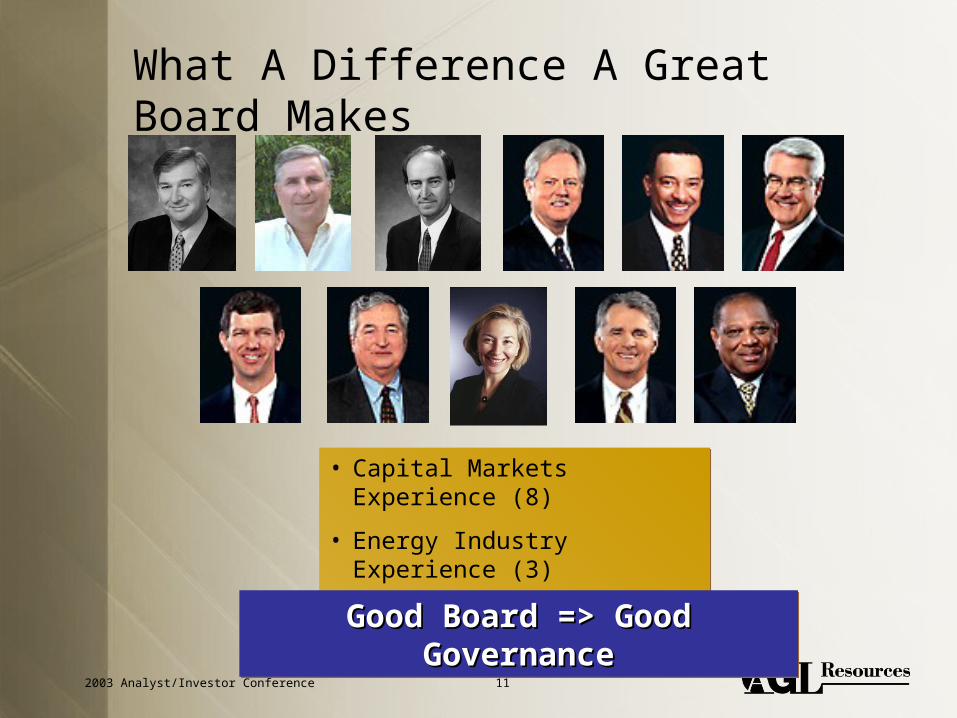
What A Difference A Great Board Makes
• Capital Markets Experience (8)
• Energy Industry Experience (3)
• Public Company Experience (7)
• Capital Markets Experience (8)
• Energy Industry Experience (3)
• Public Company Experience (7)
Good Board => Good GovernanceGood Board => Good GovernanceGood Board => Good GovernanceGood Board => Good Governance
2003 Analyst/Investor Conference 12
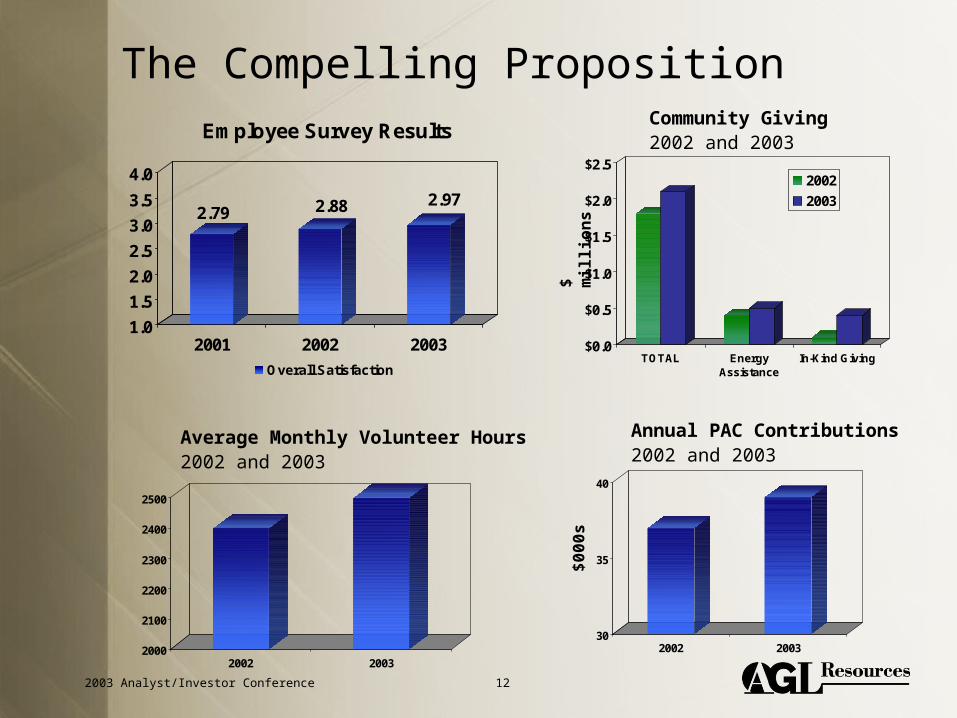
The Compelling Proposition
Average Monthly Volunteer Hours2002 and 2003
Community Giving 2002 and 2003
2000
2100
2200
2300
2400
2500
2002 2003
$0.0
$0.5
$1.0
$1.5
$2.0
$2.5
TOTAL EnergyAssistance
In-Kind Giving
2002
20032.79 2.88 2.97
1.0
1.5
2.0
2.5
3.0
3.5
4.0
2001 2002 2003
Employee Survey Results
Overall Satisfaction
30
35
40
2002 2003
Annual PAC Contributions2002 and 2003
$ m
illi
on
s$
00
0s
2003 Analyst/Investor Conference 13
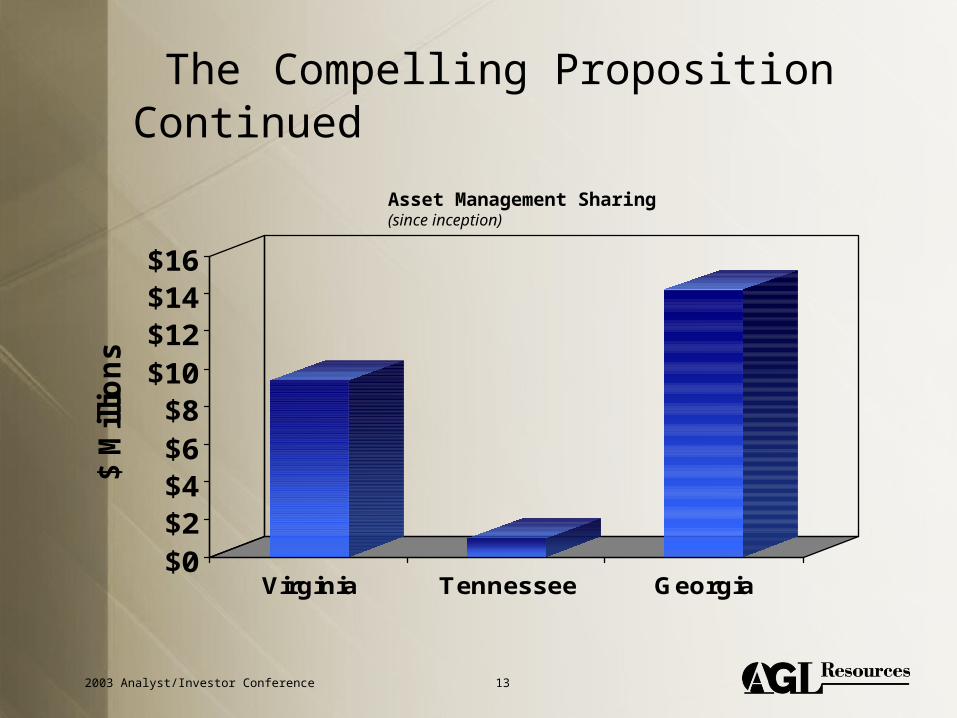
The Compelling Proposition Continued
$0$2$4$6$8
$10$12$14$16
$ M
illio
ns
Virginia Tennessee Georgia
Asset Management Sharing(since inception)
2003 Analyst/Investor Conference 14
Current Environment
• Push/pull of costs
• Volatility of product
• Next wave of productivity
• Future deal flow
2003 Analyst/Investor Conference 15
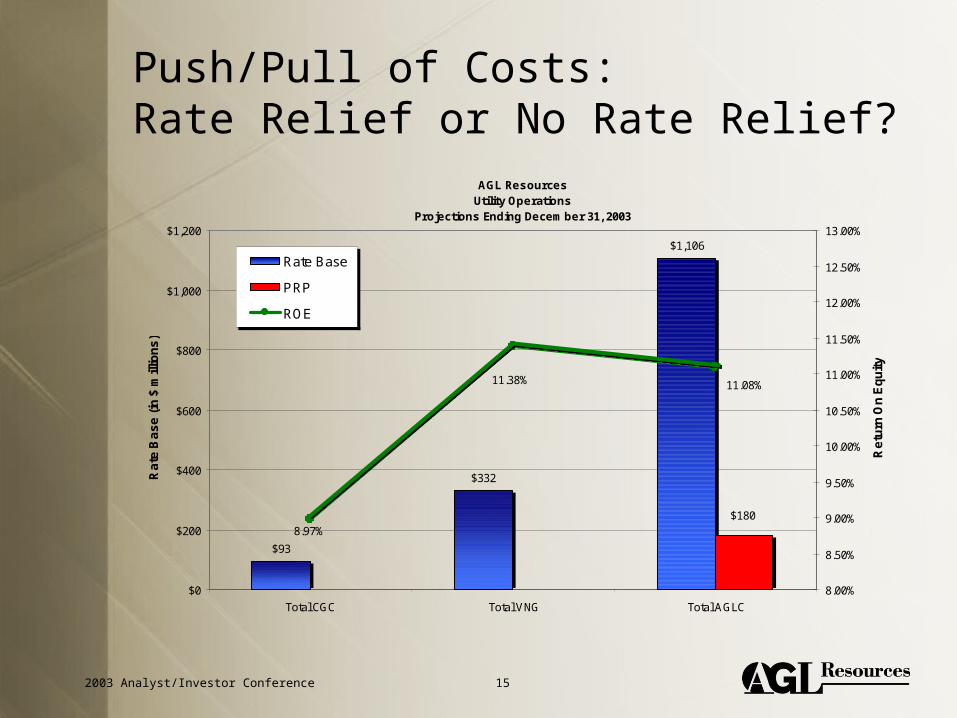
Push/Pull of Costs: Rate Relief or No Rate Relief?
AGL Resources Utility Operations
Projections Ending December 31, 2003
$93
$332
$1,106
$180
11.08%11.38%
8.97%
$0
$200
$400
$600
$800
$1,000
$1,200
Total CGC Total VNG Total AGLC
Ra
te B
as
e (
in $
mill
ion
s)
8.00%
8.50%
9.00%
9.50%
10.00%
10.50%
11.00%
11.50%
12.00%
12.50%
13.00%
Re
turn
On
Eq
uit
y
Rate Base
PRP
ROE
2003 Analyst/Investor Conference 16
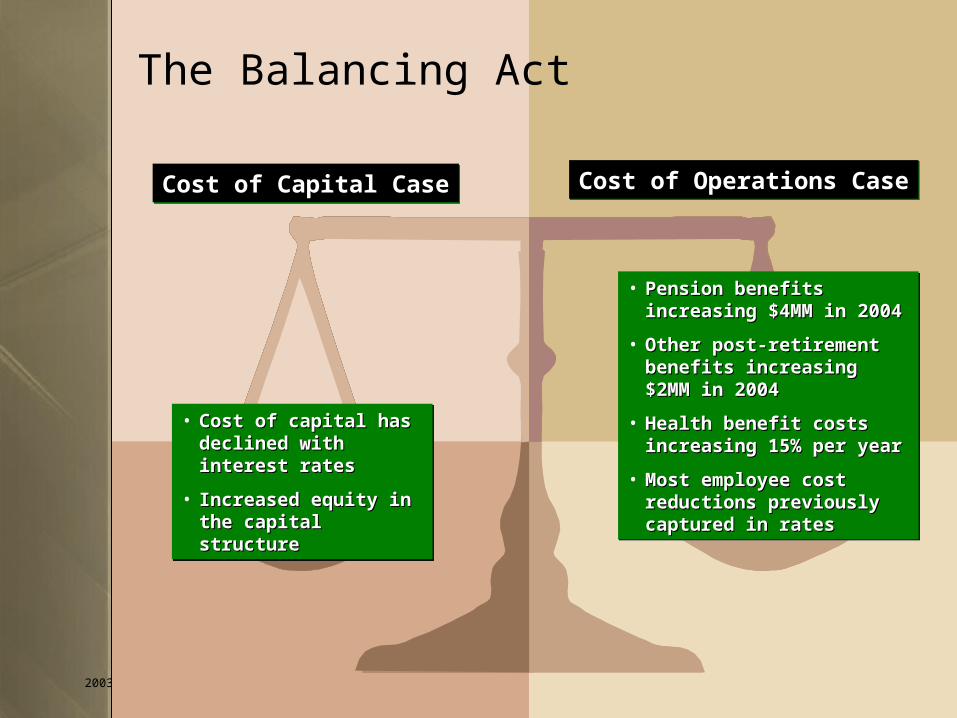
The Balancing Act
• Cost of capital has Cost of capital has declined with interest declined with interest ratesrates
• Increased equity in the Increased equity in the capital structurecapital structure
• Cost of capital has Cost of capital has declined with interest declined with interest ratesrates
• Increased equity in the Increased equity in the capital structurecapital structure
• Pension benefits increasing Pension benefits increasing $4MM in 2004$4MM in 2004
• Other post-retirement Other post-retirement benefits increasing $2MM in benefits increasing $2MM in 20042004
• Health benefit costs Health benefit costs increasing 15% per yearincreasing 15% per year
• Most employee cost Most employee cost reductions previously reductions previously captured in ratescaptured in rates
Cost of Capital CaseCost of Capital Case Cost of Operations CaseCost of Operations Case
2003 Analyst/Investor Conference 17
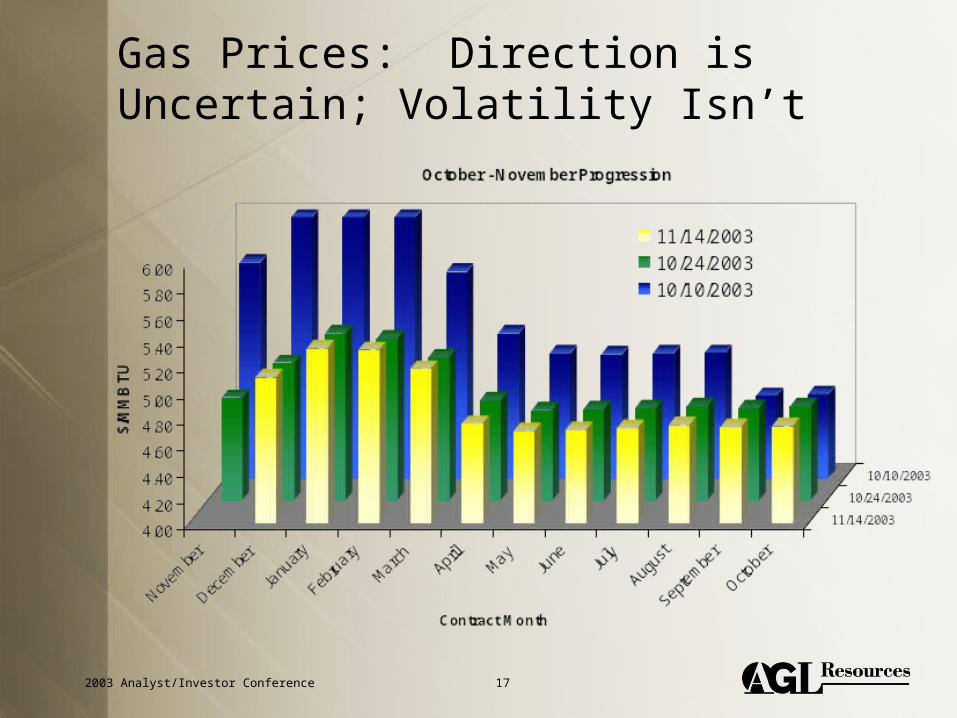
Gas Prices: Direction is Uncertain; Volatility Isn’t
2003 Analyst/Investor Conference 18
Implications
• Must meet the challenge of retail market communications
• Validates SouthStar’s fixed-charge strategy
• Supports Pivotal incremental approach; cautious outreach on LNG and storage investment
• Sequent’s services have value; storage arbitrage strategy is robust
2003 Analyst/Investor Conference 19
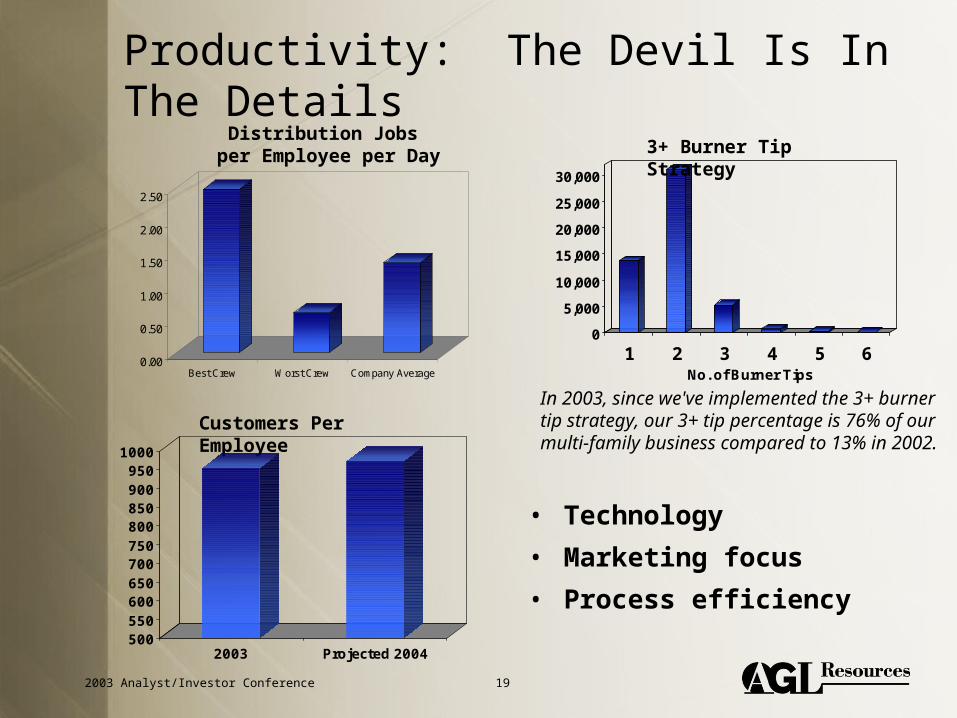
Productivity: The Devil Is In The Details
0
5,000
10,000
15,000
20,000
25,000
30,000
1 2 3 4 5 6No. of Burner Tips
In 2003, since we've implemented the 3+ burner tip strategy, our 3+ tip percentage is 76% of our multi-family business compared to 13% in 2002.
0.00
0.50
1.00
1.50
2.00
2.50
Best Crew Worst Crew Company Average
• Technology
• Marketing focus
• Process efficiency
Distribution Jobs per Employee per Day
Customers Per Employee
500550600650700750800850900950
1000
2003 Projected 2004
3+ Burner Tip Strategy
2003 Analyst/Investor Conference 20
Future Deal Flow
• Best buyer
• Capital structure optimization
• Regulatory ease
• Earnings accretion
2003 Analyst/Investor Conference 21
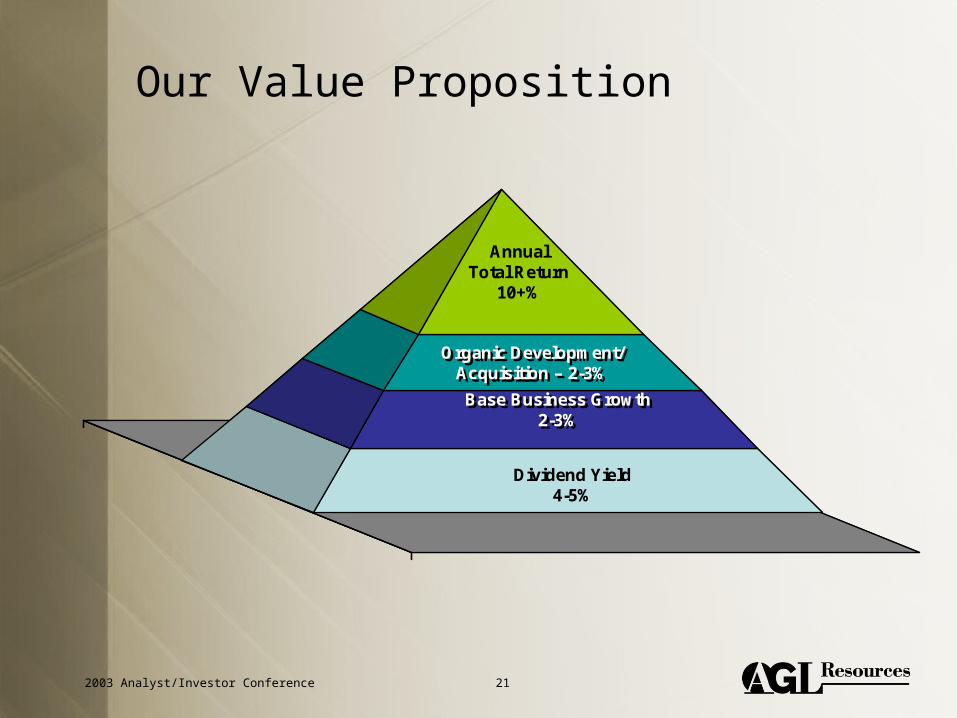
Our Value Proposition
Annual Total Return
10+%
Organic Development/Acquisition – 2-3%
Organic Development/Acquisition – 2-3%
Base Business Growth2-3%
Base Business Growth2-3%
Dividend Yield4-5%
Annual Total Return
10+%
Organic Development/Acquisition – 2-3%
Organic Development/Acquisition – 2-3%
Base Business Growth2-3%
Base Business Growth2-3%
Dividend Yield4-5%
2003 Analyst/Investor Conference 22
2004 Goals
• We will sustain superior financial and operating performance
• We will reconfigure the gas delivery system to save money for our customers – and invest in our own infrastructure
• We will market our products and services as never before
• We will change our business process and culture by driving technology through everything we do
2003 Analyst/Investor Conference 23
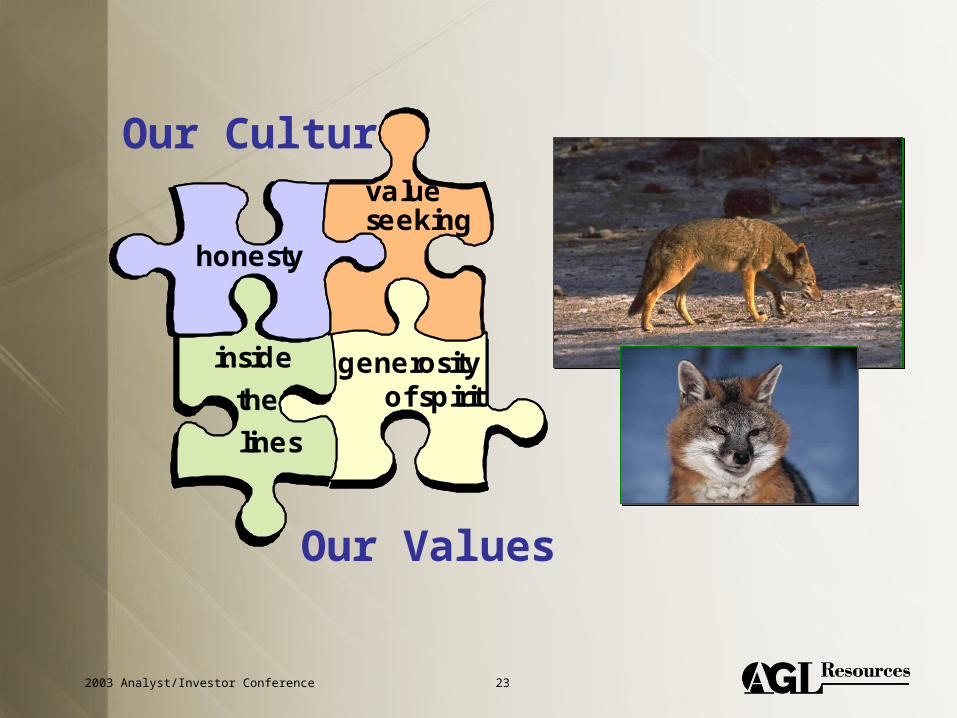
Our Culture
generosityof spirit
generosityof spirit
inside
the
lines
inside
the
lines
honestyhonesty
valueseekingvalueseeking
Our Values
2003 Analyst/Investor Conference 24
Our Promise
• The Value Is Here
• The Value is Still Here
• Every Day, We Seek Value For You
2001
2002