Embed Size (px)
Citation preview

Analyst and Investor BriefingAnalyst and Investor Briefingon the First on the First HalfHalf of of
the Fiscal Year Ended March 31, 2004the Fiscal Year Ended March 31, 2004(April 1, 2003, to September 30, 2003)(April 1, 2003, to September 30, 2003)
November 10, 2003November 10, 2003YAMAHA CORPORATIONYAMAHA CORPORATION

Review of Performance Review of Performance in the Interim Periodin the Interim Period
�For the past two consecutive periods, interim operating income and interim net income have both reached historical highs.
Operating income— ¥26.4 billion (previous record set March 31, 2003, ¥13.1 billion)Interim net income— ¥26.2 billion (previous record set March 31, 2003, ¥10.0 billion)
�Net sales increased from the previous period for two consecutive periods (up 4.9%).Musical instrument and semiconductor sales were the principal cause of the increase.
�Inventories were close to optimal levels, at ¥86.5 billion at the end of the interim period.(Down ¥4.2 billion from the same period of the previous year and down ¥2.3 billion from previous projections)
�Actual interest-bearing debt at the end of the interim period was ¥46.7 billion.(Down ¥22.8 billion from the same period of the previous year or ¥1.2 billion less than projected)
�Second quarter sales and income exceeded levels recorded in the same period of the previous year as well as August 8, 2003, projections.
�Thanks to hedging through futures contracts for the sale of euros, foreign exchange gains were ¥1.1 billion during the second quarter compared to previous projections made August 8, 2003.
Second Quarter
First Half

�Compared with projections announced on August 8, 2003, and the FY2003 interim period, both sales and profit were higher.
266.226.4
(9.9%)29.7
(9.3%)26.2
(8.0%)
((((Billions of Yen))))
Performance in the Interim PeriodPerformance in the Interim Period
Currency Exchange Rate
US$EURUS$EUR
119130120125
Change from
FY2003(1H)FY2004 (1H)projections
Change from
projections 2QQQQ
4.9%
101.6%
109.0%
160.6%
264.0
20.5
21.5
19.0
0.8%
28.9%
38.4%
38.2%
140.1
14.6
16.3
13.6
Net Sales
Net Income
FY2003(1H)
253.7
13.1
14.2
10.0
118133119127
123117122115
Net Income(Net Income Ratio)
Recurring Profit(Recurring Profit Ratio)
Operating Income(Operating Income Ratio)
Net Sales
FY2004(1H)

Breakdown of Operating Income/Loss in Breakdown of Operating Income/Loss in the Interim Periodthe Interim Period
((((Billions of Yen))))
+5.3
13.1
+3.0
FY2003(1H)Operating Income
FY2004 (1H)Operating Income
26.4
(0.6)+4.5
+1.1
Decrease in SG&A
Expenses
Actual Increase in
Sales (+9.9)
Gain on Foreign
Exchange
Pension ObligationsDecrease in
Manufacturing Costs

Non-Operating Income (Loss)
Extraordinary Income (Loss)
Corporate Income Tax and Other Expenses
Equity method income Net financial expenses OtherTotal
Income (loss) from disposal of fixed assets
Other
Total
Corporate income tax, etc.Minority interests in consolidated subsidiariesTotal
FY2004(1H)
8/8/2003 Projections
3.9(0.7)(2.2)
+1.0
(0.5)0.0
(0.5)
1.80.2
+2.0
((((Billions of Yen))))
FY2003(1H)
3.5(0.6)(1.8)+1.1
(0.5)(1.5)
(2.0)
1.90.3
+2.2
・・・・Loss from revaluation on investment securities (1.6)
FY2004(1H)
5.2(0.4)(1.5)+3.3
(0.5)(0.5)
(1.0)
2.20.3
+2.5
・・・・EC Fines (0.3)・・・・Disposal of the
Yamaha Electronique Alsace S.A. AV plant (0.25)
148.7148.7148.7148.7149.0149.0149.0149.0
33.733.733.733.735.535.535.535.5
23.223.223.223.223.023.023.023.0
36.436.436.436.433.033.033.033.0
23.623.623.623.623.523.523.523.5
149.1149.1149.1149.1146.2146.2146.2146.2 147.5147.5147.5147.5
32.932.932.932.934.034.034.034.038.538.538.538.5
23.223.223.223.223.223.223.223.223.623.623.623.6
36.436.436.436.436.436.436.436.424.924.924.924.9
23.623.623.623.623.623.623.623.620.620.620.620.6
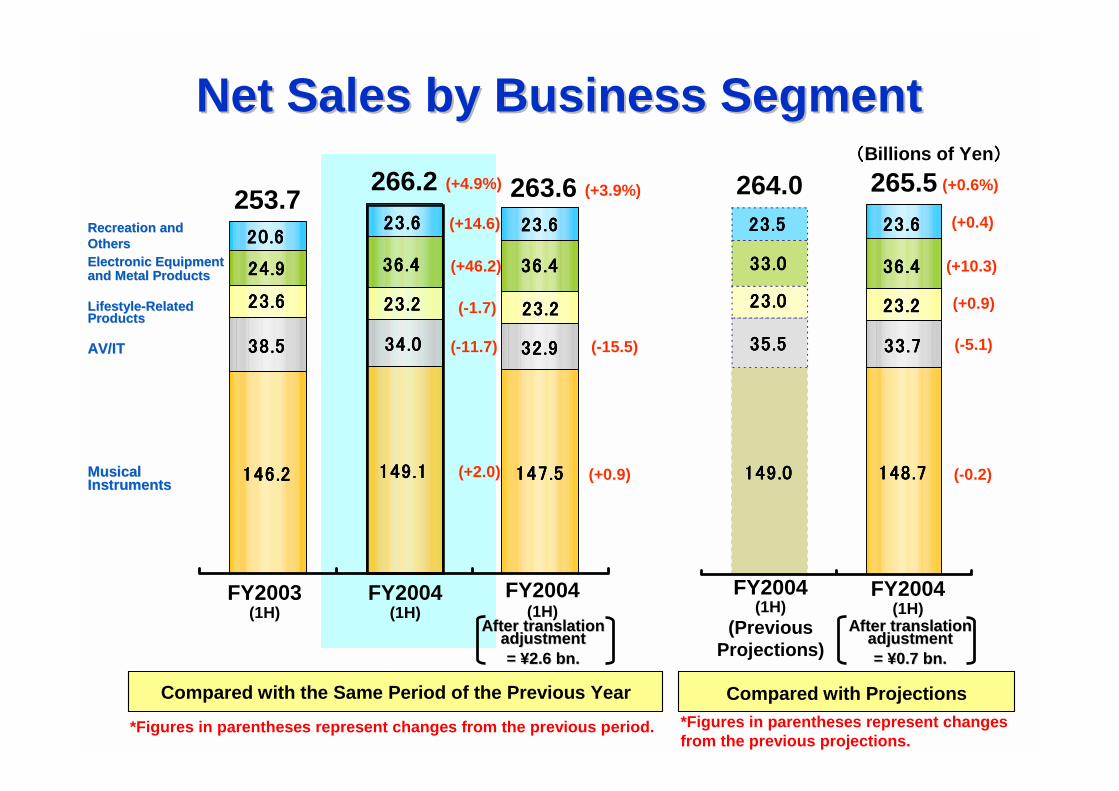
Net Sales by Business SegmentNet Sales by Business Segment
After translation After translation adjustment adjustment = = ¥¥2.6 bn.2.6 bn.
((((Billions of Yen))))
253.7266.2 263.6
(-15.5)
(+3.9%)
(+0.9)
FY2003(1H)
FY2004(1H)
FY2004(1H)
FY2004(1H)
(Previous Projections)
FY2004(1H)
264.0 265.5
Compared with the Same Period of the Previous Year Compared with Projections
(+0.6%)
(-5.1)
(-0.2)
(+0.4)
(+10.3)
(+0.9)
(+4.9%)
(+14.6)
(+46.2)
(-1.7)
(-11.7)
(+2.0)Musical Musical InstrumentsInstruments
AV/ITAV/IT
LifestyleLifestyle--Related Related ProductsProducts
Electronic EquipmentElectronic Equipmentand Metal Productsand Metal Products
Recreation and Recreation and OthersOthers
*Figures in parentheses represent changes from the previous period.
After translation After translation adjustment adjustment = = ¥¥0.7 bn.0.7 bn.
*Figures in parentheses represent changes from the previous projections.

FY2004(1H)
26.4*
(0.5)14.2
1.11.49.7
0.5
((((Billions of Yen))))
Operating Income by Business Segment Operating Income by Business Segment in the Interim Periodin the Interim Period
*¥5.9 billion increase from the projection issued on August 8, 2003Of this, the results of foreign exchange accounted for ¥1.1 billion (¥0.7 billion in musical instruments, ¥0.4 billion in AV/IT). Accordingly, on a real basis, there was an increase of ¥4.8 billion over previous projections.
7.0
8/8/2003Projections
0.120.5
1.50.8
Increase/(Decrease)
+13.3
Currency Exchange
Impact
+3.0
Actual Increase/
(Decrease)
+10.3
+0.3+8.3+0.6+0.4+3.7
0.0
+1.1+1.9
+0.3
+1.8
0.0
(0.7)+0.6+8.3
FY2003(1H)
13.1
(0.8)5.90.51.06.0
0.5
11.5(0.4)Recreation
Electronic Equipment and Metal Products
Lifestyle-Related Products
AV/IT
Musical Instruments
Others
TOTAL
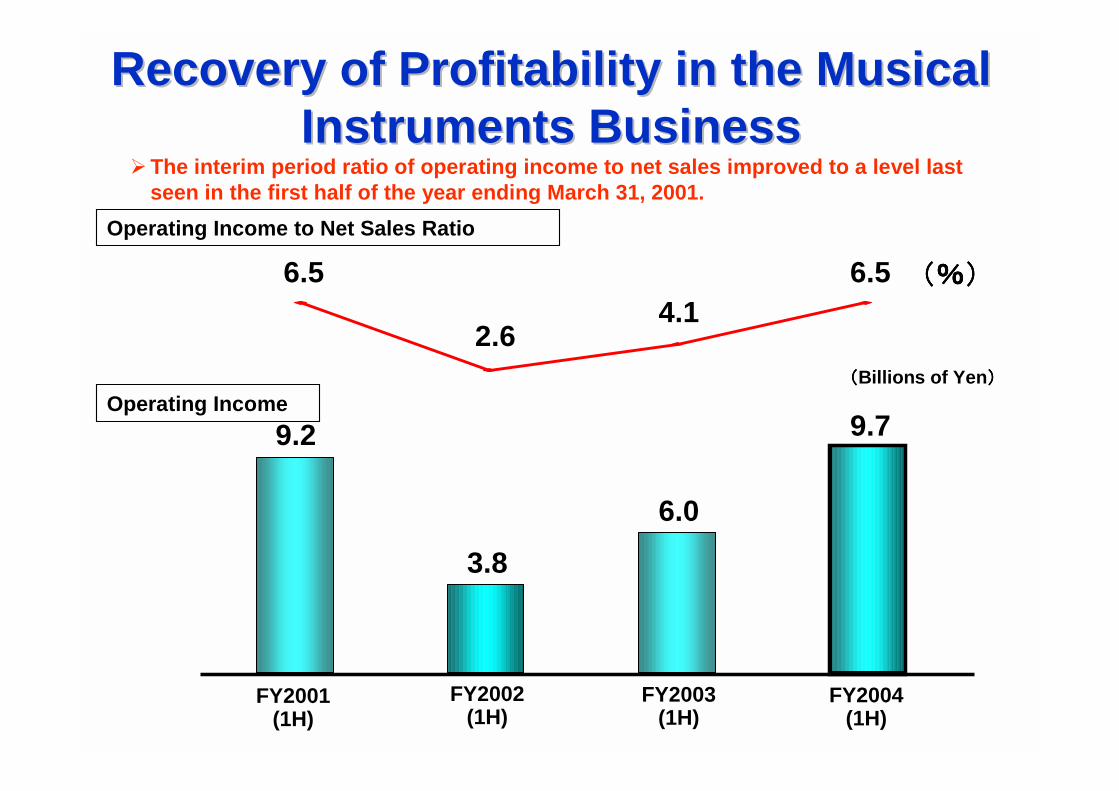
Recovery of Profitability in the Musical Recovery of Profitability in the Musical Instruments BusinessInstruments Business
Operating Income9.2
6.5
3.8
4.1(%)(%)(%)(%)
FY2001(1H)
6.0
9.7
((((Billions of Yen))))
FY2002(1H)
FY2003(1H)
FY2004(1H)
�The interim period ratio of operating income to net sales improved to a level last seen in the first half of the year ending March 31, 2001.
2.6
6.5Operating Income to Net Sales Ratio

Improvement in Profitability in the Electronic Improvement in Profitability in the Electronic Equipment and Metal Products BusinessEquipment and Metal Products Business
3.3
14.9
2.6
23.7
(%)(%)(%)(%)
5.9
14.2
((((Billions of Yen))))14.1
39.0
�The interim period ratio of operating income to net sales improved significantly compared with the same period of the previous year.
FY2001(1H)
FY2002(1H)
FY2003(1H)
FY2004(1H)
Operating Income
Operating Income to Net Sales Ratio

Background of the Strong Performance Background of the Strong Performance of the Semiconductor Businessof the Semiconductor Business
� The growth in the mobile phone market and the spread of the use of polyphonic sound in mobile phones (expansion in the market)
� YAMAHA’s unique FM sound generator + Wave Table (PCM sound generator)�The FM sound generator features a reduction in data storage space requirements, a greater degree of freedom in tone composition (sound effects, etc.), and PCM sound generator data sampling technology
� Created synergy among SMAF (Synthetic music Mobile Application Format), content (ringing melodies), and sound chips (hardware)
� Improvements to sound chip peripheral software, tools, SMAF that optimizes the sound quality
� Provision of technology to mobile phone handset manufacturers: both technology and personnel
� Accumulated expertise in sound that has accompanied the development of musical instruments
� Cost-competitiveness through mass production

Principal Measures and Topics for the Principal Measures and Topics for the First Half of Fiscal 2004First Half of Fiscal 2004
� Business� Began China-based holding company operations (April 2003)
The effects of SARS have stunted progress.
The piano plant in China faced delays in real estate acquisition and the start ofproduction has been delayed for six months to fall 2004.
� The AV plant in China began operations (March 2003)� Started musical instrument rental services in the Japanese market (April 2003)
We have revised upward our first fiscal year target from 2,000 rentals to 3,000
� Restructuring� Invar material business was discontinued production as scheduled in July 2003
� Sunza Villa closed for business on June 30, 2003
� Decision made to stop production at the YAMAHA Electronique Alsace S.A. AV plant on November 30, 2003
� Thermoelectric modules business was transferred to the Technology Group and downsized
� Other� Return of the substitutional portion of the employees’ pension determined (future portion
authorized November 1, 2003)

Business Environment in the Second Business Environment in the Second Half of Fiscal 2004Half of Fiscal 2004
�Overall Instability and unpredictability in global economy to continue
�Musical InstrumentsIncrease of Chinese-manufactured pianos and wind instrumentsExpansion in software and network markets
�AV/IT Home theater component market to shrink and the home theater system market to growLow-cost, Chinese-made and Chinese brand products to emerge in marketDigital and networking technologies to advance
�Lifestyle-Related ProductsSigns of market deterioration to appear in the beginning of 2004 as a repercussion of the end of the housing loan incentive tax systemIndustry participants to work vigorously to stimulate demand for housing renovation
�Semiconductors Global mobile phone unit sales for 2003 to increase 10% to 15% from 2002In conjunction with this trend, mobile phones will have more advanced functions
�Electronic Equipment and Metal Products
Despite indications for a recovery in the semiconductor market, future trends are uncertain
�Recreation Continued declines in prices and greater selectivity
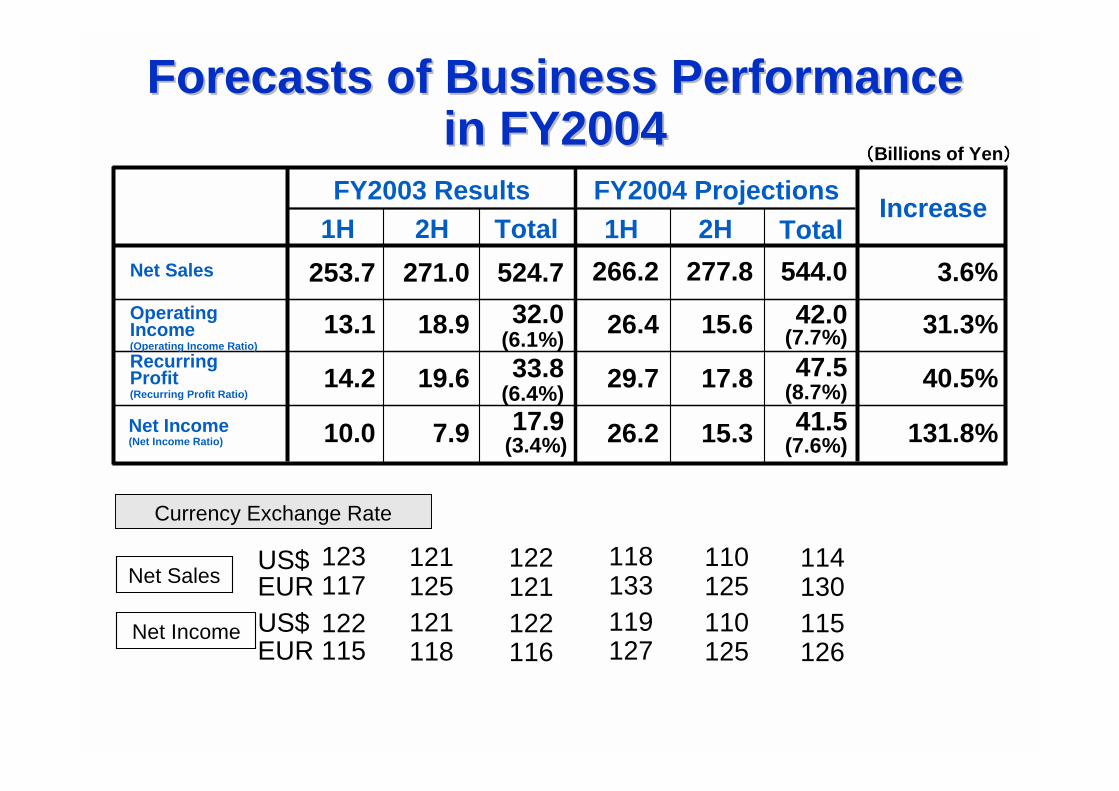
Forecasts of Business Performance Forecasts of Business Performance in FY2004in FY2004
((((Billions of Yen))))
131.8%7.910.0
40.5%19.614.2
31.3%18.913.1
3.6%271.0253.7
IncreaseFY2004 ProjectionsFY2003 Results
17.9(3.4%)
33.8(6.4%)
32.0(6.1%)
524.7
15.326.2
17.829.7
15.626.4
277.8266.2
41.5(7.6%)
47.5(8.7%)
42.0(7.7%)
544.02H1H Total 2H1H Total
Currency Exchange Rate
US$EURUS$EUR
123117122115
121125121118
122121122116
Net Sales
Net Income
118133119127
110125110125
114130115126
Net Income(Net Income Ratio)
Recurring Profit(Recurring Profit Ratio)
Operating Income(Operating Income Ratio)
Net Sales

Breakdown of Operating Income/LossBreakdown of Operating Income/Lossin FY2004in FY2004
((((Billions of Yen))))
+4.2
32.0
+4.4
Operating Income for FY2003
Operating Income for FY2004
42.0
(1.1)+4.3 (1.8)
Increase in SG&A
ExpensesActual
Increase in Sales
(+21.4)Gain on Foreign
Exchange
Pension Obligations
Decrease in Manufactur-
ing Costs
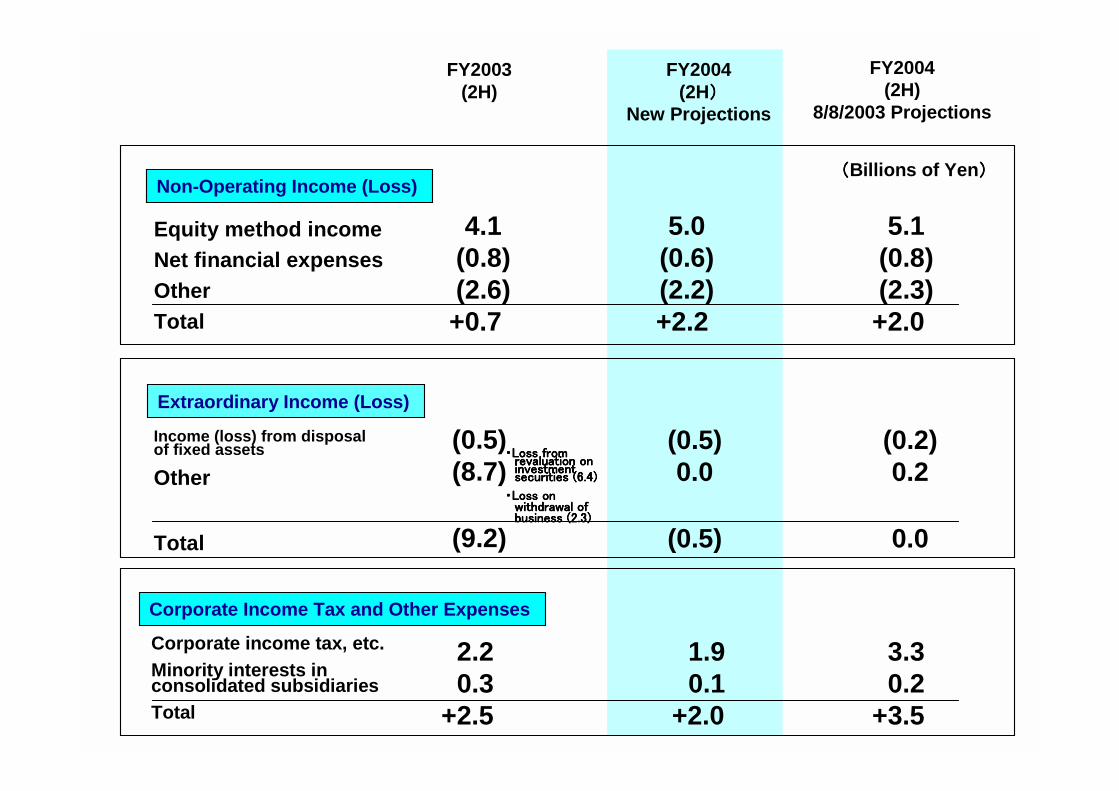
4.1(0.8)(2.6)+0.7
(0.5)(8.7)
(9.2)
2.20.3
+2.5
5.0(0.6)(2.2)+2.2
(0.5)0.0
(0.5)
1.90.1
+2.0
5.1(0.8)(2.3)+2.0
(0.2)0.2
0.0
3.30.2
+3.5
・・・・Loss from Loss from Loss from Loss from revaluation on revaluation on revaluation on revaluation on investment investment investment investment securities (6.4)securities (6.4)securities (6.4)securities (6.4)
・・・・Loss on Loss on Loss on Loss on withdrawal of withdrawal of withdrawal of withdrawal of business (2.3)business (2.3)business (2.3)business (2.3)
Non-Operating Income (Loss)
Extraordinary Income (Loss)
Corporate Income Tax and Other Expenses
Equity method income Net financial expenses OtherTotal
Income (loss) from disposal of fixed assets
Other
Total
Corporate income tax, etc.Minority interests in consolidated subsidiariesTotal
FY2004(2H)
8/8/2003 Projections
((((Billions of Yen))))
FY2003(2H)
FY2004(2H))))
New Projections

299.3299.3299.3299.3297.5297.5297.5297.5292.6292.6292.6292.6
83.383.383.383.383.083.083.083.083.783.783.783.7
46.046.046.046.0 45.545.545.545.5 45.545.545.545.5
60.660.660.660.670.570.570.570.570.570.570.570.5
47.547.547.547.547.547.547.547.541 .841 .841 .841 .8
Forecasts of Net Sales by Business SegmentForecasts of Net Sales by Business Segment((((Billions of Yen))))
(-1.1)
(-0.8)
((((+1.7)
((((+13.6)
(-0.5)
(+2.3)
(+16.3)
((((+3.7%) ((((+4.1%)524.7 544.0 546.1
((((New Projections))))FY2003 FY2004 FY2004
300.0300.0300.0300.0302.0302.0302.0302.0
83.883.883.883.886.086.086.086.0
45.545.545.545.5 45.545.545.545.5
61.561.561.561.5 70.570.570.570.5
47.547.547.547.546.046.046.046.0
541.0 547.3
(0)
(-2.6)
((((-0.7)
((((+3.3)
(+14.6)
((((+1.2%)
FY2004(Previous
Projections)
Musical Musical InstrumentsInstruments
AV/ITAV/IT
LifestyleLifestyle--Related Related ProductsProducts
Electronic EquipmentElectronic Equipmentand Metal Productsand Metal Products
Recreation and Recreation and OthersOthers
After translation After translation adjustment adjustment = = ¥¥--2.1 bn.2.1 bn.
After translation After translation adjustment adjustment ==¥¥ --3.3 bn.3.3 bn.
((((New Projections))))FY2004
(New Projections)
Compared with the Same Period of the Previous Year Compared with Projections*Figures in parentheses represent changes from the previous period. *Figures in parentheses represent changes
from the previous projections.

Forecasts of Operating Income by Forecasts of Operating Income by Business SegmentBusiness Segment
((((Billions of Yen))))
(0.5)25.0
1.04.0
12.0
FY2004Projections
0.5
19.30.53.29.8
FY2003
0.4+0.6+5.7+0.5+0.8+2.2
Increase/ (Decrease)
+0.1+10.032.0
+2.0+2.4
Currency Exchange
Impact
+4.4
+0.6+5.7
(0.2)
Actual Increase/
(Decrease)
+0.1+5.6
(1.2)+0.5
(1.1)
*This represents an increase of ¥8.0 billion from August 8, 2003, projections.The increase in income from foreign exchange rate fluctuations is projected at ¥1.1 billion (musical instruments ¥0.2 billion, AV/IT ¥0.9 billion). Accordingly, on a real basis, operating income is now projected to outstrip the August 8, 2003, projections by ¥6.9 billion.
(0.5)17.7
12.0
0.334.0
3.70.8
Recreation
Electronic Equipment and Metal Products
Lifestyle-Related Products
AV/IT
Musical Instruments
Others
TOTAL
8/8/2003Projections
42.0*
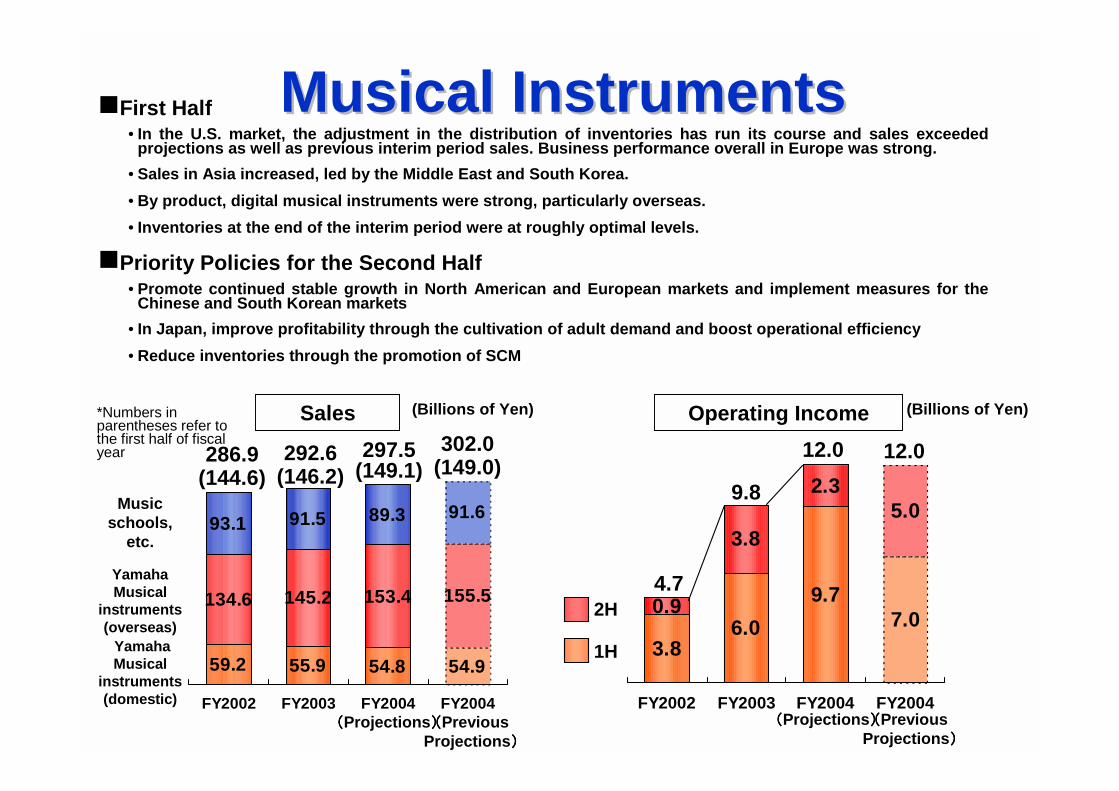
�First Half• In the U.S. market, the adjustment in the distribution of inventories has run its course and sales exceeded
projections as well as previous interim period sales. Business performance overall in Europe was strong.• Sales in Asia increased, led by the Middle East and South Korea.• By product, digital musical instruments were strong, particularly overseas.• Inventories at the end of the interim period were at roughly optimal levels.
�Priority Policies for the Second Half• Promote continued stable growth in North American and European markets and implement measures for the
Chinese and South Korean markets• In Japan, improve profitability through the cultivation of adult demand and boost operational efficiency• Reduce inventories through the promotion of SCM
Musical InstrumentsMusical Instruments
54.954.855.959.2
155.5153.4145.2134.6
91.689.391.593.1
FY2002 FY2003 FY2004 FY2004
286.9(144.6)
7.09.7
6.03.8
5.02.3
3.8
0.9
FY2002 FY2003 FY2004 FY2004
9.8
((((Previous Projections))))
292.6(146.2)
297.5(149.1)
302.0(149.0)
12.0
((((Previous Projections))))
Yamaha Musical
instruments(domestic)
Yamaha Musical
instruments(overseas)
Music schools,
etc.
1H
2H
((((Projections)))) ((((Projections))))
4.7
12.0
(Billions of Yen) Operating Income (Billions of Yen)Sales*Numbers in parentheses refer to the first half of fiscal year

�JapanOverall Conditions:
� The market is saturated and new content providers are beginning to emerge. The size of the market is estimated to be between ¥70.0 and ¥80.0 billion and Chaku-uta (reproduction of brief portions of CDs using compressed music data) is expanding.
� The number of members has peaked out at approximately 33 million total and competition is heating up.Initiatives:
� Television commercials were aired in July and August aimed at recruiting new members� Improve profitability through scrapping and building
�Overseas Conditions:
<United States> The ringing melodies distribution business is expanding, but obtaining permission to use musical compositions is a barrier. There are numerous formats, including SPMIDI, SMAF, SMF, CMX, and iMelody.
<Europe> Vodafone Live! in Europe has an overall download rate of 1 million per month.<China> There are between four and five local content providers serving the market. These
companies have been affected by the SARS epidemic and the slower than expected diffusion of mobile phone handsets.
Initiatives:<United States> Began providing services with AT&T Wireless in July 2003, plan to transfer operating body
from Japan to the United States<Europe> Began Bouygues Telecom in France (2,000 subscribers in August 2003)<China> Began providing services with China Unicom in July 2003; strengthening local response
through hiring staff locally and growth expected in the future <Taiwan> Number of TCC subscribers exceeded 20,000 and sales have increased sharply
Ringing Melodies Distribution Service Ringing Melodies Distribution Service DevelopmentDevelopment
Number of YAMAHA Members is Stagnant.
YAMAHAYAMAHA’’s Continued Strategy to Actively Develop Overseas, Has s Continued Strategy to Actively Develop Overseas, Has Not Led to Visible ResultsNot Led to Visible Results
*Numbers in parentheses refer to the first half of fiscal year
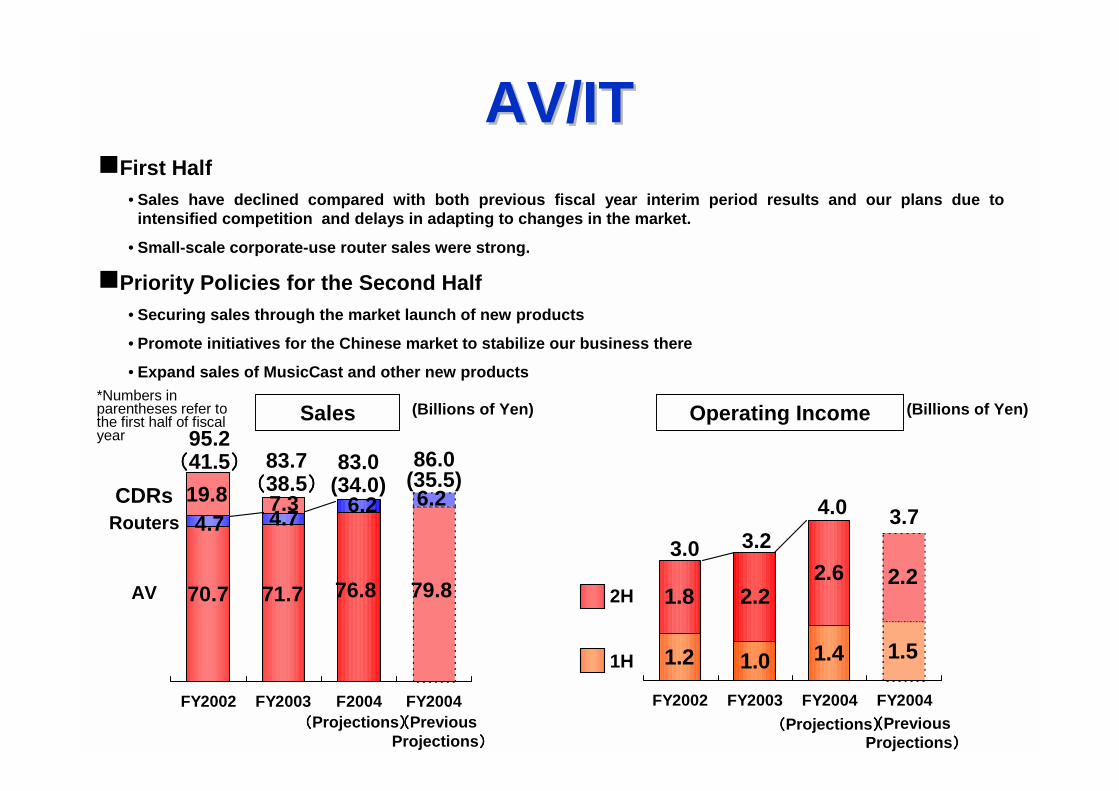
AV/ITAV/IT
FY2002 FY2003 F2004 FY2004
86.0(35.5)
1.51.41.01.2
2.22.62.21.8
FY2002 FY2003 FY2004 FY2004
3.0
CDRs
70.7
83.7((((38.5))))
�First Half• Sales have declined compared with both previous fiscal year interim period results and our plans due to
intensified competition and delays in adapting to changes in the market.
• Small-scale corporate-use router sales were strong.
�Priority Policies for the Second Half• Securing sales through the market launch of new products
• Promote initiatives for the Chinese market to stabilize our business there
• Expand sales of MusicCast and other new products
Routers
AV
95.2((((41.5))))
4.719.8
71.7
4.77.3
79.8
6.2
3.23.7
((((Previous Projections))))
((((Previous Projections))))
83.0(34.0)
76.8
6.2 4.0
1H
2H
((((Projections)))) ((((Projections))))
Operating IncomeSales (Billions of Yen) (Billions of Yen)

�First Half• Mobile phone sound chips rebounded in the second quarter and semiconductors continued to perform well.
• The profitability of the electronic metals business improved along with the withdrawal from the invar materials business.
• Due to deteriorating market conditions, it was not possible to launch the operations of the thermoelectric modules (Peltier device) business, and it was reorganized into the Technology Group.
�Priority Policies for the Second Half• Maintain profitability in the semiconductor business
• Strengthen profitability in the electronic metals business
Electronic Equipment and Metal Electronic Equipment and Metal Products Products
33.036.424.918.4
28.534.1
35.7
18.2
FY2002 FY2003 FY2004 FY2004
36.6
60.6 61.5
11.514.2
5.92.6
6.2
10.8
13.4
1.8
FY2002 FY2003 FY2004 FY2004
4.4
19.3 17.7
((((Previous Projections))))
((((Previous Projections))))
70.5
1H
2H
1H
2H
((((Projections)))) ((((Projections))))
25.0
Operating IncomeSales (Billions of Yen) (Billions of Yen)

SemiconductorsSemiconductors�First Half• Mobile phone sound chips lost momentum in the first quarter due to inventory adjustments and the SARS
epidemic, but in the second quarter they staged a recovery centered in China and South Korea.
• Chips for amusement machines (Pachinko, Pachislo, etc. ) maintained their strength throughout the period.
• Inventories have declined to nearly optimal levels.
�Priority Policies for the Second Half• Maintain dominance in the mobile phone sound chip business
Increase sales in Asian marketsPromote sales in the expanding markets of Europe and North America
• Expand the business for chips for amusement machines (Pachinko, Pachislo, etc. )
FY2002 FY2002 FY2003 FY2003 FY2004 FY2004
16.8
11.6
29.2 29.8((((Billions of Yen))))
((((Projection))))
12.9
28.7
((((1H)))) ((((1H)))) ((((1H))))((((2H)))) ((((2H)))) ((((2H))))
Sales

Trends in the Global Market for Trends in the Global Market for Mobile PhonesMobile Phones
■■■■Situation in 2003
• Mobile phone sales rose 18% in the January-March quarter from the same quarter of 2002, and increased 12% in the April-June quarter from the same quarter of 2002.
• The effects of SARS had nearly played out as of May 31, 2003, and the inventory adjustments of handset manufacturers wound down in July.
• Handsets featuring color liquid crystal displays with camera functions became increasingly known among consumers in Europe and North America.
• In the Chinese market, in Beijing, Shanghai, Guangzhou, and other major cities, there has been a sudden increase in users buying upgraded models.
• In Japan, roughly 90% of mobile phones have camera functions and the third-generation (3G) mobile phone market is increasing.
• In South Korea, even though the market is nearly saturated, a number of companies are planning to launch W-CDMA services at the end of 2003 in Seoul.
• There has been concern regarding possible inventory adjustments since the beginning of 2004.
0000
100100100100
200200200200
300300300300
400400400400
500500500500
99 00 01 02 03*
Source: Nikkei Market Access
(Millions Units)
*The projection for 2003 was made by IDC.

Japan
Korea
China
Europe/US
Others
Mobile PhonesIn Use*
(Million Units)(Million Units)(Million Units)(Million Units)
Annual Sales ofMobile Phones*
(Million Units)(Million Units)(Million Units)(Million Units)
Trends in Sound Chip Markets
Mobile Phone Sales VolumeMobile Phone Sales Volumeand Sound Chip Business Conditionsand Sound Chip Business Conditions
78.6
33.2
48.0
15
235 Slightly under
100
200500
• Rush for new handsets with cameras, increase in replacement demand
• Market for third generation (3G) mobile phones expanding• Move from 32/40-note to 64-note polyphony sound chips under way
• Rush to introduce 64-note models, but market saturated• To start W-CDMA services from the end of 2003
• The market share of domestic Chinese manufacturers tops 50%• Sharp increase in users upgrading models in large cities• Projected to move from 16-note to 32/40/64-note polyphony sound
chips• Color liquid crystal units with cameras recognized by consumers• Increase in number of ringing melodies distribution service
providers, competition intensified• Increase in sales of models with over 32-note polyphony sound
chips• Increased sales in South America, Eastern Europe, the Middle
East, and Africa• Expand market for CDMA type units• Shift from monophony to polyphony
100500
*assumption
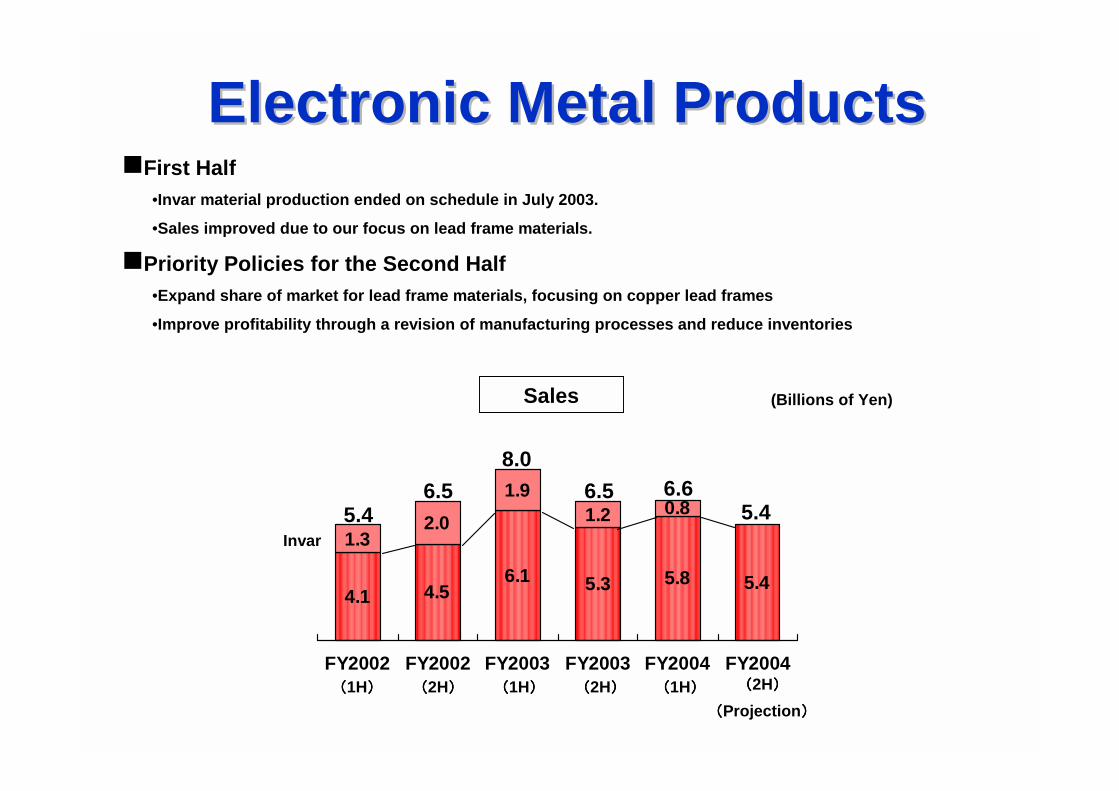
5.45.85.36.14.54.1
0.81.21.9
2.01.3
FY2002 FY2002 FY2003 FY2003 FY2004 FY2004
Electronic Metal ProductsElectronic Metal Products�First Half
•Invar material production ended on schedule in July 2003.
•Sales improved due to our focus on lead frame materials.
�Priority Policies for the Second Half•Expand share of market for lead frame materials, focusing on copper lead frames
•Improve profitability through a revision of manufacturing processes and reduce inventories
5.4
8.06.5 6.6
((((Projection))))
Invar
6.55.4
((((1H)))) ((((1H)))) ((((1H))))((((2H)))) ((((2H)))) ((((2H))))
Sales (Billions of Yen)

*Numbers in parentheses refer to the first half of fiscal year
FY2002 FY2003 FY2004 FY2004
LifestyleLifestyle--RelatedRelated
21.421.321.421.8
17.417.417.717.5
6.76.86.96.4
FY2002 FY2003 FY2004 FY2004
45.7(23.8)
�First Half• Competition was fierce in principal wholesale routes and sales declined from the same period of the previous
year.
• Profits increased due to successful cost cutting measures.
�Priority Policies for the Second Half• Lower the breakeven point by reducing fixed asset costs, particularly through measures involving the reduction
of manufacturing costs
• Expect to launch of and see results from new products jointly developed with Air Water Living Inc., in the next period
• Augment response to renovation-related market, which is projected to continue growing
46.0(23.6) 45.5
(1.1)1.0
(1.0)
0.5(0.5)
0.8(0.8)
1.0
45.5(23.2)
Operating IncomeSales (Billions of Yen) (Billions of Yen)*Numbers in parentheses refer to the first half of fiscal year
((((Previous Projections))))
((((Previous Projections))))
((((Projections)))) ((((Projections))))
Bathrooms
System Kitchens
Others
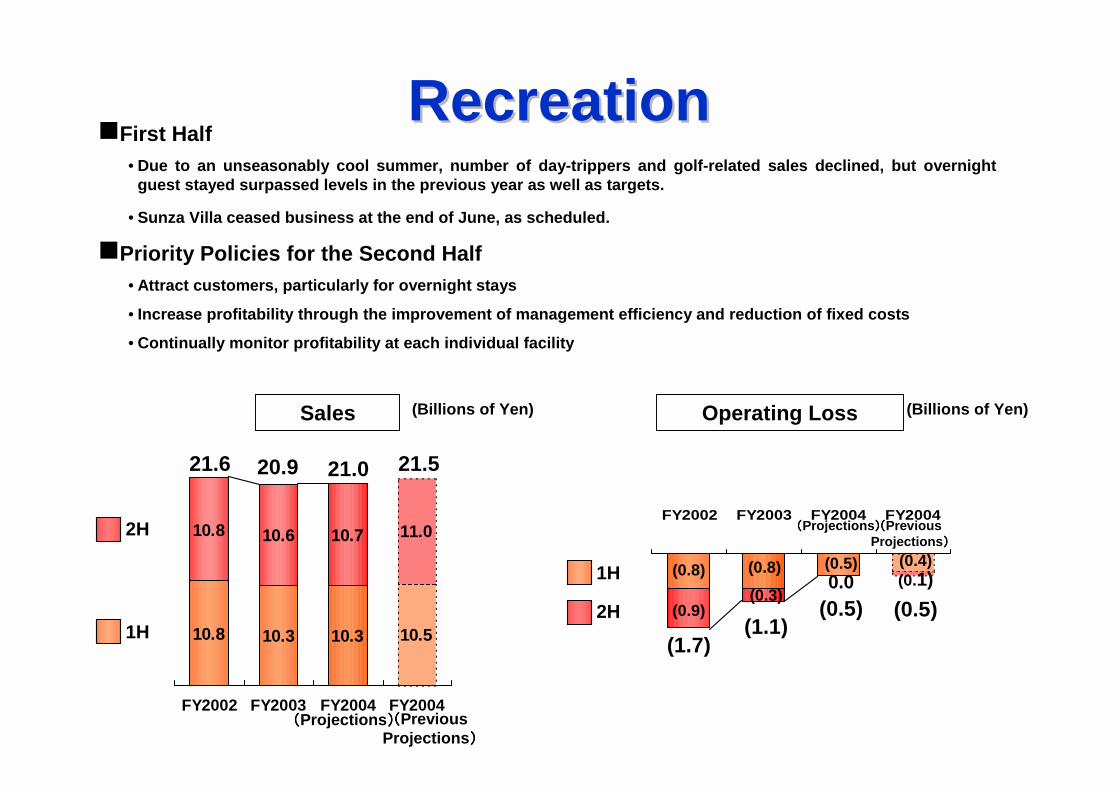
RecreationRecreation
10.510.310.310.8
11.010.710.610.8
FY2002 FY2003 FY2004 FY2004
21.6 20.9 21.5
FY2002 FY2003 FY2004 FY2004
(0.9)(0.3)
(0.5)
�First Half• Due to an unseasonably cool summer, number of day-trippers and golf-related sales declined, but overnight
guest stayed surpassed levels in the previous year as well as targets.
• Sunza Villa ceased business at the end of June, as scheduled.
�Priority Policies for the Second Half• Attract customers, particularly for overnight stays
• Increase profitability through the improvement of management efficiency and reduction of fixed costs
• Continually monitor profitability at each individual facility
(0.8) (0.8) (0.4)(0.1)
(1.7)(1.1)
(0.5) (0.5)
21.0
1H
2H
2H
1H 0.0
Operating LossSales (Billions of Yen) (Billions of Yen)
((((Previous Projections))))
((((Previous Projections))))
((((Projections))))
((((Projections))))

12.914.19.56.5
2.32.3
1.52.4
9.310.1
9.010.4
FY2002 FY2003 FY2004 FY2004
18.4(9.7)
26.5(13.3) 24.5
0.10.50.4
(0. 1)
0.2
0.00.1
(0.2)
FY2002 FY2003 FY2004 FY2004(0. 3)
0.3
OthersOthers�First Half• YAMAHA continued full-capacity production of Mg-molded parts for mobile phones.
• Income from automobile interior components increased compared with previous forecasts due to increased production.
• Profitability in golf operations was firm thanks to high market evaluations and commissioned manufacturing, which lowered costs.
�Priority Policies for the Second Half• Increase profitability of Mg-molded parts for mobile phones
• Ensure profitability in automobile interior components to accompany the increase in production expected to continue from the first half of the fiscal year
• Establish market for new golf products to be launched in December 2003
20.9(10.3)
((((Previous Projections))))
0.5
((((Previous Projections))))
0.5
1H
2H
((((Projections)))) ((((Projections))))
Operating Income/Loss
Sales (Billions of Yen) (Billions of Yen)*Numbers in parentheses refer to the first half of fiscal year
Other Businesses by Yamaha Fine Technologies Co., Ltd.
Golf Club
Automobile Interior Components
In this report, the figures forecast for the Company’s future performance have been calculated on the basis of information currently available to YAMAHA and the YAMAHA Group.
Forecasts are, therefore, subject to risks and uncertainties. Accordingly, our actual performance may differ greatly from our predictions depending on changes in our operating and economic environments, demand trends, and the value of key currencies, such as the U.S. dollar and the EURO.