Embed Size (px)
Citation preview

1San Diego Renewable Energy Society
February 20, 2008

2
Sempra’s vision: Baja LNG, Baja power plants, Sunrise Powerlink to Los Angeles

3
Sempra/SDG&E regional energy infrastructurenote: Sempra gas-fired power plants in western Arizona (1,250 MW), Las Vegas (480 MW), Kern County (550 MW) are not shown in graphic.

4
LNG - 25% increase in GHG emissions compared to domestic natural gas

5
Affect of LNG imports – no change in GHG emissions from power generation, 2007-2016bar chart source: SDG&E PowerPoint presentation to SANDAG Energy Working Group on long-term plan, January 25, 2007. Red line and yellow tag added by B. Powers.
6
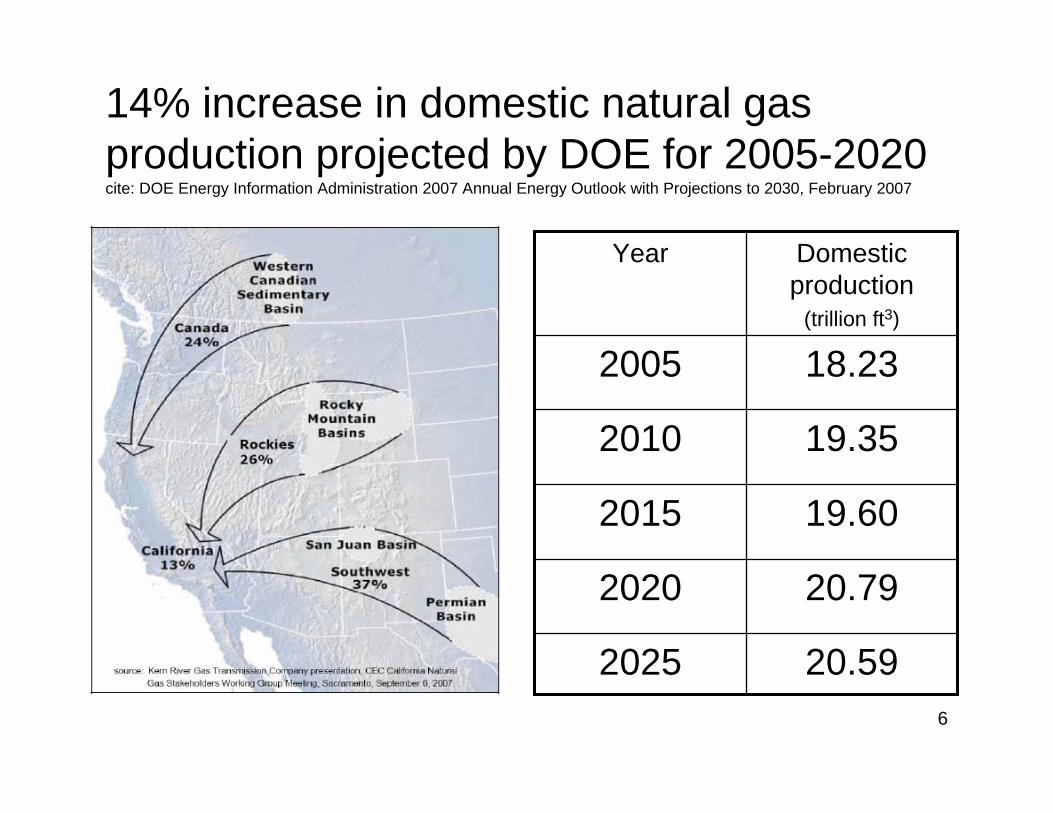
14% increase in domestic natural gas production projected by DOE for 2005-2020cite: DOE Energy Information Administration 2007 Annual Energy Outlook with Projections to 2030, February 2007
20.592025
20.792020
19.602015
19.352010
18.232005
Domestic production
(trillion ft3)
Year

7
Drivers Behind Smart Energy 2020● “There’s an ongoing schizophrenia in state energy policy
between what we say we want to do and what we actually allow to happen,” CEC’s John Geesman, May 2007.
● AB 32, Global Warming Solutions Act: 25% reduction in CO2 by 2020, 80% by 2050.
● CPUC/CEC Energy Action Plan: priority “loading” order –maximum energy efficiency, renewable energy (solar, wind, geothermal), clean distributed energy first, only then conventional power plants and high voltage transmission.
● San Diego Regional Energy Strategy 2030: increase local power to 75% by 2020; 25% renewable energy by 2020 and 40% by 2030, at least 50% of renewables in-county; add 700 MW of combined heat and power by 2020.

8
Problems with Sunrise Powerlink• Drain on limited resources: $7 billion (2010 dollars) over 40
years, more power imports, no guarantee it will carry renewable power. Money will not be available for smart energy solutions.
• Contrary to state’s Energy Action Plan loading order: SDG&E puts new transmission first, Energy Action Plan puts new transmission last.
• Conflicts with San Diego Regional Energy Strategy (RES) 2030: RES 2030 put increased local generation first. Local generation will drop if Sunrise is built.
• Route will cause many negative impacts: CPUC January 2008 environmental impact study rated Sunrise near last due to high number of unavoidable environmental impacts. Local generation was ranked first.

9
Themes of San Diego Smart Energy 2020
● Global warming is the issue of our time - we must achieve the maximum economically feasible reduction of greenhouse gases as rapidly as we can.
● Energy independence – minimize reliance on power imports, natural gas, and liquefied natural gas (LNG).
● Stay within the known world – proven, achievable measures - in establishing specific Smart Energy 2020 targets.

10
Implementing San Diego Smart Energy 2020● Step 1: Realign SDG&E financial incentives to match
Energy Action Plan priorities.● Step 2: Achieve absolute reduction of 20 percent in
annual energy consumption by 2020.● Step 3: Achieve absolute reduction of 25 percent in peak
demand by 2020.● Step 4: Achieve 50 percent reduction in greenhouse gas
emissions from power generation by 2020 through use of local PV and combined heat and power generation.
● Step 5: Prioritize modernization of the 1950s-vintage electrical distribution system to maximize potential benefits of smart meters.
● Step 6: Assure new construction in San Diego incorporates state-of-the-art green building principles and sufficient solar PV to meet own electricity demand.

11
20% reduction in energy demand below 2003 baseline via energy efficiency
● Strategic energy planning is driven by increasing peak power demand in California. SDG&E forecasts 61 MW per year increase. This is a/the major justification for the Sunrise Powerlink project.
● California utilities have achieved only 10% of cost-effective energy efficiency reductions.
● Energy Action Plan requires state buildings to reduce grid power purchases to 20% below 2003 levels by 2015.
● City of San Diego has achieved average reduction of 20% on more than 50 projects.
● Full development of economic energy efficiency measures (air conditioning, insulation, lighting, refrigeration) would reduce annual energy demand by about 20% in SDG&E service territory by 2020.

12
Energy Efficiency – electricity demand growth drops to zero by 2016 with moderate effort (pink), drops by 14% by 2016 with aggressive cost-effective effort (red)
13
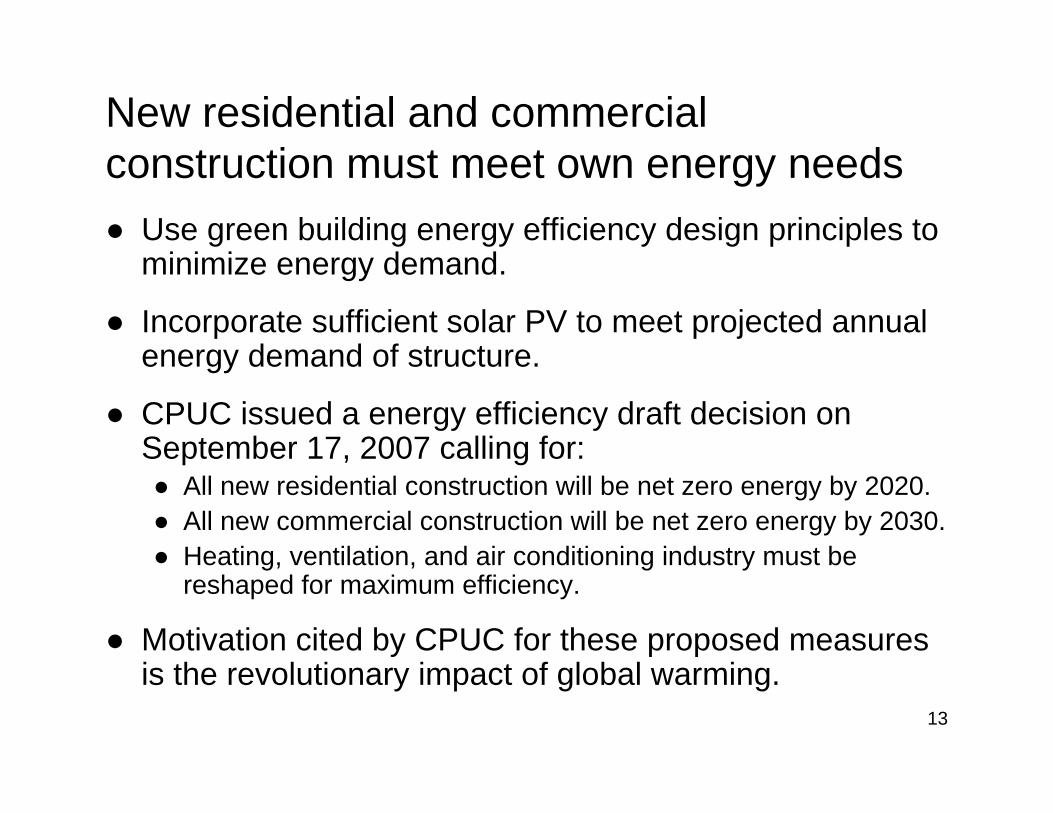
New residential and commercial construction must meet own energy needs● Use green building energy efficiency design principles to
minimize energy demand.
● Incorporate sufficient solar PV to meet projected annual energy demand of structure.
● CPUC issued a energy efficiency draft decision on September 17, 2007 calling for:● All new residential construction will be net zero energy by 2020.● All new commercial construction will be net zero energy by 2030.● Heating, ventilation, and air conditioning industry must be
reshaped for maximum efficiency.
● Motivation cited by CPUC for these proposed measures is the revolutionary impact of global warming.

14
Energy savings potential of off-the-self, cost-effective equipment
20Completely driven by federal efficiency standards – some high efficiency units for use with solar PV
Refrigeration
60Phase-out of incandescent bulbs by 2012 – proposed in AB 722 (Levine)
Lighting
50+Air conditioning(average efficiency is SEER 10, commercially available at 20% cost premium is SEER 21)
Energy savings (%)
ActionEquipment

15
25% reduction in peak power demand through demand response actions● All SDG&E customers will receive digital “smart meters”
by 2011 – estimated 5% reduction in peak demand as a result of smart meters.
● Air conditioning load is 35% of total energy demand on hot summer days.
● No SDG&E efficiency incentives for workhouse central air conditioning units.
● State-of-art, off-the-shelf central A/C uses ½ the power but costs only 10 – 20% more than basic models.
● Utility incentives should be directed at ensuring all new central A/C in hot parts of San Diego County is state-of-the-art.

16
San Diego Solar Initiative - 40% of new power added by 2020 is solar PV
• 2,000 MW, mostly large commercial PV systems with $1.5 billion incentive budget. 900 MW with limited $700 million budget.
• San Diego Solar Initiative incentive concept modeled on California Solar Initiative, 3,000 MW by 2017.
• Germany has installed as much as 1,000 MW per year of PV.
• PV systems would be equipped with limited battery storage to provide full output during afternoon peak.
• 3rd party long-term power purchase agreements using handful of large PV system providers.
• Example: City of San Diego’s Alvarado Water Treatment Plant - 965 kW, City pays $0.12/kWh for solar power to 3rd party, otherwise pays SDG&E $0.17/kWh.

17
How PV can compete with conventional natural gas-fired power in 2007Large commercial PV, greater
than 100 kW:• $8/watt installed (AC), 2007.• Existing 30% federal tax credit.• Tax code allows accelerated
depreciation for commercial PV systems, equals 28% credit.
• Private financing, 6% interest, 30 years.
• Assume no incentive.• No fuel cost.• Power production: 1.5 kWh-yr per
direct current watt.• Average cost of electricity over 30
years in 2007 dollars: ~$0.17/kWh.
Conventional natural gas-fired generation:
• Cost to build natural gas fired generation is low, $1/watt in 2007.
• However, more than 75%of the cost of electricity from natural gas-fired generation is fuel cost.
• SDG&E energy tariff to commercial customers, 2007: ~0.17/kWh.
18
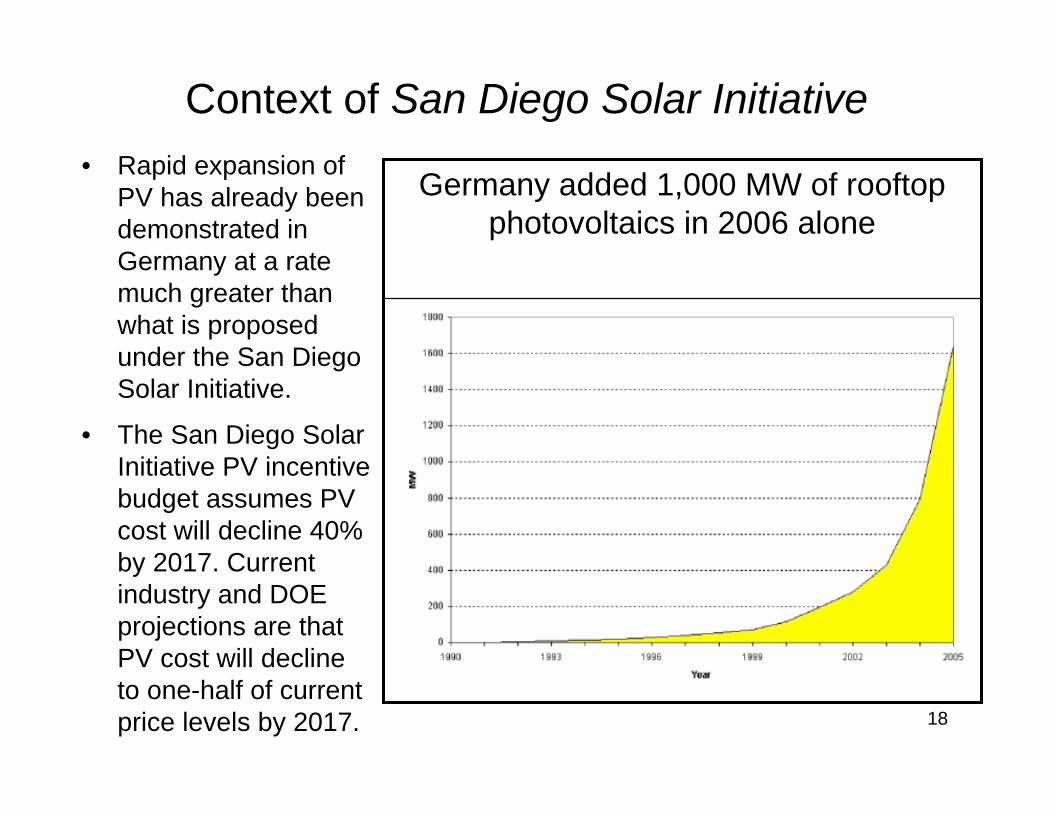
Context of San Diego Solar Initiative• Rapid expansion of
PV has already been demonstrated in Germany at a rate much greater than what is proposed under the San Diego Solar Initiative.
• The San Diego Solar Initiative PV incentive budget assumes PV cost will decline 40% by 2017. Current industry and DOE projections are that PV cost will decline to one-half of current price levels by 2017.
Germany added 1,000 MW of rooftop photovoltaics in 2006 alone
19
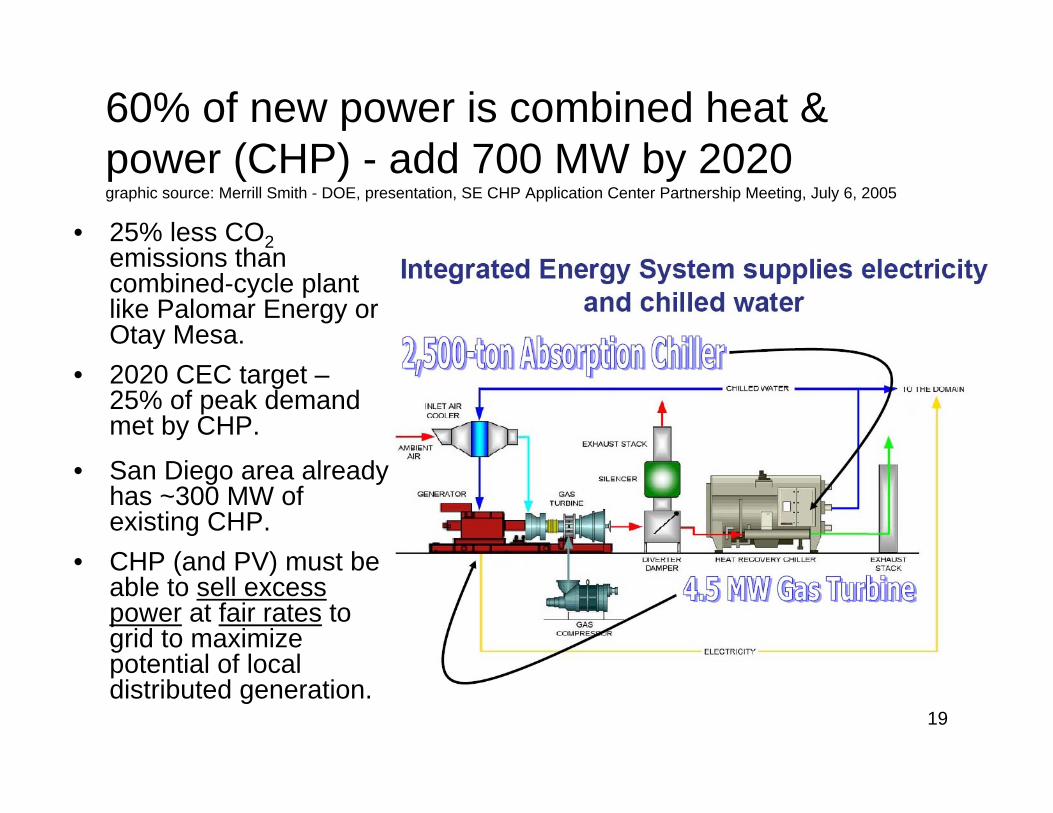
60% of new power is combined heat & power (CHP) - add 700 MW by 2020 graphic source: Merrill Smith - DOE, presentation, SE CHP Application Center Partnership Meeting, July 6, 2005
• 25% less CO2emissions than combined-cycle plant like Palomar Energy or Otay Mesa.
• 2020 CEC target –25% of peak demand met by CHP.
• San Diego area already has ~300 MW of existing CHP.
• CHP (and PV) must be able to sell excess power at fair rates to grid to maximize potential of local distributed generation.

20
Combined heat & power – lowest CO2 emissions, energy savings, good for local economysource: Solar Turbines cogeneration project case studies - http://mysolar.cat.com/cda/layout?m=41110&x=7
26 MW UCSD CHP• plant provides up to 90% of
campus electricity and 75% of steam demand.
• UCSD saves nearly $250,000 per month by producing its energy instead of purchasing from SDG&E.
5 MW Veteran’s Hospital CHP• contract guarantees $1.3 million
per year in savings.• new turbine installed in same
building that housed old turbines.

21
Sufficient distributed generation – answer to blackouts during firestorms
• SDG&E does not have sufficient local generation to become an electrical “island” under high demand conditions.
• Blackouts will occur if firestorms causing multiple transmission outages and high electricity demand occur at same time.
• SDG&E long-term plan will rely on more imports and less local generation, increasing San Diego’s vulnerability during major fire events.
• The large increase in local distributed generation capacity under Smart Energy 2020 will maximize system reliability during major fire events, and will ensure sufficient internal generation to permit SDG&E to “island” without risking blackouts.

22
Existing and proposed regional transmission infrastructurecite: Robert Jackson, SDG&E Transmission Feasibility Study Status Report, STEP meeting, August 9, 2005.

23
Level of SDG&E electricity imports is already high at 67 percent
67Total 2007 imports:
4Renewable energy
9Large hydroelectric
20Nuclear (San Onofre)
12Coal
22Natural gas – DWR long-term contracts
Percentage of total SDG&E power sales, 2007 (%)
Import source

24
Top priority should be upgrading the existing distribution and transmission systems
• Replace 1950s era distribution system to reduce frequency of equipment failures, O&M, and to maximize benefits of smart meters.
• Emphasis on local generation reduces import load on existing transmission lines – frees lines for emergency use and renewable energy imports.
• Reinforce existing lines - capacity of north-south and east-west lines high voltage lines can be increased by 550 MW for one-tenth the cost of the 1,000 MW Sunrise Powerlink.

25
$1.5 billion San Diego Smart Energy 2020 compared to SDG&E strategic plan
2562Percentage of renewable energy (%) generated in San Diego County
8,800,0003,300,0002020 GHG emissions assuming liquefied natural gas (tons CO2)
7,100,0002,600,0002020 GHG emissions assuming domestic natural gas (tons CO2)
3603,030New local generation available at peak demand (MW)
1850Percentage renewable energy (%)
5,0603,5002020 peak demand (MW)
24,67916,0002020 annual energy need (GWh)
SDG&E Strategic Plan
San Diego Smart Energy 2020

26
$700 million San Diego Smart Energy 2020 compared to SDG&E strategic plan
2548Percentage of renewable energy (%) generated in San Diego County
8,800,0004,400,0002020 GHG emissions assuming liquefied natural gas (tons CO2)
7,100,0003,500,0002020 GHG emissions assuming domestic natural gas (tons CO2)
3601,910New local generation available at peak demand (MW)
1836Percentage renewable energy (%)
5,0603,5002020 peak demand (MW)
24,67916,0002020 annual energy need (GWh)
SDG&E Strategic Plan
San Diego Smart Energy 2020

27
Renewable wind, solar, and geothermal energy imports are a potential tool in Smart Energy 2020 (NREL map of best solar insolation sites in California)
28
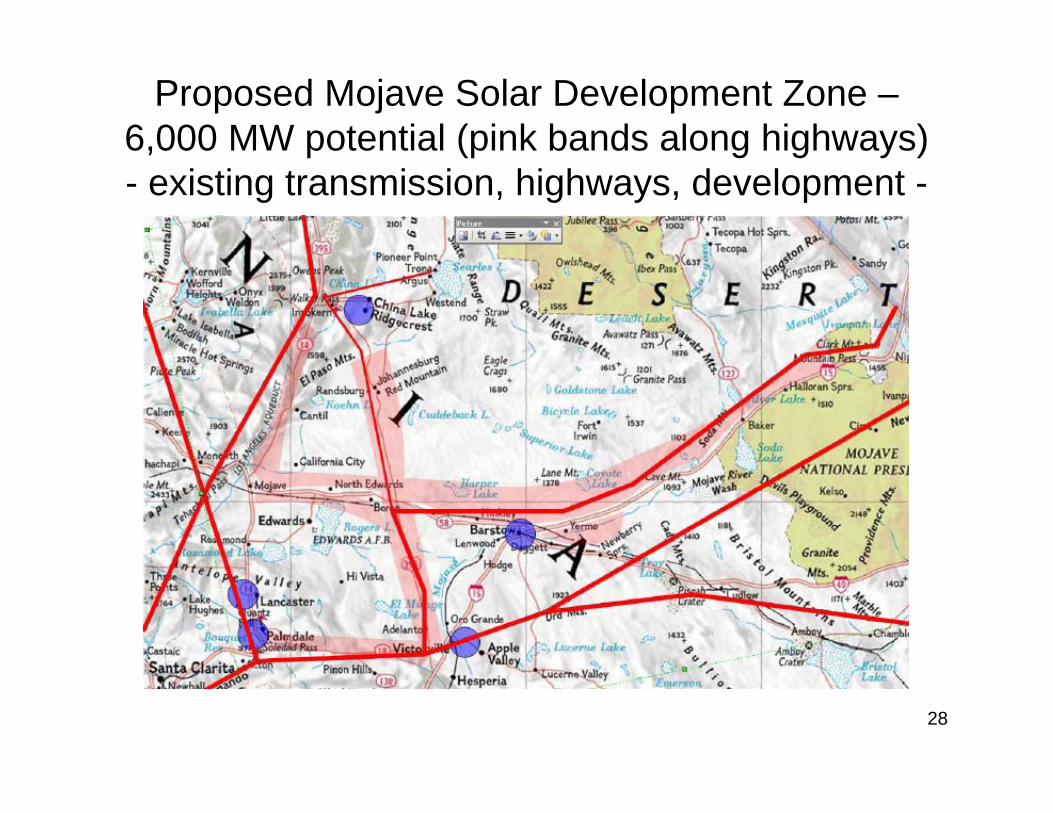
Proposed Mojave Solar Development Zone –6,000 MW potential (pink bands along highways)- existing transmission, highways, development -

29
Regional wind and geothermal resources are good – major transmission already in place
Imperial County geothermal resource
San Diego County wind resource

30
San Diego County renewable energy parks along existing 69 kV lines (blue) – part of the renewable energy solution
31
Emphasis on local power generation frees existing transmission lines to move renewable energy –minimum environmental controversy
• San Diego already has transmission import capacity in excess of 100% of the region’s peak electricity demand.
• In 2007, the region imported 67% of its electric energy needs.
• New transmission lines are costly and controversial.
• Increased use of local renewable and high efficiency natural gas resources reduces use of existing transmission lines.
• Reliance on existing transmission eliminates major cost, environmental, and timing constraints to remote renewable energy sites.

32
Renewable Energy Transmission Initiative
• Sponsored by California Energy Commission (CEC)
• CEC permits all energy projects over 50 MW
• Purpose of RETI is to prioritize renewable energy development areas and identify transmission needs to connect these areas to load centers
• http://www.energy.ca.gov/reti/
33
Obstacles to Implementation of San Diego Smart Energy 2020● Utility profits come primarily from building major capital
projects, like the Sunrise Powerlink, a major power plant, or the smart meter installation program.
● For example, the Sunrise Powerlink will cost $7 billion over 40 years, of which over $700 million is guaranteed profit.
● This profit will be received regardless of how much or how little the line is actually used.
● Utility parent company Sempra is also heavily invested in expanding liquefied natural gas consumption.
34
Institutional steps necessary to implement San Diego Smart Energy 2020
● Within existing utility structure: Put energy efficiency, solar, and combined heat and power projects on higher profit footing than traditional utility infrastructure projects.Energy efficiency projects were put on equal footing in September 2007 by the CPUC.
OR,
● Form a public utility, as San Francisco and San Joaquin Valley cities have done under California’s community choice aggregation legislation, and assume responsibility for power generation.

35
Conclusions
● The challenge to successfully implementing San Diego Smart Energy 2020 is not technical or economic, it is institutional.
● Utility incentives must be aligned with the Energy Action Plan loading order. For example, with the PUC’s new energy efficiency policy, SDG&E can make as much profit eliminating 1,000 MW of demand through energy efficiency programs as it can by building the 1,000 MW Sunrise Powerlink.
● A fraction of the $7 billion Sunrise Powerlink will cost would convert San Diego County into a world leader in addressing climate change and dramatically reduce our dependence on natural gas for power generation.