Embed Size (px)
Citation preview
1FinScope Tanzania 2017: Dedicated Farmers
17DEDICATEDFARMERS:Their Needs How can they be served? FinScope Tanzania 2017Agriculture Niche Report
20

2 FinScope Tanzania 2017: Dedicated Farmers 3FinScope Tanzania 2017: Dedicated Farmers
1. INTRODUCTION
2. SEGMENTATION
3. ANALYSIS
SECTION 1: DEMOGRAPHICS
SECTION 2: ADDRESSABILITY
SECTION 3: FINANCIAL BEHAVIOUR
SECTION 4: FINANCIAL INCLUSION (UPTAKE AND USAGE)
SECTION 5: DEDICATED FARMERS IN THE SAGCOT REGION
ANNEX 1: INCOME OF DEDICATED FARMERS IN TANZANIA
ANNEX 2: GEOGRAPHIC DISTRIBUTION OF FINANCIALLY
EXCLUDED FARMERS
ANNEX 3: FINANCIAL INCLUSION OF SMALL, MEDIUM AND
LARGE-SCALE FARMERS
Table of Contents
ACKNOWLEDGMENTSResearch design, data analysis and report by Financial Sector Deepening Trust, MercyCorps AgriFin Accelerate and Nathan Associates
FSDT - Sosthenes Kewe, Elvis Mushi, Mwombeki Baregu, Samora Lupalla and Julia Seifert
MercyCorps – Paul Kweheria, Collins Marita, Andrew Karlyn
Nathan - Enrico Neumann, Ramesh Karuppusamy, Katherine Hughes and Jincy Elizabeth Francis
GLOSSARY
AMCOS Agricultural Marketing SocietyBOT Bank of TanzaniaFSP Financial Service ProviderMFI Microfinance InstitutionMoF Ministry of Finance and PlanningNBS National Bureau of StatisticsNHIF National Health Insurance FundOCGS Office of the Chief Government Statistician - ZanzibarSACCO Savings and Credit Cooperative Organisation SAGCOT Southern Agricultural Corridor of TanzaniaWRS Warehouse Receipt System
4 FinScope Tanzania 2017: Dedicated Farmers 5FinScope Tanzania 2017: Dedicated Farmers
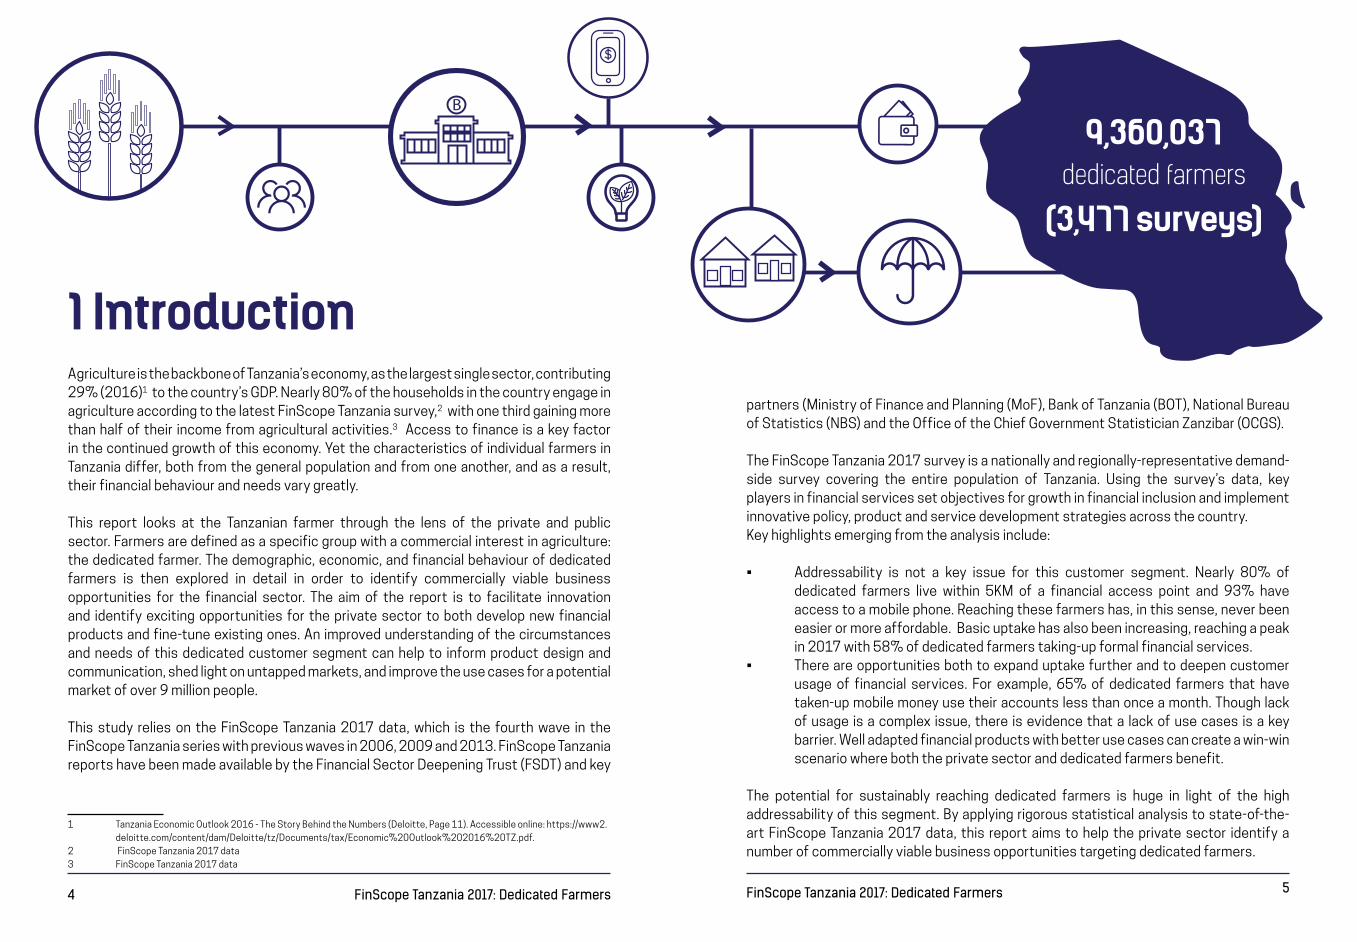
1 IntroductionAgriculture is the backbone of Tanzania’s economy, as the largest single sector, contributing 29% (2016)1 to the country’s GDP. Nearly 80% of the households in the country engage in agriculture according to the latest FinScope Tanzania survey,2 with one third gaining more than half of their income from agricultural activities.3 Access to finance is a key factor in the continued growth of this economy. Yet the characteristics of individual farmers in Tanzania differ, both from the general population and from one another, and as a result, their financial behaviour and needs vary greatly.
This report looks at the Tanzanian farmer through the lens of the private and public sector. Farmers are defined as a specific group with a commercial interest in agriculture: the dedicated farmer. The demographic, economic, and financial behaviour of dedicated farmers is then explored in detail in order to identify commercially viable business opportunities for the financial sector. The aim of the report is to facilitate innovation and identify exciting opportunities for the private sector to both develop new financial products and fine-tune existing ones. An improved understanding of the circumstances and needs of this dedicated customer segment can help to inform product design and communication, shed light on untapped markets, and improve the use cases for a potential market of over 9 million people.
This study relies on the FinScope Tanzania 2017 data, which is the fourth wave in the FinScope Tanzania series with previous waves in 2006, 2009 and 2013. FinScope Tanzaniareports have been made available by the Financial Sector Deepening Trust (FSDT) and key
1 Tanzania Economic Outlook 2016 - The Story Behind the Numbers (Deloitte, Page 11). Accessible online: https://www2.deloitte.com/content/dam/Deloitte/tz/Documents/tax/Economic%20Outlook%202016%20TZ.pdf.
2 FinScope Tanzania 2017 data3 FinScope Tanzania 2017 data
partners (Ministry of Finance and Planning (MoF), Bank of Tanzania (BOT), National Bureau of Statistics (NBS) and the Office of the Chief Government Statistician Zanzibar (OCGS).
The FinScope Tanzania 2017 survey is a nationally and regionally-representative demand-side survey covering the entire population of Tanzania. Using the survey’s data, key players in financial services set objectives for growth in financial inclusion and implement innovative policy, product and service development strategies across the country.Key highlights emerging from the analysis include:
• Addressability is not a key issue for this customer segment. Nearly 80% of dedicated farmers live within 5KM of a financial access point and 93% have access to a mobile phone. Reaching these farmers has, in this sense, never been easier or more affordable. Basic uptake has also been increasing, reaching a peak in 2017 with 58% of dedicated farmers taking-up formal financial services.
• There are opportunities both to expand uptake further and to deepen customer usage of financial services. For example, 65% of dedicated farmers that have taken-up mobile money use their accounts less than once a month. Though lack of usage is a complex issue, there is evidence that a lack of use cases is a key barrier. Well adapted financial products with better use cases can create a win-win scenario where both the private sector and dedicated farmers benefit.
The potential for sustainably reaching dedicated farmers is huge in light of the high addressability of this segment. By applying rigorous statistical analysis to state-of-the-art FinScope Tanzania 2017 data, this report aims to help the private sector identify a number of commercially viable business opportunities targeting dedicated farmers.
S
B
9,360,037dedicated farmers
(3,477 surveys)

6 FinScope Tanzania 2017: Dedicated Farmers 7FinScope Tanzania 2017: Dedicated Farmers
2 Segmentation

8 FinScope Tanzania 2017: Dedicated Farmers 9FinScope Tanzania 2017: Dedicated Farmers
According to the FinScope 2017 data, more than 3 out of 4 Tanzanian households (79%) are engaged in agriculture. This number includes households that grow crops in the backyard to supplement domestic consumption, and farming is therefore not always a core activity for them. To narrow Tanzanian farmers down to those that focus on agriculture as their main source of income – i.e. farmers that are dedicated to agriculture and keen to invest in agriculture on a commercial basis – the overall data was broken down into sub-segments. This study defines a sub-group of households engaged in agriculture as dedicated farmers, namely those whose income from agriculture contributes to a significant portion (>50%) of the total household income. These farmers may or may not have a personal preference for agriculture, but as derived from the data the majority of their income is derived from agriculture. Traders and retailers of agriproducts have been excluded from the definition in order to enable a specific focus on farmers that grow and sell their own products.
Applying this definition yields a sub-group of dedicated farmers that make-up 34% of the overall Tanzanian adult population (Figure 1), adding-up to 9.36 million farmers across Tanzania, 2.34 million of which (or 25%) are based in the Southern Agricultural Corridor of Tanzania (SAGCOT) region. These 9.36 million dedicated farmers are the focus of this report.
Although dedicated farmers are spread across the country, analysing the regional distribution across Tanzania shows that regions such as Dodoma, Geita, Morogoro, Kagera and Mtwara have a higher number of dedicated farmers than other regions (Figure 2). Together, these regions (outlined in blue) account for nearly 27% (or 2.5m) of dedicated farmers in the country. The SAGCOT region4 (outlined in red) houses 21.8% of Tanzania’s dedicated farmers.
4 SAGCOT region comprises of Iringa, Njombe, Mbeya, Morogoro, Songwe, Rukwa, Katavi, Ruvuma
Note that throughout this study, dedicated farmers across Tanzania are compared with dedicated farmers from the SAGCOT region and the ‘average Tanzanian’. This is helpful to understand how dedicated farmers compare to other populations and the nature of their special characteristics.
The average Tanzanian: The entire sample data from FinScope, which are representative of the entire Tanzanian population, is taken as a benchmark of the behaviour of the average Tanzanian.
Dedicated farmers from SAGCOT: This segment includes only those dedicated farmers that live in the SAGCOT region.
Figure 1: Proportion of Dedicated Farmers in Tanzania
Figure 2: Regional Distribution of Dedicated Farmers
SAGCOT Region
10,939 541,190
Dedicated Farmers Other Population
66%
34%
9,360,037dedicated farmers
(3,477 surveys)
Source: FinScope Tanzania 2017

10 FinScope Tanzania 2017: Dedicated Farmers 11FinScope Tanzania 2017: Dedicated Farmers
3 Analysis

12 FinScope Tanzania 2017: Dedicated Farmers 13FinScope Tanzania 2017: Dedicated Farmers
This section presents the key demographic characteristics of the dedicated farmer segment. Understanding factors such as gender, age, location, education and income are crucial to designing products and services that look to address the specific use cases of the 9.36m dedicated farmers across Tanzania.
Of the dedicated farmers in Tanzania, 87% live in rural areas, implying that out of every 10, nearly 9 live in rural areas (Figure 3). A slightly larger portion of dedicated farmers in SAGCOT region live in urban areas compared to the overall dedicated farmers in the country. This could be a sign of SAGCOT farmers moving to cities to supply essential food crops to urban markets. These farmers can be an interesting segment for Financial Service Providers (FSPs) to service, as they are closer to the established financial infrastructure.
SECTION 1: DEMOGRAPHICS
Understanding the level of education among potential clients, particularly for financial literacy, supports FSPs to design and market products responsibly, and enhance long term client retention. Less than 1 in every 10 dedicated farmers have attended secondary education (Figure 4) – which is less than the average Tanzanian.
FACT 1 FACT 2A
Figure 3: Rural Urban Split of Dedicated Farmers
dedicated farmers live in rural areas attainment among dedicated
farmers is limited
Most Educational
Urban
Rural
22%
78%
13%
87%
Source: FinScope Tanzania 2017
Dedicated Farmers in SAGCOT Region All Dedicated Farmers
Tertiary
Secondary
Primary completed
No formal education
3%
18%
65%
1%
8%
Chart 4: Highest Level of Education
Source: FinScope Tanzania 2017
73%
15%18%
Overall Population All Dedicated Farmers

14 FinScope Tanzania 2017: Dedicated Farmers 15FinScope Tanzania 2017: Dedicated Farmers
Education levels are high for men (14%), where only every 7th man does not have any formal education. This is important to realise for FSPs, since for women that have not received any form of education, the likelihood of uptake is lower. To overcome this challenge, reliance on appropriate measures, for example, a simple interface with clear, straightforward instructions, is key to communicating the different functions of a product to groups with low education levels.
Only 17% dedicated farmers are aged between 16 and 24, in comparison to 26% in the overall population (Figure 6). Most dedicated farmers are between 25 and 54 years old, with an average age of slightly over 40 years. This is greater than the average age of Tanzanians of around 37.
Age can often be a determinant of different lifestyle choices, financial needs, and aspirations, creating an average life cycle which FSPs can refer to when they design and market appropriate products. Knowing which age group to target helps to narrow the focus of the product design. For example, older clients may be interested in products carrying lower risk, i.e. long-term savings products or insurance, while middle-aged clients are more inclined to make significant investments in their businesses. Younger clients may be interested in short term loans as well as savings products.
of dedicated female farmers don’t have any formal education
Dedicated farmers areAlmost a quarterolder than the average Tanzanian,(23%) OLDER
especially SAGCOT farmers
FACT 2B FACT 3
Chart 5: Highest Level of Achieved of Dedicated Farmers by Gender
Chart 6: Age Distribution of Dedicated Farmers Primary
No Formal Education
70%
17%
23%
76%
14%
Female Male
Only every 7th man does not have any formal education.
14%
26%24%
22%19% 18%18%
14%
10% 10%7%
9% 8%7%
27%24%
26%
All Dedicated Farmers Dedicated Farmers in SAGCOT Region Overall Population
Source: FinScope Tanzania 2017
Source: FinScope Tanzania 2017
Age 16 to 24 Age 25 to 34 Age 35 to 44 Age 45 to 54 Age 55 to 64 Above 65

16 FinScope Tanzania 2017: Dedicated Farmers 17FinScope Tanzania 2017: Dedicated Farmers
Live! From the Market 1:
Understanding disposable income and financial pressure points can assist FSPs in determining the cost and commercial viability of their products for a particular segment. The average monthly income of dedicated farmers from sales of their produce5 is about TZS 135,628, which is 13% lower than the national average (median income is much lower - TZS 50,000). The average is however skewed by a small group of very successful, large-scale farmers and nearly 64% of all dedicated farmers in the country still earn less than TZS 2,500 a day (Figure 7). This finding has important implications for FSPs.
5 Note that this does not include in-kind income or crops that farmers consume, but only the amount of cash income from selling agriculture produce.
An inappropriate slab-based fee structure can be a significant barrier to dedicated farmers that are looking to transfer small amounts of money. Addressing this barrier however could unlock a large quantity of transactions, with the associated returns to scale. See also Live! From the Market 1 below.
Interoperability can reduce transaction costs
Interoperability between mobile network operators such as Tigo, Airtel, Tigo, TTCL and Zantel, is one example where partnerships are aiming to increase utilisation of mobile money services by reducing transaction costs, simplifying transactions and adding speed and convenience to their customers’ daily routines. A regulatory shift to reduce the barriers for similar partnerships and interoperability between FSPs and non-FSPs could lead to a national switch in the reduction of transaction costs. This would also encourage more financial innovations that offer more services to smallholder farmers at a lower cost. Source: FinScope Tanzania 2017
FACT 4Dedicated farmers
earn lessthan the average Tanzanian
Chart 7: Income Distribution of Dedicated Farmers
Above 6,000/day
64% < TZS 2,500/day
4,000/day and6,000/day
2,500/day and4,000/day
1,250/day and2,500/day
Below 1,250/day
16%
8%
13%
23%
41%
Dedicated Farmers
Low incomes need to be considered when structuring financial products – especially when structuring transaction fees.

18 FinScope Tanzania 2017: Dedicated Farmers 19FinScope Tanzania 2017: Dedicated Farmers
As shown above, dedicated farmers are a diverse group with varying incomes. It is important for the private sector to better understand the composition of this group. Therefore, dedicated farmers have been further segmented into small, medium, and large-scale farmers based on their monthly income.6, 7 More than three-quarters of the dedicated farmers in Tanzania are small-scale with an average income of TZS 39,549 per month (Figure 8). The size of these three distinct groups, as well as the average income, needs to be considered by financial service providers (FSPs) when tailoring products to the respective segments.
While medium and large-scale farmers could benefit from long-term loans, small-scale farmers should be encouraged to engage more frequently with financial systems, hence transaction costs for small volume transactions should be revisited. Large-scale farmers, which only account for 7% of the dedicated farmers on the other hand, present an interesting target market for MSME-lending, considering that they earn more than TZS 1 million.
6 Ward’s Linkage clustering method was used to segment the dedicated farmers into small, medium and large categories. Small farmers were defined as those with monthly income less than TZS 114,192. Medium scale farmers had monthly income more than TZS 114,192 but less than TZS 358,251, and the monthly income of large-scale farmers was more than TZS 358,251.
7 Income was used for segmentation since farm size does not always predict income and productivity well. Consider for example that highly productive greenhouses can generate high income and yield on a relatively small farm size.
93% of the dedicated farmers in Tanzania produce food crops, 59% are engaged in livestock, and only 38% produce cash crops (Figure 9)8. As might be expected, average income from sales of produce9 is highest for farmers engaged in production of cash crops, followed by those engaged in livestock; average income is lowest for farmers producing food crops.10 The median income of farmers engaged in production of cash crops and livestock is the same, but is lower in the case of farmers engaged in food crops. The lower income of farmers producing food crops could be due to farmers consuming part of their own produce. While this lowers the output available for sale in the market, it also reduces the amount of food they need to purchase from the market.
8 Food crops include food crops and vegetables, cash crops include cash crops, beekeeping, and fruit and livestock include cattle, goats, fishing and other livestock.
9 Note that this does not include in-kind income or crops that farmers consume, but only the amount of cash income from selling agriculture produce.
10 In order to obtain average monthly income, 11 farmers who earn more than TZS 25,000,000 per month were removed as outliers
Medium and large-scale farmers could benefit from long-term loans to finance inputs and investment, leasing solutions for machinery, or digital solutions for value chain financing.
FACT 5 FACT 6Different segments of dedicated farmers have huge variations in their monthly incomes
Farmers that grow cash crops
have higher incomes
Chart 8: Segmentation of Dedicated Farmers by Size
Chart 9a: Percentage of Farmers Engaging in Different Livelihoods and Average Monthly Incomes
Average income: TZS 39,549
100% 180,000160,000140,000120,000100,00080,00060,00040,00020,0000
Perc
enta
ges
Mea
n In
com
e in
(TZS
)
75%
50%
25%
0%Food Crops Cash CropsLivestock
Average income: TZS 201,359
Average income: TZS 1,032,616
Source: FinScope Tanzania 2017
Source: FinScope Tanzania 2017
Small
Medium
Large
76%
17%
7%
93%
59%
38%
132,841
135,827
167,663
Percentage All Dedicated Farmers Mean Income All Dedicated Farmers

20 FinScope Tanzania 2017: Dedicated Farmers 21FinScope Tanzania 2017: Dedicated Farmers
20%
1% 5%
15% 34%23%
2%
Chart 9b: Dedicated farmers involved in farming activities and average income of subgroups
Chart 10: Percentage of Small, Medium and Large-Scale Dedicated Farmers Engaging in Different Livelihoods
100% Value chains of SMALL dedicated farmers
Value chains of SMALL dedicated farmers
Value chains of MEDIUM dedicated farmers
Value chains of LARGE dedicated farmers
Value chains of MEDIUM dedicated farmers
180,000160,000140,000120,000100,00080,00060,00040,00020,0000
Perc
enta
ges
Mea
n In
com
e in
(TZS
)
75%
50%
25%
0%Food Crops Cash CropsLivestock
Source: FinScope Tanzania 2017
Source: FinScope Tanzania 2017
93%
59%
38%
132,841
48,000 50,000 50,000
135,827
167,663
Percentage All Dedicated Farmers
Food Crops
LivestockCash Crops
Food Crops and Livestock Food Crops Only All Three
Food Crops and Cash Crops Livestock Only Cash Crops Only Cash Crops and Livestock
Mean Income All Dedicated Farmers
Median Income All Dedicated Farmers
Small-scale farmers focus more on food crops while medium and large-scale farmers focus more on cash crops
FACT 7
The correlation between income and cash crops can also be seen in the case of small, medium and large-scale farmers. The percentage of farmers engaged in only food crops is highest among small-scale farmers, followed by medium-scale farmers; it is the lowest among large-scale farmers (Figure 10). The opposite is observed in the case of percentage of farmers engaged in both food and cash crops – it is highest among large-scale farmers, followed by medium and small-scale farmers. As the income of farmers increases, the focus shifts from only food crops to both food and cash crops. Access to financial services for small-scale dedicated farmers could, for example, enable them to shift from production of only food crops to include cash crops, which would eventually translate to higher income, liquidity and likelihood of repayment.
29%
2% 2%
11% 32%24%
1%
Value chains of LARGE dedicated farmers
15%
3% 4%
20% 34%23%
1%
32%
29%
24%
11%
2%2% 1%
34% 34%
20% 15%
23%23%
15%20%
5% 4%1% 1%2% 3%
Tailor repayment terms to the agricultural cycle of specific crops to mirror the cash flow periods of farmers and increase the likelihood of repayment

22 FinScope Tanzania 2017: Dedicated Farmers 23FinScope Tanzania 2017: Dedicated Farmers
FACT 8Land size, additional labour on-farm and overall productivity varies for small, medium and large-scale farmers
Small, medium, and large-scale farmers also differ in terms of their available land size (Figure 11) and additional labour engaged by them for farming activities (Figure 12) which are key factors in determining efficiency and scale, and potential growth of an agri-business.
Hence, land size is not always the barrier to improved livelihoods. Greenhouses, for example, offer higher efficiency and can be operational on land sizes available even to small or medium sized farms.
It would be important to conduct further research to understand the source of the difference in productivity between small, medium and large-scale farmers so that tailored products can be developed to address these factors and align credit scoring. One factor could be the level of mechanisation and application of modern technologies, demand for which could be addressed through leasing products.
Chart 11: Average Land Size by Type of Farmer (by acre)
Chart 12: Percentage of Farmers who Hire Additional Labour for Farming
Activities by Size of the Farmer
5 18%
36%
52%
7
9
Small SmallMedium MediumLarge Large
Source: FinScope Tanzania 2017
Medium-scale farmers make 5 times more money than small-scale farmers but only use 25% more land
EFTA Ltd (a subsidiary of Equity for Africa) is a Tanzanian finance company which specialises in serving SMEs and farmers. They are successfully offering agricultural leasing solutions for dedicated farmers, namely equipment loans of up to USD 60,000 (TZS 137 million), with no collateral except for the equipment itself. This zero-collateral requirement addresses one of the key constraints on small enterprise borrowing levels and enables customers to pursue more ambitious growth plans. The overall size of this market segment implies there is potential for larger companies as well.
Stanbic Bank Tanzania offers leasing solutions in other African markets. For example, in Nigeria, the bank has developed a value chain financing model called “the smallholder farmer finance scheme” to provide smallholder producers with access to finance for improving the volume and quality of their production. This model takes an innovative approach in identifying key stakeholders along the value chain and brokering agreements. This has resulted in a guaranteed minimum price for smallholder outputs and access to quality agricultural input service providers. It also mitigates some of the risk involved in lending to individuals, by lending to cooperatives instead and paying agricultural suppliers directly for their services rather than providing cash loans.
See also Live! From the Market 3 below for a discussion of alternative approaches to credit scoring.
Live! From the Market 2:
24 FinScope Tanzania 2017: Dedicated Farmers 25FinScope Tanzania 2017: Dedicated Farmers
Live! From the Market 3:
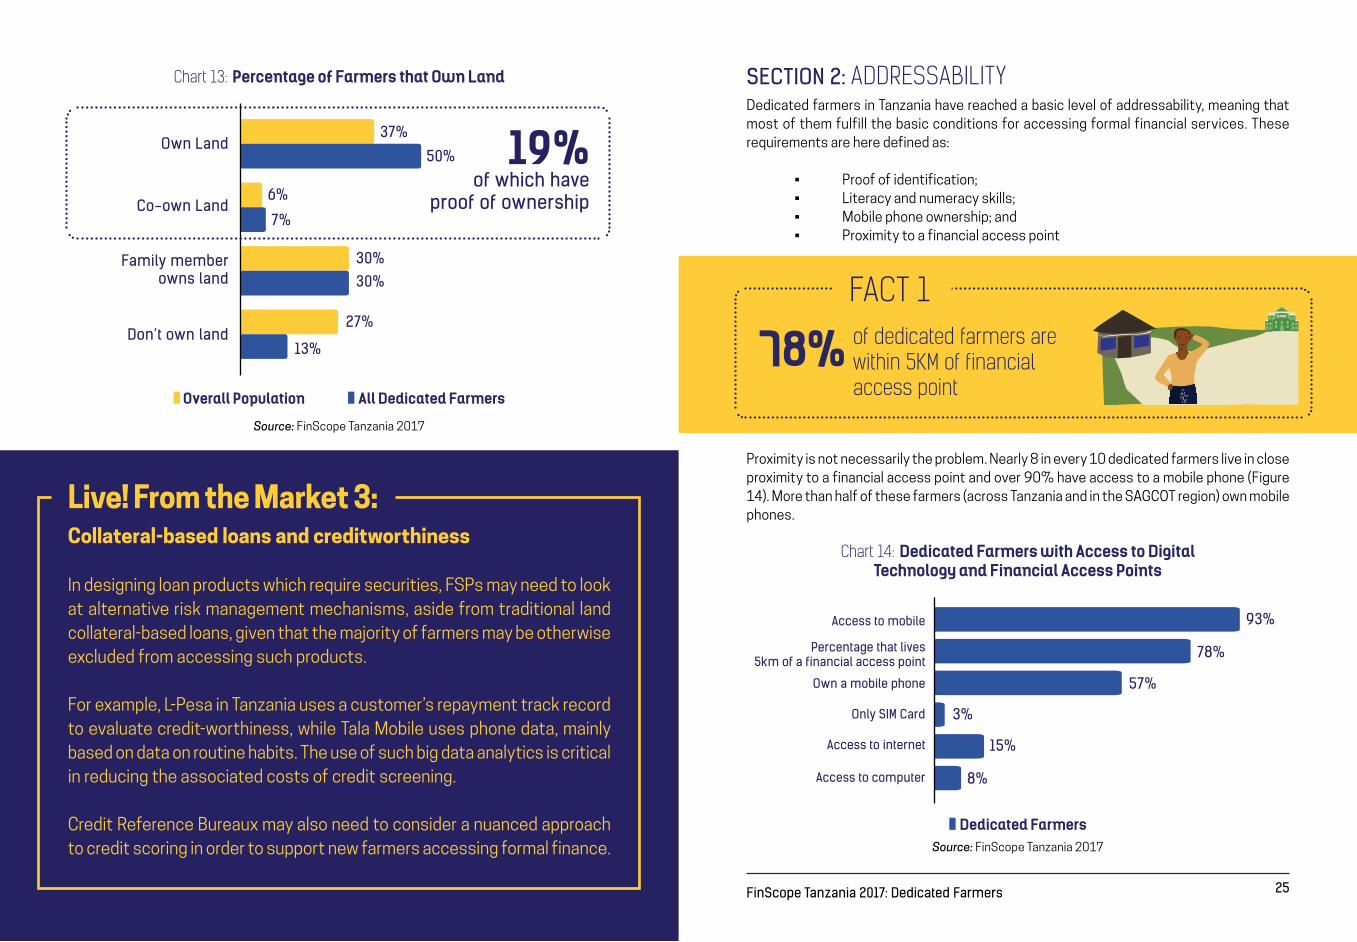
Dedicated farmers in Tanzania have reached a basic level of addressability, meaning that most of them fulfill the basic conditions for accessing formal financial services. These requirements are here defined as:
• Proof of identification; • Literacy and numeracy skills; • Mobile phone ownership; and • Proximity to a financial access point
Proximity is not necessarily the problem. Nearly 8 in every 10 dedicated farmers live in close proximity to a financial access point and over 90% have access to a mobile phone (Figure 14). More than half of these farmers (across Tanzania and in the SAGCOT region) own mobile phones.
Chart 13: Percentage of Farmers that Own Land
Chart 14: Dedicated Farmers with Access to Digital Technology and Financial Access Points
Own Land
Co-own Land
Family member owns land
Don’t own land
37%
30%
93%
78%
57%
3%
15%
8%
27%
30%
13%
6%
7%
50%
Source: FinScope Tanzania 2017
Overall Population All Dedicated Farmers
19%of which have
proof of ownership
Collateral-based loans and creditworthiness
In designing loan products which require securities, FSPs may need to look at alternative risk management mechanisms, aside from traditional land collateral-based loans, given that the majority of farmers may be otherwise excluded from accessing such products.
For example, L-Pesa in Tanzania uses a customer’s repayment track record to evaluate credit-worthiness, while Tala Mobile uses phone data, mainly based on data on routine habits. The use of such big data analytics is critical in reducing the associated costs of credit screening.
Credit Reference Bureaux may also need to consider a nuanced approach to credit scoring in order to support new farmers accessing formal finance.
SECTION 2: ADDRESSABILITY
FACT 1of dedicated farmers are within 5KM of financial access point
78%
Access to mobile
Own a mobile phone
Only SIM Card
Access to internet
Access to computer
Percentage that lives 5km of a financial access point
Source: FinScope Tanzania 2017
Dedicated Farmers

26 FinScope Tanzania 2017: Dedicated Farmers 27FinScope Tanzania 2017: Dedicated Farmers
Nearly 89% of dedicated farmers have a proof of identification (Figure 15). As a result, availability of documents required for Know-Your-Customer (KYC) requirements will not be a barrier to providing them with access to financial services.
The proportion of dedicated farmers that can read and write in Kiswahili is high, 66% versus a national average of 72% (Figure 16). While about 1 in 5 average Tanzanians can speak and write in English, only about 1 in 7 dedicated farmers can do so. Ensuring that clients understand the product is essential for uptake and responsible usage. Using Kiswahili in this instance for product marketing and design will support uptake. See also Live! From the Market 4 below.
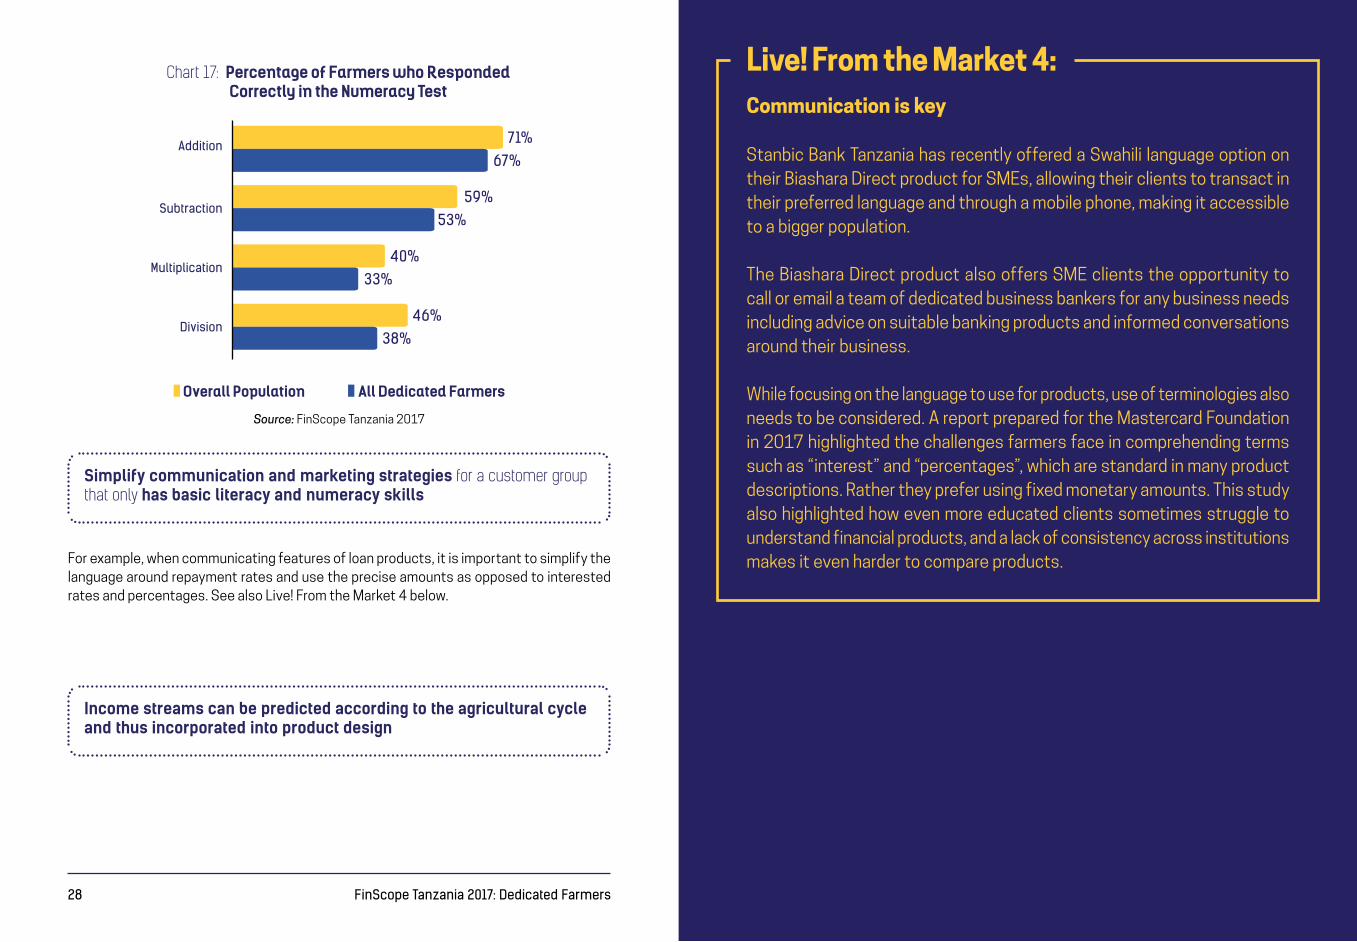
In terms of numeracy, the performance of dedicated farmers is close to that of the average Tanzanian with respect to addition and subtraction exercises. While 7 out of 10 dedicated farmers can solve basic addition tasks, only half of the dedicated farmers can solve basic subtraction tasks (Figure 17). Multiplication and division tasks can only be solved by 3-4 out of 10 farmers. With lower multiplication and division skills, it is however, unlikely that dedicated farmers have a good understanding of concepts like percentages or interest rates.
KYC requirements
for dedicated farmersare not a challenge
FACT 2
Chart 15: Identification Documents Ownership Among Dedicated Farmers
89%
4%
2%
2%
1%
83%
Voter’s Identification card
National Identification card
Driver’s License
TASAF identification card
Passport
Zanzibar resident ID (base Zanzibari’s)
Source: FinScope Tanzania 2017
Dedicated farmers have
basicliteracy and numeracy skills
FACT 3
Chart 16: Ability to Read and Write
Dedicated Farmers
27%
72%
16%
66%
English Language
Kiswahili Language
Source: FinScope Tanzania 2017
Overall Population All Dedicated Farmers
28 FinScope Tanzania 2017: Dedicated Farmers 29FinScope Tanzania 2017: Dedicated Farmers
Chart 17: Percentage of Farmers who Responded Correctly in the Numeracy Test
71%
59%
40%
46%
67%
53%
33%
38%
Addition
Subtraction
Multiplication
Division
Source: FinScope Tanzania 2017
Overall Population All Dedicated Farmers
Simplify communication and marketing strategies for a customer group that only has basic literacy and numeracy skills
Income streams can be predicted according to the agricultural cycle and thus incorporated into product design
For example, when communicating features of loan products, it is important to simplify the language around repayment rates and use the precise amounts as opposed to interested rates and percentages. See also Live! From the Market 4 below.
Communication is key
Stanbic Bank Tanzania has recently offered a Swahili language option on their Biashara Direct product for SMEs, allowing their clients to transact in their preferred language and through a mobile phone, making it accessible to a bigger population.
The Biashara Direct product also offers SME clients the opportunity to call or email a team of dedicated business bankers for any business needs including advice on suitable banking products and informed conversations around their business.
While focusing on the language to use for products, use of terminologies also needs to be considered. A report prepared for the Mastercard Foundation in 2017 highlighted the challenges farmers face in comprehending terms such as “interest” and “percentages”, which are standard in many product descriptions. Rather they prefer using fixed monetary amounts. This study also highlighted how even more educated clients sometimes struggle to understand financial products, and a lack of consistency across institutions makes it even harder to compare products.
Live! From the Market 4:
30 FinScope Tanzania 2017: Dedicated Farmers 31FinScope Tanzania 2017: Dedicated Farmers
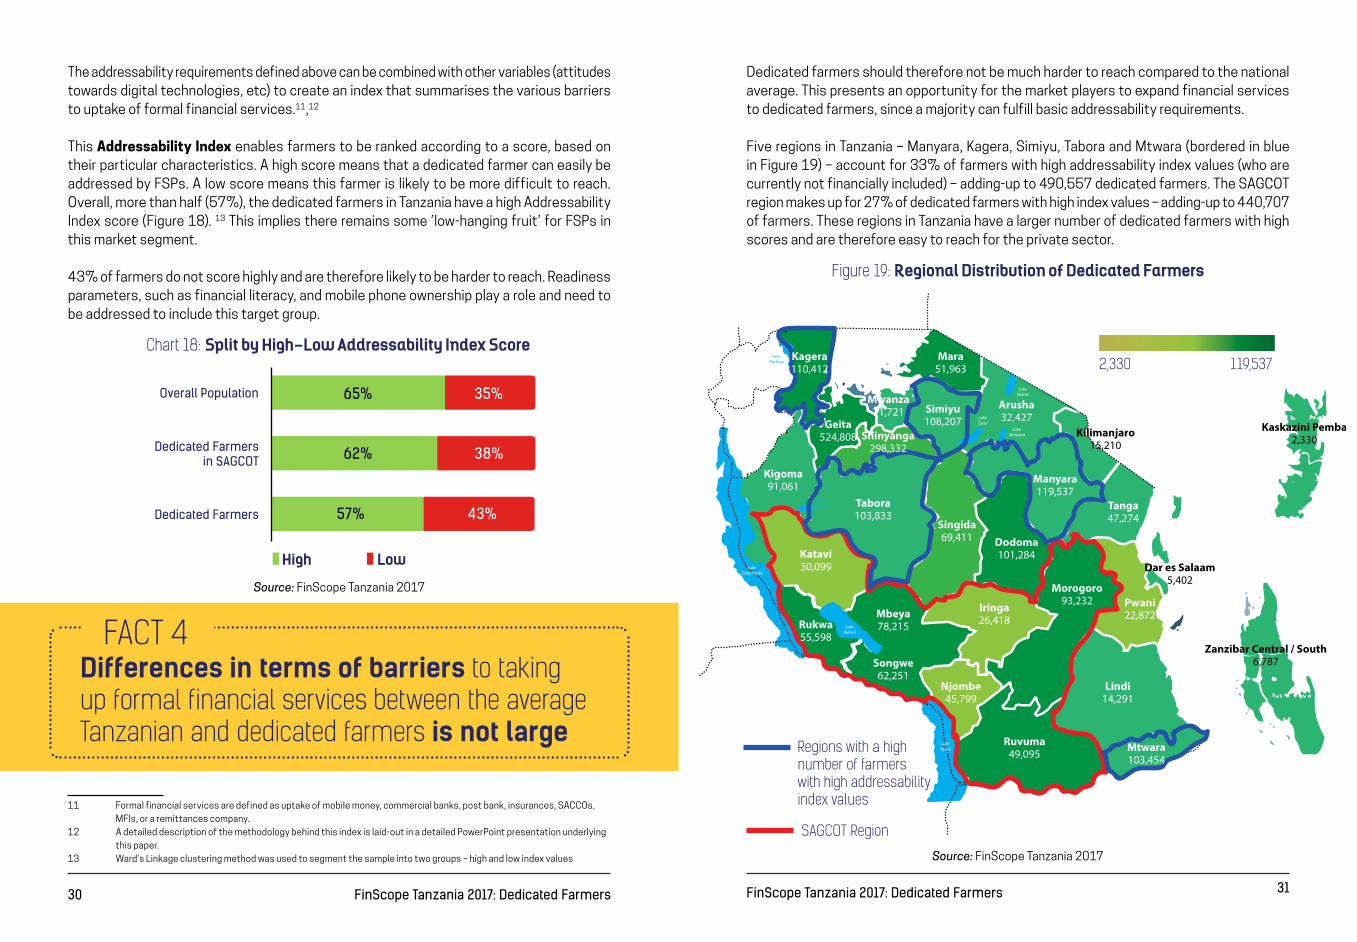
The addressability requirements defined above can be combined with other variables (attitudes towards digital technologies, etc) to create an index that summarises the various barriers to uptake of formal financial services.11,12
This Addressability Index enables farmers to be ranked according to a score, based on their particular characteristics. A high score means that a dedicated farmer can easily be addressed by FSPs. A low score means this farmer is likely to be more difficult to reach. Overall, more than half (57%), the dedicated farmers in Tanzania have a high Addressability Index score (Figure 18). 13 This implies there remains some ’low-hanging fruit’ for FSPs in this market segment.
43% of farmers do not score highly and are therefore likely to be harder to reach. Readiness parameters, such as financial literacy, and mobile phone ownership play a role and need to be addressed to include this target group.
11 Formal financial services are defined as uptake of mobile money, commercial banks, post bank, insurances, SACCOs, MFIs, or a remittances company.
12 A detailed description of the methodology behind this index is laid-out in a detailed PowerPoint presentation underlying this paper.
13 Ward’s Linkage clustering method was used to segment the sample into two groups – high and low index values
Chart 18: Split by High-Low Addressability Index Score
FACT 4Differences in terms of barriers to taking up formal financial services between the average Tanzanian and dedicated farmers is not large
Dedicated farmers should therefore not be much harder to reach compared to the national average. This presents an opportunity for the market players to expand financial services to dedicated farmers, since a majority can fulfill basic addressability requirements.
Five regions in Tanzania – Manyara, Kagera, Simiyu, Tabora and Mtwara (bordered in blue in Figure 19) – account for 33% of farmers with high addressability index values (who are currently not financially included) – adding-up to 490,557 dedicated farmers. The SAGCOT region makes up for 27% of dedicated farmers with high index values – adding-up to 440,707 of farmers. These regions in Tanzania have a larger number of dedicated farmers with high scores and are therefore easy to reach for the private sector.
35%65%
38%62%
43%57%
Overall Population
Dedicated Farmers in SAGCOT
Dedicated Farmers
Source: FinScope Tanzania 2017
High Low
Figure 19: Regional Distribution of Dedicated Farmers
SAGCOT Region
Regions with a high number of farmers with high addressability index values
2,330 119,537
Source: FinScope Tanzania 2017

32 FinScope Tanzania 2017: Dedicated Farmers 33FinScope Tanzania 2017: Dedicated Farmers
SECTION 3: FINANCIAL BEHAVIOURThis section draws key insights related to financial behaviour of dedicated farmers in Tanzania. It is crucial to take the financial behaviour of dedicated farmers into account when designing financial products, as they are part of the essence to defining use cases.
In addition to income from selling their produce, a fifth of dedicated farmers receive income from casual labour/ occasional jobs (Figure 20). This additional source of income should be considered by FSPs when they assess the capacity of farmers to save or repay loans.
Almost 60% of dedicated farmers in Tanzania receive their income seasonally (Figure 21). Given this irregular flow of income, financial services – particularly the ability to flexibly save post-harvest and borrow pre-planting – presents a significant use case for dedicated farmers.
FACT 1Dedicated farmers supplement income through occasional jobs
Figure 20: Additional Income Sources of Dedicated Farmers
Figure 21: Frequency of Receiving Agricultural Income by Dedicated Farmers
19%
56%
17%
8%
6%
5%
3%
6%
2%
1%
Price work / Causal labor / Occasional Jobs
Seasonally
Occasionally
Annually
Monthly
Daily
Weekly
Rely on someone else / others to give / send me money
Money from providing a service
Salaries / wages
Source: FinScope Tanzania 2017
Source: FinScope Tanzania 2017
Dedicated Farmers
Dedicated Farmers
Income is mostly seasonaland comes in tranches
FACT 2
Income streams can be predicted according to the agricultural cycle and thus incorporated into product design

34 FinScope Tanzania 2017: Dedicated Farmers 35FinScope Tanzania 2017: Dedicated Farmers
Despite growing uptake,
FACT 3
cash remains king
Presently, almost all income payments to and from farmers (groceries, school fees, medical treatment, and airtime) are made in cash (Figures 22 and 23). Significant sums of money therefore still circulate outside the formal financial system.
Reliance by dedicated farmers on informal channels like family and friends to meet their financial needs and the extensive use of cash for transactions, limits their ability to build a credit history which can help them apply for formal credit in the future. For example, mobile money transactions help to build a credit history, which in turn can help to apply for loans in the future. Improving communicating of this link to farmers could encourage them to transact more frequently. Promoting the advantages of a digital footprint can be particularly attractive when cross-selling transaction products and loan products. Another opportunity would be to offer digitised transactions related to livestock investments, as these form a large part of dedicated farmers’ investments (see Figure 26 and 27).
FSPs that use digital delivery channels and products are in a good position to do this as they reach new markets at lower cost. Partnerships with market counter parties (agri-business, commercial farms, etc) who already engage with this customer segment could however speed-up the on-boarding process.
Only 47% dedicated farmers in Tanzania save money. Nearly half of them keep the saved money as cash at home or in a hiding place (Figure 24).
Figure 22: How Do Dedicated Farmers Receive Income
Figure 24: Savings Channels Used by Dedicated Farmers Who Save
Figure 23: How Do Dedicated Farmers Pay for Groceries, School Fees, Medical Treatment, and Airtime
98.3%
1.2%
0.5%
Cash in hand
Into a bank
On your phoneSource: FinScope Tanzania 2017
Source: FinScope Tanzania 2017Source: FinScope Tanzania 2017
Dedicated Farmers
Dedicated Farmers
Airt
ime
Overall Population
Overall Population
Overall Population
Overall Population
Dedicated farmers
Dedicated farmers
Dedicated farmers
Dedicated farmers
Dedicated farmers in SAGCOT
Dedicated farmers in SAGCOT
Dedicated farmers in SAGCOT
Dedicated farmers in SAGCOT
Med
ical
Tr
eatm
ent
Scho
ol F
ees
Gro
cerie
s
97% 3%
2%
2%
1%
0%
0%
98%
98%
99%
100%
100%
100%
100%
100%
75% 4% 1%20%
11%
11%
2%
5%
87%
84%
Use Cash Bank OthersMobile Money Services
FACT 4Using mobile money is becoming a viable alternative to saving at home, with
dedicated farmers who save already using their e-wallet2 out of 10 TZS
49%
23%
17%
16%
10%
10%
Keep cash at home or in a secret hiding spot ...
You don’t put cash away but you buy ...
Give to a household or family member ...
Bank
In your mobile phone
Save with a savings group This is an interesting opportunity for the private sector to further expand. There seems to be traction in using mobile money as a savings device which could be further built on.
36 FinScope Tanzania 2017: Dedicated Farmers 37FinScope Tanzania 2017: Dedicated Farmers
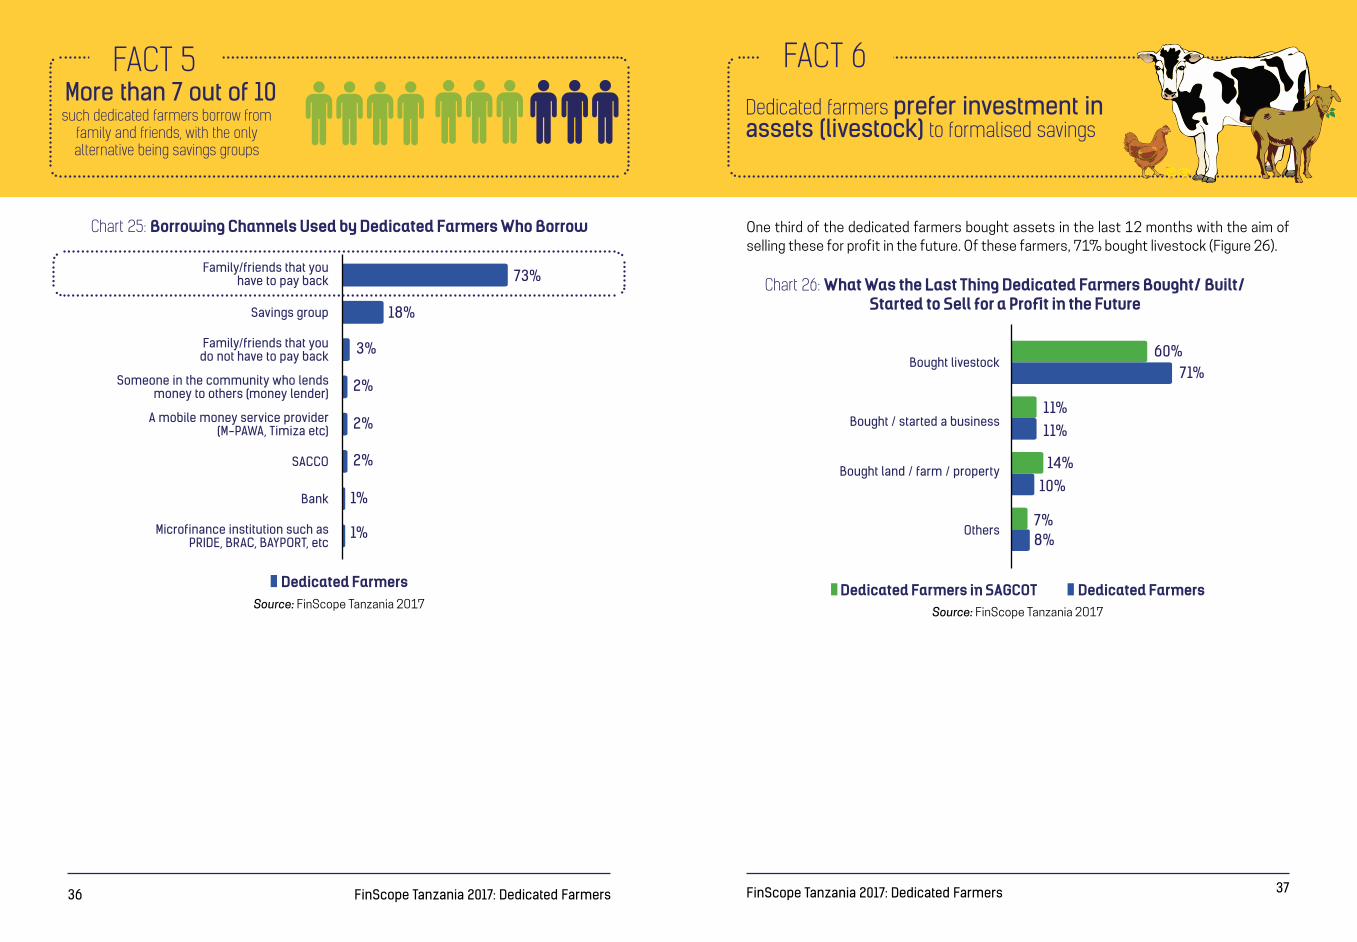
One third of the dedicated farmers bought assets in the last 12 months with the aim of selling these for profit in the future. Of these farmers, 71% bought livestock (Figure 26).
Chart 25: Borrowing Channels Used by Dedicated Farmers Who Borrow
Chart 26: What Was the Last Thing Dedicated Farmers Bought/ Built/ Started to Sell for a Profit in the Future
FACT 5Dedicated farmers prefer investment in assets (livestock) to formalised savings
FACT 6
such dedicated farmers borrow from family and friends, with the only alternative being savings groups
More than 7 out of 10
73%
18%
3%
2%
2%
2%
1%
1%
Family/friends that you have to pay back
Family/friends that you do not have to pay back
Someone in the community who lends money to others (money lender)
A mobile money service provider (M-PAWA, Timiza etc)
Savings group
60%71%
11%
14%
11%
10%
7%8%
Bought livestock
Bought / started a business
Bought land / farm / property
Others
SACCO
Bank
Microfinance institution such as PRIDE, BRAC, BAYPORT, etc
Source: FinScope Tanzania 2017Source: FinScope Tanzania 2017
Dedicated Farmers Dedicated FarmersDedicated Farmers in SAGCOT

38 FinScope Tanzania 2017: Dedicated Farmers 39FinScope Tanzania 2017: Dedicated Farmers
A fifth of dedicated farmers invested in assets to increase their productivity, and thereby their future income. Of these, nearly 50% bought livestock for this purpose (Figure 27).
This suggests that tying-up capital by investing in livestock and selling this for a higher price in the future is still a preferred way of saving for dedicated farmers. The returns, if perceived or real, seem to outweigh the benefits of formal savings products that are at their disposal. As such, this is attractive financial behaviour, as it implies calculated investments in long-term assets (livestock).
Changing this behaviour is challenging and instead FSPs should look to innovative products that mimic the features of farmers’ current investments. This is done, for example, by the chicken coin or Kuku coin; a financial product that offers similar benefits to an investment in a chicken. The product speaks to farmers both in terms of communication approach and product design – not asking farmers to drastically change their behaviour. This has the potential to increase uptake and usage.
Farmers invest in livestock to protect themselves from economic shocks in the future. Here FSPs could offer different types of insurance, including that for livestock, to de-risk dedicated farmers’ main assets (see also Live! From the Market 5 below).
Chart 27: What Was the Last Thing Dedicated Farmers Bought/ Built/ Started to Earn Income in the Future
1%
Source: FinScope Tanzania 2017
Dedicated FarmersDedicated Farmers in SAGCOT
39%
21%
13%
8%
7%
9%
2%
47%
30%
9%
6%
5%
3%
Bought livestock
Bought / started a business
Bought / built house / flat / apartment to rent out
Bought land / farm to rent out
Bought equipment / machinery / tools such as sewing machine, stone ....
Bought a car / vehicle
Others
Farmers prefer investments in livestock to formal savings since returns are higher and they bear a social value
Complement current behaviours instead of re-engineering
Insurance for livestock
In 2010, The International Livestock Research Institute (ILRI) formulated and piloted the Index-Based Livestock Insurance (IBLI), to protect livestock keepers from drought related asset losses, specifically Kenyan and Ethiopian pastoralists in Arid and Semi-Arid Lands (ASALs). IBLI uses a combination of satellite observations of forage conditions with longitudinal livestock mortality rates to calculate clients’ seasonal pay outs. Over the last 8 years IBLI has been scaled up through partnerships with insurance partners, NGOs, the Government of Kenya and other donors. It has also adapted it’s offering in response to demand, including a sharia-compliant IBLI product in 2013.
Part of the success may be attributed to ILRI’s emphasis on continuous learning and in creating “informed demand”. Building capacity in its Market and Capacity Development Team to implement trainings and design capacity building activities that are appropriate to the needs of pastoralists, helps to improve understanding about IBLI and insurance, resulting in sustainable and positive demand for IBLI in pastoral areas.
Live! From the Market 5:

40 FinScope Tanzania 2017: Dedicated Farmers 41FinScope Tanzania 2017: Dedicated Farmers
FSPs can develop this market potential by developing insurance products for them based on a deep understanding of their specific requirements. Live! From the Market 6 below discusses
a case study in more detail.
Opportunities for rolling-out insurance products
Insurance penetration in lower income markets can be sluggish for two main reasons. The first is low demand for insurance due to limited understanding by potential customers on insurance concepts as well as negative perceptions and attitudes towards insurance. The second includes limited capacity by providers to provide adequate distribution channels, skilled insurance personnel and product offerings.
Multi-stakeholder partnerships are emerging to address these challenges. ACRE Africa, (Agriculture and Climate Risk Enterprise Ltd), links farmers to insurance products so that they can confidently invest in their farms. By 2017, over 1,000,000 farmers in Kenya, Tanzania and Rwanda insured over USD 75 million against a variety of weather risks underwritten by UAP Insurance Kenya, CIC Insurance Group Limited, APA Insurance, Heritage Insurance, UAP Insurance Tanzania and SORAS Insurance Rwanda. The insurance was distributed through four main channels: seed distribution linked to a mobile network operators location service, agribusinesses with out-growers or contracted farmers, lending institutions and savings and credit cooperatives (SACCOs) providing input loans and medium-scale professional farmers.
Live! From the Market 6:
FACT 7Reliance on borrowings from friends and relatives by farmers to pay for unexpected expenses highlights the need for insurance cover for the farmers
While savings are the most commonly relied on source for dedicated farmers to pay for major expected events (such as marriage or birth), to pay for unexpected expenses (such as droughts or death of family members), farmers mostly rely on borrowings from friends and relatives (Figure 28). Only 2% of dedicated farmers use insurance cover to pay for unexpected events. This seems at odds with the relatively high number of dedicated farmers who invest in long term assets, implying a potential market opportunity for FSPs, especially if premiums can be paid in small, regular amounts or in one larger installment just after harvest (as opposed to during planting).
Chart 28: Source for Dedicated Farmers to Pay for Expected and Unexpected Expenses
Source: FinScope Tanzania 2017
Where will you get most of the money to pay for major expected events
If you should have unexpected expenses tomorrow, how will you cope?
26% 33%
26%
15%
14%
5%
4%
2%
2%
1%
21%
12%
10%
9%
8%
8%
6%
Savings Will borrow from family / friends
Sell livestock / poultry I keep for this purpose
Use savings / money I put aside
Sell an asset bought for this purpose
Will do casual work / work more
Use insurance cover
Others
Sell crops
Don’t know
Others
Don’t know
Cut back on expenses
Borrow
Rely on friends and family for gifts / money
Sell something not intentionally bought for this purpose
Sell something Ibought for this purpose
42 FinScope Tanzania 2017: Dedicated Farmers 43FinScope Tanzania 2017: Dedicated Farmers
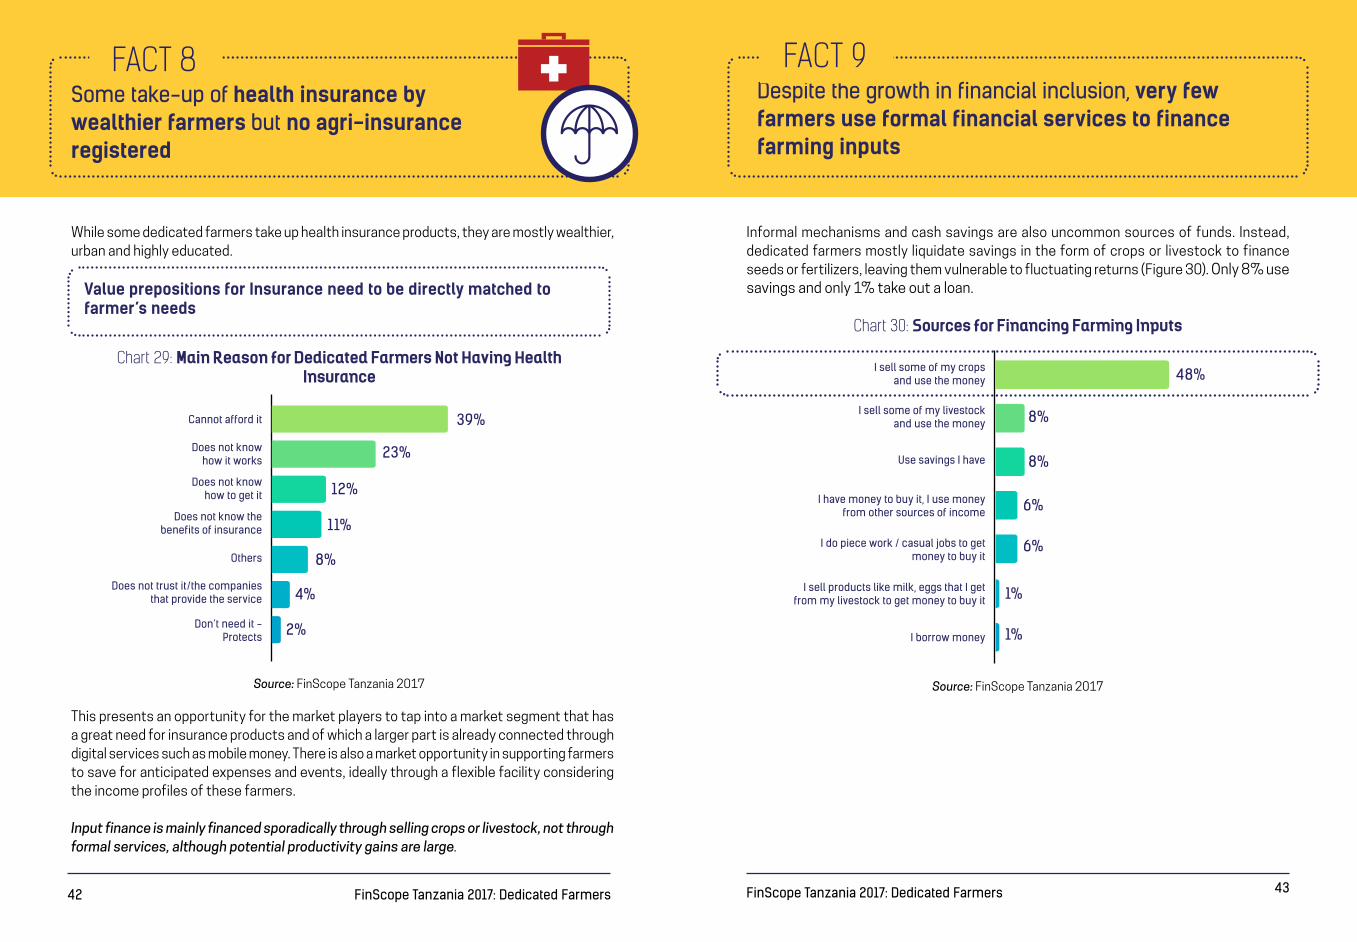
While some dedicated farmers take up health insurance products, they are mostly wealthier, urban and highly educated.
This presents an opportunity for the market players to tap into a market segment that has a great need for insurance products and of which a larger part is already connected through digital services such as mobile money. There is also a market opportunity in supporting farmers to save for anticipated expenses and events, ideally through a flexible facility considering the income profiles of these farmers.
Input finance is mainly financed sporadically through selling crops or livestock, not through formal services, although potential productivity gains are large.
Informal mechanisms and cash savings are also uncommon sources of funds. Instead, dedicated farmers mostly liquidate savings in the form of crops or livestock to finance seeds or fertilizers, leaving them vulnerable to fluctuating returns (Figure 30). Only 8% use savings and only 1% take out a loan.
FACT 8Some take-up of health insurance by wealthier farmers but no agri-insurance registered
Value prepositions for Insurance need to be directly matched to farmer’s needs
Chart 29: Main Reason for Dedicated Farmers Not Having Health Insurance
Chart 30: Sources for Financing Farming Inputs
Source: FinScope Tanzania 2017 Source: FinScope Tanzania 2017
39%
23%
12%
11%
8%
4%
2%
Cannot afford it
Does not know how it works
Does not know how to get it
Does not know the benefits of insurance
Does not trust it/the companies that provide the service
Don’t need it - Protects
Others
Despite the growth in financial inclusion, very few farmers use formal financial services to finance farming inputs
FACT 9
48%
8%
8%
6%
6%
1%
1%
I sell some of my crops and use the money
I sell some of my livestock and use the money
I have money to buy it, I use money from other sources of income
I do piece work / casual jobs to get money to buy it
I sell products like milk, eggs that I get from my livestock to get money to buy it
Use savings I have
I borrow money

44 FinScope Tanzania 2017: Dedicated Farmers 45FinScope Tanzania 2017: Dedicated Farmers
This creates an opportunity for innovative products financing agricultural inputs, especially for dedicated farmers that already use mobile money. While the roll-out of a new product can present challenges, there are many ways to leverage existing structures. See also Live! From the Market 7 below for an example of how existing linkages can be used to reach dedicated
farmers in Tanzania.
Product roll-out through Agricultural Marketing Cooperative Society (AMCOS) and the warehouse receipt system
FSDT designed an intervention to improve livelihoods of the rural poor through an innovative linkage model and product design. AMCOS, a key institution in the linkage model, helps farmers with marketing and selling through the warehouse receipt system (WRS). Working with FSPs, FSDT encouraged the design of three solutions including a health insurance solution for farmers and their households with the National Health Insurance Fund (NHIF); an alternative savings and investment solution with a pension company; and a payment solution for farmers with Tigo, initially targeting cashew nut farmers. The health solution which is being rolled out this year is designed to cover healthcare expenses in order to allow for households to take advantage of various forms of long term savings options and investment opportunities. The Tigo solution saw a huge demand from farmers with over TZS 1.9 billion distributed in just a few months and is projected to reach over 200,000 farmers in 2018.
Digitising different components of key value chains can thus have positive spill-over effects, impacting the success of other products.
This section assesses how dedicated farmers fare in terms of financial inclusion with specific focus on the extent of their uptake and usage of financial services. Based on an understanding of factors hindering adoption and use of financial services by dedicated farmers, appropriate measures can be undertaken by FSPs to overcome these issues.
Tanzania has been a success story in terms of financial service uptake over the last decade. Uptake has been increasing, drive by the expansion of mobile money services, and financial access points have been rolled-out even to more remote rural areas. This is also reflected in uptake rates of dedicated farmers.
SECTION 4: FINANCIAL INCLUSION (UPTAKE AND USAGE)
FACT 1
Dedicated farmers are not far behind the financial inclusion curve
Chart 31: Financial Inclusion of Dedicated farmers Compared to the Average Tanzanian
Chanzo: FinScope Tanzania 2017
17%
10%
7%
8%
28%
34%
49%
48%Dedicated Farmers
Overall population
Live! From the Market 7:
Banked Other Formal Informal Excluded

46 FinScope Tanzania 2017: Dedicated Farmers 47FinScope Tanzania 2017: Dedicated Farmers
FACT 2About half (51%) of dedicated farmers have taken up mobile money
Chart 32: Uptake of Different Types of Formal Financial Services Chart 33: Uptake of Different Types of Formal Financial Services
Source: FinScope Tanzania 2017
Overall Population All Dedicated Farmers
60%
15%
51%
16%
17%
6%
2%
4%
0%
1%
1%
0%
3%
10%
Mobile Money
Insurance
Banked
MFI
SACCO
Pension
Capital Markets
This offers an opportunity for the market to engage more with dedicated farmers as a large share of them are already digitally connected, paving the way to roll-out additional products or further deepening the usage of existing products through new features.
This could present an interesting opportunity to link informal to formal financial services. Please see Live! From the Market 8 below for more details on this opportunity.Of the farmers that have a high Addressability Index score, 69% are already using mobile
SAGCOT dedicated farmers use informal services slightly more often than dedicated farmers in other regions
FACT 3
Source: FinScope Tanzania 2017
Dedicated FarmersDedicated Farmers in SAGCOT
Informal Savings Group
by type of product
Money Lender
29%
16%
5% 5%
32%
18%
48 FinScope Tanzania 2017: Dedicated Farmers 49FinScope Tanzania 2017: Dedicated Farmers
Use case for including savings groups – moving from informal to formal
Savings groups are a proven pathway to formal financial inclusion. CARE International’s work with partners including Maendeleo, Barclays, National Microfinance Bank (NMB) Tanzania, Equity Bank and many others have helped 1.3 million members open their first bank accounts, leading to financial as well as non-financial gains, such as increased women’s control over resources. In Tanzania, CARE worked with Barclays and NMB bank to design group savings products as a first step for bringing savings group members into the formal financial sector. This suited the needs of groups who had concerns over the security of their savings. Business skills training and further financial education was delivered to members in order to improve management and increase investment in their businesses. With this training, members could then make informed decisions about other formal products that would suit their needs.
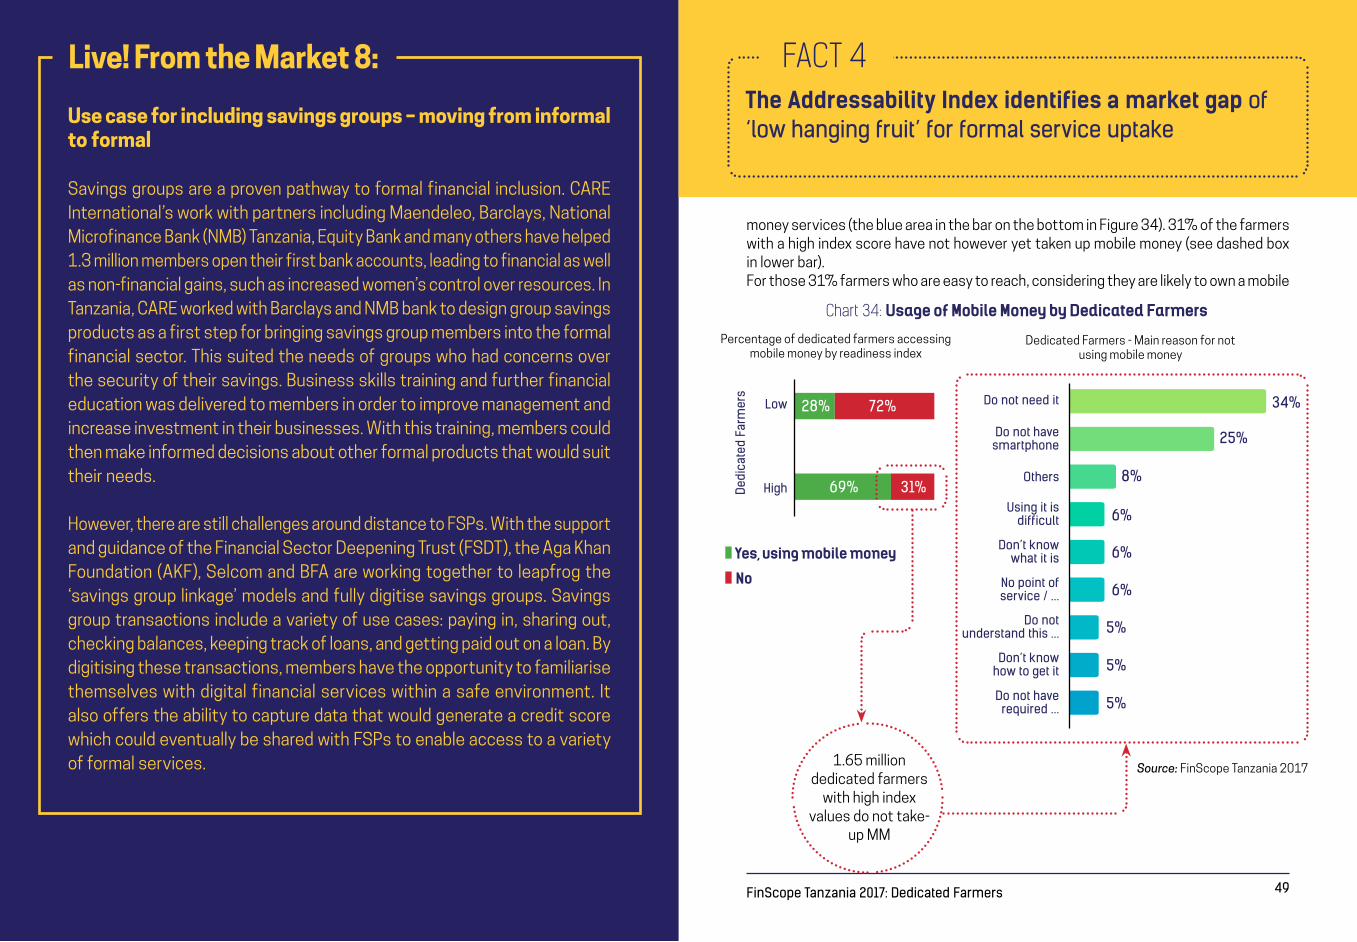
However, there are still challenges around distance to FSPs. With the support and guidance of the Financial Sector Deepening Trust (FSDT), the Aga Khan Foundation (AKF), Selcom and BFA are working together to leapfrog the ‘savings group linkage’ models and fully digitise savings groups. Savings group transactions include a variety of use cases: paying in, sharing out, checking balances, keeping track of loans, and getting paid out on a loan. By digitising these transactions, members have the opportunity to familiarise themselves with digital financial services within a safe environment. It also offers the ability to capture data that would generate a credit score which could eventually be shared with FSPs to enable access to a variety of formal services.
The Addressability Index identifies a market gap of ‘low hanging fruit’ for formal service uptake
FACT 4
money services (the blue area in the bar on the bottom in Figure 34). 31% of the farmers with a high index score have not however yet taken up mobile money (see dashed box in lower bar).For those 31% farmers who are easy to reach, considering they are likely to own a mobile
Chart 34: Usage of Mobile Money by Dedicated Farmers
1.65 million dedicated farmers
with high index values do not take-
up MM
34%28%
69% 31%
72%
25%
8%
6%
6%
6%
5%
5%
5%
Do not need it
Dedi
cate
d Fa
rmer
s
Low
HighOthers
Do not have smartphone
Using it is difficult
Don’t know what it is
No point of service / ...
Don’t know how to get it
Do not have required ...
Do not understand this ...
Percentage of dedicated farmers accessing mobile money by readiness index
Dedicated Farmers - Main reason for not using mobile money
Source: FinScope Tanzania 2017
Yes, using mobile money
No
Live! From the Market 8:
50 FinScope Tanzania 2017: Dedicated Farmers 51FinScope Tanzania 2017: Dedicated Farmers
1.65m dedicated farmers across Tanzania could easily take up mobile money services, but lack use cases
FACT 5
phone, live close to a financial access point, have positive attitudes towards digital technologies, but have not taken up mobile money, more than a third claim that they “do not need [mobile money]” (see box in Figure 34). A main barrier for this specific customer segment is communication. The initial mass media campaign, promoting mobile money as a “send money home” service, has not served these consumers’ needs, hence usage beyond send-receive services is key.
Lack of use cases for low income segment: inactive mobile users have lower incomes
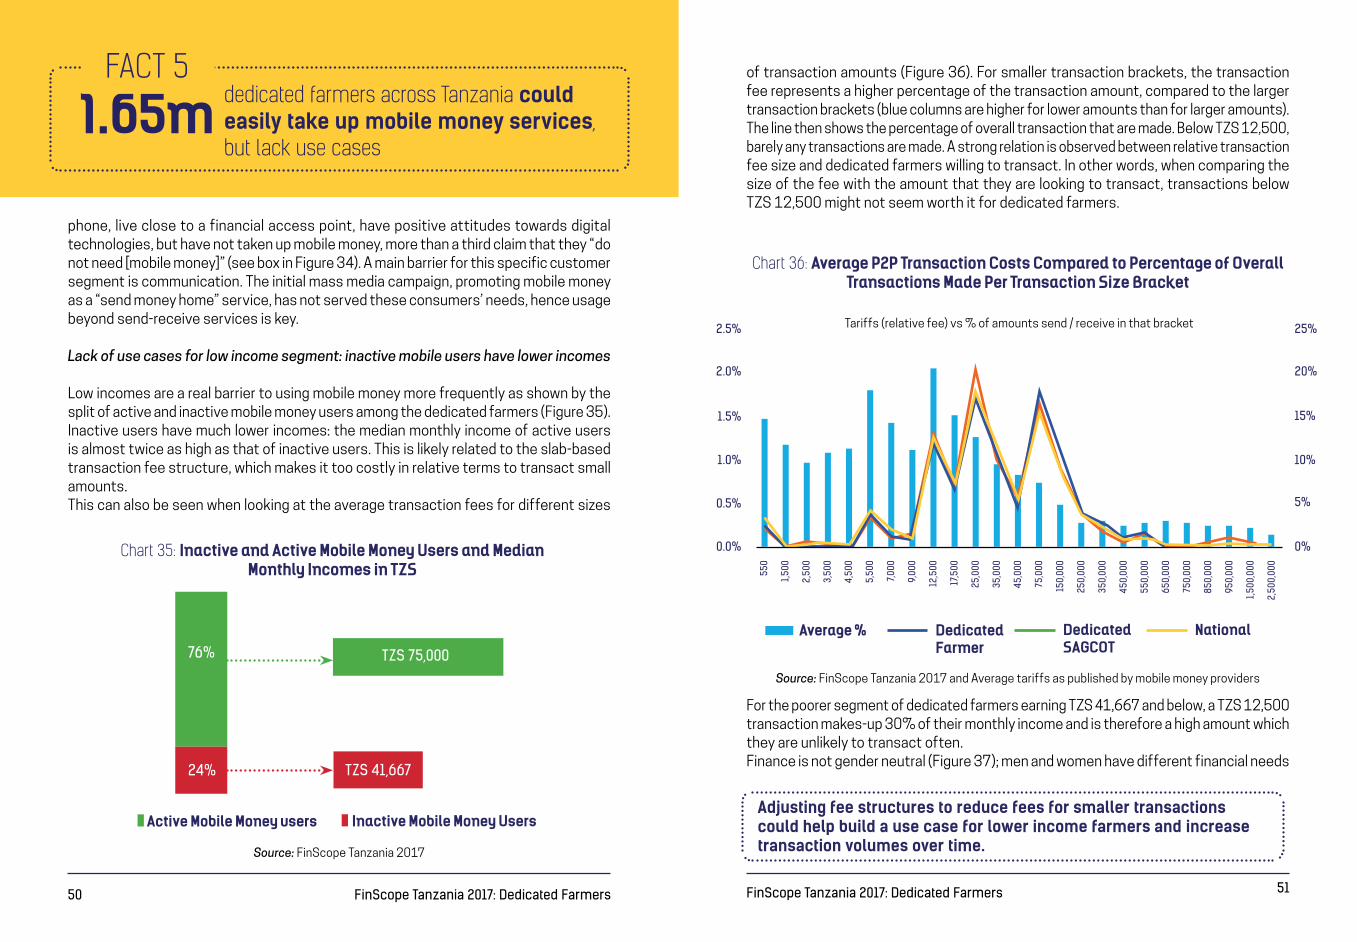
Low incomes are a real barrier to using mobile money more frequently as shown by the split of active and inactive mobile money users among the dedicated farmers (Figure 35). Inactive users have much lower incomes: the median monthly income of active users is almost twice as high as that of inactive users. This is likely related to the slab-based transaction fee structure, which makes it too costly in relative terms to transact small amounts. This can also be seen when looking at the average transaction fees for different sizes
of transaction amounts (Figure 36). For smaller transaction brackets, the transaction fee represents a higher percentage of the transaction amount, compared to the larger transaction brackets (blue columns are higher for lower amounts than for larger amounts). The line then shows the percentage of overall transaction that are made. Below TZS 12,500, barely any transactions are made. A strong relation is observed between relative transaction fee size and dedicated farmers willing to transact. In other words, when comparing the size of the fee with the amount that they are looking to transact, transactions below TZS 12,500 might not seem worth it for dedicated farmers.
For the poorer segment of dedicated farmers earning TZS 41,667 and below, a TZS 12,500 transaction makes-up 30% of their monthly income and is therefore a high amount which they are unlikely to transact often.Finance is not gender neutral (Figure 37); men and women have different financial needs
Chart 35: Inactive and Active Mobile Money Users and Median Monthly Incomes in TZS
Chart 36: Average P2P Transaction Costs Compared to Percentage of Overall Transactions Made Per Transaction Size Bracket
Active Mobile Money users Inactive Mobile Money Users
Average % Dedicated Farmer
Dedicated SAGCOT
National
TZS 75,00076%
24% TZS 41,667
Source: FinScope Tanzania 2017
Source: FinScope Tanzania 2017 and Average tariffs as published by mobile money providers
0.0%
0.5%
1.0%
1.5%
2.0%
2.5% 25%
20%
15%
10%
5%
0%
550
1,50
0
2,50
0
3,50
0
4,50
0
5,50
0
7,000
9,00
0
12,5
00
17,5
00
25,0
00
35,0
00
45,0
00
75,0
00
150,
000
250,
000
350,
000
450,
000
550,
000
650,
000
750,
000
850,
000
950,
000
1,50
0,00
0
2,50
0,00
0
Tariffs (relative fee) vs % of amounts send / receive in that bracket
Adjusting fee structures to reduce fees for smaller transactions could help build a use case for lower income farmers and increase transaction volumes over time.
52 FinScope Tanzania 2017: Dedicated Farmers 53FinScope Tanzania 2017: Dedicated Farmers
FACT 7Uptake of financial services in urban areas is higher than rural areas
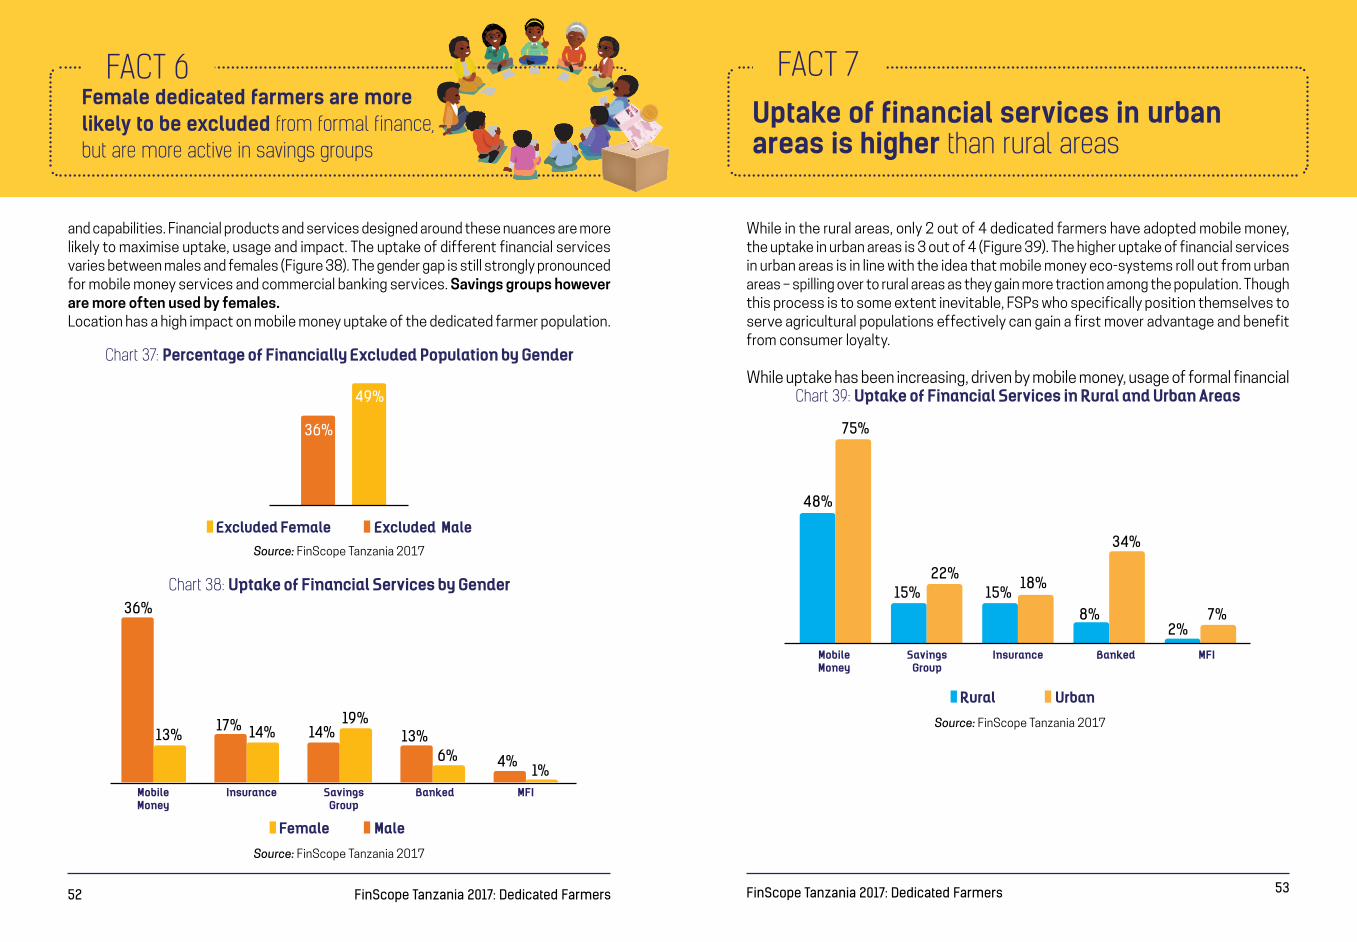
FACT 6Female dedicated farmers are more likely to be excluded from formal finance, but are more active in savings groups
and capabilities. Financial products and services designed around these nuances are more likely to maximise uptake, usage and impact. The uptake of different financial services varies between males and females (Figure 38). The gender gap is still strongly pronounced for mobile money services and commercial banking services. Savings groups however are more often used by females.Location has a high impact on mobile money uptake of the dedicated farmer population.
While in the rural areas, only 2 out of 4 dedicated farmers have adopted mobile money, the uptake in urban areas is 3 out of 4 (Figure 39). The higher uptake of financial services in urban areas is in line with the idea that mobile money eco-systems roll out from urban areas – spilling over to rural areas as they gain more traction among the population. Though this process is to some extent inevitable, FSPs who specifically position themselves to serve agricultural populations effectively can gain a first mover advantage and benefit from consumer loyalty.
While uptake has been increasing, driven by mobile money, usage of formal financial Chart 37: Percentage of Financially Excluded Population by Gender
Chart 39: Uptake of Financial Services in Rural and Urban Areas
Chart 38: Uptake of Financial Services by Gender
Excluded Female Excluded Male
Female
Rural
Male
Urban
Source: FinScope Tanzania 2017
Source: FinScope Tanzania 2017
Source: FinScope Tanzania 2017
36%
49%
MobileMoney
MobileMoney
Insurance
Insurance
SavingsGroup
SavingsGroup
Banked
Banked
MFI
MFI
36%
48%
15% 15%8% 7%
2%
34%
22%18%
13%
75%
17% 14% 14%19%
13%
4%1%
6%
TZS
54 FinScope Tanzania 2017: Dedicated Farmers 55FinScope Tanzania 2017: Dedicated Farmers
is likely driven by a number of factors, such as transaction fees and a lack of financial awareness.
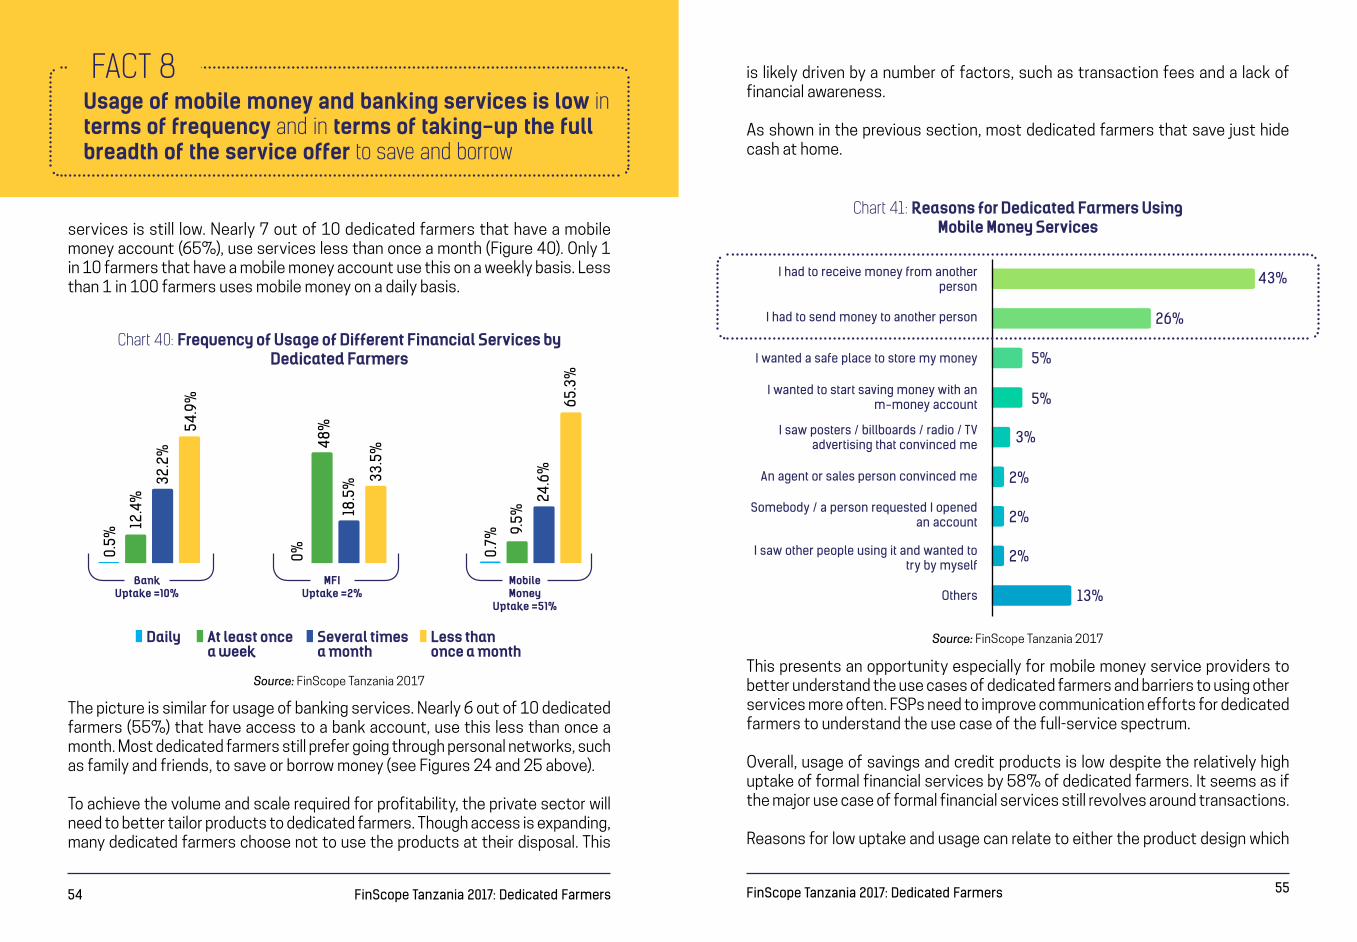
As shown in the previous section, most dedicated farmers that save just hide cash at home.
This presents an opportunity especially for mobile money service providers to better understand the use cases of dedicated farmers and barriers to using other services more often. FSPs need to improve communication efforts for dedicated farmers to understand the use case of the full-service spectrum.
Overall, usage of savings and credit products is low despite the relatively high uptake of formal financial services by 58% of dedicated farmers. It seems as if the major use case of formal financial services still revolves around transactions.
Reasons for low uptake and usage can relate to either the product design which
FACT 8Usage of mobile money and banking services is low in terms of frequency and in terms of taking-up the full breadth of the service offer to save and borrow
services is still low. Nearly 7 out of 10 dedicated farmers that have a mobile money account (65%), use services less than once a month (Figure 40). Only 1 in 10 farmers that have a mobile money account use this on a weekly basis. Less than 1 in 100 farmers uses mobile money on a daily basis.
The picture is similar for usage of banking services. Nearly 6 out of 10 dedicated farmers (55%) that have access to a bank account, use this less than once a month. Most dedicated farmers still prefer going through personal networks, such as family and friends, to save or borrow money (see Figures 24 and 25 above).
To achieve the volume and scale required for profitability, the private sector will need to better tailor products to dedicated farmers. Though access is expanding, many dedicated farmers choose not to use the products at their disposal. This
Chart 40: Frequency of Usage of Different Financial Services by Dedicated Farmers
Chart 41: Reasons for Dedicated Farmers Using Mobile Money Services
BankUptake =10%
MFIUptake =2%
MobileMoney
Uptake =51%
Daily At least oncea week
Several timesa month
Less than once a month
0.5%
0% 0.7%
9.5%
24.6
%
65.3
%
12.4
%
48%
18.5
% 33.5
%
32.2
%
54.9
%
Source: FinScope Tanzania 2017
Source: FinScope Tanzania 2017
43%
26%
5%
5%
3%
2%
2%
2%
13%
I had to receive money from another person
I had to send money to another person
Others
I wanted a safe place to store my money
I wanted to start saving money with an m-money account
I saw posters / billboards / radio / TV advertising that convinced me
Somebody / a person requested I opened an account
I saw other people using it and wanted to try by myself
An agent or sales person convinced me

56 FinScope Tanzania 2017: Dedicated Farmers 57FinScope Tanzania 2017: Dedicated Farmers
fails to present a use case for the dedicated farmer, or poor communication of existing use cases, leaving farmers not fully aware of the full product spectrum and its applications:
• Communication: Some dedicated farmers have a lack of understanding of existing products. This could be addressed through, for example, financial literacy campaigns increasing the understanding of use cases of already existing products and services. For example, better communication around the advantages of a digital footprint and how this helps to build a credit history, could increase the frequency of digital transactions. Further linking this to loan products can create powerful synergies to expand product usage and frequency of usage of this customer segment.
• Product design: There is a lack of use cases for dedicated farmers especially for savings products, loan products and services that are beyond financial services but close to improving productivity among farmers. Most dedicated farmers still prefer to save at home or through tying-up cash in assets by investing in livestock, although formal financial services are available to them. These practices seem more profitable for them than using a bank account, hence FSPs need to offer a product that is of similar nature. A better understanding of the financial behaviour of dedicated farmers is key to designing products that are useful and complement the daily lives of this customer segment.
Lack of communication and product design are reflected in responses to the question why dedicated farmers would not take-up mobile money. The two main responses were that either they would not need mobile money (34% - an indication of either lack of communication or lack of use case/product design) or that they did not trust mobile money providers (23% - an indication of lack of communication) (Figure 42).
The Southern Agricultural Growth Corridor of Tanzania (SAGCOT) region14 plays a crucial role in the nation’s economic transformation and is home to 21.8% of dedicated farmers across Tanzania. Dedicated farmers from the SAGCOT region stand out in terms of certain characteristics, bearing viable opportunities for FSPs.
14 SAGCOT region comprises of Iringa, Njombe, Mbeya, Morogoro, Songwe, Rukwa, Katavi, Ruvuma
Source: FinScope Tanzania 2017
34%
23%
6%
6%
6%
5%
5%
5%
2%
2%
1%
1%
Do not need it
Don’t know what it is
Service fees are too high
Don’t know how to get it
Do not have a smartphone
Do not have required documents
Does not provide anything better than financial ...
No friends or family use this service
Using it is difficult
Do not understand the service fees
Do not trust money is safe in mobile money account
No point of service / agent close to where I live
Chart 42: Main Reasons for Dedicated Farmers Not Using Mobile Money

58 FinScope Tanzania 2017: Dedicated Farmers 59FinScope Tanzania 2017: Dedicated Farmers
1 out of 5 dedicated farmers in the SAGCOT region live in urban areas, where they are closer to urban markets to supply their produce. These farmers can be an interesting segment for FSPs to service, as they are closer to the established financial infrastructure.
More SAGCOT farmers have a formal proof of land ownership than their peers across the country. This presents an opportunity for FSPs to innovate loan products that use land as collateral. See also Live! From the Market 3 for alternative credit scoring methodologies.
Compared to dedicated farmers across the country, more SAGCOT farmers use savings groups, with nearly 1 out of 5 SAGCOT farmers proving to be a member of a savings group (Figure 45). Savings groups are a proven pathway to formal financial inclusion (see also Live! From the Market 8 above). This presents an interesting opportunity for FSPs to link informal to formal financial services.
SECTION 5: DEDICATED FARMERS IN THE SAGCOT REGION)
FACT 1Compared to dedicated farmers across the country, more SAGCOT farmers live in urban areas
Source: FinScope Tanzania 2017
Dedicated Farmers(Base: 1.3M)
Dedicated Farmers in SAGCOT(Base: 5.3M)
25%
19%
FACT 2
Chart 44: Proof of land ownership
Chart 43: Urban-Rural Split of Dedicated Farmers
1 in 4 SAGCOT farmers that own land, have a proof of land ownership
Urban
Rural
Source: FinScope Tanzania 2017
Dedicated FarmersDedicated Farmers in SAGCOT
22%
78%
87%
13%

60 FinScope Tanzania 2017: Dedicated Farmers 61FinScope Tanzania 2017: Dedicated Farmers
FACT 3SAGCOT farmers use savings groups more often
SAGCOT farmers are looking to invest in more productive farming inputs and take supply chain credit to be able to do so. Here, FSPs could leverage the existing behaviour of SAGCOT farmers and offer leasing or layaway products, focusing on agricultural value chains and productive assets in particular. See Live! From the Market 2 above for example of agri-leasing products in practice.Nearly 40% of SAGCOT farmers, compared to 26% of all dedicated farmers in the country, are not diversified and focus on food crops only (Figure 47). A higher proportion (24%) of dedicated farmers in the country are diversified and engage in all three activities - cash crops, food crops, and livestock – compared to SAGCOT farmers (17%). The two groups are similar in terms the proportion of farmers engaged in only cash crops (1-2%), only livestock (1-2%), cash crops and livestock (1%), food crop and livestock (30-32%), and food crop and cash crop (10-13%).
This is mirrored in lower monthly incomes and more reliance on the seasonality of food crops, leaving SAGCOT farmers more vulnerable to shocks. This bears an opportunity for both savings and insurance products. See also Live! From the Market 5 and Live! From the Market 6. The income/wealth of farmers is assessed based on two parameters - Progress out of Poverty Index (PPI) and daily personal income.15 73% of the dedicated farmers in Tanzania fall in the lowest two quintiles as per PPI, indicating the low levels of wealth for a large portion of the farmers. The low level of income of farmers is also highlighted by the fact that 64% of the dedicated farmers earn less than a TZS 2,500 a day.
15 The PPI is a statistically sound, simple, and country-specific calibrated index (for Tanzania it is based on the 2011/2012 household budget survey). The index uses scores given to answers on 10 questions about a household’s character-istics. With the PPI scores, households are classified into 5 quintiles according to the different wealth levels. For the analysis, the first two quintiles and the last two quintiles have been combined.
Chart 45: Use of savings groups
Chart 47: Value chains of dedicated farmers in SAGCOT
Chart 46: Got goods/services in advance and paid for them later
Source: FinScope Tanzania 2017
Dedicated FarmersDedicated Farmers in SAGCOT
16%
18%
FACT 41 in 10 SAGCOT farmers have bought goods on credit before, including farming inputs
11%
FACT 5Dedicated farmers in SAGCOT focus more on food crops and have lower incomes
Value chains of dedicated farmers
32%
26%
24%
13%
2%2% 1%
30%
39%
17%
10%1%
1% 1%
Value chains of dedicated farmers in SAGCOT
Food Crops and Livestock Food Crops Only All Three
Food Crops and Cash Crops Livestock Only Cash Crops Only Cash Crops and Livestock
Source: FinScope Tanzania 2017
62 FinScope Tanzania 2017: Dedicated Farmers 63FinScope Tanzania 2017: Dedicated Farmers
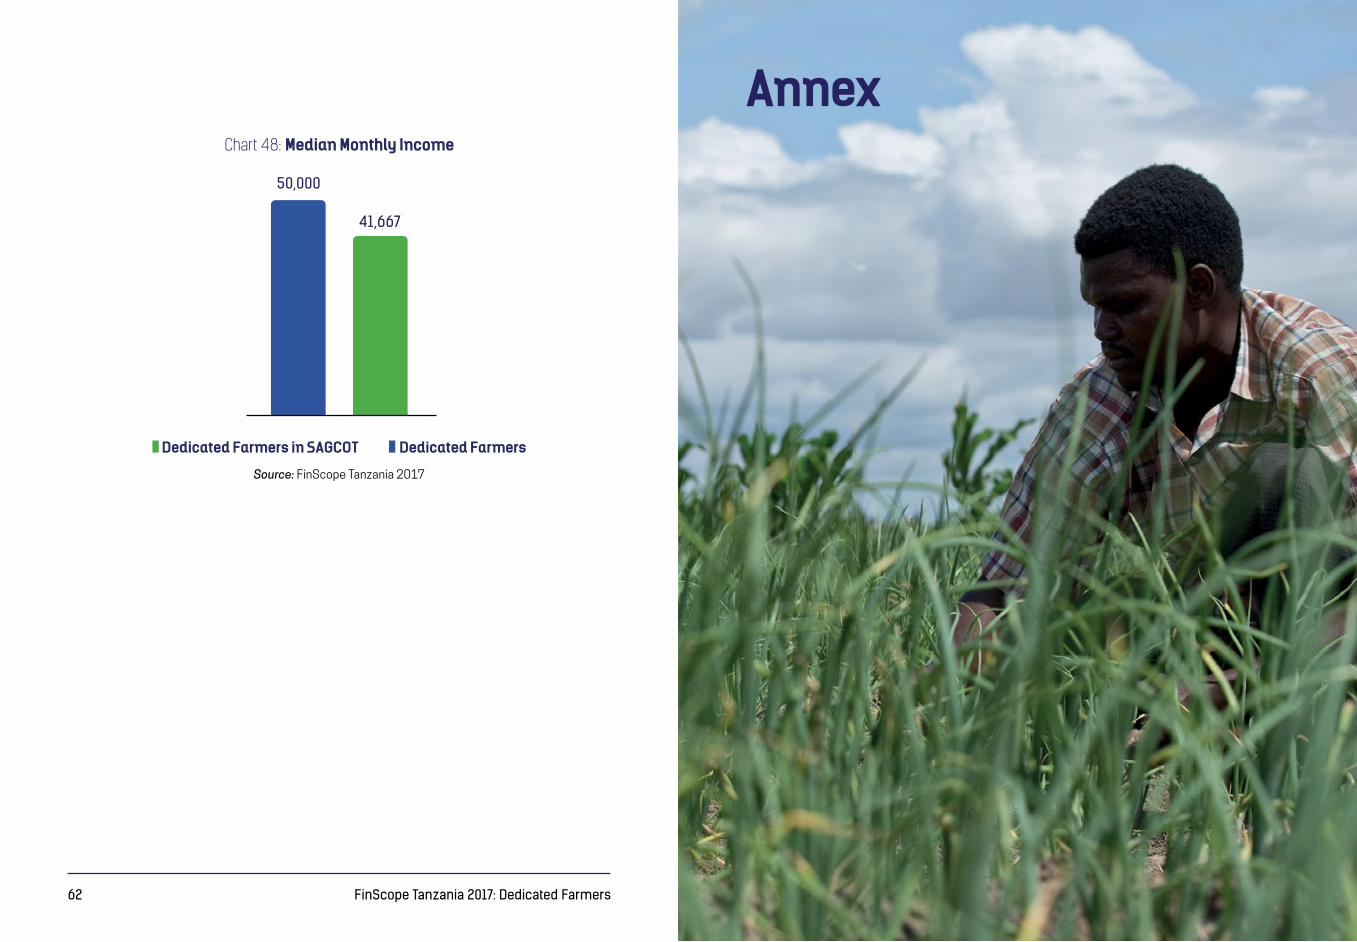
AnnexChart 48: Median Monthly Income
Source: FinScope Tanzania 2017
Dedicated FarmersDedicated Farmers in SAGCOT
50,000
41,667
64 FinScope Tanzania 2017: Dedicated Farmers 65FinScope Tanzania 2017: Dedicated Farmers
ANNEX 1: INCOME OF DEDICATED FARMERS IN TANZANIA ANNEX 2: GEOGRAPHIC DISTRIBUTION OF FINANCIALLY EXCLUDED FARMERS
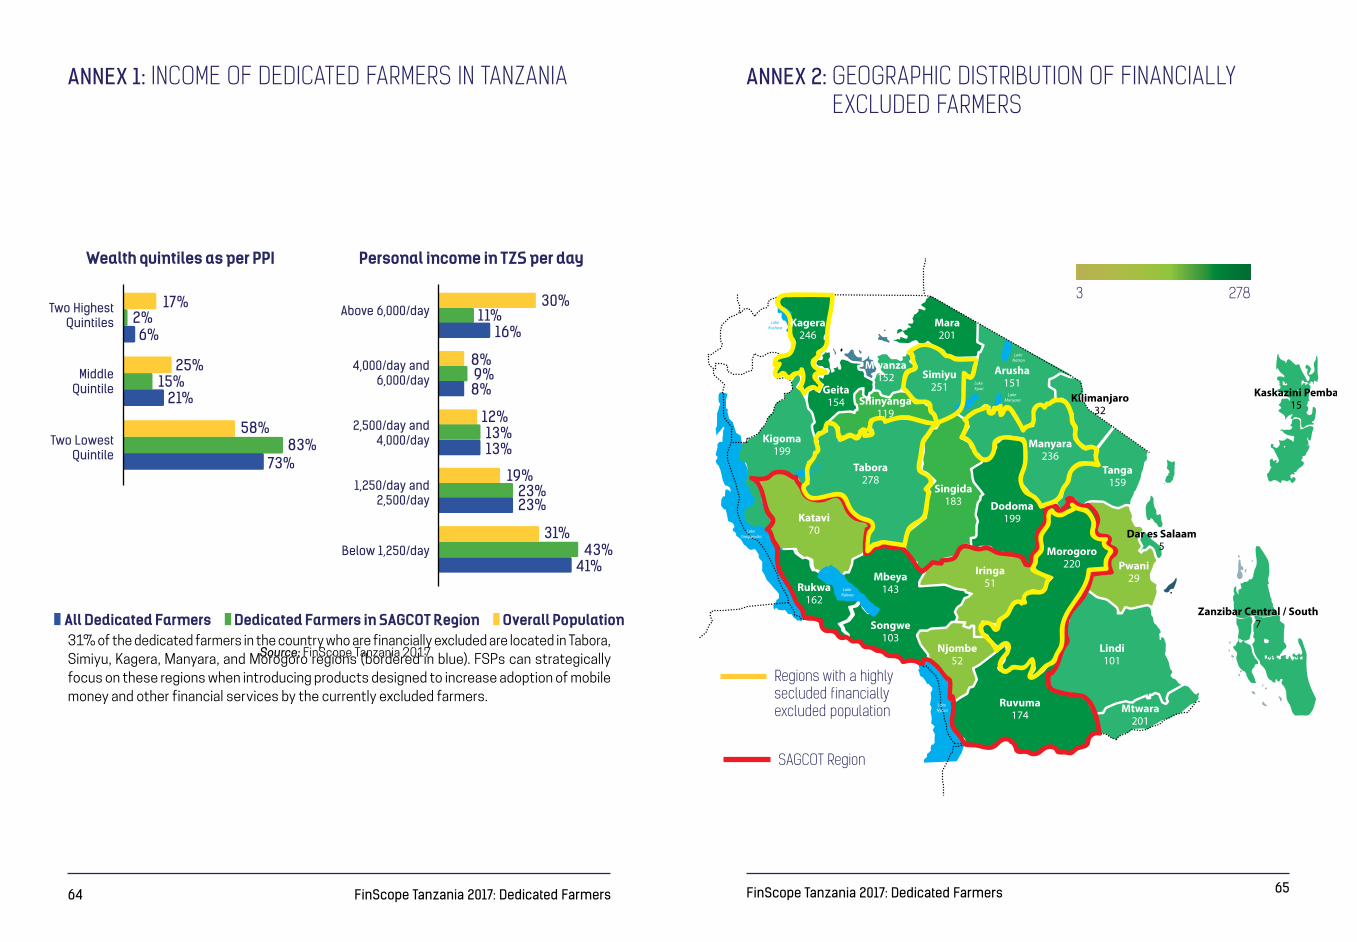
31% of the dedicated farmers in the country who are financially excluded are located in Tabora, Simiyu, Kagera, Manyara, and Morogoro regions (bordered in blue). FSPs can strategically focus on these regions when introducing products designed to increase adoption of mobile money and other financial services by the currently excluded farmers.
SAGCOT Region
Regions with a highly secluded financially excluded population
3 278
Wealth quintiles as per PPI Personal income in TZS per day
All Dedicated Farmers Dedicated Farmers in SAGCOT Region Overall Population
Source: FinScope Tanzania 2017
Two Highest Quintiles
Above 6,000/day
4,000/day and 6,000/day
2,500/day and 4,000/day
1,250/day and 2,500/day
Below 1,250/day
Middle Quintile
Two Lowest Quintile
17% 30%11%
8%
12%
19%
31%43%
41%
13%
23%23%
13%
9%8%
16%
25%
58%83%
73%
21%15%
2%6%
66 FinScope Tanzania 2017: Dedicated Farmers 67FinScope Tanzania 2017: Dedicated Farmers
ANNEX 3: FINANCIAL INCLUSION OF SMALL, MEDIUM AND LARGE-SCALE FARMERS
Dedicated Farmers: Financial Inclusion Status by Type of Farmers
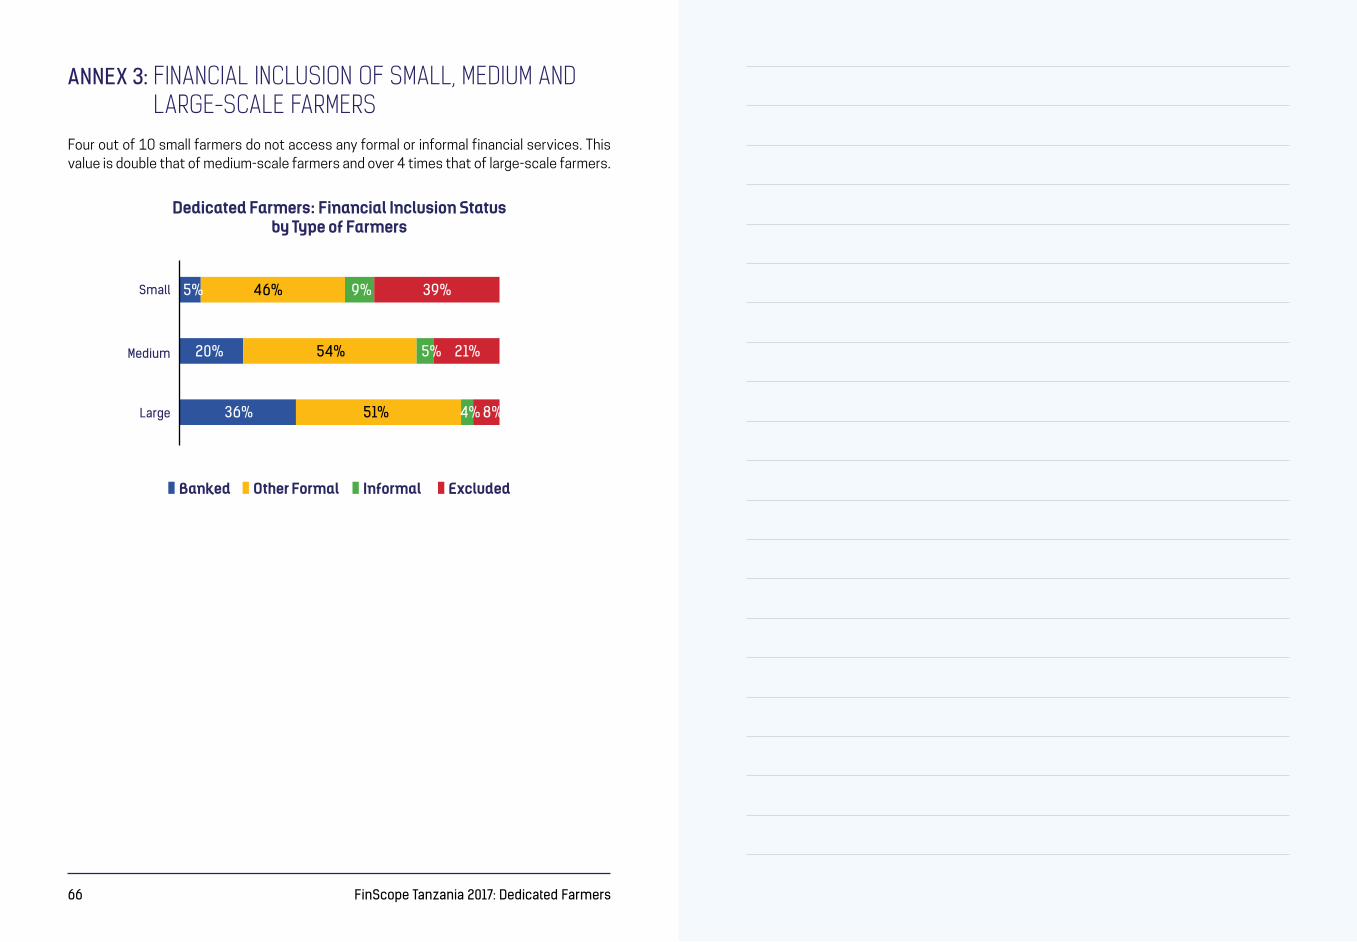
Four out of 10 small farmers do not access any formal or informal financial services. This value is double that of medium-scale farmers and over 4 times that of large-scale farmers.
Small
Medium
Large
5% 46%
54%
51%
5%
4%
20%
36%
21%
8%
9% 39%
Banked Other Formal Informal Excluded

68 FinScope Tanzania 2017: Dedicated Farmers
Ministry of Finance


![Analysis of Rectangular Stiffened Plates Based on FSDT ...journals.iau.ir/article_533187_941593adfb53fefff6a1f1c...stiffened plates include grillage model [1] and orthotropic model](https://img.dokumen.tips/doc/110x75/611987e0da7612591d4b1661/analysis-of-rectangular-stiffened-plates-based-on-fsdt-stiffened-plates.jpg)


