Embed Size (px)
Citation preview

Application Note
Critical RF Measurements in Cable,Satellite and Terrestrial DTV SystemsThe secret to maintaining reliable and high-quality services over different digital television
transmission systems is to focus on critical factors that may compromise the integrity of the
system. This application note describes those critical RF measurements which help to detect
such problems before viewers lose their service and picture completely.

Critical RF Measurements in Cable, Satellite and Terrestrial DTV SystemsApplication Note
Modern digital cable, satellite, and terrestrial systems behavequite differently when compared to traditional analog TV asthe signal is subjected to noise, distortion, and interferencesalong its path. Today s consumers are familiar with simpleanalog TV reception. If the picture quality is poor, an indoorantenna can usually be adjusted to get a viewable picture.Even if the picture quality is still poor, and if the program is ofenough interest, the viewer will usually continue watching aslong as there is sound.
DTV is not this simple. Once reception is lost, the path to recovery isn t always obvious. The problem could becaused by MPEG table errors, or merely from the RF powerdropping below the operational threshold or the cliff point.RF problems can include any of the following: satellite dish orLow-Noise Block Converter (LNB) issues, terrestrial RF signalreflections, poor noise performance, or channel interference;and cable amplifier or modulator faults.
There are a couple of ways to solve DTV reception problems.One solution is to make set-top receivers more tolerant todegraded signals. A better solution is for the network to maintain a clean, high-quality RF signal.
To ensure this, Tektronix provides critical RF measurementsfor 8-VSB, 8PSK, QPSK, COFDM and QAM modulationschemes, integrated with real-time MPEG monitoring in a single instrument, the MTM400A. This instrument can beeconomically deployed at various points within the transmissionchain from downlink and encoding, through multiplexing and remultiplexing to final delivery via uplink, head-end, and transmitter sites.
Using the MTM400A, an operator can make critical RF measurements at a fraction of the cost of dedicated RFtest equipment.
Web-based remote control allows the correct measurements to be made at the appropriate signal layers throughout thetransmission chain, thus ensuring that cost-effective resultscan be guaranteed.
The Key RF parameters
RF signal strength How much signal is being received
Constellation diagram Characterizes link and modulator
performance
MER An early indicator of signal degradation, MER
(Modulation is the ratio of the power of the signal to the
Error Ratio) power of the error vectors, expressed in dB
EVM EVM is a measurement similar to MER but
(Error Vector expressed differently. EVM is the ratio of the
Magnitude) amplitude of the RMS error vector to the
amplitude of the largest symbol, expressed
as a percentage
BER BER is a measure of how hard the Forward
(Bit Error Rate) Error Correction (FEC) has to work
BER = Bits corrected
Total bits sent
TEF The TEF is an indicator that the FEC is failing
(Transport Error Flag) to correct all transmission errors
TEF is also referred to as “Reed-Solomon
uncorrected block counts”
BER or Bit Error RateThis is the ratio of bits in error to total bits delivered. EarlyDTV monitoring receivers provided an indication of bit errorrate as the only measure of digital signal quality. This is simple to implement since the data is usually provided by the tuner demodulator chipset and is easily processed.However, tuners may often output BER after the ForwardError Correction (FEC) has been applied. It is better to measureBER before FEC ( pre-Viterbi ) so that an indication is given ofhow hard the FEC is working. After the Viterbi de-interleaveprocess, Reed-Solomon (RS) decoding will correct erroredbits to give quasi error-free signal at the output.
2 www.tektronix.com/video

Critical RF Measurements in Cable, Satellite and Terrestrial DTV SystemsApplication Note
3www.tektronix.com/video
This is applicable when the transmission system is operatingwell away from the cliff point, where few data errors occurand pre-Viterbi bit error rates are near zero. As the systemapproaches the edge of the cliff, the pre-Viterbi BER increasesgradually, the post-Viterbi more steeply, and the post-FEC(after RS) very steeply.
Therefore, FEC has the effect of sharpening the angle of thecliff. As a result, very sensitive bit error rate measurements dogive a warning, but usually too late for any corrective actionto be taken.
It is still useful to display BER to allow documentation andquantification of the signal quality being delivered. BER canalso be used to log long-term system trends. It is best usedto identify periodic, transient impairments.
BER measurements are usually expressed in engineeringnotation and are often displayed as an instantaneous rateand an average rate. Typical targets are: 1E-09, quasi error-free at 2E-04; critical BER: 1E-03; and out-of-service:greater than 1E-03.
How to Improve on BER — use MERThe TR 101 290 standard describes measurement guidelinesfor DVB systems. One measurement, Modulation Error Ratio(MER), is designed to provide a single figure of merit of the received signal. MER is intended to give an early indication of the ability of the receiver to correctly decode the transmitted signal. In effect, MER compares the actuallocation of a received symbol (as representing a digital valuein the modulation scheme) to its ideal location. As the signaldegrades, the received symbols are located further from theirideal locations and the measured MER value will decrease.Ultimately the symbols will be incorrectly interpreted, and thebit error rate will rise; this is the threshold or cliff point.
Figure 1 shows a graph, which was obtained by connectingthe MER receiver to a test modulator. Noise was then gradually introduced and the MER and pre-Viterbi BER valuesrecorded. With no additive noise, the MER starts at 35 dBwith the BER near zero. Note that as noise is increased theMER gradually decreases, while the BER stays constant.When the MER reaches 26 dB, the BER starts to climb, indicating the cliff point is near. MER indicates progressivesystem degradation long before reaching the cliff point.
The Importance of MERBecause Tektronix equipment can measure to a high value of ultimate MER (typically 38 dB in QAM systems, 37 dB in COFDM systems and 36 dB in 8-VSB systems), then monitoring equipment sited at the head-end modulator can provide early indication of signal degradation as thedownstream MER reduction factor (safety margin) is known — or can be measured close to or at the subscriber site.Common set-top boxes may fail to correctly demodulate or drop out at 24 dB (for 64-QAM) and 30 dB (for 256-QAM). Other typical measuring equipment having a lower ultimate MER measurement will not give such anearly warning of signal degradation.
Typical ultimate MER at a cable (QAM) head-end is 35 dB to37 dB. A typical value of MER in an analog cable system is45 dB. The difference between analog and digital levels is 10 dB, giving a digital MER in distribution systems ofaround 35 dB.
BER Pre-Viterbi v. MER (Calibration ON)
MER (dB)
190.00E+00
2.00E-03
4.00E-03
6.00E-03
8.00E-03
1.00E-02
1.20E-02
1.40E-02
1.60E-02
1.80E-02
20 21 22 23 24 25 26 27 28 29 30 31 32 33 34 35 36
BER
Figure 1. A 64-QAM receiver with MER measurement capability.

Critical RF Measurements in Cable, Satellite and Terrestrial DTV SystemsApplication Note
4 www.tektronix.com/video
EVM or Error Vector MagnitudeEVM is a measurement similar to MER but expressed differently. EVM is expressed as the percentage ratio of theamplitude of the RMS error vector to the amplitude of thelargest symbol. EVM increases as impairment increases, while MER decreases as impairment increases.
MER and EVM can be derived from each other. EVM is thedistance that a carrier is detected on the IQ (in-phase andquadrature) constellation from the theoretical perfect landingpoint (Figure 3) and is the ratio of errored signal vectors tomaximum signal amplitude and is expressed as an RMS
percentage value. EVM is defined in an annex of TR 101 290. The Tektronix MTM400A provides both MER and EVM measurement capability.
Reactive Monitoring
Digital Cliff
Proactive Monitoring
Increasing
Decreasing
Far Away Near OverApproaching Cliff
Proximity to Digital Cliff
Post
-Ree
d/So
lom
on B
ER
Pre-
Vier
bi B
ER
Post
-Vie
rbi B
ER
MeasurementValues
EVM
MER
Figure 2. How MER and EVM can be used to predict how much safety margin thesystem has before BER rapidly rises and reception is lost.
Target symbol
Transmitted symbol
Error vector
Quadrature phase axis
In-phase axis
Figure 3. Error vector.
QAMoutputsignal
Local carrieroscillator
Q
I
90 degreesphase shift
Sum
Figure 4. QAM modulator.
Critical RF Measurements in Cable, Satellite and Terrestrial DTV SystemsApplication Note
5www.tektronix.com/video
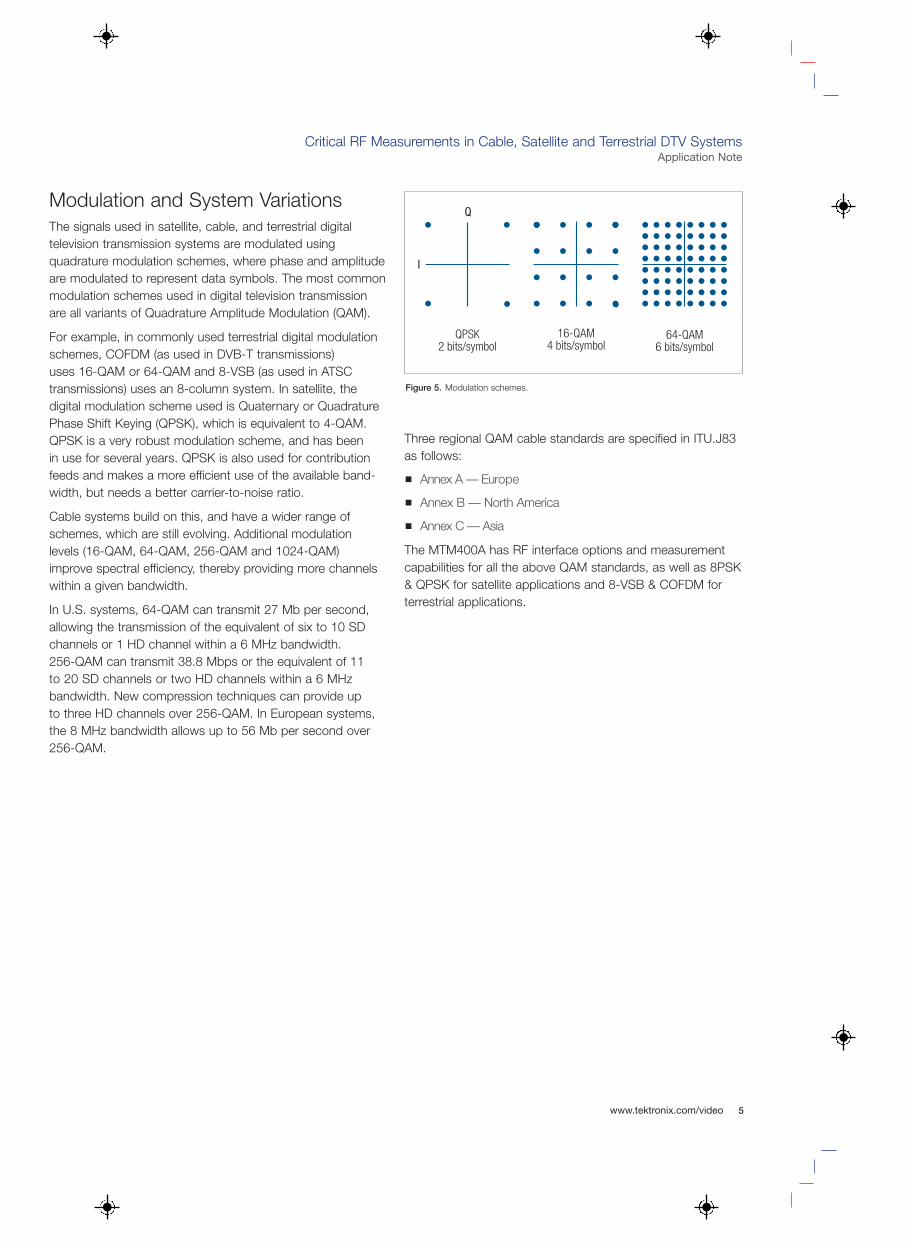
Modulation and System VariationsThe signals used in satellite, cable, and terrestrial digital television transmission systems are modulated using quadrature modulation schemes, where phase and amplitudeare modulated to represent data symbols. The most commonmodulation schemes used in digital television transmissionare all variants of Quadrature Amplitude Modulation (QAM).
For example, in commonly used terrestrial digital modulationschemes, COFDM (as used in DVB-T transmissions) uses 16-QAM or 64-QAM and 8-VSB (as used in ATSCtransmissions) uses an 8-column system. In satellite, the digital modulation scheme used is Quaternary or QuadraturePhase Shift Keying (QPSK), which is equivalent to 4-QAM.QPSK is a very robust modulation scheme, and has been in use for several years. QPSK is also used for contributionfeeds and makes a more efficient use of the available band-width, but needs a better carrier-to-noise ratio.
Cable systems build on this, and have a wider range ofschemes, which are still evolving. Additional modulation levels (16-QAM, 64-QAM, 256-QAM and 1024-QAM)improve spectral efficiency, thereby providing more channelswithin a given bandwidth.
In U.S. systems, 64-QAM can transmit 27 Mb per second,allowing the transmission of the equivalent of six to 10 SDchannels or 1 HD channel within a 6 MHz bandwidth. 256-QAM can transmit 38.8 Mbps or the equivalent of 11 to 20 SD channels or two HD channels within a 6 MHz bandwidth. New compression techniques can provide up to three HD channels over 256-QAM. In European systems,the 8 MHz bandwidth allows up to 56 Mb per second over 256-QAM.
Three regional QAM cable standards are specified in ITU.J83as follows:
Annex A — Europe
Annex B — North America
Annex C — Asia
The MTM400A has RF interface options and measurementcapabilities for all the above QAM standards, as well as 8PSK& QPSK for satellite applications and 8-VSB & COFDM forterrestrial applications.
64-QAM6 bits/symbol
QPSK2 bits/symbol
16-QAM4 bits/symbol
Q
I
Figure 5. Modulation schemes.

Critical RF Measurements in Cable, Satellite and Terrestrial DTV SystemsApplication Note
6 www.tektronix.com/video
Constellation DisplaysThe constellation display is the digital equivalent of a vectorscope display, showing in-phase (I) and quadrature (Q)components of the QAM signal. A symbol is the smallestpiece of information transmitted in a given modulation system.
For 64-QAM, a symbol represents 6 bits. This is then plotted as a single point. These symbol bits have beenprocessed using a complex transcoding process from the original MPEG-2 transport stream. This involves Reed-Solomon encoding, interleaving, randomization, trellis for QAM Annex B systems and convolutional (Viterbi) encoding for QPSK systems. The idea is to protect and correct bit errors, provide immunity from burst noise, and spread energy evenly throughout the spectrum. Afterreversing these processes in the decoder, quasi error-free bitstreams must be restored. Because of this error correction,merely inspecting the transport stream will not provide anyindication that channel or modulators and processing amplifiers are inducing errors, pushing the system closer to the digital cliff point.
Once Transport Error Flags (TEFs) start being reported in the MPEG stream, it is usually too late to take any corrective action.
The Constellation DiagramThis can be considered as an array of 2-D eye diagrams ofthe digital signal, with symbol landing points having acceptablelimits or decision boundaries. The closer the points aretogether in the cloud of received symbols, the better thesignal quality. Since the diagram maps amplitude and phaseon the screen, the shape of the array can be used to diagnoseand determine many system or channel faults and distortions,and help pin down the cause.
Constellation diagrams are useful for identifying the followingmodulation problems:
Amplitude imbalance
Quadrature error
Coherent interference
Phase noise, amplitude noise
Phase error
Modulation Error Ratio
Inter-symbol Interference Zones
Transmitted Symbols (shown as dots) are the individual symbol landings
Decision Boundaries
Quadrature phase axis
In-phase axis
Figure 6. Constellation basics.

Remote ConstellationThe MTM400A uses Web-browser technology, so it is uniquein that the constellation display can be viewed in a differentlocation or even country to an unmanned test probe positionusing the Internet or a dedicated network. The user interfacealso has adjustable persistence so the spots can be made tofade away on older carriers received, like traditional instruments.
Note: The MTM400A screen shots below are all from instruments with tests set up so that MER and EVM are similar in all cases. Only the constellation shapes differ.
Quadrature ErrorQuadrature error pushes symbol landing-points nearer to theboundary limits and therefore reduces noise margin. It occurswhen I and Q are not spaced exactly 90 degrees apart. Theresult is that the constellation diagram loses its squarenessand takes on the appearance of a parallelogram or rhombus(see Figures 7 and 8).
Critical RF Measurements in Cable, Satellite and Terrestrial DTV SystemsApplication Note
7www.tektronix.com/video
Figure 8. A screen capture from an MTM400A, showing quadrature error with IQphase error of five degrees.
Quadrature phase axis
In-phase axis
Figure 9. A difference in gain between the in-phase and quadrature components ofthe constellation shapes it into a rectangle instead of a square.
Figure 10. This MTM400A plot shows an IQ amplitude imbalance of 10%. The circlesaround each IQ sample represents the overall MER (25.8 dB).
Amplitude Imbalance
Quadrature phase axis
In-phase axis
Figure 7. An error in quadrature between the in-phase and quadrature axes of theconstellation shapes it into a diamond instead of a square.

Critical RF Measurements in Cable, Satellite and Terrestrial DTV SystemsApplication Note
8 www.tektronix.com/video
Noise ErrorsNoise is the most common and unavoidable impairment toany signal, including QAM. Additive White Gaussian Noise(AWGN) is the normal type of noise impairment. As it is white (flat power density function in frequency) and gaussian(mathematically normal amplitude density), it spreads thereceived symbols in a cluster around the ideal location.
Gain CompressionThis MTM400A live signal display allows you to see gaincompression, causing rounding of the corner edges, in both I and Q axes, but only where the modulator, or fibertransport system, is being driven to its limits. This is happeningat higher amplitude levels, showing non-linearity. It appears asa spherical or fish-eye lens view.
Figure 11. Noise error (64-QAM cable system).
Figure 13. MTM400A plot shows gain compression. Figure 14. This plot is from a source with seriously errored gain compression.
Figure 12. Noise error (QPSK satellite source).

Coherent InterferenceHere a channel interferer or harmonic component happens tobe phase-locked to the IQ signal. This results in an array ofrings, or doughnuts.
Phase Noise (Jitter in I and Q)Any carrier source or local oscillator in the signal chain hasphase noise or phase jitter that is superimposed onto thereceived signal. Phase noise is displayed as concentric ring-arcs of carrier symbols.
Acceptable SignalThe IQ gain and phase errors are normally negligible in modern all-digital modulators. Such errors are not misalignment but rather equipment failure. Compression, on the other hand, can be generated in modulators, up-converters and transmission network.
Figure 18 shows what a normal signal looks like.
Critical RF Measurements in Cable, Satellite and Terrestrial DTV SystemsApplication Note
9www.tektronix.com/video
Figure 16. Phase noise (jitter in I and Q).
Figure 18. A correctly operating 64-QAM cable system.
Figure 15. Coherent interference.
Figure 17. The effect of a DC offset on the In-phase axis, should the carrier besuppressed by 10%. The display is shifted to the right.
Critical RF Measurements in Cable, Satellite and Terrestrial DTV SystemsApplication Note
10 www.tektronix.com/video
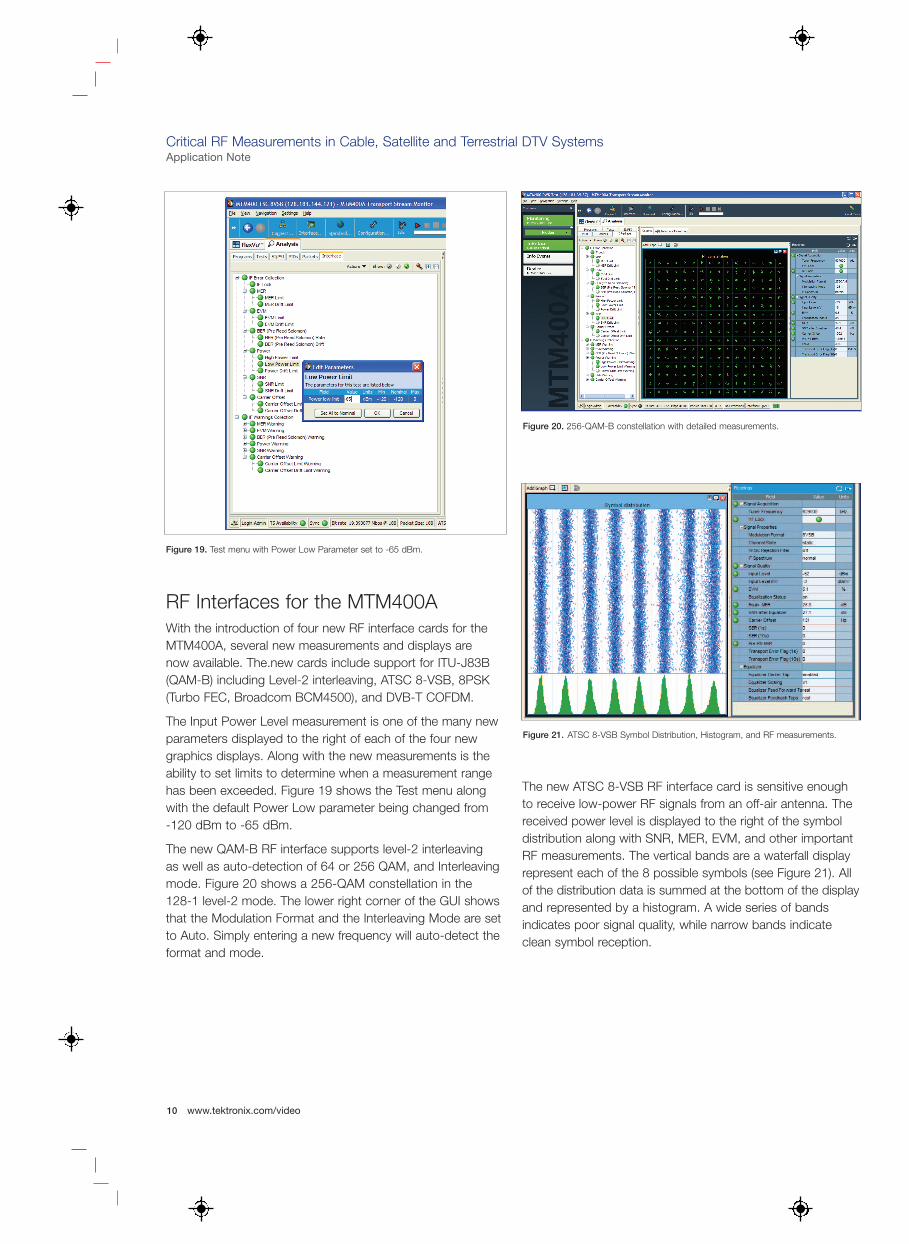
RF Interfaces for the MTM400AWith the introduction of four new RF interface cards for theMTM400A, several new measurements and displays are now available. The.new cards include support for ITU-J83B(QAM-B) including Level-2 interleaving, ATSC 8-VSB, 8PSK(Turbo FEC, Broadcom BCM4500), and DVB-T COFDM.
The Input Power Level measurement is one of the many newparameters displayed to the right of each of the four newgraphics displays. Along with the new measurements is theability to set limits to determine when a measurement rangehas been exceeded. Figure 19 shows the Test menu alongwith the default Power Low parameter being changed from -120 dBm to -65 dBm.
The new QAM-B RF interface supports level-2 interleaving as well as auto-detection of 64 or 256 QAM, and Interleavingmode. Figure 20 shows a 256-QAM constellation in the 128-1 level-2 mode. The lower right corner of the GUI showsthat the Modulation Format and the Interleaving Mode are setto Auto. Simply entering a new frequency will auto-detect theformat and mode.
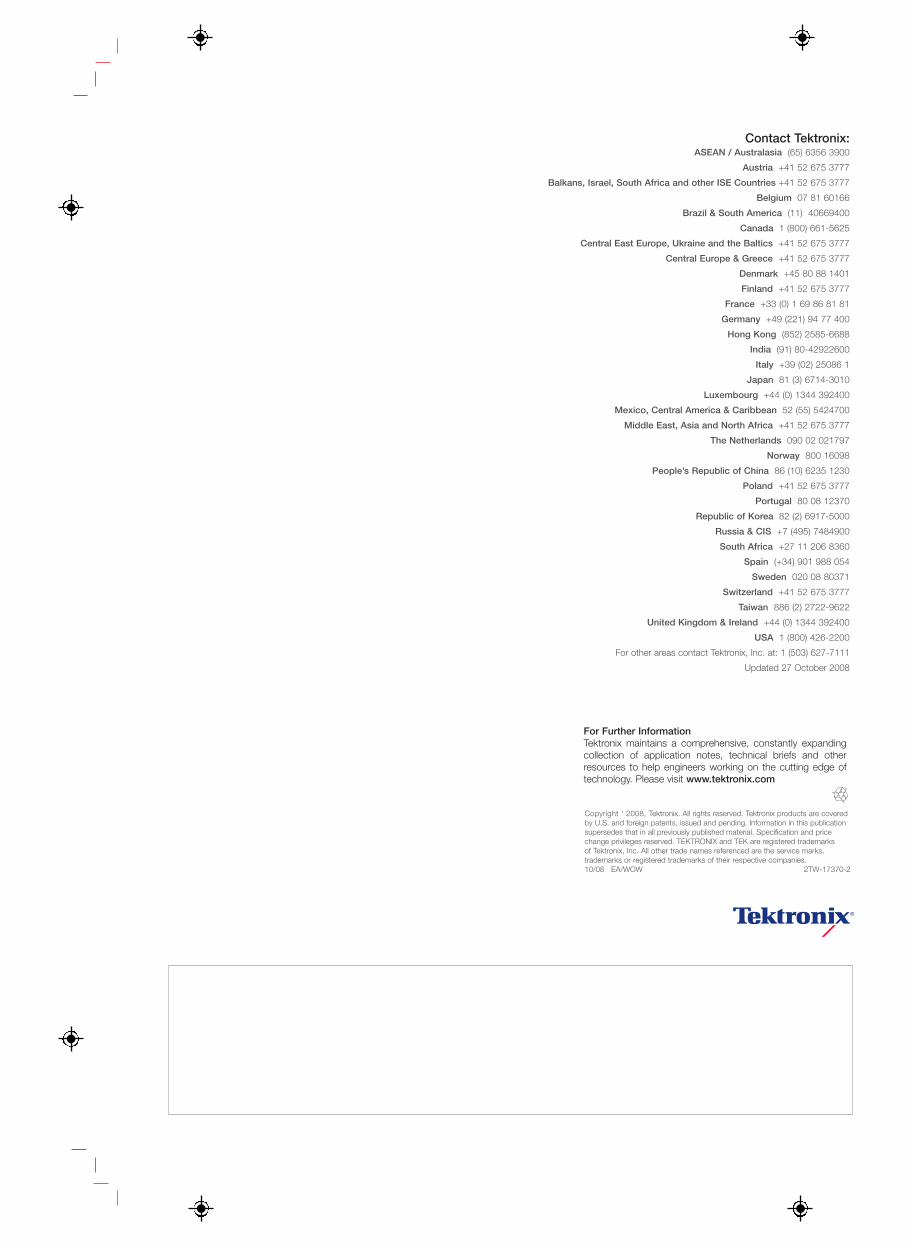
The new ATSC 8-VSB RF interface card is sensitive enough to receive low-power RF signals from an off-air antenna. Thereceived power level is displayed to the right of the symboldistribution along with SNR, MER, EVM, and other importantRF measurements. The vertical bands are a waterfall displayrepresent each of the 8 possible symbols (see Figure 21). Allof the distribution data is summed at the bottom of the displayand represented by a histogram. A wide series of bands indicates poor signal quality, while narrow bands indicateclean symbol reception.
Figure 19. Test menu with Power Low Parameter set to -65 dBm.
Figure 20. 256-QAM-B constellation with detailed measurements.
Figure 21. ATSC 8-VSB Symbol Distribution, Histogram, and RF measurements.

Multipath or ghost signals can be quantified within the 8-VSBsignal by viewing the Equalizer tap graph. The x-axis startswith 6.7 s of pre-ghost information and ends at 45.5 s.The example shown in Figure 22 includes several ghosts ormultipath signals on the same frequency. The first ghost isdown 21 dB at 5.5 s before the carrier, another down 21 dBat 20 s after the carrier, and the last ghost down 34 dB at38 s after the carrier.
DVB-S bandwidth has been expanded through the use of the8PSK modulation scheme. This increased bandwidth allowsfor multiple HD channels on a single satellite transponder.Figure 23 shows an 8PSK signal being received from a livesatellite feed. Several different 8PSK modulation schemesexist, and the MTM400A uses the Turbo 8PSK support bythe BCM4500 demodulator.
Critical RF Measurements in Cable, Satellite and Terrestrial DTV SystemsApplication Note
11www.tektronix.com/video
Figure 22. ATSC 8-VSB carrier at 647 MHz with several ghosts.
Figure 23. 8PSK constellation display with RF measurements.

COFDM is the modulation scheme used by DVB-T for terrestrial transmission. COFDM allows for QPSK, 16-QAMand 64-QAM formats. It allows for a hierarchical mode thatcan transmit one or two transports at the same time. Eachcarrier is divided into 2k or 8k smaller carriers. These lowerdata rate carries virtually eliminate Multipath from the signal.Figure 24 shows a 16-QAM COFDM signal measured from anoff-air signal.
Figure 25 shows an Impulse Response graph that plots themagnitude of similar COFDM carriers at the same frequencyat different arrival times (multipath).
Critical RF Measurements in Cable, Satellite and Terrestrial DTV SystemsApplication Note
12 www.tektronix.com/video
Figure 24. COFDM 16-QAM constellation and RF measurements.
Figure 25. COFDM Impulse Response.

Critical RF Measurements in Cable, Satellite and Terrestrial DTV SystemsApplication Note
13www.tektronix.com/video
Trends over timeAs the RF signal deteriorates over time, it becomes increasinglyimportant to contrast measurements and problems againstother measurements. Looking at a live set of measurementparameters is important, but plotting long-term history across several different measurements allows one to see therelationship one impairment has on another measurement(e.g., drop in power affects SNR and MER). Problems cancreep into the signal from many different outside sourcessuch as wind on the dish or LNB, temperature, RF noise,
atmospheric problems such as heavy rain storms, etc. Figure26 shows four different measurements over 24 hours. Thebold blue line denotes the average measurement, and thegray band denotes the min/max pairs over each sample.Figure 27 shows a similar graph but includes seven days of history. The blue band shows the limit-line for triggering a warning-alarm, and the red band shows the limit-line fortriggering an error-alarm.
Figure 26. Long-term trend plots showing MER, EVM, Power, and SNR over an entireday (Blue=Avg, Gray=min/max pairs).
Figure 27. Long-term trend plots showing an entire week, along with blue warning limits and red error limits.

Critical RF Measurements in Cable, Satellite and Terrestrial DTV SystemsApplication Note
14 www.tektronix.com/video
ConclusionsIt is better to predict system problems long before critical revenue earning services go off the air, rather than cure them.
MER measurements are able to measure small changes in transmitter and system performance and are one of the best single figures-of-merit for any cable and satellitetransmissions system. EVM and more traditional BER areuseful for standard cross-equipment checks and as an aid to identify short-term signal degradation.
Constellation displays help provide a reliable health checkfor RF transmission systems by indicating artifacts, distortion,or equipment drift.
By combining these critical RF measurements with comprehensive MPEG transport stream monitoring andalarming in a single probe, system problems can be detected at an early stage, before viewers are affected.
With the MTM400A, Tektronix is able to provide all the criticalRF measurements and interfaces, integrated with MPEGmeasurements in a single cost-effective monitoring probe.
ReferencesInternational Telecommunications Union, ITU-T J.83, Series J:Digital multi-program system for television, sound and dataservices for cable distribution (04/97).
ATSC Recommended Practice A/54A: Guide to the Use ofthe ATSC Digital Television Standard.
Measurement Guidelines for DVB systems, ETSI TechnicalReport, TR101 290 V1.2.1 (2001-05) Digital VideoBroadcasting (DVB); European Telecommunications Standard Institute.
Digital Video Broadcasting (DVB); Framing structure, channelcoding and modulation for cable systems EN 300 429 V1.2.1(1998-04) European Standard (Telecommunications series).
Broadcom BCM4500 Advanced Modulation SatelliteReceiver: supporting QPSK and 8PSK with turbo code FEC,as well as DVB-S, DirecTV, and Digicipher-II QPSK systems.

Critical RF Measurements in Cable, Satellite and Terrestrial DTV SystemsApplication Note
15www.tektronix.com/video
For Further InformationTektronix maintains a comprehensive, constantly expandingcollection of application notes, technical briefs and otherresources to help engineers working on the cutting edge oftechnology. Please visit www.tektronix.com
Copyright ' 2008, Tektronix. All rights reserved. Tektronix products are covered by U.S. and foreign patents, issued and pending. Information in this publicationsupersedes that in all previously published material. Specification and pricechange privileges reserved. TEKTRONIX and TEK are registered trademarks of Tektronix, Inc. All other trade names referenced are the service marks, trademarks or registered trademarks of their respective companies. 10/08 EA/WOW 2TW-17370-2
Contact Tektronix:ASEAN / Australasia (65) 6356 3900
Austria +41 52 675 3777
Balkans, Israel, South Africa and other ISE Countries +41 52 675 3777
Belgium 07 81 60166
Brazil & South America (11) 40669400
Canada 1 (800) 661-5625
Central East Europe, Ukraine and the Baltics +41 52 675 3777
Central Europe & Greece +41 52 675 3777
Denmark +45 80 88 1401
Finland +41 52 675 3777
France +33 (0) 1 69 86 81 81
Germany +49 (221) 94 77 400
Hong Kong (852) 2585-6688
India (91) 80-42922600
Italy +39 (02) 25086 1
Japan 81 (3) 6714-3010
Luxembourg +44 (0) 1344 392400
Mexico, Central America & Caribbean 52 (55) 5424700
Middle East, Asia and North Africa +41 52 675 3777
The Netherlands 090 02 021797
Norway 800 16098
People’s Republic of China 86 (10) 6235 1230
Poland +41 52 675 3777
Portugal 80 08 12370
Republic of Korea 82 (2) 6917-5000
Russia & CIS +7 (495) 7484900
South Africa +27 11 206 8360
Spain (+34) 901 988 054
Sweden 020 08 80371
Switzerland +41 52 675 3777
Taiwan 886 (2) 2722-9622
United Kingdom & Ireland +44 (0) 1344 392400
USA 1 (800) 426-2200
For other areas contact Tektronix, Inc. at: 1 (503) 627-7111
Updated 27 October 2008


![Quantum Dots Talking through a Quantum Wirehome.itp.ac.ru/~qd2010/Talks/Yudson_Talk.pdf · n)] ln 2 1 2 TW 1 TW TW 1 TW Exactly as many as required to renormalize the product of n](https://img.dokumen.tips/doc/110x75/5fb2b7588505d05ed27c1cec/quantum-dots-talking-through-a-quantum-qd2010talksyudsontalkpdf-n-ln-2-1.jpg)


