Embed Size (px)
Citation preview

The Triple Bottom Line: What Is It and How Does It Work?
Timothy F. Slaper, Ph.D.: Director of Economic Analysis, Indiana Business Research Center, Indiana
University Kelley School of Business Tanya J. Hall: Economic Research Analyst, Indiana Business Research Center, Indiana University Kelley
School of Business
6 Indiana University Kelley School of Business, Indiana Business Research Center
Sustainability has been an often mentioned goal ofbusinesses, nonprofits and
governments in the past decade, yet measuring the degree to which an
organization is being sustainable or pursuing sustainable growth can be difficult.
John Elkington strove to measure sustainability during the mid-1990s by
encompassing a new framework to measure performance in corporate America.1
This accounting framework, called the triple bottom line (TBL), went beyond the
traditional measures of profits, return on investment, and shareholder value to
include environmental and social dimensions. By focusing on comprehensive
investment results— that is, with respect to performance along the interrelated
dimensions of profits, people and the planet— triple bottom line reporting can be
an important tool to support sustainability goals. Interest in triple bottom line
accounting has been growing across for-profit, nonprofit and government sectors.
Many businesses and nonprofit organizations have adopted the TBL sustainability
framework to evaluate their performance, and a similar approach has gained
currency with governments at the federal, state and local levels.
This article reviews the TBL concept, explains how it can be useful for businesses,
policy-makers and economic development practitioners and highlights some
current examples of putting the TBL into practice.
The Triple Bottom Line Defined
The TBL is an accounting framework that incorporates three dimensions of
performance: social, environmental and financial. This differs from traditional
reporting frameworks as it includes ecological (or environmental) and social
measures that can be difficult to assign appropriate means of measurement.
The TBL dimensions are also commonly called the three Ps: people, planet and
profits. We will refer to these as the 3Ps.
Well before Elkington introduced the sustainability concept as ―triple bottom line,‖
environmentalists wrestled with measures of, and frameworks for, sustainability.
Academic disciplines organized around sustainability have multiplied over the last
30 years. People inside and outside academia who have studied and practiced
sustainability would agree with the general definition of Andrew Savitz for TBL. The
TBL ―captures the essence of sustainability by measuring the impact of an
organization’s activities on the world ... including both its profitability and
shareholder values and its social, human and environmental capital.‖2
The trick isn’t defining TBL. The trick is measuring it.
Calculating the TBL

The 3Ps do not have a common unit of measure. Profits are measured in dollars.
What is social capital measured in? What about environmental or ecological
health? Finding a common unit of measurement is one challenge.
Some advocate monetizing all the dimensions of the TBL, including social welfare
or environmental damage. While that would have the benefit of having a
common unit—dollars—many object to putting a dollar value on wetlands or
endangered species on strictly philosophical grounds. Others question the method
of finding the right price for lost wetlands or endangered species.
Another solution would be to calculate the TBL in terms of an index. In this way,
one eliminates the incompatible units issue and, as long as there is a universally
accepted accounting method, allows for comparisons between entities, e.g.,
comparing performance between companies, cities, development projects or
some other benchmark.
An example of an index that compares a county versus the nation’s performance
for a variety of components is the Indiana Business Research Center’s Innovation
Index.
There remains some subjectivity even when using an index however.
For example, how are the index components weighted?
Would each ―P‖ get equal weighting? What about the sub-components within
each ―P‖?
Do they each get equal weighting? Is the people category more important than
the planet? Who decides? Another option would do away with measuring
sustainability using dollars or using an index. If the users of the TBL had the stomach
for it, each sustainability measure would stand alone. ―Acres of wetlands‖ would
be a measure, for example, and progress would be gauged based on wetland
creation, destruction or status quo over time. The downside to this approach is the
proliferation of metrics that may be pertinent to measuring sustainability. The TBL
user may get metric fatigue. Having discussed the difficulties with calculating the
TBL, we turn our attention to potential metrics for inclusion in a TBL calculation.
Following that, we will discuss how businesses and other entities have applied the
TBL framework.
What Measures Go into the Index?
There is no universal standard method for calculating the TBL. Neither is there a
universally accepted standard for the measures that comprise each of the three
TBL categories. This can be viewed as a strength because it allows a user to adapt
the general framework to the needs of different entities (businesses or nonprofits),
different projects or policies (infrastructure investment or educational programs), or
different geographic boundaries (a city, region or country).
Both a business and local government agency may gauge environmental
sustainability in the same terms, say reducing the amount of solid waste that goes
into landfills, but a local mass transit might measure success in terms of passenger
miles, while a for-profit bus company would measure success in terms of earnings
per share. The TBL can accommodate these differences.
Additionally, the TBL is able to be case (or project) specific or allow a broad
scope—measuring impacts across large geographic boundaries—or a narrow
geographic scope like a small town. A case (or project) specific TBL would
measure the effects of a particular project in a specific location, such as a
community building a park. The TBL can also apply to infrastructure projects at the
state level or energy policy at the national level.
The level of the entity, type of project and the geographic scope will drive many
of the decisions about what measures to include. That said, the set of measures will
ultimately be determined by stakeholders and subject matter experts and the
ability to collect the necessary data. While there is significant literature on the
appropriate measures to use for sustainability at the state or national levels, in the
end, data availability will drive the TBL calculations.
Many of the traditional sustainability measures, measures vetted through
academic discourse, are presented below.
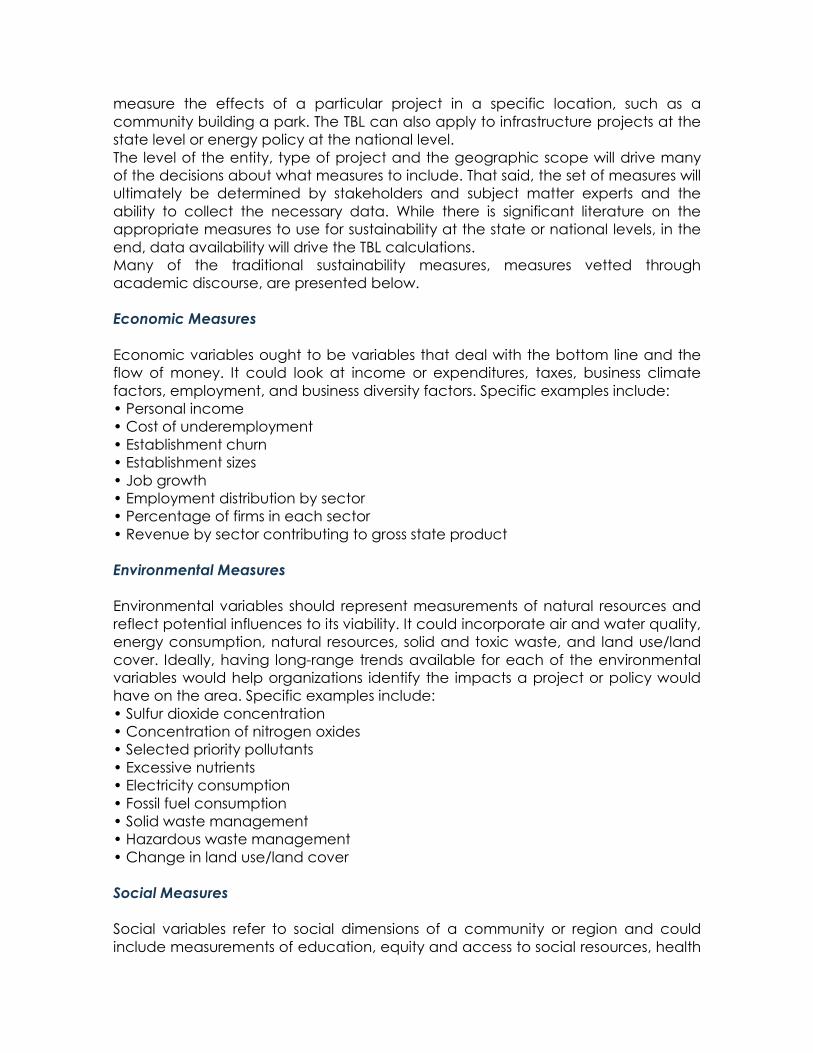
Economic Measures
Economic variables ought to be variables that deal with the bottom line and the
flow of money. It could look at income or expenditures, taxes, business climate
factors, employment, and business diversity factors. Specific examples include:
• Personal income
• Cost of underemployment
• Establishment churn
• Establishment sizes
• Job growth
• Employment distribution by sector
• Percentage of firms in each sector
• Revenue by sector contributing to gross state product
Environmental Measures
Environmental variables should represent measurements of natural resources and
reflect potential influences to its viability. It could incorporate air and water quality,
energy consumption, natural resources, solid and toxic waste, and land use/land
cover. Ideally, having long-range trends available for each of the environmental
variables would help organizations identify the impacts a project or policy would
have on the area. Specific examples include:
• Sulfur dioxide concentration
• Concentration of nitrogen oxides
• Selected priority pollutants
• Excessive nutrients
• Electricity consumption
• Fossil fuel consumption
• Solid waste management
• Hazardous waste management
• Change in land use/land cover
Social Measures
Social variables refer to social dimensions of a community or region and could
include measurements of education, equity and access to social resources, health

and well-being, quality of life, and social capital. The examples listed below are a
small snippet of potential variables:
• Unemployment rate
• Female labor force participation rate
• Median household income
• Relative poverty
• Percentage of population with a post-secondary degree or certificate
• Average commute time
• Violent crimes per capita
• Health-adjusted life expectancy
Data for many of these measures are collected at the state and national levels,
but are also available at the local or community level. Many are appropriate for a
community to use when constructing a TBL. However, as the geographic scope
and the nature of the project narrow, the set for local or community-based
projects, the TBL measures of success are best determined locally.
There are several similar approaches to secure stakeholder participation and input
in designing the TBL framework: developing a decision matrix to incorporate public
preferences into project planning and decision-making,3 using a ―narrative
format‖ to solicit shareholder participation and comprehensive project
evaluation,4 and having stakeholders rank and weigh components of a
sustainability framework according to community priorities.5 For example, a
community may consider an important measure of success for an entrepreneurial
development program to be the number of woman-owned companies formed
over a five-year time period. Ultimately, it will be the organization’s responsibility to
produce a final set of measures applicable to the task at hand.
Variations of the Triple Bottom Line Measurement
The application of the TBL by businesses, nonprofits and governments are
motivated by the principles of economic, environmental and social sustainability,
but differ with regard to the way they measure the three categories of outcomes.
Proponents who have developed and applied sustainability assessment
frameworks like the TBL encountered many challenges, chief among them, how to
make an index that is both comprehensive and meaningful and how to identify
suitable data for the variables that compose the index.
The Genuine Progress Indicator (GPI), for example, consists of 25 variables that
encompass economic, social and environmental factors.
Those variables are converted into monetary units and summed into a single,
dollar-denominated measure.6
Minnesota developed its own progress indicator comprised of 42 variables that
focused on the goals of a healthy economy and gauged progress in achieving
these goals.7
There is a large body of literature on integrated assessment 8 and sustainability
measures that grew out of the disciplines that measure environmental impact.
These are not constrained by strict economic theory for measuring changes in
social welfare.9 Researchers in environmental policy argue that the three
categories—economic, social and environmental—need to be integrated in order
to see the complete picture of the consequences that a regulation, policy or
economic development project may have and to assess policy options and
tradeoffs.
Who Uses the Triple Bottom Line?
Businesses, nonprofits and government entities alike can all use the TBL.
Businesses
The TBL and its core value of sustainability have become compelling in the business
world due to accumulating anecdotal evidence of greater long-term profitability.
For example, reducing waste from packaging can also reduce costs.
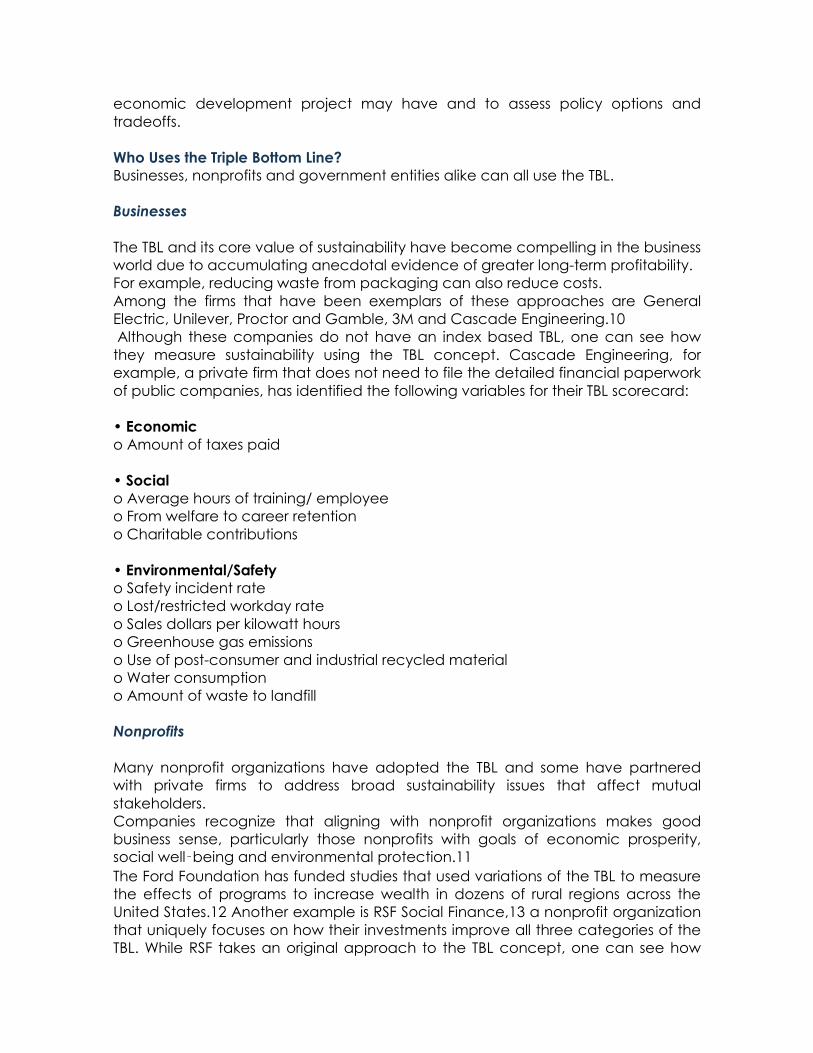
Among the firms that have been exemplars of these approaches are General
Electric, Unilever, Proctor and Gamble, 3M and Cascade Engineering.10
Although these companies do not have an index based TBL, one can see how
they measure sustainability using the TBL concept. Cascade Engineering, for
example, a private firm that does not need to file the detailed financial paperwork
of public companies, has identified the following variables for their TBL scorecard:
• Economic
o Amount of taxes paid
• Social
o Average hours of training/ employee
o From welfare to career retention
o Charitable contributions
• Environmental/Safety
o Safety incident rate
o Lost/restricted workday rate
o Sales dollars per kilowatt hours
o Greenhouse gas emissions
o Use of post-consumer and industrial recycled material
o Water consumption
o Amount of waste to landfill
Nonprofits
Many nonprofit organizations have adopted the TBL and some have partnered
with private firms to address broad sustainability issues that affect mutual
stakeholders.
Companies recognize that aligning with nonprofit organizations makes good
business sense, particularly those nonprofits with goals of economic prosperity,
social well‑being and environmental protection.11
The Ford Foundation has funded studies that used variations of the TBL to measure
the effects of programs to increase wealth in dozens of rural regions across the
United States.12 Another example is RSF Social Finance,13 a nonprofit organization
that uniquely focuses on how their investments improve all three categories of the
TBL. While RSF takes an original approach to the TBL concept, one can see how
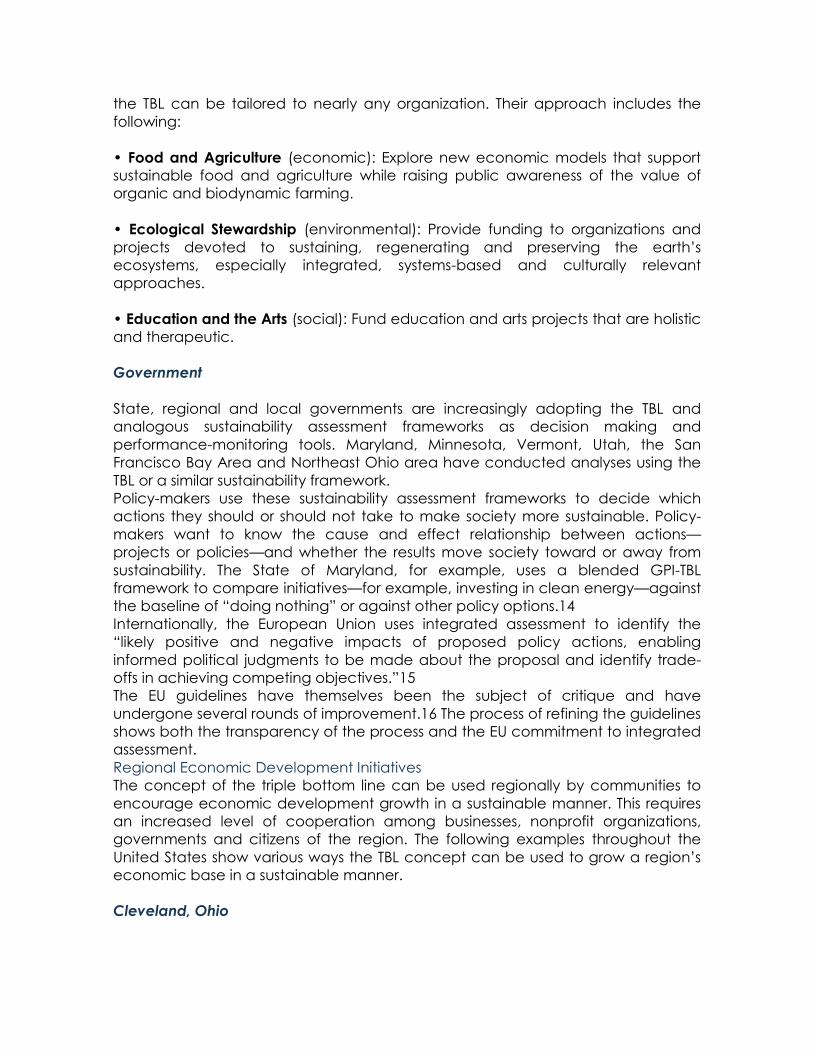
the TBL can be tailored to nearly any organization. Their approach includes the
following:
• Food and Agriculture (economic): Explore new economic models that support
sustainable food and agriculture while raising public awareness of the value of
organic and biodynamic farming.
• Ecological Stewardship (environmental): Provide funding to organizations and
projects devoted to sustaining, regenerating and preserving the earth’s
ecosystems, especially integrated, systems-based and culturally relevant
approaches.
• Education and the Arts (social): Fund education and arts projects that are holistic
and therapeutic.
Government
State, regional and local governments are increasingly adopting the TBL and
analogous sustainability assessment frameworks as decision making and
performance-monitoring tools. Maryland, Minnesota, Vermont, Utah, the San
Francisco Bay Area and Northeast Ohio area have conducted analyses using the
TBL or a similar sustainability framework.
Policy-makers use these sustainability assessment frameworks to decide which
actions they should or should not take to make society more sustainable. Policy-
makers want to know the cause and effect relationship between actions—
projects or policies—and whether the results move society toward or away from
sustainability. The State of Maryland, for example, uses a blended GPI-TBL
framework to compare initiatives—for example, investing in clean energy—against
the baseline of ―doing nothing‖ or against other policy options.14
Internationally, the European Union uses integrated assessment to identify the
―likely positive and negative impacts of proposed policy actions, enabling
informed political judgments to be made about the proposal and identify trade-
offs in achieving competing objectives.‖15
The EU guidelines have themselves been the subject of critique and have
undergone several rounds of improvement.16 The process of refining the guidelines
shows both the transparency of the process and the EU commitment to integrated
assessment.
Regional Economic Development Initiatives
The concept of the triple bottom line can be used regionally by communities to
encourage economic development growth in a sustainable manner. This requires
an increased level of cooperation among businesses, nonprofit organizations,
governments and citizens of the region. The following examples throughout the
United States show various ways the TBL concept can be used to grow a region’s
economic base in a sustainable manner.
Cleveland, Ohio

In 2009, the mayor of Cleveland convened the Sustainable Cleveland 2019
(SC2019) Summit to bring together hundreds of people interested in applying the
principles of sustainability to the design of the local economy.17 The SC2019 is a
10-year initiative to create a sustainable economy in Cleveland by focusing on a
TBL-like concept.
The city uses four key areas for measuring sustainability: the personal and social
environment, the natural environment, the built environment (e.g., infrastructure
and urban growth patterns) and the business environment. Each key area has six
goals. At this point, specific measurement indicators have not been fully
developed; however, the city is looking to create a dashboard that could be
combined to create an index for overall project success. This dashboard would
allow for quick year-to-year assessment in the SC2019 progress.
Grand Rapids, Michigan, and the Surrounding Region
In 2005, the Grand Rapids region created the nation’s first ―Community
Sustainability Partnership‖ to develop a roadmap to lead Grand Rapids to
sustainability. The region employs 14 major indicators related to the region’s quality
of life and environmental factors to determine progress made towards
sustainability. Rather than create an index, target goals were established for each
indicator. More detailed information of the metrics used for each indicator can be
found in their TBL report.18
Below are brief explanations of the variables used to measure their TBL.
Environmental Quality
o Waste: trends in recycling, refuse and yard waste
o Energy: energy consumption, natural gas consumption and
alternative fuel usage
o Water: water consumption
o Air Quality: toxic release inventory and number of air pollution ozone
action days
o Built Environment: number of LEED registered and certified projects
o Land Use and Natural Habitat: inventory of land use and forest
canopy
o Transportation: public transportation ridership
Economic Prosperity
o Personal Income: personal income per capita
o Unemployment: unemployment rate
o Redevelopment, Reinvestment and Jobs: results from brownfield
redevelopment investment and job creation
o Knowledge Competitiveness: third-party report ranking U.S. regions
Social Capital and Equity
o Safety and Security: crime statistics
o Educational Attainment: degree attainment levels
o Health and Wellness: infant mortality rate and blood lead levels
trends
o Quality of Life: home ownership, poverty, and reduced price and
free lunches trends
o Community Capital: 211 calls for assistance, voter participation and
population and ethnicity
o
Summary
The Triple Bottom Line concept developed by John Elkington has changed the
way businesses, nonprofits and governments measure sustainability and the
performance of projects or policies. Beyond the foundation of measuring
sustainability on three fronts—people, planet and profits—the flexibility of the TBL
allows organizations to apply the concept in a manner suitable to their specific
needs.
There are challenges to putting the TBL into practice. These challenges include
measuring each of the three categories, finding applicable data and calculating
a project or policy's contribution to sustainability. These challenges aside, the TBL
framework allows organizations to evaluate the ramifications of their decisions from
a truly long-run perspective.
NOTES
1. John Elkington, "Towards the Sustainable Corporation: Win-Win-Win Business
Strategies for Sustainable Development," California Management Review
36, no. 2 (1994): 90–100.
2. Andrew Savitz, The Triple Bottom Line (San Francisco: Jossey-Bass, 2006).
3. Peter Soderbaum, "Positional Analysis and Public Decision Making," Journal
of Economic Issues 16, no. 2 (June 1982): 391–400,
www.jstor.org/stable/pdfplus/4225177.pdf.
4. Terre Satterfield, Paul Slovic and Robin Gregory, "Narrative Valuation in a
Policy Judgment Context," Ecological Economics 34 (2000): 315–331.

5. Stephen R. J. Sheppard and Michael Meitner, "Using Multi-Criteria Analysis
and Visualization for Sustainable Forest Management Planning with
Stakeholder Groups," Forest Ecology and Management 207 (2005): 171–187.
Another example can be found in Katrina Brown et al., "Trade-Off Analysis
for Marine Protected Area Management," Ecological Economics 37, no. 3
(June 2001): 417–434.
6. See Herman E. Daly, John B. Cobb and Clifford W. Cobb, For the Common
Good: Redirecting the Economy towards Community, the Environment, and
a Sustainable Future (Boston: Beacon Press, 1989) and John Talberth, Clifford
Cobb and Noah Slattery, "The Genuine Progress Indicator 2006: A Tool for
Sustainable Development," www.environmental-
expert.com/Files/24200/articles/12128/GPI202006.pdf.
7. Minnesota Planning Environmental Quality Board, "Smart Signals: An
Assessment of Progress Indicators," March 2000,
www.green.maryland.gov/mdgpi/pdfs/GPI-Minnesota.pdf.
8. Integrated assessment is used as a general rubric for all sustainability
assessment frameworks, including TBL. The proliferation of frameworks and
their acronyms often complicates the issues associated with implementing a
TBL framework for evaluating economic development initiatives. Except for
a couple of sustainability frameworks, the accessibility components and
measures can be easily organized into the three TBL categories (economic,
social and environmental).
9. Theo Hacking and Peter Guthrie, "A Framework for Clarifying the Meaning of
Triple Bottom-Line, Integrated, and Sustainability Assessment," Environmental
Impact Assessment Review 28 (2008):73–89 and Wouter de Ridder et al., "A
Framework for Tool Selection and Use in Integrated Assessment for
Sustainable Development," Journal of Environmental Assessment Policy and
Management 9, no. 4 (December 2007): 423–441.
10. Cascade Engineering, "The Triple Bottom Line Report," 2009,
www.cascadeng.com/pdf/TBL_2009.pdf.
11. Nancy Fell, "Triple Bottom Line Approach Growing in Nonprofit Sector,"
Causeplanet, January 21, 2007, and Peter Senge, et al., The Necessary
Revolution (New York: Doubleday, 2008).
12. For example, see Nancy Stark and Deborah Markley, "Rural
Entrepreneurship Development II: Measuring Impact on the Triple Bottom
Line, Wealth Creation in Rural America," July 2008,
www.yellowwood.org/wealthcreation.aspx.
13. "Focus Areas," RSF Social Finance, http://rsfsocialfinance.org/values/focus/.
14. "Maryland's Genuine Progress Indicator: An Index for Sustainable Prosperity,"
Maryland: Smart, Green and Growing, www.green.maryland.gov/mdgpi/.
15. Commission of the European Communities, "Communication from the
Commission on Impact Assessment," May 6, 2002,
http://trade.ec.europa.eu/doclib/docs/2005/february/tradoc_121479.pdf.

16. EU Secretariat General, "Memo: The Main Changes in the 2009 Impact
Assessment Guidelines Compared to 2005 Guidelines,"
http://ec.europa.eu/governance/impact/index_en.htm.
17. Sustainable Cleveland 2019, "Action and Resources Guide: Building an
Economic Engine to Empower a Green City on a Blue Lake," October
2010,www.gcbl.org/system/files/SC2019+Executive+Summary+%289SEP10%2
9.pdf.
18. City of Grand Rapids, Michigan, "Community Triple Bottom Line Indicator
Report," September 2008, www.grpartners.org/pdfs/resources/TBLFinal1.pdf.
Indiana Business Review, Spring 2011
http://www.ibrc.indiana.edu/ibr/2011/spring/article2.html
Indiana University Kelley School of Business, Indiana Business Research Center