Embed Size (px)
Citation preview

COMPACT CITY STRATEGY OF BANGKOK MEGA-CITY1 Chaweewan Denpaiboon2 Hidehiko Kanegae3 Abstract The objectives of this study encompass three aspects. First, it analyzes the Bangkok Mega-city Model in three sub-areas around the New Suvarnabhumi International Airport.4 Second, it analyzes the compact city policy to measure factors of the compact city based on affordable transportation costs related to household income, jobhousing balance, and facilities. Third, it analyzes household commuting travel using modeling displays with visual simulation. The results show that the compact city strategy can shed light on the lifestyle of residents in a mega-city. Moreover, the study reveals that the patterns of urban structure in
1 The paper is part of the findings of our study on the compact city simulation strategy in Bangkok Mega-city, Thailand (2006). The study was supported by a grant provided by the Center of Excellence of Ritsumeikan University. We are grateful to the Faculty of Architecture and Planning for kind assistance in the conduct of the study and to the fourth-year students of Urban Environmental Planning and Managemen. Thanks also go to Miss Chonthicha Thamasith, who prepared the paper and document. 2 Faculty of Architecture and Planning, Thammasat University, Patumthani, Thailand 3 Graduate School of Policy Science, Ritsumeikan University, Kyoto, Japan 4 The three areas are Bang Kapi, Lat Krabang, and Bang Phli.
the Bangkok Metropolis are close to the compact city concept, which means the residents utilize urban structure in an area not more than 20 kilometers distant from their residences. The study was designed to show the necessity of urban policy that pursues "a compact city" in the Bangkok Mega-city. Keywords: Compact City Policy, Mega-city, Bangkok Metropolitan Regions Introduction A mega-city5 is one of the most rapidly growing and increasingly populated cities, in addition to having the greatest amount of urban infrastructure in the world. Bangkok Metropolis is considered one of the world’s 21 mega-cities (Guest 2000). It has a rapidly increasing population. The surrounding areas will also increase by millions, meaning an additional 1.5 million people will live in the Greater Bangkok Area and a million people will be located in the surrounding provinces. As of 2001, populations and built up areas are showing urban sprawl (see Figure 1 and Figure 2). What we are witnessing today requires new concepts and strategies for the management of this urban environment especially for the largest human agglomerations. All the specific problems of this century’s development appear most obvious in mega-cities: population migration, changes in regional patterns, and fast growing cities. Moreover, the character and spatial distribution of the mega-cities has led to
5 The term “mega-city” is frequently used as a synonym for such word as “super-city,” “conurbation,” “megalopolis,” “world city,” and so on.

Compact City Strategy of Bangkok Mega City
39
the 21st century being called the age of urbanization, during which period towns and cities have experienced an increase of 50% in population. The effects of urbanization are not the same world-wide; rather, they differ regionally. While the situation in the industrialized nations of the world is challenging, it is still under control. However, we have to face the fact that the inferior situation in the mega-cities of developing nations is escalating and is, in many cases, out of control. Hence, development of the subcenters concept was selected as the solution to Bangkok Metropolis’ problems. Nine subcenters were developed in Bangkok Mega-city. The subcenters within the jurisdiction of Bangkok Mega-city serve the purposes of travel time and metropolitan structure, of improving the quality of life in the mega-city in view of the current state of urban problems, and of discussion of ideal urban infrastructures from the standpoint of realizing the feasibility of the paper proposed for land-use planning policy.
In recent years, city planners, developers, and policymakers have increasingly looked towards designing a more ‘compact city’ in order to achieve a more sustainable urban form. There are many perceived benefits of the compact city over “urban sprawl”, including less car dependency (and, hence, lower emissions), reduced energy consumption, better public transportation services, increased overall accessibility, re-use of infrastructure and previously developed land, rejuvenation of existing urban areas and urban vitality, higher quality of life, the preservation of green space, and the creation of a milieu for enhanced business and trading activities (Thomas and Cousins 1996). However, the major findings of US mega-city research found that denser and more mixed land use
are associated with less automobile use for improving sustainability, and more creation of pedestrian areas in order to support the development of a “health city”. However, there is a limitation for Asian mega cities. Bangkok Mega-city also has been experiencing a rapid increase in automobile use, and empirical studies in the high-density context have been scarce. The studies have shown that the process of urbanization presents enormous challenges for government, social and environmental planners, architects, and inhabitants of the city. There are three points, as follow: (1) What urban population should be realized to mega-city growth? (2) How should compact city policy and subcenter policy6 serve as guidelines for the mega-city? And (3) how should the urban population commute in order to carry out urban activities in the mega-city?
Figure 1: Bangkok metropolis growth in 2001
6 Subcenter policy was proposed by Bangkok Metropolitan Administration (BMA) as a measurement of urban development policy.

MANUSYA: Journal of Humanities 11.2, 2008
40
Figure 2: Built-up area around Suvarnabhumi Airport Literature review Williams (2000) argued that compact cities were explained by four characteristics. First, compact cities are efficient for more sustainable modes of transportation. The population densities are high enough to support public transportation and to make it feasible to operate. Also, the theory is that, because compact cities have high density and mixed use, people can live near to their workplace and leisure facilities. Hence, people can walk and cycle easily and the demand for travel is reduced overall. Second, compact cities allow sustainable use of land by reducing sprawl. Land in the countryside is preserved, and land in towns can be recycled for development. Third, in social terms, compactness and mixed use are associated with diversity, social cohesion, and cultural development. Some also argue that it is an equitable form because it offers good accessibility to everyone. Fourth, compact cities are economically viable because infrastructure, such as roads
and street lighting, can be provided cost-effectively. Many planners and policymakers believe that “sustainable communities are places that exhibit a compact urban form.” (Beatley 1995) However, there is debate about the very definition of a ‘compact city’ and, in particular, about what policies need to be undertaken to achieve urban compaction, whether these particular policies do in fact, contribute to sustainability. According to Breheny (2001) “policies of urban compaction involve the promotion of urban regeneration, the revitalisation of town centers, restraint on development in rural areas, higher densities, mixed-use development, promotion of public transport and the concentration of urban development at public transport nodes.” Researchers have renounced many of these policies as being uneconomic and against the wishes of the general population, who have characterized the twentieth century by a rejection of inner-city living and the invention of suburbia. The nature of intensification is also important; development in mixed-use town centers is usually perceived to have a positive effect, especially if landscaping and urban design improvements are subsequently implemented. Infill housing developments in residential suburbs are frequently perceived as being of poor quality and therefore having a detrimental effect on the environment and sustain-ability in general. A model of an existing context is built to a consistent quality, and developers and/or architects are required to “plug-in” their model of a proposed development and various alternatives at the same level of detail, accuracy, and visual quality as the existing contextual model. Additionally, the so-called activity- based approach (Jones 1990) is a useful conceptual framework for the travel activities study. Nearly all travel activities are derived from the need or wish to fulfill physiological needs (eating, sleeping),

Compact City Strategy of Bangkok Mega City
41
institutional needs (work, education), personal obligations (child-care, shopping) and personal preferences (leisure activities). Objectives of the study This paper tries to achieve a better understanding of the mega-city as an introduction to what the quality of life of the residents will be if urban reconstruction can not be achieved by the compact city policy. The objectives of the study encompass three aspects:
1. to analyze the commuting behaviour of the Bangkok Mega-city Model in three subareas around the new Suvarnabhumi International Airport, consisting of the Bang Kapi, Bang Phli, and Lat Krabang subareas;
2. to analyze the compact city policy in order to measure factors of the compact city based on affordable transportation costs related to household income, jobhousing balance, and facilities; and
3. to analyze household commuting behavior using modeling displays created with simulation software that integrates an existing system using the Sketch Up, Maya, 3D Max, Flash, and Premier programs and also includes visual simulation.
Data collection The study methods employed travel surveys of residential areas in three subareas (Bang Kapi area, Lat Krabang; Rom Klao Housing Project, Bang Phli; Bang Phli New Town Project and Bang-Chalong Housing Project for a total of 278 samplings). A household travel survey compiled by the authors in August 2006 was employed to investigate the urban structure and the commuting
pattern of residents who travel downtown and commute to work. The surveys were designed to test certain effects on people, such as affordable transportation costs related to household income, job-to-housing balance, and to facilitate in the change of the urban structure with the new development of three subcenters. Descriptive statistics were also analyzed within this study with the intention of exploring the different characteristics of Bangkok’s commuting behavior of detailed daily travel investigations among the participants of this survey. The questionnaires consisted of questions about individual travel behavior, participation in activities related to commuting, and social relations or routines likely to influence travel behavior. The main survey included questions about the distance traveled by each method on each day during a week. In addition, the study utilized simulation software integrating existing systems, such as Sketch Up, Maya, 3D Max, Flash, and Premier programs, and also used visual simulation to facilitate the modeling, display, and evaluation of the proposed alternative environment.
Population, urban economics and urban growth In brief, the population in the Bangkok Metropolitan Region (BMR7) reached 3.3 million, 6.6 million, and 10.0 million in 1960, 1980, and 2006, respectively (see Table 1). Thus, the BMR represented a high percentage of the total population of Thailand in 2006. Annual population
7 BMR = BMA + Vicinity (Bangkok Metropolitan Regions) BMA = Bangkok Metropolitan Administration, and vicinity including the provinces of Nonthaburi, Samut Prakan, Pathum Thani, Samut Sakhon, and Nakhon Pathom

MANUSYA: Journal of Humanities 11.2, 2008
42
growth in the BMR has been slowing down and turned negative between the years 2000 and 2006, dropping from 4.5% per annum during 1960–1970 to –1.0% per annum during 2000 to 2006. According to the Department of City Planning, BMA, the built-up area had expanded by nearly 10% per annum from 1993 to 1995. Depicted by aerial photography in 1995, there were about 39% of the built-up areas in the BMA. Subsequently, the built-up area is 700 kilometers2, out of a total of 1,568 kilometers2 in the city’s administrative area. However, the population density of Bangkok Metropolis increased from 4,001 to 7,001 inhabitants per sq.km by 2006 (Bang Kapi), from 1,001 to 4,000 inhabitants per sq.km in Lat Krabang, and from 500 to 1,000 inhabitants per sq.km in Bang Phli (see Figure 3). The characteristics of urbanization that indicate a change to urban sprawl are as follows: (1) residential population has declined in the central area; (2) commercial and office buildings are to be found in areas such as Petchaburi, Rama I, Rama IV, Sukhumvit, Asok-Rachadapisek, Victory Monument, and Central Plaza; (3) suburban residential developments are expanding in the eastern and northern corridors; (4) areas within a 10 kilometers radius from the center have vertical extension; and (5) areas outside 10 kilometers have horizontal extension. Unplanned urban sprawls are currently in progress. They cause not only traffic jams, but also various problems relating to the urban living environment. Problems include the
mixing of conflicting functions, such as the mixing of residential and industrial areas, which is potentially hazardous to residents, insufficient provision of public services, and the resultant deterioration of the living environment. However, the majority of economic and social activities are still located in Bangkok Metropolis and its vicinity. In addition, Table 2 indicates a real household income of 18,800 baht per month in the BMA and of 18,000 baht per month in the BMR in 2000. Moreover, the employment structure in Bangkok varies greatly across its area. Secondary employment structures such as commercial, financial, and service sectors play an important role as major sources of employment. In the vicinity of Bangkok, the production sector was still the major source of employment in 2000 (see Table 3). Thus, urban sites are initiated primarily by the private sector. This is thought to be one of the reasons why the road network is poorly designed in built-up areas, and this situation is causing serious congestion in town.

Compact City Strategy of Bangkok Mega City
43
Table 1: Total population of the Bangkok Metropolitan Regions (BMR) and its growth rate classified by province in 1980, 1988, and 2006 (Unit: 1,000,000)
Sources: Population and Housing Census, 1960, 1970, 1980, 1990 and Preliminary Report of Population and Housing Census, 2000, *National Statistical Office (NSO); National Economic and Social Development Board (NESDB). Table 2: Real household income in 1995 (unit: baht/month)
Source: UTDM (1995) and URMAP (2000)
Table 3: Employment structure of BMR in 2000 (unit: baht/month)
Source: URMAP estimates (2000)
Commuting mode in greater Bangkok There are three modes of transport for commuting in greater Bangkok. These are private vehicle, public transport, and non-motorized vehicle. All types are variably
employed. The areas of greater Bangkok are linked to the center by a set of roads radiating northwards and southwards to Nonthaburi and Samut Prakan provinces and eastwards and westwards to Chachoengsao and Nakhon Pathom provinces respectively (see Figure 3).
Total population (millions) Annual growth rate (%)
Province 1960 1970 1980 1990 2000 2006
1960–
1970
1970–
1980
1980–
1990
1990–
2000
2001–
2006 Bangkok Metropolitan
Area (BMA) 2.1 3.1 4.7 5.9 6.3 5.7 4.8 5.2 2.6 0.7 -1.0
Samut Prakan Nonthaburi Pathum Thani Vicinity Samut Sakhon Nakhon Pathom
1.2 1.4 1.9 2.7 3.8 4.3 1.7 3.6 4.2 4.7 1.3
Total BMR 3.3 4.8 6.6 8.6 10.1 10.0 4.5 3.7 3.0 1.7 -0.1
Name of Province 1995 2000 1995-2000 Bangkok 21,000 18,800 -2.19% Nakhon Pathom 15,100 13,500 -2.22% Nonthaburi 27,100 24,200 -2.44% Pathum Thani 17,700 15,800 -2.25% Samut Prakan 15,200 13,600 -2.20% Samut Sakhon 13,000 11,600 -2.25% BMR 20,100 18,000 -2.18%
Name of Province Primary Secondary Tertiary Bangkok 1.90% 34.70% 63.40% Nakhon Pathom 41.20% 31.90% 26.90% Nonthaburi 18.10% 39.70% 42.30% Pathum Thani 14.40% 59.50% 26.00% Samut Prakan 7.80% 65.00% 27.20% Samut Sakhon 15.60% 62.20% 22.20%
BMR 7.60% 41.20% 51.20%

MANUSYA: Journal of Humanities 11.2, 2008
44
Figure 3: Direction commuting travel to work place around Suvarnabhumi Airport
Within the BMA, private cars and motorcycles (44.7%) and public transportation systems (42.4%) are chiefly employed for journeys. Among the public transportation systems, buses command an outstanding share of 72%. This indicates that mass transportation is a striking feature of transportation within the BMA. There are various commuting modes in place in the BMA. In terms of approximate contribution of passengers per kilometer traveled, city buses are the largest contributors. This transport mode thereby contributes significantly to either improvement or degradation of the urban air quality in Bangkok. Improvement of urban air quality could be accomplished by instituting appropriate policies regarding city buses. In the same fashion, private cars are the biggest contributors in terms of vehicle-kilometer traveled. This indicator signifies that private cars have an important effect on the quality of urban air in the Bangkok Metropolitan Area. The passenger-kilometers traveled and vehicle-kilometers traveled in 2005 for different transport modes are shown in Table 6.
Table 4: Mode of transport to work place in greater Bangkok __________________________________ Mean Commute School Private Business Total
Walk 631,539 766,952 481,135 112,775 1,992,401 (10.9%) (21.6%) (11.9%) (5.2%) (12.8%) Bicycle 1,056,735 299,310 981,123 450,581 2,787,749 (18.24%) (8.42%) (24.28%) (20.93%) (17.94%) Personal 1,297,121 303,490 1,301,277 1,268,848 4,170,736 Car (22.4%) (8.5%) (32.2%) (58.9%) (26.8%) Public 2,809,052 2,183,071 1,276,633 320,680 6,589,436 Transport (48.5%) (61.4%) (31.6%) (14.9%) (42.4%)
Total 5,794,447 3,552,823 4,040,168 2,152,884 15,540,322 (37.3%) (22.9%) (26.0%) (13.9%) (100.0%)
Source: JICA (1990, 1997) Table 5: Share transport systems in greater Bangkok
Description Share (%) Bus 72.0 Railway 0.4 Surface Transport 4.2
Others (taxi, etc.) 23.4 Source: JICA (1990, 1997)
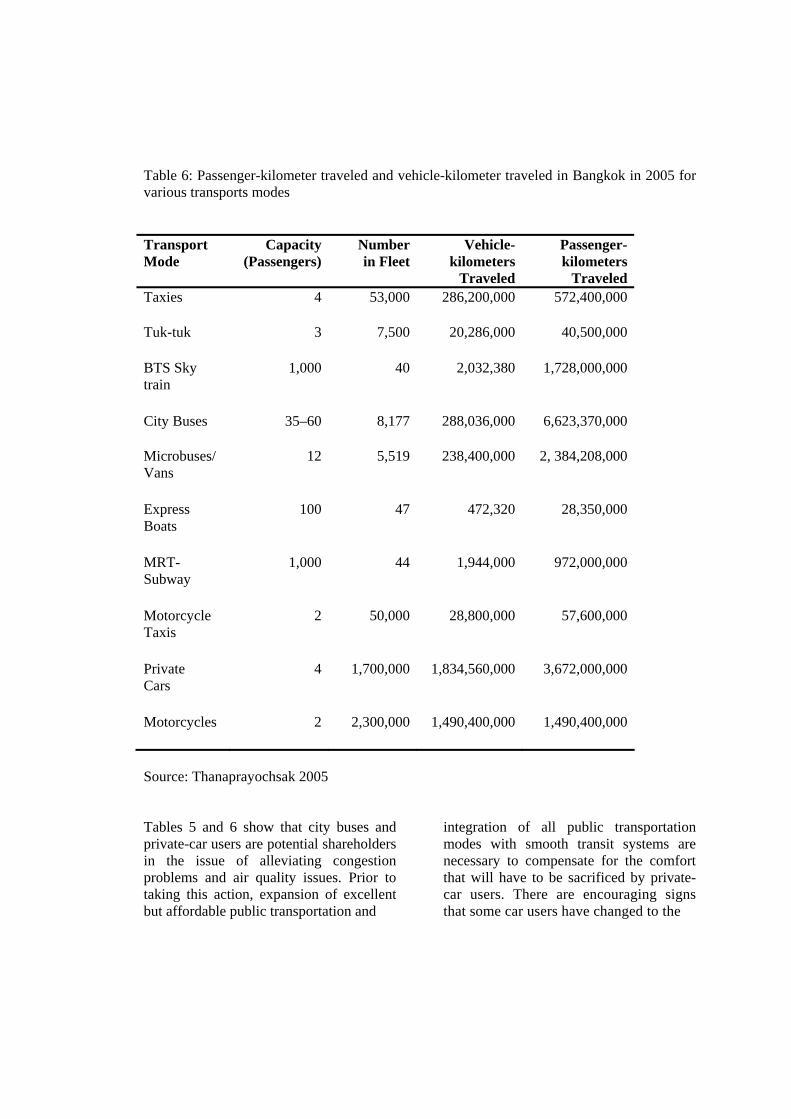
Table 6: Passenger-kilometer traveled and vehicle-kilometer traveled in Bangkok in 2005 for various transports modes
Transport Mode
Capacity (Passengers)
Numberin Fleet
Vehicle-kilometers
Traveled
Passenger-kilometers
Traveled Taxies
4 53,000 286,200,000 572,400,000
Tuk-tuk
3 7,500 20,286,000 40,500,000
BTS Sky train
1,000 40 2,032,380 1,728,000,000
City Buses
35–60 8,177 288,036,000 6,623,370,000
Microbuses/ Vans
12 5,519 238,400,000 2, 384,208,000
Express Boats
100 47 472,320 28,350,000
MRT- Subway
1,000 44 1,944,000 972,000,000
Motorcycle Taxis
2 50,000 28,800,000 57,600,000
Private Cars
4 1,700,000 1,834,560,000 3,672,000,000
Motorcycles
2 2,300,000 1,490,400,000 1,490,400,000
Source: Thanaprayochsak 2005 Tables 5 and 6 show that city buses and private-car users are potential shareholders in the issue of alleviating congestion problems and air quality issues. Prior to taking this action, expansion of excellent but affordable public transportation and
integration of all public transportation modes with smooth transit systems are necessary to compensate for the comfort that will have to be sacrificed by private-car users. There are encouraging signs that some car users have changed to the

MANUSYA: Journal of Humanities 11.2, 2008
46
elevated light rail and the subway. This is very visibly indicated by the popularity of the park-and-ride facilities near certain railway stations. Therefore, the park-and-ride system needs more promotion and expansion to attract more car users to mass transit systems. Results and discussions Activities and travel in three subareas This study of activity-based approaches is based on the work-day and holiday behavior for leisure trips by analysis of daily travel behavior and of the relationship between residential locations, urban facilities, the location of the activity, trip distances, activity participation, and journey frequency in the three subareas. For some facility types, the results almost always show that commuters choose the closest facility because the various facilities are more or less equal (such as post offices) or have regulated catchment areas (such as social security offices). Conversely, symbolic differences within each facility category may make people travel beyond the closest facility, other recreational facilities, many types of shops, and, not the least, workplaces. Furthermore, there are a number of features other than proximity that are important when choosing among facilities. Figure 4 shows the relationship between residents and workplaces and the distance traveled for five workdays. It indicates that the distance from residence to workplace of commuters was around 40 – 50 kilometers on average. The cost of travel and distance were significantly related. Additionally, distance is less significantly related to duration of travel.
Distance from resident to downtown (km)
5040302010
Amou
nt dis
tance
from
resid
ent to
down
town
500
400
300
200
100
0
-100
Figure 4: Average, expected travel distances (km) over five days Trip frequencies in subareas Trip frequency analysis was based on data from the daily travel investigation. In particular, close interdependence of activity participation could be expected. However, because of the possibility of combining several activities, such as shopping at different locations, and thus making several journeys in connection with the same activity, on average, the travel daily respondents made three journeys per day during the investigated weekdays and during the weekend. The total number of journeys appears to be influenced by the urban structure. The effect of local area density on the number of journeys at the weekend is more difficult to explain, but it might reflect a tendency found among residents of dense, inner city areas to reduce the number of shopping and visiting trips carried out at the weekend. However, some theorists have assumed that “distance decay” will, by and large, also have an effect on the number of days per week that the workplace is visited, since information technology and improved communication have made it possible for an increasing number of employees to do some of their

Compact City Strategy of Bangkok Mega City
47
work from home. Location of the residence in hierarchy relation centers in the metropolitan area has some influence on the frequency of participation in different activities. Visits to typical “urban” facilities like cinemas and restaurants are more common among inner city dwellers, while residents of outer suburbs go to other provinces more frequently, and spend more time on recreation (see Table 7). Table 7: Number of residents and urban structural characteristics of dwellers grouped into three subareas near Suvarnabhumi Airport
Number of residents for traveling to downtown (%)
Urban structural factor Less
than 20 km
21– 30 km
31– 40 km
41– 50 km
Distance from residence to downtown BKK (km)
14.39 16.19 24.46 44.96
Distance from residence to closest second order urban center (km)
55.04 44.96 - -
Distance from residence to closest urban rail station (km)
30.58 69.42 - -
Local area population density (dwellers/rai)
18–20 18– 20
18– 20
18– 20
Local area workplace density (jobs/rai)
3:1 2:1 2:1 2:1
Distance from residence to closest grocery stores
500 m - - -
Number of residents for traveling to downtown (%)
Urban structural factor
Less than 20 km
21–30 km
31–40 km
41–50 km
Number of grocery stores within 1.5 km distance of the dwelling
200 - -
Distance from residence to closest primary school
1 km - - -
Distance from residence to closest kindergarten
500 m - - -
Distance from residence to closest daycare
500 m - -
Distance from residence to closest post office
500 m - - -
Proportion of residence with a green recreational area of at least 5 rai within 1 km distance
1:1 1:1 1:1 1:1
Figure 5 shows daily commuting and traveling that demonstrates the visual activity by using 3D graphical program presentation. This figure aims to describe the activity through urban facilities like convenience shops, workplaces, and other facilities around their residential area. Residents in three subareas, Bang Kapi, Lat Krabang, and Bang Phli, use the nearest urban facilities to their homes and commute around 41–50 kilometers to their workplaces. In daily life, travelers start from home, take breakfast around their residential area, and take a bus to the railway station, a distance of 12 kilometers with a trip duration of 30 minutes. After spending 30 minutes on the bus, they switch to various other modes of transportation, such as the sky train, i.e., Bangkok Mass Transit System (BTS), or the subway i.e., Mass Rapid Transit System (MRT), which takes only 10–30 minutes

MANUSYA: Journal of Humanities 11.2, 2008
48
of travel to the vicinity of their workplace. Then they go to their place of work on foot, which takes less than 10 minutes. So it can be assumed that the shorter distance may take a longer time and the longer distance may take a shorter time if they use an appropriate mode of transportation. At lunch time people will go for lunch near to their workplace for about 5–10
minutes and 10–20 minutes for doing other activities and participating in other urban services also situated near their workplace. After finishing work they will go to department stores for relaxation, other venues for recreational activities, and then back home using the transportation modes mentioned above.
Figure 5: Daily life commuting travelling

A behavioral model This is a simplified behavioral model of the residential urban structure and other social conditions which individuals are assumed to influence daily through traveling distances, accessing facilities, and participating in activities. This is correlated with the locations of the activities, the frequencies of activity participation, and the locations of the facilities. The location of residences relative to various centers and facilities combined with the transport infrastructure on the relevant stretch determine how accessible these centers and facilities are from the dwelling. There are also mutual influences between the urban structural situation of the dwelling (location relative to various centers and facilities and local transport infrastructure) and the individual and household characteristics. The study suggests that urban structure, in addition to its direct effects, may influence active participation and travel behaviors indirectly via car ownership, transport attitudes, and some other variables. We found that the average distance of holiday travel falls in the range of 21–30 kilometers, while travel time was 30–60 minutes on average (see Figure 6). The majority of respondents used bus and/or train as the major mode of travel.
Figure 6: Distance and time of travel for respondents in three subareas
We also found that residents in the study area go shopping, watch movies, meet family and friends, do social work, and engage in other activities at venues that are less than 20 kilometers from their homes. This means that they are satisfied with going out to other places around their residential area. In addition, they are also satisfied with the aforementioned activities, spending less than 30 minutes and spending at least 7 baht to go shopping, watch movies, or meet family and friends. They also spend around 300 baht on shopping, 159 baht on watching movies, 1,800 baht on meeting their family, 500 baht on
0
1 0
2 0
3 0
4 0
5 0
6 0
7 0
8 0
L e ss
t h a n 2 0
2 1 - 3 0 3 1 - 4 0 4 1 - 5 0 M o r e
t h a n 5 0
D i s ta n c e
N u m b e r o f r e s p o n d e n ts
01020
30405060
7080
L e ss
than
30
31-60 61-90 91-120 M or e
than
120
N u m b er o f res p o n d en ts
Time
Meeting relatives
Social work
Movie
Other provinces
Shopping
Meeting friends
Others

MANUSYA: Journal of Humanities 11.2, 2008
50
meeting friends and on other activities, 250 baht on social work, and 3,500 baht on travelling to other provinces (see Table 8).
Table 8: Cost of commuting to social functions for residents in study areas (Baht)
Cost of travel (Baht)
Min Max Mean SD
Shopping Movie Meeting relatives Meeting friends Other provinces Social work Others
7 7 7 6 80 50 10
300 159 1,800 500 3,500 250 500
46.99 40.00 209.96 89.76 851.32 133.33 124.17
59.019 47.476 415.773 129.379 803.358 104.083 159.837
Figure 7 shows the distance and time residents of Bang Kapi subarea spend commuting when they are engaging in certain social functions. It shows that when residents go out for social functions, they usually travel less than 20 kilometers and spend less than 30 minutes traveling. For some activities, they may spend less time; for example, they may travel to meet family and friends more than 50 kilometers in less than 30 minutes. This relates to the chosen mode of transportation. Table 9 shows the cost of travel to social functions in the Bang Kapi subarea. The minimum costs for commuting in Bang Kapi to go shopping, watch movies, meeting family, meeting friends, other provinces, and other activities were 7, 8, 75, 14, 270, and 290 baht, respectively.
Figure 7: Distance and time of commuting in Bang Kapi subarea Table 9: Cost of commuting to social functions for residents in Bang Kapi subarea (Baht)
Cost of travel (Baht)
Min Max Mean SD
Shopping Movie Meeting relatives Meeting friends Other provinces Social work Others
7 8 75 14 270 0 290
200 50 300 150 3,500 0 20
67.00 21.50 158.33 83.50 897.86 0 20.00
77.454 19.485 123.322 56.883 1,021.945 0 0
Distance of commuting to social functions for residents in Bang Kapi subarea
0
5
10
15
20
Lessthan20
21-30
31-40
41-50
Morethan50
Number of residents
Meeting relatives
Social work
Movie
Other provinces
Shopping
Meeting friends Others
Time of commuting to social functions for residents in Bang Kapi subarea
0
5
10
15
20
Lessthan30
31-60 61-90 91-120
Morethan120
Number of residents

Compact City Strategy of Bangkok Mega City
51
Figure 8 shows the distance and time that residents of the Lat Krabang subarea spent commuting to engage in certain social functions. The satisfaction of Lat Krabang residents to perform social functions, go shopping, watch movies, meet family, meet friends, and engage in other activities is correlated with a distance of less than 20 kilometers and a time of less than 30 minutes. Table 10 shows the cost of commuting to social functions for residents in the Bang Kapi subarea. The cost for commuting to meet friends is 6–100 baht less than that for other activities, such as meeting family at 30–1,800 baht and shopping at 7–100 baht.
Figure 9 shows the distance and time that residents of Bang Phli subarea spent commuting to engage in certain social functions. The results for social functions in Bang Phli show that the residents are satisfied with doing these activities near their homes, and this minimizes time and cost. The distances shown for shopping, watching movies, meeting family, meeting friends, going to other provinces, doing social work, and other activities are less than 20 kilometers and time is less than 30 minutes, with the minimum cost being around 7–80 baht and the maximum cost being around 150–2,000 baht (see Table 11).
Cost of travel (Baht)
Min Max Mean SD
Shopping Movie Meeting relatives Meeting friends Other provinces Social work Others
7 0 30 6 200 - 14
100 0 1,800 100 2,800 - 500
37.94 0 379.17 68.67 914.29 - 184.67
26.016 0 703.821 54.271 933.503 - 273.396
Meeting relatives
Social work
Movie
Other provinces
Shopping
Meeting friends
Others
Time of commuting to social functions for residents
in Lat Krabang subarea
02468
10121416
Less than 30 31-60 61-90 91-120 More than
120
Number of
residents
Time of commuting to social functions for residents in Lat Krabang subarea
0
2
4
6
8
10
12
14
16
Lessthan 30
31-60 61-90 91-120 Morethan 120
Number of residents
Figure 8: Distance and time for commuting in Lat Krabang subarea
Table 10: Cost of commuting to social functions for residents in Bang Kapi subarea (Baht)

MANUSYA: Journal of Humanities 11.2, 2008
52
Figure 9: Distance and time for commuting in Bang Phli subarea Table 11: Cost of commuting to social functions for residents in Bang Phli subarea (Baht) Cost of travel (Baht)
Min Max Mean SD
Shopping Movie Meeting relatives Meeting friends Other provinces Social work Others
7 7 7 7 80 50 10
300 150 1,200 500 2,000 250 300
42.92 52.33 156.19 98.60 787.06 133.33 114.50
61.078 58.078 307.195 166.650 555.965 104.083 124.761
Conclusion In this study, we try to develop a guideline Compact Policy for a newly developed international aero-city. Points of view are based not only on job and housing balance but also on technical points of view measured by activity and functionality. These are important when considering the quality of life in mega-cities. Although government policy is attempting to develop new connections between urban structures and various dimensions of poverty affecting quality of life through mega housing projects for low income people, the low income people still meet the problems of which points of view are, for example, considerations of the meaning of cities as fields of transportation, as well as those for securing urban spaces suitable as a rearing environment for children where such children can come into contact with nature.
Neuman has proposed the compact city fallacy on problems of urban sprawl and how to mitigate it. This is the goal of sustainability, which should focus on the process more than the form (Neuman, 2005). He has argued that a compact city should be created in the form of new urbanism, and health community in such a way that social interaction is fostered when communities are closer to one another. Also it should be more pedestrian friendly, more convenient in terms of mass transit, and generally more sustainable than urban sprawl. Our study agrees with Neuman. It concurs with “the compact city form of urbanism” and shows that the residents in three study areas enjoy living in these projects with accessibility to facilities and services.
We found that low-income residents enjoy living there and having their workplace
Meeting relatives
Social work
Movie
Other provinces
Shopping
Meeting friends Others
Meeting relatives
Social work
Movie
Other provinces
Shopping
Meeting friends Others
Distance of commuting to social functions for residents in Bang Phli subarea
0
5
10
15
20
25
30
35
40
Less than 20 21-30 31-40 41-50 Mor e than
50
Number of residents
Time of commuting to social functions for residents in Bamg Phli subrea
0
5
10
15
20
25
30
35
Less than
30
31-60 61-90 91-120 M or e than
120
Number of residents

Compact City Strategy of Bangkok Mega City
53
near their living area (not more than 20 kilometers distant). Upper middle income groups, on the other hand, still work in the Center Business District, commuting a distance of 41–50 kilometers. For holiday activities, most of them prefer staying at home rather than participating in holiday shopping around residential areas. Moreover, the project location of Bang Chalong is far from the public transportation project.
This study reveals that the urban structure of Bangkok Metropolis is close to the compact city form of urbanism. This means that the residents utilize urban structures such as grocery stores, kindergartens, day-care centers, schools, post offices, etc., in and around the area of their residences or not more than 20 kilometers distant. In addition, the residents’ time for daily life travel and distance for accessibility to urban facilities, activity participation, and local activities were related to the efficiency of the transport infrastructure. This implies that the urban structure directly affects travel behaviour through car ownership and transport attitudes. Hence, the compact city policy in BMR should plan to use urban land for sustainable development. There are three aspects which must be emphasized in Bangkok Mega-city, as follows:
1. Urban redevelopment projects should be resized and the number of large-scale urban redevelopments should be reduced from now on, while a large number of small-scale unit area development projects should be promoted.
2. Building of a network structure should now be formed by transferring its functions to Bangkok Metropolis vicinity areas.
3. Mega-city policies should be promoted from the standpoint of residents, such as the division of mega-city areas into
unit areas under separate administrative zones, thus enhancing the quality of daily life.
The BMA’s policy has solved these problems and the future of mega-cities, with view over the growth stages of those cities. The role of the mega-city, however, with large-scale urbanization, has taken a toll in lifestyle terms, with Bangkok residents sacrificing affluence and healthy living. A network structure has now been formed by transferring the functions to Bangkok Metropolis vicinity areas, while promoting compact city policies from the standpoint of residents, such as the division of mega-city areas into unit areas under separate administrations as places for everyday life...
The conclusion of this study shows that (1) the problems facing the Bangkok mega-city have to be solved to a significant extent; (2) the low-income quality of life has to be improved, although access and approach remain problems; (3) there is inadequate low-income housing due to high land prices around the restructured city; and (4) mega-cities create urban sprawl, which is not beneficial to the environment or the national economy.
Recommendations This study has included some measures of the urban living environment. The examination of the Compact City concept could provide a guideline for policy development for mega-cities in the future. However, city or urban plans should be promoted as small-scale urban redevelopments in each subcenter, connected with each other by mass rapid transportation (BTS or MRT). Additionally, Bangkok Sustainable City conditions should consist of the most efficient social structures and balance of

MANUSYA: Journal of Humanities 11.2, 2008
54
urban areas to rural areas. Moreover, the security of social equality should be taken into account. Finally, the success of the Compact City Policy should be measured by quality-of-life and sustainable city indicators. To this end, it is necessary to accumulate detailed data by promptly formulating an observation system. The study proposes the following: (1) Shift from rapid-growth-type urban policies and land planning to policies suitable for a mature society. (2) Create urban environments as scenes for living and fostering children. (3) Create a network of medium-to-small-sized cities in order to promote nation building on a decentralized basis. (4) Establish a wide-area policy to make and enforce offices exceeding local municipalities in mega-city areas. References Beatley, T. 1995. Planning and Sustainability: The Elements of a New (Improved?) Paradigm. Journal of Planning Literature 9: 383–395. Breheny, M. 2001. Densities and Sustainable Cities: The UK Experience. In Cities for the New Millennium, edited by M. Echenique and A. Saint, pp. 39–51. London: Spon Press. Department of Publics Works and Towns and Country Planning. Homepage of Department of Publics Works and Towns and Country Planning. December, 2006 <http://www.dtcp.go.th.>. Fox, M. 1995. Transport Planning and Human Activities Approach.
Journal of Transport Geography 3: 105–116. Guest, P. 2000. The Impact of Population Change on the Growth of Mega-cities. Paper presented at the Meeting the Population Challenge: The Role of Journalists in the International Planned Parenthood Federation's East, South-East Asia and Oceania Region, Mahidol University, Salaya, Nakhon Pathom, Thailand. Japan International Cooperative Agency (JICA). 1990. The Study on Medium to Long Term Improvement and Management Plan of Road and Road Transport in Bangkok in the Kingdom of Thailand. Final report, Bangkok, Thailand. ---. 1997. Bangkok Environmental Improvement Project (BEIP).Travel Demand Modeling in Asian Cities: Case Study of Bangkok, Kuala Lumpur and Nagoya. Proceedings of the Eastern Asia Society for Transportation Studies, Vol.4, October, 2003. Jones, P. (ed.). 1990. Development in Dynamic and Activity-based Approaches to Travel Analysis. Aldershot: Gower. National Economic and Social Development Board (NESDB). 2001. The 1999 Gross Regional and Gross ProvincialProducts. September, 2006 <http://www.nesdb.go.th/ Default.aspx?tabid>. National Housing Authority. Homepage of National Housing Authority. August, 2006 <http://www.nhanet.or.th>. National Statistical Office. 1994. Formal and Informal Labor Force Market:

Compact City Strategy of Bangkok Mega City
55
1994 Labor Force Survey. Bangkok: Office of the Prime Minister. Neuman, M. 2005. The Compact City Fallacy. Journal of Planning Education and Research: 25–11. Office of the National Economic and Social Development Board. 2003. Final Report Suvarnabhumi Aerotropolis Development Plan. Bangkok: Thailand. Pacific Consultants International. 1995. URMAP Mass Transit: Urban Rail. A survey jointly conducted in 1995 by the UTDM project and the JICA-funded. Thanaprayochsak, W. 2005. Application Economic Instruments to Influence People's Decision in Choice of Transportation Mode towards Reducing Car Use in Bangkok. M.A.Thesis, Asian Institute of Technology, Bangkok. Thomas, L. and W. Cousins. 1996. The Compact City: A Successful, Desirable and Achievable Urban Form? In The Compact City: A Sustainable Urban Form?, edited by M. Jenks, E. Burton and K. Williams, pp. 53–65. London: Pion. Vilhemson, B. 1999. Daily Mobility and the Use of Time for Different Activities: The Case of Sweden. Geo Journal 48: 177–185. Williams, K., E. Burton and M. Jenks. 2000. Achieving Sustainable Urban Form (Introduction). London: Pion. Williams, K. 2000. Can Urban Intensification Contribute to Sustainable Cities?: An International Perspective. Oxford: Centre for
Sustainable Development, Oxford Brookes University.