Embed Size (px)
Citation preview
Case StudyJENEBERANG RIVER BASIN, SOUTH SULAWESI , INDONESIA
1.RIVER BASIN2.CALDERA OF MT. BAWAKARAENG3.SEDIMENT CONTROL PLAN4.BILI-BILI DAM5.PROBLEMS OF DOWNSTREAM
AREA OF BILI-BILI DAM
The Jeneberang River System, which has acatchments area of 762.01 km2, originates atcaldera slope of the Mt. Bawakaraeng. Five(5) major sub-basins :1. Bili-Bili Dam Basin : 384.40 km2,
2. Salo Malino : 85.89 km2,3. Salo Kausisi : 37.50 km2,4. Jene Rakikang (42.2 km2),5. Binanga Jajang : 22,7 km2,
1. RIVER BASIN

10 km
A
B
0 5
Jene Berang
Salo Garassi
Binanga Sapaya
Binanga Tokka
Jene Lata
Binanga Jajang
Jene Rakikang
Salo Malino
Jene Berang
Salo B
ulang
Salo Takapala
Salo Malino
Balang Kampala
Binanga Patteteang
119o 55'E119o 50'E119o 45'E119o 40'E119o 35'E119o 30'E119o 25'E
5o 10'S
5o 15'S
5o 20'S
5o 25'S
Jene Berang
KEY MAP
N
Mak
assa
r Stra
it
Bili Bili ReservoirJene Bontomalangere
Bili Bili Dam
Malino
Limbunga
Mangempang
Jonggoa
Bili Bili JenelataKampili
Bayang
Legend:
Macini Sombala
Bontojai
Bulu Karampuang(1407m)
Bulu Bulunta(941m)
BuluBawakaraeng
(2830m)
Bulu Sarongan (2514m)
Bulu Sarobaiya (2560m)
Bulu Baria(2658m)
Makassar
SOUTH SULAWESI
SOUTH EAST SULAWESI
CENTRAL SULAWESI
NORTH SULAWESI
GORONTALO
River
Mountain
Catchment Area
Latest Collapse
Existing Sand Pocket
Existing Sabo Dam
Bridge
Existing Rainfall Gauging Station
Existing Water LevelGauging Station
Existing Rainfall and Water LevelGauging Station
Salo Kausisi
Proposed Rainfall Gauging Station
Proposed Water LevelGauging Station
Proposed VibrationSensor
Figure 1.

Jene
Rak
ikan
g
Bin
anga
Jaj
ang
Salo
Mal
ino
Salo
Kau
sisi
0
500
1,000
1,500
2,000
2,500
3,000
0 5,000 10,000 15,000 20,000 25,000 30,000 35,000 40,000 45,000 50,000
Distance (m)
Rel
ativ
e El
evat
ion
(m)
Daraha Bridge
Bili
Bili
Dam
Mt. Bawakaraeng
Figure 1.

2.1. Natural Condition.Elevation: 2,830 mMt. Bawakaraeng, whose name literallymeans “Mouth of King”, shows large calderaformation.Existing Caldera is surrounded by Mountainranges of Lompobatang and Bawakaraengranging from Elev. 1,800 m to 2,200m. Thecaldera is in process of expansion at present.
2. CALDERA OF MT. BAWAKARAENG

Mt. Bawakaraeng Caldera Wall
Old Lava Form
Mt. Bawakaraeng (Elev.2,830m)
Summit
Jeneberang River

Lompobatang-Bawakaraeng Caldera (as of July, 2005)

2.2. Occurrence of Caldera Collapse
A gigantic caldera-wall collapse occurred onMarch 26, 2004, at the northeast of caldera of Mt.Bawakaraeng (hereinafter the Collapse). Thevolume of collapsed mass is estimated at 200 to300 million m3. The caldera-wall collapse broughttremendous damage to the area, accounting for 32people death and missing, 635 cows losing, manyhouses, elementary school and about 1,500 ha ofagricultural land buried. Total damage wasestimated at about Rp. 22 billion.


2.3. Monitoring of CracksThere are many cracks observed and start settingobservation points at each zone by installation ofwooden pegs as shown in picture below.Pompengan-Jeneberang RBO has installed suchobservation point totally 32 locations (EL.2600-2650m).Each displacement of crack will be observed atleast once in three months as well as rainfall databy using automatic rainfall gauging instrumentinstall by the Pompengan-Jeneberang RBO.

Zone 1,2 and 3
Zone 4
Locations of monitoring pilesfor opening of cracks
For monitoring of open crack,measurement pile and board bar areinstalled and change of intervalsbetween piles and boards aremeasured. And condition of collapsedwall is observed by watching andtaking photos from the fixed points.

H
Crack H2
H1
Crack
Caldera wall
H equal this spacel
Installation for small open crack Applied for open crack with width of less than 20 cm
Installation for crack which may move horizontally and verticallyApplied for open crack with width of 20 cm and more
Installation for crack which has sliding condition Applied for crack 2-4 only

2.4. Potential Collapse of Caldera Ridge WallTo grasp of the Caldera wall slope condition andstability in detail, slope units are divided into three(3) groups, 10 units in the North Caldera, 10 unitsin the East Caldera and 10 units in the SouthCaldera. In each slope unit, slope inventory recordhas prepared. The total unstable volume of thewhole caldera wall slope is estimated to be145,068,000 m3. In east caldera wall is estimatedwith 111,073,000 m3.

• Level I, estimated volume is 20,102,500m3, Ineast Caldera, and partly in the east side of theNorth Caldera.
• Level II ,estimated volume is 24,646,000 m3.• Level III, estimated volume is 27,819,500 m3
• Expansion Portion, which indicates possiblemaximum collapse extent at present condition, isestimated to be 72,500,000m3 in volume.
Level of possibility Collapace

3. Sediment Control Plan3.1. Formulation of Sediment Disaster
Mitigation Plan1) caldera wall collapse (as preliminary sediment
movement),2) debris flow,3) mud flow, and4) gully erosion and surface erosion.
Among these phenomena, there are two types ofconsiderable sediment disasters, namely:1) Sediment disasters directly caused by
preliminary (future collapse) and secondarycollapse,
2) Sediment disasters caused by rainfall such asdebris flow, mud flow, gully/river bank erosion
Sediment disaster mitigation plan should beformulated against both the sediment disasters, andwill be formulated in combination with structuralmeasures and non-structural measures.
3.1. Formulation of Sediment Disaster Mitigation Plan....

Sediment Control Plan against Rainfall• Debris Flow• Mud Flow
Non-structural Measure
Preliminary Caldera CollapseDebris Flow Occurrence
Structural Measure
Non-structural Measure
Sediment Disaster Mitigation Plan
Both the structural and non-structural measures have to cooperatedemonstrating each characterized measures to attain sediment disastermitigation in the Jeneberang River Basin.

3.2 Target Sediment Amounts to be controlled
The amount of sediment deposit in the main riverof Jeneberang was estimated at over 230 millionm3 (JICA estimation in 2006) and 40 % of themstill remained in caldera area. The unstablesediment in the caldera is estimated with 90million m3 as of July 2008. Therefore, 61% ofthe total sediment deposit has already flowed intothe downstream reaches. It volume is estimatedbased on the topographic survey result with 140million m3.

Bed material load Bed load
Suspended load
Wash load
3.3. Concepts of Sediment Transportation System by Structure Measure
It is necessary to analysis sediment transportation system in the basin. It is the way to formulate a sabo facility plan in the Jeneberang River Basin. In general, sediment transportation loads is classified as:

Mountain Stream
Riverbed
Tran
spor
tatio
n Pr
ofile
Sec
tion
Distribution of Sediment
Sediment Source
Regulating Volume
Boulder Slit Dam /Large Conduit Dam
Sabo Dams
Sand Pocket Works
Consolidation Dams
WL SL BL
Sedi
men
t Flo
w S
ectio
nD
ebris
Flo
w S
ectio
n
WL : Wash Load Φ<0.1 mm
SL : Suspended Load 0.1<Φ<1.0 mm
BL : Bed Load 1 mm <Φ
Riv
erbe
d/Ba
nkEr
osio
nR
iver
bed/
Bank
Eros
ion
Runoff control volume Storage Volume
Bilibili Dam
Sand Mining
Outflow/Inflow Outflow
SedimentationSedimentation
WL SL BL
BoulderSand
Silt & Clay
Sediment Movement
WL SL BLRegulating Volume Storage Volume
Sand Pocket Works
Inflow
SP-5SP-4
SP-3 SP-2 SP-1
SedimentationSedimentation
Sand Mining
Sand Mining
Sand Mining
WL SL BLStorage Volume
SL
Sub Basin
WL BL
SL
Sub
Basi
n
WL
BLSL
Sub
Basi
n
WL
BL

3.4 Layout of Sediment Control WorksBased on tentative target sediment amount to becontrolled and to be transported at present andfuture topographic conditions along the rivercourses, the propose facility layout plan asillustrated in Figure below, which can be classifiedinto six (6) sediment control works, to reduce thedebris flow occurrence, to stabilize the riverbed, toregulate the debris flow deposit, to control debrisflow direction and to reduce the inflow sediment toBili-Bili reservoir.

Sediment runoff control works
Debris flow control works
Jeneberang Main Stream
Debris flow occurrence control works
Deposition
works with sand mining
Tributaries:- Salo Malino- Salo Bengo- Others
Sediment runoff control works
Deposition Works (Existing Dam)
Caldera
Hill side works
Debris flow occurrence control works

Process of Traditional Stone Terracing
1st
Dry pitching
2nd
Mud layer
3rd
Process
1) Hillside Works and Surface erosion control work .

Outlet of Caldera: Surfaceerosion control work site:dense plantation is required.EL.1000-1500m
EL 1,500m: Surface erosion byrain drop on the deposit ofcaldera: rain drop has accuratesurface erosion process. 2 -3 cmdepth surface erosion during halfhour rainfall observed
Surface soil eroded by rain drop

2) Debris flow occurrence control worksshall be proposed with series of sabo dams atthe exit of a valley, and debris flow directioncontrol works with sabo dams.
Riverbe
d Aug.
2004
Original P
roposed Dams
No.7
-2 No.7
-3
No.7
-4 No.7
-5
No.7
-8 No.7
-7
No.7
-1
Lengkese Village
No.7
-3 No.7
-4
No.7
-5
No.7
-6
No.7
-7
No.7
-8 No.7
-9
No.7
-10
No.7
-1
No.7
-2
Present Rive
rbed Sep.2006
Riverbed Sep. 20061/12~1/13
2 years change
Revised Propose Sabo Dam
Riverbed Aug. 20041/10
Riverbed slope change due to rapid erosion
process
Sabo dam No.7 series in the upper reaches

3) Debris flow control works, and Sediment runoffcontrol works shall be proposed in combinationwith Sabo dams and consolidation dams to restrainunstable riverbed and riverbank profile withpresent riverbed level, to control debris flowdirection, and to accumulate runoff sedimentdeposit at river section from Daraha Bridge sectionto upper reach section of sand pocket No.5 dam.
4) Sediment deposition works and Flow DirectionControl Works which stock the large amount ofgravel and sand material with sand pocket facilities.

Location /Proposed Sabo Facility Recommended Sabo Facility /Structure Type
(1) Upper ReachDebris Flow Occurrence Control worksSeries of Sabo dams (it is necessary toconsider the number of sabo dams /type ofsabo dams based on the results of movementof sediment from caldera)
Combination type of INSEM and concrete type
CSG and ISM type of soil cement was applied to shorten construction Period
(2) Middle Reach(Debris Flow Control Works, Sediment Runoff Control Work) Series of Sabo dams (1 Open type dam, and 5 closed type dam)Series of Consolidation dams withIrrigation intake facility (2 consolidationwith crossing road, and 4 consolidationdams)
Combination type of INSEM and concrete type
Combination of Masonry and concrete type
(3) Sand Pocket Area(Sediment Deposit Area)Rehabilitation of 5 existing sand pocketdamsA series of dispersion dams with irrigationintake facility would be considered
Existing sand pocket dams will be utilized as either sub-dam body or base body of new main dams
Combination of Masonry and concrete type
Sediment Disposal work by machineryexcavation at the edge of reservoir
Machinery excavation both by mining activities and Government at the edge of Reservoir
Lay Out of Sabo Plans

3.6. Sediment Control Effect by Proposed Sabo Facilities
The sediment control facilities has constructed on presentriverbed between upper to middle reaches which alreadypiled up with sediment deposits in order to fix presentriverbed deposit. The facilities will be functioned asfixation of riverbed which means;• to reduce secondary sediment movement from present
sediment deposits,• to reduce lateral erosion of sediment deposits• to control riverbank erosion during flooding time• to stock and regulate the debris flow deposit from upper
stream• to guide sediment flow/sediment flow direction

Source Sediment Restraining
Storage Capacity(Dead Storage)
Initial Riverbed
Source Sediment Restraining
Storage Capacity(Remaining Storage)
Initial Riverbed
Slit/ConduitBase
Slit/Large -Conduit Dam Static Riverbed
Dynamic RiverbedRegulating Storage
Closed-typeStatic Riverbed
Dynamic RiverbedRegulating Storage
Open-type Dam(Blockage-type Dam)
Closed-type Dam(Normal Dam)

KD
-2 KD
-3
KD
-4 CD
-1 CD
-2 CD
-3
Dam
Sub
-dam
Direct Control Sediment Volume
In-direct Control Sediment Volume
Σ Direct Sediment Volumeby Structure Measure
Σ In-direct Sediment Volumeby Riverbed Consolidation Work
+ 20m
+ 6.0km
= 48.43million m3
= 1.56 million m3
KD
-1
+ 10m
7-2
7-3 7
-4 7-5
7-6
7-7
Dam
Sub-d
am
Direct Control Sediment Volume
In-direct Control Sediment Volume
Σ Direct Sediment Volumeby Structure Measure
Σ In-direct Sediment Volumeby Riverbed Consolidation Work
+ 40m
+ 5.0km
= 28.2 million m3
= 1.3 million m3
7-1
+ 20m
Middle Reach Upper Reach

Estimated sediment control volumes of the above proposed facilities are summarized in table below
Location
Direct Control
Sediment Volume
In-direct Control
Sediment Volume
Total Direct and Indirect
Control Sediment Volume
(1) Upper Reach 1.300 28.200 29.500
(2) Middle Reach 1.560 48.430 49.990
Total 2.860 76.630 79.490
(Million m3)

3.7. Implementation of WorksSince the caldera wall collapsed on March2004, the Government of Indonesiacooperating with Government of Japan hadmade efforts to cope the above sedimentproblem in Jeneberang River both structuralmeasures and non-structural measures asshown on figures below.


Bili-Bili Dam and Its Reservoir
Dam type :Main Dam height :Main Dam Crest length :Main Dam Crest width :Main Dam Body volume :Catchment area :Left Wing Dam height :Left Wing Dam Crest length :Left Wing Crest width :
Rock-fill dam73 m750 m10 m2.76 million m3
384.4 km2
42 m646 m10 m1.47 million m3
Gross storage volume :Effective storage volume :Sediment Capacity :Water Utilization Capacity :Design Flood Water Level :Normal Water Level :Low Water Level :Irrigation area (total):Raw Water transmission capacity:
375 million m3
346 million m3
29 million m3
305 million m3
EL.103.0 mEL. 99.5 mEL.65.0 m25,000 ha3.3 m3/s
4. Bili-BiliDam

Three (3) irrigation systems are named as Bili-Bili, Bissua and Kampili, Net total irrigation service areas 23,663 ha.
Municipal and industrial water supply PDAM MakassarPDAM GowaSugar factory in Takalar Regency (PT. Perkebunan Nusantara IV (Persero)
Hydro Power 18 MW

PDAM Makassar owns water treatmentplants with clean water production capacityof 2,340 liter/sec in total and takes 1,250liter/sec from the Jeneberang River, or about53 % of the total water production, whilewater source of PDAM Gowa totallydepends on the water flow of the JeneberangRiver Basin

4.1. Reservoir SedimentationThe cumulative reservoir sedimentation curve since1997shown on following figures and cumulativesedimentation volume had reached 62,744,000 m3 as ofNovember 2008.
Sediment Inflow Volume
Cumulative Sediment Volume
Design Sediment Storage Capacity
-10
0
10
20
30
40
50
60
70
19992001
20042005
20062007 Wet
2007 Dry
2008 Wet
2008 Dry
Res
ervo
ir Se
dim
enta
tion
( x m
illion
m3 )

The annual variation of sedimentation profile of Bili-BiliReservoir based on lowest riverbed elevation of results ofbathymetric survey result is shown on Figure below.
40
50
60
70
80
90
100
110
0 1,000 2,000 3,000 4,000 5,000 6,000 7,000 8,000 9,000
Longitudinal Distance from Dam Site (m )
Elev
atio
n (m
)
1997
2008
Nov
2005 Sep
Intak

4.2. Turbidity of Bili-Bili ReservoirThe following graph shows raw water turbidity records before and after the collapse. High turbidity rates occurred during the rainy season in the month of December and January. The maximum turbidity rate declined to 33,000 NTU in 2006 and about 4,000 NTU in 2007.
Rainfall and Turbidity of Bili-bili Dam
10
100
1,000
10,000
100,000
1,000,000
Date
7-M
ar-0
111
-May
-01
15-J
ul-01
18-S
ep-0
122
-Nov
-01
26-J
an-0
21-
Apr-0
25-
Jun-
029-
Aug-
0213
-Oct
-02
17-D
ec-0
220
-Feb
-03
26-A
pr-0
330
-Jun
-03
3-Se
p-03
7-No
v-03
11-J
an-0
416
-Mar
-04
20-M
ay-0
424
-Jul-
0427
-Sep
-04
1-De
c-04
4-Fe
b-05
10-A
pr-0
514
-Jun
-05
18-A
ug-0
522
-Oct
-05
26-D
ec-0
51-
Mar
-06
5-M
ay-0
69-
Jul-0
612
-Sep
-06
16-N
ov-0
620
-Jan
-07
26-M
ar-0
730
-May
-07
3-Au
g-07
7-O
ct-0
711
-Dec
-07
14-F
eb-0
819
-Apr
-08
23-J
un-0
827
-Aug
-08
31-O
ct-0
84-
Jan-
09
Turb
idity
(NTU
)
0
50
100
150
200
250
Rain
fall I
nten
sity (
mm
/day
)
Bili-bili Dam Outlet Daily Rainfall (from Jan. 2001-Nov.2005 based on Malino Rainfall,from Dec. 2005-up to now based on Lengkese Rainfall)

4.3. Characteristics of Reservoir Sediment DepositionThe investigation of sedimentation in reservoir edge in thestate of reservoir water level at EL. 83.29 m was conductedon October 12, 2006 and the following characteristics arefounded.
0.0%
10.0%
20.0%
30.0%
40.0%
50.0%
60.0%
70.0%
80.0%
90.0%
100.0%
0.0001 0.001 0.01 0.1 1 10
Diameter(mm)
Perse
tage o
f Pass
age(%
)
Reservoir NO1
Reservoir NO2
Reservoir NO3
Fine Material in Caldera
Fine Material in Spoil Bank
As shown in grain distribution of reservoir deposit, content of sediment size is mainly 1mm>φ> 0.075mm (fine sand) and φ< 0.075mm (silt) is less 10 % and classified as bed load material.

4.4. Cause of Reservoir TurbiditySerious muddy water occurred from 2004 and significantreduce at present. The cause of muddy water is originatedfrom very fine soil particle which covered on the sedimentdeposit in the caldera area. Field investigation made onOctober 2006 found the very fine soil exists at temporaryspoil bank in right reservoir edge. The grain distribution issmaller than 0.075mm that classified as wash loadmaterials. This material is same soil which accumulated onthe sediment surface in December 2004.These fine materials on the surface of debris flowmaterials which causes to high turbidity observed severaltime in the caldera area and upper reach of Daraha bridgesite.

Very fine material at inlet structure of Bili-Bili Dam (el.82 m, November 3, 2006)
sedimentaion
Very Fine Material on the surface of debris flow deposit Feb, 2006
Appereance of sand gravel materials after washed away (Mar, 2—0)
Very Fine Material
Debris Flow Deposit
Large-Scale of Sediment Flow Occured (July 2005, Dry Season)

Inlet Bottom, 59.00
LWL, 65.00
NWL, 99.50
SWL, 101.60
DFWL, 103.00
30
40
50
60
70
80
90
100
110
120
0 1000 2000 3000 4000 5000 6000 7000 8000 9000
Distance from the Dam (m)
Elev
atio
n (E
L. m
)
Initial River Bed20082018 (10years)
2028 (20years)
2038 (30years)
2048 (40years)
4.5. Prediction of Future Reservoir Sedimentation

Cumulative
Sedimentation
Volume(103m2)
Percentage of Sediment Volume in the Gross Storage
Capacity
Cumulative
Sedimentation in the
Water Utilization Capacity(103m2)
Percentage of
Sediment Volume in the Water Utilization Capacity
Cumulative in the Flood
Control Capacity (103m2)
Percentage of
Sediment Volume in the Flood
Control Capacity
2008 60,959 16% 57,215 19% 1,373 3%
2018(10 years) 98,394 26% 93,000 30% 2,939 7%
2028(20 years) 126,105 34% 119,825 39% 3,936 10%
2038(30 years) 148,623 40% 142,943 47% 3,675 9%
2048(40 years) 168,981 45% 163,778 54% 3,329 8%
Note: Gross Storage Capacity = 375,000,000 m3; Water Utilization Capacity = 305,000,000 m3;

4.6 Reservoir Sediment Management PlanThe measures of Bili-Bili reservoir sediment management might be specified the following stages.1st stage: Occurrence of caldera collapse2nd stage: Reduce sediment inflow to reservoir
Reduction of sediment transportation volume, fine sediment trapping facilities, excess sediment removal both by structural sabo dam watershed improvement by planting conservation work,
3rd Stage: Increase reservoir sedimentation volume and keep dam function. Decrease reservoir capacity in 2048 become 50 % , Maintenance dredging work surrounding intake
4th Stage: Recovering reservoir capacity and functionDry excavation, Construct giant sediment trap at the edge of reservoir, Selectable intake facility5th Stage: Alternative dam construction at Jenelata

46
1 2 3 4 1 2 3 4 1 2 3 4 1 2 3 4 1 2 3 4 1 2 3 4 1 2 3 4 1 2 3 4Debris flow mitigation work inupper reaches (structuralmeasure and non-structuralmeasure)
-
Sediment removal work atedge of reservoir (Recoving offlood control function)
2
IP 524 Most UrgentMaintenance Dredging Workfor avoiding possible inletblockade by sediment inflow
Maintenance dredgingsurrounding intake screenduring dry season (mean depth:20-30m)
Improvement of Intake facility
Installation of Giant SedimentTrap
4 Long Term Measure(Recommendation)
Provision of New Dam inJenelata River (Jenelata Dam)Reservoir Capacity: 140 millionm3, Dam Height 48.0 m
3 Urgent Measures to sustainoriginal dam functions
2014 2015
IP 524 Urgent DisasterReduction Project forreduction of sediment outflowfrom Caldera and Upper RiverSection
1
Countermeasure work Main Works Picture / Image of Facility 2012 20132008 2009 2010 2011
Sluice Gate
Operation Room
Siphon Feed PipeScreen
Supply Pipe
Flow
Intake
Flood Control Capacity41,000,000 m3
Excess Volume
Dredging period : Rainy Season (6months)
F/S Study
Installation of selective intake
On-Going Urgent Sediment Control Project
Continued sediment removal work by GOI
On-Going Urgent Sediment Control Project
Installation of Giant Sediment Trap
Detail Examination of Multi-Purpose Dam (F/S, DD,CS)
Intake
TYPICAL SECTIONSCALE B
5. PROBLEMS OF DOWNSTREAM AREA OF BILI-BILI DAM
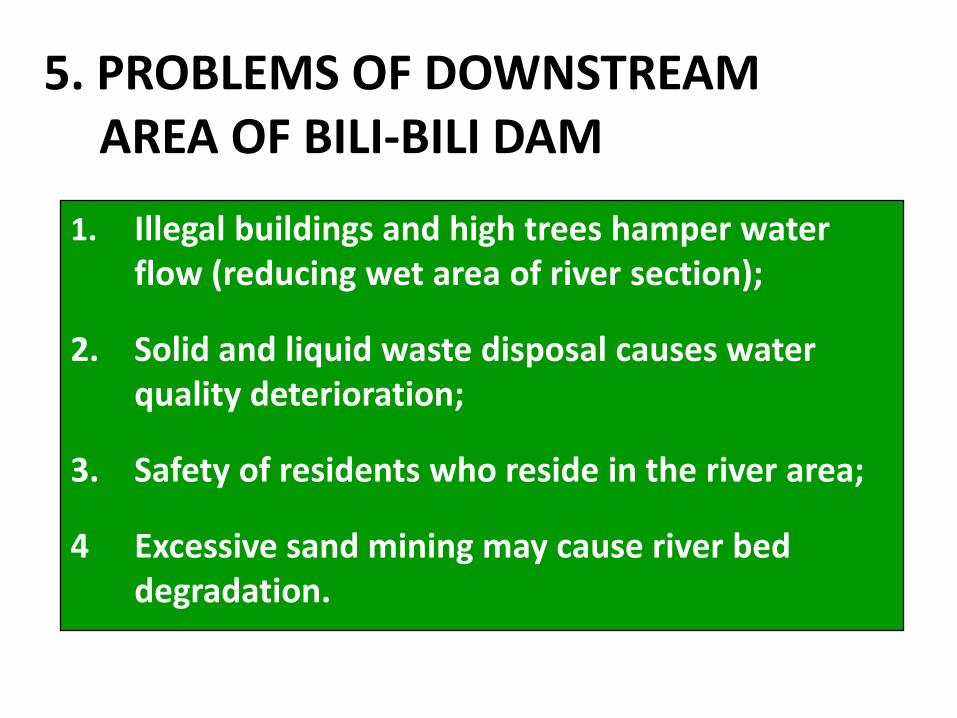
1. Illegal buildings and high trees hamper water flow (reducing wet area of river section);
2. Solid and liquid waste disposal causes water quality deterioration;
3. Safety of residents who reside in the river area;
4 Excessive sand mining may cause river bed degradation.

48
Flood risk to residents
Reduction of River Flow Capacity


50
Garbage may lead to river degradation and water quality deterioration
Building ruins may decrease river channel capacity for accomodating flood water
Garbage may lead to river degradation and water quality deterioration
Garbage may lead to river degradation and water quality deterioration


![HALK BİLİ[1]](https://img.dokumen.tips/doc/110x75/5571f1fd49795947648beefd/halk-bili1.jpg)