Embed Size (px)
Citation preview

24 July 2015
1Q FY 2015-16
Financial Results

2www.ril.com
Forward Looking Statements
This presentation contains forward-looking statements which may be identified
by their use of words like “plans,” “expects,” “will,” “anticipates,” “believes,”
“intends,” “projects,” “estimates” or other words of similar meaning. All
statements that address expectations or projections about the future,
including, but not limited to, statements about the strategy for growth, product
development, market position, expenditures, and financial results, are forward-
looking statements.
Forward-looking statements are based on certain assumptions and
expectations of future events. The companies referred to in this presentation
cannot guarantee that these assumptions and expectations are accurate or
will be realized. The actual results, performance or achievements, could thus
differ materially from those projected in any such forward-looking statements.
These companies assume no responsibility to publicly amend, modify or
revise any forward looking statements, on the basis of any subsequent
developments, information or events, or otherwise.

3www.ril.com
Financial Results

4www.ril.com
Consolidated Financial Results : 1Q FY16
4Q FY15 (in ` Crore) 1Q FY16 1Q FY15% Change
Y-o-Y
% Change
Q-o-Q
70,863 Turnover 83,064 1,07,905 -23.0% 17.2%
7,820 Segment EBIT 7,967 6,916 15.2% 1.9%
6,381 Net Profit 6,222 5,957 4.4% -2.5%
YoY turnover decline - primarily due to 43% lower crude oil prices
Robust 15% YoY growth in Segment EBIT
Refining : ` 5,252 crore (+38%)
Petrochemicals : ` 2,338 crore (+26%)
Oil & Gas : ` 32 crore (-97%)
Higher interest cost (INR depreciation), lower accruals on investments resulted in net profit growth of
4.4%
On standalone basis, RIL net profit at ` 6,318 crore, up 11.8% YoY

5www.ril.com
Consolidated Segment Revenue : 1Q FY16
4Q FY15 (in ` Crore) 1Q FY16 1Q FY15% Change
Y-o-Y
% Change
Q-o-Q
56,442 Refining 68,729 98,081 -29.9% 21.8%
21,754 Petrochemicals 20,858 25,398 -17.9% -4.1%
2,513 Oil & Gas 2,057 3,178 -35.3% -18.1%
4,788 Organised Retail 4,698 3,999 17.5% -1.9%
2,833 Others 2,579 1,772 45.5% -9.0%
YoY hydrocarbon chain revenues impacted by lower product prices – Refining ~ 29% and Petrochemicals
~ 15%
QoQ Refining revenues up by 21.8% primarily due to recovery in oil prices (Brent crude up 15% QoQ)
QoQ Petrochemicals segment revenues declined due to slower offtake of downstream polyester products
Strong growth momentum in Retail business
Revenue up 17.5% on YoY basis
Store network expansion – net addition of 126 stores during 1Q FY16

6www.ril.com
Consolidated Segment EBIT Mix
Overall segment up 15% YoY to ` 7,967 crore
Share of Refining EBIT increased sharply to 65.9% from 55.1% a year ago

7www.ril.com
R & M Segment Performance
Low absolute oil prices supportive of
refining business – aiding demand growth
and low energy cost
Highest ever quarterly EBIT of ` 5,252
crore, up 37.7% YoY
GRM of $ 10.4/bbl – highest in last six
years
Led by strong gasoline cracks (+28%
QoQ), favorable crude differential
Outperformed Singapore benchmark by
$ 2.4/bbl – above five year average
Crude throughput of 16.6 MMT, operating
rate of 107%
3,814
4,902 5,252
8.7
10.110.4
0
2
4
6
8
10
12
-
1,000
2,000
3,000
4,000
5,000
6,000
1Q FY15 4Q FY15 1Q FY16
EBIT (` crore) GRM ($/bbl)

8www.ril.com
Petrochemicals Segment Performance
EBIT of ` 2,338 crore, up 25.5 % YoY and
16.7% QoQ
Sharp improvement in EBIT margin at
11.2%
Production at 5.8 MMT, up 7.4%
Robust polymer demand growth in India
of 16% YoY
Strong delta trends QoQ in PE (+15%)
and PP (+38%) – reflecting tight ethylene
chain
Sharp rebound in Fibre intermediates
deltas on QoQ basis
PX (+18%), PTA (+33%) and MEG
(+25%)
1,863 2,003 2,338
7.3
9.2
11.2
0
2
4
6
8
10
12
-
1,000
2,000
3,000
4,000
1Q FY15 4Q FY15 1Q FY16
EBIT (` crore) EBIT Margin (%)

9www.ril.com
Oil & Gas Segment Performance
EBIT at ` 32 crore, down 96.9%
Impacted by commodity price headwinds in
US Shale business
Stable production in US shale at 49 BCFe
in 1Q FY16
Average realization of $ 3.5/MCFe,
down 47% YoY
Successfully completed monetization of
EFS Midstream – significant value
unlocking
Domestic upstream: KG-D6 production at
11.4 MMSCMD and 5,727 BOPD of liquids
Performance impacted by natural
decline and lower realizations
1042
489
32
32.8%
19.5%
1.6%
0.0%
5.0%
10.0%
15.0%
20.0%
25.0%
30.0%
35.0%
-100
100
300
500
700
900
1,100
1,300
1Q FY15 4Q FY15 1Q FY16
US Shale (` crore) Domestic (` crore) EBIT Margin (%)

10www.ril.com
Retail Segment Performance
Retail EBIT at ` 111 crore, up 37% YoY
Revenue momentum sustained – Turnover
growth of 17% to ` 4,698 crore
Led by strong growth in Digital and
Fashion & Lifestyle segment
LFL growth of up to 13 % across format
sectors
Improvement in EBIT margin at 2.4% vs.
2.0%
Net addition of 126 stores
Total No. of 2,747 stores
Consolidated retail presence in Southern
India with over 1,000 stores
81
104 111
2.02.2
2.4
0
1
2
3
-
100
200
1Q FY15 4Q FY15 1Q FY16
EBIT (` crore) EBIT Margin (%)
11www.ril.com
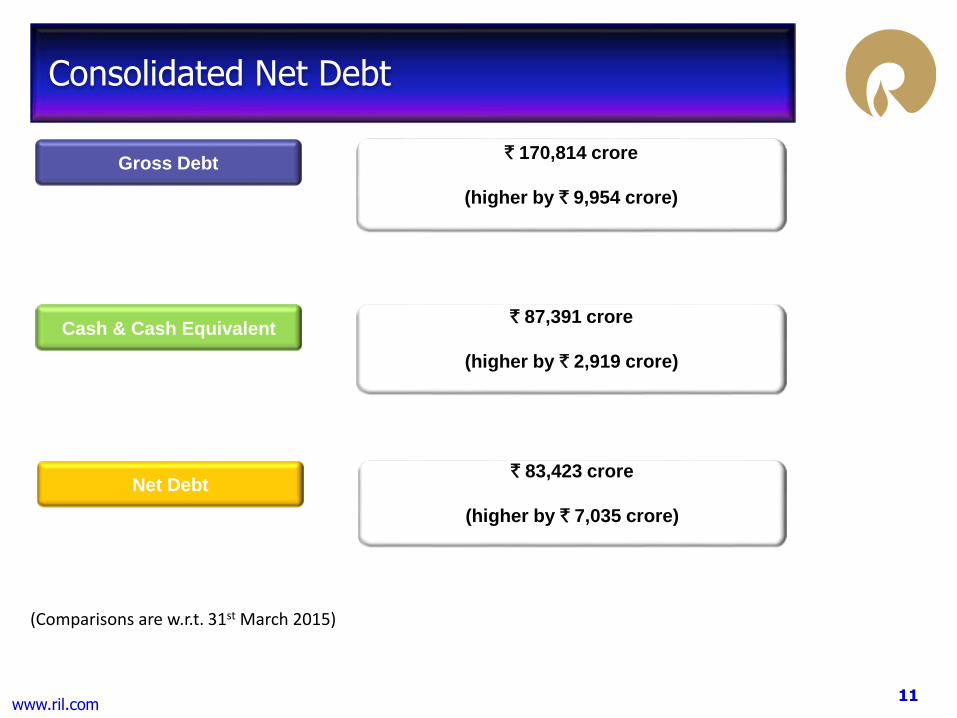
Consolidated Net Debt
` 170,814 crore
(higher by ` 9,954 crore)
Gross Debt
` 87,391 crore
(higher by ` 2,919 crore)
Cash & Cash Equivalent
` 83,423 crore
(higher by ` 7,035 crore)
Net Debt
(Comparisons are w.r.t. 31st March 2015)
12
J3 Projects – Status Update
J3 Projects – Progress Photographs

13
HIGHLIGHTS
Largest program to expand presence and leadership position
J3 program is the largest effort undertaken by Reliance to expand its presence in
energy business
Largest Coke Gasifier being implemented as part of clean coal initiative
First of it’s kind ROGC is being set up to produce Petrochem / Polymer from refinery
off gases
LLDPE unit under execution will house the word’s largest extruder of 100 TPH
capacity
World’s largest LDPE of 420 KTA capacity is being constructed
World’s largest PSA being installed to produce 651 TPD of H2 from Syngas
World’s largest Air Separation Unit is being implemented to produce 5,250 TPD of
oxygen
One of the largest workmen camps operational to house more than 1 lakh workmen

14
HIGHLIGHTS
Engineering and Procurement are in close out mode
Overall construction progressing steadily with DTA Gasification, ROGC and
Paraxylene leading the progress charts
Majority of Super Heavy lift equipment erected; 5 cranes of 3200 MT, 2X2000 MT,
1600 MT and 1250 MT mobilized for the purpose. Heaviest equipment lift in India
(1655MT) completed
More than 130,000 workmen deployed at site. Labour camps are occupied to near
capacity
New records in construction created by executing 1.8 lakh Cum of concrete, 36,000
MT of Steel fabrication, 29,000 MT of Steel erection, 6 lakh ID of pipe fabrication and
17 lakh Inch Meter of piping installation, on a monthly basis
Stadium like illumination operationalized in construction areas for round the clock
work
Outsourced Structural steel fabrication is nearing completion.
Fabrication of outsourced exotic piping is being monitored. Close-out targeted by
Sep’15

15
CBI LUMMUSTECHNIP
DOW
FOSTER WHEELER
JACOBS
FLUOR
BECHTEL
BP LUMMUS
TECHNIMONT
BECHTELUNIVATION APG
LINDE
TECHNIP
LYONDELLBASELFOSTER WHEELER
LINDE
BECHTEL
SIBUR
TECHNIMONT
J3 PROJECTS - ENGINEERING
Engineering successfully managed from 20 offices across globe from RCP, Mumbai
REG
FLUOR
FOSTER WHEELER
16
Engineering is in close out mode with focused efforts from all stakeholders
All the engineering deliverables for procurement and construction issued
Specifications & standards established and controlled by PMT to ensure
commonality
Discipline engineers embedded in project execution teams to manage
interface with engineering contractors and ensure quality of deliverables
through regular audits
Safety in design incorporated and ensured through reviews
Standardized engineering tools from Smart Plant suite deployed to ensure
commonality of data. Documents shared electronically and reviewed online for
consistent quality and minimize use of paper
Engineering set up at site is established to support construction and resolve
site queries
Engineering efforts complete for inherently safe design with minimum cost
J3 PROJECTS - ENGINEERING

17
Procurement of Mechanical, Electrical, Instrumentation and bulk material
items completed. Top up material is being procured
Challenging procurement efforts complete to secure supplies for largest
Gasifier, ROGC & Paraxylene units consisting of complex equipment,
packages and large size equipment
Accomplished one of the largest sourcing for bulk material including exotic
and speciality piping, special grade structural steel and speciality instruments
Material sourced from vendors across Germany, USA, Italy, France, Japan,
Korea, UK, Switzerland, Canada, Netherlands, Israel, China, UAE, Singapore,
Austria, Belgium, Hong Kong, India
Special cranes of 3200 MT, 2000 MT, 1600 MT mobilized from global vendors
like Mammoet and Sarens for erection of Super Heavy Lift equipment
Accomplished challenging procurement for timely delivery at optimum cost
J3 PROJECTS - PROCUREMENT

18
J3 PROJECTS - PROCUREMENT
Fabrication at vendor’s shops monitored closely by large inspection and
expediting teams to ensure quality of material delivered on time
One of the largest logistics effort operated with global transportation /
shipping agencies for expeditious delivery of material
Sikka Jetty upgraded for round the clock operation to receive the project
cargo of over 1 Million Freight Tonnes
Majority of material is delivered at site safely through dedicated efforts of
material management team
State of the art automation software being used for Material Management

19
J3 PROJECTS - CONSTRUCTION
Construction in all project areas is in advanced phase and in full swing
Quality benchmarks raised and being ensured through close monitoring and
control
Workmen camps operational with all basic amenities and hygiene
Over 130,000 workmen working at site to achieve construction targets
Structured trainings being imparted to improve the skills of craftsmen
Largest ever mobilization of construction machinery to support the construction
efforts
Fabrication shops with enhanced capacities producing pipe spools and structures
to support the construction plan
Stadium like lighting & other infrastructure operationalized for “round the clock”
construction
Integrated framework with COTS and in-house tools deployed to support &
monitor progress
Infrastructure is operational to support largest Global Construction Site

20
Largest construction quantities being executed at site – more than 2.9 million Cum of
concrete, nearly 4.1 lakh MT of steel, about 5,000 km of pipe laying and 27,000 km of
cabling
Concrete pouring is nearing completion with adequate support from all the batching
plants operating to full capacity
Majority of structural steel is fabricated at site and outsourced vendors; it is being
erected expeditiously
Piping fabrication at shops, both in-house and outsourced, is in advanced stage of
completion
Above ground pipe laying is started in a big way, supported by planned completion of
pipe racks, structure erection and equipment installation
Civil works for control rooms, substations, Plant Interface Buildings is complete and
installation of panels, transformers, cabling in progress
Construction efforts focused towards fast track completion
J3 PROJECTS - CONSTRUCTION

21
TARGETS FOR PLANT START-UP
S NO Plant / Complex Target
1 Gasification In phases starting 4Q FY 15-16
2 PX4 4Q FY 15-16
3 C2 Complex 3Q FY 16-17
4 Utilities DEC’15 – MAR’16

22
Site Progress Photographs
23
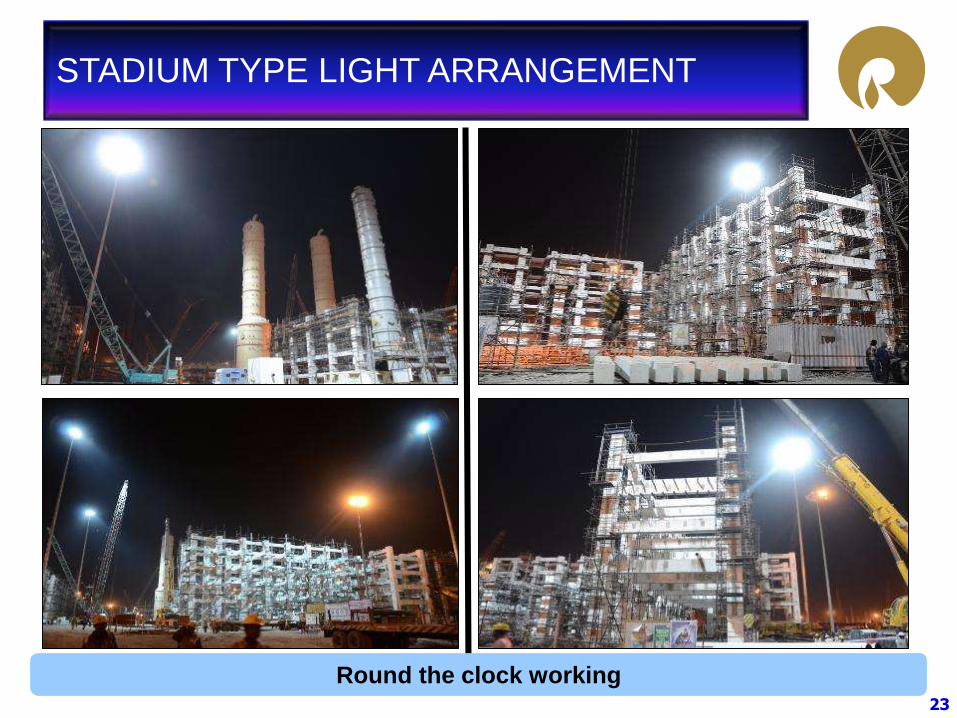
STADIUM TYPE LIGHT ARRANGEMENT
Round the clock working

24
WORKMEN CAMPS
Basic amenities and hygiene at workmen camps

25
SITE VIEW FROM ‘THE HILL’

26
GASIFICATION SKYLINE

27
GASIFICATION HEAVIEST COLUMN (1655MT)

28
GASIFICATION DOME – INSIDE VIEW

29
GASIFICATION COLD BOX & SRU STACK

30
PARAXYLENE HEATERS

31
PARAXYLENE COLUMNS

32
ROGC FURNACE

33
ROGC CRACKED GAS COMPRESSOR

34
ROGC CONTROL ROOM – ROOF SLAB CONCRETING

35
ROGC – ERECTION OF C3 SPLITTER

36
MEG STRIPPER / REABSORBER COLUMN

37
LLDPE – REACTOR INSTALLATION

38
CPP – HRSG & GTG INSTALLATION

39
OFFSITES & UTILITIES – FLARE STRUCTURE

40
OFFSITES & UTILITIES – PIPERACK

41www.ril.com
Refining & Marketing
42www.ril.com
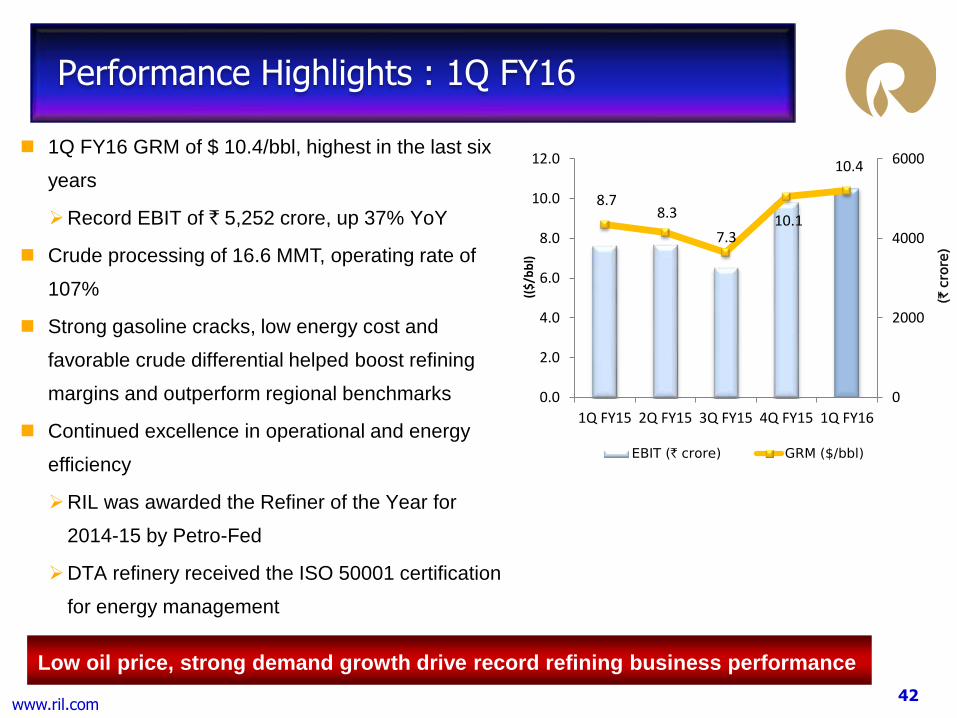
Performance Highlights : 1Q FY16
1Q FY16 GRM of $ 10.4/bbl, highest in the last six
years
Record EBIT of ` 5,252 crore, up 37% YoY
Crude processing of 16.6 MMT, operating rate of
107%
Strong gasoline cracks, low energy cost and
favorable crude differential helped boost refining
margins and outperform regional benchmarks
Continued excellence in operational and energy
efficiency
RIL was awarded the Refiner of the Year for
2014-15 by Petro-Fed
DTA refinery received the ISO 50001 certification
for energy management
Low oil price, strong demand growth drive record refining business performance
8.78.3
7.310.1
10.4
0
2000
4000
6000
0.0
2.0
4.0
6.0
8.0
10.0
12.0
1Q FY15 2Q FY15 3Q FY15 4Q FY15 1Q FY16
(` c
rore
)
(($
/bb
l)
EBIT (` crore) GRM ($/bbl)
43www.ril.com
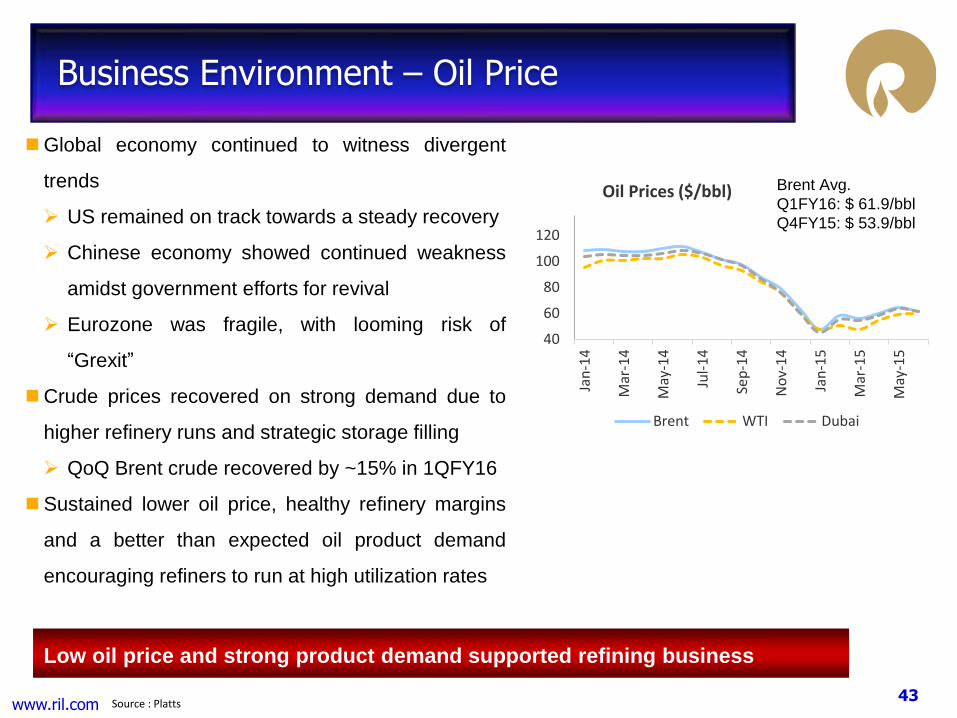
Business Environment – Oil Price
Low oil price and strong product demand supported refining business
Source : Platts
Global economy continued to witness divergent
trends
US remained on track towards a steady recovery
Chinese economy showed continued weakness
amidst government efforts for revival
Eurozone was fragile, with looming risk of
“Grexit”
Crude prices recovered on strong demand due to
higher refinery runs and strategic storage filling
QoQ Brent crude recovered by ~15% in 1QFY16
Sustained lower oil price, healthy refinery margins
and a better than expected oil product demand
encouraging refiners to run at high utilization rates
40
60
80
100
120
Jan
-14
Mar
-14
May
-14
Jul-
14
Sep
-14
No
v-1
4
Jan
-15
Mar
-15
May
-15
Oil Prices ($/bbl)
Brent WTI Dubai
Brent Avg.
Q1FY16: $ 61.9/bbl
Q4FY15: $ 53.9/bbl

44www.ril.com
Business Environment - Global Oil Demand
Source : IEA, Analyst Research
Global economic growth and lower oil prices along with seasonal factors in large consuming
countries supported oil demand in 1H’15
1H’15 global oil demand up ~1.6 mb/d (vs. 0.7 mb/d in 2014)
Refining margins supported by strength in light distillates especially gasoline
Increased consumption in US, China and India helped gasoline demand growth, supporting
cracks

45www.ril.com
Refining margins strengthened across all regions in 1Q FY16 on YoY basis
Robust gasoline cracks supported margins, especially in US where margins were at record highs
Gasoline demand from key countries increased by 592 kb/d YTD
97% of the gasoline demand growth came from US, China and India
Delay in refinery startup and difficulties in ramping of new capacities supported the margins
Improved refining margins globally, driven primarily by strength in Gasoline
Source : Reuters
Global Refining Margins
0
90
180
270
360
450
UnitedStates
SaudiArabia
Asia China India
kb/d
Gasoline demand growth, YoY
1Q15 2Q15 3Q15 4Q15 1Q16
5.77
2.51
8.95 8.78.02 8.11
20.08
10.4
0
5
10
15
20
25
Singapore Europe US RIL
B E N C H M A R K R E F I N I N G M A R G I N S 1 Q 1 6 V S 1 Q 1 5
1Q FY15 1Q FY16
46www.ril.com
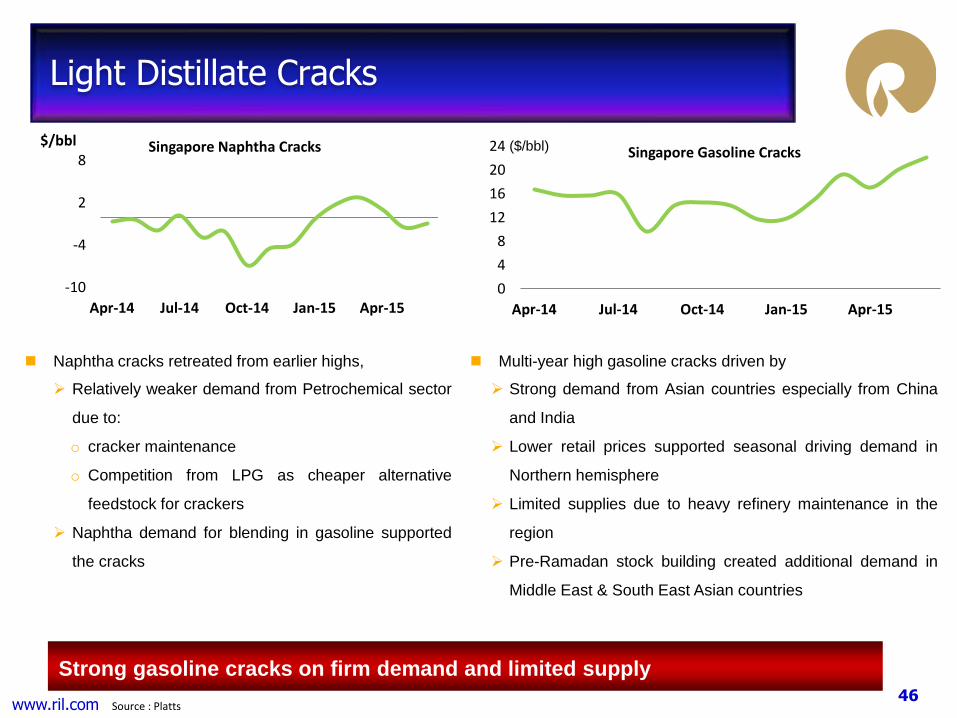
Naphtha cracks retreated from earlier highs,
Relatively weaker demand from Petrochemical sector
due to:
o cracker maintenance
o Competition from LPG as cheaper alternative
feedstock for crackers
Naphtha demand for blending in gasoline supported
the cracks
Light Distillate Cracks
Strong gasoline cracks on firm demand and limited supply
Multi-year high gasoline cracks driven by
Strong demand from Asian countries especially from China
and India
Lower retail prices supported seasonal driving demand in
Northern hemisphere
Limited supplies due to heavy refinery maintenance in the
region
Pre-Ramadan stock building created additional demand in
Middle East & South East Asian countries
Source : Platts
-10
-4
2
8
Apr-14 Jul-14 Oct-14 Jan-15 Apr-15
$/bbl Singapore Naphtha Cracks
0
4
8
12
16
20
24
Apr-14 Jul-14 Oct-14 Jan-15 Apr-15
Singapore Gasoline Cracks($/bbl)

47www.ril.com
Jet-Kero weakened amid ample supplies
Incremental supplies from new Middle East
refinery
Weaker summer demand in key import market in
Europe weighed on cracks
However, regional demand remained supportive
to cracks
Middle Distillate Cracks
Steady demand overshadowed by ample supply led to softer middle distillates cracks
Source : Platts, KBC
Gasoil cracks under pressure on increased supplies
Over 1 MMBPD of new refining capacity came online
in last 2-3 quarters, including 0.8 MMBPD in Middle
East
Higher refineries run in Europe kept the market well
supplied
Chinese exports high on tapering industrial demand
Downward pressure on cracks was offset by stronger
demand in Middle East and India
0
4
8
12
16
20
24
Apr-14 Jul-14 Oct-14 Jan-15 Apr-15
Singapore Gasoil Cracks(
0
4
8
12
16
20
24
Apr-14 Jul-14 Oct-14 Jan-15 Apr-15
Singapore Jet Kero Cracks(($/bbl) ($/bbl)
48www.ril.com
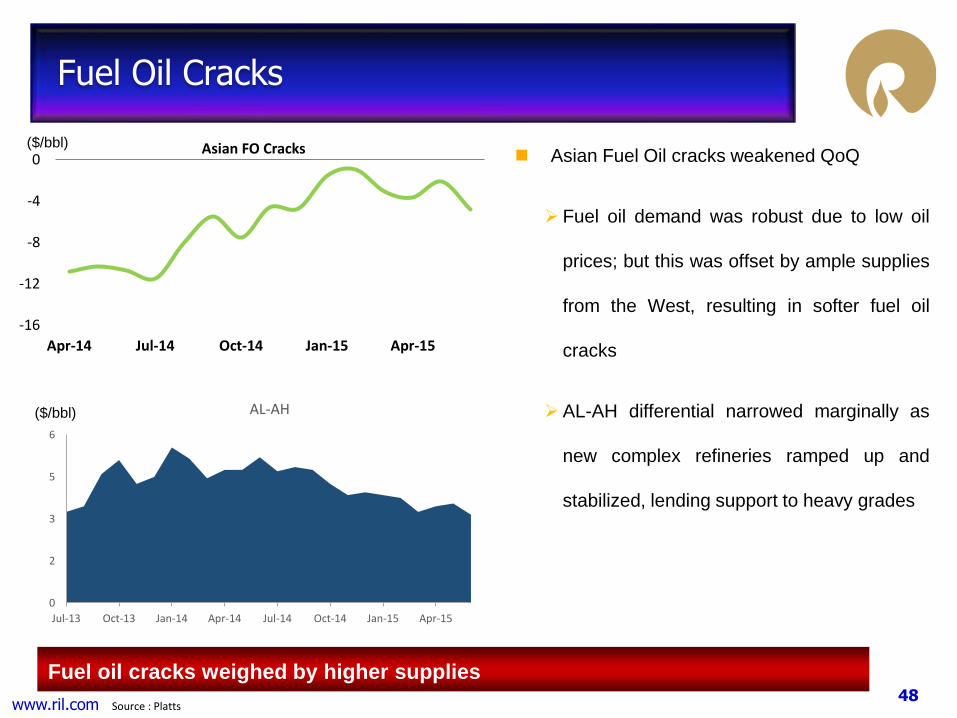
Fuel oil cracks weighed by higher supplies
Fuel Oil Cracks
Asian Fuel Oil cracks weakened QoQ
Fuel oil demand was robust due to low oil
prices; but this was offset by ample supplies
from the West, resulting in softer fuel oil
cracks
AL-AH differential narrowed marginally as
new complex refineries ramped up and
stabilized, lending support to heavy grades
Source : Platts
-16
-12
-8
-4
0
Apr-14 Jul-14 Oct-14 Jan-15 Apr-15
Asian FO Cracks($/bbl)
0
2
3
5
6
Jul-13 Oct-13 Jan-14 Apr-14 Jul-14 Oct-14 Jan-15 Apr-15
AL-AH($/bbl)

49www.ril.com
Product Cracks and Margins
Strength in gasoline cracks supported margins
High refinery runs across the globe kept markets well supplied and exerted pressure on middle
distillate cracks
Diversified crude sourcing and grade switching flexibility help RIL outperform benchmark margins
Light-Heavy differential continue to be supportive for complex refiners
Source : Platts, Reuters
Asian Product
Cracks ($/Bbl)1Q FY16 1Q FY15
YoY
Change4Q FY15
QoQ
Change
Dubai 61.3 106.1 (44.8) 51.9 9.4
Brent-Dubai 0.6 3.5 (2.9) 2.1 (1.5)
Asian L-H Diff 3.4 4.9 (1.5) 3.6 (0.2)
Naphtha (0.5) (1.0) 0.5 1.5 (2.0)
Gasoline 19.8 16.1 3.7 15.4 4.4
Jet/Kero 13.5 14.3 (0.8) 17.1 (3.6)
Gasoil 13.8 16.0 (2.2) 16.2 (2.4)
Fuel Oil (4.9) (12.8) 7.9 (3.0) (1.9)
Singapore GRM 8.0 5.8 2.3 8.5 (0.5)
RIL GRM 10.4 8.7 1.7 10.1 0.3

50www.ril.com
Domestic Marketing
Over 450 retail outlets and 8 terminals already operational
Consistent customer experience across all touch points through efficient mix of
people, processes and technology
Unique Value Added Services and consumer focused schemes
Fleet Management Program providing better Fleet Control, Cash Flow
Management & Cashless transactions
Customized loyalty programs
Targeting aggressive volumes in the bulk HSD market
Acquired Rate Contract for Railways, the largest consumer of HSD in India
Integrated supply chain comprising Terminals [Hinterland & Coastal] and Company
owned fleet of tank trucks, covering major consumption centres across the country
Reliance committed to provide superior customer value across the network

51www.ril.com
Product Placement in Domestic Market
Domestic demand:
Positive trend for transportation fuel demand
Robust growth in gasoline demand expected to
continue in the medium term
Post DBTL and reduction in diversion, LPG
demand slated for rapid growth especially in rural
areas
Refinery Product Sales:
Resilient refinery sales growth, specially
to PSUs
Increased gasoline and gasoil sales to
PSU helped in replacing imports
Robust domestic demand supported refinery sales growth to meet India’s energy needs
Source: IPR
12.3%
3.6%
3.5%-3.4%
8.6% -5.9%
-1,5%
-
4,000
8,000
12,000
16,000
20,000
MS HSD ATF Kerosene LPG Naphtha Others
India Demand (in KT)
1Q FY15 1Q FY16
8,456
2,782
4,443
Refinery Sales (in KT) - 1Q FY16
Exports Captive Domestic (Bulk +PSU+ Retail)

52www.ril.com
Emerging markets economic outlook positive on lower oil prices
– Indian economy expected to continue on path of strong recovery
– China expected to provide more stimulus to bring its economy back on recovery track
– Japan expected to post positive growth in 2015
Crude oil market continues to be oversupplied with considerable inventory overhang
Iranian barrels returning to the market may keep the crude prices under pressure
Oil demand expected to be strong, with forecast growth of 1.4-1.6 mb/d in 2015 and 2016
In the medium term, global refined product demand growth is expected to outstrip refinery capacity
additions
– Delay in new capacity additions, outages / maintenance to support refining margins
– Refinery closures in Australia, Japan and Taiwan expected to tighten product supply in the region
R&M Business Outlook
Favorable industry dynamics; improving utilizations and margins
Source : IMF, IEA

53www.ril.com
Petrochemicals – Opening Remarks

54www.ril.com
Global Macro Environment
Note: Crude and Naphtha prices are basis Dubai and Singapore benchmarks
US indicators continued to show signs of economic recovery
Unfolding Greek crisis, weaker Euro and Chinese stock market turmoil to be closely
monitored to assess impact on demand
Crude and Naphtha stabilized through the quarter margins and consumption trends
remained healthy
Crude (Dubai) rose by ~18%; Naphtha rose by ~ 16% QoQ
Global structural shift to alternate feedstocks will define competitive dynamics
Project delays driven by combination of lower oil prices and uptrend in EPC costs
Exit trends for the quarter bode positive across the Asian petrochemical sector
Naphtha based crackers continue to remain competitive on low crude price
Integrated regional players remain well positioned to capture chain value
55www.ril.com
83%
84%
85%
86%
87%
88%
89%
90%
0
1
2
3
4
5
6
7
8
9
2011 2012 2013 2014 2015 2016 2017 2018 2019 2020
Op
erat
ing
Rat
e (%
)
Dem
and
Su
pp
ly A
dd
itio
ns(
In M
MTP
A)
Capacity Demand Operating Rate
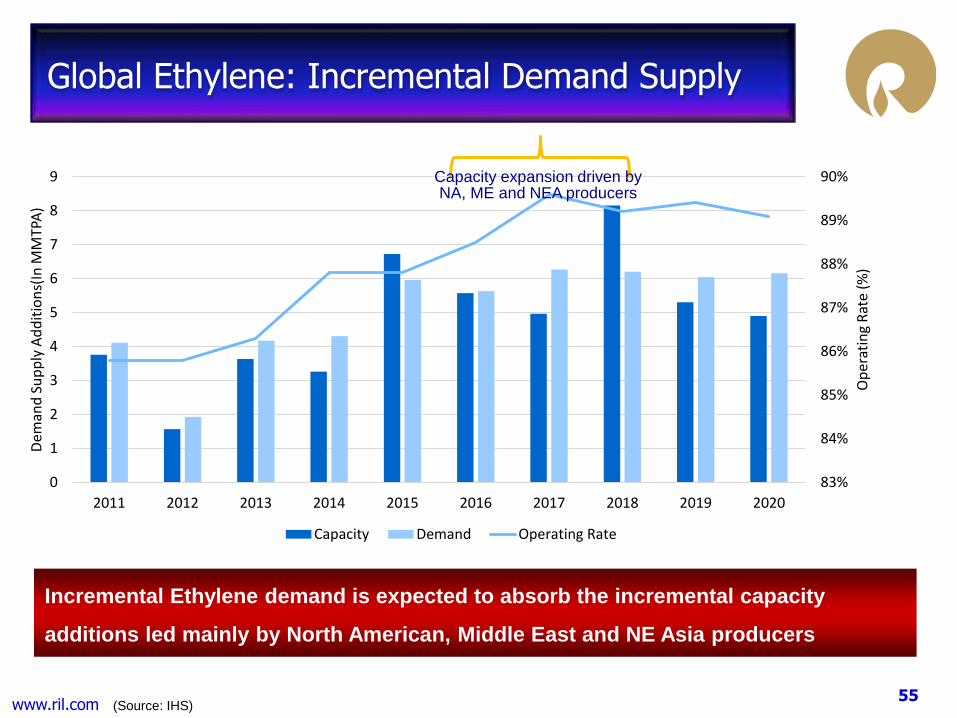
Global Ethylene: Incremental Demand Supply
(Source: IHS)
Capacity expansion driven by NA, ME and NEA producers
Incremental Ethylene demand is expected to absorb the incremental capacity
additions led mainly by North American, Middle East and NE Asia producers

56www.ril.com
Changing Feedstock Dynamics
30.9% 32.3% 34.2%
21.3% 19.9% 19.6%
10.9% 10.0% 9.1%
35.9% 34.7% 30.8%
1.1% 3.0% 6.4%
2010 2015 2020
EPB EPB/Naphtha EPB/Naphtha/Gas Oil Naphtha/Oth. CTO/MTO
Source: IHS
144 MMT 190 MMT160 MMTEthylene Supply Mix:
Ethylene dynamics are shifting in
the favour of lighter feedstocks
Light feeds and coal to account for
>60% share of Global Ethylene
capacity by 2020 vs. ~55% today
4.4% 9.7%30.2% 29.7% 25.4%3.9%
7.5% 13.6%
58.0% 50.2% 43.3%
3.9% 4.4% 4.1%3.9% 3.8% 3.9%
2010 2015 2020
CTO/MTO Refinery PDH Steam Cracker Metathesis Others
140 MMT114 MMT93 MMT Propylene Supply Mix:
Propylene chain dynamics are also
changing with a marked increase in
PDH and new Coal based
capacities coming on stream
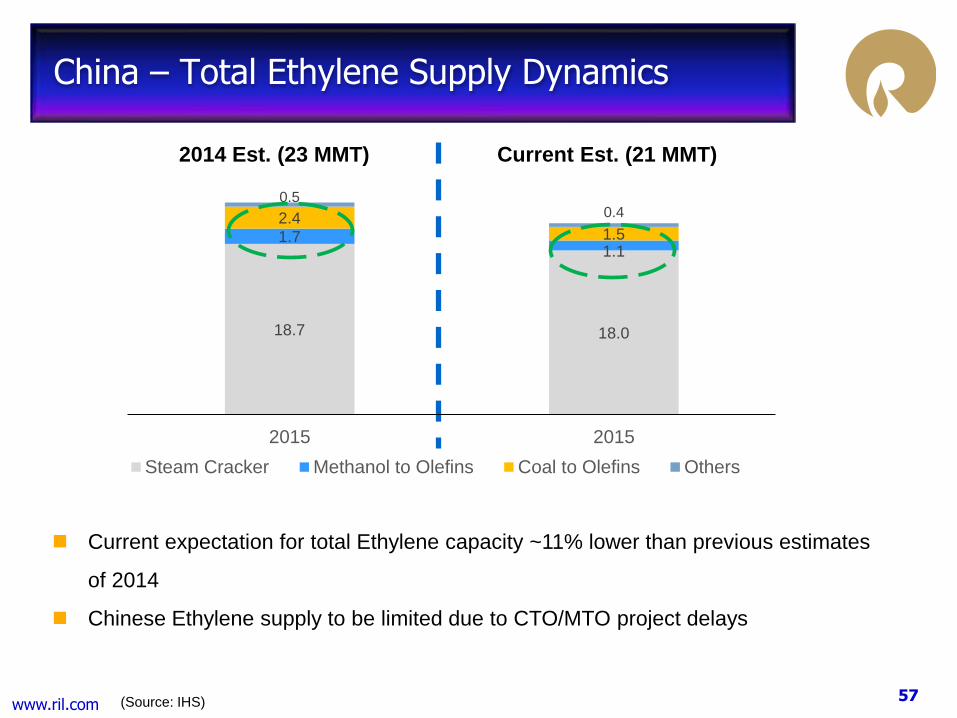
57www.ril.com (Source: IHS)
China – Total Ethylene Supply Dynamics
Current expectation for total Ethylene capacity ~11% lower than previous estimates
of 2014
Chinese Ethylene supply to be limited due to CTO/MTO project delays
2014 Est. (23 MMT) Current Est. (21 MMT)
18.7 18.0
1.71.1
2.41.5
0.50.4
2015 2015
Steam Cracker Methanol to Olefins Coal to Olefins Others

58www.ril.com
Ethane Project – Overview
Discussion are in progress with major suppliers of Ethane in North America for long term
sourcing of Ethane
The progress at the US terminal is as per schedule and is expected to be ready and
operational during 2Q-3Q/CY2016, much before the first loading of RIL’s vessels
The design and engineering of the ethane vessels is in progress.
The ceremonial steel cutting took place on 1st of July; With this, the fabrication of the
1st vessel (out of 6) has commenced
Construction activities for the import terminal at Dahej (India) is in progress
Basic engineering for cracker modification is in progress
A few of long lead equipment have been committed / ordered; Detailed engineering
contract has been awarded
495 KM pipeline between Dahej and Nagothane under implementation
PNGRB Board has approved proposal of dedicated pipeline
Modules of the project progressing in a coordinated manner

59www.ril.com
Ethane Project – Site Picture

60www.ril.com
Polymer Chain

61www.ril.com
Business Environment – Polymer Chain
Last 5 years saw a sustained rise in global demand (~3.8% CAGR) for all major polymers
PP, PE and PVC
PP demand at 61.8 MMT up ~4.0%, led by automotive, cement packaging and non-
woven markets
PE demand at 88.5 MMT up ~3.7%, led by both flexible and rigid packaging, and
roto-moulded tanks
PVC demand at 41.9 MMT up ~3.7%, led by pipe and fittings especially for
infrastructure, telecommunications and municipal utilities
Indian polymer demand growth during same period at 7.1% (~2.0x global demand) led
mainly by:
Film and Sheet (Packaging), Raffia (Cement), Injection and Blow Molding
(Automotive and FMCG)
RIL remains the largest polymer producer in India with a strong focus on customer
centricity, operational excellence and driving innovation across the value chain

62www.ril.com
Price Movement – SE Asia
(Source: Platts)
$/MT1Q FY15
Avg.
4Q FY15
Avg.
1Q FY16
Avg.
% Change
Q-o-Q
% Change
Y-o-Y
Oil - Dubai ($/bbl) 106 52 61 18% -42%
Naphtha (MOPS) 946 473 548 16% -42%
Ethylene 1447 1024 1409 38% -3%
Propylene 1308 852 980 15% -25%
EDC 460 266 364 37% -21%
HDPE 1555 1173 1355 15% -13%
PP 1541 1097 1319 20% -14%
PVC 1031 822 869 6% -16%
Building blocks witnessed mixed trends:
Ethylene firmed up on tight availability
Propylene lower on account of regional supply ease
Lower oil price scenario is improving the competitiveness of naphtha leveraged Asian Petchem
players

63www.ril.com
Polymer Delta Scenario – SE Asia
PP deltas higher (+38% QoQ) on tight supply,
turnarounds, and lower Propylene prices
HDPE deltas improved (+15% QoQ) with
increased competitiveness of naphtha-based
crackers
Whereas, PVC deltas were lower on account of
higher EDC prices
233 245
339
0
100
200
300
400
Q1 FY15 Q4 FY15 Q1 FY16
PP-Propylene 5 YEAR AVERAGE
Delta in $/MT
(Source: Platts)
608700
807
0
200
400
600
800
1000
Q1 FY15 Q4 FY15 Q1 FY16
HDPE-NAPHTHA 5 YEAR AVERAGE
418
486432
0
100
200
300
400
500
600
Q1 FY15 Q4 FY15 Q1 FY16
PVC-Nap-EDC 5 YEAR AVERAGE

64www.ril.com
Demand Growth and RIL Operational Performance
Demand across all major end-use sectors remained healthy
1Q FY16 Indian polymer demand up 16% YoY
PE: up 11%
PP : up 13%
PVC : up 29%
China’s polymer demand (April-May) higher by
7.9% y-o-y:
PP: up 13.6%
PE: up 5.7%
PVC: up 4.1%
RIL Production
Production (MMT) 1Q FY15 1Q FY16
PP 0.7 0.6
PE 0.3 0.3
PVC 0.1 0.2
TOTAL 1.1 1.1
RIL Polymer production remained
flat at 1.1 MMT
Domestic polymer market share:
34%
PP market share: 52%

65www.ril.com
Injection Moulding and Rigid Packaging Solutions
Food Packaging:
Multi-layer containers for longer shelf-life,
specially for Rosogulla Packaging and Fruit Pulp
packaging.
Replacing tin containers for rosogulla packaging
PP Bottles for flavoured milk and other
beverages.
New packaging solutions with In-mould labelling
(IML) bottles:
Project is under progress to replace glass
bottles with IML PP bottles
Driving innovation across the customer value chain

66www.ril.com
Business Outlook – Polymer Chain
RIL is well positioned to remain a leading player in the global polymer market
Ethylene and Propylene dynamics to change with fewer cracker turnarounds and supply
ease
Sustained lower oil prices will continue to improve the cost competitiveness of Asian
polymer producers
Delays in incremental Chinese capacity(CTO/MTO) likely to support margins going
forward
Domestic demand is likely to remain higher across all major end-use sectors
RIL is focused on growing opportunities with new capacity additions and downstream
application development
67www.ril.com
Elastomers

68www.ril.com
Business Environment – Elastomers
Significant strength in butadiene prices (+64% QoQ) put pressure on
downstream PBR and SBR margins
Domestic commercial vehicles sales grew 3.6% y-o-y driven by growth in all
segments except LCV’s
Passenger vehicles sales grew by 6.2% y-o-y
21% decline in domestic production of natural rubber led to imports increasing
by 5.5% (to 106 KT) in1Q FY16, despite an increase in import duty
Production at both the new elastomers plants, i.e., PBR and SBR being
stabilized
(Source: ATMA: All India Tyre Manufacturers Association)

69www.ril.com
Elastomer Delta Scenario – SE Asia
(Source: Platts, ICIS)
Butadiene (BD) deltas have risen during
1Q FY16 with firm prices and tight supply
With rising BD and styrene prices, SBR
and PBR deltas have shrunk further in
1Q FY16.
588515
324
0
200
400
600
800
Q1 FY 15 Q4 FY 15 Q1 FY 16
PBR - Butadiene 5 yr avg
Delta in USD/MT
590
495
262
0
200
400
600
800
Q1 FY 15 Q4 FY 15 Q1 FY 16
SBR - BD - Styrene 5 yr avg
395321
510
200
400
600
800
1000
1200
1Q FY15 4Q FY15 1Q FY16
Butadiene-LPG 5 year avg

70www.ril.com
Business Outlook – Elastomers
Elastomer prices are expected to stabilize and deltas are likely to improve with
softening of feedstock prices.
Operating rates are expected to remain range bound with PBR capacity
additions slowing down
Global demand expected to grow by 3% to 3.5 MMT in FY16
Demand in India expected to grow by 8% in FY16 (>2.0x global growth)
RIL share in domestic market increased from 44% in FY14 to 58% in
FY15
Global SBR demand-supply balance likely to improve with
marginal capacity adds – helping operating rates move up
Global SBR demand expected to grow by 3% to 5.5 MMT in FY16
Indian SBR market is estimated to grow by 8% in FY16 to 260
kTA
PBR
SBR

71www.ril.com
Polyester Chain

72www.ril.com
Business Environment: Polyester Chain
Crude oil price stability and intermediate outages infuse confidence across chain
Firm intermediate prices aid margins
PX, PTA margins highest since 3Q FY15, MEG margins highest since Oct 2011
Global textile markets remained healthy, major western consumption centers witness growth
Global PET markets remained healthy, supported by warm weather
Global cotton prices firmed during 1Q anticipating a lower acreage/harvest in 15-16 planting
season, benefiting polyester substitution
Polyester price rise slowed on account of cautious Chinese markets, stemming margin
expansion
However, integrated producers benefit from chain economics
73www.ril.com
0
5
10
15
20
25
30
35
Jan 15 Feb 15 Mar 15 Apr 15 May 15 Jun 15 Jul 15
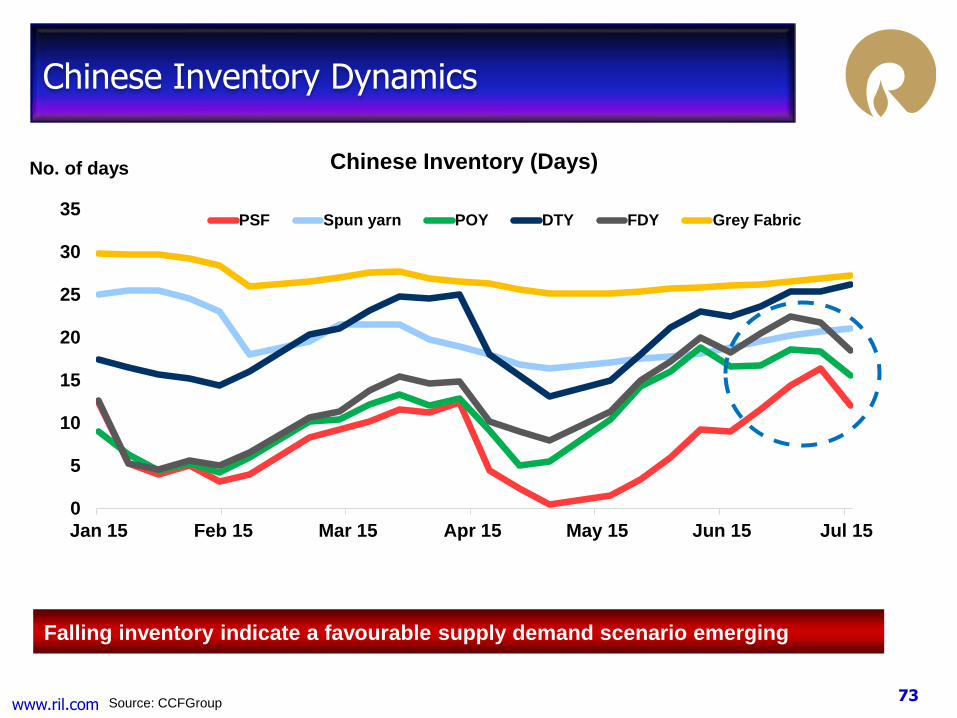
Chinese Inventory (Days)
PSF Spun yarn POY DTY FDY Grey Fabric
Chinese Inventory Dynamics
Source: CCFGroup
Falling inventory indicate a favourable supply demand scenario emerging
No. of days

74www.ril.com
Price Movement – NE Asia
Source: ICIS, PCI, Platts
Upstream shocks absorbed through the chain, integrated players benefit
$/MT1Q FY15
Avg.
4Q FY15
Avg.
1Q FY16
Avg.
% Change
Q-o-Q Y-o-Y
Crude Oil (Dubai $/bbl) 106 52 61 18% -42%
Naphtha (MOPS) 946 473 548 16% -42%
PX 1,264 800 924 15% -27%
PTA 943 628 742 18% -22%
MEG 943 783 943 20% 0%
POY 1,493 1,114 1,197 7% -20%
PSF 1,324 1,042 1,144 10% -14%
PET 1,294 956 1,074 12% -17%

75www.ril.com
Intermediates Delta Scenario
Plant outages favoured intermediates margins
QoQ PX deltas up 18% and PTA up 33%
Margins started to moderate towards end of 1Q
Lowest MEG Chinese inventory in 2.5 years and
plant outages aided margin growth (+25% QoQ)
(Source: ICIS, Platts)
Delta in USD/MT
313306
361
0
100
200
300
400
500
1Q FY 15 4Q FY 15 1Q FY 16
PX-Naphtha 5 yr Avg
109100
133
0
45
90
135
180
1Q FY 15 4Q FY 15 1Q FY 16
PTA-PX 5 yr Avg
315
457
571
0
120
240
360
480
600
1Q FY 15 4Q FY 15 1Q FY 16
MEG-Naphtha 5 yr Avg

76www.ril.com
Polyester Delta Scenario
Strong intermediates weighed down 1Q
margins, however integrated players reaped
overall chain benefits
Lower capacity growth and firm cotton prices
helped stem PSF margin drops
PET margins showing signs of bottoming out
(Source: ICIS, Platts)
Delta in USD/MT
177
226
172
0
50
100
150
200
250
1Q FY 15 4Q FY 15 1Q FY 16
PSF/PTA-MEG 5 yr Avg
166 152118
0
55
110
165
220
1Q FY 15 4Q FY 15 1Q FY 16
PET/PTA-MEG 5 yr Avg
357
305
235
0
80
160
240
320
400
1Q FY 15 4Q FY 15 1Q FY 16
POY/PTA-MEG 5 yr Avg

77www.ril.com
Capturing Value Across the Polyester Chain
$/MT
Chain margins hovering around long term average
0
200
400
600
800
1000
1200
1400
Q1 '10 Q4 '10 Q3 '11 Q2 '12 Q1 '13 Q4 '13 Q3 '14 Q2 '15
PX delta for PSF PTA delta for PSF MEG delta for PSF PSF delta Long term avg.

78www.ril.com
Domestic Polyester Demand
Polyester markets witnessed marginal demand growth
Labour shortage, liquidity crunch and raw material
volatility impacted overall textile operations
Healthy PFY demand in fine denier FDY end applications
Improved power situation in South India, and market mix
changes aided PSF
PET growth lower than expected owing to raw material
volatility and industry sentiments
Imports from China impacting markets
Jan-May volume YoY change: PSF: +124%, PFY:+27%,
PET:+68%, PTA: 25%
India removed antidumping duty on PTA imports from
China and EU; ADD on Korea, Thailand continues
(Source: Internal Estimate)
6%
-2%
9%
2%
PSF PFY PET Polyester
Demand Growth 1Q 16 Vs. 1Q15
79www.ril.com
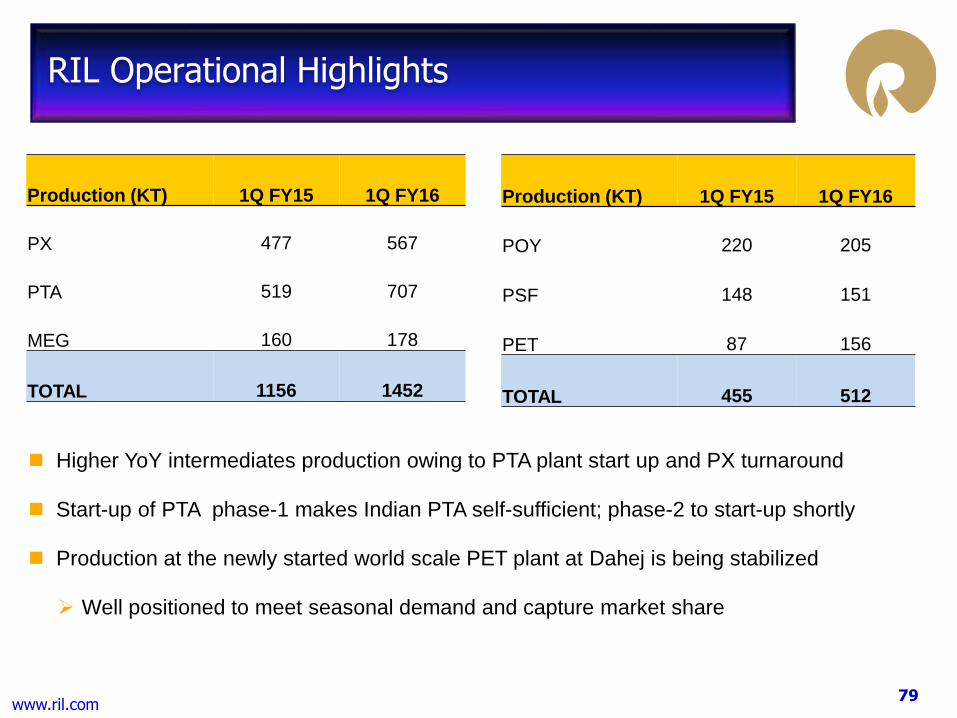
RIL Operational Highlights
Higher YoY intermediates production owing to PTA plant start up and PX turnaround
Start-up of PTA phase-1 makes Indian PTA self-sufficient; phase-2 to start-up shortly
Production at the newly started world scale PET plant at Dahej is being stabilized
Well positioned to meet seasonal demand and capture market share
Production (KT) 1Q FY15 1Q FY16
PX 477 567
PTA 519 707
MEG 160 178
TOTAL 1156 1452
Production (KT) 1Q FY15 1Q FY16
POY 220 205
PSF 148 151
PET 87 156
TOTAL 455 512

80www.ril.com
Driving Innovation, Changing Lifestyle
Apparel Fibre and Yarns
Recron® Skylark : Linen look with twinkling effect
for trousers to meet current fashion needs–
potential of 250 TPM and earning premium prices
Recron® Exclk: New application development in
jari based fabrics which can be dyed at low
temperatures –potential of 360 TPM earning
premium prices
Recron® Certified Products
Recron® Certified T Life– T cushion for complete
support to spine and lumber region
Scientifically designed antimicrobial ball fibres for
maximum support and improved hygiene
Recron® 3s
Replacing carcinogenic Asbestos
Used in wallpaper, construction (airfields, dams etc.)
High growth of 40% in last 4 years
Continued R&D to improve application areas

81www.ril.com
Green Initiatives
Products with one of the lowest
carbon footprints in the world*
Comparable product quality with
virgin fibres
Registered Green Fibre
manufacturer in India
(* for grey and ecodyed fibre)
Recycling over 2 Bn post-
consumer PET bottles p.a.
across 150 collection centres
Recycling capacity of 48KTPA
Indirect employment to over
1.25 lacs underprivileged
Recron Green Gold is made from recycling post-consumer waste PET bottles
Apparel:
Shirting, Suiting, Hosiery etc.
Home Textile:
Curtains, Bedsheets, Furnishings etc. Fashion Wear:
Scarves, Jackets etc.
Technical Textiles:
Automotive, Tarpaulins, Carpets etc.

82www.ril.com
Business Outlook – Polyester Chain
Economic growth in US and EU, and crude oil stability would drive overall textile demand
Polyester to grow at 1.6x of all other fibres during the current decade.
Make in India campaign to benefit the Indian textile industry to establish itself as a larger
player in the global arena; this will stimulate overall polyester industry growth
PX industry to witness slower capacity growth than expected aiding industry balance
PTA consolidations to continue, integrated players to enjoy scale economics
MEG markets would continue to be tight, benefiting the overall chain profitability

83www.ril.com
Oil and Gas – Exploration and Production

84www.ril.com
Domestic E&P Production Update
Note: Full Production volumes
KG-D6 production averaged at 11.4 MMSCMD of gas and 5,727 BOPD of oil/condensate
PMT production averaged at 5.8 MMSCMD of gas and 17,587 BOPD of oil
PMT: QoQ fall in production on account of planned shutdown and natural decline
Gas price at $ 5.73/MMBTU from Panna-Mukta, $ 5.57/MMBTU from Tapti
KG-D6: $ 4.67/MMBTU (GCV) for 1Q FY16
Average crude oil price realization was at $ 60/bbl during the quarter
4Q FY 15 1Q FY15 1Q FY16 % Chg. YoY
Panna-Mukta
1.6 Oil (MMBBL) 2.0 1.6 -24%
17.5 Gas (BCF) 18.2 16.7 -8%
Tapti
0.1 Oil (MMBBL) 0.1 0.0 -39%
2.8 Gas (BCF) 4.5 1.9 -58%
KG-D6
0.5 Oil (MMBBL) 0.5 0.4 -16%
36.5 Gas (BCF) 42.0 36.5 -13%
0.1 Condensate (MMBBL) 0.1 0.1 -6%

85www.ril.com
KG-D6 Block – Key Project update
D1-D3 & MA : Sustain and Augment Production
3 OT Booster Compressors successfully commissioned
o OT arrival pressure reduced to 12 bar and field stabilized
Focus on production augmentation through a) activation of ceased wells, and b) rate increase in
specific wells, subject to performance
D1-D3 Work-over campaign: Well B7 successfully put on production in July’15
o Work-over activities currently underway in well A1
Further Side Track options in MA to augment production being reviewed
D55 (MJ) Appraisal - Broadband data processing, engineering studies and analysis of well data &
integration into models underway
Integrated satellite development
In April’15 Government has announced policy on well testing
For faster development, DST in discoveries D29 & D30 being undertaken
o First step towards designing an integrated development scheme for D29 & D30 discoveries
with Satellite discoveries

86www.ril.com
Other Block Updates
Panna Mukta:
Completion of pipelines (MA-MB & MB-PPA) restored production from Mukta-A field after
nearly 2 years
4 wells worked over in FY15 got activated on completion of gas-lift riser replacement work
at PB platform
Mukta-B field development: PMT JV completed installation of facilities and drilling of 1
well out of the 6 wells planned - Production is expected from early 2Q FY16
NEC-25
JV to undertake DST in D32 discovery in the Appraisal Area during 2Q FY16
Relinquished D40 discovery
CB-10 :
8 Discoveries - expected submission of FDP to MC in 2Q FY16
Phase-II exploration - Land acquisition for exploratory well sites in progress

87www.ril.com
Coal Bed Methane (CBM) – Field Development
Phase-1 development activities nearing completion - first gas production expected by 2H FY16
Development program envisages drilling of more than 200 wells and two Gas Gathering Stations
and 8 Water Gathering Stations in Phase-1
Achieved mechanical completion of GGS-11
Drilling and completion of GGS-11 wells nearly completed; more than 50% of production holes
drilled in GGS-12
Pipeline laying work for GGS-11 is completed
68 well sites handed over to operations and are ready to flow gas
GGS-12 construction activities and Installation of equipment nearing completion
Shahdol-Phulpur Pipeline
Shahdol - Phulpur pipeline is expected to get completed by 3Q FY16
RoU for 300 km out of 302 km is handed over to pipeline construction contractors
3 out of 4 river crossings are completed
Compressor station installation and other construction work is under progress

88www.ril.com
CBM Field Development – Progress Photograph
GGS 11 GGS 12
Compressor station

89www.ril.com
Shale Gas Business

90www.ril.com
Midstream JV Monetization Completed
Successfully completed monetization of Reliance’s investments in EFS Midstream
Transaction closed on 8th July
EFS acquired by Enterprise Product Partners L.P., an industry leader in midstream
segment
Consideration: $1,073MM for Reliance’s 49.9% share of EFS, on a debt-free, cash-free basis
$ 574MM cash upfront and $ 499MM paid before July 2016
EFS played key role in ramp-up of Reliance-Pioneer Upstream JV in Eagle Ford Shale
JV transitioned from a ‘development’ mode to ‘stable operations’ mode, generating free
cash flows since 2013
EFS was at appropriate maturity phase to unlock value
Upstream JV gains significantly from the suite of long-term contracts with Enterprise affiliates

91www.ril.com
Operating Performance Highlights
Managing macro headwinds Strong operational trends
Macro headwinds impacted performance
despite strong operating trends
Stable QoQ performance - YoY trends
impacted by sharply lower realization
Low benchmark prices and high
differentials resulted in 47% lower unit
realization YoY
Unit realization improved 2% QoQ, driven
by improved WTI and oil differentials
Capex at $ 275MM in 1Q FY16 - down 15%
YoY reflecting reduced activity level, but
higher sequentially
Focus remains on growing asset values
and enhance business resilience
Activity slowdown
Disciplined investment
Efficiency gains (costs / technology)
Producing well count grew by 8% QoQ to
932 wells
Avg. Gross production at 1,211 Mcfe/day in
1Q FY16 vs. 1,228 Mcfe/day in 4QFY15
Volumes reflect reduced activity across
JVs, price driven curtailments at Carrizo
Well performance trends remain strong;
Encouraging progress on new development
initiatives
Absolute Opex lower QoQ - Unit opex lower
across all JVs despite curtailed volumes
Declining trend in D&C costs - renegotiated
service contracts, improving efficiencies
Unit drilling cost down by 13% vs. 2014
at both Pioneer & Chevron JVs
Unit completion costs down ~21% vs.
2014 levels at Pioneer & Chevron JVs

92www.ril.com
Business Performance Highlights
1Q FY16 4Q FY15 1Q FY15 % Chg. Vs. 4Q FY15 % Chg. Vs. 1QFY15
Production (Bcfe) 49.3 49.4 48.6 0% 1%
Revenues ($ MM) 141 138 270 2% -48%
EBITDA ($ MM) 86 91 201 -5% -57%
• Activity slowed down in view of challenging market conditions. Resulted in lower volume growth
• Operational trends remain strong, but short term pressure on earnings, given dismal pricing environment
• Focus remains on growing asset values through disciplined investment and realizing efficiency gains
(costs / technology)
6.7
6.2
6.0
7.0
6.6
5.7
4.6
3.4 3.5
0.0
1.0
2.0
3.0
4.0
5.0
6.0
7.0
8.0
Q1FY2014
Q2FY2014
Q3FY2014
Q4FY2014
Q1FY2015
Q2FY2015
Q3FY2015
Q4FY2015
Q1FY2016
$/Mcfe Average Realisation

93www.ril.com
Pioneer JV Progress Overview
1QFY16
Avg. Rigs operating 6
Wells Drilled 23
Wells Put on Production 33
Total Wells drilled (Inception to Date) 582
Total Wells on Line (Inception to Date) 548*
Gross JV production (Reliance Share, bcfe) 29.0
* Includes two abandoned wells.
Negotiations with services providers and new cost
reduction initiatives yielding good results on well costs..
Condensate export increasing, at 42% of condensate
sales volume for the quarter.
Production for the quarter, however, was negatively
impacted by operational issues and adverse weather.
Continued new development initiatives; such as drilling of
Upper Infill wells. Development focused on sweet spot.
Strong Operational Performance; Successful well cost reduction
Development focused on sweet spot
2015 drilling focused at CGP 71/72

94www.ril.com
1QFY16
Avg. Rigs operating 2
Wells Drilled 17
Wells Put on Production 34
Total Wells drilled (Inception to Date) 367*
Total Wells on Line (Inception to Date) 302*
Gross JV production (Reliance Share, bcfe) 14.3
*Includes 1 abandoned well and non operated wells that have
very low JV interest,
Chevron JV Progress Overview
Production growth remained strong during 1QFY16.
Producing well count up at 302; gross production grew 2%
QoQ and 26% YoY in 1QFY15
Lower Drilling & Completion costs and Lease Operating
Expenses. Procurement contracts being re-negotiated
downward. Longer lateral wells being drilled to improve
productivity. Success need to be maintained and scaled up.
Conserving capital through moderated development pace.
Only 1 rig operation planned for rest of CY15. Focus on core
areas with high prospectivity and superior economics.
Production growth maintained by shifting to prospective area.
Effective scaling up of cost initiatives key to mitigate pricing pressure

95www.ril.com
Carrizo JV Progress Overview
1QFY16
Avg. Rigs operating -
Wells Drilled -
Wells Put on Production -
Total Wells drilled (Inception to Date) 98
Total Wells on Line (Inception to Date) 82
Gross JV production (Reliance Share, bcfe) 5.9
Activity moderated to manage the weak prices and
high differentials in NEPA. Situation an outcome of
localized offtake constraints. New capacities
expected in next couple of quarters and margins
likely to improve.
Preserving value through selective production
curtailments at lower prices whilst ensuring positive
cash from operation.
Long term value upside potential from down spacing /
infill drilling in Upper Marcellus.
Positive cash from operation in 1Q FY16.
Price & production closely aligned to manage cash flows and profitability

96www.ril.com
Reliance Retail
97www.ril.com
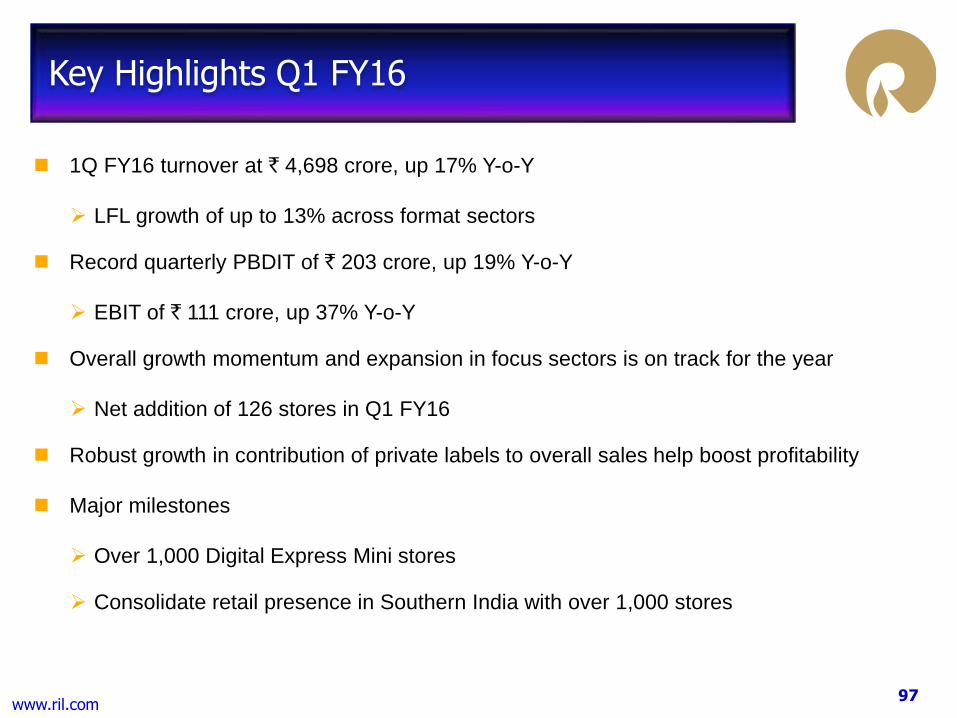
Key Highlights Q1 FY16
1Q FY16 turnover at ` 4,698 crore, up 17% Y-o-Y
LFL growth of up to 13% across format sectors
Record quarterly PBDIT of ` 203 crore, up 19% Y-o-Y
EBIT of ` 111 crore, up 37% Y-o-Y
Overall growth momentum and expansion in focus sectors is on track for the year
Net addition of 126 stores in Q1 FY16
Robust growth in contribution of private labels to overall sales help boost profitability
Major milestones
Over 1,000 Digital Express Mini stores
Consolidate retail presence in Southern India with over 1,000 stores

98www.ril.com
Performance Overview
Q1 FY16 Turnover of ` 4,698 crore, up 17%
Y-o-Y
Driven by robust growth in Digital and
Fashion & Lifestyle sectors at 37% and
30% respectively
EBITDA margin of 4.3%; trebled our EBIT %
in the last two years
3,999
4,698
1QFY15 1QFY16
Revenue (` crore)
17%
52%
25%
16%
5% 2%
Revenue Mix – 1Q FY16
VF and Others
Digital
Fashion &Lifestyle
Jewellery
Brands
57%21%
14%
6%
2%
Revenue Mix – 1Q FY15

99www.ril.com
1,006
874
315
552
Pan-India Store Network
March 31,
2015
June 30,
2015
Jewellery 53 53
Brands 107 112
Digital 1,196 1,298
Fashion & Lifestyle 649 662
Value & Others 616 622
Total 2,621 2,747
Store Count by Format Sector
Pan-India retail footprint of over 12.5 million sq. ft.

100www.ril.com
Strengthened market leadership position
- largest grocery retailer in India
Continued focus on profitable growth
despite challenging economic
environment and food safety regulatory
issues
Strong focus on Own Branded products
Own brands participation of up to 25%
in key categories
Reliance Market consolidated leadership
position in wholesale cash and carry
segment
Operating 45 stores across 35 cities
Over 1.7 million member partners
Value Formats
Own Brand Launches

101www.ril.com
Largest national chain with 1,298 stores in
over 180 cities
Accelerated expansion of “Digital Express
Mini” format with over 100 store additions
during the quarter
Strong presence in UHD TVs, Side by Side
REFs, Top load WMs and Inverter ACs
Building ResQ as a differentiated offering
Augment customer interaction points
through ResQ live chat, resQ microsite
and a resQ mobile app
Authorized to service over 50 national &
international brands, ResQ registers
robust revenue growth
Digital
102www.ril.com
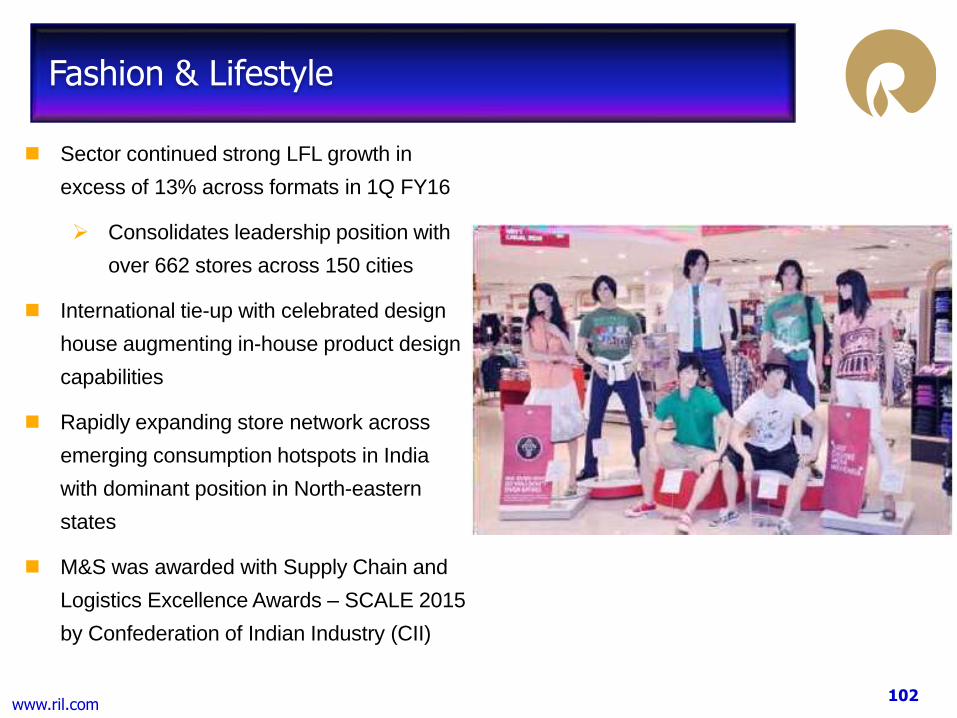
Sector continued strong LFL growth in
excess of 13% across formats in 1Q FY16
Consolidates leadership position with
over 662 stores across 150 cities
International tie-up with celebrated design
house augmenting in-house product design
capabilities
Rapidly expanding store network across
emerging consumption hotspots in India
with dominant position in North-eastern
states
M&S was awarded with Supply Chain and
Logistics Excellence Awards – SCALE 2015
by Confederation of Indian Industry (CII)
Fashion & Lifestyle

103www.ril.com
Brands
Strong revenue growth of over 28% Y-o-Y
Launched first BCBG Max Azria in India
Announced exclusive long term
partnerships with global brands:
Muji, a Japanese household, fashion &
consumer goods retailer
Hunkemöller, Europe’s No. 1 specialist
lingerie brand
Continually exploring partnership
opportunities to extend reach of brands in
the country

104www.ril.com
Embarking on Reliance Retail 2.0
Augment reach to customers through ecommerce initiatives in addition to physical
stores
Integration of advanced infrastructure built by Jio and physical retail business to create
a differentiated ecommerce model
The model would serve consumers who are digitally enabled as well as other
consumers by integrating:
o Physical and digital shopping (Fashion & Lifestyle)
o Own stores and other retailers (Market place)
o Own products and others products (Digital)
The combined physical and ecommerce business is poised for a stupendous growth
which would sustain our leadership in retail

105www.ril.com
Fashion & Lifestyle
Make fashion more trendy and accessible to Indian consumers
Fashion & Lifestyle ecommerce initiative
to be rolled out before the end of the
year
Create Omni Channel experience by
integrating physical and digital shopping
Click-n-collect; Fashion related
services
Alterations; Try-n-buy; Stylist
appointmentsProlific design developments
Faster merchandising cycles
Product innovations
QA network
Private Brands
Sourcing Network
Value Engineering
Contract Manufacturing
High Fashion Quotient
Great Value
Good Quality

106www.ril.com
Platform to enable over 150,000 small retailers and provide them with:
Enhanced supplier base and product range
Better supply chain productivity
Digital payment capability
Connectivity to customers and
Credit capability
Leverage the reach of retail in India by Integration of existing Digital and Cash & Carry
formats into Reliance Digital Marketplace platform
Market Place Platform
Building a ubiquitous model which will bring benefits to consumers in India

107www.ril.com
Reliance Digital would be a catalyst by
making available entry level to ultra
premium 4G LTE smartphones, tables and
other devices in driving the device
ecosystem in India for Jio
Rolling out ResQ as a Trusted service
brand
Authorized service provider for all
leading brands
Build Reconnect as a national brand
More than 100 different products
Digital

108www.ril.com

109www.ril.com
Digital India Opportunity Set to become second-largest digital population in the world by 2020
Among large countries, India has highest proportion of young
population
More than 90% internet users fall in the 15-44 age group
The size of Middle Class segment of population is projected
to increase from 267mn currently to 550mn by 2026
3 times increase in average household income from 2010
to 2021 – INR 300,000 to 900,000
Affordability levels are increasing with economic growth and
rising per capita income
Communication clearly identified as a necessity
47%
43%
40%
33%
32%
27%
22%
48%
49%
52%
52%
59%
60%
51%
5%
8%
8%
15%
10%
13%
27%
Age 0-24 Age 25-64 Age 65+
Source: United Nations World Population Prospects 2012 Revision
Source: India Census, Data from respective countries,
ITU, World Bank1 Madhya Pradesh grouped in 100mm group as it and
Uttar Pradesh together represent equivalent internet
users in the US.
Population of Indian states vs. top 20
countries in terms of internet population
(excluding China)
Thailand
Canada
Argentina
ItalySpain
NigeriaUnited
States of
America Brazil
Australia
Philippines
France
Japan
Turkey
Vietnam
Russia
S. Korea
Indonesia
United
Kingdom
GermanyEgypt
Indonesia
Mexico
Australia
>=100mm 50‐100mm 25‐50mm <=25mm

110www.ril.com
Source: Euromonitor
India already has the third-largest internet user base
in the world…
… with the lowest internet penetration rates (2013)
568
254213
101 99 76 68 56 55 54
Ch
ina
US
India
Japa
n
Bra
zil
Ru
ssia
Germ
any
Nig
eri
a
UK
Fra
nce
89.9 86.3 84.2 84.0 81.9
61.451.6 45.8
38.0
15.1
UK
Japa
n
US
Germ
any
Fra
nce
Ru
ssia
Bra
zil
Ch
ina
Ne
therl
an
d India
World 35.1
Digital India Opportunity Low internet penetration and poor infrastructure provide attractive opportunity
India was ranked 142nd in the State of Broadband
2014 report of the Broadband Commission (ITU
and UN)
Average downlink speed of 1.7Mbps vs global
average of 3.9Mbps as per Akamai Speed Report
2014
Ranked 118th globally on this parameter
Dichotomy between high mobile penetration and
low broadband penetration -- lack of infrastructure
Around 85mn 3G subscribers in spite of limited
3G footprint of key operators
Wireline infrastructure is underdeveloped in the
country offering a significant opportunity for FTTH
services
Rapid evolution of digital ecosystem observed
across the world – strong early trends in India
Digital commerce, payment ecosystems, media
and communication
The digital commerce market is projected to
grow from US$15bn today to over US$200bn in
the next 10 years (Source: BOFA-ML)
India requires and commercially justifies digital infrastructure in line with the
best in the world

111www.ril.com
Source: Euromonitor
Significant growth expected going forward
213
261
324
382
429
490526
564
2013 2014 2015 2016 2017 2018 2019 2020
Total internet user base in
India expected to be 2nd
largest in world after
China by 2015
Digital India Opportunity Affordability and willingness to pay have been established
Most projections estimate substantial increase in
internet user base in India
McKinsey Global Institute recently forecasted
700-900mn internet users in the next 10 years
Population of over 500mn with household
income greater than Rs 150,000 per annum
Proportion of such households increasing
rapidly
Communication as a percentage of household
spending has been constant to reducing in
recent years – unlikely trend in a high growth
economy
Hyper competitive industry, price reductions
and limited new services
There were over 235mn subscribers in 2008
with ARPU of Rs 627 (adjusted for inflation
and real increase)
There is a large and growing segment of
population in India that is willing to pay for good
connectivity and digital eco-system – demand
for both mobile and FTTH services

112www.ril.com
Global Data TrendsSignificant shift of mobile traffic from voice to data
Rapid shift from voice to data across global mobile networks
seen
Mobile data traffic in Q1-14 exceeded total mobile data
traffic in 2011
Ericsson projects a 10X increase in mobile data traffic
between 2013 and 2019
Mobile traffic generated by mobile phones has exceeded
that from mobile PCs, tablets and routers
13X growth in mobile video traffic between 2013 and 2019
As per Cisco Visual Networking Index Forecast 2015, mobile
data traffic will grow 13-fold from 2014 to 2019, CAGR of
67%, in India
Mobile data traffic will reach 1.1 Exabytes per month in
2019, up from 88 Petabytes per month in 2014
Significant capacity expansion in mobile networks required to
meet the data explosion
Trend globally has been to shift from UMTS to HSPA+ and
now towards LTE and LTE Advanced networks to meet the
data requirements
Current networks in India are not likely to be able to cater to
the rapid growth in data usage in the coming years
0
500
1000
1500
2000
2500
Q1'07
Q3'07
Q1'08
Q3'08
Q1'09
Q3'09
Q1'10
Q3'10
Q1'11
Q3'11
Q1'12
Q3'12
Q1'13
Q3'13
Q1'14
Total (UL +DL) Monthly Traffic (Petabytes / Month)
Voice Data
Source: Total Monthly Mobile Voice & Data Traffic, Ericsson
Source: Equity research reports
69% 68%
37% 36% 35% 34% 33% 32% 30% 28%
15.0%13.0%
Japa
n
Ho
ng K
on
g
Sin
gapo
re
AP
AC
Ave
rage
Taiw
an
Ch
ina
Ma
laysia
Tha
iland
Indon
esia
Kore
a
Phill
ipp
ine
s
India
Data Revenue as % of service revenue

113www.ril.com
Evolution of LTE TechnologyRapid shift to LTE to meet increased data requirement
While the first LTE networks were launched in 2010,
there has been rapid migration to LTE in the last 2 years
Fastest developing mobile system technology ever
Technology supports inter-operability across bands
as also inter-connect with other technologies
Supports LTE Broadcast through eMBMS
There are over 422 commercially operational LTE
networks in the world now across 143 countries
Over 3,250 user devices
70 mobile operators from 10 countries have launched
VoLTE
LTE technology has significant advantages over 2G/3G
networks
2.5X more spectral efficiency than 3G networks
Power requirement for radio equipment is less than
half of 2G BTS equipment
Evolution has been so fast that some operators have
already started shutting down 2G networks
Singtel, Optus, Telstra are phasing out 2G networks
GSM GPRS / EDGE UMTS HSPA+ LTE LTE - Advanced
Average User Performance
Downlink Uplink
3G2G
4G
9.6 kbps 50 kbps128 kbps
250 kbps
8 Mbps
1.5 Mbps
20 Mbps
10 Mbps
30 Mbps
75 Mbps
9.6 kbps 100 kbps
X1 X8 X20 (2014)Spectra
Efficiency
0
100
200
300
400
500
Q4'10
Q1'11
Q2'11
Q3'11
Q4'11
Q1'12
Q2'12
Q3'12
Q4'12
Q1'13
Q2'13
Q3'13
Q4'13
Q1'14
Q2'14
Q3'14
Q4'14
Subs
crip
tio
ns
(mill
ion
s)
LTE Subscriptions Growth
Q4 2014 Total LTE subs worldwide: 497 million
290 million subs added in past year
115 million subs added in Q4 2014
140% YoY growth
Source: OVUM WCIS, GSA

114www.ril.com
China Mobile launched commercial LTE operations in early
2014
Offering data and voice services
International roaming in more than 70 countries and
regions
China Mobile has seen significant adoption of 4G services
Adding 16mn subscribers monthly
Monthly traffic scale surpassed 3G/2G within the first
year
4G ARPU has been 1.7 times of blended ARPU; data
usage has been 5 times of blended data usage
Device eco-system has evolved significantly in the last 1
year
Lowest price < US$65
Over 100 new launches every month
Cost differential has been eliminated across technologies
4G has almost completely replaced 3G (96% of total
3G/4G shipment in May) and 84% of overall shipment
Evolution of LTE Technology China has seen remarkable adaption
Source: Bernstein Research, July 2015
0%
10%
20%
30%
40%
50%
60%
1 2 3 4 5 6 7 8 9 10 11 12 13 14 15 16 17 18 19 20 21 22 23 24
4G Adoption Trend
SKT KT VW China Mobile DT LG Uplus DoCoMo EE
4G S
ubs
crib
ers
as %
of
Tota
l Su
bscr
iber
s
Month Since Commercial Launch
Source: Bernstein Research, July 2015
0
50
100
150
200
250
300
China Mobile 4G Subscribers (mn)
Management Target 2014 = 50 mn
Management Target 2015 = 250 mn
283
While China has seen tremendous response to 4G services, adoption rate
is still lower than some of the other countries

115www.ril.com
Reliance JioEco-system approach to develop Digital Services
Voice(VoLTE, VoWifi)
Video MessagingHigh Speed Internet
(Mobile, FTTH)
Payments / Subscriptions / Loyalty programs / Merchant Services
Data science / Analytics / Data management / Data centers
Advertising – technology / sales
Logistics / Delivery
• Social• Sharing• Voice• Text / video / photos• Seamless device data
transfer
Communication
• News• Video on Demand• Music• News and Magazines• Own content
(Network 18)• Internet TV
Media / Entertainment
• File Storage• Picture Storage• Enterprise Cloud
Services• Digital Locker• Government
facilities
Cloud Services
• Government services• M2M• Internet of Things• Broadcast solutions• Security/ Surveillance• Gaming
Others
• Goods• Services • Local
Commerce / Payments
Network Devices Fibre Jio Centre

116www.ril.com
Jio Chat: Messaging App with voice, video calling, file sharing, location sharing features; already launched
on android and ios with over a million users
Switch and Walk: Ability to seamlessly transfer all contacts, messages, applications, files and other data
when switching device across operating systems
Jio on Demand: Ability to watch content from a huge collection of movies, TV programs, events and
proprietary content any time any place
Jio Play: Live and catch-up TV with more than 250 channels across various languages with ability to pause
and watch; also play back from last 7 days
Jio Beats: Access, including download, range of music content across languages and across genres; ready
to use playlists also available
Jio Money: Store money securely, pay at digital and physical merchant stores at the click on mobile;
connect bank accounts and credit / debit cards to wallet; loyalty programs
Supplement the merchant acquiring initiative to enable widespread adoption
Jio Drive: Ability to store upto 100GB of data per user; enterprise level data backup facilities provided;
digital locker solution to store important documents
Jio News: Provides all newspapers at the click of a button; ability to save articles and pages from the
newspaper on the go
Jio Mags: Rich library of magazines to provide an experience of reading a real magazine; integrated to
provide ability to listen to articles, and connect with links for seamless reading experience
Reliance JioRelevant and differentiated user applications…..

117www.ril.com
20 MHz contiguous
pan-India spectrum
in 2300 MHz band
1800 MHz band
spectrum across 18
of the 22 circles
800 MHz band
spectrum across
select markets
Pan-India Spectrum
.
Delhi
-/5.4/20.0
Mumbai
5.0/6.6/20.0
Legend:
Location
800 MHz (Paired) /
1800 MHz (Paired) /
2300 MHz (Unpaired)
Kolkata
-/10.0/20.0Maharashtra
-/5.0/20.0
Gujarat
-/6.0/20.0
AP
-/5.8/20.0Karnataka
-/5.0/20.0
TN
-/6.8/20.0
Kerala
-/5.0/20.0
Punjab
-/-/20.0
Haryana
5.0/4.0/20.0
UP-West
-/-/20.0
UP-East
3.75/3.0/20.0Rajasthan
-/10.0/20.0
MP
5.0/6.4/20.0
WB
-/5.6/20.0
HP
5.0/5.4/20.0
Bihar
5.0/-/20.0
Odisha
5.0/5.0/20.0
Assam
5.0/5.4/20.0
North East
5.0/6.4/20.0
J&K
5.0/-/20.0
BandTotal Spectrum
(Uplink&Downlink)
800 97.5 MHz
1800 213.6 MHz
2300 440.0 MHZ
Creating World Class InfrastructureLargest holder of liberalized spectrum
Pan India spectrum footprint
Eight circles with spectrum in all three bands
20 out of 22 circles have at least one of 800MHz
or 1800MHz spectrum alongside spectrum in
2300MHz band
Highest liberalized spectrum footprint across the
industry with 751.10MHz of spectrum
Acquired spectrum has long residual life; no
uncertainty about business for next 15 years
Total cost of spectrum at US$5.4bn
Highly efficient acquisition cost with respect to
MHz pop or revenue potential
More spectrum likely to become available in the
800MHz band; footprint can be enhanced based on
business requirement
Other options for spectrum availability also likely
to become available – sharing, trading, M&A

118www.ril.com
Creating World Class InfrastructureLargest inter-city and intra-city fiber network
Largest deployment of end-to-end all-IP network in the
world
Network of nearly 250,000 route km of fiber optics
Future proof digital backbone for a full IP network
Fiber footprint to be doubled over the next 3 years
Extensive roll out of last mile fiber planned to
addressed FTTH segment (pan-India MSO license
obtained to expedite roll out of this business)
Towers: Over 75,000 eNodeB at launch across the
country
All the towers have EB connectivity and battery
back-up
Data centers: 0.65mn sq ft of data center capacity
across three locations to be operational by launch
To be expanded to over 1.5mn sq ft in the next 3
years
Fiber Network

119www.ril.com
Creating World Class InfrastructurePan India distribution infrastructure
Jio will have direct physical presence through over
1,000 Jio Centers across the country
Decentralized and empowered decision making
Distributed one-hop structure to expedite decision
making and address local issues
On-the-ground relationship with distributors and
retailers
Focus on online channels for sales and distribution,
including customer onboarding
e-KYC framework being optimized (subject to DOT
approval)
Distribution network will include 0.5 million connectivity
outlets and 1mn additional recharge outlets at launch
Distributed customer care and support infrastructure
set-up
Jio Centers

120www.ril.com
Creating World Class InfrastructureDevice eco-system
Two pronged strategy for ensuring device
availability – open market devices and self branded
devices (Reliance Retail)
Proactively engaging smartphone brands (Indian &
Global), chipset manufacturers and OEMs directly
Catalyzing open market devices for ensuring 4G
and VoLTE as default features in all smartphones
China went from nil to 84 % smartphones being
LTE in less than 18 months
In addition to LTE smartphones, Jio also working
with OEMs for pocket router solution which can
seamlessly connect any 2G/3G smartphone to 4G
services network
Massive distribution reach of Reliance Retail’s Jio
division will be leveraged to make handsets
ubiquitously available across organized retail,
wholesale, standalone stores and online
BRANDS
CHIPSETS
121www.ril.com
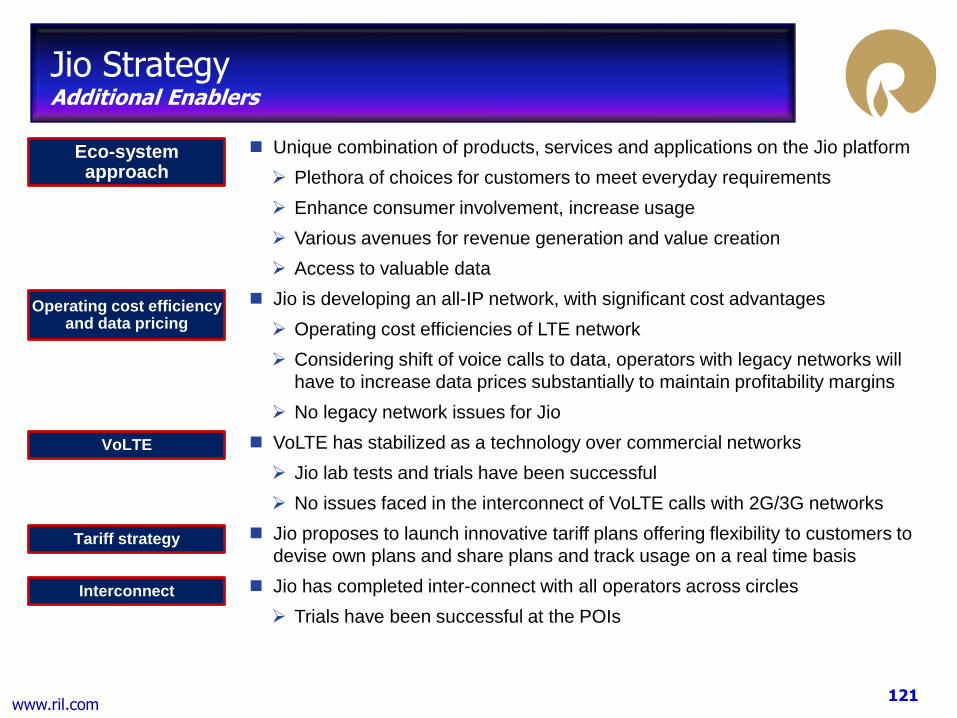
Jio StrategyAdditional Enablers
Unique combination of products, services and applications on the Jio platform
Plethora of choices for customers to meet everyday requirements
Enhance consumer involvement, increase usage
Various avenues for revenue generation and value creation
Access to valuable data
Jio is developing an all-IP network, with significant cost advantages
Operating cost efficiencies of LTE network
Considering shift of voice calls to data, operators with legacy networks will
have to increase data prices substantially to maintain profitability margins
No legacy network issues for Jio
VoLTE has stabilized as a technology over commercial networks
Jio lab tests and trials have been successful
No issues faced in the interconnect of VoLTE calls with 2G/3G networks
Jio proposes to launch innovative tariff plans offering flexibility to customers to
devise own plans and share plans and track usage on a real time basis
Jio has completed inter-connect with all operators across circles
Trials have been successful at the POIs
Interconnect
Operating cost efficiency and data pricing
VoLTE
Tariff strategy
Eco-system approach
122www.ril.com
Summary

123www.ril.com
Summary
Benign crude environment boosts integrated downstream business
Refining business delivered record EBIT on strong cracks and lower energy costs
Polymer margins at elevated levels with tight ethylene chain dynamics, polyester
intermediates margins rebound on supply disruptions and positive MEG cycle
Upstream business faces macro headwinds in challenging commodity price
environment
Successful monetization of EFS midstream unlocks part of latent value in business
Retail business at cusp of accelerated growth with differentiated e-commerce strategy
Extensive beta testing of Jio Services in coming months; on-track for launch by end of
the year
4G Eco-system benefitting from tailwinds of rapid China 4G ramp-up
Projects on track to deliver significant boost to operating EBITDA from FY17

Thank You