Embed Size (px)
Citation preview

Announced on August 5, 2021
NISSIN FOODS HOLDINGS CO., LTD.
(Stock Code: 2897)
Financial Results for FY 3/2022 1Q
Financial Results Presentation: August 6, 2021

Management Policy for FY 3/2022
1
Reboot and Make a Fresh Start
As the first year of our new management plan, we will sprint ahead in three
growth strategies, as well as organizational and human resource reforms
Domestic Existing Businesses
• Instant Noodles Business: Reform our
supply chain structure, create new
categories and channels, and transition to
a new sales approach
• Non-Instant Noodles Business: Accelerate
group synergies in both supply and
demand (mainly in the confectionery
business) to build a foundation for growth
and improved profitability
Overseas Existing Businesses
• Accelerate deeper global branding, which
has already begun to produce results.
Further solidify competitive advantage as a
growth driver
• Pursue steady progress in multi-category
and multi-area strategies to leverage
business in China and Brazil
New Businesses
• Launch businesses with a sense of
urgency to gain recognition for the wider
acceptance of complete nutritional foods
• Launch businesses across five touch
points and conduct proof-of-concept tests
during FY3/2022: (1) subscription home
delivery service (DC2: intensive program),
(2) corporate cafeterias, (3) senior, (4)
retail sales, and (5) smart cities
• Leverage the lessons of COVID-19 to transition both work styles and business structures to a new normal through the maximum use of digital
technologies
• Respond accurately to consumer behavior and awareness to turn increased demand under the COVID-19 pandemic into sustainable growth
drivers
Group Overall
* China (including H.K.) strategy and related targets, financial results forecasts are established independently by NISSIN FOODS HOLDINGS

2
Institutional accounting
basis
Management accounting
basis*1,*2
Target level
for FY 3/2022
Revenue 132.5 bil. yen +9.9% 130.4 bil. yen +17.6% Double Digit
Core Operating Profit of Existing
Businesses13.2 bil. yen (22.9%) 13.1 bil. yen + 20.5% Double Digit
Domestic Instant Noodles Business (22.4%) + 35.2% Mid single Digit
Domestic Non-Instant Noodles
Business(12.6%) + 23.8% Double Digit
Overseas Business (28.9%) (11.0%) Double Digit
FY 3/2022 1Q Results
Topics
【Institutional accounting basis】
• Revenue: Increased in both domestic and overseas businesses, even before deducting the impact of C-19
• Core Operating Profit of Existing Businesses: Decreased in almost all segments YoY due to the effect of C-19
【Management accounting basis】 Good start for Fresh Start
• Revenue: Increased in revenue in all segments except domestic others and grew by 17.6% on a consolidated basis
• Core Operating Profit of Existing Businesses: The growth rate was +20.5% on a consolidated basis YoY, well above the medium- to long-term target level.
*1 Growth rate are calculated by converting foreign currency amounts into yen at the same rate as the previous year, in order to emphasize "real fluctuation / growth on a local currency basis" excluding the effect of exchange
rate at the time of consolidation.
*2 Excluding the impact of foreign exchange rates and the impact of C-19, which had a significant impact on FY 3/2021 results (e.g., increase in demand, reduction in selling expenses, unused expenses, etc.) the actual YoY
change / growth rate.
FY 3/2022 1Q Financial Results Highlights

vs. FY 3/2020
Amount Ratio CAGR Amount Ratio
① ② ③=①-② ④=③÷② ⑤ ⑥ ⑦=①-Ex impact ⑧=②-C-19 ⑨=⑦-⑧ ⑩=⑨÷⑧
Revenue 132.5 120.6 + 11.9 + 9.9% 105.9 + 11.8% 130.4 110.9 + 19.5 + 17.6%
Core operating profitof existing businesses
13.2 17.2 (3.9) (22.9%) 8.1 + 28.2% 13.1 10.9 + 2.2 + 20.5%
Operating profit 13.2 17.5 (4.2) (24.1%) 8.6 + 23.9% 13.1 11.1 + 2.0 + 18.0%
Profit attributable to owners of
the parent7.9 12.1 (4.2) (34.7%) 5.8 + 16.7%
Core OP margin of existing
businesses10.0% 14.2% (4.2pt ) 7.6% 10.1% 9.8% + 0.2pt
OP margin 10.0% 14.5% (4.5pt ) 8.1% 10.1% 10.0% + 0.0pt
Profit attributable to owners of
the parent margin6.0% 10.0% (4.1pt ) 5.5%
bil. Yen FY 3/2022
1Q
FY 3/2022
1Q
FY 3/2021
1Q
FY 3/2020
1Q
Institutional accounting basis
YoY Change
Management accounting basis(Constant currency basis, Less C-19)
FY 3/2021
1Q
YoY Change
3
Consolidated Financial Summary
• Institutional accounting basis: Increase in revenue and decrease in profits, but maintain high
growth compared to the FY 3/2020
• Management accounting basis: Significantly higher than in all amounts
vs. FY 3/2020
Amount Ratio CAGR Amount Ratio
① ② ③=①-② ④=③÷② ⑤ ⑥ ⑦=①-Ex impact ⑧=②-C-19 ⑨=⑦-⑧ ⑩=⑨÷⑧
NISSIN FOOD PRODUCTS 46.6 48.1 (1.5) (3.1%) 43.4 + 3.6% 46.6 45.7 + 0.9 + 2.0%
MYOJO FOODS 9.4 9.7 (0.2) (2.6%) 8.4 + 5.9% 9.4 8.6 + 0.8 + 9.4%
Domestic Instant Noodles Business 56.0 57.7 (1.7) (3.0%) 51.8 + 4.0% 56.0 54.3 + 1.7 + 3.2%
Chilled / frozen foods and beverages 20.2 20.1 + 0.2 + 0.8% 17.5 + 7.5% 20.2 18.8 + 1.4 + 7.6%
Confectionery 17.1 7.6 + 9.4 + 123.3% 6.6 + 60.8% 17.1 7.1 + 10.0 + 141.2%
Domestic Non-Instant Noodles Business 37.3 27.7 + 9.6 + 34.6% 24.1 + 24.4% 37.3 25.9 + 11.4 + 44.1%
Domestic others 0.5 0.8 (0.3) (37.2%) 1.0 (28.6%) 0.5 1.2 (0.7) (59.1%)
Domestic total 93.8 86.2 + 7.6 + 8.8% 76.9 + 10.4% 93.8 81.3 + 12.4 + 15.3%
The Americas 20.2 17.7 + 2.5 + 14.0% 15.1 + 15.6% 19.5 13.8 + 5.7 + 41.4%
China (incl. H.K.) 12.2 11.5 + 0.7 + 6.4% 9.6 + 12.7% 11.4 11.2 + 0.2 + 1.6%
Asia 3.4 3.0 + 0.4 + 14.8% 2.7 + 11.3% 3.2 2.8 + 0.4 + 15.5%
EMEA 2.8 2.1 + 0.7 + 32.4% 1.5 + 36.4% 2.5 1.8 + 0.8 + 42.8%
Overseas total 38.7 34.3 + 4.3 + 12.6% 29.0 + 15.5% 36.6 29.6 + 7.1 + 24.0%
Consolidated 132.5 120.6 + 11.9 + 9.9% 105.9 + 11.8% 130.4 110.9 + 19.5 + 17.6%
YoY Changebil. Yen
Institutional accounting basisManagement accounting basis(Constant currency basis, Less C-19)
FY 3/2022
1Q
FY 3/2021
1Q
YoY Change FY 3/2020
1Q
FY 3/2022
1Q
FY 3/2021
1Q
4
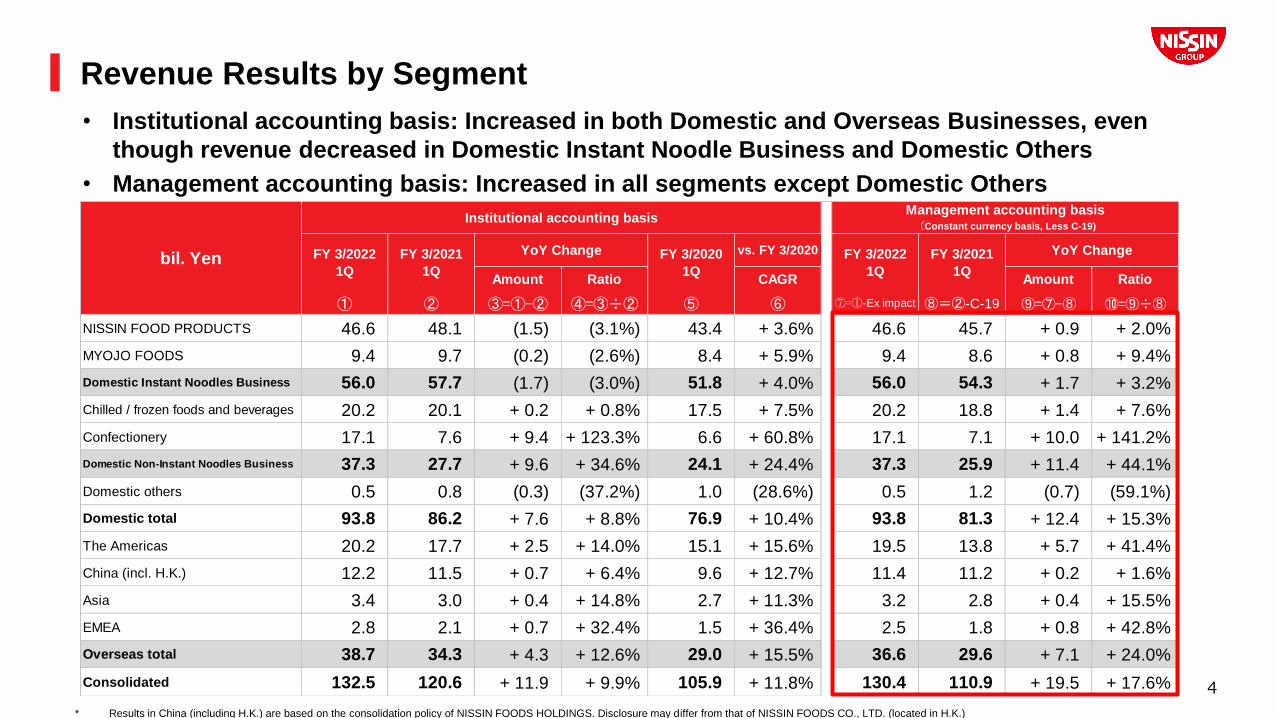
Revenue Results by Segment
* Results in China (including H.K.) are based on the consolidation policy of NISSIN FOODS HOLDINGS. Disclosure may differ from that of NISSIN FOODS CO., LTD. (located in H.K.)
• Institutional accounting basis: Increased in both Domestic and Overseas Businesses, even
though revenue decreased in Domestic Instant Noodle Business and Domestic Others
• Management accounting basis: Increased in all segments except Domestic Others

110.9
130.4
132.5
+ 0.9
+ 0.8
+ 1.4
+ 10.0
+ 5.7
+ 0.2
+ 0.4
+ 0.8
+ 2.1
(0.7)
FY 3/2021 1Q Revenue:Less C-19
NISSIN FOOD PRODUCTS
MYOJO FOODS
Chilled / frozen foodsand beverages
Confectionery
Domestic others
The Americas
China (incl. H.K.)
Asia
EMEA
FY 3/2022 1Q Revenue:Constant currency basis
Ex impact
FY 3/2022 1Q Revenue:Institutional accounting basis
Revenue Contribution by Segment (YoY, Constant currency basis)
5
Domestic
Instant Noodles
Business
Domestic
Non-Instant
Noodles Business
Overseas
Business
Major Factors*
* Please refer to the Financial Supplemental Data for the year-on-year change based on shipment value by manufacturer including the impact of COVID-19 of NISSIN FOOD PRODUCTS and MYOJO FOODS.
bil. yen
(+2%, Before deducting C-19:-3%) Cup type: CUP NOODLE PRO and U.F.O. performed well. Bag type: BAKURETSU
KARAMEN and other Prime bag-type instant noodle category products performed steadily. Others: CURRY MESHI and other rice
category products performed well.
(+9%, Before deducting C-19:-3%) Cup type: New brand MYOJO MEGAMI contributed. Revenue of MYOJO CHUKA ZANMAI
increased due to strong sales of SU RA TAN MEN, also MYOJO IPPEICHAN YOMISE NO YAKISOBA performed steadily. Bag
type: MYOJO CHARUMERA led the revenue growth due to strong sales of MIYAZAKI KARAMEN. Also new brand MYOJO
MEGAMI contributed.Chilled foods (+10%, Before deducting C-19:+4%): Revenue increased due to steady performance of mainstay brands such as
GYORETSU NO DEKIRU MISE NO RAMEN Frozen foods (+11%, Before deducting C-19:+3%): Consumer-use products
continue to perform well YORK (-4%, Before deducting C-19:-7%): PILKUL 400 was launched, and sales were strong, especially
for the 65ml size, but the struggles of drink yogurt resulted in decreased revenue
CISCO (+10%, Before deducting C-19:-0%): Cereals, mainly granolas, performed well BonChi (-3%, Before deducting C-19:
-6%): Revenue of SAGAEYA were strong, but revenue of BonChi products declined due to a backlash from last year
KOIKE-YA: As COVID-19-related demand has become the new normal, existing products performed strong (newly consolidated
from December)
Revenue decreased, mainly at NISSIN FOODS HOLDINGS
U.S. (+41%, Before deducting C-19:-2%): Premium products performed well
Mexico (+14%, Before deducting C-19:+7%): Sales were strong, especially for the mainstay product CUP NOODLES
Brazil (+49%, Before deducting C-19:+32%): Increase in demand for at-home consumption and continuation of benefit payments,
effect of last year’s price increase
Hong Kong (-2%, Before deducting C-19:-4%): Sales of both domestic instant noodles and exports were sluggish. MCMS, a
wholesaler, turned upward due to a recovery in commercial-use routes Mainland China (+4%, Before deducting C-19:+0%):
Increased sales volume of CUP NOODLES. Bag type DEMAE ICCHO made in H.K. and EASTPEAK TRADING decreased YoY
By descending order of revenue:
Thailand: Increased (Before deducting C-19: Increased) India: Decreased (Before deducting C-19: Increased)
Singapore: Increased (Before deducting C-19: Decreased) Indonesia: Increased (Before deducting C-19: Increased)
Vietnam: Increased (Before deducting C-19: Increased)
Europe: CUP NOODLES and Demae Ramen brands performed well
The Americas: +0.7 bil. yen China (incl.H.K.): +0.9 bil. yen Asia: +0.2 bil. yen Europe: +0.3 bil. yen

FY 3/2022 1Q FY 3/2021 1Q FY 3/2020 1Q vs. FY 3/2020 FY 3/2022 1Q FY 3/2021 1Q
Core OP Core OP Amount Ratio Core OP CAGR Core OP Core OP Amount Ratio
① ② ③=①-② ④ ⑤=③-④ ⑥=⑤÷④ ⑦ ⑧ ⑨=③-Ex impact ⑩=④-C-19 ⑪=⑨-⑩ ⑫=⑪÷⑩
NISSIN FOOD PRODUCTS 7.0 0.0 7.0 8.7 (1.7) (19.7%) 4.6 + 22.9% 7.0 5.0 + 2.0 + 39.5%
MYOJO FOODS 1.0 0.0 1.0 1.6 (0.6) (37.1%) 0.6 + 29.1% 1.0 0.9 + 0.1 + 10.8%
Domestic Instant Noodles Business 8.0 0.0 8.0 10.3 (2.3) (22.4%) 5.2 + 23.6% 8.0 5.9 + 2.1 + 35.2%
Chilled / frozen foods and beverages 1.3 0.1 1.2 1.6 (0.4) (23.1%) 0.4 + 72.6% 1.2 1.0 + 0.2 + 20.1%
Confectionery 1.1 0.1 1.0 1.0 + 0.0 + 4.7% 0.4 + 52.9% 1.0 0.8 + 0.2 + 28.5%
Domestic Non-Instant Noodles Business 2.4 0.1 2.2 2.6 (0.3) (12.6%) 0.8 + 62.8% 2.2 1.8 + 0.4 + 23.8%
Domestic others 0.6 0.0 0.5 0.2 + 0.4 + 210.3% 0.2 + 80.7% 0.5 0.3 + 0.3 + 115.5%
Domestic total 11.0 0.2 10.8 13.0 (2.3) (17.3%) 6.2 + 31.4% 10.8 8.0 + 2.8 + 35.1%
The Americas 1.2 0.0 1.2 1.9 (0.7) (38.4%) 1.4 (7.3%) 1.1 1.0 + 0.1 + 9.4%
China (incl. H.K.) 1.1 (0.0) 1.1 1.5 (0.4) (27.9%) 0.8 + 16.6% 1.0 1.4 (0.4) (26.7%)
Asia 1.0 0.0 1.0 1.2 (0.2) (17.4%) 0.8 + 10.0% 1.0 1.1 (0.2) (13.5%)
EMEA 0.5 (0.0) 0.6 0.7 (0.2) (25.3%) 0.2 + 83.7% 0.6 0.6 (0.0) (4.8%)
Overseas total 3.8 (0.0) 3.8 5.4 (1.6) (28.9%) 3.2 + 10.0% 3.7 4.2 (0.5) (11.0%)
Domestic and Overseas Total 14.8 0.2 14.6 18.4 (3.8) (20.7%) 9.4 + 24.6% 14.5 12.1 + 2.3 + 19.3%
Other reconciliations (0.0) (0.0) (0.0) (0.0) + 0.0 - (0.1) - (0.0) (0.0) + 0.0 -
Group expenses (1.3) - (1.3) (1.2) (0.1) - (1.3) - (1.3) (1.2) (0.1) -
Existing Businesses 13.4 0.2 13.2 17.2 (3.9) (22.9%) 8.1 + 28.2% 13.1 10.9 + 2.2 + 20.5%
New Businesses (0.2) 0.1 (0.3) (0.1) (0.2) - (0.0) - (0.3) (0.1) (0.2) -
Consolidated 13.2 0.3 13.0 17.1 (4.1) (23.9%) 8.0 + 27.1% 12.8 10.8 + 2.1 + 19.3%
YoY Changebil. Yen OPOther Income
and Expense
YoY Change
Management accounting basis(Constant currency basis, Less C-19)
Institutional accounting basis
6
Core OP Results by Segment
* Results in China (including H.K.) are based on the consolidation policy of NISSIN FOODS HOLDINGS. Disclosure may differ from that of NISSIN FOODS CO., LTD. (located in H.K.)
• Institutional accounting basis: Decreased in almost all segments, but maintained steady growth compared to FY 3/2020
• Management accounting basis: Domestic segments were strong, and the Americas exceeded mid-single digit in overseas businesses.

10.9
13.1
13.2
+2.0
+0.1
+0.2
+0.2
(0.4)
(0.2)
(0.0)
+0.0
+0.1
+0.3
+0.1
(0.1)
FY 3/2021 1Q Core OP:Less C-19
NISSIN FOOD PRODUCTS
MYOJO FOODS
Chilled / frozen foodsand beverages
Confectionery
Domestic others
The Americas
China (incl. H.K.)
Asia
EMEA
Other reconciliations
Group expenses
FY 3/2022 1Q Core OP:Constant currency basis
Ex impact
FY3/022 1Q Core OP:Institutional accounting basis
7
Domestic
Instant Noodles
Business
Domestic
Non-Instant
Noodles Business
Overseas
Business
bil. yen
Contribution of Core OP of Existing Businesses by Segment (YoY, Constant currency basis)
Major Factors
+) Increased operating profit due to increased sales, decreased selling expenses and general expenses
- ) Increase in depreciation (equipment renewal), raw material costs, distribution costs, etc.
Chilled foods: Increased Frozen foods: Increased YORK: Decreased due to advertising expenses, etc.
CISCO: Increased BonChi: Decreased KOIKE-YA: Increased due to newly consolidated
U.S.: Decreased Mexico: Increased Brazil: Increased
Hong Kong: Decreased Mainland China: Decreased
By descending order of profit (excluding companies accounted for using the equity method)
Thailand: Remains at the same level Singapore: Decreased Indonesia: Increased
Vietnam: In red India: in red
Gain (loss) on investments accounted for using the equity method: Thai President Foods 0.6 bil. yen (YoY: -0.1 bil. yen, -16%) NISSIN-UNIVERSAL ROBINA 0.2 bil. yen (YoY: +0.0 bil. yen, +6%)
Europe: Increased
Gain (loss) on investments accounted for using the equity method: Mareven Food Holdings 0.3 bil. yen (YoY: -0.2 bil. yen, -37%)
The Americas: +0.1 bil. yen China (incl.H.K.): +0.1 bil. yen Asia: +0.0 bil. yen Europe: -0.0 bil. yen

EARTH FOOD CHALLENGE 2030Proactively addressed sustainability issues and selected for inclusion in many ESG indices.
8
Status of inclusion in ESG indices ( as of August 2021)
• “DJSI” is a global ESG investment index
• Evaluate companies that have excellent
sustainability through research and analysis from
both financial and ESG perspectives
• “DJSI World” covers about 2,500 major
companies in both developed and emerging
countries
• “The DJSI Asia Pacific Index” consists of major
companies in the Asia Pacific region
• “MSCI World ESG Leaders Index” is one of the
world's leading ESG indices
• “MSCI Japan ESG Select Leaders Index” is
comprised of Japanese companies with
outstanding ESG performance*
• FTSE4Good Index Series is an investment index
selected by the London Stock Exchange Group
• Companies with excellent ESG performance are
selected as constituent stocks
• “FTSE Blossom Japan Index” selects Japanese
companies
• An index developed by Sompo Asset
Management Co., Ltd. that consists of
approximately 300 stocks with superior ESG
performance
Dow Jones Sustainability World Index (DJSI World)
Dow Jones Sustainability Asia Pacific Index (DJSI Asia Pacific)
FTSE4Good Index SeriesFTSE Blossom Japan Index
MSCI World ESG Leaders Index
MSCI Japan ESG Select Leaders Index
SOMPO Sustainability Index
* THE INCLUSION OF NISSIN FOODS HOLDINGS IN ANY MSCI INDEX, AND THE USE OF MSCI LOGOS, TRADEMARKS, SERVICE MARKS OR INDEX NAMES HEREIN, DO NOT CONSTITUTE A SPONSORSHIP, ENDORSEMENT OR PROMOTION OF NISSIN FOODS
HOLDINGS BY MSCI OR ANY OF ITS AFFILIATES. THE MSCI INDEXES ARE THE EXCLUSIVE PROPERTY OF MSCI. MSCI AND THE MSCI INDEX NAMES AND LOGOS ARE TRADEMARKS OR SERVICE MARKS OF MSCI OR ITS AFFILIATES.
Included from June 2021 Included from June 2021

Appendix
I. FY 3/2022 1Q:Analysis of Core OP of Existing Businesses
II. FY3/2022: Analysis of Core OP Forecast of Existing Businesses
III. FY 3/2022 Policies and Activities in Each Existing Business Segment
IV. Assumptions for performance explanation
and definition of Non-GAAP indicators
………..……….. P10
….…… P12~13
…... P15~21
…………………………………..… P23~25

(1.6)
+0.1
(1.7)
(0.3)
(0.2)
(0.0)
(0.1)
(0.4)
(1.5)
+0.8
(2.3)
(2.3)
+0.2
(0.0)
+0.3
(1.2)
(0.3)
(0.0)
+0.2
(1.5)
(3.0) (2.0) (1.0) +0.0 +1.0
1010
Increase
Ex impact
(Domestic)
(Overseas)
A: Revenue(including the impact of change
in selling expense ratio)
(Domestic)
(Overseas)B: CoGS ratio
(Domestic)
(Overseas)C: Distribution cost ratio
(Domestic)
(Overseas)
D: Depr. & amort.
(Domestic)
(Overseas)
E: Adv. expenses
(Domestic)
(Overseas)
F: G&A expenses
G: Gain (loss) on investment
accounted for using the
equity method
(Domestic)
(Overseas)
Increase/decreasein core OP of existing businesses
(Constant currency basis)
Increase/decrease of
marginal profit
Increase/decrease of
fixed expenses
Others
Increase/decreasein core OP of existing business(Institutional accounting Basis)
Major Factors : Domestic Major Factors : Overseasbil. yen
Decrease
(Domestic)
(Overseas)
(Domestic)
(Overseas)
【Method of calculating increase/decrease factors】 ① Marginal Profit(A,B,C) = (Revenue in the current fiscal year x Ratio of revenue in the previous fiscal year)
– Expenses in the current fiscal year.
* The analysis of marginal profit is based on the amount obtained by adding selling expenses to revenue.
② Fixed Costs (D,E,F) = Expenses in the previous fiscal year – Expenses in the current fiscal year.
③ Others (G) = Results in the previous fiscal year – Results in the current fiscal year.
(H) = Results of core operating profit of newly consolidated company for the current fiscal year.
1Q: Analysis of Core OP of Existing Businesses (YoY, Constant currency basis, Including C-19 impact)
- Decrease due to C-19 backlash, etc.
+ Impact of brand mix, etc.
- Equipment renewal, etc.
- Period shift due to C-19 in the previous
fiscal year, etc.
+ Impact of C-19, etc.
+ Increase in sales across all regions, etc.
- Increase in raw materials costs, mainly in
the Americas and China (incl. H.K.), etc.
- Increase in distribution costs, mainly in the
Americas, etc.
- Increase due to C-19 backlash in China
(incl. H.K.), etc.
- Decrease due to C-19 backlash, etc.
* In addition to the above, there is a year-on-year
difference in "Reconciliations" of (0.1) bil. yen.
H: Impact relating to
business combination
(Domestic)
(Overseas)

Appendix
I. FY 3/2022 1Q:Analysis of Core OP of Existing Businesses
II. FY3/2022: Analysis of Core OP Forecast of Existing Businesses
III. FY 3/2022 Policies and Activities in Each Existing Business Segment
IV. Assumptions for performance explanation
and definition of Non-GAAP indicators
…………….……….. P10
….… P12~13
…… P15~21
…………………………………..… P23~25

+0.0
+0.1
(1.3)
(1.0)
+0.2
(0.1)
(0.1)
+2.3
(4.4)
+0.9
(0.4)
(3.7)
+0.4
+0.2
(0.5)
+0.1
(1.5)
(6.0) (4.0) (2.0) +0.0 +2.0 +4.0
Analysis of Core OP Forecast of Existing Businesses (vs FY 3/2021, Planned constant currency basis, Including C-19 impact)
1212
Increase
(Domestic)
(Overseas)
A: Revenue(including the impact of change
in selling expense ratio)
(Domestic)
(Overseas)B: CoGS ratio
(Domestic)
(Overseas)C: Distribution cost ratio
(Domestic)
(Overseas)
D: Depr. & amort.
(Domestic)
(Overseas)
E: Adv. expenses
(Domestic)
(Overseas)
F: G&A expenses
G: Gain (loss) on investment
accounted for using the
equity method
Increase/decrease of
marginal profit
Increase/decrease of
fixed expenses
Others
Increase/decreasein core OP of existing businesses
(Planned constant currency basis*)
bil. yen
Decrease
(Domestic)
(Overseas)
(Domestic)
(Overseas)
【Method of calculating increase/decrease factors】 ① Marginal Profit(A,B,C) = (Revenue in the current fiscal year x Ratio of revenue in the previous fiscal year)
– Expenses in the current fiscal year.
* The analysis of marginal profit is based on the amount obtained by adding selling expenses to revenue.
② Fixed Costs (D,E,F) = Expenses in the previous fiscal year – Expenses in the current fiscal year.
③ Others (G) = Results in the previous fiscal year – Forecasts in the current fiscal year.
(H) = Forecast of core operating profit of newly consolidated company for the current fiscal year-Results of core operating profit of newly consolidated company for the
previous fiscal year from the time of business combination.
+ Increase in sales, mainly in China (incl.
H.K.), the Americas and Asia, etc.
Major Factors : Domestic Major Factors : Overseas
- Higher distribution costs, etc.
- Increase in advertising expenses in
Americas and China (incl. H.K.), etc.
* The actual average exchange rates for the April-March period of FY 3/2021 are applied under planned constant currency basis.
* In addition to the above, there is a year-on-year
difference in "Reconciliations" of (1.0) bil. yen.
H: Impact relating to
business combination
- Decrease due to C-19 backlash, etc.
- Increase due to C-19 backlash, etc. - Increase due to C-19 backlash mainly in
China (incl. H.K.), etc.
Revenue (IFRS) Core Operating Profit (Non-GAAP)
PY (FY 3/2021 Results) PY (FY 3/2021 Results)
RevenueC-19
Impact
Less
C-19YoY change OP
Other
Income
and
Expense
Core
OP
C-19
Impact
Less
C-19YoY Change
NISSIN FOOD PRODUCTS 207.0 205.6 2.8 202.8 + 4.2 + 2.1% 28.0 32.2 0.2 32.0 5.3 26.6 + 1.4 + 5.1%
MYOJO FOODS 37.5 37.6 1.4 36.2 + 1.3 + 3.6% 2.4 3.2 0.1 3.1 1.0 2.1 + 0.3 + 13.5%
Instant noodles 244.5 243.2 4.2 239.0 + 5.5 + 2.3% 30.4 35.4 0.3 35.1 6.3 28.8 + 1.6 + 5.7%
Chilled / frozen foods and beverages 77.0 77.7 1.8 75.9 + 1.1 + 1.5% 3.0 3.6 0.2 3.4 0.9 2.5 + 0.5 + 19.7%
Confectionery 65.0 41.1 0.6 40.5 + 24.5 + 60.4% 3.1 2.6 0.0 2.6 0.2 2.3 + 0.8 + 34.0%
Domestic others 2.5 3.3 (1.4) 4.7 (2.2) (46.8%) 1.0 0.8 0.0 0.8 0.2 0.6 + 0.4 + 60.2%
Domestic total 389.0 365.3 5.2 360.1 + 28.9 + 8.0% 37.5 42.5 0.5 41.9 7.7 34.2 + 3.3 + 9.6%
The Americas 74.0 70.9 9.6 61.3 + 12.7 + 20.8% 3.9 4.0 0.0 4.0 1.8 2.2 + 1.7 + 75.3%
China (incl. H.K.) 55.0 48.2 0.5 47.6 + 7.4 + 15.5% 5.5 5.8 0.2 5.5 0.5 5.0 + 0.5 + 9.9%
Asia 13.5 12.7 0.1 12.5 + 1.0 + 7.9% 4.6 4.1 0.1 4.0 0.1 4.0 + 0.6 + 16.0%
EMEA 8.5 9.1 1.0 8.1 + 0.4 + 4.6% 1.5 1.9 0.0 1.8 0.4 1.5 + 0.0 + 2.1%
Overseas total 151.0 140.8 11.3 129.5 + 21.5 + 16.6% 15.5 15.7 0.3 15.5 2.8 12.7 + 2.8 + 22.4%
Domestic and Overseas Total 540.0 506.1 16.5 489.6 + 50.4 + 10.3% 53.0 58.2 0.8 57.4 10.5 46.9 + 6.1 + 13.1%
Other reconciliations 4.0 4.1 (0.1) 0.0 (0.1)
Group expenses (4.9) 0.0 (4.9) 0.0 (4.9)
Existing Businesses 540.0 506.1 16.5 489.6 + 50.4 + 10.3% 47.0 57.3 4.9 52.4 10.5 41.9 + 5.1 + 12.2%
(2.5) (0.7) -
~ (4.5) ~ (2.7) -
44.5 + 4.4 + 11.0%
~ 42.5 ~ + 2.4 ~ + 6.0% 55.5 4.9 50.6 10.5 40.1
(1.8) 0.0 (1.8)
Consolidated 540.0 506.1 16.5 489.6 + 50.4 + 10.3%
New Businesses (1.8) 0.0
-
bil. Yen FY3/2022Forecast
FY3/2022Forecast
(6.0) (1.0)
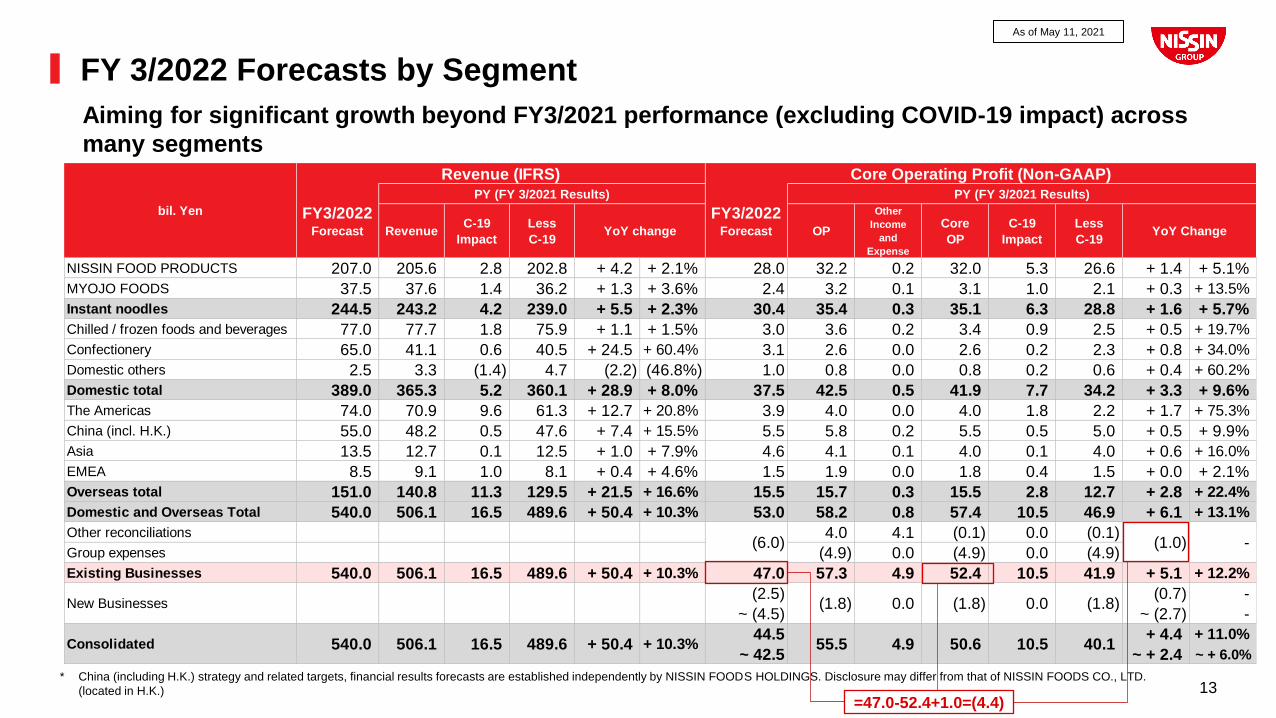
FY 3/2022 Forecasts by Segment
Aiming for significant growth beyond FY3/2021 performance (excluding COVID-19 impact) across
many segments
13* China (including H.K.) strategy and related targets, financial results forecasts are established independently by NISSIN FOODS HOLDINGS. Disclosure may differ from that of NISSIN FOODS CO., LTD.
(located in H.K.)=47.0-52.4+1.0=(4.4)
As of May 11, 2021
Appendix
I. FY 3/2022 1Q:Analysis of Core OP of Existing Businesses
II. FY3/2022: Analysis of Core OP Forecast of Existing Businesses
III. FY 3/2022 Policies and Activities in Each Existing Business Segment
IV. Assumptions for performance explanation
and definition of Non-GAAP indicators
…………….……….. P10
……..… P12~13
... P15~21
…………………………………..… P23~25

FY 3/2022 Domestic Instant Noodles Business Policy and Activities by Segment (1)
Generate profit by solidifying core brands and create food cultures by
pursuing new value
◼ Use targeted marketing aimed at three strategic target groups: youth, women and seniors
• Develop new categories (Prime bag-type instant noodle products, rice, etc.)
◼ Campaigns for mainstay brands that will be celebrating anniversaries (CUP NOODLE, DONBEI, U.F.O.)
• 50th anniversary of CUP NOODLE, 45th anniversary of DONBEI Aim for historic sales records
◼ Focus on selling products for price-conscious consumers
◼ Topical communication for young people, tailored to the digital native generation
◼ Generate new sales by strengthening sales of non-noodle products, e.g., rice products and TRIPLE BARRIER
Strengthen brands that will be
celebrating anniversaries
Strategic products to suit
price-conscious consumers
Products pursuing
new value
NISSIN FOOD
PRODUCTS
15
As of May 11, 2021
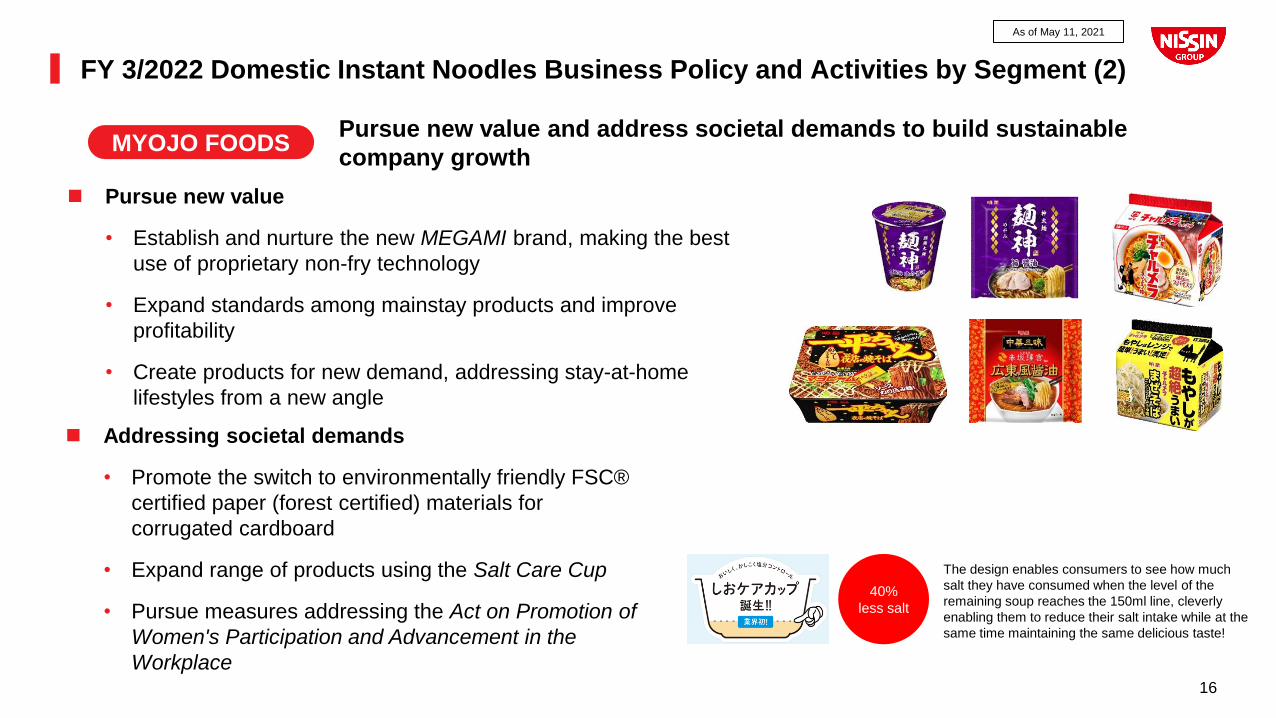
FY 3/2022 Domestic Instant Noodles Business Policy and Activities by Segment (2)
◼ Pursue new value
• Establish and nurture the new MEGAMI brand, making the best
use of proprietary non-fry technology
• Expand standards among mainstay products and improve
profitability
• Create products for new demand, addressing stay-at-home
lifestyles from a new angle
The design enables consumers to see how much
salt they have consumed when the level of the
remaining soup reaches the 150ml line, cleverly
enabling them to reduce their salt intake while at the
same time maintaining the same delicious taste!
40%
less salt
MYOJO FOODSPursue new value and address societal demands to build sustainable
company growth
◼ Addressing societal demands
• Promote the switch to environmentally friendly FSC®
certified paper (forest certified) materials for
corrugated cardboard
• Expand range of products using the Salt Care Cup
• Pursue measures addressing the Act on Promotion of
Women's Participation and Advancement in the
Workplace16
As of May 11, 2021
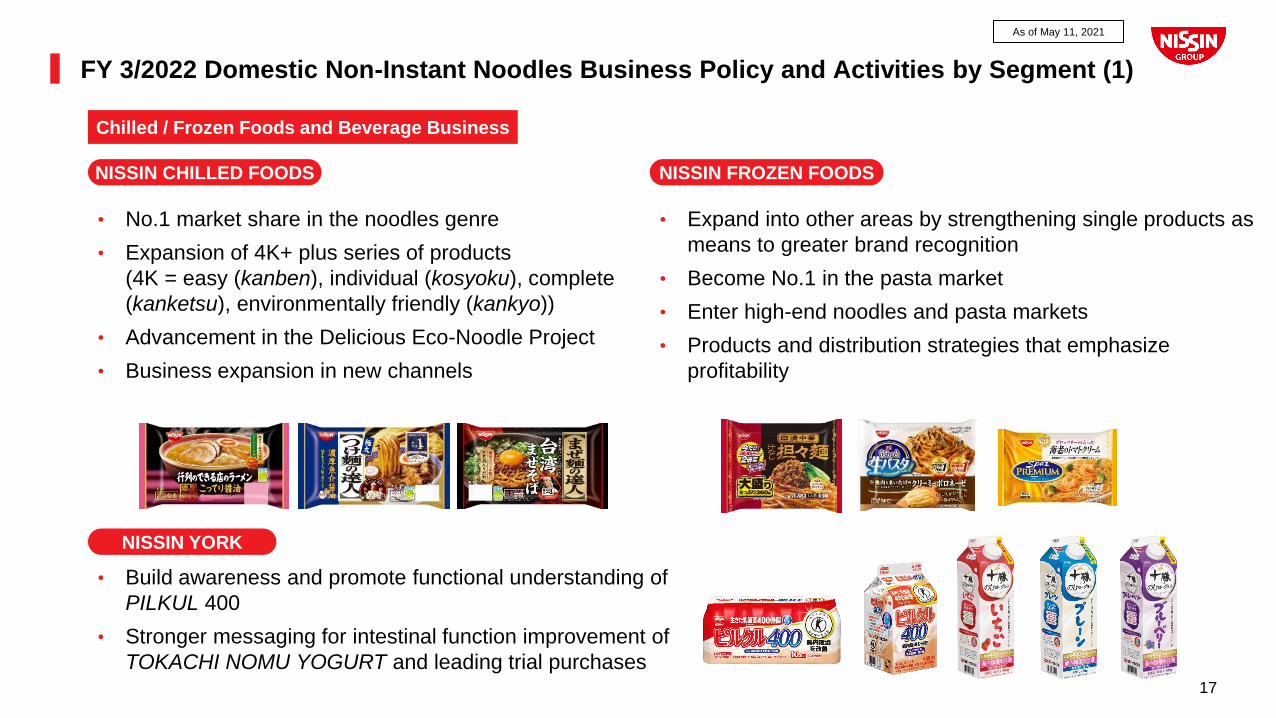
FY 3/2022 Domestic Non-Instant Noodles Business Policy and Activities by Segment (1)
Chilled / Frozen Foods and Beverage Business
NISSIN CHILLED FOODS NISSIN FROZEN FOODS
• No.1 market share in the noodles genre
• Expansion of 4K+ plus series of products
(4K = easy (kanben), individual (kosyoku), complete
(kanketsu), environmentally friendly (kankyo))
• Advancement in the Delicious Eco-Noodle Project
• Business expansion in new channels
• Expand into other areas by strengthening single products as
means to greater brand recognition
• Become No.1 in the pasta market
• Enter high-end noodles and pasta markets
• Products and distribution strategies that emphasize
profitability
NISSIN YORK
• Build awareness and promote functional understanding of
PILKUL 400
• Stronger messaging for intestinal function improvement of
TOKACHI NOMU YOGURT and leading trial purchases17
As of May 11, 2021
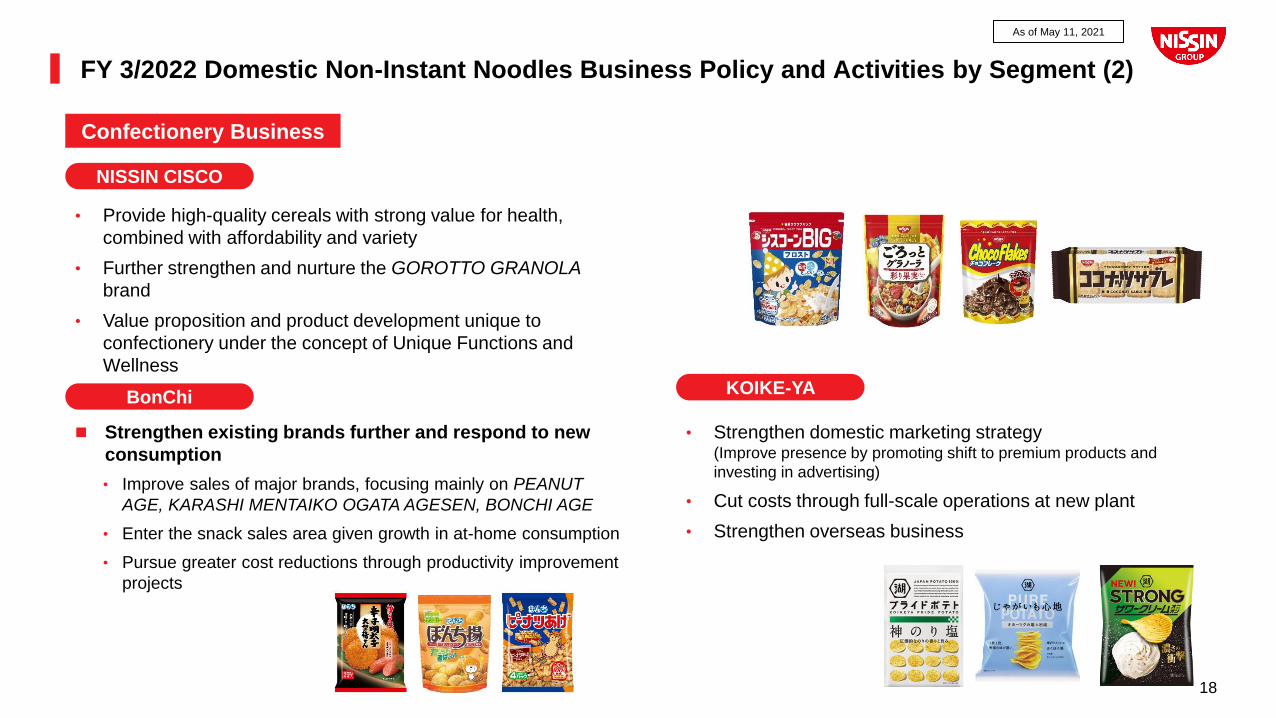
FY 3/2022 Domestic Non-Instant Noodles Business Policy and Activities by Segment (2)
Confectionery Business
BonChiKOIKE-YA
• Strengthen domestic marketing strategy(Improve presence by promoting shift to premium products and
investing in advertising)
• Cut costs through full-scale operations at new plant
• Strengthen overseas business
NISSIN CISCO
• Provide high-quality cereals with strong value for health,
combined with affordability and variety
• Further strengthen and nurture the GOROTTO GRANOLA
brand
• Value proposition and product development unique to
confectionery under the concept of Unique Functions and
Wellness
18
◼ Strengthen existing brands further and respond to new
consumption
• Improve sales of major brands, focusing mainly on PEANUT
AGE, KARASHI MENTAIKO OGATA AGESEN, BONCHI AGE
• Enter the snack sales area given growth in at-home consumption
• Pursue greater cost reductions through productivity improvement
projects
As of May 11, 2021
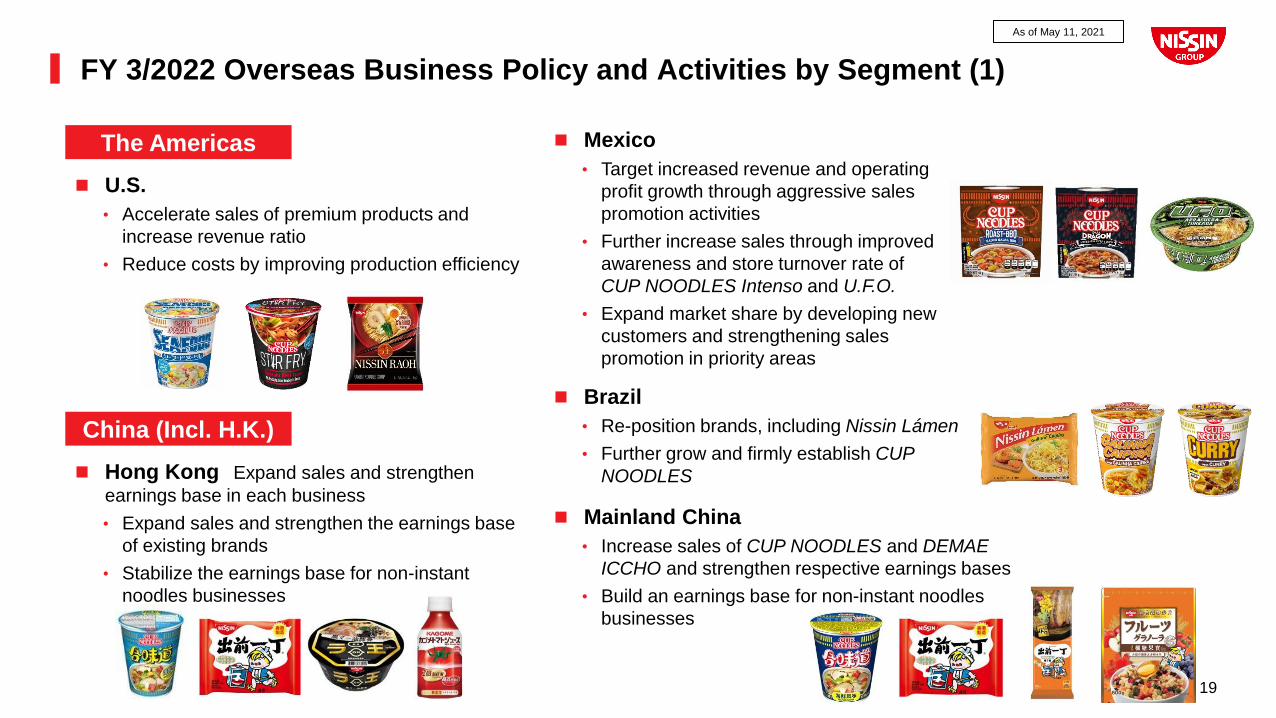
FY 3/2022 Overseas Business Policy and Activities by Segment (1)
The Americas
China (Incl. H.K.)
◼ U.S.
• Accelerate sales of premium products and
increase revenue ratio
• Reduce costs by improving production efficiency
◼ Mexico
• Target increased revenue and operating
profit growth through aggressive sales
promotion activities
• Further increase sales through improved
awareness and store turnover rate of
CUP NOODLES Intenso and U.F.O.
• Expand market share by developing new
customers and strengthening sales
promotion in priority areas
◼ Hong Kong Expand sales and strengthen
earnings base in each business
• Expand sales and strengthen the earnings base
of existing brands
• Stabilize the earnings base for non-instant
noodles businesses
◼ Mainland China
• Increase sales of CUP NOODLES and DEMAE
ICCHO and strengthen respective earnings bases
• Build an earnings base for non-instant noodles
businesses
◼ Brazil
• Re-position brands, including Nissin Lámen
• Further grow and firmly establish CUP
NOODLES
19
As of May 11, 2021

FY 3/2022 Overseas Business Policy and Activities by Segment (2)
Asia
◼ India
• Expand sales of pivotal products CUP
NOODLES and Top Ramen in the
domestic instant noodles business
• Strengthen profits by expanding third-party
sales using in-house sales platform
• Strengthen profitability by improving
production efficiency
◼ Singapore
• Strengthen sales of CUP NOODLES,
DEMAE ICCHO and MYOJO
• Expand categories other than instant
noodles
◼ Vietnam
• Introduce and expand sales of
high-profit products
• Expand target cities and delve
deeper into high-profit sales
channels
◼ Thailand
• Create market for high-value-
added bag-type instant
noodles and expand sales
• Strengthen sales of CUP
NOODLES
◼ Indonesia
• Engage in business
management that avoids price
competition
• Cultivate Nissin Ramen as a
second pillar after Gekikara
20
As of May 11, 2021
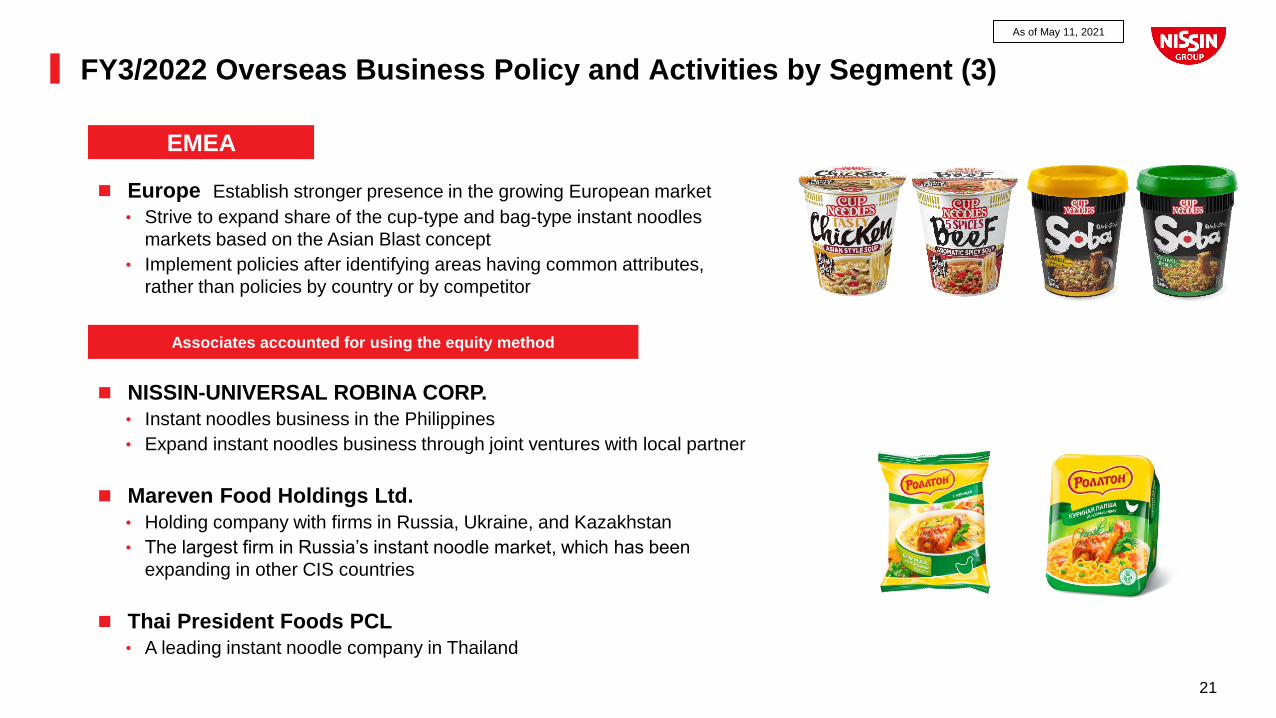
FY3/2022 Overseas Business Policy and Activities by Segment (3)
EMEA
Associates accounted for using the equity method
◼ NISSIN-UNIVERSAL ROBINA CORP.
• Instant noodles business in the Philippines
• Expand instant noodles business through joint ventures with local partner
◼ Mareven Food Holdings Ltd.
• Holding company with firms in Russia, Ukraine, and Kazakhstan
• The largest firm in Russia’s instant noodle market, which has been
expanding in other CIS countries
◼ Thai President Foods PCL
• A leading instant noodle company in Thailand
21
◼ Europe Establish stronger presence in the growing European market
• Strive to expand share of the cup-type and bag-type instant noodles
markets based on the Asian Blast concept
• Implement policies after identifying areas having common attributes,
rather than policies by country or by competitor
As of May 11, 2021
Appendix
I. FY 3/2022 1Q:Analysis of Core OP of Existing Businesses
II. FY3/2022: Analysis of Core OP Forecast of Existing Businesses
III. FY 3/2022 Policies and Activities in Each Existing Business Segment
IV. Assumptions for performance explanation
and definition of Non-GAAP indicators
…………….……….. P10
……..… P12~13
…... P15~21
………….…………………. P23~25

Approach to Sustainable Profit Growth
We have defined core operating profit of existing businesses as an indicator showing the real
growth of our existing businesses, which serve as the foundation for growth investment. Here,
we have set growth in the mid-single digits as our core economic value target
23
Rev. ProfitBefore Tax
ProfitProfit
Attributable to
Owners of the Parent
-) Cost of sales, SG&A expenses
+) Gain on investments accounted for
using the equity method, other
income and expenses
IFRS (GAAP) Indicators
+) Net financial
income
-) Income tax
-) Other income and expenses
-) Profit/loss from new businesses
-) Impact of foreign currency translation
-) Non-controlling
interests
Operating Profit
Core Operating Profit
(Company Total)
Constant Currency Basis
Core Operating Profit (Company Total)
Constant Currency Basis
Core Operating Profit of Existing Businesses
Non-
GAAP
Indicators
CurrentMid
Term
Long
Term
Short
Term
Constant Currency Basis
Core Operating Profit
Company Total
≥ YoY Increase~~
Sustainable Profit Growth
Invest an aggressive
5% to 10%of existing business core
operating profit
Disruptive innovation causes growth
at a level not achievable for existing
businesses alone
Secure indications of
profitability in 5 to 7
years
Corresponds to extraordinary income/loss and miscellaneous
income/loss, etc., under J-GAAP. Gains on sale of real estate,
loss on disposal of fixed assets, impairment losses, etc., and other
accounting or non-recurring losses/gains are deducted as non-
core income/expenses
Deduct profit/loss from new businesses to measure the growth
potential of existing businesses properly, even as we invest
aggressively in new businesses
Deduct the impact of yen exchange rate fluctuations during
consolidation to measure the growth potential of a business
properly
However, the impact of exchange rate fluctuations on the non-
consolidated profit and loss of each company
(e.g., soaring material costs due to the depreciation of the home
country's currency) is not deducted
As of May 11, 2021

Major Earnings Forecast Assumptions
Beginning FY 3/2022, we will begin conducting management, making adjusting earnings
forecasts, and explaining earnings results based on the following three assumptions
24
Introducing core operating profitas a core economic value target
Adoption of
non-GAAP profit indicators
Transferring New Business Development
Dept. from NISSIN FOODS HD to
NISSIN FOOD PRODUCTS
Organizational changes for pursuing new businesses
Establish new businesses segment
and split off Confectionery business
Changes to
disclosure segments
• Shift from IFRS operating profit to
indicators excluding other income and
expenses as non-recurring profit/loss
• To measure sustainable profit growth not
affected by transient, non-core factors
such as impairment and extraordinary
income
• To efficiently leverage the business
foundation of NISSIN FOOD
PRODUCTS, the largest business in the
group
• To reflect achievements from the New
Business Development Dept. in existing
businesses in a timely manner and to
increase synergy
• To clarify the performance of new
businesses that require aggressive
investment/risk-taking
• Re: independence of the confectionery
business, we aim to further drive
synergies between businesses in
conjunction with making KOIKE-YA a
consolidated subsidiary
1 2 3
Toward group performance management and presentation built around the
core operating profit of existing businesses
As of May 11, 2021

29.1 29.3 30.5
40.8
35.2
41.3
43.5
55.5
50.6
40.1
1.8
1.8 37.9
42.3
40.1
52.4
41.9
47.0
25
30
35
40
45
50
55
60
IFRS Core IFRS Core CoreExcl.C-19
IFRSInitialFCST
IFRS
Results
Core CoreExcl.C-19
Core Core
FY 3/18 ... FY 3/20 ... FY 3/2021 ... FY 3/22 ... FY 3/24
Profit Levels: Launchpad for a Fresh Start
We have set 47 billion yen as the Fresh Start starting line after the reset of our core operating
profit of existing businesses base
• This is the equivalent of double-digit growth versus core operating profit of existing businesses for FY3/2021, when excluding
COVID-19 impact
• We aim to exceed the same indicator for FY3/2021 (including COVID-19 impact) by FY3/2024
25
C-19
2.3
C-19
1.0
~ ~ ~ ~
OP(bil.yen)
|Reboot|
Other Income/Expenses(incl. KOIKE-YA)
4.9
Profit Profit Profit
Profit
Existing
Business
Consol-
idated
New Business
Existing
Business
Existing
Business
Consol-
idated
Operating Profit
FY 3/2021 FY 3/2022
Investments
in New Businesses
(5% to 10%
of core OP of
existing business)
Make
A Fresh Start
CAGR
vs FY 3/18 5.5%
vs FY 3/20 8.3%
IFRS / Non-GAAP OP Bridge
C-19
10.5
C-19
10.5
As of May 11, 2021

26
Company plans, business forecasts, strategies, and other information contained in this document are based on management judgments derived from
information available at the time of this publication. Be aware that these are only future projections, and actual results may differ due to various risks and
uncertainties. These risks and uncertainties include intensifying price competition in the market, changes in economic trends surrounding the business
environment, exchange rate fluctuations, and significant market fluctuations in the capital markets.
The purpose of this document is only to provide information for reference in making investment decisions, and is not a solicitation for investment. Use your
own judgment when selecting stocks and making final investment decisions.
• These presentation materials are available in PDF format at our official website, under Financial Statements & Presentation Materials
https://www.nissin.com/en_jp/ir/library/materials/
• Figures in this document are calculated to the thousands of yen, rounded down to the nearest hundred million yen. Therefore, detailed calculations and
total amounts may not agree
• As a general rule, fiscal years in this document run from April 1, 20YY through March 31, 20YY, and may be written as FY3/20YY or FYYY
• Results from China (including H.K.) are based on the consolidation policy of NISSIN FOODS HOLDINGS. Disclosure may differ from that of NISSIN
FOODS CO., LTD. (located in H.K.) .) China (including H.K.) strategy and related targets, financial results forecasts are established independently by
NISSIN FOODS HOLDINGS