Embed Size (px)
Citation preview

1H21 ResultsHR | Payroll | Expense Management
Investor Presentation
ASX:ELO16 February 2021
1
Agenda
Company overview and business highlights
Results 1H21(ASX:ELO)
2
Financial results and outlook
Q&A

ELMO Software [email protected] | elmosoftware.com.au
1H21 ELMO group results snapshotDelivering on our growth strategy
Guidance Reaffirmed
3
1. Credit approved term sheet with Commonwealth Bank of Australia. 3 year term, 2.6% interest rate
$74.2 millionAnnualised recurring revenue (ARR)
42.8% growth from 1H20
$30.6 millionStatutory revenue
29.3% growth from 1H20
$(0.8) millionEBITDA
Up $1.8 million from 1H20
$34.4 millionCash Receipts
Up 25.5% on 1H20
$71.3 millionCash on handPlus new $34.5 milliondebt facility1
Well capitalised to pursue growth initiatives
ASX:ELO

Company overviewA leading provider of cloud HR, payroll and expense management solutions
Convergent solution
Multiple modules/revenue streams
Integrated solution
Competitive advantage: width of solution
Recurrent subscription revenue
High customer retention
Land and expand strategy
Robust SaaS business model
Convergent solution providing customers with an all-in-one platform to manage people, process and pay
ELMO Software [email protected] | elmosoftware.com.au 4ASX:ELO
524Employees
OfficesIn Australia, New Zealand and United Kingdom
97.4%Subscription revenue

Expanding our market opportunityDriving ELMO’s growth
ASX:ELO
Key pillars of our expansion strategy:
2. Module Expansion
1. SegmentExpansion
3. GeographicExpansion
Multiple new levers to sustain growth into FY22 and beyond
5ELMO Software [email protected] | elmosoftware.com.au

Segment expansionGrowth opportunities across two key market segments
1. Frost & Sullivan independent market report 2019/2020
Small business solution(<50 employees)
ELMO Software [email protected] | elmosoftware.com.au 6
CV
~3.7 million organisations1 in ANZ/UK
$2.2bn1 opportunity
7,146 customers
Market penetration: <1%
Mid-market solution(50 - 2,000 employees)
~75,000 organisations1 in ANZ/UK
$10.6bn1 opportunity
2,892 customers
Market penetration: ANZ <8%, UK <2%
ASX:ELO
Fit for purpose solution for each market segment

DevelopRetainHireEngagePay
Payroll
Self-Service
Expenses
HR Core Recruitment Performance Management
Rewards & Recognition
Remuneration
Succession Management
Learning Management
Course Builder
Course Library
Video Library
OnboardingSurvey
ConnectRostering / Time & Attendance
Module expansionContinuing to broaden our customer offering
ASX:ELO
Module expansion driving convergence:
Land and expand Point of difference Interoperability
Breadth of solution is our key competitive advantage
7ELMO Software [email protected] | elmosoftware.com.au

ASX:ELO
Significant new revenue opportunities in the UK
Small BusinessBreathe + additional ELMO modules
Mid-marketELMO Modules
Geographic expansion Leveraging our technology into the UK
8ELMO Software [email protected] | elmosoftware.com.au

Plus 5.4 million UK public
ELMO Group Total Addressable Market (TAM)Large market opportunity and headroom for growth
~3.7 millionorganisations
TAM ~$2.2bn
ELMO Software [email protected] | elmosoftware.com.au
1. Frost & Sullivan independent market report 2019/20202. Assumes full penetration of Breathe platform3. Assumes full penetration of ELMO platform
UK
ANZ
Mid-market TAM1,3
(50+ employees)
~3.7 millionorganisations
TAM ~$2.2bn
Market penetration<4% organisations
~75,000 organisations
TAM ~$10.6bnUK
ANZ
Small business TAM1,2
(<50 employees)
~3.7 millionorganisations
TAM ~$2.2bn
Market penetration<1% organisations
~3.7 million organisations
TAM ~$2.2bnUK
ANZ
Plus 5.4 million UK public employees
9ASX:ELO
$12.8 billion opportunity across small business and mid-market

Agenda
Company overview and business highlights
Results 1H21(ASX:ELO)
10
Financial results and outlook
Q&A

Group ARR growthARR CAGR of 52.8% pa from 1H18 to 1H21
• ARR $74.2 million at December 2020, up 42.8% from 1H20• High level of subscription revenue at 97.4%
1. ARR CAGR 1H18 to 1H21
ELMO Software [email protected] | elmosoftware.com.au
20.8
36.4
52.0
74.2
85
1H18 1H19 1H20 1H21 FY21 ARR Guidance
CAGR1
52.8%
ARR 1H18 to 1H21 ($m)81.5 - 88.5
11ASX:ELO
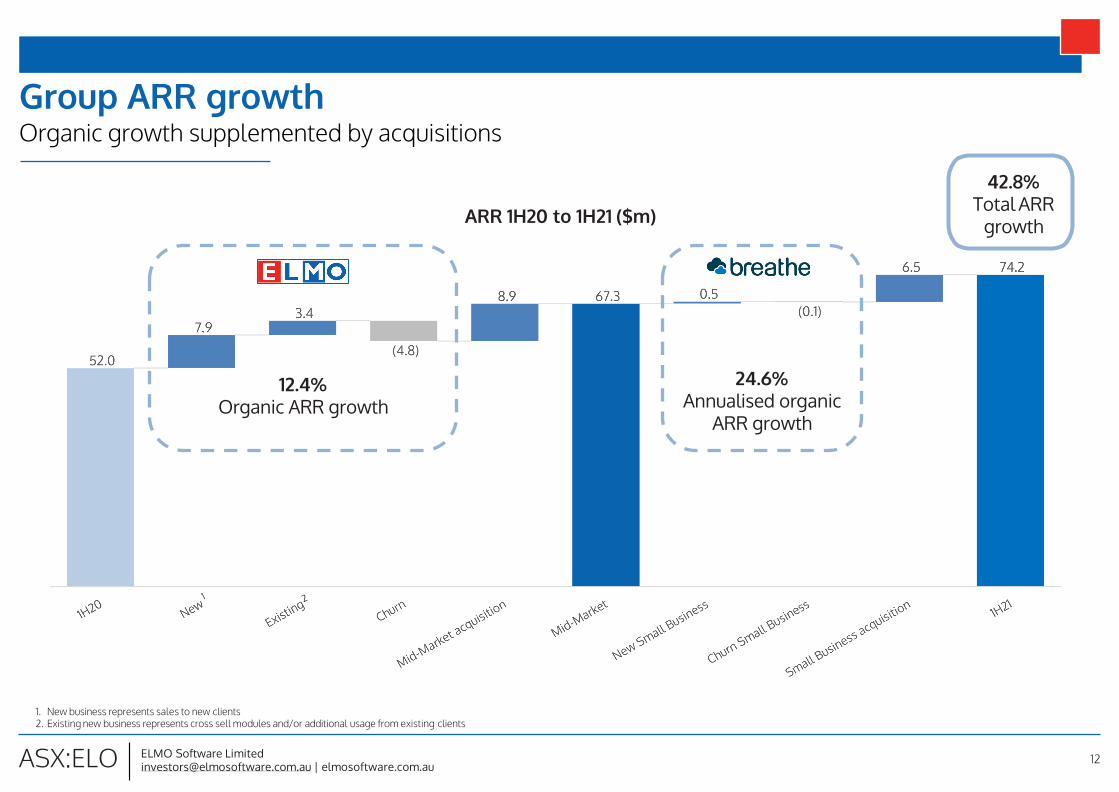
Group ARR growthOrganic growth supplemented by acquisitions
1. New business represents sales to new clients2. Existing new business represents cross sell modules and/or additional usage from existing clients
ELMO Software [email protected] | elmosoftware.com.au
42.8%Total ARR
growthARR 1H20 to 1H21 ($m)
12.4%Organic ARR growth
12ASX:ELO
24.6%Annualised organic
ARR growth

1H21 mid-market dashboardContinuing to scale
ELMO Software [email protected] | elmosoftware.com.au
2,892Customer base
95.7% growth from 31 Dec 2019
Up $26m from 30 June 2020
88.5%Gross Profit Margin
Up 3.9% from 1H20
90.0%Customer retention rate
Net customer dollar retention 97.2%
4.0Modules per new customer at 31 Dec 20201
Compared to 3.9 at 31 Dec 2019
$67.3 millionAnnualised recurring revenue (ARR)
29.5% growth from 31 Dec 2019
$28.9 million1H21 statutory revenue
22.5% growth from 1H20
$23.3kAverage ARR per customer
Down $11.9k from 1H20
13
OperationalRevenue Customer
ASX:ELO
$628 millionLifetime value (LTV) of customer base at 31 Dec 2020
<1% ARR<6% ARR
Contribution of largest customerContribution of top 10 customers
1. Average modules per customer of 2.2, post Webexpenses acquisition

1H21 small business dashboardNew segment opportunity
ELMO Software [email protected] | elmosoftware.com.au
7,146Customer base
90.1%Gross Profit Margin
~87.5%Annualised customer retention rate
1.0Modules per new customer at 31 Dec 2020
$6.9 millionAnnualised recurring revenue (ARR)
$1.7 million1H21 statutory revenue
22.5% growth from 1H20
~$950Average ARR per customer
14
OperationalRevenue Customer
ASX:ELO
$50.0 millionLifetime value (LTV) of customer base at 31 Dec 2020
<1% ARRLow customer concentration
Contribution of top 10 customers

1H21 summary financial results
1. Gross profit excludes $1.0m of amortisation (1H20: nil) of capitalised commission included in the statutory accounts2. R&D spend includes the income statement expense and capitalised costs in the reference period
ELMO Software [email protected] | elmosoftware.com.au
Income statement ($m) 1H21 1H20 Movement $ Movement %Subscription revenue 29.8 23.0 6.8 29.4%Professional fees and other revenue 0.8 0.6 0.2 25.5%Total revenue 30.6 23.6 7.0 29.3%Gross profit1 27.1 20.0 7.1 35.5%Other income 1.8 - 1.8 n/aSales and marketing expenses (13.4) (11.2) 2.1 (18.8%)Research and development expenses (5.2) (2.9) 2.3 (80.9%)General and administrative expenses (11.1) (8.5) 2.6 30.7%Total operating expenses (29.7) (22.6) 7.1 31.2%EBITDA (0.8) (2.6) 1.8 69.5%
Financial and Operational Metrics 1H21 1H20Annualised recurring revenue ($m) 74.2 52.0Subscription revenue % 97.4% 97.3%Gross margin1 % 88.6% 84.6%
S&M spend as a % of revenue 43.7% 47.5%R&D2 spend as a % of revenue 46.5% 44.9%G&A spend as a % of revenue 36.4% 36.0%
Headcount 524 368
15ASX:ELO

1H20 1H21
Average ARR per customer ($000s) 35.2 32.8ARR churn (%) 6.9% 9.3%Gross profit margin (%)2 85.8% 88.5%LTV per customer ($000s) 436 311LTV for the customer cohort ($000s) 645,000 553,0001
Estimated LTV of Webexpenses n/a 75,000Total mid-market LTV 645,000 628,000
1H20 1H21Total customer base CAC ($000s) 14,044 13,351Number of customers won 298 342Average CAC ($000s)3 47.1 39.0
LTV / CAC Ratio 9.3 8.0
Mid-market Lifetime Value (LTV)1 Mid-market CAC (excluding Webexpenses)
1. Calculations based on customer number as at 31 December in the financial period. Calculations exclude Webexpenses acquisition2. Gross profit excludes $1.0m of amortisation (1H20: nil) of capitalised commission included in the statutory accounts3. Average CAC reflects total sales and marketing expenses associated with securing new customers divided by the total number of new customers added in the period
Increasing LTVStrong payback on customer acquisition investment
ASX:ELO ELMO Software [email protected] | elmosoftware.com.au 16
1H21
Average ARR per customer ($) 950ARR churn (%) 12.5%Gross profit margin (%) 90.1%LTV per customer ($000s) 7,000LTV for the customer cohort ($000s) 50,000
ELMO Group LTV 678,000
Small Business LTV1
E:MO Lifetime value of ELMO group $678 million

Group cash flowRecord cash receipts
ELMO Software [email protected] | elmosoftware.com.au 17ASX:ELO
20.3
27.4
34.4
1H19 1H20 1H21
CAGR1
30.2%
• Total cash receipts in 1H21 of $34.4m, up 25.5% on 1H20• Bank balance of $71.3 million as at 31 December 2020
Statutory cash flow bridge ($m) Cash receipts ($m)
• New $34.5 million debt facility• Well capitalised to fund ongoing investment for growth
1. CAGR from 1H19 to 1H21

ELMO Software [email protected] | elmosoftware.com.au
ARR$74.0 – 80.0 m
Revenue$61.0 – 66.0m
EBITDA($2.9 - 6.9m)
1. Reflects the estimated revenue from completion to 30 June 20212 . EBITDA guidance excludes transaction, integration and non-cash share based payments
ARR$[ ]
Revenue$[ ]
EBITDA[ ]
FY21 Group Guidance
ARR$7.5-8.5m
Revenue 1
$4.0-5.0m
EBITDA$(0.5m) - 0.5m
ARR$81.5 – 88.5m
Revenue 1
$65.0 – 71.0m
EBITDA2
$(2.4 – 7.4m)
As provided to market on 7 October 2020
FY21 guidanceGuidance reaffirmed
As provided to market on 28 January 2021
18ASX:ELO
E:MO ELMO remains well capitalised to fund growth initiatives

Agenda
Company overview and business highlights
Results 1H21(ASX:ELO)
19
Financial results and outlook
Q&A

Appendix
20

Glossary
Term Definition
Annualised recurring revenue (ARR) Annualised recurring revenue at December 2020
Customer retention rate Customer retention is calculated by dividing the number of customers in the current period who were active customers at the end of the prior period by the number of customers at the end of the prior period
Lifetime value (LTV) LTV is calculated by multiplying the average ARR per customer over the past 12 months by gross profitmargin (%) divided by ARR churn
TAM Total Addressable Market
Net customer dollar retention Customer dollar retention is calculated by dividing the ARR at December 2020 by the ARR at December 2019 of the same customer cohort
CAGR Compound annual growth rate
EBITDA Earnings before interest, taxation, depreciation and amortisation
CAC Customer acquisition cost: includes the allocation of sales and marketing costs associated with acquiring new customers
ELMO Software [email protected] | elmosoftware.com.au 21ASX:ELO

Expense base driversContinued investment to capitalise on the market opportunity
1. Headcount relates to ELMO employees and does not include Hero Brands joint venture
ELMO Software [email protected] | elmosoftware.com.au 22ASX:ELO
0
50
100
150
200
250
R&D S&M Client Services G&A
1H20 1H21
Headcount1
Group Headcount 524
at 31 December 2020

Balance SheetStatutory Balance Sheet
($m) 31 Dec 2020 31 Dec 2019 Movement % movementCash and cash equivalents 71.3 78.1 (6.8) (8.7%)Other current assets 11.6 9.9 1.8 17.8%Total current assets 83.0 88.0 (5.0) (5.7%)Intangibles 178.7 62.9 115.8 184.0%Other non-current assets 29.1 14.0 15.1 108.4%Total non-current assets 207.8 76.9 130.9 170.3%Total assets 290.7 164.9 125.9 76.3%Trade and other payables 12.7 5.9 6.8 114.2%Contract liabilities 26.1 21.1 5.0 23.7%Deferred consideration 32.4 6.6 25.7 389%Other liabilities 32.5 15.0 17.6 117.4%Total liabilities 103.7 48.6 55.1 91.7%Net assets 187.0 116.2 70.8 237.6%
ELMO Software [email protected] | elmosoftware.com.au 23ASX:ELO

HistoryANZ’s leading unified cloud HR, payroll, expense management solution
2002 2011 2012 2013 2014 2015 2016 2017 2018 2019 2020
eLearningof talent
content
in 2002 by
SUCCESSION
REMUNERATION
HR CORE
SURVEY PAYROLL
COURSE BUILDER
REWARDS AND RECOGNITION
Australian Human Resources
PERFORMANCE
ONBOARDING
PeoplePulse and LiveSalary
Listed June 29 2017
SkyPayrollHROnboard
Pivot Software BoxSuite Vocam
ROSTERING /TIME & ATTENDANCE
CONNECT
UTS Partnersip
VIDEO LIBRARY
RECRUITMENT
164 Customers 254 Customers 358 Customers 524 Customers
As at 30 June 2017As at 30 June 2016As at 30 June 2015As at 30 June 2014
1,031 Customers
As at 30 June 2018
1,341 Customers
As at 30 June 2019
1,478 Customers
As at 31 December 2019
1,682 Customers
As at 30 June 2020
ELMO Software [email protected] | elmosoftware.com.au
Breathe
Webexpenses
EXPENSES
24ASX:ELO
As at 31 December 2020
10,038 Customers

Important notice and disclaimerinvestors.elmosoftware.com.au
Forward-looking statementsThis presentation may include forward-looking statements. Such statements can generally be identified by the use of words such as ‘may’, ‘will’, ‘expect’, ‘intend’, ‘plan’, ‘estimate’, ‘anticipate’, ‘believe’, ‘continue’, ‘objectives’, ‘outlook’, ‘guidance‘, ‘forecast’ and similar expressions. Indications of plans, strategies, management objectives, sales and financial performance are also forward-looking statements.
Such statements are not guarantees of future performance, and involve known and unknown risks,uncertainties, assumptions, contingencies and other factors, many of which are outside the control of ELMO Software Limited (ELMO or Company). No representation is made or will be made that any forward-looking statement will be achieved or will prove to be correct. Actual results, performance, operations or achievements may vary materially from any forward-looking statements. Circumstances may change and the contents of this presentation may become outdated as a result. Readers are cautioned not to place undue reliance on forward-looking statements and ELMO assumes no obligation to update such statements.No representation or warranty, expressed or implied, is made as to the accuracy, reliability, adequacy or completeness of the information contained in this presentation.
Past performancePast performance information given in this presentation is given for illustrative purposes only and should not be relied upon as (and is not) an indication of future performance.
Information is not advice or offer of securitiesThis presentation is not, and is not intended to constitute, financial advice, or an offer invitation, solicitation or recommendation to acquire or sell ELMO shares or any other financial products in any jurisdiction and is not a prospectus, product disclosure statement, disclosure document or other offering document under Australian law or any other law.This presentation also does not form the basis of any contract or commitment to sell or apply for securities in ELMO or any of its subsidiaries. It is for information purposes only.
ELMO does not warrant or represent that the information in this presentation is free from errors, omissions or misrepresentations or is suitable for your intended use. The information contained in this presentation has been prepared without taking account of any person’s investment objectives, financial situation or particular needs and nothing contained in this presentation constitutes investment, legal, tax or other advice. The information provided in this presentation may not be suitable for your specific needs and should not be relied upon by you in substitution of you obtaining independent advice. Subject to any terms implied by law and which cannot be excluded, ELMO accepts no responsibility for any loss, damage, cost or expense (whether direct, or indirect, consequential, exceptional or special damages including but not limited to loss of revenue, profits, time, goodwill, data, anticipated savings, opportunity, business reputation, future reputation, production or profit, any delay costs, economic loss or damage) incurred by you as a result of any error, omission or misrepresentation in this presentation.
Preparation of informationAll financial information has been prepared and reviewed in accordance with Australian Accounting Standards. Certain financial data included in this presentation is ‘non-IFRS financial information’.
The Company believes that this non-IFRS financial information provides useful insight in measuring thefinancial performance and condition of ELMO. Readers are cautioned not to place undue reliance on any non-IFRS financial information including ratios included in this presentation.
Presentation of information• Currency All amounts in this presentation are in Australian dollars unless otherwise stated.• 1H refers to the half year to 31 December.• FY refers to financial year ending 30 June.• Rounding Amounts in this document have been rounded to the nearest $0.1m. Any differences between this
document and the accompanying financial statements are due to rounding.
Third party information and market dataThe views expressed in this presentation contain information that has been derived from publicly available sources that have not been independently verified. No representation or warranty is made as to the accuracy, completeness or reliability of the information. This presentation should not be relied upon as a recommendation or forecast by ELMO. Market share information is based on management estimates except where explicitly identified.
No liability or responsibilityThe information in this presentation is general in nature and is provided in summary form and is therefore does not purport to be complete.
None of ELMO’s advisers (Advisers) has authorised, permitted or caused the issue or lodgement,submission, dispatch or provision of this presentation and there is no statement in this presentation which is based on any statement made by any of them or by any of their affiliates, officers or employees. To the maximum extent permitted by law, each Adviser and each of their respective affiliates, officers, employees and advisers expressly disclaim all liabilities in respect of, and make no representations regarding, and take no responsibility for, any part of this presentation and make no representation or warranty as to the currency, accuracy, reliability or completeness of this presentation.
To the maximum extent permitted by law, ELMO and each of its affiliates, directors, employees,officers, partners, agents and Advisers and any other person involved in the preparation of this presentation disclaim all liability and responsibility (including without limitation, any liability arising from fault ornegligence) for any direct or indirect loss or damage which may arise or be suffered through use or reliance on anything contained in, or omitted from, this presentation. ELMO accepts no responsibility or obligation to inform you of any matter arising or coming to their notice after the date of this presentation which may affect any matter referred to in this presentation.
This presentation should be read in conjunction with ELMO’s other periodic and continuous disclosure announcements lodged with ASX.
ELMO Software [email protected] | elmosoftware.com.au 25ASX:ELO