Embed Size (px)
Citation preview
A N N U A L R E P O R T
1999

Systeem Overzicht PAS 5500/900
ASML Mission
Providing leading edge
imaging solutions
to continuously improve
customers’ global
competitiveness
2
4
5
6
7
11
12
24
32
>
34
66
67
Message to the Shareholders
Five-year Financial Summary
Highlights 1999
Management
Report of the Supervisory Board
ASML worldwide
Management’s Discussion and Analysis of Financial
Condition and Results of Operations
12 Euro
12 Business strategy
12 Results of operations
19 Foreign exchange management
19 Financial condition, liquidity and capital resources
21 Year 2000 readiness
21 Risks affecting ASML’s business strategy
23 New accounting pronouncements
Lithography, the artist innovating the world
ASML’s product family
ASML Imaging Systems
PAS 5500/900 Step & Scan Foldout
Financial Statements 1999
Glossary of terms
Information and Investor Relations
C O N T E N T S
In this report the collective expres-
sions ‘ASML’ and ‘ASM Lithography’
are sometimes used for convenience in
contexts where reference is made to
ASM Lithography Holding N.V.
and/or any of its subsidiaries in
general. Those expressions are also
used where no useful purpose is
served by identifying the particular
company or companies.
‘Safe Harbor’ Statement under the U.S.
Private Securities Litigation Reform Act
of 1995: The matters discussed
in this document include forward-
looking statements that are subject to
risks and uncertainties including, but
not limited to, economic conditions,
product demand and industry
capacity, competitive products and
pricing, manufacturing efficiencies,
new product development, ability to
enforce patents, availability of raw
materials and critical manufacturing
equipment, trade environment,
and other risks indicated in filings
with the U.S. Securities and Exchange
Commission.
A N N U A L R E P O R T
1999
3
M E S S A G E T O T H E S H A R E H O L D E R S
Scan systems. In April, ASML commenced shipping the
PAS 5500/700, the system for the most advanced
volume manufacturing, underlining ASML’s technology
leadership. By achieving 59 shipments of this system,
ASML demonstrated its capability for a fast ramp up to
volume. Customer interest is high for the whole product
line, which is an indication of the strength of the
product line and the new period of growth. This strong
market demand is reflected in the high order intake
during the second half of 1999. Based on preliminary
data, ASML’s market share (measured in USD) increased
from 29 percent in 1998 to approximately 37 percent in
1999. This increase was as a result of a greater penetra-
tion at existing customers and engaging with several
new customers.
This market share gain is driven by ASML’s Value of
Ownership concept. This combines the latest technology
available for volume production at the time the market
needs it, the support of a network of strategic partners,
each leading in its own area of expertise, products that
can be installed and ramped up to production quickly
and an extensive customer and application support net-
work.
This Value of Ownership concept enables ASML to
continue to win new customers and increase market
share. As part of its long-term, market-oriented product
strategy, ASML designs each successive generation of
systems based on a family. This enables fast and rela-
tively easy installation at the customer site, and thus fast
production ramp up of the latest technology. Additionally,
the ability to process more wafers per hour, combined
with flexible solutions for leading-edge imaging, helps to
lower the overall production cost per chip. To extend
and exploit its technology leadership, ASML maintains
and will reinforce strategic partnerships with world-
class partners.
In the current environment, just generating and
bringing to the market the newest imaging technology
alone is not sufficient. Increasingly, customers request
hands-on support for their imaging and process opti-
mization activities. Therefore, ASML is strengthening its
already impressive customer support operations and fur-
ther enhancing its application support capabilities. The
founding of the U.S. Technology Development Center
and the acquisition of ASML Masktools have been key
initiatives in this respect. Both are focused on providing
our customers whole imaging solutions and confirming
ASML’s leadership position in this field.
It is likely that market growth momentum will con-
tinue during the year 2000 and to respond to this,
ASML will continue to increase production capacity.
Given ASML’s flexible business model, we expect that
for each incremental sale, net profit growth will exceed
net sales growth.
The current results and the growing market share are
the result of ASML’s strategy to continuously invest in
infrastructure and research and development, even in the
downcycle. In the coming years ASML will continue to
invest heavily in technology to introduce new platforms
to the market and to develop the next generation of
lithography solutions. In addition, further investments
in customer support will have a key focus. With these
investments, ASML expects to employ more than 3,500
people world-wide by the end 2000. Integrating and
effectively employing these employees requires continu-
ing investments in facilities, infrastructure and training
equipment. For 2000, nevertheless, ASML expects to
further improve its financial performance.
Last year’s result was achieved with the effort and
help of all ASML’s employees and suppliers. The ongo-
ing demand for increased production will require the
same achievement and the same commitment this year.
The Board of Management is very grateful to everyone
who contributed to this success and wishes to thank
them for their efforts.
Doug J. Dunn
CEO and Chairman of the Board of Management
ASM Lithography Holding N.V.
Veldhoven, January 19, 2000
2
Message to the
shareholders
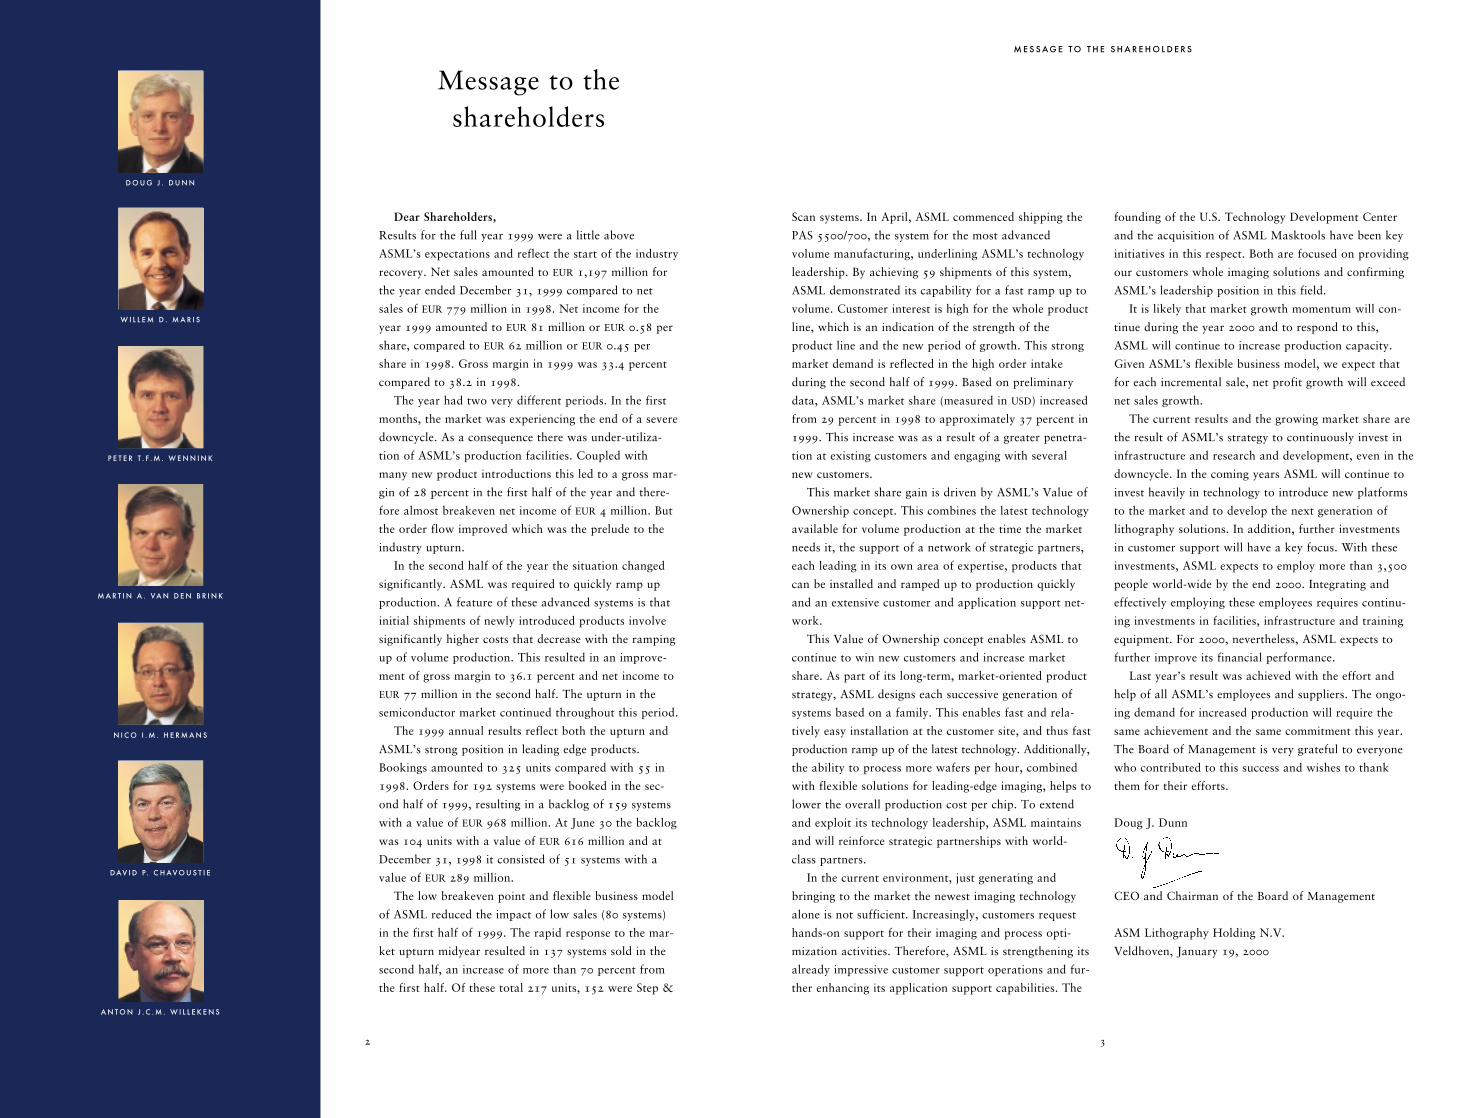
Dear Shareholders,
Results for the full year 1999 were a little above
ASML’s expectations and reflect the start of the industry
recovery. Net sales amounted to EUR 1,197 million for
the year ended December 31, 1999 compared to net
sales of EUR 779 million in 1998. Net income for the
year 1999 amounted to EUR 81 million or EUR 0.58 per
share, compared to EUR 62 million or EUR 0.45 per
share in 1998. Gross margin in 1999 was 33.4 percent
compared to 38.2 in 1998.
The year had two very different periods. In the first
months, the market was experiencing the end of a severe
downcycle. As a consequence there was under-utiliza-
tion of ASML’s production facilities. Coupled with
many new product introductions this led to a gross mar-
gin of 28 percent in the first half of the year and there-
fore almost breakeven net income of EUR 4 million. But
the order flow improved which was the prelude to the
industry upturn.
In the second half of the year the situation changed
significantly. ASML was required to quickly ramp up
production. A feature of these advanced systems is that
initial shipments of newly introduced products involve
significantly higher costs that decrease with the ramping
up of volume production. This resulted in an improve-
ment of gross margin to 36.1 percent and net income to
EUR 77 million in the second half. The upturn in the
semiconductor market continued throughout this period.
The 1999 annual results reflect both the upturn and
ASML’s strong position in leading edge products.
Bookings amounted to 325 units compared with 55 in
1998. Orders for 192 systems were booked in the sec-
ond half of 1999, resulting in a backlog of 159 systems
with a value of EUR 968 million. At June 30 the backlog
was 104 units with a value of EUR 616 million and at
December 31, 1998 it consisted of 51 systems with a
value of EUR 289 million.
The low breakeven point and flexible business model
of ASML reduced the impact of low sales (80 systems)
in the first half of 1999. The rapid response to the mar-
ket upturn midyear resulted in 137 systems sold in the
second half, an increase of more than 70 percent from
the first half. Of these total 217 units, 152 were Step &
D O U G J . D U N N
P E T E R T . F . M . W E N N I N K
W I L L E M D . M A R I S
N I C O I . M . H E R M A N S
M A R T I N A . VA N D E N B R I N K
D AV I D P. C H AV O U S T I E
A N T O N J . C . M . W I L L E K E N S

5
Five-year
Financial Summary
4
Highlights 1999
Corporate highlights
• Market share grew further in 1999 to about 37 per-
cent (measured in USD) from 29 percent in 1998.
• The customer base expanded with several new cus-
tomers.
• ASML strengthened its financial position by a
USD 520 million convertible notes issue, five times
overwritten, thus enhancing ASML’s ability to con-
tinue investing in the future.
• ASML acquired the privately held Masktools,
creating a wholly owned subsidiary ASML
Masktools Inc. focusing on providing its patented
OPC solutions to customers. This further strength-
ens ASML’s capability to provide whole imaging
solutions for resolution performance below the
wavelength of the light used.
• The ASML U.S. Technology Development Center
was formed to research, develop and commercialize
advanced image-processing techniques for future
generations of semiconductor devices.
• A wholly owned subsidiary, ASML Hong Kong, was
created to manage ASML’s regional business activi-
ties throughout the Asia-Pacific markets
• Worldwide, ASML’s dedicated workforce grew to
2,984 in 1999.
• ASML Special Applications gained new customers
that use ASML’s systems for gallium arsenide
applications, thin film heads and other specific
market applications.
Year ended December 31 1995 1996 1997 1998 1999
(in millions, except per share data) EUR EUR EUR EUR EUR
CC OO NN SS OO LL II DD AA TT EE DD SS TT AA TT EE MM EE NN TT SS OO FF OO PP EE RR AA TT II OO NN SS DD AA TT AA
Net sales 416.4 604.2 817.9 779.2 1,197.5
Cost of sales 264.1 361.6 474.2 481.6 798.0
Gross profit on sales 152.3 242.6 343.7 297.6 399.5
Research and development costs 38.7 56.8 93.1 144.6 174.0
Research and development credits (6.9) (3.8) (13.6) (29,9) (36.1)
Selling, general and administrative expenses 25.8 37.2 57.6 94.2 140.2
Operating income 94.7 152.4 206.6 88.7 121.4
Gain on sale of marketable securities 0 0 (14.1) 0 0
Interest (income) expense, net 0.4 0.2 (0.7) (1.2) 3.1
Income before income taxes 94.3 152.2 221.4 89.9 118.3
Provision for income taxes 34.7 53.4 72.1 27.9 37.5
Net income 59.6 98.8 149.3 62.0 80.8
Basic net income per ordinary share* 0.46 0.72 1.08 0.45 0.58
Number of ordinary shares used in computing per
share amount (in thousands) 129,500 136,900 138,000 138,167 138,733
CC OO NN SS OO LL II DD AA TT EE DD BB AA LL AA NN CC EE SS HH EE EE TT SS DD AA TT AA
Working capital 113.4 227.5 368.2 626.1 1,162.3
Total assets 299.1 487.0 664.0 937.8 1,703.5
Long-term debt, less current portion 7.5 0 0 272.3 789.0
Total shareholders’ equity 137.8 292.3 437.6 500.2 611.3
CC OO NN SS OO LL II DD AA TT EE DD SS TT AA TT EE MM EE NN TT SS OO FF CC AA SS HH FF LL OO WW SS DD AA TT AA
Capital expenditures 20.7 36.8 41.4 98.6 126.8
Depreciation and amortization 6.0 9.2 16.1 34.0 42.5
Net cash provided by (used in) operating activities 33.5 36.1 (16.1) (53.6) 38.1
Net cash used in investing activities (23.5) (33.6) (12.9) (102.3) (120.0)
Net cash provided by financing activities 10.8 25.3 3.8 272.9 535.4
Net increase (decrease) in cash and cash equivalents 20.7 28.4 (24.7) 116.0 452.1
RR AA TT II OO SS AA NN DD OO TT HH EE RR DD AA TT AA
Increase (decrease) in net sales (in percent) 71.9 45.1 35.4 (4.7) 53.7
Gross profit on sales as a percentage of net sales 36.6 40.1 42.0 38.2 33.4
Operating income as a percentage of net sales 22.8 25.2 25.3 11.4 10.1
Net income as a percentage of net sales 14.3 16.4 18.3 8.0 6.7
Shareholders’ equity as a percentage of total assets 46.1 60.0 65.9 53.3 36.0
Backlog of systems (in units) at year-end 176 94 158 51 159
Sales of systems (in units) 177 205 211 162 217
Number of employees at year-end 1,123 1,423 2,019 2,364 2,983
Prior year balances were restated from guilders into euros using the fixed exchange rate as of January 1st 1999 (EUR 1.00 = NLG 2.20371). See
Note 1 of the Notes to the Consolidated Financial Statements.
* All net income per ordinary share amounts have been retroactively adjusted to reflect two-for-one stock split in both May 1997 and
May 1998.
Technology highlights
• In April, ASML commenced shipping the PAS
5500/700, the system for the most advanced volume
manufacturing, underlining ASML’s technology
leadership. By achieving 59 shipments of this sys-
tem in the remainder of 1999, ASML demonstrated
its capability for a fast ramp up to volume.
• After shipping the 100th Step & Scan system in
August, ASML shipped more than 100 Step & Scan
systems in the second half of 1999 only, under-
lining ASML’s position as premier supplier of Step
& Scan systems in the industry.
• The development of a new platform, suitable to
process 200 and 300 mm wafers, with improved
imaging capabilities is on track.
• ASML shipped the first 193 nm Step & Scan sys-
tems, the PAS 5500/900. In July IMEC announced
its 193nm lithography process development pro-
gram for which one PAS 5500/900 has been
installed in the IMEC product line
• ASML has positioned itself for the future:
- ASML announced its 157 nm program with its
strategic technology partners,
- After an agreement reached with he U.S.
Department of Energy on the conditions, ASML is
now participating in the EUV-LLC program,
- ASML and Applied Materials announced their
joint venture e_Lith to develop and commercialize
electron projection lithography based on the
SCALPEL technology of Lucent’s Bell Labs.

7
General Meeting of Shareholders that effective April 1,
2000, Mr. D. Chavoustie, Executive Vice President
Worldwide Sales, will be appointed as member of the
Board of Management.
Supervision
The Supervisory Board met five times in the course of
1999. Topics of discussion at the meetings included,
amongst others things, the Company’s general strategy
and business plan, the internal division of tasks of the
Board of Management, strategic alliances and acquisi-
tions and the risks associated with the Company. The
Supervisory Board was also kept informed on the
course of the business through monthly reports and
was consulted on a regular basis. The Supervisory
Board was also represented in some of the discussions
between the Board of Management and the Works
Council.
One meeting of the Supervisory Board was held
without the Board of Management present, to discuss
amongst other things the functioning of the
Supervisory Board itself, the relationship with the
Board of Management and the performance, composi-
tion and succession of the Board of Management.
In 1999 the Remuneration Committee met once; the
Audit Committee met three times in the presence of the
external auditor
Composition of the Supervisory Board
On April 29, 1999 the Supervisory Board was sad-
dened with the news of the death of Mr. R. Baron van
Overstraeten who had resigned as member of the
Supervisory Board as of March 3, 1999.
In 1999, Mr. A. Westerlaken was reappointed as
member of the Supervisory Board.
At the coming General Meeting of Shareholders, the
Supervisory Board intends to reappoint Mr. J. Dekker
and Mr. P. Grassmann who will be retiring by rotation
and who have made themselves available for
6
Financial Statements
The Supervisory Board has reviewed the financial
statements and the notes thereto of ASM Lithography
Holding N.V. (the ‘Company’) for the financial year
1999, as prepared by the Board of Management.
Deloitte & Touche, independent public accountants,
have duly examined these financial statements. Their
report appears in this Annual Report.
The Supervisory Board has adopted these financial
statements in accordance with article 38, paragraph 5
of the Company’s Articles of Association. The
Supervisory Board recommends to the General
Meeting of Shareholders to approve these financial
statements in accordance with the proposal of the
Board of Management, which includes the proposal
not to declare a dividend for 1999.
Composition of the Board of Management
In 1999, Mr. W. Maris, President, Chairman of the
Board of Management and Chief Executive Officer of
the Company, announced that he would retire as of
January 1, 2000. The Supervisory Board wishes to
express its sincere gratitude to Mr. Maris for the
remarkable achievements the Company has made dur-
ing the decade that Mr. Maris was in office. After a
transition period of several months, Mr. Maris was
succeeded by Mr. D. Dunn, effective January 1, 2000
The Supervisory Board will announce at the coming
General Meeting of Shareholders its intention to
appoint Mr. Maris as member of the Supervisory
Board effective April 1, 2000 (see also Composition of
the Supervisory Board)
The announced succession of Mr. G. Verdonschot,
Vice President Finance/Administration and Chief
Financial Officer by Mr. P Wennink as well as the
appointment of M. van den Brink and N. Hermans as
additional Board members, became effective as of July
1, 1999 and April 1 1999 respectively. The
Supervisory Board will also announce at the coming
Report of the
Supervisory Board
Management*
B O A R D O F M A N A G E M E N T
Doug J. Dunn (1944)
President, Chief Executive Officer, Chairman of the
Board of Management (as of January 1, 2000)
Appointed as Board Member in 1999
British nationality
Willem D. Maris (1939)
President, Chief Executive Officer, Chairman of the
Board of Management (until December 31, 1999)
Appointed in 1990
Dutch nationality
Peter T.F.M. Wennink (1957)
Executive Vice President Finance and Chief Financial Officer
Appointed in 1999
Dutch nationality
Martin A. van den Brink (1957)
Executive Vice President Marketing & Technology
Appointed in 1999
Dutch nationality
Nico I.M. Hermans (1951)
Executive Vice President Worldwide Customer Support
Appointed in 1999
Dutch nationality
O T H E R M E M B E R S O F M A N A G E M E N T
David P. Chavoustie (1943)
Executive Vice President Sales
Appointed in 1998
U.S. nationality
Anton J.C.M. Willekens (1944)
Executive Vice President Goodsflow
Appointed in 1991
Dutch nationality
Evert B. Polak (1944)
Corporate Vice President Strategic Business Development
Appointed in 1986
Dutch nationality
William B. Arnold (1954)
Chief Executive Scientist
Appointed in 1998
U.S. nationality
As per January 1, 2000, Willem Maris was succeeded by
Doug Dunn as President,
Chief Executive Officer and Chairman of the
Board of Management. Willem Maris also resigned
as member of the board as per January 1, 2000.
During 1999, Peter Wennink succeeded Gerard Verdonschot
as Executive Vice President Finance and Chief Financial
Officer and Martin van den Brink and
Nico Hermans were appointed as additional
Board Members.
* situation as at December 31, 1999

98
Henk Bodt (1938)
(Chairman)
Former Executive Vice President of
Royal Philips Electronics
Dutch nationality
First appointed 1995;
current term until 2001
Additional functions:
Member of the Supervisory Board of:
DSM N.V.,
Delft Instruments N.V.,
Neo Post SA
Syb Bergsma (1936)
Professor of Financial Management at
the University of Amsterdam
and Former Executive Vice President
Financial Affairs of Akzo Nobel N.V.
Dutch nationality
First appointed 1998;
current term until 2001
Additional functions:
Chairman of the Supervisory Board of
UPM Holding B.V.,
Member of the Supervisory Board of:
Van der Moolen Holding N.V.,
Koninklijke ANWB B.V.,
European Assets Trust N.V.,
Generali Verzekeringsgroep N.V.,
Van Melle N.V.;
Member of:
Advisory Board ABN AMRO
Management Investment Funds B.V.,
Board of External Advisors
Ernst & Young
Jan A. Dekker (1939)
Chief Executive Officer of TNO
Dutch nationality
First appointed 1997;
current term until 2000
Additional functions:
Chairman of the Supervisory Board of
H.E.S. Beheer N.V.;
Member of the Supervisory Board of
Gamma Holding N.V.
Peter H. Grassmann (1939)
President and Chief Executive Officer
of Carl Zeiss
German nationality
First appointed 1996;
current term until 2000
Additional functions:
Member of the Supervisory Board
of Gambro AB;
Member of the Senate of
Max-Planck-Gesellschaft;
Member of the Advisory Board of:
Allianz,
the Deutsche Bank
Arie Westerlaken (1946)
(Secretary)
General Secretary and Chief Legal
Officer of Royal Philips Electronics;
Member of Group Management
Committee of Royal Philips Electronics
Dutch nationality
First appointed 1995;
current term until 2002
Additional functions:
none
T H E S U P E R V I S O R Y B O A R D
H A S F O R M E D T H E
F O L L O W I N G C O M M I T T E E S
Audit Committee
Members: Henk Bodt, Syb Bergsma,
Jan Dekker
Remuneration Committee
Members: Henk Bodt, Syb Bergsma,
Arie Westerlaken
The remuneration of the members
of the Supervisory Board does
not depend on the results of the
Company.
None of the members of the
Supervisory Board personally
maintains a business relationship
with the Company other than as
member of the Supervisory Board.
None of the members of the
Supervisory Board owns shares or
options on shares of the Company.
Members of the Supervisory Board
H E N K B O D T
S Y B B E R G S M A
J A N A . D E K K E R
P E T E R H . G R A S S M A N N
A R I E W E S T E R L A K E N
reappointment. At the same occasion the Supervisory
Board intends to appoint Mr. Maris, with his long-
standing experience with the Company, as member of
the Supervisory Board. The Supervisory Board consid-
ers it desirable to have adequate ASML experience
among its ranks with a former member of ASML top
management.
Finally, the Supervisory Board wishes to thank all
involved for their contribution to the achievements of
the Company in 1999.
Veldhoven, January 19, 2000
The Supervisory Board
11
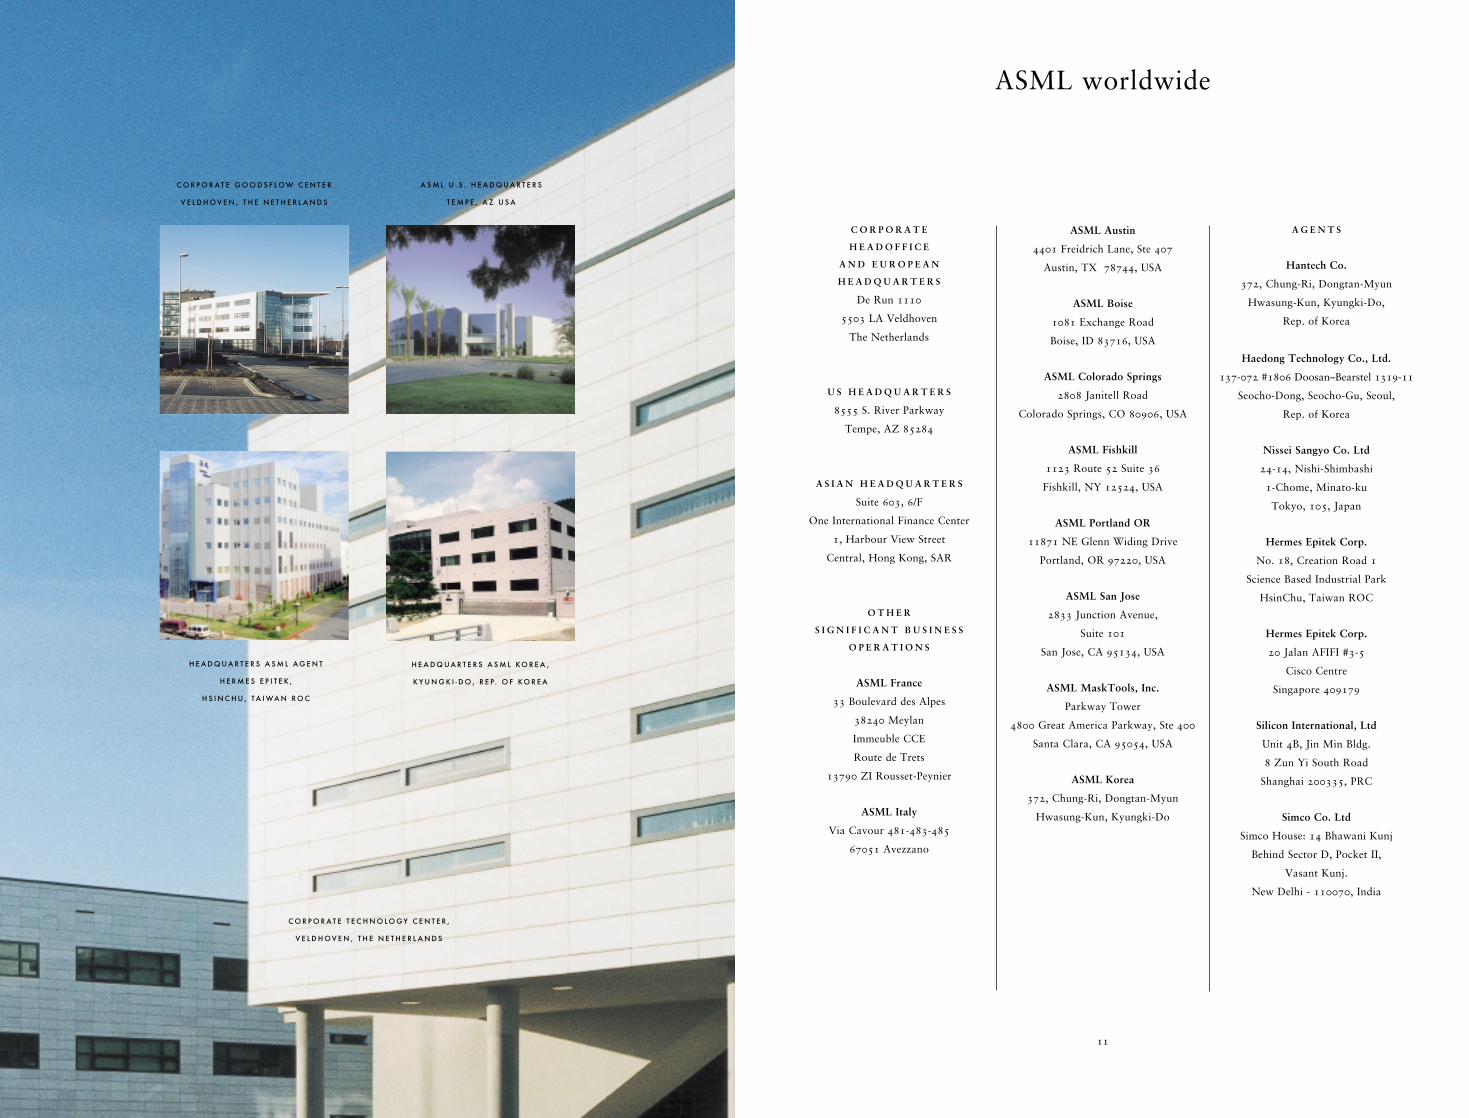
ASML worldwide
C O R P O R A T E
H E A D O F F I C E
A N D E U R O P E A N
H E A D Q U A R T E R S
De Run 1110
5503 LA Veldhoven
The Netherlands
U S H E A D Q U A R T E R S
8555 S. River Parkway
Tempe, AZ 85284
A S I A N H E A D Q U A R T E R S
Suite 603, 6/F
One International Finance Center
1, Harbour View Street
Central, Hong Kong, SAR
O T H E R
S I G N I F I C A N T B U S I N E S S
O P E R A T I O N S
ASML France
33 Boulevard des Alpes
38240 Meylan
Immeuble CCE
Route de Trets
13790 ZI Rousset-Peynier
ASML Italy
Via Cavour 481-483-485
67051 Avezzano
ASML Austin
4401 Freidrich Lane, Ste 407
Austin, TX 78744, USA
ASML Boise
1081 Exchange Road
Boise, ID 83716, USA
ASML Colorado Springs
2808 Janitell Road
Colorado Springs, CO 80906, USA
ASML Fishkill
1123 Route 52 Suite 36
Fishkill, NY 12524, USA
ASML Portland OR
11871 NE Glenn Widing Drive
Portland, OR 97220, USA
ASML San Jose
2833 Junction Avenue,
Suite 101
San Jose, CA 95134, USA
ASML MaskTools, Inc.
Parkway Tower
4800 Great America Parkway, Ste 400
Santa Clara, CA 95054, USA
ASML Korea
372, Chung-Ri, Dongtan-Myun
Hwasung-Kun, Kyungki-Do
A G E N T S
Hantech Co.
372, Chung-Ri, Dongtan-Myun
Hwasung-Kun, Kyungki-Do,
Rep. of Korea
Haedong Technology Co., Ltd.
137-072 #1806 Doosan–Bearstel 1319-11
Seocho-Dong, Seocho-Gu, Seoul,
Rep. of Korea
Nissei Sangyo Co. Ltd
24-14, Nishi-Shimbashi
1-Chome, Minato-ku
Tokyo, 105, Japan
Hermes Epitek Corp.
No. 18, Creation Road 1
Science Based Industrial Park
HsinChu, Taiwan ROC
Hermes Epitek Corp.
20 Jalan AFIFI #3-5
Cisco Centre
Singapore 409179
Silicon International, Ltd
Unit 4B, Jin Min Bldg.
8 Zun Yi South Road
Shanghai 200335, PRC
Simco Co. Ltd
Simco House: 14 Bhawani Kunj
Behind Sector D, Pocket II,
Vasant Kunj.
New Delhi - 110070, India
H E A D Q U A R T E R S A S M L K O R E A ,
K Y U N G K I - D O , R E P. O F K O R E A
C O R P O R A T E G O O D S F L O W C E N T E R
V E L D H O V E N , T H E N E T H E R L A N D S
A S M L U . S . H E A D Q U A R T E R S
T E M P E , A Z U S A
H E A D Q U A R T E R S A S M L A G E N T
H E R M E S E P I T E K ,
H S I N C H U , T A I WA N R O C
C O R P O R A T E T E C H N O L O G Y C E N T E R ,
V E L D H O V E N , T H E N E T H E R L A N D S

12 13
– Offering customers continuing improvements in
productivity and value by introducing advanced
technology, based on the modular, upgradeable
design of ASML’s families of lithography tools.
– Pursuing continuing reductions in the cycle time
between a customer’s order of a lithography tool and
the use of that tool in volume production at the
customer site.
– Providing superior customer support services that
ensure rapid and efficient installation, as well as
continuing on-site support and training to optimize
the imaging process and improve customers
productivity.
– Expanding operational flexibility in research and
manufacturing by reinforcing strategic alliances with
world-class partners.
R E S U LT S O F O P E R A T I O N S
The following discussion and analysis of results of
operations should be viewed in the context of the risks
affecting ASML’s business strategy, described below.
Following is ASML’s consolidated statements of
operations data for the last three years expressed as a
percentage of total net sales:
E U R O
On January 1st, 1999, The Netherlands and eight other
member countries of the European Union adopted the
euro (‘EUR’) as their new common currency. The Dutch
guilder will also remain as legal tender for a transition
period of three years until January 1st, 2002. During
this period, the euro will not be usable for cash
payments, but can be used for non-cash electronic
money transfers between ASML and its business
partners.
For external reporting purposes, effective January 1st,
1999, ASML adopted the euro as reporting currency.
Prior year balances have been restated based on the
fixed exchange rate as of January 1st, 1999 (EUR 1.00
to NLG 2.20371). The comparative balances reported in
euros depict the same trends as would have been
presented if ASML had continued to present balances in
Dutch guilders.
B U S I N E S S S T R A T E G Y
ASML’s strategic objective is to realize profitable and
sustainable growth by providing leading edge imaging
solutions to the worldwide semiconductor industry that
continually improve customers’ competitiveness by
enhancing the value of their ownership of ASML
equipment.
The principal elements of ASML’s value of ownership
strategy are:
– Maintaining significant levels of research and
development spending in order to offer customers, at
the earliest possible date, the most advanced
technology suitable for high-throughput, low-cost
volume production.
Year ended December 31 1997 1998 1999
Total net sales 100.0% 100.0% 100.0%
Cost of sales 58.0 61.8 66.6
Gross profit on sales 42.0 38.2 33.4
Research and development costs 11.4 18.6 14.6
Research and development credits (1.7) (3.8) (3.0)
Selling, general and administrative expenses 7.0 12.0 11.7
Operating income 25.3 11.4 10.1
Gain on sale of marketable securities (1.7) 0 0
Interest (income) expense (0.1) (0.1) 0.2
Income before income taxes 27.1 11.5 9.9
Income taxes 8.8 3.5 3.2
Net income 18.3 8.0 6.7
Sales of systems (in units) 211 162 217
Management’s Discussion and
Analysis of Financial Condition and
Results of Operations
ASML’s latest generation of products sell at average
sales prices that are considerably higher than the older
generation of products. In 1999 the number of ASML’s
wafer steppers sold was 43, a decrease of 83 compared
to 1998.
The increase in total net sales in 1999 included an
increase in net service sales of 13.3 percent, reflecting
the continued increase in the installed base of ASML’s
products at customer plants.
Total net sales for 1998 and 1999, respectively, include
EUR 6.7 and EUR 40.4 million relating to the sale of 7
and 22 pre-owned wafer steppers. These steppers were
reacquired from existing customers and then resold,
primarily to other customers seeking to expand
production capacity in areas requiring the less critical
resolution capabilities provided by these machines.
ASML will engage in similar repurchase and resale
transactions in the future; however, it does not
anticipate that the impact of those transactions will be
significant.
Results of Operations 1999 compared with 1998
Net Sales
Net sales consist of revenues from sales of wafer
steppers and Step & Scan systems, sales of equipment
options and software upgrades, which may occur in
conjunction with the initial sale of a system or after its
installation, and revenues from service.
Total net sales increased from EUR 779.2 million in
1998 to EUR 1,197.5 million in 1999, an increase of
EUR 418.3 million or 53.7 percent. The increase in sales
was caused by an increase in shipments from 162 units
in 1998 to 217 units in 1999 as well as an increase in
the average unit sales price for new systems. The
34 percent increase in the number of systems shipped
reflects the accelerated upturn in the semiconductor
industry, and the equipment industry in particular, in
the second half of 1999. The 23 percent increase in the
average unit sales price of new systems was due to a
continued shift in customer demand towards ASML’s
most advanced technology products, primarily ASML’s
PAS 5500 Step & Scan systems. Sales of these systems
increased from 29 in 1998 to 152 in 1999. Generally,
M A N A G E M E N T ’ S D I S C U S S I O N A N D A N A LY S I S

of 1999, this roll-out continued to place pressure on
gross margins as did. Furthermore the under-utilization
of ASML’s manufacturing capacity during the first half
of 1999 affected the gross margin adversely. In the
second half of 1999, the increased sales volumes, as well
as increased learning curve benefits, significantly
improved gross margins.
ASML anticipates that gross margins from its advanced
Step & Scan systems will continue to improve in the
year 2000.
However, ASML also anticipates that it will continue
to experience periodic fluctuations in gross margins as it
introduces and rolls out further new advanced
technology systems.
Following is a summary of gross margins on a half-
yearly basis reflecting the analysis discussed:
In 1999, sales to two customers accounted for
EUR 238.8 million and EUR 164.7 million, or 19.9 and
13.8 percent of net sales, respectively. In 1998 sales to
four customers accounted for EUR 132.0 million,
EUR 115.5 million, EUR 108.1 million and EUR 98.0
million or 16.9, 14.8, 13.9 and 12.6 percent of net
sales, respectively.
Gross Profit
Gross profit as a percentage of total net sales decreased
from 38.2 percent in 1998 to 33.4 percent in 1999.
Excluding the gross margin on service sales, gross
margin on systems sales decreased by 5.7 percent to
35.1 percent. Generally, ASML experiences pressure on
gross margins when new technology is introduced and
shipped to customers. This reflects the additional costs
relating to production, installation, warranty and other
areas that are part of the new technology learning curve
both for ASML and its suppliers. In 1998, the gross
margin was negatively affected by the roll-out of
ASML’s advanced Step & Scan systems. In the first half
15
M A N A G E M E N T ’ S D I S C U S S I O N A N D A N A LY S I S
14
R E V E N U E S B Y
G E O G R A P H I C A L
A R E A
R E V E N U E S
( I N M I L L I O N E U R O S )
T O T A L E M P L O Y E E S
N E T P R O F I T
( I N M I L L I O N E U R O S )
E U R O P E
T A I WA N
U S A
R O W
R O W = R E S T O F T H E W O R L D
1 H = F I R S T H A L F - Y E A R
2 H = S E C O N D H A L F - Y E A R
K O R E A
O T H E R
M A R K E T I N G &
T E C H N O L O G Y
C U S T O M E R
S U P P O R T
O P E R A T I O N S
G O O D S F L O W
14 0 0
12 0 0
10 0 0
8 0 0
6 0 0
4 0 0
2 0 0
0
9 0
8 0
7 0
6 0
5 0
4 0
3 0
2 0
10
0
– 10
3 5 %
2 4 %
2 7 %
13 %
1 %
S E C O N D H A L F - Y E A R
F I R S T H A L F - Y E A R
2 7 %
3 6 %
2 3 %
14 %
I N C I D E N T A L S
S E M I - A N N U A L
2 4 2
9 5
19 94
5 3
14
6 7
19 9 71 H
19 9 72 H
19 9 81 H
19 9 82 H
19 9 91 H
19 9 92 H
8 2
6 4
– 2
4
7 7
417
1 6 9
19 9 5
6 0 4
2 7 1
19 9 6
818
3 4 8
19 9 7
7 7 9
4 5 5
19 9 8
119 7
14 7
2 4 8
3 3 3
4 7 0 3 2 4
7 8 9
4 0 8
19 9 9
Year ended December 31 1998 1999
Jan – Jun Jul – Dec Jan – Jun Jul – Dec
Total units shipped 98 64 80 137
Net sales (EUR million) 455 325 408 789
Gross margin (% of sales) 42.8 31.7 28.0 36.1
Average unit sales price for new systems (EUR million) 4.24 4.89 4.85 5.94

17
M A N A G E M E N T ’ S D I S C U S S I O N A N D A N A LY S I S
rate. The implementation of this program reduced the
effective tax rate by approximately 2.0 percent.
Furthermore, ASML recorded additional non-
recurring permanent differences in the calculation of the
income tax for the year 1998, which accounted for an
additional 1.9 percent reduction in the 1998 effective
tax rate.
In 1999 a new structure of ASML’s activities in Asia
became effective. In addition to organizational and
managerial benefits, ASML recorded tax rate benefits
from this new structure.
Results of Operations 1998 compared with 1997
Net Sales
Total net sales decreased from EUR 817.9 million in
1997 to EUR 779.2 million in 1998, a decrease of
EUR 38.8 million or 4.7 percent. The decrease in sales
was primarily caused by a decrease in shipments from
211 units in 1997 to 162 units in 1998, reflecting the
sharp downturn in the semiconductor industry, and the
equipment industry in particular, in the course of 1998.
The effect of this 23 percent decrease in the number of
systems shipped was mitigated by an increase in the
average unit sales price for new systems, including
options, by 20.4 percent in 1998. This was due to a
continued shift in customer demand towards ASML’s
most advanced technology products, primarily ASML’s
lines of PAS 5500 Step & Scan systems and deep UV
systems. Notwithstanding the downturn in the industry,
sales of these systems increased from 76 in 1997 to 105
in 1998. In 1998 the number of ASML’s PAS 5500
i-line systems sold was 50, a decrease of 67 compared to
1997.
The decrease in total net sales in 1998 included an
increase in net service sales of 21 percent, reflecting the
continued increase in the installed base of ASML’s
products at customer plants.
Total net sales for 1997 and 1998, respectively, include
EUR 13.3 and EUR 6.7 million relating to the sale of 11
and 7 pre-owned wafer steppers. These steppers were
reacquired from existing customers and then
immediately resold, primarily to other customers
seeking to expand production capacity in areas
allowing the less critical resolution capabilities
provided by these machines.
In 1998 sales to four customers accounted for
EUR 132.0 million, EUR 115.5 million, EUR 108.1
million and EUR 98.0 million or 16.9, 14.8, 13.9 and
12.6 percent of net sales, respectively. In 1997 sales to
two customers accounted for EUR 171.2 million and
EUR 140.4 million or 20.9 and 17.2 percent of total net
sales, respectively.
Gross Profit
Gross profit as a percentage of total net sales decreased
from 42.0 percent in 1997 to 38.2 percent in 1998.
Excluding the gross margin on service sales, gross
margin on systems sales decreased by 3.3 percent to
40.8 percent. In 1997, the gross margin was negatively
affected by the introduction of the PAS 5500/300 deep
UV systems. Generally, ASML experiences pressure on
gross margins when new technology is introduced and
shipped to customers. This reflects the additional costs
relating to installation, warranty and other areas that
are part of the new technology learning curve both for
ASML and its suppliers.
Apart from costs related to new product
introduction, the decrease in gross margin in 1998 was
also attributable to ASML’s increase in its production
capacity and related cost base. Because of the
unexpected and sharp downturn in demand, ASML was
not able to utilize this expanded production capacity as
efficiently as it had anticipated.
16
A S M L A N N U A L R E P O R T 19 9 9
Research and Development Costs
Research and development costs increased from
EUR 144.7 million (18.6 percent of total net sales) in
1998 to EUR 174.0 million (14.6 percent of total net
sales) in 1999. The increase in research and
development costs resulted from an increase in staffing
levels from 800 at the end of 1998 to 977 at the end of
1999 and development costs of 193 nanometer lenses.
The increase in research and development costs reflects
ASML’s continuing efforts to develop its 300 millimeter
wafers platform and to upgrade its PAS 5500 family of
Step & Scan systems generally and in particular its
PAS 5500/700 deep UV system as well as its
PAS 5500/900, a 193 nanometer system. The increase
also reflects ASML’s increasing efforts in research
related to next-generation-lithography.
ASML foresees further long-term growth in research
and development staffing and other costs, although
these costs as a percentage of total net sales are
expected to decrease as a result of the further upturn
in the semiconductor industry.
Research and Development Credits
Research and development credits increased from
EUR 29.9 million in 1998 to EUR 36.1 million in 1999.
The increase in research and development credits in
1999 in comparison to 1998 primarily reflects
additional credits received by ASML under European
Union Technology subsidy programs (MEDEA) and
similar programs of the Dutch Ministry of Economic
Affairs (TOK and PBTS) in connection with ASML’s
development work for its new platform for 300
millimeter wafers.
Furthermore, the European Union Programs have
been instrumental in the sale of ASML’s products to
European Research Institutes. ASML also received
subsidies as part of the Ellipse II program to assist the
development of the PAS 5500/900, ASML’s
193 nanometer system. Finally, the increase in subsidies
received also reflects ASML’s share in the WBSO
program, a subsidy program operated by the Dutch
government to stimulate research and development
activities in the industry in general.
Management anticipates receiving lower research
and development credits in 2000 although the precise
amount remains subject to further negotiation with the
relevant granting authorities.
Selling, General and Administrative Expenses
Selling, general and administrative expenses increased
from EUR 94.2 million in 1998 to EUR 140.2 million in
1999. The increase in the absolute level of selling,
general and administrative expenses reflects higher
staffing levels in ASML’s sales and customer support
functions, as well as higher costs of the information
technology organization. This increase in staffing levels
reflects ASML’s efforts to support the development of
new markets (particularly Asia) and expand its support
to customers to increase the value of their ownership of
more complex Step & Scan systems. The expansion of
effort for the information technology organization is
necessary to support research and development and
increased customer services and accounted for an
increase in selling, general and administrative expenses
of approximately EUR 21.9 million. The increase of the
customer support organization accounted for higher
selling, general and administrative expenses of
approximately EUR 15.7 million.
Income Taxes
Income taxes represented 31.1 and 31.7 percent of
income before taxes in 1998 and 1999, respectively. In
1998 and 1999 ASML recorded tax rate benefits
resulting from a program operated by the government
of The Netherlands pursuant to which eligible
companies may seek a reduction in their effective tax

19
M A N A G E M E N T ’ S D I S C U S S I O N A N D A N A LY S I S
increase in selling, general and administrative expenses
by approximately EUR 8 million. Expenses with respect
to new demonstration and application equipment,
facilities, tools and consumables also increased as a
result of these developments.
General and administrative expenses increased due to
the cost of new facilities and leases, which accounted
for an increase of approximately EUR 8 million, and the
implementation of ASML’s new Enterprise Resource
Planning (‘ERP’) information system which accounted
for an increase of approximately EUR 5 million.
Income Taxes
Income taxes represented 32.6 and 31.1 percent of
income before taxes in 1997 and 1998, respectively. In
1997, ASML realized a non-taxable gain on the sale of
marketable securities and had recurring non-taxable
items which decreased the effective tax rate in 1997 by
2.2 and 1.0 percent, respectively. Without these two
items, the effective tax rate would have been 35.8
percent. In 1998 ASML recorded tax rate benefits
resulting from a program operated by the government
of The Netherlands pursuant to which eligible
companies may seek a reduction in their effective tax
rate. The implementation of this program reduced the
effective tax rate of 1998 by approximately 2.0 percent.
Furthermore, ASML recorded additional
non-recurring permanent differences in the calculation
of the income tax for the year 1998, which accounted
for an additional 1.9 percent reduction in the effective
tax rate.
F O R E I G N E X C H A N G E M A N A G E M E N T
Except for U.S. service sales, ASML’s sales are primarily
denominated in Netherlands guilders, ASML’s
functional currency, thus eliminating its currency
exposure for sales in foreign currency. The exposure
from U.S. sales denominated in U.S. dollars is naturally
hedged by the related U.S. dollar-denominated costs.
Currency exposure relating to participating member
Economic and Monetary Union (‘EMU’) countries has
been eliminated as of January 1, 1999 with the
introduction of the euro. ASML is reviewing the
potential impact of the introduction of the euro on
product pricing, human resources (i.e. payroll,
pensions), contracts and other legal matters. Although
ASML does not expect that the introduction will have a
material adverse effect on ASML’s results of operations,
cash flows or financial condition it will continue to
monitor closely developments with respect to the
introduction of the euro.
In November 1999, ASML completed an offering of
U.S. dollar 520 million principal amount of
4.25 percent Convertible Subordinated Notes. The
currency exposure from this loan was naturally hedged
by the related U.S. dollar-denominated assets.
ASML was not a party to any open forward
contracts at December 31, 1999.
F I N A N C I A L C O N D I T I O N , L I Q U I D I T Y
A N D C A P I T A L R E S O U R C E S
The following discussion and analysis of financial
condition should also be viewed in the context of the
risks affecting ASML’s business strategy, described
below.
ASML’s balance of cash and cash equivalents was EUR
151.0 million and EUR 603.1 million at December 31,
1998 and 1999, respectively. Net cash flows provided
by operating activities were EUR 38.1 million in 1999.
Net cash flows used by operating activities were EUR
53.6 million in 1998.
18
Research and Development Costs
Research and development costs increased from
EUR 93.1 million (11.4 percent of total net sales) in
1997 to EUR 144.7 million (18.6 percent of total net
sales) in 1998. The increase in research and
development costs resulted from an increase in staffing
levels from 681 at the end of 1997 to 800 at the end of
1998, as well as from an increase in amounts charged
by third parties (including Royal Philips Electronics)
from EUR 40.1 million in 1997 to EUR 73.7 million in
1998.
Research and Development Credits
Research and development credits increased from
EUR 13.6 million in 1997 to EUR 29.9 million in 1998
The increase in research and development credits in
1998 in comparison to 1997 primarily reflects
additional credits received by ASML under European
Union Technology subsidy programs (MEDEA) and
similar programs of the Dutch Ministry of Economic
Affairs (TOK and PBTS) in connection with ASML’s
development work for its new platform for 300
millimeter wafers.
Selling, General and Administrative Expenses
Selling, general and administrative expenses increased
from EUR 57.6 million in 1997 to EUR 94.2 million in
1998. The increase in the absolute level of selling,
general and administrative expenses reflects increased
staffing levels in ASML’s applications and sales support
functions, as well as higher administrative costs at
ASML’s Veldhoven headquarters. This increase in
staffing levels reflects ASML’s efforts to support the
development of new markets (particularly Asia) and
expand its sales support organization to accommodate
the increased sales of more complex wafer steppers and
Step & Scan systems. The extension of ASML’s regional
offices and sales support organization accounted for an

21
M A N A G E M E N T ’ S D I S C U S S I O N A N D A N A LY S I S
and expanded credit facilities will be sufficient to
finance its scheduled capital expenditures for 2000 and
to fund its working capital for the next few years. In
addition, ASML may seek to obtain additional financing
in the public or private capital markets. ASML does not
foresee any difficulty in obtaining such additional
financing facilities on commercially acceptable terms.
Y E A R 2 0 0 0 R E A D I N E S S
General
The year 2000 issue refers to the potential threat to all
computers, equipment-embedded microprocessors and
software if these systems were not properly modified to
recognize date-sensitive information when the year
changed to 2000. ASML has made significant efforts to
minimize the impact of the year 2000 issue on its
products, facilities, information technology systems and
infrastructure. ASML did not experience significant
problems when the year changed to 2000. However
because of the complexity and the long term effects of
some of the possible failures, ASML will continue to
actively monitor the situation in this area.
R I S K S A F F E C T I N G A S M L ’ S B U S I N E S S S T R A T E G Y
In conducting its business, ASML faces many risks that
may interfere with its business objectives as defined in
ASML’s strategy. Some of those risks relate to the
operational processes of ASML, others are more
inherent to ASML’s business environment. It is
important to understand the nature of these risks and
the impact they may have on ASML’s business and
results of operations. Some of the most relevant risks
are described hereafter.
Cyclical Nature of the Semiconductor Industry
Historically, the semiconductor industry has been highly
cyclical and has experienced recurring periods of
oversupply, resulting in significantly reduced demand
for capital equipment, including wafer steppers and
Step & Scan systems. ASML believes that demand for
any particular future period is therefore difficult to
predict.
Downturns in the semiconductor industry and
related fluctuations in the demand for capital
equipment could materially adversely affect ASML’s
business and operating results. However, because
ASML believes that the long-term trend for the
semiconductor industry is positive, it is determined to
maintain a significant level of research and development
spending in order to maintain its competitive position.
Management does not intend to reduce this level of
spending in response to the short to medium term
cyclical nature of the semiconductor industry.
Sole or Limited Sources of Supply
ASML relies on outside vendors to manufacture the
components and subassemblies used in its wafer
steppers and Step & Scan systems. Generally, these
components and subassemblies are obtained from a
single supplier or a limited number of suppliers. In
particular, the number of systems ASML has been able
to produce from time to time has been limited by the
production capacity of Zeiss, the optics arm of Carl
Zeiss-Stiftung, a German foundation. Zeiss is ASML’s
sole supplier of lenses and other critical components
and is capable of producing these lenses only in limited
numbers. ASML believes that there are no alternative
suppliers for these components in the short to medium
term.
In addition to Zeiss’ position as ASML’s sole
supplier of lenses, the excimer laser illumination
systems for deep UV steppers and Step & Scan systems
are available from only a very limited number of
suppliers.
20
A S M L A N N U A L R E P O R T 19 9 9
The increase in accounts receivable, of EUR 245.7
million reflected the accelerated upturn in shipments of
systems towards the end of the second half year of 1999
and was mitigated by the effect of increasing short-term
liabilities and a decrease of inventories as compared to
1998.
Positive cash flows from operating activities came from
net income, depreciation and other non-cash items.
The decreased inventory level reflects the reduction in
work in process due to the increased shipments of
systems towards the end of the second half of 1999.
In 1998 and 1999 ASML paid EUR 33.7 million and
EUR 23.9 million in taxes, respectively. As of December
31, 1999, ASML had current tax liabilities of EUR 21.6
million, which will be paid in 2000.
ASML’s ratio of average accounts receivable to total net
sales was 30.8 and 27.7 percent in 1998 and 1999,
respectively. The ratio for 1998 includes the effect of
some extended payment terms to certain customers,
which decreased during 1999. ASML generally ships its
wafer steppers and Step & Scan systems on payment
terms requiring 90 percent of the sales price to be paid
within 30 to 60 days after shipment The remainder of
the purchase price for ASML’s wafer steppers and
Step & Scan systems is due after the completion of the
installation process and subsequent customer testing, a
process that can take an additional six to eight weeks.
Payment terms for the remaining 10 percent of the
purchase price generally reflect the same terms
applicable to the original 90 percent.
Consistent with the sales increases and inventory
reductions described above, ASML’s ratio of average
inventory to total net sales was 41.3 percent in 1998,
decreasing to 31.9 percent in 1999. ASML’s inventory
requirements are increased by the need to maintain
adequate customer spare parts for regional expansion,
the increasing size of its installed base.
Net cash used in investing activities was EUR 102.3
million and EUR 120.0 million in 1998 and 1999,
respectively. The 1998 amount primarily reflects the
expansion of ASML’s production and office facilities
and the related investments in property, plant and
equipment.
The 1999 amount primarily reflects the further
expansion of these facilities as well as investments in
own equipment (including prototypes, training and
demonstration systems).
ASML expects capital expenditure in 2000 to be
approximately EUR 200 million, of which approxi-
mately EUR 30 million relates to the further expansion
of ASML’s research and development, manufacturing
and office facilities.
Net cash provided by financing activities was EUR 272.9
million and EUR 535.5 million in 1998 and 1999,
respectively. In 1999, ASML issued 4.25% Convertible
Subordinated Notes with net proceeds of EUR 503.7
million. In 1998, ASML issued 2.5 percent Convertible
Subordinated Bonds with net proceeds of EUR 265.5
million. In addition, ASML received proceeds from the
exercise of stock options and the issuance of shares of
EUR 31.6 million, in 1999.
ASML has two lines of credit with two banks. Each line
provides up to EUR 113.4 million in available credit,
totaling EUR 226.8 million at December 31, 1999.
There were no outstanding borrowings on these
facilities at December 31, 1998 and 1999. ASML
intends to expand its credit facilities. Management
believes that its operating cash flows together with
existing cash balances and the availability of existing

23
M A N A G E M E N T ’ S D I S C U S S I O N A N D A N A LY S I S
claims of infringement. Any litigation could result in
substantial costs and a diversion of resources and could
have a material adverse effect on ASML’s business and
results of operations. ASML also may incur substantial
licensing or settlement costs where doing so would
strengthen or expand its intellectual property rights or
limit its exposure to intellectual property claims of
others.
Dependence on Manufacturing facilities
All of the manufacturing activities performed by ASML
currently take place in two separate clean room facilities
located in Veldhoven, The Netherlands. While a range
of disaster prevention measures have been installed to
ensure continued operation of these Facilities, a major
catastrophe could result in significant interruption of
ASML’s business operations and affect the Company’s
result of operations and financial position.
N E W A C C O U N T I N G P R O N O U N C E M E N T S
In June 1998, the FASB issued SFAS No. 133,
‘Accounting for Derivative Instruments and Hedging
Activities’, which establishes accounting and reporting
standards for derivative instruments and requires that
all derivatives be recognized generally at fair value in
the statements of financial position. This pronounce-
ment will become effective for the Company for the
year ending December 31, 2001. The Company has
not yet completed its analysis of the specific additional
information that may be required under this new stan-
dard.
Doug J. Dunn
CEO and Chairman of the Board of Management
ASM Lithography Holding N.V.
Veldhoven, January 19, 2000
22
A S M L A N N U A L R E P O R T 19 9 9
Technological Change; Importance of
Timely New Product Introduction
The semiconductor manufacturing industry is subject to
rapid technological change and new product
introductions and enhancements. The success of ASML
in developing new and enhanced lithography systems
and in enhancing its existing products depends upon a
variety of factors, including successful management of
its research and development program and timely
completion of product development and design relative
to its competitors. ASML’s ability to remain competitive
will depend in part upon its ability to develop these new
and enhanced lithography equipment and to introduce
these systems at competitive prices on a timely basis that
will enable customers to integrate these systems into the
planning and design of their new fabrication facilities.
ASML’s development and initial production and
installation of its systems and enhancements thereof
generally are accompanied by design and production
delays and related costs of a nature typically associated
with the introduction and full-scale production of very
complex capital equipment. While ASML expects and
plans for a corresponding learning curve effect in its
product development cycle, the time and expense
required to overcome these initial problems cannot be
predicted with precision.
Competition
ASML experiences intense competition worldwide,
particularly from Nikon Corporation (‘Nikon’) and
Canon Kabushika Kaisha (‘Canon’), both of which are
diversified manufacturing companies that may have
substantially greater financial, marketing, technical and
other resources than ASML. These greater resources
may enable Nikon and Canon to expand more rapidly.
ASML also believes that Nikon and Canon have a
further competitive advantage because of their
dominance in the Japanese market segment, which
represents a significant proportion of worldwide IC
production. Historically it has been difficult for non-
Japanese companies to penetrate this market. In
addition, adverse market conditions, industry over-
capacity or a decrease in the value of the Japanese yen
in relation to the euro can lead to intensified price-based
competition in those markets where ASML is most
active, thus affecting ASML’s results of operations and
financial position.
Intellectual Property Matters
Although there are no pending lawsuits against ASML
regarding infringement claims with respect to any
existing patents or any other intellectual property rights,
certain of ASML’s customers have received notices of
infringement from third parties alleging that the
manufacture of semiconductor products and/or the
equipment used to manufacture these products infringe
certain patents issued to those parties. ASML has been
advised that it could be obligated to pay damages to
customers if use of ASML’s lithography systems by
those customers were found to infringe any valid
patents issued to those parties. If these claims were
succesfull, ASML could be required to indemnify its
customers for some or all of any losses incurred as a
result of that infringement.
Although ASML attempts to protect its intellectual
property rights through patents, copyrights, trade
secrets and other measures, there can be no assurance
that ASML will be able to protect its technology
adequately, that competitors will not be able to develop
similar technology independently, that any of ASML’s
pending patent applications will be issued, or that
intellectual property laws will protect ASML’s
intellectual property rights. In addition litigation may be
necessary in order to enforce ASML’s intellectual
property rights to determine the validity and scope of
the proprietary rights of others or to defend against

25
Lithography, the artist innovating the world
Minimum DRAM DRAM Micro processor Micro processorfeature Price/Bit Performance Price/Transistor performancesize most in in in inadvanced USD millicents bit capacity USD cents system speeddevices
1970 10 Micron 492 1 Kbit 50 0.5 MHz
1980 1.3 Micron 15 64 Kbit 3.5 5 MHz
1990 0.5 Micron 0.48 4 Mbit 0.25 50 MHz
2000 0.18 Micron 0.015 256 Mbit 0.018 1 GHz
2010* 0.05 Micron 0.00047 64 Gbit 0.0013 10 GHz
K = Kilo = thousand 1000 Nanometer = 1 Micron = 0.001 millimeter
M = Mega = million 1 DRAM chip of 64 Mbit consists of 64,000,000 bits
G = Giga = billion 1 Bit is one memory element
* forecast
A . K . D E K O N I N G H ( 18 2 5 - 18 6 7 ) , W I N D M I L L N E A R D O R D R E C H T ,
S T O N E E T C H , R I J K S M U S E U M , A M S T E R D A M
But let’s start at the beginning
As in the creation of art the artist is key in obtaining
the end result. When in the 19th century the Dutch
artist De Koningh was creating his lithos he was pro-
ducing patterns in wax such that an etching process
could transfer the picture into stone. Since stone is
mostly silicon the principles of lithography for art or
for semiconductor are not all that different - the dif-
ferences are mostly matters of implementation.
Today the artists for the most diverse applications are
the lithography systems, patterning the structures in
silicon to create integrated circuits.
Society today is seeing rapid innovation in the elec-
tronics industry with many new products and services
coming on to the market every year. The rapid
improvements in the performance of these devices are
made possible by revolutions in the IC industry. Since
the beginning of IC production tremendous improve-
ments have been achieved in the performance and cost
per function of these devices.
T A B L E 1

Those improvements have allowed electronics applica-
tions to boom as can be seen around us every day.
The structure of an IC resembles that of a building
with multiple floors. Rooms compare to functional
components like transistors, the corridors and the
stairs to the interconnections between the components.
A further analogy exists in building the ICs as they are
built layer after layer (floor after floor). Lithography
plays the key role in defining the precise structures to
form the layers and hence the components.
The reason why the IC industry is able to innovate as
rapidly as it is lies in the reduction of the size of the
structures. This has caused the tremendous increase in
integration, as it became possible to pack more func-
tions in the same space. The reduction of size also
brought about an increase in performance (for instance
the speed of microprocessors). Last but not least, the
reduction helped lower cost price as shown in table 1.
F R O M E N D P R O D U C T S T O T H E
S M A L L E S T D E T A I L S I N T H E I C s
To build the integrated circuit components, numerous
layers of patterns have to be superimposed on top of
each other to obtain a three-dimensional structure.
Since this has to be done with an almost unimaginable
accuracy, extremely accurate positioning overlay is
required from the lithography systems. These accura-
cies are expressed in nanometers, which is a one-thou-
sandth of a micron or one-millionth of a millimeter.
To achieve economic viability in IC manufacturing,
this printing of the structures has to take place at a
very high speed. This means that basically all fields of
a silicon wafer have to be positioned and exposed in
slightly more than half a minute. One silicon wafer can
contain between 100 and 1000 identical ICs depending
on the device type and size.
In short, a lithography system has to combine the fol-
lowing key requirements: imaging of small structures;
overlay with the ability to accurately place the struc-
tures; and productivity, which in fact means high
throughput and processing speed.
To achieve this, lithography systems employ the most
advanced techniques with respect to optics, servo sys-
tems, measurement systems and real-time control soft-
ware and hardware. As mentioned earlier, future litho-
graphy systems will have to enable further reductions
of the device structures down to 0.05 micron or even
0.035 micron for the most advanced manufacturers.
Using light with shorter wavelengths, like a painter
who uses smaller brushes to paint the smaller details,
will accomplish this. Today, the most advanced devices
are made using light of wavelengths that are invisible
to the human eye, and the trend to further shorten
wavelengths will continue in the years ahead.
PA T T E R N I N G T H E
I C S T R U C T U R E S
26 27
C O R R E C T I M A G E PA T T E R N E D O N T H E WA F E R
M O D I F I E D I M A G E O N T H E M A S K
O P C I N P R A C T I C E :
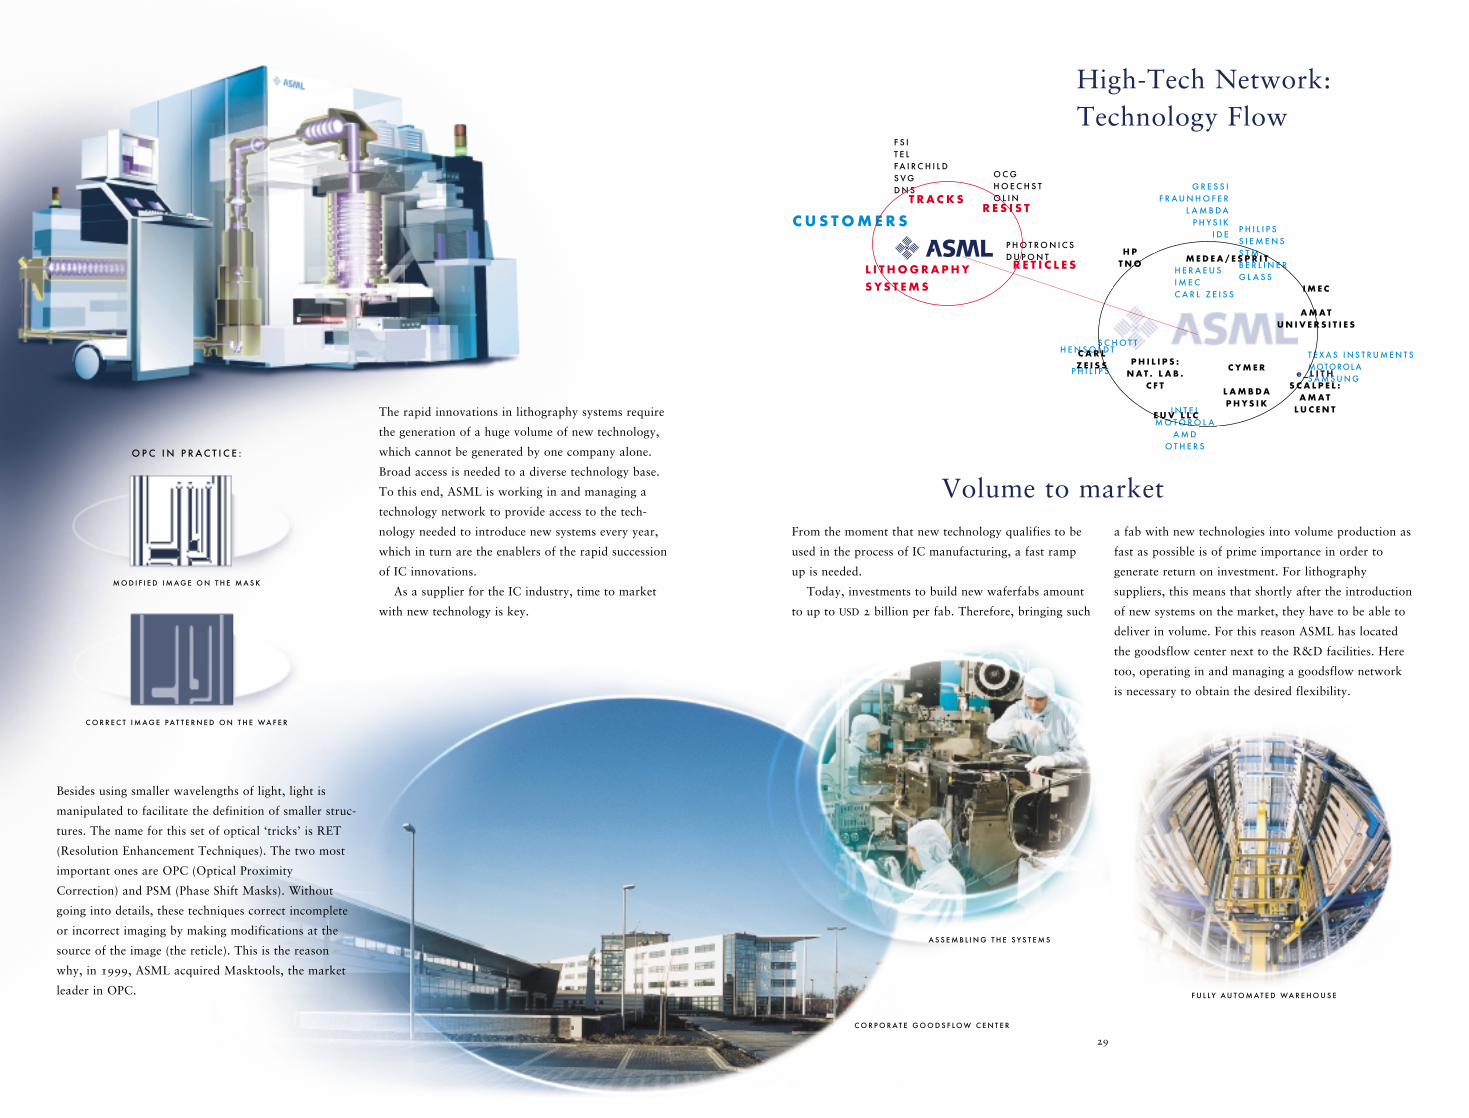
Besides using smaller wavelengths of light, light is
manipulated to facilitate the definition of smaller struc-
tures. The name for this set of optical ‘tricks’ is RET
(Resolution Enhancement Techniques). The two most
important ones are OPC (Optical Proximity
Correction) and PSM (Phase Shift Masks). Without
going into details, these techniques correct incomplete
or incorrect imaging by making modifications at the
source of the image (the reticle). This is the reason
why, in 1999, ASML acquired Masktools, the market
leader in OPC.
The rapid innovations in lithography systems require
the generation of a huge volume of new technology,
which cannot be generated by one company alone.
Broad access is needed to a diverse technology base.
To this end, ASML is working in and managing a
technology network to provide access to the tech-
nology needed to introduce new systems every year,
which in turn are the enablers of the rapid succession
of IC innovations.
As a supplier for the IC industry, time to market
with new technology is key.
From the moment that new technology qualifies to be
used in the process of IC manufacturing, a fast ramp
up is needed.
Today, investments to build new waferfabs amount
to up to USD 2 billion per fab. Therefore, bringing such
a fab with new technologies into volume production as
fast as possible is of prime importance in order to
generate return on investment. For lithography
suppliers, this means that shortly after the introduction
of new systems on the market, they have to be able to
deliver in volume. For this reason ASML has located
the goodsflow center next to the R&D facilities. Here
too, operating in and managing a goodsflow network
is necessary to obtain the desired flexibility.
C O R P O R A T E G O O D S F L O W C E N T E R
F U L LY A U T O M A T E D WA R E H O U S E
29
High-Tech Network:
Technology Flow
A S S E M B L I N G T H E S Y S T E M S
Volume to market
C U S T O M E R S
O C G H O E C H S T O L I N
H PT N O
P H I L I P S
S C H O T TH E N S O L D T
P H I L I P S S I E M E N S S T M B E R L I N E RG L A S S
G R E S S I F R A U N H O F E R
L A M B D AP H Y S I K
I D E
H E R A E U SI M E CC A R L Z E I S S
C A R LZ E I S S P H I L I P S :
N A T . L A B .C F T
M E D E A / E S P R I T
I M E C
A M A TU N I V E R S I T I E S
C Y M E R
L A M B D AP H Y S I K
P H O T R O N I C SD U P O N T
R E T I C L E S
R E S I S TT R A C K S
F S IT E L F A I R C H I L D S V G D N S
T E X A S I N S T R U M E N T SMOTOROL AS A M S U N G
I N T E LM O T O R O L A
A M DO T H E R S
E U V L L C
L I T H O G R A P H YS Y S T E M S
e _ L I T HS C A L P E L :
A M A TL U C E N T

3130
From the moment the lithography tools are up and
running in the customer’s environment it is essential
that these machines generate as much output as possi-
ble. Therefore efficient customer support should first
be focused on keeping the machines up and running.
Secondly, the focus should be on helping the customers
to optimize the use of the machines on the typical
process-machine interface. This application support is
becoming more and more important as the complexity
of machines and processes increases. This requires a
worldwide network of service offices and communica-
tion links to the central headquarters with the machine
specialist. In this way customer support operates as a
worldwide web.
ASML Special Applications focuses on industries with
lithography requirements differing from those of main-
stream applications such as DRAM and microproces-
sor production and provides customized imaging solu-
tions utilizing ASML’s technology base. The focus
areas include GaAs, Thin Film Head and Analog IC
lithography applications, which enables cost efficient
production of consumer devices such as handheld
phones, hard disk storage units in personal computers,
and devices to optimize battery usage of mobile
devices.
High value is given to the need of customers who
operate mature lithography equipment and want to
extend the economic life of their production facilities.
Options & accessories, upgrades, certified pre-owned
ASML equipment, as well as financial and consulting
services are offered to realize this.
Value of Ownership
All the above come together in ASML’s superior Value
of Ownership offer. Customers can improve their
competitiveness using ASML products. ASML offers
the customer the latest technology available for volume
production at the time the market needs it, which is
supported long term by a whole network of partners,
each of which is leading in its own area of expertise.
ASML products can be installed and ramped up to
production quickly and ASML offers an extensive
customer and application support network. Combine
these factors and you have a Value of Ownership
proposition that is hard to resist.
Supporting the customers
Broad Market Coverage
ASML, the spider in the web
of strategic partners
Suppliers
Technology
partners
Customers
Industry
partners
Broad Market
Coverage

0.15-0.13
0.15
0.18
0.25
0.28
0.3
0.4
<
ASML’s product family
Suitable for patterning structures with minimum feature size in microns
PA S 5 5 0 0 / 7 0 0
PA S 5 5 0 0 / 9 0 0
PA S 5 5 0 0 / 2 5 0
PA S 5 5 0 0 / 4 0 0
PA S 5 5 0 0 / 3 0 0
PA S 5 5 0 0 / 5 5 0
PA S 5 5 0 0 / 2 2
PA S 5 5 0 0 / 10 0
32

A N N U A L R E P O R T
1999

System Overview PAS 5500/900
ASML Mission
Providing leading edge
imaging solutions
to continuously improve
customers’ global
competitiveness
Financial Statements 1999

C O N S O L I D A T E D F I N A N C I A L S T A T E M E N T S
35 Consolidated Statements of Operations
35 Consolidated Statements of Comprehensive Income
36 Consolidated Balance Sheets
37 Consolidated Statements of Shareholders’ Equity
38 Consolidated Statements of Cash Flows
39 Notes to the Consolidated Financial Statements
58 Independent Auditors’ Report
S T A T U T O R Y F I N A N C I A L S T A T E M E N T S
59 Statutory Balance Sheets
60 Statutory Statements of Operations
61 Notes to the Statutory Financial Statements
62 Additional Information
65 Independent Auditors’ Report
F I N A N C I A L S T A T E M E N T S 19 9 9
34

35
Consolidated Statements of Operations
For the year ended December 31 1997 1998 1999 1999
(Amounts in thousands, except per share data) EUR EUR EUR USD
Net product sales 771,044 722,308 1,133,042 1,140,111
Net service sales 46,908 56,888 64,448 64,850
Total net sales 817,952 779,196 1,197,490 1,204,961
Cost of product sales 431,370 427,344 735,178 739,764
Cost of service sales 42,890 54,244 62,862 63,255
Total cost of sales 474,260 481,588 798,040 803,019
Gross profit on sales 343,692 297,608 399,450 401,942
Research and development costs 93,136 144,651 173,967 175,052
Research and development credits (13,613) (29,965) (36,128) (36,353)
Selling, general and administrative expenses 57,611 94,210 140,182 141,056
Operating income 206,558 88,712 121,429 122,187
Gain on sale of marketable securities 14,130 - - -
Interest income 1,047 6,865 11,479 11,550
Interest expense (332) (5,647) (14,629) (14,720)
Income before income taxes 221,403 89,930 118,279 119,017
Provision for income taxes 72,109 27,930 37,529 37,763
Net income 149,294 62,000 80,750 81,254
Basic net income per ordinary share 1.08 0.45 0.58 0.58
Diluted net income per ordinary share 1.08 0.45 0.58 0.58
Number of ordinary shares used in computing
per share amounts (in thousands):
Basic 138,000 138,167 138,733
Diluted 138,798 139,032 140,113
Consolidated Statements of Comprehensive Income
For the year ended December 31 1997 1998 1999 1999
(Amounts in thousands) EUR EUR EUR USD
Net income 149,294 62,000 80,750 81,254
Foreign currency translation 1,454 (1,255) (1,320) (1,328)
RR EE CC LL AA SS SS II FF II CC AA TT II OO NN AA DD JJ UU SS TT MM EE NN TT SS ::
Gains included in net income (8,856) 0 0 0
Deferred compensation expense 3,403 0 0 0
Comprehensive income 145,295 60,745 79,430 79,926
Prior year balances were restated from guilders into euros using the fixed exchange rate as of January 1st 1999 (EUR 1.00 = NLG 2.20371). See Note 1 to the
Consolidated Financial Statements.
See Notes to the Consolidated Financial Statements.
F I N A N C I A L S T A T E M E N T S 19 9 9
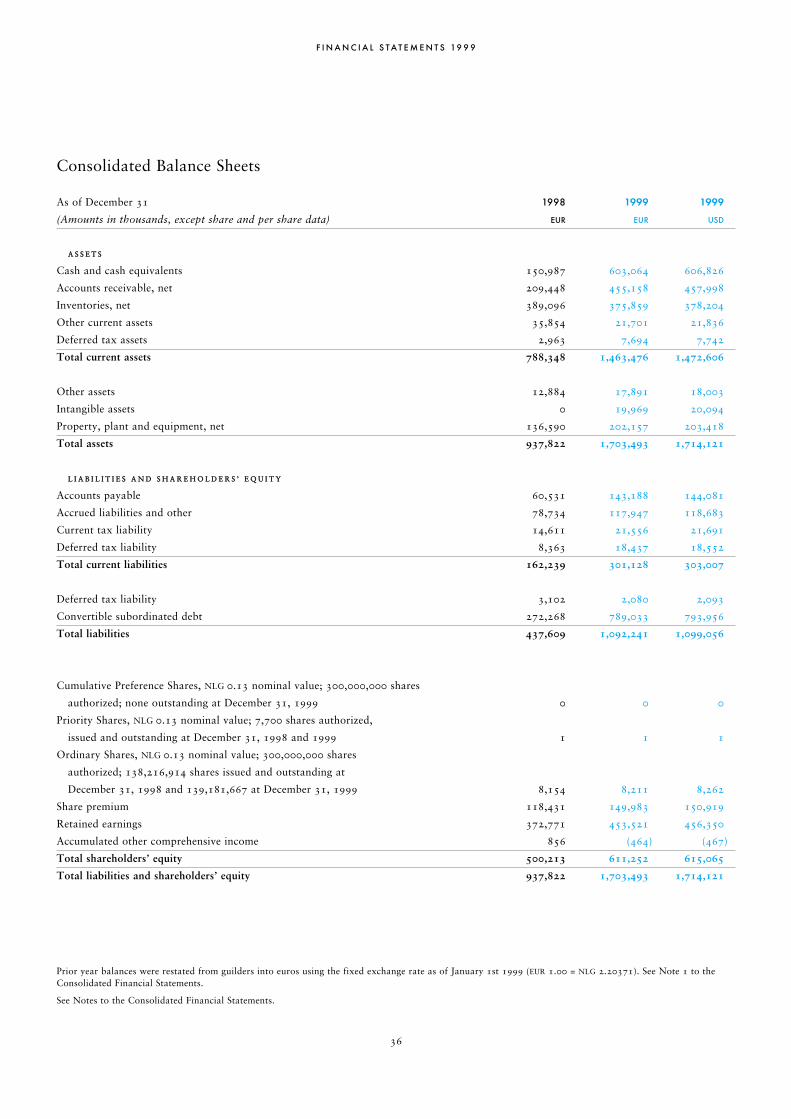
36
Consolidated Balance Sheets
As of December 31 1998 1999 1999
(Amounts in thousands, except share and per share data) EUR EUR USD
AA SS SS EE TT SS
Cash and cash equivalents 150,987 603,064 606,826
Accounts receivable, net 209,448 455,158 457,998
Inventories, net 389,096 375,859 378,204
Other current assets 35,854 21,701 21,836
Deferred tax assets 2,963 7,694 7,742
Total current assets 788,348 1,463,476 1,472,606
Other assets 12,884 17,891 18,003
Intangible assets 0 19,969 20,094
Property, plant and equipment, net 136,590 202,157 203,418
Total assets 937,822 1,703,493 1,714,121
LL II AA BB II LL II TT II EE SS AA NN DD SS HH AA RR EE HH OO LL DD EE RR SS ’’ EE QQ UU II TT YY
Accounts payable 60,531 143,188 144,081
Accrued liabilities and other 78,734 117,947 118,683
Current tax liability 14,611 21,556 21,691
Deferred tax liability 8,363 18,437 18,552
Total current liabilities 162,239 301,128 303,007
Deferred tax liability 3,102 2,080 2,093
Convertible subordinated debt 272,268 789,033 793,956
Total liabilities 437,609 1,092,241 1,099,056
Cumulative Preference Shares, NLG 0.13 nominal value; 300,000,000 shares
authorized; none outstanding at December 31, 1999 0 0 0
Priority Shares, NLG 0.13 nominal value; 7,700 shares authorized,
issued and outstanding at December 31, 1998 and 1999 1 1 1
Ordinary Shares, NLG 0.13 nominal value; 300,000,000 shares
authorized; 138,216,914 shares issued and outstanding at
December 31, 1998 and 139,181,667 at December 31, 1999 8,154 8,211 8,262
Share premium 118,431 149,983 150,919
Retained earnings 372,771 453,521 456,350
Accumulated other comprehensive income 856 (464) (467)
Total shareholders’ equity 500,213 611,252 615,065
Total liabilities and shareholders’ equity 937,822 1,703,493 1,714,121
Prior year balances were restated from guilders into euros using the fixed exchange rate as of January 1st 1999 (EUR 1.00 = NLG 2.20371). See Note 1 to the
Consolidated Financial Statements.
See Notes to the Consolidated Financial Statements.
F I N A N C I A L S T A T E M E N T S 19 9 9
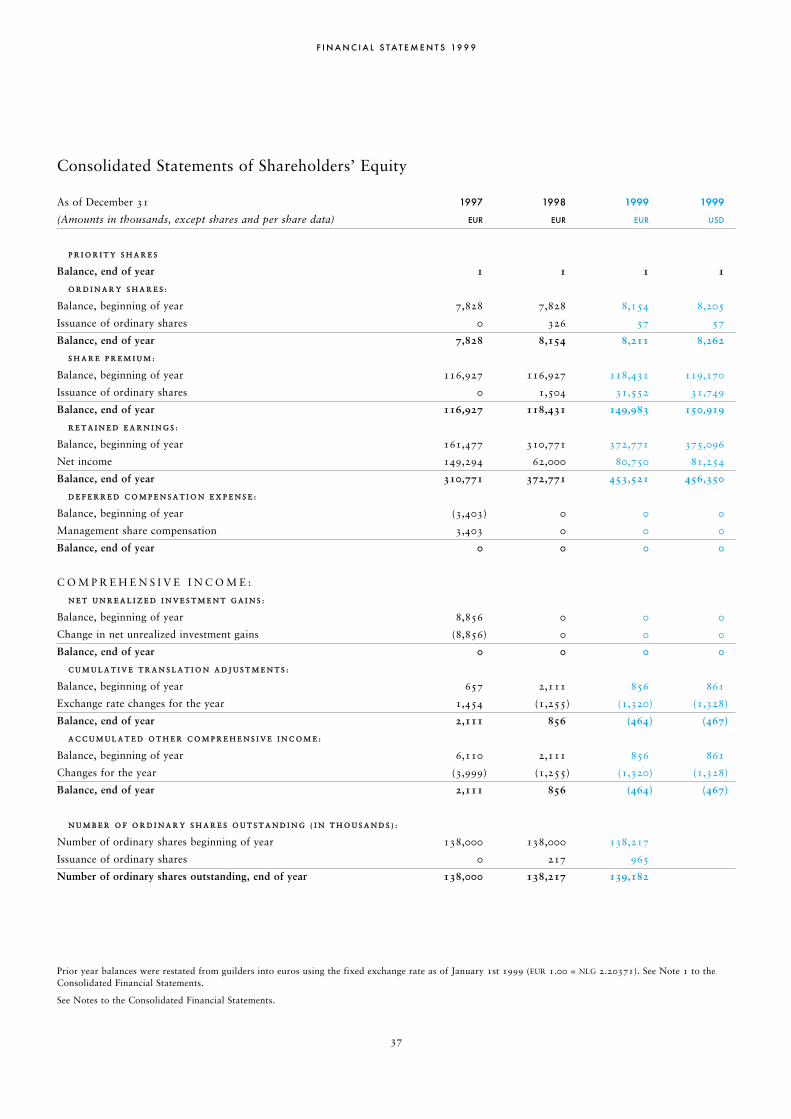
37
Consolidated Statements of Shareholders’ Equity
As of December 31 1997 1998 1999 1999
(Amounts in thousands, except shares and per share data) EUR EUR EUR USD
PP RR II OO RR II TT YY SS HH AA RR EE SS
Balance, end of year 1 1 1 1
OO RR DD II NN AA RR YY SS HH AA RR EE SS ::
Balance, beginning of year 7,828 7,828 8,154 8,205
Issuance of ordinary shares 0 326 57 57
Balance, end of year 7,828 8,154 8,211 8,262
SS HH AA RR EE PP RR EE MM II UU MM ::
Balance, beginning of year 116,927 116,927 118,431 119,170
Issuance of ordinary shares 0 1,504 31,552 31,749
Balance, end of year 116,927 118,431 149,983 150,919
RR EE TT AA II NN EE DD EE AA RR NN II NN GG SS ::
Balance, beginning of year 161,477 310,771 372,771 375,096
Net income 149,294 62,000 80,750 81,254
Balance, end of year 310,771 372,771 453,521 456,350
DD EE FF EE RR RR EE DD CC OO MM PP EE NN SS AA TT II OO NN EE XX PP EE NN SS EE ::
Balance, beginning of year (3,403) 0 0 0
Management share compensation 3,403 0 0 0
Balance, end of year 0 0 0 0
C O M P R E H E N S I V E I N C O M E :
NN EE TT UU NN RR EE AA LL II ZZ EE DD II NN VV EE SS TT MM EE NN TT GG AA II NN SS ::
Balance, beginning of year 8,856 0 0 0
Change in net unrealized investment gains (8,856) 0 0 0
Balance, end of year 0 0 0 0
CC UU MM UU LL AA TT II VV EE TT RR AA NN SS LL AA TT II OO NN AA DD JJ UU SS TT MM EE NN TT SS ::
Balance, beginning of year 657 2,111 856 861
Exchange rate changes for the year 1,454 (1,255) (1,320) (1,328)
Balance, end of year 2,111 856 (464) (467)
AA CC CC UU MM UU LL AA TT EE DD OO TT HH EE RR CC OO MM PP RR EE HH EE NN SS II VV EE II NN CC OO MM EE ::
Balance, beginning of year 6,110 2,111 856 861
Changes for the year (3,999) (1,255) (1,320) (1,328)
Balance, end of year 2,111 856 (464) (467)
NN UU MM BB EE RR OO FF OO RR DD II NN AA RR YY SS HH AA RR EE SS OO UU TT SS TT AA NN DD II NN GG (( II NN TT HH OO UU SS AA NN DD SS )) ::
Number of ordinary shares beginning of year 138,000 138,000 138,217
Issuance of ordinary shares 0 217 965
Number of ordinary shares outstanding, end of year 138,000 138,217 139,182
Prior year balances were restated from guilders into euros using the fixed exchange rate as of January 1st 1999 (EUR 1.00 = NLG 2.20371). See Note 1 to the
Consolidated Financial Statements.
See Notes to the Consolidated Financial Statements.
F I N A N C I A L S T A T E M E N T S 19 9 9

38
Consolidated Statements of Cash Flows
For the year ended December 31 1997 1998 1999 1999
(Amounts in thousands) EUR EUR EUR USD
CC AA SS HH FF LL OO WW SS FF RR OO MM OO PP EE RR AA TT II NN GG AA CC TT II VV II TT II EE SS ::
Net income 149,294 62,000 80,750 81,254
Adjustments to reconcile net income to net cash flows
from operating activities:
Depreciation and amortization 16,066 34,014 42,516 42,781
Realized gain on sale of marketable securities (14,130) 0 0 0
Deferred income taxes 3,715 (3,895) 4,322 4,349
Management share compensation 3,403 0 0 0
Changes in assets and liabilities that provided (used) cash:
Accounts receivable (96,775) 60,809 (245,710) (247,243)
Inventories (101,393) (135,297) 13,237 13,320
Other assets (9,697) (13,404) 14,152 14,240
Accrued liabilities (8,505) 2,963 39,213 39,458
Accounts payable 44,765 (58,990) 82,657 83,173
Income tax payable (2,816) (1,852) 6,945 6,988
Net cash provided by (used in) operating activities (16,074) (53,652) 38,082 38,320
CC AA SS HH FF LL OO WW SS FF RR OO MM II NN VV EE SS TT II NN GG AA CC TT II VV II TT II EE SS ::
Proceeds from sale of marketable securities 15,964 0 0 0
Purchases of property, plant and equipment (41,438) (98,547) (109,787) (110,472)
Proceeds from sale of property, plant and equipment 12,531 3,056 2,889 2,907
Purchase of intangible assets 0 0 (21,020) (21,151)
Disbursements for loans 0 (6,807)
Other investing activities 0 0 7,858 7,907
Net cash used in investing activities (12,943) (102,298) (120,060) (120,809)
CC AA SS HH FF LL OO WW SS FF RR OO MM FF II NN AA NN CC II NN GG AA CC TT II VV II TT II EE SS ::
Proceeds from issuance of convertible subordinated loans 0 272,268 516,765 520,000
Payment of underwriting commission 0 (6,807) (12,860) (12,951)
Proceeds from (repayment of) advances from customers (1,815) 1,375 0 0
Proceeds from advances to supplier 5,583 4,181 0 0
Proceeds from issuance of shares and stock options 0 1,833 31,609 31,806
Net cash provided by financing activities 3,768 272,850 535,514 538,855
Effect of changes in exchange rates on cash 511 (865) (1,459) (1,468)
Net increase (decrease) in cash and cash equivalents (24,738) 116,035 452,077 454,898
Cash and cash equivalents at beginning of the year 59,690 34,952 150,987 151,928
Cash and cash equivalents at end of the year 34,954 150,987 603,064 606,826
SS UU PP PP LL EE MM EE NN TT AA LL DD II SS CC LL OO SS UU RR EE SS OO FF CC AA SS HH FF LL OO WW II NN FF OO RR MM AA TT II OO NN ::
Purchase of intangible assets during fiscal year 1999
Fair value of assets acquired through the issuance of Ordinary Shares (21,020) (21,151)
Cash paid for:
Interest 333 887 6,807 6,849
Taxes 70,950 33,707 23,863 24,012
Prior year balances were restated from guilders into euros using the fixed exchange rate as of January 1st 1999 (EUR 1.00 = NLG 2.20371). See Note 1 to the
Consolidated Financial Statements.
See Notes to the Consolidated Financial Statements.
F I N A N C I A L S T A T E M E N T S 19 9 9
Notes to the Consolidated Financial Statements
1 . S U M M A R Y O F S I G N I F I C A N T A C C O U N T I N G P O L I C I E S
Basis of presentation
The accompanying consolidated financial statements include the financial statements of ASM Lithography Holding N.V.
Eindhoven, The Netherlands (the ‘Company’), and its consolidated subsidiaries. ASML, operating under a single
management, is a worldwide business engaged in the development, production, marketing, sale and servicing of advanced
lithography systems, consisting of wafer steppers and Step & Scan systems for the semiconductor industry. ASML’s principal
operations are in The Netherlands, the United States of America and Asia. At December 31, 1998, Royal Philips Electronics
(‘Philips’) owned 23.9 percent of the Company’s shares and at December 31, 1999, Royal Philips Electronics owned
23.7 percent of the Company’s shares. In addition, one of the five members of the Company’s Supervisory Board is a Philips
employee.
ASML follows accounting principles generally accepted in the United States of America (‘U.S. GAAP’). Effective beginning
of fiscal year 1999, ASML changed its reporting currency from Dutch guilders to euros. Prior year balances have been
restated based on the fixed exchange rate as of January 1st, 1999 (EUR 1.00 to NLG 2.20371). The comparative balances
reported in euros depict the same trends as would have been presented if ASML had continued to present balances in Dutch
guilders. Balances for periods prior to January 1st, 1999 are not comparable to the balances of other companies that report
in euros having restated amounts from a different currency than Dutch guilders. The accompanying consolidated financial
statements are stated in thousands of euros (‘EUR’) except that, solely for the convenience of the reader, certain euro amounts
presented as of and for the year ended December 31, 1999 have been translated into United States (‘U.S.’) dollars (‘USD’)
using the exchange rate in effect on December 31, 1999 of USD 1.00 = EUR 0.9938. These translations should not be con-
strued as representations that the euro amounts could be converted into U.S. dollars at that rate.
Additional disclosures have been included in the Notes to the Consolidated Financial Statements to conform these consoli-
dated financial statements to requirements under the Netherlands Civil Code. Such disclosures are in addition to the disclo-
sures presented under U.S. GAAP.
Principles of consolidation
The consolidated financial statements include the accounts of ASM Lithography Holding N.V. and all of its majority-owned
subsidiaries. All significant intercompany profits, transactions and balances have been eliminated in consolidation.
Foreign currency
Foreign currency translation
The financial information for subsidiaries outside The Netherlands is measured using local currencies as the functional cur-
rency. Transactions between ASML and its U.S. subsidiary relating to sales of products are denominated in U.S. dollars.
Assets and liabilities are translated into euros at the exchange rate in effect on the respective balance sheet dates. Income and
expenses are translated into euros based on the average rate of exchange for the corresponding period. Exchange rate differ-
ences resulting from the translation of the net investment in subsidiaries outside The Netherlands into euros are accounted
for directly in the shareholders’ equity section of the balance sheet. Exchange rate differences due to transactions in foreign
currencies are reflected in the consolidated statements of operations.
39
F I N A N C I A L S T A T E M E N T S 19 9 9

Foreign currency management
ASML enters into foreign exchange contracts from time to time as a hedge against accounts
payable denominated in foreign currencies. Changes in market value of foreign exchange con-
tracts are recognized as gains or losses and are intended to offset foreign exchange gains or
losses on these accounts payable. A change in the market value of a foreign exchange contract
that is a hedge of a firm commitment is deferred and included in the valuation of the completed
purchase transaction. The measurement date for hedged purchase transactions is the date when
the purchased goods are delivered. Premiums and discounts relating to forward exchange
contracts that hedge foreign currency exposures are amortized over the term of the forward
contracts and are charged to operating income. ASML attempts to minimize the counter-party
credit risk associated with the foreign exchange forward contracts and currency option arrange-
ments to which it is a party by selecting counter-parties that it believes are creditworthy.
The currency exposure relating to the US-dollar denominated convertible loan is naturally
hedged by the related US-dollar assets.
Except for U.S. service sales, ASML’s sales are primarily denominated in Dutch guilders,
ASML’s functional currency, thus eliminating its significant currency exposure for sales in
foreign currency. The exposure from U.S. sales denominated in U.S. dollars is naturally
hedged by the related U.S. dollar-denominated costs. Currency exposure relating to
participating Economic and Monetary Union (‘EMU’) member countries has been eliminated
as of January 1st, 1999 with the introduction of the euro.
Cash and cash equivalents
Cash and cash equivalents consist primarily of highly liquid investments, such as bank
deposits, with insignificant interest rate risk and original maturities of three months or less at
the date of acquisition.
Inventories
Inventories are stated at the lower of cost (first-in, first-out method) or market value. Cost
includes net prices paid for materials purchased, charges for freight and customs duties, pro-
duction labor cost and factory overhead. Allowances are made for slow moving, obsolete or
unsaleable stock.
Income taxes
Deferred income taxes are provided for the temporary differences between the carrying
amounts used for financial reporting purposes and the tax basis of assets and liabilities at the
relevant balance sheet date. Deferred tax amounts are calculated at the rates of taxation
applicable in the several jurisdictions in which ASML operates.
Intangible assets
Intangible assets include intellectual property rights that are valued at cost and are amortized
straight-line over the estimated useful live of 10 years. The company periodically reviews the car-
rying value of the intangible assets and impairments are recognized when the expected future
operating cash flows derived from such intangible assets are less than their carrying value.
40
F I N A N C I A L S T A T E M E N T S 19 9 9
Property, plant and equipment
Property, plant and equipment are stated at cost less accumulated depreciation and amortiza-
tion. Depreciation is calculated using the straight-line method based on the estimated useful
lives of the related assets. In the case of leasehold improvements, the estimated useful lives of
the related assets do not exceed the remaining term of the corresponding lease. The following
table presents the assigned economic lives of ASML’s property, plant and equipment:
Category Assigned economic life
Machinery and equipment 2 – 5 years
Office furniture and equipment 3 – 5 years
Leasehold improvements 5 – 10 years
ASML also leases certain buildings, machinery and equipment under arrangements accounted
for as operational leases.
Internal and external costs associated with the purchase and/or development of internally
used software are capitalized in accordance with Statement of Position No. 98-1, ‘Accounting
for the Costs of Computer Software Developed or Obtained for Internal Use’. These costs are
amortized straight-line over periods of related benefit ranging primarily from two to five
years.
Recognition of revenues, income and expenses
ASML’s practice is to recognize revenues (and related cost of sales) from sales of products
when goods are shipped, the time at which the risks and rewards of ownership transfer to
customers. Shipment occurs after a customer accepts the product at ASML’s premises. No sig-
nificant obligations remain after the sale is completed and a customer’s sole recourse against
ASML is to enforce its obligations relating to installation and warranty.
Costs for these obligations relating to installation, which are insignificant, and for warran-
ty expenses (see Cost of sales, below) are also accrued at the time of shipment when
corresponding sales revenues are recognized. Revenues from services are recognized when
performed. Revenue from prepaid service contracts is recognized over the life of the contract.
Advance payments received from customers are deferred and recognized when the products
have been shipped. Operating expenses and other income and expense items are recognized in
the income statement as incurred or earned.
Cost of sales
Cost of sales consists of direct product costs such as materials, labor, cost of warranty and
depreciation. Repayments of certain technical development credits are also charged to cost of
sales (see Research and development credits, below). ASML accrues installation and warranty
expenses for every system shipped. The amount accrued is based on actual historical expenses
incurred and on estimated probable future expenses related to current sales. In addition,
ASML accrues for incidental expenses relating to specific customer issues that are not formal-
41
F I N A N C I A L S T A T E M E N T S 19 9 9
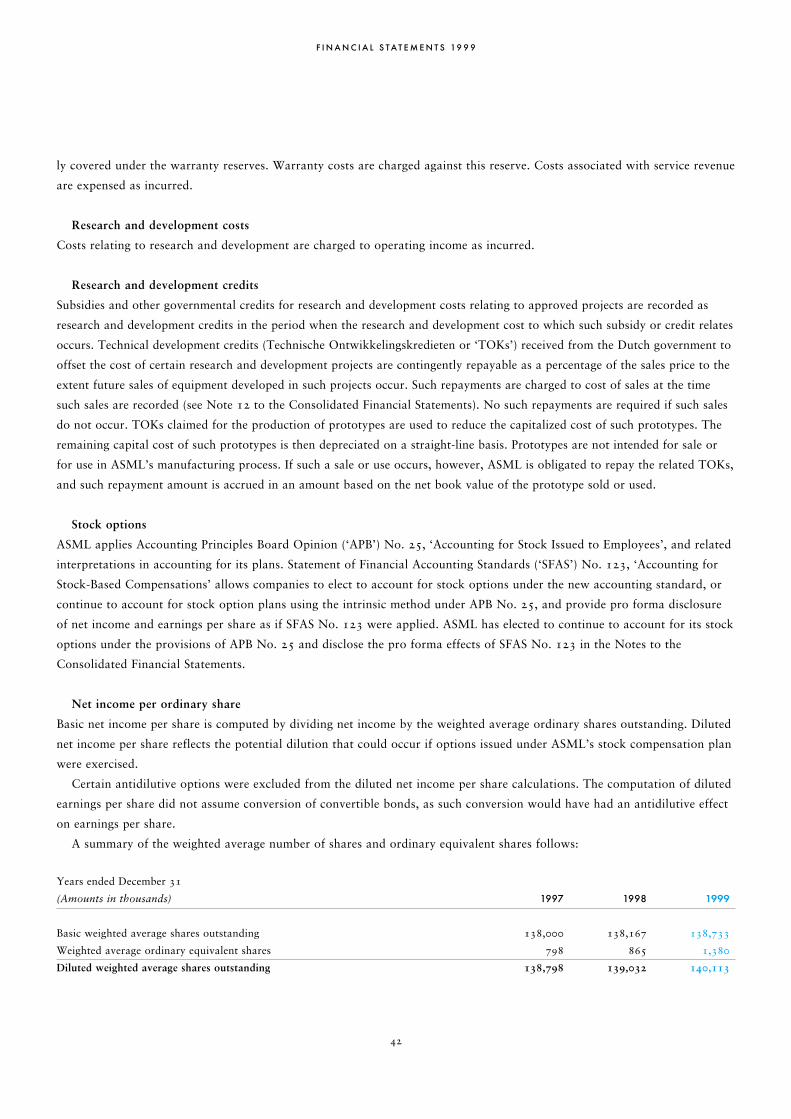
ly covered under the warranty reserves. Warranty costs are charged against this reserve. Costs associated with service revenue
are expensed as incurred.
Research and development costs
Costs relating to research and development are charged to operating income as incurred.
Research and development credits
Subsidies and other governmental credits for research and development costs relating to approved projects are recorded as
research and development credits in the period when the research and development cost to which such subsidy or credit relates
occurs. Technical development credits (Technische Ontwikkelingskredieten or ‘TOKs’) received from the Dutch government to
offset the cost of certain research and development projects are contingently repayable as a percentage of the sales price to the
extent future sales of equipment developed in such projects occur. Such repayments are charged to cost of sales at the time
such sales are recorded (see Note 12 to the Consolidated Financial Statements). No such repayments are required if such sales
do not occur. TOKs claimed for the production of prototypes are used to reduce the capitalized cost of such prototypes. The
remaining capital cost of such prototypes is then depreciated on a straight-line basis. Prototypes are not intended for sale or
for use in ASML’s manufacturing process. If such a sale or use occurs, however, ASML is obligated to repay the related TOKs,
and such repayment amount is accrued in an amount based on the net book value of the prototype sold or used.
Stock options
ASML applies Accounting Principles Board Opinion (‘APB’) No. 25, ‘Accounting for Stock Issued to Employees’, and related
interpretations in accounting for its plans. Statement of Financial Accounting Standards (‘SFAS’) No. 123, ‘Accounting for
Stock-Based Compensations’ allows companies to elect to account for stock options under the new accounting standard, or
continue to account for stock option plans using the intrinsic method under APB No. 25, and provide pro forma disclosure
of net income and earnings per share as if SFAS No. 123 were applied. ASML has elected to continue to account for its stock
options under the provisions of APB No. 25 and disclose the pro forma effects of SFAS No. 123 in the Notes to the
Consolidated Financial Statements.
Net income per ordinary share
Basic net income per share is computed by dividing net income by the weighted average ordinary shares outstanding. Diluted
net income per share reflects the potential dilution that could occur if options issued under ASML’s stock compensation plan
were exercised.
Certain antidilutive options were excluded from the diluted net income per share calculations. The computation of diluted
earnings per share did not assume conversion of convertible bonds, as such conversion would have had an antidilutive effect
on earnings per share.
A summary of the weighted average number of shares and ordinary equivalent shares follows:
Years ended December 31
(Amounts in thousands) 1997 1998 1999
Basic weighted average shares outstanding 138,000 138,167 138,733
Weighted average ordinary equivalent shares 798 865 1,380
Diluted weighted average shares outstanding 138,798 139,032 140,113
42
F I N A N C I A L S T A T E M E N T S 19 9 9
Excluded from the diluted weighted average share outstanding calculation are Cumulative Preference Shares contingently
issuable to the preference share foundation as they represent a different class of stock than the Ordinary Shares. See further
discussion in Note 18 to the Consolidated Financial Statements.
Use of estimates
The preparation of ASML’s consolidated financial statements in conformity with generally accepted accounting principles
necessarily requires Management to make estimates and assumptions that affect the reported amounts of assets and liabilities
and disclosure of contingent assets and liabilities at the balance sheet dates and the reported amounts of revenue and expense
during the reported periods. Actual results could differ from those estimates.
Comprehensive income
ASML has applied the requirements of SFAS No. 130, ‘Reporting Comprehensive Income’, in its consolidated statements of
comprehensive income and consolidated statements of shareholders’ equity
Segment disclosure
In June 1997, FASB issued SFAS No. 131, ‘Disclosures about Segments of an Enterprise and Related Information’. SFAS
No.131 has redefined how operating segments are determined and requires qualitative disclosures of certain financial and
descriptive information about a company’s operating segments. As ASML operates in only one segment, and in three general
geographic locations, ASML defines its operational segment by geographical location (see Note 15 to the Consolidated
Financial Statements).
Recent accounting pronouncements
In June 1998, the FASB issued SFAS No. 133, ‘Accounting for Derivative Instruments and Hedging Activities’, which
establishes the definition of derivative instruments and the related fair value reporting requirements. This additional
reporting requirement will be adopted by ASML for the year ending December 31, 2001. ASML is currently investigating the
impact and specific additional information that will be required under this new standard.
43
F I N A N C I A L S T A T E M E N T S 19 9 9

2 . A C C O U N T S R E C E I VA B L E
Accounts receivable consist of the following:
December 31 1998 1999
Accounts receivable 208,685 428,552
Accounts receivable – Philips 763 26,606
Total accounts receivable, net 209,448 455,158
3 . I N V E N T O R I E S
Inventories consist of the following:
December 31 1998 1999
Raw materials 147,674 163,575
Work-in-process 142,941 122,740
Finished products 122,615 131,209
Allowance for obsolescence (24,134) (41,665)
Total inventories, net 389,096 375,859
4 . I N T A N G I B L E A S S E T S
In July 1999 ASML obtained the intellectual proprietary rights relating to Optical Proximity Correction technology. This
technology enhances leading edge lithography systems to accurately and reliably print line widths below 0.2 micron. These
rights have been valued at cost and are amortized straight-line over the estimated useful live of 10 years.
Intellectual
Property
CC OO SS TT ::
Balance, January 1, 1999 0
Additions 21,020
Balance, December 31, 1999 21,020
AA CC CC UU MM UU LL AA TT EE DD DD EE PP RR EE CC II AA TT II OO NN ::
Balance, January 1, 1999 0
Amortization (1,051)
Balance, December 31, 1999 (1,051)
NN EE TT BB OO OO KK VV AA LL UU EE ::
December 31, 1999 19,969
44
F I N A N C I A L S T A T E M E N T S 19 9 9
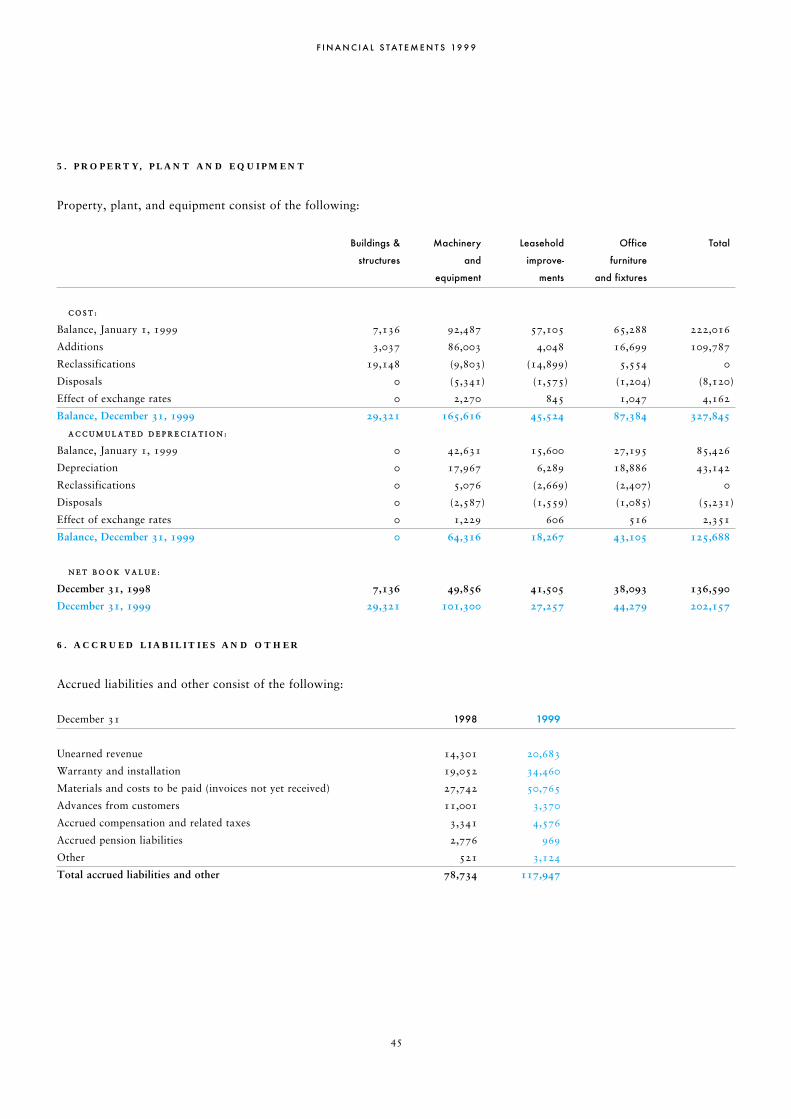
5 . P R O P E R T Y, P L A N T A N D E Q U I P M E N T
Property, plant, and equipment consist of the following:
Buildings & Machinery Leasehold Office Total
structures and improve- furniture
equipment ments and fixtures
CC OO SS TT ::
Balance, January 1, 1999 7,136 92,487 57,105 65,288 222,016
Additions 3,037 86,003 4,048 16,699 109,787
Reclassifications 19,148 (9,803) (14,899) 5,554 0
Disposals 0 (5,341) (1,575) (1,204) (8,120)
Effect of exchange rates 0 2,270 845 1,047 4,162
Balance, December 31, 1999 29,321 165,616 45,524 87,384 327,845
AA CC CC UU MM UU LL AA TT EE DD DD EE PP RR EE CC II AA TT II OO NN ::
Balance, January 1, 1999 0 42,631 15,600 27,195 85,426
Depreciation 0 17,967 6,289 18,886 43,142
Reclassifications 0 5,076 (2,669) (2,407) 0
Disposals 0 (2,587) (1,559) (1,085) (5,231)
Effect of exchange rates 0 1,229 606 516 2,351
Balance, December 31, 1999 0 64,316 18,267 43,105 125,688
NN EE TT BB OO OO KK VV AA LL UU EE ::
December 31, 1998 7,136 49,856 41,505 38,093 136,590
December 31, 1999 29,321 101,300 27,257 44,279 202,157
6 . A C C R U E D L I A B I L I T I E S A N D O T H E R
Accrued liabilities and other consist of the following:
December 31 1998 1999
Unearned revenue 14,301 20,683
Warranty and installation 19,052 34,460
Materials and costs to be paid (invoices not yet received) 27,742 50,765
Advances from customers 11,001 3,370
Accrued compensation and related taxes 3,341 4,576
Accrued pension liabilities 2,776 969
Other 521 3,124
Total accrued liabilities and other 78,734 117,947
45
F I N A N C I A L S T A T E M E N T S 19 9 9
7 . L O N G - T E R M D E B T A N D B O R R O W I N G A R R A N G E M E N T S
Long-term debt
In April 1998, ASML completed an offering of EUR 272 million principal amount of its
2.5 percent Convertible Subordinated Bonds due 2005, with interest payable annually com-
mencing April 9, 1999. The bonds are convertible into 4,662,360 ordinary shares at
EUR 58.40 per share at any time prior to maturity. At any time after April 9, 2001, the bonds
are redeemable at the option of ASML, in whole or in part, at 100 percent of the principal
amount, together with accrued interest. These bonds were issued in an offering not registered
or required to be registered under the U.S. Securities Act of 1933, as amended, and therefore
were offered only to ‘qualified institutional buyers’ and ‘accredited investors’ as defined by
applicable Securities and Exchange Commission regulations. These bonds are traded in the
Private Offerings, Resales and Trading through Automated Linkages (‘PORTAL’) Market.
The bonds will mature on April 9, 2005, and be payable at a price of 100 percent of the
principal amount thereof.
In November 1999, ASML completed an offering of USD 520 million (EUR 517 million)
principal amount of its 4.25 percent Convertible Subordinated Notes due November 30, 2004
with interest payable semi-annually November 30 and May 30 of each year, commencing on
May 30, 2000. The Notes are convertible into 4,653,220 ordinary shares at USD 111.75
(EUR 111.06) per share at any time prior to maturity. At any time on or after December 5,
2002 the notes are redeemable at the option of ASML, in whole or in part, at the prices
specified below, together with accrued interest.
The redemption prices, expressed as a percentage of the outstanding principal amount of the
Notes being redeemed are:
Redemption Price
December 5, 2002 through December 4, 2003 101.70%
December 5, 2003 through November 29, 2004 100.85%
November 30, 2004 and thereafter 100.00%
These Notes were issued in an offering not registered or required to be registered under the
U.S. Securities Act of 1933, as amended, and therefore were offered only to ‘qualified institu-
tional buyers’, ‘accredited investors’ and ‘non-U.S. persons acquiring in an offshore transac-
tion’ as defined by applicable Securities and Exchange Commission regulations. These Notes
are traded on the Official Segment of the stock market of the Amsterdam Exchanges N.V.
Lines of credit
ASML has two lines of credit with two banks. Both lines of credit amounted to EUR 113.4
million (EUR 226.8 million total) at December 31, 1999. There were no outstanding borrow-
ings on these facilities at December 31, 1998 or 1999. The average interest rate on the
amounts available at December 31, 1999 was Euribor plus 40 basis points with an annual
commitment fee of 0.2 percent on the unused portion. The lenders have certain contractual
46
F I N A N C I A L S T A T E M E N T S 19 9 9

rights to secure the facilities by taking a pledge of ASML’s accounts receivable as well as
certain restrictive covenants. As of December 31, 1999 ASML was in compliance with these
covenants. ASML intends to expand its credit facilities.
8 . E M P L O Y E E B E N E F I T S
Pension plans
ASML contributes to a multi-employer defined contribution pension plan covering its hourly
and salaried employees in The Netherlands and to a defined contribution plan for its U.S.
employees. The basis for the contribution to the Dutch plan is the total wages and salaries
paid during the year. The contribution is calculated as a percentage of this total, using a
maximum salary base per employee. Contributions to the U.S. plan range from 4 to 5 percent
of the compensation of plan participants. ASML may make an additional contribution to the
U.S. plan, in an amount determined at the sole discretion of ASML, if ASML meets certain
financial performance criteria. No such contribution was made by ASML in 1997, 1998 and
1999. Pension costs for these plans were approximately, EUR 2,354, EUR 3,511 and EUR 5,091
during 1997, 1998 and 1999, respectively.
During 1996, ASML adopted a defined contribution plan for certain Dutch employees who
earn salaries exceeding a defined base amount. ASML’s contributions to the defined contribu-
tion plan for these employees are based on 11.4 percent of the compensation of the plan par-
ticipants in the first half year, 13.3 percent in the second half year and were, EUR 270,
EUR 396 and EUR 564 in 1997, 1998 and 1999, respectively.
Profit-sharing plan
During 1995, ASML established a profit-sharing plan (the ‘Plan’) covering all employees.
Under the Plan, which was revised in 1999 and will be effective as of January 1999,
employees who are eligible will receive an annual profit-sharing bonus, based on a percentage
of net income to sales ranging from 0 to 20 percent of annual salary.
Share incentive scheme
Philips and the Company established an incentive scheme (the ‘Scheme’) pursuant to which
members of the Company’s management and senior staff were eligible to receive, at no cost to
such employees, an aggregate amount of approximately 6,600,000 Ordinary Shares (the
‘Scheme Shares’). The Scheme Shares were transferred by Philips at no cost to the Stichting
Administratiekantoor Management Aandelen ASML Holding (the ‘Scheme Foundation’), a
Dutch foundation with a self-electing board consisting of members of the Company’s
Supervisory Board and Board of Management. The Scheme provided for the vesting on
January 1, 1998 of the right of the participants in the Scheme to receive from the Scheme
Foundation a fixed number of the Scheme Shares. Under this arrangement, ASML recorded in
1994 a EUR 13,613 increase in its share premium and corresponding deferred charge of
EUR 10,210 to the deferred compensation account in Shareholders’ equity and a non-cash,
non-tax deductible charge of EUR 3,403 in respect of compensation expense allocated to
47
F I N A N C I A L S T A T E M E N T S 19 9 9

selling, general and administrative expenses. ASML also incurred in 1996 and 1997 a non-
cash charge in respect of compensation expense equal to EUR 3,403 and a corresponding
decrease in the deferred compensation account. These charges are allocated to selling, general
and administrative expenses and are not tax deductible for Dutch corporate income tax
purposes. ASML did not incur any further charges in connection with the Scheme since 1998.
Stock option plans
In 1997, the Company issued stock option plans, in which 863,574 stock options were
authorized in each year to purchase Ordinary Shares. The stock option plans provide for the
issuance of up to 712,574 options to purchase Ordinary Shares for eligible employees of
ASML and up to 151,000 options to purchase Ordinary Shares for certain key personnel and
management. In 1998, the company issued stock option plans, in which 1,116,192 options
were authorized to purchase Ordinary Shares. The stock option plans provide for the issuance
of up to 699,277 options to purchase Ordinary Shares for eligible employees of ASML and up
to 416,915 options to purchase Ordinary Shares for key personnel and management. These
plans include a feature whereby eligible employees will have the right to elect to receive
options to purchase Ordinary Shares in lieu of distribution under the profit sharing plan.
Options granted under these plans have fixed exercise prices equal to the closing price of the
Company’s Ordinary Shares on Amsterdam Exchanges on the applicable grant dates. Stock
options granted to eligible employees vest over a period of two years and any unexercised
options outstanding expire five years after the grant date. In 1998, the vesting period relating
to employees was amended to reflect cumulative installments vesting over a three year period
with any unexercised stock options expiring six years after the grant date. In 1998, the
vesting period relating to key personnel was amended to reflect equal cumulative installments
vesting over a three and four year period with any unexercised stock options expiring six
years after the grant date.
In 1999, a new stock option plan has been issued, in which 1,500,000 stock options were
authorized to purchase Ordinary Shares. The Board of Management has issued this plan, with
the approval of the Supervisory Board and the holders of priority shares. The plan shall be
effective as of the year 2000 and shall remain in place until revoked by the Board of
Management. The Board of Management shall determine per category of ASML personnel the
total available number of options which can be granted in a certain year on an annual basis.
The determination is subject to approval from the Supervisory Board and the holders of
priority shares of the Company.
The vesting and exercise period for this plan is similar to the plan of 1998.
48
F I N A N C I A L S T A T E M E N T S 19 9 9

Stock option transactions are summarized as follows:
Number of shares Weighted average
exercise price per share
(EUR)
Outstanding, December 31, 1997 1,449,692 13.24
Granted 863,574 31.24
Exercised (216,914) 8.52
Outstanding, December 31, 1998 2,096,352 19.12
Granted 1,116,192 39.24
Exercised (650,980) 10.62
Cancelled (24,396) 10.38
Outstanding, December 31, 1999 2,537,168 31.81
Exercisable, December 31, 1999 405,402 10.94
Exercisable, December 31, 1998 457,266 7.99
Information with respect to stock options outstanding at December 31, 1999 is as follows:
Number Weighted Weighted average
Options outstanding outstanding average remaining exercise price
Range of exercise prices (EUR) at December 31, 1999 contractual life (years) (EUR)
7.08 – 26.95 486,402 2.16 12.57
28.43 – 36.44 1,610,416 3.56 33.95
38.62 –95.25 440,350 3.81 45.24
Under the provisions of APB No. 25, no compensation expense was recorded for ASML’s
stock-based compensation plans. Had compensation cost been determined based upon the fair
value at the grant date for awards under the plan consistent with the methodology prescribed
under SFAS No. 123, ASML’s net income and calculation for net income per ordinary share
would have been as follows:
1998 1999
NN EE TT II NN CC OO MM EE ::
As reported 62,000 80,750
Pro forma 54,842 71,153
BB AA SS II CC NN EE TT II NN CC OO MM EE PP EE RR OO RR DD II NN AA RR YY SS HH AA RR EE ::
As reported 0.45 0.58
Pro forma 0.39 0.51
DD II LL UU TT EE DD NN EE TT II NN CC OO MM EE PP EE RR OO RR DD II NN AA RR YY SS HH AA RR EE ::
As reported 0.45 0.58
Pro forma 0.39 0.51
49
F I N A N C I A L S T A T E M E N T S 19 9 9
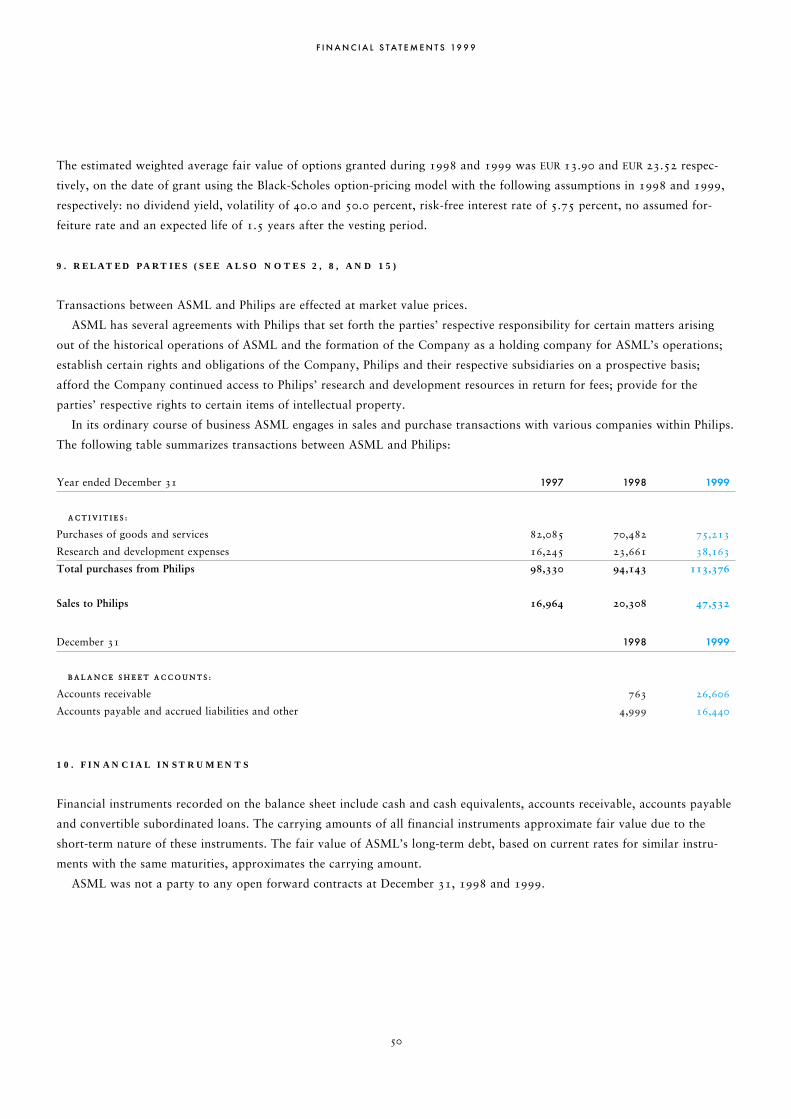
The estimated weighted average fair value of options granted during 1998 and 1999 was EUR 13.90 and EUR 23.52 respec-
tively, on the date of grant using the Black-Scholes option-pricing model with the following assumptions in 1998 and 1999,
respectively: no dividend yield, volatility of 40.0 and 50.0 percent, risk-free interest rate of 5.75 percent, no assumed for-
feiture rate and an expected life of 1.5 years after the vesting period.
9 . R E L A T E D P A R T I E S ( S E E A L S O N O T E S 2 , 8 , A N D 1 5 )
Transactions between ASML and Philips are effected at market value prices.
ASML has several agreements with Philips that set forth the parties’ respective responsibility for certain matters arising
out of the historical operations of ASML and the formation of the Company as a holding company for ASML’s operations;
establish certain rights and obligations of the Company, Philips and their respective subsidiaries on a prospective basis;
afford the Company continued access to Philips’ research and development resources in return for fees; provide for the
parties’ respective rights to certain items of intellectual property.
In its ordinary course of business ASML engages in sales and purchase transactions with various companies within Philips.
The following table summarizes transactions between ASML and Philips:
Year ended December 31 1997 1998 1999
AA CC TT II VV II TT II EE SS ::
Purchases of goods and services 82,085 70,482 75,213
Research and development expenses 16,245 23,661 38,163
Total purchases from Philips 98,330 94,143 113,376
Sales to Philips 16,964 20,308 47,532
December 31 1998 1999
BB AA LL AA NN CC EE SS HH EE EE TT AA CC CC OO UU NN TT SS ::
Accounts receivable 763 26,606
Accounts payable and accrued liabilities and other 4,999 16,440
1 0 . F I N A N C I A L I N S T R U M E N T S
Financial instruments recorded on the balance sheet include cash and cash equivalents, accounts receivable, accounts payable
and convertible subordinated loans. The carrying amounts of all financial instruments approximate fair value due to the
short-term nature of these instruments. The fair value of ASML’s long-term debt, based on current rates for similar instru-
ments with the same maturities, approximates the carrying amount.
ASML was not a party to any open forward contracts at December 31, 1998 and 1999.
50
F I N A N C I A L S T A T E M E N T S 19 9 9

1 1 . C O M M I T M E N T S A N D C O N T I N G E N C I E S
ASML leases its facilities and certain equipment under operational leases. As of December 31, 1999, the minimum annual
rental commitments are as follows:
2000 41,561
2001 30,727
2002 24,260
2003 21,636
2004 20,322
Thereafter 103,196
Total 241,702
Rental expense was EUR 14,709, EUR 34,445 and EUR 44,354 for the years ended December 31, 1997, 1998 and 1999,
respectively.
ASML has entered into sale and leaseback transactions to lease systems manufactured by ASML, for testing and training
purposes. The term of the operational lease contracts is 30 to 60 months, commencing October 1996. Rental expense for
1997, 1998 and 1999 was EUR 4,605, EUR 12,714 and EUR 18,480, respectively, for the operational lease contracts that are
included in total rental expense above.
At December 31, 1999, as a part of the overall development plan, ASML has entered into agreements to expand its
research and development, manufacturing and office facilities. The current and expected facility expansions will be partially
financed through leasing arrangements with third parties. Minimum annual rental commitments relating to the new facilities
are included in the schedule above.
Although there are no pending lawsuits against ASML regarding infringement claims with respect to any existing patents
or any other intellectual property rights, from time to time certain of ASML’s customers have received notices of infringe-
ment alleging that the manufacture of semiconductor products and/or the equipment used to manufacture semiconductor
products infringes certain patents. ASML has been advised that it could be obligated to pay damages to customers if use of
ASML’s systems by those customers were found to infringe any valid patents issued to third parties. If these claims were
successfull, ASML could be required to indemnify its customers for some or all of any losses incurred as a result of that
infringement. In addition, Management is not aware of any other matters that could give rise to any material liability to
ASML for patent infringement claims.
1 2 . C O S T O F S A L E S
ASML has research and development agreements (TOKs) with the Government of The Netherlands, Ministry of Economic
Affairs. From 1986 through 1993, credits were received to fund research and development projects for ASML’s PAS 2500 or
PAS 5500 wafer stepper. In 1997, 1998 and 1999 credits were received for research and development projects relating to a
new generation of semiconductor lithography systems. Such agreements require that the majority of the amounts received are
to be repaid, with interest, to the extent product sales occur which relate to the research. The amount of the repayment due
is based on a percentage of the selling price of the product and is charged to cost of sales when such a sale is recorded. In
1997, 1998 and 1999 no repayment obligations were outstanding.
51
F I N A N C I A L S T A T E M E N T S 19 9 9

At December 31, 1998 and 1999, ASML has contingent obligations totaling EUR 12,996 and
EUR 34,995 to repay TOK credits received in 1997, 1998 and 1999.
1 3 . R E S E A R C H A N D D E V E L O P M E N T C R E D I T S
ASML receives subsidies and credits for research and development from various
governmental sources as follows:
Year ended December 31 1997 1998 1999
European Community/Dutch technology (JESSI / MEDEA)
Subsidy 6,217 10,097 9,688
Netherlands Ministry of Economic Affairs (TOKs) credits* 4,828 9,529 17,073
Netherlands Ministry of Economic Affairs subsidy
(WBSO / BTS / Stimulus) 788 6,915 5,066
European Community technology
(ESPRIT-EUCLIDES / ELLIPSE) subsidy 1,780 3,424 4,301
Total subsidies and credits received 13,613 29,965 36,128
* See Note 12 of the Notes to the Financial Statements.
1 4 . I N C O M E T A X E S
The components of income before income taxes are as follows:
Year ended December 31 1997 1998 1999
Domestic 211,376 84,111 92,793
Foreign 10,027 5,819 25,486
Total 221,403 89,930 118,279
The Dutch domestic statutory tax rate is 35 percent. The reconciliation between the provision
for income taxes shown in the consolidated statement of operations, based on the effective
tax rate, and expense based on the domestic tax rate, is as follows:
Year ended December 31 1997 1998 1999
Income tax expense based on domestic rate 77,491 31,476 41,398
Non-deductible management stock compensation 1,191 0 0
Different foreign tax rates 602 413 (3,545)
Realized gain on sale of marketable securities (4,845) 0 0
Other credits and non-taxable items (2,330) (3,959) (324)
Provision for income taxes shown in the income statement 72,109 27,930 37,529
52
F I N A N C I A L S T A T E M E N T S 19 9 9

ASML’s provision for income taxes consisted of the following:
Year ended December 31 1997 1998 1999
CC UU RR RR EE NN TT ::
Domestic 63,235 20,988 41,207
Foreign 5,159 3,046 643
DD EE FF EE RR RR EE DD ::
Domestic 4,775 4,492 (9,052)
Foreign (1,060) (596) 4,731
Total 72,109 27,930 37,529
Deferred tax assets (liabilities) consist of the following:
December 31 1998 1999
Warranty 2,963 7,694
Accounts receivable (4,926) (12,557)
Inventories (3,280) (5,762)
Property, plant and equipment (2,725) (1,984)
Pensions (377) (96)
Other (157) (118)
Total (8,502) (12,823)
Deferred tax assets (liabilities) are classified in the consolidated financial statements as fol-
lows:
December 31 1998 1999
Deferred tax assets – current 2,963 7,694
Deferred tax liabilities – current (8,363) (18,437)
Deferred tax liabilities – non-current (3,102) (2,080)
1 5 . M A J O R C U S T O M E R S A N D G E O G R A P H I C A L I N F O R M A T I O N
ASML operates in one business segment, which is the design, production and marketing of
lithographic systems for the semiconductor industry. The following table presents sales to spe-
cific customers for each of the years 1997, 1998 and 1999 that exceeded 10 percent of total
net sales in such year:
Year ended December 31 1997 1998 1999
CC UU SS TT OO MM EE RR ::
A 171,177 98,022 238,837
B 140,398 115,549 164,725
C 0 108,095 –
53
F I N A N C I A L S T A T E M E N T S 19 9 9
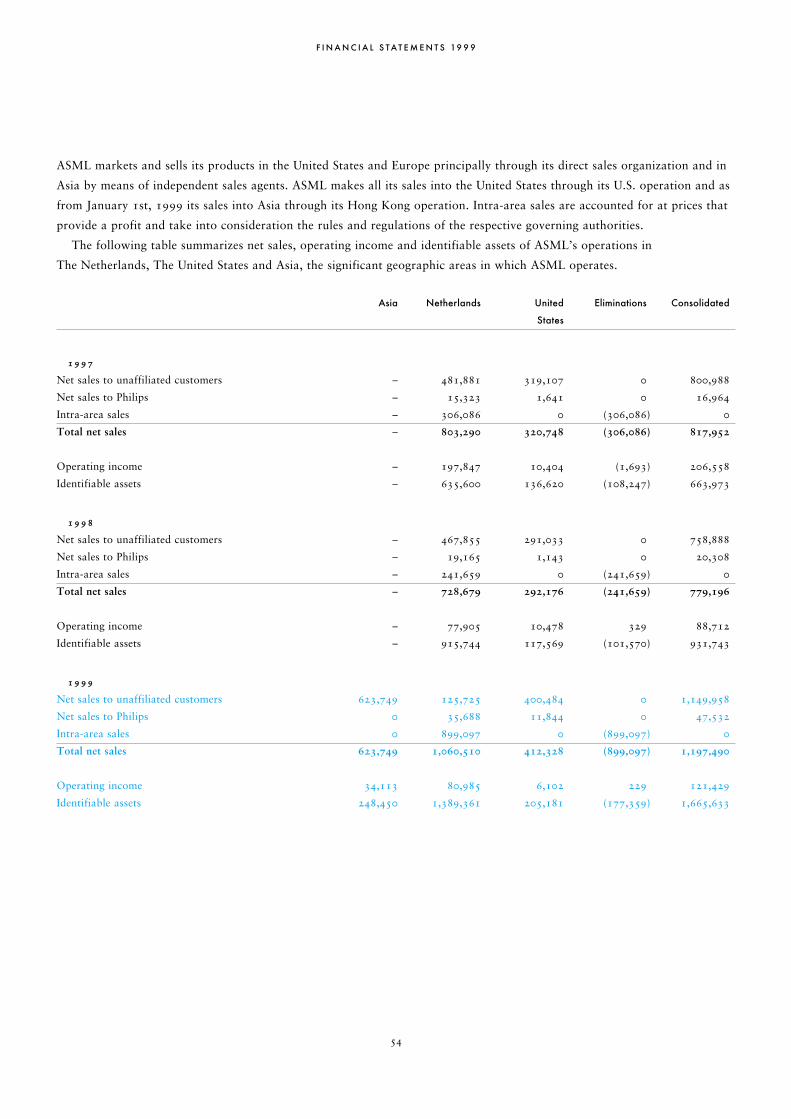
ASML markets and sells its products in the United States and Europe principally through its direct sales organization and in
Asia by means of independent sales agents. ASML makes all its sales into the United States through its U.S. operation and as
from January 1st, 1999 its sales into Asia through its Hong Kong operation. Intra-area sales are accounted for at prices that
provide a profit and take into consideration the rules and regulations of the respective governing authorities.
The following table summarizes net sales, operating income and identifiable assets of ASML’s operations in
The Netherlands, The United States and Asia, the significant geographic areas in which ASML operates.
Asia Netherlands United Eliminations Consolidated
States
11 99 99 77
Net sales to unaffiliated customers – 481,881 319,107 0 800,988
Net sales to Philips – 15,323 1,641 0 16,964
Intra-area sales – 306,086 0 (306,086) 0
Total net sales – 803,290 320,748 (306,086) 817,952
Operating income – 197,847 10,404 (1,693) 206,558
Identifiable assets – 635,600 136,620 (108,247) 663,973
11 99 99 88
Net sales to unaffiliated customers – 467,855 291,033 0 758,888
Net sales to Philips – 19,165 1,143 0 20,308
Intra-area sales – 241,659 0 (241,659) 0
Total net sales – 728,679 292,176 (241,659) 779,196
Operating income – 77,905 10,478 329 88,712
Identifiable assets – 915,744 117,569 (101,570) 931,743
11 99 99 99
Net sales to unaffiliated customers 623,749 125,725 400,484 0 1,149,958
Net sales to Philips 0 35,688 11,844 0 47,532
Intra-area sales 0 899,097 0 (899,097) 0
Total net sales 623,749 1,060,510 412,328 (899,097) 1,197,490
Operating income 34,113 80,985 6,102 229 121,429
Identifiable assets 248,450 1,389,361 205,181 (177,359) 1,665,633
54
F I N A N C I A L S T A T E M E N T S 19 9 9

The following table represents export sales by ASML’s Dutch operation. ASML’s U.S. operation has no significant export
sales.
Europe Asia Total
11 99 99 77
Net export sales to unaffiliated customers 55,691 426,190 481,881
Net export sales to Philips 9,219 0 9,219
11 99 99 88
Net export sales to unaffiliated customers 54,436 413,419 467,855
Net export sales to Philips 4,609 0 4,609
11 99 99 99
Net export sales to unaffiliated customers 114,322 623,749 738,071
Net export sales to Philips 1,873 0 1,873
1 6 . S E L E C T E D O P E R A T I N G E X P E N S E S A N D A D D I T I O N A L I N F O R M A T I O N
Aggregate cash compensation paid or accrued by ASML for its management including members of the Board of Management
of the Company was EUR 1,655 in 1997, EUR 2,023 in 1998 and EUR 2,224 in 1999. Amounts accrued to provide pension,
retirement or similar benefits to these individuals, as a group, were EUR 185, EUR 162 and EUR 211 in 1997, 1998 and 1999,
respectively. Aggregate compensation for the members of the Supervisory Board amounted to EUR 86 in 1997 and 1998 and
EUR 95 in 1999. Personnel expenses for all employees were as follows:
Year ended December 31 1997 1998 1999
Wages and salaries 63,867 98,957 122,981
Social security expenses 4,822 8,482 10,743
Pension and retirement expenses 4,744 7,900 9,116
73,433 115,339 142,840
The average number of employees during 1997, 1998 and 1999 were 1,691, 2,104 and 2,658 respectively.
The total number of personnel employed per sector were:
December 31 1997 1998 1999
Marketing & Technology 737 901 1,065
Goodsflow 503 553 674
Customer support 482 575 818
General 223 254 335
Sales 74 81 92
2,019 2,364 2,984
In 1997, 1998 and 1999 a total of 1,641, 1,932 and 2,352 personnel were employed in The Netherlands, respectively.
55
F I N A N C I A L S T A T E M E N T S 19 9 9

1 7 . V U L N E R A B I L I T Y D U E T O C E R T A I N C O N C E N T R A T I O N S
ASML relies on outside vendors to manufacture the components and subassemblies used in its
systems, each of which is obtained from a sole supplier or a limited number of suppliers.
ASML’s reliance on a limited group of suppliers involves several risks, including a potential
inability to obtain an adequate supply of required components and reduced control over
pricing and timely delivery of these subassemblies and components. In particular, the number
of systems ASML has been able to produce has from time to time been limited by the produc-
tion capacity of Zeiss. Zeiss currently is ASML’s only supplier of lenses and other critical
optical components and is capable of producing these lenses only in limited numbers and only
through the use of its manufacturing and testing facility in Oberkochen, Germany. In addition
to Zeiss’ position as ASML’s sole supplier of lenses, the Excimer laser illumination systems for
deep UV systems are available from a very limited number of suppliers. Additionally, certain
raw materials and minerals necessary for the manufacture of certain components supplied by
outside vendors may be limited from time to time. Any prolonged inability to obtain adequate
deliveries from its suppliers or any other circumstance that would require ASML to seek alter-
native sources of supply, could adversely impact ASML’s future operating results.
1 8 . C A P I T A L S T O C K
Cumulative Preference Shares
In April 1998, the Company has granted to the preference share foundation Stichting
Preferente Aandelen ASML (‘the Foundation’) an option to acquire Cumulative Preference
Shares in the capital of ASML Holding N.V. (‘the Company’) (the ‘Preference Share Option’).
The object of the Foundation is to protect the interests of the Company and the enterprises
maintained by it. The Cumulative Preference Shares have a higher liquidity preference and the
same voting rights as Ordinary Shares. Additionally, Cumulative Preference Shares are
entitled to dividends at a percentage based on the average contango rate (‘prolongatie koers’)
determined by Euribor plus 2 percent. The Board of Directors of the Foundation is indepen-
dent of ASML and is comprised of three voting members from the Dutch business and
academic communities, and two non-voting members; the Chairman of the Company’s
Supervisory Board and the Chairman of the Company’s Board of Management.
The Preference Share Option gives the Foundation the right to acquire a number of
Cumulative Preference Shares equal to the number of Ordinary Shares outstanding at the time
of exercise of the Cumulative Preference Share Option for a subscription price equal to their
NLG 0.13 nominal value. Only one-fourth of this subscription price is payable at the time of
initial issuance of the Cumulative Preference Shares. The Cumulative Preference Shares may
be cancelled and repaid by the Company upon the authorization by the General Meeting of
the Shareholders of a proposal to do so by the Board of Management that receives the prior
approval of the Supervisory Board and of the Meeting of Priority Shareholders.
Exercise of the Preference Share Option would effectively dilute the voting power of the
56
F I N A N C I A L S T A T E M E N T S 19 9 9

Ordinary Shares then outstanding by one-half. The practical effect of any such exercise could
be to prevent attempts by third parties to acquire control of the Company
Priority Shares
The Priority Shares are held by a foundation, having an elected board that consists solely of
members of the Company’s Supervisory Board and Board of Management.
Per December 31, 1999, the board members were:
– Willem D. Maris
– Henk Bodt
– Arie Westerlaken
– Syb Bergsma
– Jan A. Dekker
– Peter T.F.M. Wennink
An overview of the other functions held by above persons, can be obtained at the Company’s
office.
Furthermore, the Company as well as the members of the board declare in accordance with
Article 11 under C of the ‘Bijlage X van het Fondsenreglement van AEX-Effectenbeurs’ that
in their opinion the composition of the board is conform Article 10 under C of the above
mentioned ‘Bijlage’.1
With respect to the Priority Shares, they are not entitled to dividends but have a preferred
right on the return of their nominal value in the case of winding up the Company. Holders of
the priority shares of the Company have the effective power to control significant corporate
decisions and transactions of the Company. These decisions and transactions encompass, but
are not limited to, amendment of the Articles of Association, winding up of the Company,
issuance of shares, limitation of preemptive rights and repurchase and cancellation of shares.
1 Article 10 states that the issuing entity takes care that not more than half of the priority shares are being held by
board members of the issuing entity or, in case the priority shares are being held by a legal entity, that not more than
half of the amount of votes to be exercised in meetings of the foundation in which decisions are made about the exercise
of the voting rights of the priority shares, can be exercised, directly or indirectly, by persons who are also board mem-
bers of the issuing entity.
57
F I N A N C I A L S T A T E M E N T S 19 9 9

Independent Auditors’ Report
To the Supervisory Board, Board of Management and Shareholders of ASM Lithography Holding N.V.
Eindhoven, The Netherlands
We have audited the accompanying consolidated balance sheets of ASM Lithography Holding N.V. and its subsidiaries (col-
lectively, the ‘Company’) as of December 31, 1998 and 1999 and the related consolidated statements of operations, compre-
hensive income, shareholders’ equity and cash flows for each of the three years in the period ended December 31, 1999.
These financial statements are the responsibility of the Company’s management. Our responsibility is to express an opinion
on these financial statements based on our audits.
We conducted our audits in accordance with auditing standards generally accepted in the United States of America. Those
standards require that we plan and perform the audit to obtain reasonable assurance about whether the financial statements
are free of material misstatement. An audit includes examining, on a test basis, evidence supporting the amounts and disclo-
sures in the financial statements. An audit also includes assessing the accounting principles used and significant estimates
made by management, as well as evaluating the overall financial statement presentation. We believe that our audits provide a
reasonable basis for our opinion.
In our opinion, such consolidated financial statements present fairly, in all material respects, the financial position of the
Company at December 31, 1998 and 1999, and the results of its operations, comprehensive income and its cash flows for
each of the three years in the period ended December 31, 1999 in conformity with accounting principles generally accepted
in the United States of America.
Our audits also comprehended the translation of euro amounts into U.S. dollar amounts, and, in our opinion, such trans-
lation has been made in conformity with the basis stated in Note 1 of the Notes to the Consolidated Financial Statements. Such
U.S. dollar amounts are presented mainly for the convenience of readers outside the Economic and Monetary Union (EMU).
Eindhoven, The Netherlands
January 19, 2000
58
F I N A N C I A L S T A T E M E N T S 19 9 9

Statutory Balance Sheets
As of December 31 1998 1999
(Amounts in thousands, except share and per share data) EUR EUR
AA SS SS EE TT SS
Cash and cash equivalents 39,826 472,252
Amounts due from subsidiaries 527,451 605,050
Other current assets 2,131 1,417
Total current assets 569,408 1,078,719
Investments in subsidiaries 76,449 168,961
Loans due from subsidiaries 143,989 151,930
Other assets 12,884 17,891
Total assets 802,730 1,417,501
LL II AA BB II LL II TT II EE SS AA NN DD SS HH AA RR EE HH OO LL DD EE RR SS ’’ EE QQ UU II TT YY
Accrued liabilities and other 5,072 7,073
Current tax liability 13,712 (10,374)
Deferred tax liability 8,363 18,437
Total current liabilities 27,147 15,136
Deferred tax liability 3,102 2,080
Convertible subordinated debt 272,268 789,033
Total liabilities 302,517 806,249
Cumulative Preference Shares, NLG 0.13 nominal value; 300,000,000 shares
authorized; none outstanding at December 31, 1999 0 0
Priority Shares, NLG 0.13 nominal value; 7,700 shares authorized,
issued and outstanding at December 31, 1998 and 1999 1 1
Ordinary Shares, NLG 0.13 nominal value; 300,000,000 shares
authorized; 138,216,914 shares issued and outstanding at
December 31, 1998 and 139,181,667 at December 31, 1999 8,154 8,211
Share premium 118,431 149,983
Accumulated earnings 372,771 453,521
Accumulated other comprehensive income 856 (464)
Total shareholders’ equity 500,213 611,252
Total liabilities and shareholders’ equity 802,730 1,417,501
See Notes to the Statutory Financial Statements.
59
F I N A N C I A L S T A T E M E N T S 19 9 9

Statutory Statements of Operations
For the year ended December 31 1997 1998 1999
(Amounts in thousands) EUR EUR EUR
Net gain on sale of marketable securities 14,130 0 0
Management share compensation expense (3,403) 0 0
General and administrative expenses (592) (716) (3,231)
Net income from financing activities 18,369 6,998 9,979
Net income from holding Company activities 28,504 6,282 6,748
Net income of subsidiaries 120,790 55,718 74,002
Consolidated net income 149,294 62,000 80,750
See Notes to the Statutory Financial Statements.
60
F I N A N C I A L S T A T E M E N T S 19 9 9

Notes to the Statutory Financial Statements
1 . S U M M A R Y O F S I G N I F I C A N T A C C O U N T I N G P O L I C I E S
Significant accounting policies
The accounting policies used in the preparation of the statutory financial statements are the
same as those used in the preparation of the consolidated financial statements. Please refer to
the Notes to the Consolidated Financial Statements. In addition to those accounting policies,
the following accounting policies for the statutory financial statements are described below.
Presentation of amounts
Amounts presented in the Statutory Statements of Operations are presented net of income
taxes. The accompanying Financial Statements include the accounts of ASM Lithography
Holding N.V. ASM Lithography Holding N.V. follows accounting principles that conform
with those generally accepted in the United States of America.
Had ASM Lithography Holding N.V. prepared its Financial Statements following account-
ing principles generally accepted in The Netherlands, the Statements of Operations and the
Balance Sheets would not have differed significantly from those presented herein.
Investments in subsidiaries
Investments in subsidiaries are valued using the equity method of accounting.
2 . C H A N G E S I N N O N - C U R R E N T A S S E T S
Changes in non-current assets during 1999 were as follows:
Investments in Loans due Other
subsidiaries from assets
subsidiaries
Balance, January 1, 1999 76,449 143,989 12,884
Additions 19,876 0 12,860
Net income of subsidiaries 74,002 0 0
Amortization 0 0 (1,203)
Repayments 0 0 (6,807)
Effect of exchange rates (1,366) 7,941 157
Balance, December 31, 1999 168,961 151,930 17,891
61
F I N A N C I A L S T A T E M E N T S 19 9 9

3 . L I S T O F S U B S I D I A R I E S
Name Location % Ownership
ASM Lithography B.V. Eindhoven, The Netherlands 100%
ASM Lithography, Inc. Delaware, United States of America 100%
ASM Lithography SARL Meylan, France 100%
ASM Lithography Participations B.V. Eindhoven, The Netherlands 100%
ASML Masktools Netherlands B.V. Eindhoven, The Netherlands 100%
ASML Korea Co., Ltd. Pundang-Ku, Republic of Korea 100%
ASML (UK) Limited Glasgow, United Kingdom 100%
ASM Lithography (Germany) GmbH Dresden, Germany 100%
ASML Hong Kong, Limited. Hong Kong, SAR 100%
ASML Italy S.r.l. Milan, Italy 100%
Subsidiaries of ASM Lithography , Inc.:
ASML Masktools, Inc. (100%)
ASML Participations U.S., Inc (100%)
Furthermore ASML Participations U.S., Inc. has a 50% participation in e_Lith LLC.
4 . A D D I T I O N A L I N F O R M A T I O N
The additional information below includes a brief summary of the most significant provisions
of the Articles of Association of ASM Lithography Holding N.V. (the ‘Company’).
Appropriation and determination of profits
Dividends may be payable out of annual profit shown in the financial statements of the
Company as adopted by the Supervisory Board and approved by the General Meeting of
Shareholders of the Company, after payment first of (accumulated) dividends on any out-
standing Cumulative Preference Shares. At its discretion, however, subject to statutory provi-
sions, the Board of Management may, with the prior approval of the Supervisory Board and
the Meeting of Priority Shareholders, distribute one or more interim dividends on the
Ordinary Shares before the financial statements for any financial year have been approved by
the General Meeting of Shareholders. The Board of Management, with the approval of the
Supervisory Board, may decide that all or part of the Company’s profits should be retained
and not be made available for distribution to shareholders, except for dividends on the
Cumulative Preference Shares. Those profits that are not retained may be distributed to share-
holders pursuant to a shareholders’ resolution, provided that the distribution does not reduce
shareholders’ equity below the amount of reserves required by Dutch law. Existing reserves
that are distributable in accordance with Dutch law may be made available to the General
Meeting of Shareholders for distribution upon a proposal by the Board of Management, sub-
ject to prior approval by both the Supervisory Board and the Meeting of Priority
Shareholders. As regards cash payments, the rights to dividends and distributions shall lapse
62
F I N A N C I A L S T A T E M E N T S 19 9 9

if such dividends or distributions are not claimed within five years following the day after the
date on which they were made available.
The Board of Management with the approval of the Supervisory Board has decided that
the Company’s profits for 1999 will be retained by way of reserve and not be made available
for distribution.
Voting rights
A number of special powers have been conferred to the Meeting of Priority Shareholders
under the Articles of Association. Such special powers relate, amongst others, to changes to
the issued capital, amendment of the Articles of Association and dissolution of the Company.
All outstanding Priority Shares are held by Stichting Prioriteitsaandelen ASM Lithography
Holding N.V., a Dutch foundation with a self-electing Board, consisting of members of the
Board of Management and of the Supervisory Board of the Company.
The Company is subject to the relevant provisions of Dutch law applicable to large corpo-
rations (‘Structuurregime’). These provisions have the effect of concentrating control over cer-
tain corporate decisions and transactions in the hands of the Supervisory Board. The
Supervisory Board is self-electing, however the General Meeting of Shareholders and the
Works Council each have a right of recommendation and a right to object to a proposed
appointment of a new member of the Supervisory Board.
Members of the Board of Management are appointed by the Supervisory Board. The
Supervisory Board shall notify the General Meeting of Shareholders of intended appointments
to the Board of Management.
General Meetings of Shareholders will be held at least once a year.
The Company does not solicit from or nominate proxies for its shareholders. However,
shareholders and other persons entitled to attend General Meetings of Shareholders may be
represented by proxies with written authority.
Extraordinary General Meetings of Shareholders may be held as often as deemed necessary
by the Supervisory Board or Board of Management and must be held if the Meeting of
Priority Shareholders or one or more Ordinary or Cumulative Preference Shareholders jointly
representing at least 10 percent of the issued share capital make a written request to that
effect to the Supervisory Board and the Board of Management specifying in detail the busi-
ness to be dealt with.
Resolutions are adopted at General Meetings of Shareholders by a majority of the votes
cast (except where a different proportion of votes is required by the Articles of Association or
Dutch law) and there are generally no quorum requirements applicable to such meetings.
Each Ordinary, Cumulative Preference and Priority Share confers the right to one vote.
Cumulative Preference Shares
See Note 18 to the Consolidated Financial Statements.
Issue of Shares
The Board of Management of the Company has the power to issue Ordinary Shares and
63
F I N A N C I A L S T A T E M E N T S 19 9 9

Cumulative Preference Shares if and insofar as the Board of Management has been designated by the General Meeting of
Shareholders (whether by means of an authorizing resolution or by an amendment to the Company’s Articles of Association)
as the authorized body for this purpose. The Board of Management requires the approval, however, of the Supervisory Board
and the Meeting of the Priority Shareholders for such an issue.
Shareholders have a pro rata pre-emptive right of subscription to any Ordinary Share issue for cash, which right may be
limited or eliminated. Shareholders have no pro rata pre-emptive subscription right with respect to any Ordinary Shares
issued for a contribution other than cash. If designated for this purpose by the General Meeting of Shareholders, the Board
of Management has the power, on approval by the Supervisory Board and the Meeting of Priority Shareholders, to limit or
eliminate such rights.
The Company may repurchase Ordinary Shares, subject to compliance with certain legal requirements. Any such purchas-
es are subject to the approval of the Supervisory Board and the authorization of the General Meeting of Shareholders, which
authorization may not be for more than 18 months.
Corporate Governance
The Company generally endorses the recommendations made in the report of the Netherlands Committee on Corporate
Governance. As in the 1997 Annual Report, the Committee’s recommendations are expressly taken into account at various
points in this Annual Report. The Company will continue to closely monitor developments in the field of Corporate
Governance in the Netherlands. A detailed overview of the Company’s position on the 40 recommendations is available at
the Company’s offices.
In this context it should be noted that the Supervisory Board has adopted in its Rules of Procedure that it will resolve, in
consultation with the Board of Management, to put on the agenda of the General Meeting of Shareholders any proposal
from shareholders representing more than 1 percent of the Company’s share capital, presented at least 60 days in advance of
the General Meeting of Shareholders, unless substantive Company concerns prevail.
Also in this respect, in the coming General Meeting of Shareholders a proposal shall be submitted for adoption to amend the
Articles of Association in order to disconnect the current link between the approval of the Company’s financial statements
from the discharge of the Board of Management and the Supervisory Board from liability for the performance of their duties
for the past financial year.
Adoption of Financial Statements
The Board of Management will submit the Company’s annual Dutch statutory accounts, together with a certificate of the
auditor in respect thereof, to the Supervisory Board for adoption. Thereupon, these financial statements will be submitted to
the General Meeting of Shareholders for approval.
Please refer to page 65 for the Independent Auditors’ Report.
Signing of the Financial Statements
The members of the Supervisory Board and the Members of the Board of Management responsible for the signing of the
financial statements are included at pages 9 and 2.
Veldhoven, The Netherlands
January 19, 2000
64
F I N A N C I A L S T A T E M E N T S 19 9 9

Independent Auditors’ Report
Introduction
We have audited the 1999 financial statements of ASM Lithography Holding N.V., Eindhoven. These financial statements
are the responsibility of the Company’s management. Our responsibility is to express an opinion on these financial state-
ments based on our audit.
Scope
We conducted our audit in accordance with auditing standards generally accepted in the Netherlands. Those standards
require that we plan and perform the audit to obtain reasonable assurance about whether the financial statements are free of
material misstatement. An audit includes examining, on a test basis, evidence supporting the amounts and disclosures in the
financial statements. An audit also includes assessing the accounting principles used and significant changes made by the
management, as well as evaluating the overall financial statement presentation. We believe that our audit provides a reason-
able basis for our opinion.
Opinion
In our opinion, the financial statements of ASM Lithography Holding N.V. give a true and fair view of the financial position
of the Company as of December 31, 1999 and of the net income for the year then ended in accordance with accounting prin-
ciples generally accepted in the Netherlands and comply with the legal requirements for financial statements as included in
Part 9, Book 2 of the Netherlands Civil Code.
Eindhoven, The Netherlands
January 19, 2000
65
F I N A N C I A L S T A T E M E N T S 19 9 9

66
Glossary of Terms
D E E P U LT R AV I O L E T ( ‘ D U V ’ ) – Output of light from
an excimer laser centered at 193 or 248 nanometers.
D I E – Each portion of a wafer on which a circuit pattern
is printed in the lithography process that, after further
processing, will become an individual, finished IC or
chip.
D R A M – Dynamic Random Access Memory, a type of IC.
E L L I P S E – Excimer Laser Lithography Processing for
the Subquartermicron Era.
E S P R I T – European Strategic Programme for Research
and development in Information Technologies.
E X C I M E R L A S E R – Typical illumination source used in
deep ultraviolet lithography systems.
G A L L I U M A R S E N I D E – A semi conducting material
like silicon, used as a basis to create IC’s for specific
applications like high frequency or optical. Examples are
IC’s for communications or LED’s.
i - L I N E – Output of light energy from a mercury arc
lamp centered at 365 nanometers.
I C – Integrated Circuit, semiconductor or chip.
J E S S I – Joint European Submicron Silicon Initiative.
M E D E A – Micro Electronics Development for European
Applications.
M E R C U R Y A R C L A M P – Typical illumination source
used in i-line lithography equipment.
M I C R O N ( µ M ) – One millionth of a meter, or one
thousandth of a millimeter.
N A N O M E T E R ( n m ) – One billionth of a meter, or one
thousandth of a micron.
O P C – Optical Proximity Correction, correcting the
pattern on the mask in such a way that the imaging of
structures with a very small resolution is improved.
P H A S E S H I F T M A S K – Mask that selectively shifts the
phase of the light to enable the printing of smaller
structures.
R E S O L U T I O N – Refers to feature size, geometries or
line widths being printed by the lithography system on
the substrate material. Resolution is expressed as a
function of wavelength divided by numerical aperture,
multiplied by a constant.
R E T I C L E – Photomask containing one or more of the
die or component patterns used in lithography systems.
Usually part of a reticle set, a serie of reticles each of
which contains the pattern to be imaged for a particular
level of a process.
T H I N F I L M H E A D – Magnetic heads for reading and
writing amongst others harddiscs, also manufactured
with lithographic processes.
T H R O U G H P U T – Number of wafers that can be
processed by a wafer stepper or Step & Scan system in a
given period of time.
WA F E R – Round, thin slices, typically composed of
silicon, that form the base substrate for semiconductor
processing. Current sizes range from 4 inches up to 8
inches in diameter. In the future also 12 inch-wafers will
be used.
Y I E L D – The ratio of working dies on a wafer with
respect to the total available dies per wafer.

67
Information and Investor Relations
F I N A N C I A L C A L E N D A R
March 23, 2000
General Meeting of Shareholders
at the Evoluon,
Noord Brabantlaan 1a in Eindhoven,
The Netherlands
July 19, 2000
Announcement of semi-annual results for 2000
January 18, 2001
Announcement of annual results for 2000
F I S C A L Y E A R
ASML’s fiscal year ends at December 31.
L I S T I N G
The Ordinary Shares of the Company are listed on the
official market of the Amsterdam Exchanges (AEX) and
the New York shares of the Company are listed on the
Nasdaq Stock Market® (NASDAQ) in the United States,
both under the symbol ‘ASML’.
I N V E S T O R R E L A T I O N S
ASML Investor Relations will supply information or fur-
ther copies of the original English Annual Report as well
as copies of the Dutch translation. In case of different
interpretation between these versions, the English version
prevails. Copies of other publications (i.e. Semi-Annual
Reports or the Annual Report on Form 20-F filed with
the U.S. Securities and Exchange Commission and the
Amsterdam Exchanges) can also be obtained free of
charge at the offices of ASML. The English version of the
Annual Report and the Semi-Annual report are also avail-
able on the ASML website (http://www.asml.com).
ASM Lithography Holding N.V.
Investor Relations Office:
Phone: (31)40-268 4941/3938
Fax: (31)40-268 3565
E-mail: [email protected]
Office address:
De Run 1110, 5503 LA Veldhoven
The Netherlands
Mailing address:
P.O. Box 324, 5500 AH Veldhoven
The Netherlands

Printed by: PlantijnCasparie Hilversum, The Netherlands. Design: Berry Slok BNO, Hilversum, The Netherlands. Illustrations: Jorien Doorn, Soest, The Netherlands


