Embed Size (px)
Citation preview

University of WollongongResearch Online
University of Wollongong Thesis Collection University of Wollongong Thesis Collections
1990
Tissue culture of cassava (Manihot esculentaCrantz): development and use in elucidatingpathogenic mechanisms of Erwinia speciesPatrick Michael RoachUniversity of Wollongong
Research Online is the open access institutional repository for theUniversity of Wollongong. For further information contact the UOWLibrary: [email protected]
Recommended CitationRoach, Patrick Michael, Tissue culture of cassava (Manihot esculenta Crantz): development and use in elucidating pathogenicmechanisms of Erwinia species, Doctor of Philosophy thesis, Department of Biology, University of Wollongong, 1990.http://ro.uow.edu.au/theses/1081


TISSUE CULTURE OF CASSAVA ( Manihot esculenta Crantz): DEVELOPMENT AND
USE IN ELUCIDATING PATHOGENIC MECHANISMS OF Erwinia species.
A Thesis submitted in fulfilment of the
requirements for the award of the degree
DOCTOR OF PHILOSOPHY
from
THE UNIVERSITY OF WOLLONGONG
by
PATRICK MICHAEL ROACH BSc.(Hons.) Witwatersrand
BWrtrn r mi i ii i f —
ONIVERSITY Of WGLLONGOMG
L13RAR.Y
DEPARTMENT OF BIOLOGY
DECEMBER 1990

i
It is hard to predict how science is going to turn out, and if it is really good science
it is impossible to predict. This is in the nature of the enterprise. If the things to
be found are actually new, they are by definition unknown in advance, and there is
no way of telling in advance where a new line of inquiry will lead. You cannot make
choices in this matter, selecting things you think you are going to like and shutting
off the lines that make for discomfort. You either have science or you don't and if
you have it you are obliged to accept the surprising and disturbing pieces of
information, even the overwhelming and upheaving ones, along with the neat and
promptly useful bits, it is like that.
The only solid piece of scientific truth about which I feel totally confident is that
we are profoundly ignorant about nature. It is, in it's way, an illuminating piece of
news. It would have amazed the brightest minds of the eighteenth-century
Enlightenment to be told by any of us how little we know, and how bewildering
seems the way ahead. It is this sudden confrontation with the depth and scope of
ignorance that represents the most significant contribution to twentieth-century
science to the human intellect. W e are, at last, facing up to it. In earlier times, we
either pretended to understand how things worked or ignored the problem, or
simply made up stories to fill the gap. Now that we have begun exploring in
earnest, doing serious science, we are getting glimpses of how huge the questions
are, and how far from being answered. Because of this, these are hard times for
the human intellect, and it is no wonder we are depressed. It is not so bad being
ignorant if you are totally ignorant; the hard thing is knowing in some detail the
reality of ignorance, the worst spots and here and there the not-so-bad spots, but
no true light at the end of the tunnel nor even any tunnels that can yet be trusted.
Hard times indeed.
Lewis Thomas, The Hazards of Science (1979).

i i
ABSTRACT
Tissue culture systems were developed for cultivars of cassava grown in both
southern Africa and Australia. Using meristem derived in vivo plantlets and
leaves from plants grown under environmentally controlled conditions, a method
was established to isolate consistently high yields of viable protoplasts and a new
medium promoting protoplast division was formulated. Callus was initiated from
stem tissue and both green, compact callus and pale, friable callus were obtained.
The former was used in regeneration studies, whilst the latter was used to
establish fast growing cell suspensions.
Plant cell suspension cultures, together with protoplast division and plantlet
assays, were used to effectively differentiate between a non pathogenic strain of
Erwinia herbicola and two strains which cause a blight disease of cassava. The
pathogenic strains appeared to produce an extracellular cytotoxic metabolite in
vitro.
Purification of extracellular material revealed the presence of pili and
polysaccharide on the outer surface of the three bacterial strains. The role of pili
in this bacterial-plant interaction is uncertain but they may play a role in
recognition. The toxic effect displayed by the polysaccharide, produced by the two
pathogenic strains, may be due to physical blocking of plant conductive tissue. The
lower production and apparent conformational differences of the polysaccharide
from the non pathogenic strain, may account for the lack of effect of this material
in plant assays.
A range of plant cell and tissue culture techniques applicable to cassava have thus
been established and are available for the study of diseases of cassava.

iii
DECLARATION
I declare that this thesis is m y own, unaided work. It is being submitted for the
degree of Doctor of Philosophy from the University of Wollongong. It has not been
submitted before for any degree or examination at any other University.
3 ° dav of T)ecerf\W;( 19^0

i v
ACKNOWLEDGEMENTS
I wish to thank the University of Wollongong for the scholarship awarded to me
during the period of study.
I am much indebted to Professor Helen Garnett, Head of the Department of Biology,
University of Wollongong, for her supervision, guidance and encouragement
throughout this project. Helen, for all your help and understanding, thank-you.
My debt and gratitude is also extended to the many people, colleagues and friends,
who in numerous ways have given m e support and helped m e weather the last few
years. A few, Ashlee, Greg, Daniel and Christine, deserve special thanks for
reasons too extensive to mention here, Dr. Glenda Sullivan-Tailyour and Debra for
their careful proof-reading and comments and finally to Donna for, amongst other
things, the laughter.
The last word of acknowledgement is to my family for being there and lastly and in
dedication: To the memory of my parents
There is no armour against fate;
James Shirley, The contention of Ajax and Ulysses (1659).

Abbreviations
A C M D african cassava mosaic disease
ACMV african cassava mosaic virus
BAP 6-benzylamino purine
bp base pair
CBB cassava bacterial blight
CFE cell free extract
cfu colony forming unit
CIAT Centro Internacional de Agricultura
Tropical (International centre for
Tropical Agriculture)
CLV cassava latent virus
C M D cassava mosaic disease
CTAB cetyltrimethylammonium bromide
Cv. cultivar
Da dalton
DLVO due to Derjaguin and Landau; Verwey and
Overbeek
DNA deoxyribose nucleic acid
°C degrees centigrade
2,4-D 2,4-dichlorophenoxyacetic acid
EDTA ethylene diamine tetra-acetic acid
E C European economic community
EPS exopolysaccharide
FAD Food and agriculture organisation
FDA fluorescein diacetate
gram

vi
GA3 gibberellic acid
GC-MS gas liquid chromatography-mass
spectrometry
h hours
ha hectare
HCI hydrochloric acid
HR hypersensitive response
2ip 2-isopentenyladenine
Kb Kilobase
Kinetin 6-furfurylamino purine
Kcal Kilocalories
I litre
M Molar
M D A multiple drop array
M E 2-mercaptoethanol
min minutes
ml millilitre
m m millimetre
mmol millimolar
MOPS 3-N-morpholino propane sulphonic acid
M S Murashige-Skoog medium
M S * modified Murashige-Skoog medium
MSX 1.5x Murashige-Skoog medium
NAA 1-naphthaleneacetic acid
NW3 nutrient agar + 5 % glucose
nm nanomole
l\M3 nutrient yeast extract glucose agar
p proliferation medium
PAGE polyacrylamide gel electrophoresis

polysaccharide
parts per million
pathovar
red blood cells
relative humidity
revolutions per minute
sodium dodecyl sulphate
subspecies
tonne
trimethylsilyl
microlitre
microgram
micromolar
void volume
volts
volume per volume
weight per volume

V I I I
CONTENTS
TITLE PAGE
ABSTRACT
DECLARATION
ACKNOWLEDGEMENTS
ABBREVIATIONS
TABLE OF CONTENTS
UST OF TABLES
LIST OF FIGURES
Page
i
ii
v
v
viii
xiv
xvi
1.0 INTRODUCTION
1.1 Cassava
1.1.1 Cassava Tissue Culture
1.1.2 Cassava Diseases
1.2 Bacteria as Plant Pathogens
1.2.1 Pathogenicity and Virulence Factors
1.2.1.1 Plasmids in Phytopathogenic Bacteria
1.2.1.2 The Capsule and Exopolysaccharide
1.2.2 Recognition and Specificity
1.2.2.1 Pili and Fimbriae
1.3 Separation and Purification of Surface Components
1.3.1 Purification of Pili
1.3.2 Isolation of Exopolysaccharide
1.3.2.1 Monosaccharide Composition Analysis of EPS
by Gas-Liquid Chromatography-Mass
Spectrometry (GC-MS)
1.4 Plant Tissue Culture
1.4.1 Protoplast Isolation
1.4.1.1 Protoplast Purification
1
1
4
4
7
10
1 1
12
20
21
23
23
24
25
26
27
30

1.4.1.2 Protoplast Viability 31
1.4.2 Protoplast Culture 3 2
1.4.2.1 Plantlet Regeneration 3 7
1.4.3 Callus Production 3 8
1.4.3.1 Callus Regeneration 41
1.4.4 Establishment of Suspension Cultures from Callus 4 4
1.4.5 Meristem Tip Excision and Regeneration 4 8
1.4.5.1 Establishment and Development of the Explant 4 9
1.4.5.2 Multiplication of Shoot Buds
- Clonal Propagation 5 1
1.4.5.3 Transplantation to Soil 5 2
1.5 The Use of Plant Tissue Cultures in
Study of Phytopathogens 5 3
1.5.1 Development and Use of Bioassays 5 3
1.5.2 Plant Tissue Cultures as Assay Systems 5 5
1.5.2.1 Plant Bacterial Interactions Using
Tissue Cultures 5 8
1.6 Experimental Objectives 6 1
.0 MATERIALS AND METHODS 6 3
2.1 Plant material 6 3
2.2 Protoplast Isolation 6 4
2.2.1 Protoplast Viability Determinations 6 6
2.2.2 Protoplast Culture and Regeneration 6 6
2.2.2.1 Broad Spectrum Medium
Experiment 6 8
2.3 Callus Production 6 9
2.3.1 Regeneration of Callus 7 0
2.3.2 Initiation of Suspension Cultures 71

2.3.3 Growth Characteristics
2.3.3.1 Determination of Packed
Cell Volume 7 2
2.3.3.2 Determination of Cell
Number 7 3
2.4 Meristem Tip Excision and Propagation 7 4
2.4.2 Acclimatisation to Soil 75
2.5 Bacterial Stocks 7 6
2.5.1 Bacteriocin Production 7 6
2.5.2 Electron Microscopy 7 7
2.6 Precipitation and Separation of Bacterial
Extracellular Material 7 7
2.6.1 Isolation of Exopolysaccharides 7 9
2.6.2 Preparation of EPS Samples for G C - M S 8 1
2.7 Pilin Protein Purification 81
2.7.1 Polyacrylamide Gel Electrophoresis (PAGE) 8 2
2.7.2 Haemagglutination 8 3
2.8 D N A Extraction 8 4
2.8.1 Alkaline Lysis Plasmid D N A Miniprep 8 4
2.8.2 Large Scale Plasmid D N A Preparation 8 5
2.8.3 Extraction of Chromosomal D N A 8 6
2.8.4 Agarose Gels 8 7
2.9 Infection of Suspension Cultures With Bacteria 8 7
2.9.1 Bacterial Growth in Cell Suspension
Medium 8 7
2.9.2 Bacterial Growth in Cassava Cell
Suspension Cultures 8 8
2.9.3 Addition of Bacterial Cell Free Filtrate to
Cassava Cell Suspension Cultures 8 8

XI
2.9.4 Protoplast Assays 8 9
2.9.4.1 Protoplast Regeneration Assay 8 9
2.10 Bioassays 9 0
2.10.1 Detached Leaf Bioassy 9 0
2.10.2 Electrolyte Leakage 9 0
2.10.3 Polyphenol Oxidase Assay 9 1
2.10.4 Plantlet Assays 91
3.0 RESULTS 93
3.1 Protoplast Isolation and Regeneration 9 3
3.1.1 Growth Requirements of Donor Plants 93
3.1.2 Isolation Procedures 93
3.1.3 Regeneration Studies 9 5
3.2 Callus Production 101
3.2.1 Regeneration of Callus 104
3.2.2 Initiation of Suspension Cultures 104
3.3 Meristem Propagation 11 5
3.3.1 Acclimatisation to Soil 1 1 5
3.4 Bacterial Growth and Structure 11 6
3.5 Bioassays 11 6
3.5.1 Electrolyte Leakage 11 6
3.5.2 The Detached Leaf Assay 11 9
3.6 Pathogen - Tissue Culture Interactions 11 9
3.6.1 Infection of Suspension Cultures with
Bacteria 11 9
3.6.2 Inoculation of Suspension Cultures with
Bacterial Cell Free Filtrates 1 21
3.6.3 Protoplast Assay - Cell Free Filtrate 1 21

XII
3.6.3.1 Protoplast Division Assay - Addition
of Cell Free Filtrate
3.7 Precipitation and Separation of Extracellular Material
3.7.1 Exopolysaccharide - Purification and Separation
3.7.1.1 GC-MS Analysis
3.7.2 Protein
3.7.2.1 Electron Microscopy
3.7.2.2 Purification of Pilin
3.7.2.3 Haemagglutination
3.7.3 Plasmid DNA Extraction
3.8 Cell Culture Assays Using Purified Polysaccharide
3.8.1 Suspension Culture Assay - Purified EPS
3.8.2 Protoplast Assay - Addition of Purified EPS
3.8.3 Protoplast Division Assay - Addition of
Purified EPS
3.9 Plantlet Assays
130
133
135
144
147
148
157
160
165
165
165
165
169
169
4.0 DISCUSSION 176
5.0 GENERAL CONCLUSIONS 206
APPENDIX
Appendix i. M S * medium
Appendix ii. Enzyme and rinse solution
Appendix iii. Holding solution
Appendix iv. Plating medium
Appendix v. Proliferation medium
Appendix vi. M S X medium
Appendix vii. Broad spectrum medium components
208
209
210
211
212
214
215
216

Appendix viii. Eradication Medium
Appendix ix. Nutrient yeast extract glucose agar 2 2 0
Appendix x. Polyacrylamide gel electrophresis 221
Appendix xi. HA buffer 2 2 5
Appendix xii. Plasmid solutions and agarose gels 226
Appendix xiii. G C - M S analysis of T M S methyl glycosides 228
REFERENCES 241

LIST OF TABLES
XIV
T A B L E 1 Protoplast yields and viabilities
T A B L E 2 The 116 media selected from the first
broad spectrum medium screen found to support
protoplast division.
T A B L E 3 A comparison of initial plating medium
and the new formulation PI-85.
T A B L E 4 Plating efficiency of protoplasts in PI-85 medium.
T A B L E 5 Callus growth in M S * medium with varying
concentrations of 2,4-D and BAP.
T A B L E 6 Regeneration of callus.
T A B L E 7 Morphology of cells in suspension culture.
T A B L E 8a Growth of cassava suspension cultures
T A B L E 8b Packed cell volumes (%) of cassava suspension
cultures.
T A B L E 9 Protoplast viability after exposure to bacterial
conditioned medium.
T A B L E 10 Amount (u.g) of fractionated bacterial extracellular
material obtained after column chromatography.
T A B L E 11 Suspension culture viability (%) after incubation
with fractionated extracellular material from the
3 bacterial strains.
T A B L E 12 Yield of purified E P S (from 20 N A + 5 %
glucose plates) produced by the bacterial strains.
ECU, la and Xiib after a 48 h culture period.
Page
94
99
102
103
105
107
109
113
1 14
132
140
142
145

13 Area percentage report of total ion current for
TMS-methyl glycosides for standard monosaccharides
and monosaccharide peak identification by GC-MS. 1 50
T A B L E 14 Area percentage report of total ion current for
TMS-methyl glycosides released from E P S of bacterial
strain ECU and monosaccharide peak identification
by GC-MS. 152
T A B L E 15 Area percentage report of total ion current for
TMS-methyl glycosides released from E P S of bacterial
strain la and monosaccharide peak identification
by GC-MS. 154
T A B L E 16 Area percentage report of total ion current for
TMS-methyl glycosides released from E P S of bacterial
strain Xiib and monosaccharide peak identification
by GC-MS. 156
T A B L E 17a Haemagglutination by partially purified pili
from the 3 bacterial strains, la, Xiib, and ECU. 1 67
T A B L E 17b Haemagglutination inhibition. 1 6 7
T A B L E 18 Viability of protoplasts after incubation with
purified bacterial polysaccharide. 1 72

xvi
LIST O F FIGURES
Page
Figure 1 Light micrograph of freshly isolated protoplasts
of Groot Rooi 9 6
Figure 2 Light micrograph of a "budding" protoplast of Groot Rooi. 9 7
Figure 3 Light micrograph of Groot Rooi protoplasts cultured
in PI-85 medium. 1 00
Figure 4 Micrograph of representative Groot Rooi protoplasts
showing shrinkage and occasional cluster formation when
cultured in all other media. 1 00
Figure 5 Cell suspension culture of Groot Rooi 11 0
Figure 6a Growth curve of cell suspension cultures of
Groot Rooi. 111
Figure 6b Packed cell volumes (%) of suspension
cultures of Groot Rooi. 111
Figure 7a Growth curve of cell suspension culture
of T M S 58308 in suspension culture medium. 1 1 2
Figure 7b Packed cell volume (%) of suspension
culture of T M S 58308. 1 1 2
Figure 8 Colony appearance of pathogenic field strains and
a non pathogenic strain of Erwinia herbicola . 117
Figure 9 Electron micrographs of whole cells of
the 3 bacterial strains. 11 8
Figure 10a The effect of the 3 Erwinia herbicola
strains on the leakage of electrolytes from
leaf tissue. 1 20
Figure 10b The effect of bacterial conditioned medium
on electrolyte leakage from leaf tissue. 1 20

xvii
Figure 11 Bacterial cell growth in plant cell
suspension medium. 1 22
Figure 12 Bacterial cell growth in Groot Rooi cell
suspension cultures. 1 2 3
Figure 13 Bacterial cell growth T M S 58308 cell
suspension cultures. 1 24
Figure 14 Viability of cultivar Groot Rooi cells
after inoculation with bacteria. 1 2 5
Figure 15 Viability of cultivar T M S 58308 cells
after inoculation with bacteria. 126
Figure 16 Viability of (a) Groot Rooi and (b) T M S 58308
suspension culture cells with increasing concentrations
of bacterial cell free filtrate 1 2 7
Figure 17 Viability of suspension culture cells of cassava
cultivars on incubation with increasing
concentrations of bacterial cell free filtrate 1 2 8
Figure 18 The viability of freshly isolated protoplasts
after incubation with bacterial cell free filtrates. 1 31
Figure 19 Plating efficiency (%) of protoplasts after addition
of 1 0 % (v/v) bacterial cell free filtrate. 1 3 4
Figure 20 Fractionation of extracellular material of
strain ECU on Sephacryl S-300 HR. 1 3 6
Figure 21 Fractionation of extracellular material of
Strain la on Sephacryl S-300 HR. 1 3 7
Figure 22 Fractionation of extracellular material of
strain Xiib on Sephacryl S-300 HR. 1 3 8
Figure 23 Fractionation of extracellular material
in the acetone soluble fraction. 1 39

X V I I I
Figure 24 The elution profiles obtained after separation of
E P S purified from the 3 bacterial strains through
a Sephacryl S-500 HR column. 1 46
Figure 25 Total ion current of TMS-methyl glycosides
of standard monosaccharides. 1 49
Figure 26 Total ion current of TMS-methyl glycosides
obtained from EPS produced by the
non pathogenic strain ECU. 1 51
Figure 27 Total ion current of TMS-methyl glycosides
obtained from EPS produced by the pathogenic
strain la. 1 53
Figure 28 Total ion current of TMS-methyl glycosides
obtained from EPS produced by the pathogenic
strain Xiib. 155
Figure 29 Production of polyphenol oxidation products
in broad bean leaf homogenates in response
to pooled column eluates. 158
Figure 30 Electron micrographs of bacterial cells of strain ECU. 159
Figure 31 Electron micrographs of purified pili from
the bacterial strains. 161
Figure 32 Elution profile of a purified pili preparation
from strain ECU from a Sepharose CL-4B column. 1 62
Figure 33 Elution profile of a purified pili preparation
from strain la from a Sepharose CL-4B column. 1 62
Figure 34 Elution profile of a purified pili preparation
from strain Xiib from a Sepharose CL-4B column. 1 63

igure 35 Haemagglutination of human type A erythrocytes
by bacterial cells. 1 66
Figure 36 Agarose gel electrophoresis of plasmid D N A
preparations. 168
Figure 37 The effect of purified E P S on the viability
of plant suspension cultures. 1 71
Figure 38 The effect of purified EPS on cassava
protoplast plating efficiency. 1 73
Figure 39 Leaves from regenerated plants inoculated with
bacterial strains la, ECU and a medium control. 1 74
Figure 40 Symptoms on cassava leaves after
inoculation with 1 0 % (v/v) bacterial cell free
filtrates. 17

1
1.0 INTRODUCTION
1.1 Cassava
Cassava (Manihot esculenta Crantz ) probably originated in the northern part of
South America, where it has been cultivated for more than 5000 years (Lozano,
Byrne and Bellotti, 1980). Around 400 years ago the Portuguese introduced
cassava on the west coast of Africa via the gulf of Benin and Congo river and later on
to the east coast via the islands of Reunion, Madagascar and Zanzibar (Jennings,
1970). From Africa, cassava material was introduced to Asia. Later, cassava
material was introduced directly from South America to Asia and Australia. Cassava
probably came into Australia late in the last century as human food, in association
with labourers involved in the early tropical development. A number of cultivars of
the original cassava planting material have been collected and are now described
under the code MAus 1-22; the origin of this material is unknown. A small number
of cultivars has been introduced from Puerto Rico, Thailand and the International
Centre for Tropical Agriculture (CIAT) Colombia (Wilson, 1979). Australian
interest in cassava focuses on its potential as a competitive source of starch for use
in food preparations and industrial processes. Cassava starch is low in amylose and
high in amylopectin, giving it unusual viscosity and great dimensional strength,
which is of particular value to food, textile, paper and adhesive industries (Smith,
Biggs and Scott, 1986 a).
The ecological zone of the cassava belt corresponds roughly with that region classified
by the Food and Agriculture Organization (FAO) as economic class 2 - the third world
countries. This region accounts for 46 % of the world's population but only 13 % of
the worlds gross domestic product (Lozano,1977). It was estimated in 1973 that up
to 300 million people in the world's tropical areas were heavily dependent on
cassava as a major carbohydrate source (Peterson and Yang, 1976). With the ever
3 0009 02980 4783

2
increasing world population, the continuing lack of food and energy sources has
placed stress on the production of maximum cassava yields. Indeed, as a source of
food and energy supply, cassava plays an important role and has a much greater
potential than other food crops. Cassava productivity in terms of calories per unit
land per unit time is significantly higher than that of other staple food crops such as
rice, maize, sorghum and wheat (Coursey and Haynes, 1970). De Vries, Ferwerda
and Flach, (1976), found that in general root crops have a far higher production
potential than grain crops.
Cassava is very efficient and is capable of producing 250 Kcal/ha/day. Not only is
cassava the most important root crop of the tropics, its production being much
greater than yams, sweet potato, elephant yam and taro put together, but it is also the
most ubiquitous, being grown almost everywhere ecological conditions permit
(Coursey.1983). On an energy production basis, cassava is fourth among major food
crops in developing countries, after rice, wheat and maize (De Bruin and Fresco,
1989). Total cassava production in South America, Africa and Asia was estimated in
1984 at 129 x 10 6 tonnes per annum, from a net cropped area of 14 - 15 million
ha, yielding an average production of 8500 kg/ha (Balgopalan, Padmaja, Nanda and
Moorthy, 1988). Africa produces 49 x 10 6 tonnes of the annual world cassava
yield (Christie, 1987). This production constitutes 4 0 % of the food production
from 5 5 % of the total area under cultivation. Both tubers and fresh young leaves are
used as human food. Cassava can also be used as livestock feed. In addition to chips
and broken fresh roots, the leaves are also used as fodder during drought when other
feedstuffs become scarce (Seif and Chogoo,1976). It has entered world trade as a
livestock feed export from Thailand to E E C countries (Phillips,1974).
Despite its many advantages and the fact that world production of cassava increased
by 24 % between 1971 and 1981, the importance of cassava, relative to cereals, has

3
decreased. This suggests that on a world-wide scale cassava is becoming relatively
less important (De Bruin and Fresco, 1989). The implementation of foreign aid
programmes, often in the form of subsidies for food that is not grown locally, has
created the belief that cassava is 'poor folks food' (Cooke and Cock, 1989). In Brazil,
subsidies make bread cheaper than cassava and consequent failure of the market has
caused a migration of farmers to the cities. A growing dependency on imported food
and the consequent neglect of traditional local crops, that can give excellent yields, is
a disturbing trend. With the uncertainties associated with long term food aid and the
trend towards agro-industrial development in tropical countries, this might change
(Cooke and Cock, 1989).
Indeed, the future for cassava may lie with its use in secondary products. These
include animal feed, cassava flour as a partial substitute for wheat in bread, alcohol
and as industrial starch used in the paper and fabric industries. Starch and starch
derivatives such as dextrins, glucose and high fructose syrup are the main products
of the cassava agro-industry. Large scale operations in Thailand, Brazil, the
Philippines and Indonesia produce 8 % of the world's starch (Cooke and Cock, 1989).
Cassava has a high yield potential (De Vries etal, 1976; De Bruin and Fresco,
1989). However, in West and East Africa annual commercial yield per unit area is
about 7 t per ha, this is low when compared to potential yields of 20 t per ha
(Hahn,1982). Indeed, with high yielding varieties and better packaging practices
the yield could be as high as 40 to 60 t/ha (Balagopalan et al, 1988). This low yield
has generally been attributed to inadequate agronomic practices, as well as to the lack
of improved high yielding cultivars resistant to diseases and attack by pests (Lozano ,
Byrne and Bellotti,1980).

4
1.1.1 Cassava Tissue Culture
The effective solution to disease problems in cassava requires application of a wide
variety of both standard and new technologies to crop management and yield
improvement. Recent advances in the development of in vitro techniques with higher
plants permit their application to practical problems related to agricultural crops.
Most cassava tissue culture work has been aimed at virus eradication through
meristem tip culture (Berbee, Berbee and Hildebrandt, 1973; Kartha and Gamborg,
1975; Kaiser and Teemba, 1979; Adejare and Coutts, 1981). Subsequent clonal
propagation of healthy, symptom free plant stocks, has facilitated global exchange and
long term storage of germplasm (Roca, 1984; Smith, Biggs and Scott, 1986b).
Compared to the state of meristem and shoot-tip culture, the development of cell,
callus, protoplast and anther culture is still in its infancy. Although somatic
embryogenesis has been reported for cassava, routine regeneration from callus
tissue, cells and protoplasts, apart from isolated reports (Tilquin, 1979; Shahin
and Shepard, 1980), is still to be realized. The failure of plant regeneration from
isolated cassava protoplasts has been recognized as a major barrier to the use of
protoplasts in an improvement programme for this important crop (Cassava
programme, Annual reports, 1982/83, 1984 and 1985). Development of these
techniques and procedures is essential for disease study and eventually for the
application of genetic engineering schemes to cassava improvement and development
of pathogen resistance.
1.1.2 Cassava Diseases
Cassava is susceptible to a wide variety of diseases caused by bacteria, viruses and
fungi (Lozano,1972 ; Martinez-Lopez,1979). To increase cassava yields to a

5
maximum it is important that knowledge and control of the many diseases that reduce
cassava yield be increased (Lozano and Booth,1974).
On a global scale, cassava bacterial blight (CBB) disease is considered one of the most
devastating as it results in complete loss of the crop under certain conditions.
Cassava bacterial blight was first recorded in Brazil but is now widely spread
throughout Central and South America, Asia and Africa (Balagopalan et a/,1988).
The causal organism of this disease, Xanthomonas campestris pv.manihotis,
specifically infects Manihotis spp. Cultural, morphological, physiological and
serological studies of Xanthomonas campestris pv.manihotis isolates from Africa,
Asia and America show similar species characteristics. Considering the above, it was
concluded that the pathogen was probably introduced from America to Africa and Asia
via infected plant material. This introduction caused serious economic damage in
African cassava growing areas and poses a threat to productivity in Thailand and
Malaysia (Lozano,1977 and Daphne,1980). Under favourable environmental
conditions and poor cultural practice, crop loss by cassava bacterial blight infection
can reach 8 0 % (Lozano, 1989). Perreaux, Maraite and Meyer (1982, 1986) have
identified 3(methylthio) propionic acid produced by Xanthomonas campestris pv.
manihotis, both in vitro and in vivo as having a phytotoxic effect. However, the
plausibility of such toxic action has been contested by Robeson and Cooke (1985),
who concluded that the weak phytotoxic action is due to the elevated hydrogen ion
activity at the relatively high concentrations of material required to show toxicity.
Many other diseases are less widespread but can cause severe disease (Lozano and
Booth,1974).
A disease, similar in field symptoms to cassava bacterial blight, causes sporadic crop
losses in southern Africa. Two strains of a causative bacterium, isolated from
diseased plants, have been identified (Whitlock, Hill and Cowley, 1986). Primary

6
cultures of these strains, la and Xiib, produce yellow mucoid colonies containing
gram-negative motile cocco-bacilli 0.8 x 1.9 - 2.1 urn with variable peritrichous
flagella. Optimum growth is between 25 -35°C, but growth at 11°C and 40°C also
occurs. Based on cross-agglutination both strains, la and Xiib, which induced disease
symptoms were serologically indistinguishable from Erwinia herbicola strain ECU
(ATCC 23372) (Whitlock, Hill and Cowley, 1986). Further biochemical tests have
characterized these two strains, la and Xiib, as members of the Erwinia herbicola
(Lohnis) Dye - Enterobacter agglomerans (Ewing and Fife) complex (Whitlock et al,
1 9 8 6 ) .
Although the symptomology of this disease is sufficiently similar to cassava bacterial
blight to cause confusion in the field, important differences occur. Symptoms in
experimental plants differ from those of cassava bacterial blight in that necrotic
lesions appear later, are never watersoaked and only 4 0 % exude gum. The initial
leaf symptoms are small often angular chlorotic lesions followed by marginal curling
and tip necrosis. Rapid leaf wilt and abscision follows. In severe cases tips of young
shoots also become necrotic. Although collapse of leaves suggested systemic infection
or production of a toxin, the nature of the pathogenicity of strains la and Xiib
remains to be elucidated (Whitlock etal, 1986).
The strain ECU (ATCC 23372) was originally isolated from cassava and named
Erwinia cassavae by Burkholder (1948). This organism was initially described as
a pathogen of cassava but was later found to have been co-isolated with the causal
organism of cassava bacterial leaf spot or necrosis, Xanthomonas campestris
pv.cassavae (Wiehe and Dowson, 1953; Dye, 1969; Van Den Mooter, Maraite,
Meiresonne, Swings, Gillis, Kersters and De Ley, 1987). The strain, ECU (ATCC
23372), is indistinguishable from Erwinia herbicola and is not pathogenic on
cassava. This strain was used in the current study as the non pathogenic control.

7
1.2 Bacteria as Plant Pathogens
Both plants and animals are in constant contact with a wide range of bacteria.
However, of these only a small number are able to colonize a particular host and
interfere with normal growth and development and cause serious disease. Research
on plant-bacterial diseases has increased over the past 20 years. This has led to an
increased understanding of the nature and properties of some of the molecular and
cellular interactions between host plant and bacteria, especially those taking place at
the cell surface.
Bacterial diseases are generally of lower economic importance than diseases caused by
fungi or viruses, although the destruction, resulting from infection by a bacterial
pathogen, in successive seasons may mean an otherwise profitable crop cannot be
grown. The economic importance of bacterial disease is greater in the tropics than in
more temperate climates. Severe crop losses have been reported in some years for a
number of the staple food crops including rice {Xanthomonas campestris pv. oryzae ),
wheat {Pseudomonas syringae ), soya bean {Pseudomonas syringae pv. glycinea ),
cassava {Xanthomonas campestris pv.manihotis) and potato {Erwinia carotovora ).
The bacterial blight-like disease of cassava, caused by a member of the Erwinia
herbicola - Enterobacter agglomerans group under investigation in this study, could
also cause severe crop losses under certain conditions, especially under monocrop
plantation conditions.
A large number of diverse plant pathogens are grouped in the Enterobacteriaceae
within the genus Erwinia. This genus includes pectolytic macergens, necrogens,
which cause wilt or blight disease but have no discernible pectolytic activity, and a
non-pathogenic common saprophyte, Erwinia herbicola (syn. Enterobacter

9
The development of disease in plants by bacteria is the result of a series of
complementary reactions involving the interaction of molecular components of both
the host and pathogen. These are recognition, multiplication of the pathogen and
finally stimulation or inhibition by the host.
Host - pathogen cell surface component interactions are probably an important
determinant of compatibility and occurrence of disease, while multiplication and
translocation within the host is more likely to be dependent on metabolic capabilities
of the pathogen (Vidaver and Chaterjee, 1986). Indeed, a number of metabolites
produced by phytopathogenic bacteria in planta may serve to enhance and perhaps be
critical for the development of the disease. "In the broadest sense a bacterial
phytotoxin is considered as a compound of any size or chemical composition arising
from a bacterial phytopathogen that adversely affects the normal metabolism of the
plant, resulting in cell death "(Strobel, 1977). Phytopathogenic bacteria are able to
cause disease symptoms, including tissue destruction, by virtue of their interference
with normal stuctural, physiological or metabolic systems of the host plant.
For maximum pathogenic potential, a pathogen must be able to rapidly colonize tissue
and reach high population levels before the plant's response limits bacterial growth.
In addition to producing specific virulence factors, successful pathogens are often
able to increase susceptibility of the host to infection. To fully characterize such
factors a distinction should be made between pathogenicity products and those
influencing virulence; however this is often not easily achieved (Billing, 1987).
In plants, the incompatible reaction leading to a halt in disease progression is known
as the hypersensitive response (HR). The sequence of events can be divided into
three stages; an initial induction period, followed by a latent period and then a final
necrotic stage. The necrotic stage is characterized by leakage of electrolytes, death of

the plant cell and tissue collapse. Death is usually accompanied by tissue browning
due to oxidation of phenols released by the plant as a response to wounding. The
rapidity with which the host responds to the invading pathogen may be an important
factor in disease resistance (Addy ,1976). It has been suggested that in the
compatible reaction the H R is suppressed. The presence of a capsule and production
of extracellular polysaccharide have been implicated in this suppression and thereby
enhance the likelihood of disease (Sequeira, Gaard and de Zoeten, 1977; Mazucchi, El
Banoby and Rudolph, 1984; Duvick and Sequeira, 1984; Billing, 1987).
1.2.1 Pathogenicity and Virulence Factors
The major pathogenicity factors involved in bacterial plant disease are: a) enzymes,
which by degradation of plant cell walls or other structures, allow entrance of the
pathogen and dissemination throughout the host and b) toxins that injure or kill the
plant cells , enabling colonization by the pathogen. The role of these factors is either
as requisites for basic pathogenicity i.e. essential for the pathogen to cause disease,
or as virulence factors increasing the extent and severity of the disease (Keen and
Staskawicz, 1988; Mitchell, 1989). The basis of pathogenicity is little understood.
Once initial identification and characterization of pathogenicity or virulence factors
has been achieved, the use of molecular genetics can only serve to increase this
understanding. Generally, studies in this area have attempted to locate, clone and
identify any genes involved in pathogenicity. This is usually achieved with
transposon mutagenesis and construction of a genomic library in a wide host range
cosmid vector (Kerr, 1987).

11
1.2.1.1 Plasmids in Phytopathogenic Bacteria
Plasmids are often responsible for the adaptation of bacteria to specific ecological
niches. Furthermore, they may have a role in the determination of virulence of plant
pathogenic bacteria (Boucher, Martinel, Barberis, Alloing and Zischek, 1986).
Simpler extraction procedures have increased plasmid isolation from many
organisms (Kado and Liu, 1981; Takahashi and Nagano, 1984). Plasmids have now
been reported in all genera of plant pathogenic bacteria. There are usually 1-3
plasmids per bacterium but up to 13 have been found in some strains of Erwinia
stewartii (Billing, 1987). However, the functions encoded by these plasmids and
the advantage of these to the bacterium is not always certain (Coplin, 1982).
It is clear that many of the traits encoded on plasmids, such as nutritional
capabilities, antibiotic resistance, adherence factors and production of/or resistance
to bacteriocins, could be useful to plant pathogens in adapting to their environment
and competing with other microflora (Coplin, 1989). In Erwinia herbicola,
thiamine prototrophy, yellow pigmentation and bacteriocin production, are plasmid
borne (Gantotti, Kindle and Beer, 1981; Gantotti and Beer, 1982). A number of
important virulence plasmids in plant pathogenic bacteria have been isolated
(Coplin, 1989). An ubiquitous 30Kb plasmid has been recovered from numerous
strains of Erwinia amylovora isolated from various hosts and sources. Cured strains
showed impaired virulence and pathogenicity (Laurent, Barny, Kotoujansky,
Dufriche and Vanneste, 1989; Falkenstein, Zeller and Geider, 1989).
Plasmid DNA has been implicated in the production of both phaseolotoxin and
syringomycin. However, chromosomal rather than plasmid locations for these genes
have been identified. Conversely, coranatine, the chlorosis inducing toxin produced

by Pseudomaonas syringae pvs. glycinea, tomato, atropurpurea and morsprunorum,
is plasmid encoded (Bender, Malvick and Mitchell, 1989).
The majority of virulence genes in Pseudomonas solanacearum may be encoded on a
<1000 Kb megaplasmid (Boucher etal, 1986). Conversely, in Xanthomonas
campestris pv. vesicatoria , a plasmid bearing genes for copper resistance, bears an
avirulence gene that interacts with the B S gene of pepper to give incompatibility
(Stall, 1987). Three different Xanthomonas campestris pv. vesicatoria avirulence
genes have been identified. These specify disease resistance on lines of pepper
carrying corresponding resistance genes (Minsavage, Dahlbeck, Whalen, Kearney,
Bonas, Staskawicz and Stall,1990). This evidence implicates a gene for gene model
of resistance in the pepper-Xanthomonas campestris pv. vesicatoria interaction.
Pseudomonas syringae pv. tomato also contains a plasmid encoding copper resistance.
Protection of seeds, against these seed borne pathogens, by copper containing sprays
may select for copper resistance (Bender and Cooksey, 1986).
1.2.1.2 The Capsule and Exopolysaccharide
Bacteria produce polysaccharides as components of their cell wall structure and in
many species as extracellular polysaccharides (EPS). These may occur as rigid or
deformable capsules on the bacteria or as free, water soluble or insoluble polymers.
There appears to be a preference to differentiate between the material adhering to the
cell as a capsule and that secreted into the medium as EPS. However, secretion
probably indicates hyperproduction of material adhering to the cell (Troy, 1979;
Kenne and Lindberg, 1983; Sutherland, 1985 and Billing, 1987). Polysaccharide
production varies markedly. Polymers produced are composed of neutral sugars with
either a limited or wide range of uronic acids (Sutherland, 1985). Where EPS is

produced, cell wall antigens are masked and immunological properties are conferred
by the E P S (Kenne and Lindberg, 1983).
The capsule extends the cell surface for cell activity but prevents rapid diffusion. A
large number of polymers can be classed, due to their electrochemical properties, as
polyelectrolytes. This property is highly pH dependent and has a significant effect on
the physiochemical properties of these molecules regarding their solution properties
and interaction with the solid phase (Harris and Mitchell, 1973). The capsule will
affect access by ions, attract and concentrate nutrients and hold extracellular
enzymes. Due to the hydrophilic nature of the capsule, it also absorbs and binds
water, buffering the bacterial cell against rapid hydration and dehydration (Billing,
1987). Capsular polymers are not essential for cell growth. However, the presence
of a capsule influences recognition and interactions between cell - host, cell - virus,
cell - cell or cell - effector molecule and hence affects the ability of a bacterium to
colonize a given niche (Troy, 1979; Coplin and Cook, 1990).
Exopolysaccharides are involved in bacterial cell-cell aggregation reactions by
macromolecular bridging and can inhibit respiration and the growth of viable cells
(Harris and Mitchell, 1973). The importance of aggregation reactions is partly a
function of the hydrophobicity / hydrophilicity of the interacting surfaces. If the
mechanism of microbial aggregation is due to macromolecular bridging between
adjacent molecules, E P S excreted or exposed on the surface must be present at near
optimal concentrations and extend to adjacent cells. Indeed, enhanced capsular
growth leads to enhanced bacterial aggregation, while the removal of such material
causes formation of stable colloidal suspensions (Harris and Mitchell, 1973).
Bacterium-plant host interactions can lead to wilting, resulting not from the high
molecular weight of the polysaccharide, but from the polymer-polymer interactions
which occur in water solutions.

14
Bacterial E P S is a collection of highly charged molecules with the capacity for strong
intermolecular interaction between themselves and plant derived molecules. Such
interactions, even at low concentrations, greatly alter the physical properties of EPS
solutions and must be considered in any hypothesis designed to explain formation of
wilt symptoms (Sijam, Goodman and Carr, 1985). Sutherland (1985) suggests that
the presence of acyl groups - the most common being o-acetyl, pyruvate and ketal
groups - are a likely influence on the specificity of the E P S molecule. However, a
study by Goodman (1987) using nuclear magnetic resonance spectroscopy (NMR),
showed that neither acetate or pyruvate side chain decorations significantly
influenced virulence. Similar acetate and pyruvate decorations were found in
purified E P S from both virulent and weakly virulent strains.
EPS has frequently been implicated as an important factor in phytopathogenicity of
such bacteria as Erwinia amylovora, Erwinia stewartii, Pseudomonas solanacearum ,
other pseudomonad subspecies, Xanthomonas campestris pv. campestris,
Xanthomonas campestris pv. oryzae and other xanthomonads (Rudolph, 1976;
Daniels, D o w and Osbourn, 1988; Van Alfen, 1989). The two observations supporting
an essential role for E P S in pathogenicity are altered virulence of capsular mutants
and pathological responses induced by fractionated polymers. However the primary
step in the virulence sequence which permits bacterial growth and accumulation of
EPS remains unknown (Goodman, 1987).
Specific roles attributed to EPS in virulence include: induction of water soaking
symptoms, presumably a consequence of its hydrophilicity and water holding
capacity; occlusion of vessels leading to wilt; blocking recognition at the
bacterium-plant cell interface; prevention of bacterial dessication; a protection
mechanism against plant defence molecules.

Water soaking induced by purified E P S or live whole bacteria is a pathogenic
condition resulting from the movement of intracellular water into the intercellular
space. The intercellular space within the mesophyll tissue is usually air filled, and
thus does not readily support the physiological activities of bacteria. However, upon
introduction into the mesophyll tissue, many phytopathogenic bacteria synthesize
copious amounts of E P S which, by causing abnormal water movement from the plant
tissue, enables bacterial growth and multiplication (El Banoby and Rudolph,
1979a,b, 1980; Sjulin and Beer, 1978; Rudolph, El Banoby and Gross, 1987). The
role of water retention in suppression of the hypersensitive reaction (HR) has
received much attention. Indeed, a variety of bacteria will grow in intercellular
spaces and prevent H R if the tissue is kept water soaked (Rudolph and Mengen, 1985;
Billing, 1987). Both LPS and E P S of Pseudomonas phaseolicola race 1 and 2,
Pseudomonas aptata , and Pseudomonas tabaci are able to interact at relatively low
concentrations with tobacco leaf tissue and can inhibit the H R caused by incompatible
bacteria (Mazzucchi, El Banoby and Rudolph, 1984). Infiltration of leaves, though
not inducing plant cell electrolyte leakage, can lead to persistent water soaking of the
infiltrated tissue if plants are kept under high humidity (El Banoby and Rudolph,
1979; Panopoulos and Peet, 1985).
Water movement within the vascular system of plants is susceptible to disruption by
embolism formation and/or plugging by very small numbers of macromolecules.
Thus, mechanisms based on metabolic inhibition or membrane effects are not
necessary to explain how picomole quantities of macromolecules cause plant cuttings
to wilt (Van Alfen, 1989). Clavibacter michiganense subsp. insidiosum causes a
large increase in resistance to water conductance through the leaf traces and leaflets
(Van Alfen, 1989). Increased resistance to water flow reduces leaf water potential
and results in stunted, chlorotic plants. No effect on plant membrane functions

occurs. As increased water flow resistance is found at some distance from the
bacterial cells, the role of a pathogen produced molecule is indicated. Indeed,
picomole quantities of certain polysaccharides completely plugged the pit membrane
pores and hence, the water conducting system of infected alfalfa. The pit membrane
pores of alfalfa are not the same size throughout the plant and, are larger in stems
than in leaf traces. Thus, a larger molecule is required to plug the pores of stems
than leaf traces. Susceptibility to plugging also varies in other locations within the
vascular system. The mesophyll cell walls of leaves, as part of the apoplastic
pathway of water movement, are critical to the distribution of water to leaf cells
some distance from vessels. Since pore sizes in the capillaries are much smaller than
those of the pit membranes, even smaller molecules can cause plugging. Capillary
pore size is not the only factor that influences the susceptibility of different areas of
the water conducting pathway to plugging of the capillaries. In addition to the
smaller pore sizes found in leaf traces, the low number of vessels in this region
increase the susceptiblity to plugging. There are few alternative routes around a
blockage, so fewer pit membranes must be plugged to cause a blockage at leaf traces
than in stems. Three E P S molecules, each of an appropriate size to block one of the
three known capillary pore sizes of the alfalfa water conducting pathway, are
produced by Clavibacter michiganense subsp. insidiosum (Van Alfen, 1989).
Evidence that the EPS of Erwinia amylovora, amylovorin, had properties of a host-
specific toxin increased speculation on the role of bacterial E P S as a plant 'toxin'.
Amylovorin or E P S production was first reported only in association with the host,
as a wilt inducing toxin (Goodman, Huang and Huang, 1974; Hsu and Goodman,
1978). Fractionated polysaccharide was alleged to be host-specific, causing both
wilt and necrosis symptoms (Goodman et al, 1974; Ayers, Ayers and Goodman,
1979). However, the toxic properties of amylovorin were disputed as both the EPS,
produced by the pathogen under in vitro conditions, and amylovorin caused wilting

(Sjulin and Beer, 1978; Bennet and Billing, 1980; Sijam Carr and Goodman,
1983). Amylovorin is, therefore, not host-specific and causes plant cuttings to wilt
by interfering with xylem conductance, presumably by plugging pit membrane
pores. Moreover, on infection by Erwinia amylovora, contact with surface
structures of cells, altered plant cell membrane permeability (Hignett, 1988 ).
Non capsular strains of Erwinia amylovora, obtained as laboratory mutants or as
naturally occurring strains, are generally non pathogenic or less virulent. Absence
of a capsule is associated with the development of a H R and failure to grow in apple
plants (Hignett and Roberts, 1985). At least some disease symptomology in the
fireblight syndrome can be attributed to the presence of EPS. This is reportedly
proportional to virulence but must at least be proportional to the number of bacteria
growing in the xylem vessels (Goodman, 1987). The controversy concerning
amylovorin and other E P S molecules thought to be wilt toxins has done much to spur
interest in the role of E P S in wilt type diseases.
The causal relationship of EPS to virulence remains to be completely defined.
Nevertheless, E P S can impair vascular transport by occlusion of xylem vessels
causing wilting, or by induction of xylem parenchyma plasmolysis. Bacterial E P S
probably restricts water flow by plugging pits in the walls of the annular and helical
vessels. Bacterial polysaccharide may also combine with plant cell wall
polysaccharides to form a gel. Gels formed in xylem vessels would disrupt water
flow. Moreover, the gel formed by an interaction between E P S and fibrils of the
vessel wall would aid in the stabilization of the E P S and its localization within the
xylem (Suhayda and Goodman, 1981). Occlusion of vessels is caused by a dense
fibrillar material associated with the presence of Erwinia amylovora populations
and may be largely E P S (Suhayda and Goodman, 1981). Absorption of E P S by cut
bases of apple shoots results in vessel occlusion similar to that seen in tissue
infected by bacteria.

Erwinia stewartii, the causal organism in Stewarts wilt disease of maize, is another
organism in which E P S has been implicated in virulence. A single mutation which
abolishes both EPS synthesis and pathogenesis has confirmed this (Torres-Cabassa,
Gottesman, Frederick, Dolph and Coplin, 1987). Virulence expression by Erwinia
stewartii involves two identified functions: EPS production, necessary for wilt
symptoms and systemic movement of the bacterium; and water soaking, a localized
symptom. The identification of a locus for water soaking, not involved in EPS
synthesis or regulated by the res A gene, indicated that the watersoaking locus was
probably separate from that of the major polysaccharide (Panopoulos and Peet,
1985; Torres-Cabassa etal, 1987). However, the involvement of E P S of Erwinia
stewartii in both wilting and watersoaking has since been confirmed (Coplin and
Majerczak, 1990).
Pseudomonas syringae pathovars which induce water soaked lesions have the ability to
produce alginic acid in vivo (Fett and Dunn, 1989). A pathovar of Pseudomonas
syringae pv. syringae that only produces low amounts of alginic acid does not induce
formation of water soaked lesions. It was concluded that the production of alginate in
vivo could be important in the induction of watersoaking of host tissues and/or the
maintenance of the water soaked condition. In Pseudomonas solanacearum the
expression of virulence is complex. At least two separate gene clusters are involved
in both pathogenicity and H R (Huang, Xu and Sequeira, 1990). Two extracellular
enzymes, an endoglucanase and an endopolygalacturonase, are considered minor
virulence factors. Although EPS has been implicated as a major wilt-inducing factor,
wilting in this disease is clearly not exclusively the result of E P S production (Denny,
Makini and Brumbley, 1988; Denny, Carney and Schell, 1990). The N-
acetylgalactosamine component of the EPS may not be required for disease
development (Xu, Iwata, Leong and Sequeira , 1990). Indeed, transposon Tn5

mutagenesis has yielded a number of mutants defective in E P S production but still
able to cause severe wilting and death of tobacco plants. Virulence obviously involves
a number of genes. Detailed molecular analysis of these genes and characterization of
their products should clarify the role of E P S in this wilt disease.
The conformation of EPS (xanthan) produced by Xanthomonas campestris pathovars
suggests that it may be important in pathogenicity. Xanthan interacts with other
polysaccharides which have a b-1-4 linked backbone, such as plant cellulose,
forming a gel. Although gel formation within the plant does not account for host
specificity, it may indicate adaptation of the pathogen to the plant environment.
Stable gels are probably important for water retention but whether a specific
interaction between pathogen and host polysaccharides is necessary needs further
investigation (Whitfield, Sutherland and Cripps, 1981; Billing, 1987). A
pathogenicity gene of Xanthomonas campestris pv. campestris has been identified
(Osbourn, Clarke and Daniels, 1990). Mutants in this gene, although producing
wild-type levels of a number of extracellular enzymes as well as EPS, were clearly
reduced in pathogenicity.
Polysaccharide isolated from Xanthomonas campestris pv. oryzae, used in rice
seedling assays at concentrations as low as 1 u.g/ml, interfered with water movement
from the veinlets to the leaf surface. This interference caused increased stomatal
resistance to transpiration and decreased the drying rate of the leaf tissues. In rice
seedlings treated with the polysaccharide, permeability of the cell membrane of the
leaf tissues increased as did the water potential of the stem tissues. At higher
concentrations, water movement in the xylem vessels was retarded (Vidhyasekaran,
Alvenda and Mew, 1989).

Most wilt pathogens cause plants to wilt by increasing the resistance to water flow
through the xylem. The susceptibility of plants to wilting, as a consequence of
microbial colonization, is related to the anatomy of the water conducting pathway of
the plant. However, physical blockage of the xylem is not the only mechanism of
inducing wilt, as very small amounts of large E P S molecules cause cuttings to wilt
(Van Alfen, 1989). The function of E P S size and viscosity in wilt induction remains
unclear (Coplin and Cook, 1990).
1.2.2 Recognition and Specificity
Attachment and envelopment of bacteria by the plant cell wall is a preventative
measure against multiplication and disease progression. A virulent Pseudomonas
syringae pv. glycinea attached to single leaf cells of resistant soybean cultivars (an
incompatible reaction) between 30 - 180 min after inoculation. Attachment using a
susceptible cultivar (a compatible reaction) was considerably delayed and did not
occur within 10 - 15 h. Compatibility was characterized by the formation of
adherent bacterial clusters. The early attachment in incompatible reactions suggests
that incompatibility rather than compatibility is the active process (Ersek,
Gaborjanyi, Holtzl and Kiraly, 1985). Many plant responses to challenge by
bacteria are nonspecific and may be separated from irreversible damage to the
plasma membrane which initiates the H R (Brown and Mansfield, 1988). Many plant
pathogens owe their virulence to an ability to prevent attachment and envelopment.
In contrast attachment by some plant pathogens, such as Agrobacterium tumefaciens,
is essential to pathogenesis (Sequeira, 1984).
A protein produced by an incompatible strain of Pseudomonas solanacearum in
contact with resistant potato tissue, appeared to induce a H R type response (Huang,
Helgeson and Sequeira, 1990). This 60,000 dalton protein is produced early in the

interaction of bacteria with the host cells, is active at very low concentrations and is
able to cause a H R type reaction in resistant potato tissue but not in susceptible lines.
The question arises as to what mechanisms facilitate bacterial-plant interaction.
Pili may play a role, although the specificity of this mechanism in eliciting
hypersensitive responses is not clear (Daly, 1984). Since pili bind to a variety of
different substrates, nonspecific interactions may be responsible for pilus adhesion
to plant cells (Duvick and Sequeira, 1984; Young and Sequeira, 1986).
1.2.2.1 Pili and Fimbriae
Bacteria bind to many inert surfaces. The initial process is seemingly nonspecific
and mediated by intermolecular forces such as ionic interactions, hydrogen bonding
or other surface forces that provide loose bonding. O n the surface of host cells,
attachment of bacteria becomes irreversible within a short time. Bacterial adhesins
function as a bridge between the bacterium and surface and provide a means by which
bacteria can recognize specific surfaces in their natural habitat (Jones and Isaacson,
1 9 8 3 ) .
"Fimbriae" (Duguid, Smith, Dempster and Edmunds,1955) or "pili" (Brinton,
1959) are filamentous nonflagellar protein appendages found on a broad range of
bacteria, especially gram negative species (Hancock and Poxton, 1988). As there is
no agreement to a confirmed nomenclature, the term pili as adopted by Paranchych
and Frost (1988), is used here to describe all surface filamentous, nonflagellar
protein appendages. The role of pili in animal/bacterial interactions has been
intensively studied (Read, 1989). Pili are composed of a series of ordered repeating
subunits yielding an organelle of regular uniform stucture. They range in diameter
from 2-12 n m and vary in length between 0.5 and 10 urn (Paranchych and Frost,
1988). Large variations occur in morphology and other properties of pili. Thus, a

precise definition of pilus appearance and general characteristics is difficult, even
between bacteria of different strains of the same bacterial species (Hancock and
Poxton, 1988).
Studies on bacterial pili were stimulated by the agglutination of erythrocytes by
piliated Escherichia coli (Duguid et al, 1955; Salit and Gotschlich, 1977). Pili
enhance adhesion of a large number of bacterial species to inert surfaces, other
bacteria, bacteriophages and host cells in vivo and in vitro (Ottow, 1975;
Chaterjee and Vidaver, 1986; Hancock and Poxton, 1988). Interest in pili has
largely stemmed from mammalian urinary and gastrointestinal tract infections.
Adherent piliated bacteria are often more pathogenic than nonpiliated strains to
mammalian cells (Paranchych and Frost, 1988).
The presence of pili, their structure, composition and role in pathogenicity in plant
bacterial disease have not been extensively studied (Chaterjee and Vidaver, 1986).
Evidence suggests they have a role in adhesion to plant surfaces but not with the
specificity associated with mammalian pathogens (Billing, 1987). Pili have been
reported in several plant pathogens, namely Pseudomonas sp. and Erwinia sp.
(Fuerst and Hayward, 1969; Christofi, Wilson and Old, 1979; Sequeira, 1984;
Young, Stemmer and Sequeira, 1985; Young and Sequeira, 1986). The pili of
Pseudomonas solanacearum are the most studied of plant pathogenic bacterial pilin
proteins. They are apparently responsible for the agglutinating properties of crude
bacterial extracts. In contrast to mammalian systems, where piliation enhances
pathogenicity, pilus attachment induces H R in plants. Bacterial and plant cell wall
surfaces carry a net negative charge. Piliate bacteria carry a lower negative charge
than nonpiliated bacteria and are more likely to approach plant surfaces more
closely. Subsequent recognition by the plant can induce the H R (Jones and Isaacson,
1983; Sequeira, 1984; Billing, 1987).
1.3 Separation and Purification of Surface Components
1.3.1 Purification of Pili
Isolation and concentration of pili is easily achieved by mechanical agitation and high
speed centrifugation of cultures in the log phase of growth (Ottow, 1975). A
standard method for the isolation of pili uses cycles of alternating disaggregation
steps followed by reprecipitation of pilus crystals in the presence of ammonium
sulphate or polyethylene glycol (PEG) (Isaacson, 1977; McMichael and Ou, 1979;
Mooi and De Graaf, 1979; De Graaf and Roorda, 1982). Detergents, sucrose or
guanidine hydrochloride can solubilize pili, which can subsequently be reaggregated
to obtain pure preparations. Since pili are normally composed of a repeating array
of a single subunit, the purity of the final product can be assessed by sodium dodecyl
sulphate - polyacrylamide gel electrophoresis (SDS-PAGE) (Heckels and Virji,
19 8 8 ) .
SDS-PAGE provides an important method for analysis of pilus purity (Jann, Jann
and Schmidt, 1981). Pili can usually be depolymerized to pilin by reaction with
sodium dodecyl sulphate (SDS) and 2-mercaptoethanol. In some cases - for example
using Escherichia coli type 1 pili - guanidine hydrochloride was used to provide
more vigorous dissociation conditions (Eshdat, Silverblatt and Sharon, 1981). SDS-
P A G E of crude fimbrial preparations usually reveals one major protein band and
numerous minor bands. Purification of pili from several genera, Escherichia,
Klebsiella, Neisseria and Pseudomonas , have revealed a strong similarity in their
protein structure. The pili were composed of identical pilin subunits having a
molecular weight in the range 15000 to 18000 (Paranchych and Frost, 1988).

Pili, being extremely hydrophilic proteins, are easily contaminated with other
bacterial surface antigens. Conventional techniques were unsuitable for the
purification of B1 pili from Pseudomonas solanacearum because of their tendency to
bind tenaciously to other proteins and lipopolysaccharide. In some instances there
can be as much as 20 % contamination with carbohydrate (Young, Stemmer and
Sequeira, 1985). Similar difficulties, presumably resulting from strong
hydrophobic or charge - charge interactions, have been encountered in attempts to
purify Escherichia coli type 1 pili (Korhonen, Nurmiaho, Ranto and Svanberg Eden,
1980). Precipitation of B1 pili, by divalent cations, in crude or partially purified
preparations strongly implicates pili in ion mediated agglutination (Young, Stemmer
and Sequeira, 1985). A final purification step to remove contaminating proteins is
gel filtration using an ion exchange matrix such as D E A E sephadex or cross linked
sepharose gels with a high molarity urea buffer (Isaacson, 1977; Mooi and De
Graaf, 1979; De Graaf, Klemm and Gaastra, 1980; Fader, Duffy, Davis and Kurosky,
1982; De Graaf and Roorda, 1982; Hall, Maneval, Collins, Theibert and Levine,
19 8 9 ) .
1.3.2 Isolation of Exopolysaccharides
Enhanced production of capsular polysaccharides by many gram negative strains is
favoured by growth at lower temperatures (15-18°C) in medium deficient in
nitrogen and high in glucose. Recent advances in chemical and physical analyses now
make it possible to carry out complete structural studies of complex carbohydrates
on only milligram quantities (Troy, 1979).
Polysaccharide excreted in the growth medium can be conveniently isolated by
precipitating with ethanol (Jeanes, Rogovin, Cadmus, Silman and Knutson, 1976;
Ayers, Ayers and Goodman,1979; El Banoby and Rudolph, 1979a,b and 1980;

Buchanan and Starr, 1980; Vidhyasekaran et al, 1988), acetone (Buchner,
Nachmias and Burstein, 1982; Fett and Dunn, 1989) , ammonium sulphate (El
Banoby and Rudolph, 1979a) and quaternary ammonium salts such as
cetyltrimethylammonium bromide (CTAB). However, treatments such as boiling and
alkali extraction should be avoided to prevent both contamination and degradation of
the polysaccharide.
Cells can be readily decapsulated by treatment in a Waring blender. Capsular
polymers can be purified by applying a combination of such conventional techniques
as fractional precipitation (El Banoby and Rudolph, 1979b), ultracentrifugation
(Jeannes et al, 1976) and molecular exclusion chromatography (Ayers et al,
1979; Buchner, Nachmias and Burstein, 1982; Sijam, Karr and Goodman, 1983;
Fett and Dunn, 1989).
Adequate criteria for purity are difficult to define for macromolecules of this size
and relatively high level of polydispersity. The minimum criterion for purity of
polysaccharide is the elution of an apparent single molecular species from an ion
exchange column. Further criteria include immunological homogeneity, N M R signals
and homogeneity meniscus depletion and sedimentation equilibrium (Chaterjee and
Vidaver, 1986).
1.3.2.1 Monosaccharide Composition Analysis of EPS by Gas-Liquid
Chromatography-Mass Spectrometry (GC-MS)
Although many extracellular polysaccharides have been studied, complete structures
have not been determined for them all. There is widespread structural variation
between polysaccharides even from different strains from within the same bacterial
species. The apparent complexity of most EPS can be simplified to oligosaccharide

repeating units with varying degrees of polymerization and non carbohydrate
substituent groups. Characterization of E P S requires reliable and sensitive methods
for measuring and quantifying the monomeric composition and for elucidation of the
sequence and conformation. Often only sugars and their approximate molar ratios
have been determined. Any attempt at structural classification on a species level is
thus impossible. Present methods of methylation analysis coupled with specific
degradation techniques and identification of reaction products by G C - M S means that
much information is now available from only a few milligrams of polysaccharide
material (Powell, 1979).
Sugars contain several hydroxyi groups and, therefore, have to be derivatized before
G C - M S . G C - M S analysis of saccharides often consists of identifying the sugar and
determining the relative amounts in a simple mixture. Comparison of G C retention
times together with the mass spectra is necessary for identification (Kitson and
Larsen, 1990). At present, the separation and characterization of volatile
derivatives by combined G C - M S is also widely used for disaccharides and some
trisaccharides (Aspinall, 1982). In terms of thermal stability and ease of
interpretation of spectra, permethylated compounds and trimethylsilyl (TMS)
ethers are the derivatives of choice for mass spectrometry (Aspinall, 1982).
1.4 Plant Tissue Culture
Originally plant tissue culture techniques evolved primarily for physiological and
morphological studies. It has only been in the last twenty-five years, as techniques
have improved, that tissue cultures have proved to be important instruments for
other areas of plant science including plant pathology (Ingram, 1980).

1.4 1 Protoplast Isolation
Protoplasts were first isolated, using mechanical methods, towards the end of last
century. However, yields using this method were low and only tissue having large
and highly vacuolated cells such as onion bulb scales and radish roots could be used
(Bhojwani and Razdan, 1983; Evans and Bravo, 1983). Induced plasmolysis of
such cells caused the plasmalemma to retract from the cell wall resulting in a
rounded protoplast in the centre of the cell. Tissues were then cut and often the cell
wall was removed without damage to the protoplast (Errikson, Bonnett, Glimelius
and Wallin, 1974).
In 1960, Cocking, using an extract of hydrolytic enzymes, isolated protoplasts from
tomato root tips. This method had three major advantages over the mechanical
method:
• A higher yield of protoplasts is obtainable.
• Less osmotic shrinkage of the cytoplasm is required.
• Less cellular damage occurs.
Prior to 1968, there was no commercially available cellulase preparation that gave
reliable results; however, with their availability, experiments on the isolation of
protoplasts were increased and techniques improved.
Two basic methods of protoplast isolation were developed. The two-step sequential
method of Takebe, Otsuki and Aoki (1968) involves the initial isolation of single
cells from leaf material by macerozyme (pectinase) followed by a separate cellulase
incubation to remove the cell walls, yielding protoplasts. The second method,
developed by Power and Cocking (1969), uses a mixture of the two enzyme
preparations in a one-step isolation.

The development of a reliable protoplast isolation system, yielding consistently high
numbers of viable protoplasts, requires the optimization of several variables for
each particular plant type being studied. Most of the available enzymes are isolated
from micro-organisms. Two of the most popular enzyme preparations available for
protoplast isolation are cellulase (Onozuka®) R10 isolated from the fungus
Trichoderma reesii, which contains cellulase and some hemicellulase activity and
Macerozyme® a pectinase derived from the fungus Rhizopus (Evans and Bravo,
1 9 8 3 ) .
None of the commercially available enzymes are highly purified, and contain many
toxic substances and impurities such as nucleases, lipases, peroxidases, proteases
and other enzymes. The enzymes are usually used without any purification to yield
high numbers of viable protoplasts. Removal of low or high molecular weight
contaminants has sometimes led to improved results (Maheshwari, Gill, Maheshwari
and Gharyal, 1986; Ishii, 1989). Highly purified enzyme preparations are not
very efficient in the breakdown of the cell wall and fewer surviving protoplasts are
obtained (Von Arnold and Eriksson, 1976). Therefore, impure enzymes are often the
most useful for complete wall breakdown and release of protoplasts (Vasil and Vasil,
1 9 8 0 ) .
When working with a new plant species or tissue, it is necessary to optimize the
combination, concentration and duration of treatment for the particular enzymes
used (Bajaj, 1989). The condition of the plant material used for protoplast
preparation is critical. Thus, plants must be undergoing active growth under ideal
conditions of temperature, light intensity, daylength, humidity and regular
fertilization (Shepard and Totten, 1977; Shepard, Bidney and Shahin, 1980; Evans
and Bravo, 1983).

Plants grown in the greenhouse provide a most inconsistent source material due to
seasonal variation (Watts, Motoyoshi and King, 1974; Tal and Watts, 1979).
Protoplasts are most frequently isolated from in vitro grown plantlets, suspension
cultures or sterile seedlings, grown aseptically under defined conditions (Chanabe,
Burrus and Alibert, 1989; Creemers-Molenaar, Van Der Valk, Loeffen and Zaal,
1989). Protoplasts isolated from these cultured tissues have a higher division
capability (Thompson, Abdullah and Cocking, 1986; Imbrie-Milligan and Hodges,
1986; Coulibaly and Demarly, 1986).
The method of sterilization of the donor tissue is important for successful, viable
protoplast release. Extended sterilization treatment can reduce the viability of
resultant cultures (Evans and Bravo, 1983). After sterilization, the lower leaf
epidermis is damaged or removed to facilitate enzyme penetration. This is usually
done by peeling the lower epidermis, by rubbing the surface with a stiff bristled
brush or by cutting the leaf into small pieces (Gamborg, Shyluk and Shahin, 1981).
The enzyme solution in which the protoplasts are isolated contains a mixture of salts
- in some cases a complete medium - and an osmotic stabilizer (Evans and Bravo,
1 9 8 3 ) .
The osmotic pressure between cell exterior and interior must be balanced to protect
the protoplast from osmotic swelling or shrinking during and after isolation. The
most widely used osmotica are sorbitol or mannitol in a concentration range 0.45 -
0.8 M (Bhojwani and Razdan, 1983; Maheshwari et al, 1986). These sugars are
metabolically inert and are not metabolized during isolation. Therefore, changes in
the osmotic potential do not occur and osmotic stability remains constant. In some
cases sucrose has been successfully used (Shepard and Totten, 1977; Gamborg etal,
1981). The effective osmotic concentration depends on the leaf cell osmotic pressure

at the time of isolation. Endogenous cell osmotic pressures are influenced by
environmental conditions, under which the source plant is grown (Shepard and
Totten, 1977).
The incubation solution, containing the enzymes, osmoticum and mineral salt
solution, is usually adjusted to a pH between 4.7 and 6.0. For the isolation of
protoplasts from cultured cells of tobacco there are two pH optima, 4.7 and 5.7
(Uchimiya and Murashige, 1974). The plant tissue/enzyme mixture is usually
incubated at 25 - 30°C, which is in the optimum range for the plant cells. The
optimum temperature for enzyme activity (40 - 50°C) is too high to maintain cell
viability (Bhojwani and Razdan, 1983). The incubation step is usually carried out
in the dark or at low light intensity with slow shaking (30 - 50 rpm). The length of
incubation depends on the plant material being used, but is usually between 30 min
and 20 h.
1.4.1.1 Protoplast Purification
At the end of the incubation period the incubation solution contains chloroplasts,
vascular elements, undigested cells and damaged protoplasts, in addition to the viable
protoplasts. Thus, a purification step is necessary to eliminate contaminating plant
material to yield a pure protoplast suspension.
Generally, the protoplast suspension is first passed through a series of steel or nylon
filters between 40 - 100 u m pore size to retain the larger plant and cell debris.
The filtrate is centrifuged at low speed, which is usually sufficient to pellet the
intact protoplasts but not damaged cell material. This step is repeated 2 or 3 times
to achieve a clean protoplast preparation. An advantage of this method is that the

cells remain under the same osmotic potential during the purification procedure
(Evans and Bravo, 1983).
When delicate protoplast preparations are to be purified, flotation has been used. A
concentrated solution of sucrose or sorbitol may be combined with the
enzyme/protoplast mixture and the protoplasts recovered from the top of the tube
after low speed centrifugation. This technique is, however, not always successful and
may, due to the concentration of the sugar used, cause cell damage and cell death
(Eriksson et al, 1974).
Numerous other gradients have been used in protoplast purification, for example;
two - phase purification systems using ficoll, polyethylene glycol (PEG) and
dextrans (Kanai and Edwards, 1973; Larkin, 1976 and Edwards, Lilley, Craig and
Hatch, 1979; Kobza, Moore and Seemann, 1989).
1.4.1.2 Protoplast Viability
Viability of protoplasts can be visually assessed using Evans blue (0.05 %), an
exclusion dye (Gaff and Okong'o-Ogola, 1971), or fluorescein diacetate (0.01 % ) , a
fluorescent viable stain (Widholm, 1972), in the appropriate osmoticum.
Fluorescein diacetate is non-fluorescing, non-polar and freely permeable across the
intact plasmalemma (Larkin, 1976). Inside living cells, the acetate residues are
cleaved by esterase, releasing the fluorescent polar section - fluorescein.
Fluorescein is not freely permeable across intact membranes and accumulates in the
cytoplasm of intact cells. W h e n illuminated with a mercury vapour lamp with
suitable excitation and suppression filters it yields a yellow/green fluorescence.

However, using FDA, an exaggerated high number of counts can be obtained under
certain conditions (Gahan, 1989).
1.4.2 Protoplast Culture
Viable protoplasts, when cultured in a suitable medium, synthesize new cell wall
material within 8 - 24 h of isolation. A complete cell wall is formed within 2 - 4
days. Protoplasts increase in size and numerous cytoplasmic strands are formed
before and during early stages of cell wall formation. During this time there is an
increase in the number of cell organelles, cytoplasmic streaming and respiration, as
well as synthesis of RNA, protein and polysaccharides suggesting active cell
metabolism (Vasil and Vasil, 1980). Upon completion of new wall formation,
protoplasts lose their spherical shape. Cell wall regeneration precedes cell division
in cultured protoplasts and is a prerequisite for mitosis. Protoplasts which do not
regenerate a complete cell wall do not undergo normal mitosis. They often show
"budding" and, due to incomplete cytokinesis, may become enlarged and multinucleate
(Bala Bawa and Torrey, 1971; Bhojwani and Razdan, 1983).
"Budding" is the distending of a protoplast in one or more regions of its membrane,
giving rise to two or more spherical compartments joined to one another. It does not
occur in the absence of a cell wall but is more frequent where cell wall regeneration
is poor.
Not all protoplasts are capable of dividing. Those that are, generally undergo their
first division within 2 - 5 days after plating. Subsequent more rapid division gives
rise to multicellular colonies within 1 - 3 weeks. Additions of fresh culture medium
are made every 1 - 2 weeks. This addition reduces the osmoticum and allows for
adjustment of medium composition to aid regeneration and division (Maheshwari et

al, 1986). Once callus is formed, it is usually transferred to solid agar medium for
further regeneration (Evans and Bravo, 1983).
Wall regeneration and division of cells is dependent on optimization of a number of
variables specific for a particular tissue from a particular species or even variety
(Frearson, Power and Cocking, 1973; Niedz, Rutter, Handley and Sink, 1985).
Indeed, these variables, regular fertilization, temperature, light intensity,
daylength and photoperiod, are as important for protoplast culture as they are for
isolation (Pelcher, Gamborg and Kao, 1974). If these conditions are not met,
protoplasts fail to undergo division regardless of the culture medium used (Shepard
and Totten, 1977; Shepard et al, 1980). The rate and regularity of cell wall
regeneration is dependent on the plant species and the state of differentiation of the
donor tissue used for protoplast isolation.
Although culture requirements of intact cells and tissues may be used as a guide for
the medium to be used for protoplast culture, the concept of protoplasts being
equivalent to that of cells without walls is often not as simple and changes in medium
requirements are necessary (Bhojwani and Razdan, 1983). Protoplast growth
medium consists of inorganic nutrients, vitamins, organic nitrogen, growth
hormones, carbon sources and osmotic stabilizers (Gamborg etal, 1981). Mostly
the salts of Murashige and Skoog (1962) and B5 (Gamborg, Miller and Ojima,
1968) with or without modifications have been used (Bhojwani and Razdan, 1983).
Single protoplasts are very efficient in nutrient uptake hence, reduced levels of
inorganic substances are used. If the salt concentration is too high, cell division does
not occur (Zapata, Sink and Cocking, 1981).
A number of toxic macromolecules can be found as contaminants in protoplast culture
media. Autoclaved glucose was found to be detrimental to lucerne protoplast division

and appeared to contain inhibitory factors, which may be breakdown products or
polymers known to form from glucose at high temperature and pressure (Davies,
Larkin and Tanner, 1989). Greater survival and higher division of protoplasts
occur in filter sterilized media than in autoclaved media.
Types and concentrations of growth regulators are of crucial importance. The most
commonly used auxin is 2,4-dichlorophenoxyacetic acid (2,4-D) (Pelcher et al,
1974; Coutts and Wood, 1977 and Zapata etal, 1981). The cytokinins most
commonly used are 6-benzylamino purine (BAP), 6-furfurylamino purine
(Kinetin) and N-isopentenylamino purine (2-ip) (Bhojwani and Razdan, 1983).
Protoplasts may be cultured in agar plates following the Bergmann technique of cell
plating. Free cells in protoplast culture medium are diluted to a final density with an
equal volume medium containing a low agar concentration. The medium, containing
the protoplasts, is spread into petri-dishes to form a thin layer approximately 1 m m
deep to allow for adequate aeration (Nagata and Takebe, 1971; Takebe, Labib and
Melchers, 1971; Zapata, Evans, Power and Cocking, 1977). High purity agarose is
superior to agar for such purposes (Maheshwari et al, 1986). The use of semi-solid
medium maintains the protoplasts in a stationary state and allows assessment of
growth of particular cells. However, cells in agar are slower to begin division than
those in liquid (Vasil, Wang and Vasil, 1983).
Therefore, liquid medium has been more universally used and is considered to confer
the following advantages:
Some protoplasts, of particular species, do not grow on agar solidified
medium.
Lowering of the osmoticum after a few days in culture is facilitated.

Any toxic metabolites or components produced by the cells which do not
divide and eventually die, can be removed by changing the medium.
• If the colonies require a high initial plating density, the density of the cells
may be reduced after a few days in culture so that mixing of colonies derived
from adjacent cells does not occur.
Cells cultured in liquid medium can be suspended as a shallow layer in petri-dishes
(Frearson et al, 1973), in flasks (Coutts and Wood, 1977) or suspended in 50 -
100 ul drops in petri dishes (Pelcher etal, 1974). However, in some liquid media
there have been reports of abnormal cell wall regeneration (Maheshwari et al,
1986). Thus, a combination of both liquid and agarose solidified medium has been
used to regenerate single cells. The protoplasts are first incubated in liquid medium
for 2 to 5 days before transfer to semi solid medium (Hunt and Helgeson,1989;
Ratushnyak, Piven and Rudas, 1989). When a recalcitrant species is used, it may be
advantageous to embed the protoplasts in agarose (Dons and Colijn-Hooymans,
1 9 8 9 ) .
Until protoplasts have regenerated their cell wall, osmotic protection is required.
The osmolarity is often adjusted with the same osmotic stabilizer used for isolation,
generally mannitol or sorbitol, 0.5 - 0.6 M (Bhojwani and Razdan, 1983).
However, the use of metabolically active stabilizers such as glucose and sucrose is
often advantageous as these sugars are metabolized by the cells, gradually lowering
the osmoticum during early growth and wall formation. Glucose is more effective
than other stabilizers in the culture of some plant protoplasts (Gamborg et al,
1975; Michayluk and Kao, 1975; Ge, Wang, Yuan, Huang, Nie, Testa and Lee,
1989). However, concentration of glucose is critical below 0.5 M, protoplasts
ceased to grow whilst above 0.6 M few protoplasts divided. Sucrose has been used as
the osmotic stabilizer for the culture of protoplasts of potato, sweet potato and

cassava (Shepard and Totten, 1977; Bidney and Shepard, 1980; Shahin and
Shepard, 1980). The synthesis of new cell wall material is influenced by both the
type and concentration of the osmoticum. A high level of osmoticum may prevent
bursting and "budding". However, unless the osmoticum is diluted after a few days in
culture, when a strong cell wall has regenerated and a number of divisions has taken
place, cell division may cease (Kartha, Michayluk, Kao, Gamborg and Constabel,
1974b; Gamborg et al, 1975; Kao and Michayluk, 1980; Attanasov and Brown,
1984). Shepard and Totten (1977) reported that concentrations of sucrose, 58 m M
or greater, inhibited cell division and growth in small (1-2 m m ) callus arising
from dividing protoplasts. Michayluk and Kao (1975) reported a much higher
incidence of "budding" in sucrose rich media.
The initial plating density of protoplasts is important in subsequent wall formation
and division. Protoplasts are not easily grown at low densities and maintenance of a
minimum cell density is necessary. Protoplasts are generally cultured at a density
between 1 X 10 4 -1 X 10 5 per ml of medium. Such high densities often lead to
mixing of cell colonies during culture, which complicates the culture of single cell
clones. This problem can be minimized if a system for protoplast culture at low
density is used. The system used by Lawrence and Davies (1985) allows for the
culture of only 1 0 - 1 5 protoplasts in a microdrop (50 - 150 u.l). In some cases,
an initial electric field stimulation increases protoplast division (Rathore and
Goldsworthy, 1985a, b; Chanabe, Burrus and Alibert, 1989).
Plating efficiency, the percentage of cells undergoing division, is generally quite low,
although levels as high as 90 % have been recorded (Niedz et al, 1985).
Determination of percentage cell division is often hampered by aggregation of
protoplasts during culture (Pelcher et al, 1974). Maximizing plating efficiency is a
key objective in tissue culture and is dependent on physiological condition of donor

tissue, procedures for isolation, medium composition and incubation conditions
(Keller, Setterfield, Douglas, Gleddie and Nakamura, 1982).
Plating efficiency is determined using the following equation:
Plating efficiency = Number of colonies/plate /after time X)
Number of cell units initially/ plate
Freshly isolated protoplasts are generally incubated in diffuse light or in the dark.
Light intensities above 1000 lux cause rapid loss of chlorophyll and subsequent cell
death (Frearson et al, 1973). S o m e species which are very sensitive to light
require incubation in complete darkness for 4 - 7 days. The inspection of plates
under the microscope, especially during the early stages of culture, is detrimental to
cell growth and development (Street, 1977). Once a new wall has regenerated, cells
may become light tolerant.
1.4.2.1 Plantlet Regeneration
It is important to induce plant regeneration from protoplast derived colonies as early
as posssible so that totipotent cells are not outgrown by nonmorphogenic cell types
(Keller et al, 1982). The strategy for plant regeneration has, thus, been to recover
rapidly growing callus from protoplasts and to transfer it to species specific
medium. Morphogenetic developments result from a balance between growth
regulating hormones, nutrients and physical incubation conditions. Only a few
species are capable of sustained cell divisions leading to callus formation. Plant
regeneration is less frequent and has only been recorded for a number of genera,
most of which are members of the Solanaceae. However reports of regeneration from

woody species, legume and monocotyledonous species are increasing (Vasil and Vasil,
1980; Ge et al, 1989; Creemers-Molenaar et al, 1989; Ratushnyak, 1989;
Bajaj, 1989). The need for more efficient and reproducible methods for plant cell
regenerating systems is imperative for the development of modern somatic
hybridization and genetic manipulation techniques.
Very few studies exist on the role and optimal levels of specific micronutrients
affecting protoplast growth and division. Indeed, the composition of the culture
medium may be more critical for cultured plant protoplasts than for cultured
explants (Evans and Bravo, 1983). A broad spectrum media experiment was
developed for the initial investigation of any new or unresolved tissue culture
situation (De Fossard, Myint and Lee , 1974). Even in the simplest procedures for
regeneration of plants from protoplasts there is a requirement for at least three
media changes in levels of auxin, cytokinin, osmoticum and frequently in the basal
medium itself (Maheshwari etal, 1986).
1.4.3 Callus Production
Callus culture, is readily established for virtually any plant and has been the most
widely cultivated tissue in vitro. Callus cultures are neither uniform nor
undifferentiated. The tissue is composed primarily of parenchyma of varying shapes,
sizes and organelle contents. Scattered distributions of lignified xylem and callused
phloem may be encountered (Murashige, 1979). Parenchyma is a tissue with
considerable developmental plasticity resulting from its low level of differentiation
and is theoretically capable of indefinite proliferation. The pith and cortex of stems
and roots, tubers, the mesophyll of leaves, the flesh of succulent fruits and the
endosperm of seeds are examples of plant parts consisting largely or entirely of
parenchyma (Constabel, 1984).

There are three steps in callus induction:-
• Selection of the explant.
• Provision of a suitable medium and culture conditions.
• Isolation and maintenance of callus for subsequent experimentation.
Although mechanical wounding always accompanies explantation onto growth medium
it is not a necessary prerequisite for callus initiation. Callus may be achieved
directly from intact seedlings placed in contact with growth producing chemicals.
Changes brought about by wounding or added growth stimulants in the chemical
environment cause major regulatory controls to breakdown. Furthermore, isolation
from whole plant controls and breakdown of intercellular regulation results in the
collapse of cellular organization (Yeoman and Forche, 1980).
The intensity of the above responses, giving rise to callus formation on explants, is
related to the physiological state of the tissue and time of the year when the tissue is
isolated. Tissues isolated soon after fertilization of the source plant material may
respond differently in culture from those isolated later or from an unfertilized plant
(Thorpe, 1982). Juvenile above ground parts of plants are easier to decontaminate
for culture than are mature or below ground plant parts.
Explants are usually cultured on Murashige and Skoog's (1962) high salt formula
(Thorpe, 1982) with sucrose as the preferred carbohydrate source. Extra vitamins
are often added to enhance callus growth and differentiation, thiamine, nicotinic acid
and pyridoxine are the most common. Callus induction and proliferation can in most
cases be achieved using 10"5 - 10"6 M 2,4-D (Gamborg, Murashige, Thorpe and
Vasil, 1976). Although 2,4-D induces cell division, it suppresses morphogenesis

and where cultures are used for differentiation studies, N A A together with a
cytokinin may be more effective (Yeoman and Forche, 1980). The addition of 10~6
- 10"7 M cytokinin (kinetin, zeatin or BAP) may be beneficial. Once callus has
grown 2 - 3 cm in diameter it can be separated from the explant, divided into
smaller sections and subcultured onto fresh medium.
Important variables in the culture environment which influence growth and
organized development are:-
Physical form of the medium
• pH
Humidity
• Light
• Temperature
On agar solidified media (0.6 - 1.0 %) new callus cells are formed on the periphery
of the tissue/callus mass and nutrient gradients from the medium into the tissues
will occur. Most success with organogenesis has been on solid medium (Thorpe,
1982). There has not been a critical assessment of pH and humidity requirements
for most tissue cultures. pH is usually set between 5.0 and 6.5. Humidity in culture
vessels is usually approximately 100 % although no studies on varying levels have
been made. Most cultures are kept at a constant temperature between 20 - 30°C.
Light has an effect on organized development in vitro. Light requirements for
differentiation involve a combination of several components, including intensity,
photoperiod and quality. While maximum callus growth often occurs in darkness,
low light intensity may enhance organogenesis and embryogenesis. Callus if initiated
in light can be pale yellow or pigmented, while callus initiated in the dark is white to
pale yellow. The texture can also vary from compact to friable and from smooth to
very nodular.

Successful establishment of callus usually depends on using a critical growth factor
and nutrient environment that selects for rapid cell division. Although most source
tissues contain a mixed population of cells, the initial conditions of culture tend to
select against those that show specialized metabolism (Yeoman and Forche, 1980).
Therefore, after one or two subcultures, the "typical" callus for that species under
the culture conditions used will be obtained. The culture conditions play an
important role in selection of the particular cells which are best suited to that
particular environment.
Certain changes often occur with continued subculture of callus. These include the
loss of organogenetic potential, which occurs more often with respect to rooting than
to shoot formation, and has been observed in many tissues. However the loss of the
morphogenetic potential has been restored by particular treatments, which suggests
that this loss may be physiological (Thorpe, 1982). Continued culture may lead to
the spontaneous appearance of tissue with an altered texture and the loss of
phytohormone requirement known as habituation (Thorpe, 1980).
1.4.3.1. Callus Regeneration
One of the most significant developments in callus culture has been the regeneration
of plants either by a process involving a sequence of shoot formation followed by root
initiation or by somatic cell embryogenesis (Murashige, 1979).
Cell divisions in callus cultures usually occur in a random fashion. However, under
particular conditions shoot and root or even embryo-like structures may be formed.
Often these organized structures develop to form plantlets and eventually whole
plants (Butcher and Ingram, 1976).

The balance between auxin and cytokinin regulates organogenesis and provides a
c o m m o n mechanism for morphogenetic regulation of plants (Skoog and Miller,
1957). Better results are obtained if recently isolated tissues are used for
regeneration purposes because the proportion of defective cells is smaller and the
chances of regenerating whole plants of the parent genotype are greater. In culture,
random cell division occurs which can give rise to regions of preferential cell
division. Such regions of high mitotic activity lead to the formation of meristematic
centres or meristemoids. It appears that the organogenetic process begins with
changes in a single cell in the callus mass. The products of division, small
isodiametrically shaped cells, remain in close contact, ensuring reinitiation of cell-
cell interaction and regulation. Surrounding cells are then often induced, by the
actively dividing cells, to divide themselves and may thus become incorporated in the
new structure (Thorpe, 1982). The active centre, by drawing nutrients and
metabolites from surrounding cells inhibits or reduces their division. These
meristematic nodules, which may be located on the surface or embedded in the tissue,
are a relatively common feature in developing callus. These nodules may be induced
to form primordia from which shoot and root morphogenesis can result (Yeoman and
Street, 1977).
Reinitiation of cell-cell interaction and regulation, probably explains the ease with
which embryogenic tissues form somatic embryos and organs. Such tissues are
already in an active metabolic state so that breaking of quiescence is not necessary
(Thorpe, 1982; Yeoman and Forche, 1980).
Species which readily regenerate in vivo may do so more easily in vitro, although
this is not always necessarily so. Rooting occurs more often than other forms of
regeneration irrespective of the source of the callus and is sometimes too random to
define conditions (Narrayanaswamy, 1977).

The culture medium plays an extremely important role in organogenesis. Culture
conditions favouring callus growth may not be suitable for organ differentiation.
Each tissue type requires a different formulation depending on whether optimum
growth or regeneration is the goal. Several media have been developed by various
workers to suit particular requirements of tissue cultures (Murashige and Skoog,
1962; Gamborg etal, 1986; Schenk and Hildebrandt, 1972). These media have been
used with many plant tissues with or without modifications.
Various growth regulating stimuli may need to be applied to cells, not only in the
right amounts, but also in the right order and under the right cultural conditions
(Thorpe, 1980). Factors influencing organogenesis include the following:-
• Growth-active substances which have been included in the culture medium to
manipulate organogenesis in vitro. A large number of plant species respond
to a suitable auxin/cytokinin balance by forming roots and shoots. For 7 5 % of
species forming shoots, 0.05-46 u,M kinetin was used (Evans, Sharp and
Flick, 1981). Auxins, 0.06-27 u.M, such as indole-3-acetic acid (IAA) and
alpha-napthaleneacetic acid (NAA) were used to promote rooting. For
phytohormones to be effective in organized development, the critical balance
and/or concentration must be obtained within the tissue at specific loci. During
shoot formation there is a requirement for a low and steady level of auxin, while
rooting requires a low level during induction and an increase for initiation
(Thorpe, 1982).
• Plant material - the physiological and ontogenic age of the donor tissue,
the season in which the explant is obtained and initial size of the explant and
overall quality of the donor plant (Murashige, 1974). In general, subcultured
callus or plated cell suspensions are used as the experimental material for

studies on organogenesis using media solidified with agar.
• Physical culture requirements for organogenesis. Essentially nothing is known
of the effects of the pH of the medium, the humidity of the environment or
temperature and light regimes. In general cultures are maintained at
approximately 25°C in a constant temperatureenvironment. The important
factor of light regulation is the total radiant energy to which the culture is
exposed (Murashige, 1974). This, therefore, involves both the photoperiod
and the light intensity used for a particular species and there may thus be
changes in the daylength for optimal expression.
1.4.4. Establishment of Suspension Cultures From Callus
Cell suspensions are used to provide large amounts of cell material, to sample a
homogeneous cell population or to examine quantitatively the growth and/or
metabolism of a homogeneous culture (King, 1984). The availability of cell
suspensions contribute significantly towards cellular investigations. In the past,
when only callus tissue was available for investigation, morphology, diffusion
gradients and wound phenomena combined to limit investigation (Torrey and Reinert,
1 9 6 1 ) .
Plant callus can be dispersed by shaking in a liquid medium to give a rapidly dividing
homogeneous suspension containing free cells and aggregates of cells (Henshaw, Jha,
Mehta, Shakeshaft and Street, 1966). Cell dissociation is achieved by agitating the
cultures continuously and vigourously. Cells in suspension are extremely variable
in size and shape (Murashige, 1979). Cells may be spherical, slipper or gourd
shaped and may even become multinucleate and giant sized (Narayanaswamy, 1977).
Although there is a diversity of size and shape, the suspension culture cells generally
remain parenchymatous, thin walled and vacuolated (Yeoman and Street, 1977).

During the period of culture, there is a peak in mitosis at about seven days after
initiation. This is followed by a decrease after two weeks and complete cessation of
mitosis in three weeks. The phase of exponential growth is generally short and only
3 - 4 cell generations are passed through before stationary phase. Cell doubling time
during the phase of exponential growth is usually between 20 - 22 h (King,
Mansfield and Street, 1972; King, 1984).
Aggregates of cells divide more often when compared to free cells. This results in an
increase of the cell clusters in the earlier part of the growth cycle. At this stage, the
number of the free cells remains constant. With ageing of culture, an increase in the
frequency of free cells results from the sloughing off of cells from the cellular
aggregates (Heshaw etal, 1966; Narayanaswamy, 1977). Increase in cellular
material reaches a saturation stage, beyond which there is no further increase.
Subculture of these cultures leads to a repetition of the growth cycle.
Subculture involves an initial high cell density. This limits the number of cell
generations intervening before the cell number of the culture becomes stationary
(Henshaw et al, 1966). The most obvious effect of reducing the initial density is to
increase the lag phase. The initial cell density conditions the medium in some way to
permit a high rate of cell division (Street and Henshaw, 1963).
Generally, the medium suitable for growing callus of a particular species is, with the
agar omitted, a suitable medium for suspension cultures. The concentrations of
auxins and cytokinins are often more critical (Butcher and Ingram, 1976). 2,4-D
is important for growth and omission yields a drastic reduction of both the number
and percent fresh weight of cells in suspension (Torrey and Reinert, 1961). In
some cases, however, suspension cultures are more exacting in their requirements.

Alterations of growth regulators, salts and sugars, although affecting growth, did not
yield a fine sugar beet suspension culture (Raldugina and Smolenskaya, 1984).
In some cell suspensions the degree of separation is influenced by a change in
hormone or sugar concentration (King and Street, 1977; Kubek and Shuler, 1978).
However, the origin of rapidly dividing friable callus appears to be a result of a
random, critical event that occurs during the early phases of explant exposure to the
culture medium (King, 1984). Rapid subculture is usually beneficial to the
establishment of fine cell suspension cultures and improves growth rate and
friability (Felker, Miernyk and Crawford, 1989). Aggregate size can be restricted
by regulating the duration of the alternating phases of cell division and cell
expansion, through such variables as initial population density, composition of the
culture medium and duration of each culture passage. A prolonged culture cycle gives
rise to larger tissue clumps and more senescent and fewer meristematic cells are
transferred.
While physical and chemical treatments have been used to obtain fine suspensions,
physical methods of disruption probably hold the greatest potential. As there are
changes in wall properties between species and strains, the amount of liquid shear
required for cell separation varies for each particular case (Kubek and Shuler,
1978). Cell suspension cultures are usually shaken on rotary shakers at 100 -
150 rpm, which reduces the aggregate size and helps in aeration (King, 1984).
Physical methods do not appear to significantly change the biochemical nature of cells
as opposed to substantial changes caused by chemical and enzymatic methods. Passing
tissue through a screen on subculture, to select small clumps, resulted in a culture
which maintained its friability without further screening (Felker, Miernyk and
Crawford, 1989) Further, Williams, Wilkinson, Lewis, Black and Mavituna
(1988) have used a Waring blender to homogenize large average aggregate size

suspensions. This method gives fine cultures and is more rapid than selective
culture transfers. Additionally, homogenization avoids the disadvantages of chemical
methods which may have other effects on cultures apart from the desired reduction in
aggregate size. Colchicine, which enhances separation, may induce cell wall changes
and resulting cells may be abnormal (Umetsu, Ojima and Matsuda, 1975; Dolezel
and Binarova, 1989). It is not clear whether any of these treatments actually induce
suspension cultures. It seems more likely that the culture regime for the particular
system favours the growth of a certain cell type, either present in the original callus
or appearing with time in culture. As a general rule, conditions favouring the
development of fine suspension cultures tend to reduce the organization within
aggregates and the morphogenetic potential of the cultures (King, 1984). High
friability seems to be determined by the explant and is more dependent on the species
than on the culture medium. The development of such a callus which is not
determined by growth conditions, shows such cultures to be fundamentally different
in metabolism and growth control compared to the original explant (King, 1980).
No single, simple, universally applicable method has been developed for the induction
of suspension cultures.
Cell aggregation is one of the most important limitations in suspension culture
experimentation. In highly aggregated cultures, cells are no longer single nor
exposed to a constant environment. Thus, the ability to control the cellular
environment precisely and to correlate biochemical responses to medium variations
has been partially lost (Kubek and Shuler, 1978; Morris and Fowler, 1981).
However, single plant cells growing in suspension culture can be treated as an
unicellular organism to which microbiological techniques of growth and cell division
can be applied (King etal, 1972).

It is of critical importance to measure the course of growth of suspension cultures
and for this purpose, aliquots can be removed and cell number, packed cell volume or
weights can be determined (Helgeson, 1980; King, 1984).
As is the situation for other tissue culture systems, information on the culture
regime is meagre. Cultures can be grown in light or dark. If tissues prefer light, it
can be continuous or on a regular photoperiod, but should not be random. Incubation
temperatures usually range between 20 - 30°C, with 25°C being the most common
(Helgeson, 1980). Butenko, Lipsky, Cheryak and Arya (1984) have shown that
cells in suspension cultures can shift the culture pH to that optimal for their normal
growth cycle. pH is however usually set between 5.5 and 5.8.
1.4.5 Meristem Tip Excision and Regeneration
Meristem tip culture is used to obtain virus free clones of vegetatively propagated
plants. The aim of application of the technique may be two-fold. The plants obtained
may provide material in which the effects of viruses can be studied or they may be
the basis for the commercial growing of the clones involved (Quak, 1977). Plants
derived from meristem, shoot tip and bud cultures are generally phenotypically
uniform which indicates genetically stable (D'amato, 1977).
When vegetatively propagated plants are systemically infected with a virus, the
pathogen passes from one vegetative generation to the next. The entire population of a
given clonal variety may, in time, become infected. This is especially true for latent
viruses where symptoms do not occur or are hardly detectable. However, the yield
and/or quality of the crop gradually decreases.

Root and shoot apices of virus infected plants are frequently devoid of virus particles
or contain very low virus concentrations (Kassanis, 1957). Plants regenerated
from small shoot apex explants, 0.1 - 0.3 m m tall and comprised of the meristem
dome and 2 - 3 leaf primordia, are therefore frequently free of viruses and similar
agents. These regenerated plants are the basis of specific pathogen free (SPF) stocks
(Murashige, 1979).
The ability of explants to survive, multiply and regenerate is a consequence of a wide
variety of factors, such as the origin of the donor tissue, physiological state,
endogenous hormone levels and cultural conditions. Each species thus presents an
unique problem for in vitro culturing (Hu and Wang, 1983).
Murashige (1974) proposed three stages to be involved in the process of plantlet
formation:-
Establishment and development of the explant.
Multiplication of shoot buds.
Hardening of plantlets.
1.4.5.1 Establishment and Development of the Explant
The lack of developmental capacity of the apical dome alone is possibly due to its
dependence on the sub-adjacent leaf and stem tissue for hormonal resources. Hence a
complex culture medium with balanced hormonal combinations is required for
growth (Kartha, Gamborg, Constabel and Shyluk, 1974a; Shabde and Murashige,
1977). For cassava, only explants exceeding 0.2 m m in length form complete plants
(Kartha and Gamborg, 1975). Those less than 0.2 m m produced either callus or
roots. In addition, leaf primordia are unnecessary for regeneration. However, in

most cases one to several young leaf primordia of the subapical region are also
included. The number of leaf primordia included depends on the plant species and the
purpose of the work (Wang and Hu, 1980).
Actively growing terminal buds are usually under greater growth potential than
older buds taken from lower down the plant. A young developmental stage has been
found optimum for shoot regeneration. Seasonal variations in source material can
occur and plants growing under constant environmental conditions are more suitable.
Mellor and Stace-Smith (1969), however, demonstrated seasonal differences in
rooting even though material was maintained in a constant environment.
Excised actively growing shoot tips are surface sterilized because, although shoot
meristems covered by young leaves and primordia are aseptic, contamination can be
spread during the dissection process. Heat damage during excision under a
microscope light can be avoided using illuminators with cool rays such as fluorescent
or glass fibre light sources.
Murashige and Skoog medium (1962), with or without modifications has been most
frequently used. Meristem tips are usually grown on agar solidified medium. Growth
regulators are more detrimental to excised tips from potato shoots in liquid than on
solid medium (Mellor and Stace-Smith, 1969). This is probably due to the greater
accessibility of nutrients in liquid medium, as concentration gradients found in solid
medium do not arise. Different combinations of growth regulators influence
morphogenesis of meristem tip cultures (Lane, 1979a).
Both auxin and cytokinin are involved in sustaining cell division and growth of the
apical meristem region. Furthermore, interactions between the two appear to
determine the initiation of new leaves. A relatively high cytokinin - auxin ratio

stimulates leaf initiation, while the opposite represses it. Roots are the principle
site of cytokinin synthesis and it is unlikely that excised meristem, shoot tip or bud
cultures have sufficient endogenous cytokinin to support growth and development.
B A P is the cytokinin generally used, and it promotes high shoot development (Selva,
Stouffs and Briquet, 1989). Auxin is also required sometimes, but as the shoot tip is
the active site for auxin biosynthesis, it is not always necessary. 2,4-D is the most
potent auxin and strongly antagonises organized development. It is, therefore, not
normally used and N A A is usually the auxin of choice. Gibberellie acid (GA3), when
added, is used primarily for bud elongation (Hu and Wang, 1983).
Optimum physical incubation conditions of temperature, light, pH and humidity have
not been empirically established. The pH of the medium is usually set between 5.5
and 5.8 before autoclaving (Quak, 1977). If humidity is controlled, 70 % is most
frequently used. Incubation temperatures range between 20 - 28°C, with the
majority being 24 - 26°C. The light requirement is again arbitrarily selected, long
photoperiods ( 1 2 - 2 4 h) are used, with 16/8 h light/dark being the most common
(Hu and Wang, 1983). For cowpea and soybean in vitro differentiation occured at
high light intensity and temperature (Kartha, Pahl, Leung and Mroginski, 1981).
1.4.5.2 Multiplication of Shoot Buds - Clonal Propagation
Shoots or plantlets regenerated through meristem tip culture can be transferred to
cytokinin containing media. Cytokinin releases axillary buds from apical dominance
and allows development of multiple shoots (Wang and Hu, 1980). To enhance
axillary branching the medium should contain a considerably higher level of
cytokinin and little or no auxin (Murashige, 1979; Lane, 1979b). The merit of
using axillary bud proliferation from meristem cultures as a means of regeneration
is that the primary shoot has already been developed. The initial multiplication rate

of axillary bud proliferation is rather slow, but increases during the first few
subcultures eventually reaching a plateau during subsequent subculture cycles (Hu
and Wang, 1983).
Incubating plant material in liquid shaking medium for a brief period results in a
modification of the physiological state of certain plant species causing enhanced shoot
proliferation (Roca, 1984). In liquid culture, growth rate was increased and
axillary buds divided to form a mass of proliferating shoots and roots.
1.4.5.3 Transplantation to Soil
After rooting, regenerated plants can be transferred into soil. Transition from an
aseptic closed environment (approximately 100 % relative humidity) involves
protection from infection and dessication. If components are sterilized before
transplantation infection is not a serious problem. The humidity must be carefully
controlled directly after transplantation. Plants in culture vessels at high humidity
have low quantities of epicuticular wax, large numbers of mesophyll intercellular
spaces and slow stomatal response to water stress (Hu and Wang, 1983). Therefore,
if plants are not protected from dessication, exceptionally high water loss occurs on
transplantation. Hardening in vitro by partial dessication with calcium sulphate
under aseptic conditions improves leaf growth and survival after transplantation to
soil (Ziv and Gadasi, 1986).
Furthermore, there are poor vascular connections between newly formed roots
across the basal callus to the shoot (Grout and Aston, 1977). This has no effect in
the high humidity of the culture environment, but does affect water transport in
transplanted plantlets. It is, therefore, necessary to slowly acclimatise plants to

lower levels of humidity over a period of time allowing morphological changes to take
place enabling normal water control (Grout and Aston, 1977).
1.5 The Use of Plant Cell and Tissue Cultures in the Study of
Phytopathogens
1.5.1 Development and use of Bioassays
Our goal of understanding and thereby beginning to cope with the challenge of disease
is far from being reached today (Helgeson, 1983). Recognition of incompatible or
the lack of recognition of compatible organisms is poorly understood. The various
receptors, elicitors or suppressors that may interact to give incompatibility or
compatibility are not well characterized. The metabolic consequences of the actions
and the interactions of these materials are only vaguely known, if indeed they are
even known at all.
A suitable assay is a prerequisite for further work and characterization of any
product suspected of being involved in plant pathogenesis. An initial test of
phytotoxicity is usually an attempt to induce partial or complete disease symptoms
on the natural host using the test material. A biological assay is devised to aid in the
purification of the toxin from bacterial cultures. By itself, the toxin should elicit all
or some of the disease symptoms in host plants. Throughout a toxin purification
procedure an assay based on some degree of toxin induced symptom expression should
be used (Strobel, 1977). In any experimental approach it is necessary to remember
that rather than having an independent action, disease determinants may well act in a
sequential and/or parallel fashion to produce symptom expression (Durbin, 1982).

In the study of possible toxic compounds, bioassays are often the most sensitive,
reliable and convenient of assays (Yoder, 1981). Preliminary experiments are
usually done by monitoring some gross parameter such as cell death or inhibition of
growth. This may be sufficient for following the purification of a compound or for
using toxins as selection agents in tissue culture. As the action of a toxin at the
cellular and subcellular levels becomes known, new bioassays with advantages over
cruder ones may be devised. A good bioassay should be reproducible, quantitative and
reliable, require small amounts of the available phytotoxin preparation and small
amounts of test material and be as specific as possible for the compound of interest
(Walton and Earle, 1984).
A number of assays including, inhibition of root growth, electrolyte leakage and leaf
and shoot assays have been used extensively to detect toxin in culture filtrates and
other preparations (Scheffer, 1976). However, these assays are often lengthy and
require large volumes and concentrations of toxin. The root growth assay which
relies on inhibition of root growth of susceptible seedlings requires a minimum of
48h. The cut shoot assay relies on uptake of test solutions via transpirational pull;
however, as many solutes are capable of causing damage to cuttings, crude
preparations assayed in this way can be misleading. Detached leaf assays, where
young leaves are excised and inoculated with a drop of the test solution over a wound
site, have also been used. The leaves are incubated in a moist chamber and the
resulting lesion measured after a suitable incubation period.
Electrolyte leakage, due to irreversible alterations to cell membranes, is a rapid
assay based on toxin induced leakage of electrolytes from leaf tissues of susceptible
plants. Electrolyte leakage is often one of the initial symptoms associated with H R
(Pavlovkin, Novacky, Ullrich-lberius, 1986; Keppler and Novacky, 1987).

1.5.2 Plant Tissue Cultures as Assay Systems
To further the research on host-pathogen interactions, as well as other physiological
and molecular aspects of plant pathology, attention has been directed toward the
interaction of tissue cultures and protoplasts with assorted plant pathogens
(Helgeson, 1983). Tissue culture systems are powerful tools for the elucidation of
host parasite interactions (Huang, 1986). The most significant contribution that
tissue culture methods have made to plant pathology has been their function as a tool
to elucidate the basic mechanisms of pathogen virulence and host defence. The most
extensive studies have been in the area of virus infection and replication. S o m e
important contributions have also been made to the understanding of the resistance
mechanisms of toxins and the physiological changes occurring in plants infected with
fungal and bacterial pathogens (Daub, 1986). A majority of publications during the
past decade, on the use of plant cells cultured in association with microbes have dealt
with some aspect of symbiosis or the production of phytotoxins. The approach
developed has correlated effects of bacterial culture filtrates from host specific
pathogenic microbes in planta with effects on cultured plant cells or protoplasts
derived from these cells (Handa, Bressan, Park and Hassegawa, 1982; Shohet and
Strange, 1989). The particular lesion caused by the bacterial filtrate on the plant
cells in each case has been used as a bioassay to aid in the isolation of the toxin
(Reporter, 1984). Cell cultures have been successfully used to study several toxins
involved in plant diseases where the toxin has had essentially the same effects on
cultured cells as it has on plants (Fuson and Pratt, 1988). There is a strong
correlation between the resistance of whole potato plants and the associated H R and
the browning response of callus and suspension cultures derived from the same
plants on inoculation with incompatible strains of Pseudomonas solanacearum (Huang
at al, 1989). Thus plant tissue cultures are suitable for the study of resistance
mechanisms in their system.

Indeed, callus cultures have been used for many years as bioassays and it has often
been shown that resistance and susceptibility to a phytopathogen is maintained and is
correlated with the whole plant disease reaction (Bajaj and Saettler, 1970; Huang
and Van Dyke, 1978; de Zoeten, Gaard, Haberlach and Helgeson, 1982; Hartman,
Secor, Venette and Albaugh, 1986).
Single cell and protoplast assays require very small amounts of test material. They
avoid problems associated with poor penetration of tissues, permit fairly rapid
testing of many different samples and require no prior information about the nature
of toxin action on sensitive cells (Walton and Earle, 1984). However, such single
cells and protoplast assays may not be sensitive to toxins that act only on tissues or,
in the case of protoplasts, affect cell types or biological activities not seen in the
protoplast population used (Earle, 1978). The sensitivity of protoplasts exposed to
toxin is often greater than with either intact leaf or root assays (Breiman and Galun,
1981; Gendloff, Scheffer and Somerville, 1987; Sjodin, Nyhammer and Glimelius,
1988). With species whose protoplasts divide readily, toxin effects on division and
colony formation can be noted. In many cases effects even on undivided protoplasts
are obvious within a few days (Earle, 1978; Earle, Gracen, Yoder and Gemmill,
1 9 7 8 ) .
The sensitivity of protoplasts to molecules possessing biological activity has been
used in conjunction with flow cytometry as a sensitive, rapid analytical technique
(Berglund, Taffs and Robertson, 1987; Berglund, Stobel, Sugawara and Strobel,
1 9 8 8 ) .

Advantages of cell and protoplast systems over the whole plant are:-
Protoplasts/cells can be kept under simple, well defined and uniform
conditions.
The whole system is easily manipulated with simple addition and removal of
system components. Large populations of cells can be screened using
techniques such as flow cytometry (Berglund, Strobel, Sugawara and Strobel,
1 9 8 8 ) .
Single cells are free from tissue influence and form uniform cell
suspensions in liquid media allowing easy quantitation by pipetting.
Both the plant and bacterial cells are relatively synchronized so that
responses to the interaction occur simultaneously.
Every cell is in contact with the medium allowing for simultaneous
exposure of assay components.
Furthermore, studies at the molecular level are very difficult without using single
cells or protoplasts.
Interpretation of negative results from cell and protoplast assays must be assessed
with care as a number of factors may not be active at this level. An active principle,
if produced in culture filtrates, may go undetected if it acts on cell walls, metabolic
processes or cell types not present in the cell culture population used. A toxin that
induces vascular wilts by plugging the xylem might have no detrimental effect on
isolated mesophyll protoplasts (Earle, 1982).
In addition:
There is a possibility that the metabolism of protoplasts is affected by the

hypertonic condition of the medium in which they are maintained (Takebe,
1 9 7 5 ) .
When plant tissues are converted into protoplasts some of the mechanisms
involved in pathogenicity are no longer functional. These mechanisms
possibly rely on cell to cell contact in the tissue and are consequently of
importance in host-pathogen relationships (Muhlbach, 1982; Matthysse,
1983, 1987; Fett and Zaccharius, 1983).
Isolated single cells of a particular type (callus or parenchyma cells) are used
and therefore responses in other differentiated cells cannot be followed.
Indeed, as whole plant restraints have been removed, the system is
artificial (Zaitlin and Beachy, 1974). In addition the entire population is
uniformly exposed to bacterial toxins and host phytoalexins when distributed in
suspension culture medium, as opposed to the concentration gradients that would
occur in the whole plant.
1.5.2.1 Plant Bacterial Interactions Using Tissue Cultures
The use of protoplast and cell suspension cultures as an experimental system to
investigate host cell - plant pathogen interactions using biochemical and molecular
technology for the study of phytopathogenic bacteria has not realised its full potential
Several factors affect bacterial - host cell interactions. Bacteria grow so much more
rapidly than plant cells and often overgrow cultures. Hence, they can cause death or
reduced growth of the plant cells by depletion of nutrients, depletion of oxygen,
alteration of the pH or production of toxic metabolic products. Therefore, if a
pathogenic response is not elicited, growth of the plant cells will only be affected

once bacterial cell populations become very dense (greater than 5 x 10& bacterial
cells/ml) (Matthyse, 1983). However if bacterial growth is slow in the absence of
plant cells, the system more closely approaches that of the in vivo system (Fett and
Zaccharius, 1983). Therefore, a low concentration bacterial inoculum is generally
used (Fett and Zaccharius, 1982; 1983). However, these limitations have not
prevented successful use of suspension cultures to study some host - pathogen
interactions (Thanutong, Furusawa.and Yamamoto, 1983; Fuson and Pratt, 1988;
Shohet and Strange, 1989).
A toxin producing strain of Pseudomonas syringae pv glycinea killed tissues of
sensitive soybean cells (Fett and Zaccharius, 1983). Incompatible non-toxigenic
strains of Pseudomonas syringae had no effect on soybean growth. Similarly,
virulent strains of Erwinia amylovora caused necrosis in pear suspension culture
whilst an avirulent strain had no effect on plant cell viability (Buchanan and Starr,
1 9 8 0 ) .
Enzymes produced by pathogenic bacteria, which cause degradation at the host cell
surface, may kill plant cells by wall damage. Erwinia carotovora, or the partially
purified enzyme pectin trans-eliminase produced by the bacterium, killed carrot
cells in suspension in hypotonic medium (Stephens and Wood, 1975).
Bacterial growth is only rarely decreased in mixtures of phytopathogenic bacteria
and plant cells. Tobacco callus culture restricted growth of two non pathogens of
tobacco; the growth of a tobacco pathogen was not affected (Huang and Van Dyke,
1978). Plant cell viability is similar to that of the whole plant. In the limited
number of studies that have been carried out, susceptibility or resistance to
bacterial toxins and degradative enzymes was retained by the tissue culture cells (de

Zoeten, Gaard, Haberlach and Helgeson, 1982; Matthyse, 1982, 1983; Gray, Guan
and Widholm, 1986; Rickauer, Fournier and Esquerre-Tugaye, 1989).
In a number of plant species, the lack of easily propagated uniform genetic material
and the space required to propagate large quantities of material limits virulence
studies. Micropropagated apple plantlets were used to study virulence of various
Erwinia amylovora strains (Norelli, Aldwinckle and Beer, 1988). Although some
differences due to the culture environment of in vitro grown plantlets occurred,
there was good correlation of symptom development in plantlets and greenhouse
grown plants on inoculation with a virulent and non-virulent strain. Thus,
micropropagated plantlets are useful for rapid and efficient virulence determination.
Hence, various plant cell cultures are useful for studying plant pathogens. When
related to results obtained from whole plants such studies will increase the
knowledge of in vivo pathogenesis.

1.6 Experimental Objectives
The purpose of this study was to:
i ) establish and improve tissue culture techniques for cassava cultivars grown in
southern Africa and Australia.
The tissue culture systems investigated were:-
Isolation and purification of
cassava protoplasts
Regeneration of isolated protoplasts.
Callus culture.
Cell suspension culture.
Meristem tip culture and clonal propagation techniques
i i) develop in vitro bioassays to elucidate the phytotoxicity of
Erwinia herbicola strains causing a blight-like disease of cassava.
The effect of whole bacteria, cell free extracts and various protein

and carbohydrate fractions isolated from the extracellular components
were assayed using:
traditional assays including;
-electrolyte leakage
-detached leaf assay
-a polyphenoloxidase assay using broad bean leaves
and cell and tissue culture assays including;
-viability of freshly isolated protoplasts
-plating efficiency of cultured protoplasts
-viability of single cell suspensions
-growth of clonally propagated plantlets.

2.0 MATERIALS AND METHODS
All experiments were repeated at least twice and, where applicable, performed in
triplicate. Differences in sample means were tested using a two sample t-test (a
significance test for the null hypothesis that the two population means are equal).
Where the test of Ho is based on T' = Y-X
sp. V l + 1
m n
Where sp is the squared root of the pooled estimate of the sample variances,"? and X
are the sample means and m and n refer to the sample size from the two populations
respectively. If the parent populations are normal with the same standard deviation,
then when Ho is true, the distribution of T' is the t distribution with m+n-2 degrees
of freedom (Brown and Hollander, 1977).
2.1 Plant Material
During the course of the study, both South African and Australian grown cassava
cultivars were used. Rooted cuttings or stakes of the cultivars were obtained from
the plant quarantine station at Buffelspoort, South Africa. Clones of the following
cultivars were collected as rooted cuttings: T M S 30572; T M S 58308; 1979 U S
50207; 1979 U T 4(2); T M S 3095. Cultivars Gomani and Thailand were collected
as stakes.
In addition, stakes of the cultivar Groot Rooi were obtained from Rietondale Research
Station, Pretoria, South Africa.

In Australia, stakes of the following cultivars were obtained from Australian Cassava
Products, Bundaberg Queensland: M Aus 7; M Mex 59 (ex CIAT); A C P 100 (ACP
Selection) and Comml (ex Thailand).
All plants were grown in sterilized potting soil in black polythene bags. Cuttings
were taken from the plants and grown under the following conditions:
1. A group of parent plants was established under glasshouse conditions having a
natural photoperiod and range of temperatures.
2. For experimental purposes, plants of each cultivar were kept in an
environmentally controlled phytotron chamber with a photoperiod of 16/8 h
(light/dark), a 28/22°C day/night temperature and 7 0 % relative humidity. Plants
were fertilized twice weekly with 1x Murashige-Skoog medium without sucrose and
hormones (Flow Laboratories, Irvine, Scotland; North Ryde, Sydney). In later
experiments, cultured meristem derived plantlets (2.4), were maintained in a
controlled environment room.
2.2 Protoplast Isolation
Two procedures were used for protoplast isolation (i) short term (4-5 h) and (ii)
long term (14-15 h) digestion (Appendix ii). Both are modifications of the method
of Shahin and Shepard (1980).
As much of the process as possible was carried out in a laminar flow hood under
sterile conditions. One gram of leaf material from the youngest fully expanded or
almost fully expanded leaves was used per 10 ml of enzyme solution.

Freshly picked leaves were surface sterilized by immersion in 0.5% (v/v) sodium
hypochlorite solution (made from commercial bleach containing 4 % (v/v) sodium
hypochlorite) with 0.2% Tween 20 as a wetting agent for, 3 minutes and then rinsed
2-3 times with sterile distilled water.
The leaves were placed upper surface down on a tile and lightly brushed using a nylon
brush (soaked in 7 0 % alcohol and air dried within the laminar flow) until the leaf
was lightly bruised. In some experiments, leaves were cut into pieces 1 m m 2 or
stabbed with needles. In later experiments, leaves from meristem derived plantlets
were used for protoplast isolation (2.4). Leaves from plantlets 3-4 weeks old were
removed and cut into several pieces.
Leaves/leaf pieces were placed into the filter sterilized enzyme solution (Appendix
ii), in a 100 ml wide mouthed conical flask. Flasks were sealed and placed on a
gyratory shaking platform (70 rpm) at 25°C and incubated for 4-5 h (short term)
and 14-15 h (long term) enzyme digestion procedures.
After enzymatic digestion, leaf material was poured through decreasing sized meshes
(1 m m 2 , 212 um, 88 u m and 44 um) into a plastic McCartney tube. The
protoplasts were pelleted by centrifugation for 5 min at 300 g. The supernatant was
discarded and the pellet washed in rinse solution (Appendix ii) 3 times. Protoplasts
were resuspended in a small volume (1-2 ml) of rinse solution and counted using a
haemocytometer.
For some experiments, protoplasts were purified by the aqueous sucrose - dextran T
40 two - phase system (Edwards ef a/,1979). The healthy protoplasts were
removed from between the sucrose - dextran layers without centrifugation,
resuspended in rinse solution and centrifuged for 2 - 3 min at 100 g, to separate out

any further contaminating debris. This was repeated 3 times. Protoplasts were
resuspended as above and counted.
2.2.1 Protoplast Viability Determinations
Two methods were used:
1.) Evans blue exclusion dye (Gaff and Okong'o-Ogola,1971). A 0.025% (w/v)
solution of Evans blue (BDH chemicals, Poole, England) was made up in rinse
solution (Appendix ii) and mixed (1:1, v/v) with a suspension of protoplasts.
Protoplasts were examined under the light microscope. Dead protoplasts clearly take
up the dye.
2.) Fluorescein diacetate (FDA); Polysciences, Warrington, PA, U.S.A) (Widholm,
1972). A 0.01% (v/v) solution of FDA was prepared by diluting a stock solution of
5 m g FDA/ml of acetone (stored in the freezer) with rinse solution. A mixture of
protoplasts/dye solution (1:1 v/v) was prepared. A sample was examined using a
fluorescent microscope (Zeiss Dialux, Carl Zeiss, Oberkochen, West Germany) with
a mercury vapour lamp, in combination with excitation filter B G 12 and barrier
filter 47.
2.2.2 Protoplast Culture and Regeneration (Modified Gamborg etal, 1981)
After isolation, the final washed protoplast pellet was placed in a small volume of
modified holding solution (Appendix iii) and incubated for 50 - 60 minutes at room
temperature to allow for their adjustment to the different osmoticum.
The protoplasts were plated in modified plating medium (Appendix iv) at a final
density of 1x10⁴ - 1x10⁶ protoplasts/ml. Plating mixture, consisting of 5 ml of

part 1 (Appendix iv) was mixed with 20 mis of part 2 (Appendix iv) at 60°C and
allowed to cool to approximately 28°C. Mycostatin (nystatin, Sigma, St.Louis, M O .
U.S.A) and carbenicillin, (Sigma, St Louis, M O . U.S.A) were added to a final
concentration of 25 units/ml and 250 ug/ml respectively. The protoplasts were
added to the medium and plated into 35 x 10 m m plastic petri dishes (Lux, Contur
dishes, Miles Laboratories Inc. Naperville, IL, U.S.A) and sealed with parafilm. The
plates were incubated under dim light (< 200 lux ) in a sealed opaque plastic
container.
Three weeks after plating, the plating efficiency of the protoplasts was calculated as
the percentage of cells plated which had given rise to colonies:
Plating efficiency (PE) = Number of colonies/plate (after 3 weeks)
Number of cells initially /plate
The plating medium containing these small colonies was transferred onto modified
proliferation medium (p) (Appendix v, Gamborg etal, 1981) in 90 x 10 m m plastic
petri dishes (Johns, Hardie Health Care Products, South Oakeigh, Vic. Australia)
using a small spatula. The plates were incubated at 25°C, 16/8 h photoperiod at
4000 lux.
Two to four weeks later, when the calli were between 0.1 and 1 mm in diameter, they
were transferred to: 1) fresh p-medium; 2) modified Murashige-Skoog medium
after Kartha ef al, 1974a, hereafter referred to as M S * with 1.0 u-M NAA, 0.5 u.M
BAP and 0.1 uJVI GA3 (Appendix i); 3) M.SX medium, 1.5 x Murashige -Skoog
medium (Appendix vi) and 4) M.S* medium - with 2 uM B A P and 9 u,M 2,4-D per
litre; 20 ml was poured per 90 x 10 m m petri dish.

Individual calli were transferred onto these media using a finely drawn pasteur
pipette or by cutting the agar of the initial p-medium plates into blocks containing
the small callus, and transferring these to the fresh medium. The plates were
incubated at 25°C, with a 16/8 h photoperiod at 6000, 4000 and 200 lux.
2.2.2.1 Broad Spectrum Medium Experiment (After de Fossard, Myint and
Lee, 1974)
The basic approach was as suggested by de Fossard etal (1974), except that the
main carbon source was isolated from the growth factor and amino acid group and
placed into a separate group. This permitted 4 categories of constituents to be tested
each at 3 different concentrations (low, medium and high). Four concentrations of
carbon source/osmoticum combinations were used.
1
0.1 M glucose
0.1 M sucrose
0.4 M sorbitol
3
0.2 M sucrose
0.4 M sorbitol
0.2 M glucose
0.4 M sorbitol
0.6 M glucose
Two auxins were used: NAA and 2,4-D
One cytokinin, BAP, was used.
The combination of 4 categories of medium components at 3 concentrations gave a set
of 81 (34) basal media and a total of 648 treatments (81 basal media x 2 auxins x 4
osmotica) (Appendix vii).

Protoplasts isolated as previously described (2.2.2), were plated at a final density of
100,000 protoplasts/ml in each of the different liquid media in 96 well flat
bottomed assay plates (Falcon, Oxnard, CA, U.S.A) (i.e 20,000 protoplasts/200 u.l
medium per well). The plates were incubated at low light intensity (<200 lux) in a
plastic container at 25°C, with a 16/8 h photoperiod for 3 weeks. The wells were
screened weekly for cell division. Media which appeared to promote cell division
were noted. These media were then screened further using 24 well plastic tissue
culture plates (Costar, Cambridge, Mass., U.S.A), under the same conditions as
previously described using 100 000 protoplasts /ml of medium in each well. Wells
were screened as before.
2.3 Callus Production
A section of stem approximately 20 mm long was removed from just below the shoot
apex (10 m m ) . The tissue was surface sterilized in a 0.5% (v/v) sodium
hypochlorite solution (made from commercial bleach containing 4 % (v/v) sodium
hypochlorite) for 3 minutes followed by 2 washes in sterile distilled water, and cut
into small pieces approximately 1 m m 2 and placed on:
1) M.S* Medium (Appendix i) with 0.1 uM GA3; 1.0 uM NAA and 0.5 u.M BAP.
2) M.S* Medium (Appendix i) with the following concentrations of 2,4-D: 5, 7, 9,
11, 13 u M in combination with the following concentrations of BAP: 2, 4, 6, 8 u.M.
Callus was grown in an environmental chamber at 25°C, with a 16/8 h photoperiod
at 200 lux or in a 25°C incubator room in the dark. Developing callus was
subcultured every 3 to 4 weeks.

2.3.1 Regeneration of Callus
Callus which produced chlorophyll and turned green was used for regeneration.
Callus was subcultured onto all of the following media previously shown to support
regeneration either via somatic embryogenesis or directly by shoot and root
production.
1 ) Medium S modified from Shahin and Shepard (1980)
2 ) Medium 1
Medium 2
3 ) Medium A
B
4 ) Medium SH
5 ) Medium MS*
6 ) MSX
after Stamp and Henshaw (1982)
II
after Tilquin (1979)
after Gamborg et al (1981)
after Kartha etal (1974a)1.0 uM NAA, 0.5 u.M BAP and
0.1 uJVI GA3 (Appendix i)
1.5 x Medium M S
Callus was incubated:
1) In an environmentally controlled chamber at 25°C, 16/8 h photoperiod, 7 0 % RH
at 6000 Lux; and 2) In a growth room at 25°C, 16/8 h photoperiod at 3000 Lux.
Callus was subcultured monthly.

2.3.2 Initiation of Suspension Cultures
Pale, fast growing friable callus was used for the initiation of suspension cultures,
as follows.
2.3.2.1
Callus of the cultivar Groot Rooi grown on MS* medium + 1.0 u.M NAA, 0.5 u.M BAP
and 0.1 u.M G A 3 (Appendix i) was inoculated into 30 ml of liquid Gamborgs B5
medium + 4.5 U.M 2,4-D and 0.46 u.M kinetin. The flasks were incubated under low
intensity continuous light at 25°C in a rotary incubator (Gallenkamp, London) at 80
rpm. After 7 days, cells were lightly homogenized in a sterile glass homogenizer to
break large cell aggregates apart. The cells were allowed to settle for approximately
10 minutes and the supernatant was poured off. Cells were transferred to a new
flask with 60 ml of the above liquid medium. After a further 7 days, 10 ml of cells
were taken and added to 50 ml of fresh medium (inoculum size approximately 105
cells/ml).
2.3.2.2
Callus of the cultivars Groot Rooi and TMS 58308 grown on basal MS* medium
(Appendix i)+ 6 uM BAP and 13 u.M 2,4-D was inoculated into liquid M S * medium
(Appendix i) with the following 9 different hormone concentrations.
2 uM BAP + 5 U.M, 9 u.M or 13 uM 2,4-D
4 u.M BAP + 5 uM, 9 uM or 13 uM 2,4-D
6 u\M BAP + 5 uM, 9 uM or 13 uM 2,4-D

The flasks were placed on a gyratory shaker (Certomat, Braun, West Germany) at
100 rpm in the dark at 25°C. After 10 days, the suspension was poured through a 1
m m 2 sieve to remove large cell aggregates. Five ml of the resulting suspension was
added to 20 ml of fresh MS*medium (Appendix i) containing 5 u.M 2,4-D and 6 u.M
BAP. Cells were subcultured every 8-10 days at a 1:4 dilution.
In later experiments, callus of cassava cultivars Groot Rooi, TMS 58308, Thailand,
Comml, A C P 100, M Mex 59 and M Aus 7 grown on filter paper rafts on semi-solid
M S * medium (Appendix i) containing 3 g/l agar + 6 u.M BAP and 13 uM 2,4-D was
inoculated into liquid M S * medium (Appendix i) with 5 u.M 2,4-D and 6 uM BAP. In
some experiments, a semi-synthetic cephalosporin, Zinacef, (Donated by Dr. B.M.
Bain, Glaxo Group Research Limited, Greenford, Middlesex, England) was added to the
initial culture medium at 100 ug/ml. Cultures were incubated and subcultured as
above.
2.3.3 Growth Characteristics
For cells grown as described in section 2.3.2.1, samples were taken on day 0, 1, 2,
4, 7 and 10. For cells grown using the method described in section 2.3.2.2, samples
were taken daily for 14 days. Cell samples were analyzed for packed cell volume and
cell number as follows.
2.3.3.1 Determination of Packed Cell Volume
A 10 ml aliquot of the suspension culture was removed and placed in a graduated
conical centrifuge tube and centrifuged at 1,000 rpm for 5 minutes. The total volume
of the cell pellet was read directly off the gradations on the centrifuge tube. The
pellet volume was calculated as the percentage of the total volume of the tube.

2.3.3.2 Determination of Cell Number
For cells grown as described in section 2.3.2.1, the method of Reinert and Yeoman
(1982) was employed. The pellet from the packed cell volume was resuspended in
2ml 1 0 % HCI and gently disturbed to allow adequate mixing of the cells with the acid.
The cells were frozen overnight (16 h) and the following day thawed at room
temperature (22°C). On thawing, 2 ml of 1 0 % (w/v) chromic acid (a solution of
chromium trioxide in water) was added, and the cells left at room temperature for 3
days. The mixture was converted into a fine cell suspension by repeated suction and
expulsion from a fine pasteur pipette. Cells were counted with a haemocytometer
(average of 4 grids).
The total number of cells in the pellet was calculated using the following formula.
Volume of macerate x cell count = Total cell number in pellet
Volume above grid
The cell number in suspension cultures grown according to the method described in
section 2.3.2.2 were assessed using the method of King (1984).
One volume of cell culture was added to 4 volumes of 12% (w/v) chromium trioxide,
which was filtered before use. The mixture was heated at 70°C, until the cells were
stained and plasmolysed (approximately 20 min). The cell aggregates were then
disrupted by vigorous pumping with a syringe. The cells were counted on a
haemocytometer and the total number of cells calculated as above.

2.4 Meristem Tip Excision and Propagation
Plants grown under phytotron conditions were used as source material for the
isolation of meristem tips. The excision process was carried out in a laminar flow
hood using a Zeiss stereo microscope, and 2 micro-scalpels prepared from flattened
dissecting needles to give a small blade with a cutting edge approximately 5 m m long.
A shoot between 3-4 cm long was removed from the plant and all larger leaves and
stipules removed before surface sterilization in 0.5% sodium hypochlorite (made
from commercial bleach containing 4 % (v/v) sodium hypochlorite) for 3 minutes
and 2 washes in sterilized distilled water.
The shoot was placed on the microscope stage, previously sterilized by spraying with
7 0 % alcohol and allowing to air dry. All outer appendages were removed from the
shoot at low magnification. The magnification was increased and all the young leaf
primordia were removed until only the apical meristem with 2 primordial ridges
remained (± 0.3 - 0.5 m m ) . Using a microscalpel with a small hook, the meristem
was excised and transferred to either Eradication medium 1 (Van Staden pers. comm.,
1983) (Appendix viii) or M.S* medium with 1.0 u.M NAA, 0.5 u,M BAP and 0.1 |iM
G A 3 (Appendix i), for plantlet regeneration. McCartney bottles (30 ml) containing
10 ml of solidified medium were used. The cultures were maintained in an
environmental chamber at 27°C, under 6000 lux with a 16/8 h (light/dark)
photoperiod.
For micropropagation, excised meristems were placed on M.S* medium (Appendix
i), with 0.05 u.M NAA and 2.5 u.M BAP, and kept under the same conditions as above.
On development of a rosette containing between 10-20 nodes, the plantlet was
transferred to liquid M.S.* medium (Appendix i) with 0.25 u.M BAP, 0.1 u M G A 3

and 0.1 u.M N A A in a 100 ml wide mouthed ehrlenmeyer flask. The cultures were
incubated at 25° C on a shaking platform at 40-50 rpm, with a 16/8 h (light/dark)
photoperiod, under 2000 lux.
Apical bud and single node cuttings were harvested at 2-3 weekly intervals and
placed onto solid meristem tip culture medium (M.S.* with 1.0 u.M NAA, 0.5 u.M B A P
and 0.1 u.M GA3, Appendix i)) and kept under the same conditions as above (section
2.4). If necessary, single node cuttings were also taken from these plantlets as they
developed.
2.4.2 Acclimatisation to Soil
Rooted plantlets were removed from medium and transferred into small sterilized
peat pots containing a sterile sand/vermiculite mixture (50% v/v). The plants
were watered with sterile water, before being sealed into a sterile glass jar, by
placing the bottom of a sterile petri dish over the opening and sealing with parafilm.
The plantlets were kept in an environmental chamber at 25°C, with a 16/8 h
(light/dark) photoperiod under 6000 lux, with 7 0 % relative humidity. After 10-
14 days, the parafilm was removed and the petri dish bottom lifted slightly to allow
air movement from the chamber. The petri dish bottom was removed completely
after 24-48 h, and the plants fertilized weekly.
One month after initial transfer, plants were planted in sterilized soil in polythene
bags and moved to the greenhouse.

2.5 Bacterial Stocks
Erwinia herbicola stock cultures ECU (ATCC 23372), hereafter referred to as ECU,
and the two field strains Xiib and la were donated by Dr H.M. Cowley (University of
the Witwatersrand, Johannesburg, South Africa ). Strains Xiib and la, were isolated
from infected cassava plants grown in the Transvaal Lowveld, South Africa (Whitlock
et al, 1986). Strain ECU an Erwinia herbicola originally isolated from cassava was
included as a known non-pathogen. Bacterial cultures were maintained on nutrient
yeast extract glucose agar (NYG) slants at 4°C (Appendix ix). The bacterial strains
were subcultured every 8-9 months. For experimental work, bacterial strains
were cultured on nutrient agar (Oxoid, Basingstoke, Hants, England) + 5 % glucose.
Capsules were detected according to the procedure of Duguid (1951). Basically,
bacterial cells were mixed with a drop of Indian ink, ensuring as minimum a dilution
of the ink as possible. The drop was covered with a coverslip and examined under oil
immersion.
2.5.1 Bacteriocin Production
Antagonistic compounds elicited by ECU, la and Xiib, were detected by the method of
Vantomme, Mergaert, Verdonck and De Ley (1989). Bacterial strains ECU, la and
Xiib were preincubated on nutrient agar + 5 % glucose in petri dishes for 24 h at
27°C. One drop of bacterial culture (109 cells/ml) was deposited in the centre of
the medium. After 24 h, the agar layers were turned over aseptically and the upper
side inoculated with test strains by swabbing the surface with sterile cotton buds
dipped in a suspension of bacterial indicator (109 cells/ml). A lack of growth in a
zone around the initial colony was taken as a positive result. The bacterial strains
were tested against each other, as well as against a number of test organisms,

Escherichia coli, Bacillus subtilis Salmonella typhimurium and Staphylococcus
epidermidis.
2.5.2 Electron Microscopy
Bacteria grown on solid medium (nutrient agar + 5% glucose) were suspended in 1%
(w/v) ammonium acetate (approximately 107/ml). One drop of phosphotungstic
acid (2 % w/v in water, pH 6.5) and one drop of bacteria were mixed and applied to
carbon parlodion (3.5% w/v in amyl acetate) coated copper grids for 30 s. Excess
liquid was removed with filter paper and the samples placed in a dessicator for a
minimum of 5 min before examination in a JEOL JEM 2000FX electron microscope.
2.6 Precipitation and Separation of Bacterial Extracellular Material
Bacterial cells from 48 h cultures of strains la, Xiib and ECU were collected from
the surface of nutrient agar + 5 % glucose agar plates in 2 x 5 ml aliquots of cold
(4°C) glass distilled water. The bacterial suspension was centrifuged at 10,000 g at
4°C for 20 min to remove the cells. The resulting supernatant was passed through a
0.8 u.m filter.
Cold acetone (-18°C) was added to the crude culture filtrate to 20% concentration
(v/v) and the mixture allowed to stand overnight at 4°C. The precipitate was
collected by centrifugation (16,000 g for 15 min at 4°C) and further acetone
(-18°C) added to the supernatant to a final volume of 6 6 % (v/v) and left overnight.
The resultant precipitate was recovered by centrifugation (16,000 g for 15 min)
and the pellets from each of the 2 0 % (v/v) and 6 6 % (v/v) fractionation steps were
resuspended in a minimum volume of glass distilled water.

The 3 preparations i.e. the 2 0 % precipitate, 6 6 % precipitate and acetone soluble
fraction, were fractionated further using gel chromatography. The 2 0 % and 6 6 %
fractions were eluted through Sephacryl S-300 HR, bed height 90 x 1.5 cm,
(Pharmacia, Uppsala, Sweden) and the acetone soluble material on Sephadex G 10,
bed height 30x3cm, (Pharmacia, Uppsala, Sweden). Fractions were eluted at 4°C
using glass distilled water as eluant at a flow rate of 8 ml/h. Four ml fractions were
collected. The void volume was determined using the exclusion volume for Blue
Dextran 2000 (Pharmacia, Uppsala, Sweden) measured as the leading edge of the
peak. The columns were linked to a Uvicord 2238 Sll detection system monitoring at
a wavelength of 206 nm (Pharmacia LKB, Uppsala, Sweden) attached to a chart
recorder (Omniscribe, Houston Instuments, Austin, Texas, U.S.A).
Protein was determined using the Bio-Rad Protein assay (Bio-Rad, Richmond, CA,
U.S.A), which is based on the absorbance shift of Coomassie Brilliant Blue G-250
from 465 nm to 595 nm when binding to protein occurs. A standard curve of BSA
protein was prepared for each assay. Dilutions containing from 1-25 ug/ml of
protein were prepared. The assay was carried out in a Titertek 96 well assay tray
(Flow Laboratories, Irvine, Scotland). Standard protein dilutions and test samples
(120 uJ) were pipetted into the wells and 30 u.l of dye reagent added. The contents of
the wells were mixed and the plates read 5-60 min later using a Dynatech M R 600
Microplate reader (Dynatech Laboratories, Inc. Alexandria, Virginia, U.S.A) set at
570 nm against a blank of sample buffer (water).
Polysaccharide was determined using the anthrone method with D-galactose as
standard (Dische, 1962). Two volumes of anthrone reagent (0.2 g/100 ml H2SO4)
were added to test tubes standing in a cold water bath (10-15°C). One part of the
sugar containing sample (optimal concentration 20-40 u.g) was gently added forming
a layer on top of the reagent. The sample and reagent were mixed, keeping the tube

immersed in cold water to dissipate the heat of mixing. Tubes were placed in a water
bath for 16 min and cooled again. Optical densities of the solutions were measured at
625 n m and concentrations calculated against a standard curve of galactose (0-500
M-g/ml).
2.6.1 Isolation of Exopolysaccharides
Bacteria were harvested into cold water (2 x 5 ml aliquots at 4°C) from stationary
phase 48 h cultures, grown on nutrient agar + 5 % glucose plates. Bacteria were
scraped from the plates using a glass rod. The resultant fluid was centrifuged at
10,000 g for 20 min in a Sorvall RC-5B centrifuge (DuPont Instruments, Newton,
C T . U.S.A.) to remove the bacterial cells. Four volumes of cold acetone (-18°C)
were added to the supernatant and the mixture stored at 4°C overnight to precipitate
the polysaccharide. The precipitate was collected by centrifugation at 10,000 g for
20 min, dissolved in water and lyophilized. The dried material was dissolved (10
mg/ml) in 0.25 M NaCl and stirred with one half volume of 0.25 M NaCl containing
4 % w/v cetyltrimethylammonium bromide (CTAB) for 15 min at room temperature.
The precipitated RNA-CTAB complex was removed by centrifugation at 10,000g for
1 h. Water (approximately 3 vol) was added to the supernatant until a second
precipitate formed and the mixture allowed to stand for 2 h on ice. The precipitated
EPS was collected by centrifugation at 16,000g for 20 min.
The collected precipitate was dissolved in a minimum volume of 1 M NaCl (3-5 ml)
and the polysaccharide precipitated again by the addition of 8-10 vol of cold ethanol
(4°C). After standing on ice for 2 h, the precipitate was collected by centrifugation,
at 16,000 g for 20 min. The ethanol precipitation was repeated and the final pellet
resuspended in a minimum of distilled water. The solution was desalted and
concentrated using a centriprep 10 concentrator (10,000 M W cutoff), (Amicon,

W.R Grace and Co., Danvers, Massachusetts, U.S.A). The concentrate was collected,
lyophilized (FD1 freeze drier.Dynavac High Vacuum Pty. Ltd., Burwood, Victoria,
Australia) and weighed.
A 2 ml sample of the resulting polysaccharide (2.5 mg/ml) was passed through a
Sephacryl S-500 H R (Pharmacia, Uppsala, Sweden) column (90x 1.5 cm), to
assess homogeneity. A flow rate of 8 ml/h was used with water as the eluant.
Fractions were detected using a Uvicord 2238 SI I (Pharmacia LKB, Uppsala.Sweden)
detection system linked to a chart recorder (Omniscribe, Houston Instruments,
Austin, Texas).
Polysaccharide samples, from strains ECU, la and Xiib, were assessed for purity
using the following: (a) Protein was detected using the Bio-Rad protein assay (Bio-
Rad, Richmond, CA, U.S.A) a 2.5 mg/ml solution of purified polysaccharide was
tested as previously described (2.6). (b) Nucleic acids were detected by
determination of the absorbance ratio of a 2.5 mg/ml solution in water at
260/280nm (Sambrook, Fritsch and Maniatis, 1989). 260/280 nm absorbances
were determined using an Ultrospec II, UV/visible spectrophotometer (Pharmacia
LKB Biotechnology, North Ryde, Sydney, Australia), (c) Lipopolysaccharide (LPS)
was detected using polyacrylamide gel electrophoresis followed by silver staining. A
20 u.l aliquot of purified polysaccharide in water (2.5 mg/ml) was pretreated in a
boiling waterbath for 5 min with 5 ul of S D S reducing buffer (Appendix X).
Polyacrylamide electrophoresis and silver staining was carried out as described in
(2.7.1). The ladderlike bands obtained on staining represent LPS molecules
containing increasing lengths of 0 antigen.

2.6.2 Preparation of E P S Samples for G C - M S
Purified EPS preparations were analyzed by GC-MS at Oxford Glycosystems Limited,
Oxford, England. Lyophilized EPS was dissolved in 2 ml of glass distilled water and
an aliquot (6-8 u.1) used for monosaccharide composition analysis. An aliquot of a
standard monosaccharide mixture (containing fucose, galactose, glucose, mannose,
N-acetylgalactosamine, N-acetylglucosamine, sialic acid and xylose) and a reagent
blank were simultaneously analyzed as controls. An internal standard, 3-0-Methyl-
D-glucose, was added to all samples so that the relative molar response factors of the
individual TMS-glycosides could be calculated for each monosaccharide standard.
2.7 Pilin Protein Purification
Bacterial cells of strains la, Xiib and ECU, grown on nutrient agar +5% glucose for
24-48 h (20 spread petri dishes/bacterial strain) were scraped from the petri
dishes into 0.15 M ethanolamine HCI buffer (pH 10.2) using 2 x 5 ml aliquots of
buffer/plate. The suspension was homogenized, on ice, for 2 min using an Ultra-
Turrax T25 homogenizer (Janke and Kunkel, IKA Labortechnik, West Germany) and
centrifuged for 30 min at 20,000 g using a Sorvall R C 5 B centrifuge (DuPont
Instuments, Newton, C T . U.S.A.) to remove bacteria and cell debris. The supernatant
was recovered and saturated ammonium sulphate added to achieve 10 % saturation.
After gentle stirring for 1 h, the precipitated crude pili were collected by
centrifugation at 15,000 g for 30 min. The pili were redissolved in 5 ml
ethanolamine buffer (0.15 M, pH 10.2) and contaminating cell debris removed by
centrifugation before repeating the ammonium sulphate precipitation. The final
pellet was resuspended in 2 ml of 1 M NaCl containing 0.05 % (w/v) sodium azide
and the preparation stored at 4 °C. Further purification of these crude preparations
was performed by fractionation on a Sepharose CL-4B (Pharmacia, Uppsala,

Sweden) column (1.5 x 90 cm) equilibrated with a 50 m M Na/K phosphate buffer
(pH 7.2) containing 2 M urea (after De Graaf, Klemm and Gaastra,1980). Fractions
(4 ml) were collected using a Redirac 2112 fraction collector (Pharmacia LKB,
Uppsala, Sweden) and the protein detected using a Uvicord 2238 SI I detector
(Pharmacia LKB, Uppsala, Sweden) scanning at 206 nm. The void volume was
determined using the exclusion volume for Dextran blue 2000 (Pharmacia ,
Uppsala, Sweden) 2 mg/ml.
2.7.1 Polyacrylamide Gel Electrophoresis (PAGE)
Fractions collected after filtration through the Sepharose CL-4B column were
separated using a modification of the discontinuous polyacrylamide gel system
designed by Laemmli (1970). Slab gels (16 x 20 cm) were used and consisted of a
1 5 % resolving gel and a 4 % stacking gel (Appendix X). A vertical slab gel apparatus
was used. The gels were subjected to an initial pre-electrophresis at 30mA for
30min before sample addition. The sample (20 ug protein) was pretreated in a
boiling water bath for 5 min in 50 ul S D S reducing buffer (Appendix x) before being
applied to the wells. Electrophoretic separation was carried out in a continuous
tris-glycine buffer at pH 8.3. Electrophoresis was performed at room temperature
for 1-2 h at 30 m A per gel.
The gels were fixed in 40% methanol, 10% acetic acid, 50% glass distilled water for
a minimum of 30 min before being stained with the Bio-Rad silver stain (Bio-Rad,
Richmond, CA, U.S.A).
Stained gels were recorded photographically with llford Pan F black and white film.

The molcular weights of the proteins were calculated from the migration of standard
proteins of known molecular weight. The Pharmacia (Uppsala.Sweden) low
molecular weight calibration kit was used (Appendix x).
2.7.2 Haemagglutination
Human blood (Type A) was collected into a tube containing heparin (20 units/ml).
The red blood cells (RBC) were separated from the plasma by centrifugation at 800 g
for 2 min followed by 3 washes in HA buffer (Appendix xi).
Bacterial cells (strains la, Xiib and ECU), cultured for 48 h on nutrient agar + 5 %
glucose, were scraped from the plates and collected in HA buffer. The cells were
washed 3 times in an Eppendorf centrifuge 5415 (Eppendorf, Hamburg, West
Germany) at 10,000g for 20 min. Both the R B C and bacterial cells were fixed in
0.1% glutaraldehyde at 24°C for 10 min and washed again. After fixation, the R B C
were adjusted to a final concentration of 3 % (v/v) and the bacterial cells to a
starting concentration of 10 9 cells/ml.
Ten fold dilutions of bacterial cells were made in HA buffer in Nunclon® round-
bottom 96 well trays (Delta, Denmark) to a final volume of 100 u.1. An equal volume
of 3 % R B C was added to each well and the plate incubated at 26°C for 2 h before
examination for haemagglutination.
In assays using purified pilin preparations, two fold dilutions of the purified pilin
(initial concentration 40 ug/ml) were made in HA buffer and the assay performed as
above.
In tests for inhibition of agglutination, RBC were pretreated with 200 ug/ml EPS
(from strains la and Xiib) or 200 ug/ml test sugar (glucose, mannose, galactose and

fucose). An equal volume of R B C in HA buffer, as above, and E P S or sugar solution
were mixed and incubated at room temperature for 30 min. The cells were washed
twice with H A buffer. The agglutination assay was carried out as before.
2.8 DNA Extraction
2.8.1 Alkaline Lysis Plasmid DNA Miniprep
Plasmid DNA was prepared using the Pharmacia Miniprep Kit Plus (Pharmacia LKB
Biotechnology, Uppsala, Sweden)
A sample (1.5 ml) of an overnight (18 h) bacterial broth culture (nutrient broth ;
Oxoid, Basingstoke, Hants, England; and 5 % glucose) was collected in a microfuge
tube and centrifuged for 1 min at maximum speed in an Eppendorf 5415 microfuge
(Eppendorf, Hamburg, West Germany). The medium was removed by aspiration and
the bacterial pellet resuspended by vigorous vortexing in 100 u1 of cold solution I
(Appendix xii). After 5 min incubation on ice, 200 ul of solution II (Appendix xii)
was added. The contents of the tube were mixed by inversion and incubated on ice for
5 min, before addition of 150 u.1 of solution III (Appendix xii) and further
incubation on ice (5 min).
The pellet was removed by centrifugation in a microfuge at maximum speed for 5 min
at room temperature. The supernatant was transferred to a clean microcentrifuge
tube before addition of 1 volume of isopropanol. The contents were mixed by
inversion and incubated at room temperature for 5-10 min. The precipitated D N A
was pelleted by centrifugation in a microcentrifuge at maximum speed for 5 min.
The supernatant was removed by aspiration and the pellet washed gently with 250 uJ

of isopropanol. The isopropanol was removed by aspiration and the pellet allowed to
air dry.
The pellet was resuspended in 50 u.1 of column buffer (Appendix xii) and purified on
a Sephacryl S-400 column. The column was prepared as follows:
The Sephacryl S-400 gel was resuspended by repeated inversion of the column
before being allowed to settle into a continuous bed. The column was allowed to drain
by gravity and equilibrated with 2 washes of column buffer (2 ml). Following
equilibration, the column was placed in a 15 ml centrifuge tube and centrifuged for 2
min at 400 g in a Beckman TJ 6 benchtop centrifuge (Beckman Instruments Inc.,
Spinco Division, Palo Alto, CA, U.S.A) in a TH 4 swinging bucket rotor. The eluted
buffer was discarded. The plasmid sample was slowly layered onto the flat upper
surface of the compacted bed of Sephacryl S-400 and the column spun for 2 min at
400 g in a Beckman TJ6 benchtop centrifuge in a TH 4 swinging bucket rotor. The
plasmid D N A was collected in the eluant from the column.
2.8.2 Large Scale Plasmid DNA Preparation (Qiagen pack 100,Qiagen Inc.,
Studio City, CA, U.S.A)
The bacterial cells from a 50 ml overnight (18 h) broth culture (nutrient broth +
5 % glucose) were harvested by centrifugation at 10,000 g at 4°C for 20 min in a
Sorvall RC-5B centrifuge (Du Pont Instruments, Newton, C T . U.S.A). The pellet was
resuspended in 3.6 ml of ice-cold 5 0 m M Tris-HCI (pH 7.4) and 400 uJ of freshly
prepared lysozyme (Boehringer Mannheim, North Ryde, Sydney, N S W , Australia ) at
an initial concentration of 20 mg/ml in 50 m M Tris-HCI was added. The mixture
was incubated on ice for 10 min. After incubation, 1 ml of 0.5 M EDTA (pH 8.0,
adjusted with NaOH) solution was added and incubated on ice for a further 10 min
before addition and gentle mixing of 200 ul of a 2 % (v/v) Triton X-100 solution.

The cell debris and chromosomal DNA was removed by centrifugation at 15,000 g
for 45 min at 4°C in a Sorvall RC-5B centrifuge (Du Pont Instruments, Newton, C T .
U.S.A). The supernatant was collected and treated with RNase A (Boehringer
Mannheim, North Ryde, Sydney, N S W , Australia), at a final concentration of 20
p,g/ml, for 30 min at 37°C Freshly prepared proteinase K (Boehringer Mannheim,
North Ryde, Sydney, N S W , Australia) was addded to a final concentration of 10 ug/ml
and the mixture incubated for 30 min at 37°C The cleared supernatant was
recovered by centrifugation at 15,000 g for 10 min and a 4.5 ml aliquot transferred
to a new tube. One ml of 5 M NaCl and 0.5 ml of 1 M 3-N-morpholino propane
sulphonic acid (MOPS, pH7.0) was added to the transferred supernatant to obtain a
final salt concentration of approximately 850 m M .
The Qiagen-pack 100 was equilibrated with 2 ml of buffer A (Appendix xii) and the
sample D N A adsorbed onto the cartridge by forcing the sample through at a maximum
flow rate of 0.5 ml/min. The cartridge was washed to remove proteins, R N A and
other contaminants by forcing 5 ml of buffer C (Appendix xii) through the column
over a period exceeding 3 min. The DNA was eluted from the cartridge by pressing
through 2 ml of buffer F (Appendix xii) at approximately 2 ml/min. The recovered
D N A was precipitated by addition of a 0.8 vol of isopropanol and incubation on ice for
30 min. The pellet was collected by centrifugation at maximum speed in an
Eppendorf 5415 microfuge (Eppendorf, Hamburg, West Germany) and washed 2
times with 7 0 % ethanol.
2.8.3 Extraction of Chromosomal DNA (after Marmur, 1961)
Ten ml of overnight cultures (18 h) of bacterial strains ECU, la and Xiib, grown in
nutrient broth + 5 % glucose were centrifuged at 6,000 rpm for 1 min. The pellet
was washed in 10 ml saline EDTA buffer (0.15 M NaCl, 0.10 M EDTA, pH 9.0), and

the pellet resuspended in 1 ml saline EDTA buffer. Lysozyme (500 ug/ml)
(Boehringer Mannheim, North Ryde, Sydney, Australia) was added to the suspension
and incubated at 37°C for 1 h. S D S (0.5%, w/v) was added to the suspension and
after a further incubation of one hour at 37°C, one volume of chloroform was added
and the mixture incubated for 30 min at room temperature. The solution was
centrifuged at 10,000 rpm for 10 min to recover the aqueous phase and the
chloroform step repeated. Two volumes of cold ethanol were added to the resulting
aqueous phase and the mixture incubated for 1 h at -20°C The precipitated DNA was
recovered by centrifugation at 10,000 rpm for 10 min and the resulting pellet
resuspended in 10 m M Tris buffer (pH7.4) containing 1 m M EDTA before
electrophoresis in agarose minigels.
2.8.4 Agarose Gels
Isolated plasmid and chromosomal DNA was run on 1% NA agarose (Pharmacia,
Uppsala, Sweden) horizontal minigels (52 x 76 m m ) , (Appendix xii), using the
Pharmacia D N A 100 system (Pharmacia, Uppsala, Sweden), at constant voltage (80
v) for 1-2 h ( After Sambrook, Fritsch and Maniatis, 1989). The Boehringer
Mannheim DNA standard markers No 2 (North Ryde, Sydney, N S W , Australia) were
used (125-23130 bp).
2.9 Infection of Suspension Cultures with Bacteria
2.9.1 Bacterial Growth in Cell Suspension Medium
Flasks containing 20 ml of suspension culture medium M.S* (Appendix i) with 6 u.M
BAP and 5 uM 2,4-D were inoculated with the relevant bacterial cultures to give
approximate bacterial starting concentrations of 0.5 - 2 x 10⁶cfu/ml. The flasks

were shaken at 100 rpm in a 25°C incubator room in the dark. Bacterial growth was
followed by standard serial dilutions and surface plating techniques on nutrient agar
+ 5 % glucose.
2.9.2 Bacterial Growth in Cassava Cell Suspension Cultures
Cassava cell cultures, in early log phase, having been established four days earlier,
were inoculated with overnight bacterial cultures grown in liquid cell suspension
medium. Bacterial inoculum was added to give approximate starting concentrations of
103, 10 5 and 10 7 cfu/ml.
Bacterial growth was followed by standard serial dilution and surface plating
techniques. Cassava cell viability was determined using Evans blue (0.025%, w/v).
2.9.3 Addition of Bacterial Cell Free Extract to Cassava Cell
Suspension Cultures
The bacterial cultures of strains ECU, Xiib and la grown in liquid cell suspension
medium (MS* + 6 uM BAP and 5 u M 2,4-D), were filtered through a 0.22 um
filter at late log phase. The filtrate was added to log phase cassava suspension
cultures at the following concentrations, 0; 1; 2.5; 5; 7.5 and 10 % of the volume of
plant cell suspension. Cells and extract were incubated for 2 h at 25°C on a gyratory
platform at 100 rpm. Cell viability was assessed using Evan's blue (0.025%,w/v).
To test the toxicity of the purified EPS from bacterial strains la and Xiib, suspension
cultures at midlog phase containing (* 1x10⁵ cells/ml) were incubated in plastic 24
well plates with 0, 50, 100, 250, 500, 750 and 1000 ug/ml of purified

polysaccharide from bacterial strains la and Xiib. Plates were incubated for 2 h
before evaluation of cell viability using Evans Blue (0.025%, w/v).
2.9.4 Protoplast Assays
One ml of protoplast suspension in rinse solution (1x 10⁶ cells/ml) was incubated
in a 24 well plate (Flow Laboratories, North Ryde, Sydney Australia) with 0. 1, 2.5,
5, 7.5, and 1 0 % bacterial cell free extract from bacterial strains ECU, Xiib and la
(2.9.2) or 100-1000 ug/ml of purified E P S (2.6.1) from bacterial strains Xiib
and la, for 2 h at 25°C at low light intensity. In some experiments, 100 m M CaCl2
was added to the protoplast incubation medium. Viability was determined using Evans
Blue (0.025%, w/v).
2.9.4.1 Protoplast Regeneration Assay
Protoplasts were plated as described in (2.2.2.) in liquid PI-85 medium (Table 3).
Either aliquots of bacterial cell free extract (10%, v/v) from bacterial strains
ECU, Xiib and la or 100, 250, 500 and1000 ug/ml of purified polysaccharide (2.6)
from bacterial strains Xiib and la was added to the medium. Plates were incubated
under low light intensity for 21 days before determination of plating efficiency
(2.2.2).

2.10 Bioassays
2.10.1 Detached Leaf Bioassay (after Vidhyesekaran, Borromeo and Mew,
1 9 8 6 )
Young leaves (three quarter fully expanded) were detached, surface sterilized (3
min in a 0.5% hypochlorite solution followed with 3 rinses in sterile distilled
water) and cut into 1x2 cm sections and placed over a glass slide and the ends fixed
with tape (to prevent curling). Leaves were injured using a syringe needle to make a
small abrasion on the leaf surface. They were kept inside a sterile petri dish lined
with moistened filter paper. Five u.l of bacterial suspension (24h culture in plant
cell suspension medium or in nutrient broth + 5 % glucose, approximately 106
cfu/ml) or cell free filtrate (prepared by passing the 24 h bacterial culture through
a 0.2 u m filter) was placed over the injured area.
The petri dishes were incubated under controlled laboratory conditions (25°C and
16/8 h light/dark photoperiod) and symptom expression assessed visually.
2.10.2 Electrolyte Leakage
The youngest fully expanded leaves were cut into small pieces (5x5 mm) and rinsed.
Samples were enclosed in cheesecloth and placed in small glass vials. Three ml of
bacterial cell culture (106 cells/ml) or cell free extract was added and infiltrated
under vacuum for 30 min. The leaf sections were rinsed with water and 4 ml of glass
distilled water was placed in each vial and incubated on a reciprocal shaker (100
strokes/min) at 25°C for 64 h.

Conductances of the ambient solutions were measured with an Activon model 301
conductivity meter (Activon Scientific, Thornleigh, N S W , Australia) with a glass
flow cell (k=0.2), at 8 h intervals.
2.10.3 Polyphenol Oxidase Assay (after Daniels, 1979)
This assay relies on the production of black polyphenol oxidation products in
response to damage by toxins in leaves of broad bean plants. A modification of the
method of Daniels (1979) was used. Essentially, young leaves of three week old
broad bean plants, grown at 25°C and natural photoperiod, were surface sterililized
in 7 0 % ethanol for 30 s and washed thoroughly in three changes of sterile distilled
water. The leaves were homogenized using a pestle and mortar and the homogenate
resuspended in 1 0 % (w/v) sorbitol. Fractionated extracellular material, 2 0 %
(v/v) acetone and 6 6 % (v/v) acetone precipitates and acetone soluble material
(2.6.1) from Sephacryl S-300 H R and Sephadex G-100 columns respectively and
cell free extracts of bacterial growth medium (2.9.2) was assayed. Assays were
performed in 96 well plates; 150 u.l of broad bean homogenate was incubated with
25 ug of test material in 150 ul of 1 0 % (w/v) sorbitol solution. After incubation
overnight at 37°C, the homogenate was extracted twice with methanol for 30 min,
thus fixing and removing the chloroform from the tissue. The homogenate was
collected onto glass fibre paper using a cell harvester (Titertek, Flow Laboratories,
North Ryde, Sydney, Australia) and the degree of blackening visually assessed.
2.10.4 Plantlet Assays
Plantlets .approximately 3 months old, regenerated from meristems and single node
cuttings (2.4) were inoculated with: (a) cultures of strains ECU, la and Xiib
(approximately 1 0 6 cells/ml) (2.9.1); (b) bacterial cell free filtrates (10%,

v/v) (2.9.3) and (c) a solution of purified exopolysaccharide in water (1 mg/ml)
(2.6.1) isolated from the 3 bacterial strains.
A small puncture was made in the leaf with the tip of a 25 gauge hypodermic needle.
Five u.1 of test sample was applied over the resulting wound. Symptom development
was visually assessed 10 days after bacterial cell inoculation and 48 h after
bacterial cell free filtrate and E P S application.

3.0 R E S U L T S
3.1 Protoplast Isolation and Regeneration
3.1.1 Growth Requirements of Donor Plants
To obtain consistently high yields of viable protoplasts, donor plants, either as plants
propagated as cuttings or as regenerated plantlets, were grown under a controlled
environmental regime (2.1). Young, almost fully expanded leaves, gave optimum
yields. Isolations made from leaves of any other age or under other environmental
conditions resulted in complete degradation of the leaf with no protoplast release and
excessive amounts of cell debris. The isolation of protoplasts from meristem derived
in vitro plantlets gave consistently high, viable yields of protoplasts.
3.1.2 Isolation Procedures
Lightly brushing the leaves before enzyme treatment (2.2) yielded more viable
protoplasts and less contaminating plant debris when compared to either cutting the
leaves into small (1 m m 2 ) pieces or stabbing the lower surface of the leaves.
Protoplasts isolated by either short or long term enzyme digestion consistently gave
high yields of viable protoplasts. Protoplasts varied considerably in size (6-24 um,
mean 15 urn) but were characteristically spherical. Protoplast numbers and
viabilities obtained for the 12 varieties tested are presented in Table 1. The results
obtained using the Evan's blue and fluorescein diacetate methods (2.2.1) were
identical.
Protoplast preparations at the end of either 4 - 5 h or 14 - 15 h enzyme digestion
had large numbers of intact protoplasts and very little contaminating debris. Large

Table 1. Protoplast yields and viabilities.
Cultivar
Groot Rooi
Thailand
Gomani
TMS 30572
TMS 58308
1979 US 50207
1979 UT 4(2)
TMS 3095
Comml
MMex59
MAus 7
ACP 100
Yield/g leaves
1.4 x 10⁷
2.2 x 10⁶
2.4 x 10⁶
5.8 x 10⁶
7.9 x 10⁶
6.5 x 10⁵
5.8 x 10⁶
2.7 x 10⁶
1.6 x 10⁶
3.6 x 10⁶
2.3 x 10⁶
1.8 x 10⁶
Viability
%
96.7
90.5
67.0
62.0
96.4
63.0
96.3
89.0
94.0
96.0
93.0
92.0
SD
5.4
4.6
7.5
4.5
2.1
3.3
2.5
3.9
2.0
1.5
3.0
4.5
Protoplasts were isolated from young, almost fully expanded leaves of cassava
cultivars, using both the short term (4-5h) and long term (14-15h) enzyme
digestion. After purification protoplasts were resuspended in 1-2 ml of rinse
solution and counted using a haemocytometer (2.2). The results are from a
minimum of 3 experiments.

debris was successfully removed by passage through a system of meshes of decreasing
size. Initially, protoplasts were purified using the two-phase sorbitol/Dextran T40
method. However, less damage and a 5 - 10 fold greater yield was obtained by simply
washing the protoplasts by low speed centrifugation (2.2) (Figure 1a and 1b).
3.1.3 Regeneration Studies
After 1 week in culture, protoplasts in modified plating medium (2.2.2) showed high
levels of "budding" (Figure 2). However, the majority of "budding" cells died by the
end of the second week in culture.
The few remaining protoplasts, after cell wall formation, underwent their first
division by 8 days. At the end of 3 weeks in plating medium the cells had formed
small clusters. Ultrasfructurally the appearance was similar to that previously
reported for other protoplasts in culture. However plating efficiency was low,
between 0.5 and 1.0 %, for the cassava cultivars tested (Groot Rooi, T M S 58308,
Thailand, Gomani and 1979 UT4(2)).
An experiment was carried out to assess the effect of alteration of plating density on
the regeneration of the protoplasts. Based on initial plating densities between 1 x
1 0 4 and 3 x 10⁶, an initial plating density of 1 x 1 0 5 gave the best results. Below
this initial density, 1 x 10 5 cells/ml, cell division was not initiated. Above 1 x 1 0 5
cells/ml too many cells were present, aggregation of protoplasts occurred and
division and plating efficiency became difficult to assess.

Figure 1a. Light micrograph of freshly isolated protoplasts of Groot
Rooi. Protoplasts were washed in rinse solution and subsequently stained with
fluorescein diacetate.(500x).
Figure 1b. The same preparation viewed under the fluorescent microscope
showing protoplast viability (500x). Live cells appear yellow/green while dead
cells are orange/red.

96
x
>
<S'
# ®
•
•
K 'A-C
;*D - ^

97
Figure 2. Light micrograph of a "budding" protoplast of Groot Rooi.
(100 x). After 1 week in culture in modified plating medium a large number of
protoplasts showed cell "budding" (2.2.2).

Transfer of the small calli that formed using a plating density of 1 x 10⁵
protoplasts/ml to different media in an attempt to stimulate further growth for
ultimate shoot and root formation was unsuccessful. The callus reached a size
between 0.5 -1.00 m m 2 and stopped growing on all of the media tested (p-medium,
MS*, M S X and C medium). Alterations of light intensity did not affect callus growth.
In an attempt to improve the growth of callus from protoplasts, a chequerboard
experiment was performed to evaluate 648 different media combinations (2.2.2.1).
The cultivar Groot Rooi was used.
In the first selection step, the 648 media were screened for the ability to support
division of protoplasts. A large number of the media only gave rise to "budding" or
shrunken protoplasts. From this first screening 116, media were selected as
protoplasts in these media showed some signs of division. Protoplast growth was
screened again using these 116 media (Table 2). After 3 weeks incubation, cells on
1 medium showed enhanced cell division (Figure 3), while those on the remaining
media only showed "budding" and single cells (Figure 4). The medium, 2LHLLD,
which promoted enhanced division had low major salts, high 2,4-D, low BAP, low
vitamin concentration and 0.6 M glucose as osmoticum. This medium was designated
PI-85.
Enhanced division and large cell cluster formation (plating efficiency up to 35%)
occurred in PI-85 medium compared to small, shrunken, single cells and small
isolated colonies (plating efficiency 1%) obtained on plating medium of Gamborg et al
(1981) (2.2.2)(Figures 3 and 4). The constituents of the 2 media are compared in
Table 3. The estimated plating efficiency on PI-85, 3 weeks after plating, for 6
cassava cultivars (Groot Rooi, Thailand, MAus 7, M M e x 59, A C P 100 and Comml)
ranged from 16-23% (Table 4). A fairly high variability between experiments was

Table 2. The 116 media, selected from the first broad spectrum medium screen-
found to support protoplast division.
NAA
1LHMLA
1LHMLD
1MMMLB
1MMLMD
1MHHLC
1MHMMB
1MHLHD
1MHLLA
1MHLLD
1HLHLA
1HLHLD
1HMMLB
1HMHHB
1HMHMB
1HMHLA
1HMHLD
1HHHLB
1HHMLA
1HHLLB
1LHMLB
1LHLLB
1MMMLD
1MHHLA
1MHHLD
1MHMMC
1MHLMC
1MHLLB
1HLMLB
1HLHLB
1HMMMD
1HMMLC
1HMHHD
1HMHMC
1HMHLB
1HMLHD
1HHHLC
1HHMLB
1HHLLC
1LHMLC
1LHLLD
1MMLMA
1MHHLB
1MHMMA
1MHMMD
1MHLMD
1MHLLC
1HLMLC
1HLHLC
1HMMLA
1HMMLD
1HMHMA
1HMHMD
1HMHLC
1HMLLB
1HHHLD
1HHLLA
1HHLLD
2,4-D
2LHHMA
2LHHMD
2LHMLC
2LHLLA
2LHLLD
2MMHLC
2MHMHD
2MHLLD
2HMMMA
2HMMLD
2HMHLB
2HMLHA
2HMLHD
2HHHMC
2HHMMB
2HHMLA
2HHLMA
2HHLMD
2HHLLC
2LHHMB
2LHMLA
2LHMLD
2LHLLB
2MMMLA
2MMHLD
2MHLMA
2HLLLC
2HMMMB
2HMMMD
2HMHMD
2HMHLC
2HMLHB
2HHHMA
2HHHMD
2HHMMC
2HHMLB
2HHMLD
2HHLMB
2HHLLA
2HHLLD
2LHHMC
2LHMLB
2LHLMD
2LHLLC
2MMMLB
2MHMHA
2HLLLD
2HMMMC
2HMMLA
2HMHLA
2HMHLD
2HMLHC
2HHHMB
2HHHLD
2HHMMD
2HHMLC
2HHLHD
2HHLMC
2HHLLB
1 and 2 represent NAA and 2,4-D, respectively. The 4 letter code of high (H),
medium (M) and low (L) concentration constituents is in order of major salts,
auxin, cytokinin and vitamin concentration. The final letter of the code (A,B,C,D)
represents the osmoticum used.

Figure 3. Light micrograph of Groot Rooi protoplasts cultured in
PI-85 medium (x 100). Cell division and development of cell clusters were
photographed after 14 days in culture (2.2.2.1).
Figure 4. Micrograph of representative Groot Rooi protoplasts
showing shrinkage and occassional cluster formation when cultured
in all other media (x 100). Cultures were photographed after 14 days in
culture (2.2.2.1).

100

1
observed. However in all cases the plating efficiency was greater than the 1 %
observed using plating medium.
Further, the protoplasts cultured on the new medium formulation began to divide
earlier, 3 days compared to 8 days for those on plating medium. Cell colonies
transferred to solid PI-85 medium, after 3 weeks culture in PI-85 liquid medium,
continued to grow. However, when compared to initial growth in liquid medium,
growth was slower.
3.2 Callus Production
Initially, callus was initiated on MS* medium with 0.1 uJvl GA3, 1.0 (iM NAA and 0.5
u.M B A P (2.3.2.1), using stem tissue from cassava cultivars Thailand, Gomani, Groot
Rooi, T M S 58308 and 1979 UT 4(2). The callus grew slowly and was firm and
compact. In an attempt to obtain a rapidly growing friable callus, a range of
concentrations of 2,4-D and BAP was assessed (2.3.2.2.). Growth occurred over a
range of hormone concentrations. Friability, colour, relative growth (increase in
size from initiation) in light and dark was recorded (Table 5). To initiate
suspension culture, best callus growth occurred on M S * medium with 6 u.M BAP
and.13 u.M 2,4-D. In later experiments, in addition to the cassava cultivars listed
above, varieties Comml, MMex59, M Aus 7 and A C P 100 were also used. Callus
grown on M S * medium with 2 u M BAP and 5,7,9,11 or 13 uM 2,4-D was firm
green and compact and was used for regeneration studies.

Table 3. A comparison of initial plating medium and the new formulation PI-85.
PI-85
Constituents
NH4NO3 KH2P04
KCI CaCl2.2H20 MgS04.7H20 H3BO3 MnS04.4H20 ZnS04.7H20 CuS04.5H20 Na2Mo04.2H20 CoCI2.6H20 KI FeS04.7H20 Na2-EDTA 2,4-D BAP Choline chloride Inositol L-Cysteine.HCI Nicotinic acid Glycine Pyridoxine.HCI Thiamine.HCI Riboflavin Biotin Ascorbic acid Folic acid Ca-D-Pantothenate
Osmoticum/ Carbon source
Glucose
mg/l
400 13.61 142 147 123 0.62 2.23 0.2875 0.0025 0.0024 0.0238 0.083 2.78 3.72 2.2 0.025 0.014 18.02 1.576 0.490 0.0375 0.123 0.0337 0.0376 0.0098 0.0176 0.2207 0.095
M
0.6 M
plating medium
Constituents
KNO3
MnCl2.4H20
C0SO4.7H2O
NAA
Casein hydrolysate Agarose
Osmoticum/ Carbon source
Sucrose Mannitol Xylitol Inositol Sorbitol
mg/l
1900 170
440 370 3.1 9.9 4.6 0.0125 0.125 0.015 0.415 13.9 18.65 0.2 0.08
100
5 2 5 0.5
0.05
0.5
1 0 2000
M
0.2 M 0.025 M 0.025 M 0.025 M 0.325 M

Table 4. Plating efficiency of protoplasts in PI-85 medium.
Cultivar
Groot Rooi
Thailand
MAus 7
MMex 59
ACP 100
Comml
Plating efficiency %
23.0
16.0
19.0
19.0
17.0
17.0
SD
11.9
7.5
9.4
8.8
8.5
9.0
Protoplasts, isolated from 6 cassava cultivars, (Groot Rooi, Thailand,
MAus 7, MMex 59, ACP 100 and Comml) were plated in PI-85
medium. Plating efficiency was expressed as the percentage of cells
showing division after 3 weeks in culture, compared to the number of
protoplasts initially plated. Figures are the results of 5 replicate
experiments. Standard deviations (SD) are also shown.

104
3.2.1 Regeneration of Callus
Green, compact callus, originally isolated from cassava cultivars Groot Rooi,
Thailand, Gomani, 1979 UT 4(2) and T M S 58308, was subcultured onto the callus
regeneration media. Callus was grown for 3 months on these media with monthly
subculture. Callus was observed weekly and after 3 months morphogenetic
development on the different media was recorded for several different cultivars
(Table 6). Roots developed on some media, however, only nodules resembling
meristematic mounds with no further shoot development occurred.
3.2.2 Initiation of Suspension Cultures
Suspension cultures initiated from firm, compact callus of Groot Rooi, grown on
callus medium as described in 2.3.2.1, were characterized by an initial lag phase
followed by a short exponential growth stage of approximately 72 h. Cells, however,
were abnormally pleiomorphic with thin walls. Viability was low (< 25%) at the
end of the culture period.
Callus of cassava cultivars Groot Rooi and Gomani grown as described in 2.3.2.2 was,
therefore, used to initiate further suspension cultures. When suspension cultures
were initiated in liquid M S * medium with 6 uM BAP and 13 u\M 2,4-D, cells again
had very thin walls with highly pleiomorphic, polygonal shapes and low cell viability
(approximately 35 % ) . A medium series of 5, 9, 13 u M 2,4-D and 2, 4, 6 u M BAP
in liquid M S * medium was tested and the types of suspension obtained are detailed in
Table 7. The best cell suspensions, with uniform cell shape and good wall formation
(Figure 5), were obtained from M S * medium with 5uM 2,4-D and 6uM BAP.

105
Table 5. Callus growth in M S * medium with varying concentrations of 2.4-D and BAP.
Light Dark Cultivar: Groot Rooi
2,4-D
BAP
2(iM
4u.M
6u.M
8u.M
5^M
* *
* *
ywc
* *
ywf
* *
ywc
7u.M
* *
gc
* *
ywc
* *
ywf
* *
ywc
9 iM
* *
gc
* *
ywc
* *
ywf
* *
ywc
11u\M
* *
gc
* *
ywc
• * *
ywf
* *
ywc
13u.M
* *
gc
* *
ywc
* * *
ywf
* *
ywc
2,4-D
BAP
2uM
4[iM
6u.M
8^M
5^M
* *
gc
* *
ywc
* *
ywf
* * *
ywf
7uM
* *
gc
* *
ywc
* *
ywf
* * *
ywf
9uM
* *
gc
* *
ywc
ywf
* *
ywf
11U.M
* *
gc
* *
ywc
* *
ywf
* *
ywf
13u.M
* *
gc
* *
ywc
* * *
ywf
* *
ywf
Cultivar: Thailand
2,4-D
BAP
2uM
4uM
6uM
8uM
5u.M
* * *
gc
* *
ywc
* *
ywc
* * *
ywf
7u.M
* * *
gc
* *
ywc
* * *
ywc
* * *
ywf
9u.M
* * *
gc
* *
ywc
* * *
ywc
* *
ywf
11u.M
* * *
gc
* *
ywc
* * *
ywc
* *
ywf
13u.M
* * *
ywc
* *
ywc
* * *
ywf
* *
ywf
2,4-D
BAP
2u-M
4jiM
6uM
8u.M
5 iM
* * *
gc
* * *
ywc
* * *
ywc
* * *
ywf
7u.M
* * *
gc
* * *
ywc
* * *
ywc
* *
ywf
9uM
* * *
gc
* * *
ywc
* * *
ywc
* *
ywf
11u.M
* * *
gc
* * *
ywc
* * *
ywc
* *
ywf
13»iM
* * *
gc
* * *
ywc
* * *
ywf
* *
ywf
*, ** and *** refer to relative growth, c (compact) and f (friable) represent the
composition of the callus and g (green) b (brown), yw (yellow/white) and yb
(yellow/brown) the callus colouration.
continued

106
Light Dark
Cultivar Gomani
2,4-D
BAP
2|iM
4u.M
6 iM
8tiM
5 iM
* * *
gc
* * *
ywc
* *
ywc
* * *
ywf
7u.M
* * *
gc
* *
ywc
* *
ywc
* * *
ywf
9|iM
* * *
gc
* *
ywc
* *
ywf
* *
ywf
11u.M
* * *
gc
* *
ywc
* *
ywf
* *
ywf
13|iM
* * *
gc
* *
ywc
* * *
ywf
ywf
2,4-D
BAP
2^M
4uM
6uM
8u.M
5|iM
* * *
gc
* *
OP
* *
ywc
* * *
ywf
7 iM
* * *
gc
* *
ywc
* *
ywc
* * *
ywf
9|iM
* * *
gc
* *
ywc
* *
ywc
* *
ywf
11uM
* * *
gc
* *
ywc
* * *
ywc
* *
ywf
13jiM
* *
gc
* •
ywc
* * *
ywf
*
ywf
Cultivar TMS 58308
2,4-D
BAP
2u.M
4p.M
6^M
8uM
5^M
* * *
gc
* *
ywc
* *
ywc
* * *
ywf
7\LM
* * *
gc
* *
ywc
* * *
ywc
* *
ywf
9u.M
* * *
gc
* *
ywc
* * *
ywc
* *
ywf
11 M-M
* +
gc
* *
ywc
* * *
ywc
* *
ywf
13^M
* *
gc
* *
ywc
* * *
ywc
* *
ywf
2,4-D
BAP
2\iM
4|iM
6uM
8 iM
5uM
* * *
gc
* *
ywc
* *
ybc
* * *
ybf
7^M
* * *
gc
* *
ybc
* *
ybc
* * *
ybf
9uM
* * *
gc
* *
ybc
* *
ybc
* * *
ybf
11uM
* * *
gc
* *
ybc
* *
ybc
ybf
13uM
* *
ybc
+ *
ybc
* * *
ybc
•k *
ybf
Cultivar 1979 UT 4(2)
2,4-D
BAP
2uM
4|iM
6^M
8uM
5\iM
*
be
*
be
*
ywf
* *
ywf
7uM
* *
gc
*
be
*
ywf
*
ywf
9u.M
* *
gc
*
be
*
ywf
*
ywf
11uM
*
gc
*
be
* *
ywf
ywf
13^iM
*
gc
*
be
* *
ywf
*
ywf
2,4-D
BAP
2|iM
4^M
6^M
8 iM
5 iM
*
gc
*
be
*
bf
*
bf
7u.M
*
gc
*
be
bf
*
bf
9^M
* +
gc
*
be
*
bf
*
bf
11^iM
gc
*
be
* *
bf
bf
13^M
*
gc
*
be
* *
bf
*
bf

107
Table 6. Regeneration of callus.
Medium13
1
2
A
B
MS*
MSX
S
SH
Cultivar
Thailand
FBa
G/BC
G/BC
R+N
BC
G/BC
R+N
G/BC
R+N
G/BC
N
BF
R
Gomani
FB
BC
N
G/BC
N
BC
GC
R+N
G/BC
R+N
BF
N
G/BC
R+N
Groot Rooi
FB
G/BC
GC
R+N
G/BC
N
G/BC
R+N
G/BC
R+N
G/BC
N
G/BC
R+N
TMS 58308
FB
BC
G/BC
N
G/BC
N
GC
N
G/BC
R+N
BF
G/BC
N
1979 UT 4(2)
FB
G/BC
G/BC
R+N
G/BC
R+N
GC
R+N
G/BC
R+N
BF
G/BC
R+N
aG/B (Green/Brown), G (Green) and B (Brown) refer to callus colouration, R
(Roots) and N (Nodules) to the state of morphogenetic development and F (Friable)
and C (Compact) to the type of callus obtained, after 3 months in culture.
bThe various media listed in 2.3.1 previously shown to support regeneration of
cassava, either directly by organogenesis or via somatic embryogenesis, were tested
for regeneration of callus from several cultivars.

1
There were apparent significant differences in plant cell number and packed cell
volume (Figure 6a and 6b) of cell suspension cultures of Groot Rooi in the 2 media
used, Gamborgs B5 medium + 4.5 u.M 2,4-D and 0.46 u.M kinetin (2.3.2.1) and
M S * medium containing 5 uM 2,4-D and 6 uM BAP (2.3.2.2). Cell number was
greater in M S * medium containing 5 u.M 2,4-D and 6 |iM BAP (2.3.2.2) and there
was a corresponding increase in the packed cell volume of cells grown in this
medium. The viability after 14 days in MS*medium + 5 u-M 2,4-D and 6 u.M BAP,
was between 50 and 60 %.
When a cell suspension culture, using callus of TMS 58308, was initiated using
medium, M S * + 5 jxM 2,4-D and 6 utvl BAP, a fine uniform single cell suspension
with high viability (90-95%) resulted. A maximum cell number of approximately
4 x 10⁷ cells/ml and a corresponding packed cell volume of approximately 3 5 % was
obtained at the end of the log phase (Day 8) in all experiments using this cultivar
(Figure 7a and 7b).
Similar improvements in cell growth occurred for suspension cultures of cassava
cultivars MAus7, A C P 100, Comml, Thailand and M Mex 59 when callus grown on
semi-solid (3 g agar/l) M S * medium +6 uM BAP and 13 uM 2,4-D was inoculated
into liquid M S * medium containing 5 uM 2,4-D and 6 uM BAP (Table 8a and 8b).
Similar trends of cell number and packed cell volume occurred with cassava
cultivars Groot Rooi and T M S 58308 when grown in the same medium (Figures 6a
and b and 7a and b, respectively). Growing callus on semi-solid medium supported
by filter paper rafts yielded a white, friable callus which, on inoculation into liquid
cell suspension medium, gave a uniform single cell suspension.

1
Table 7. Morphology of cells in suspension culture.
Groot Rooi
2,4-D
BAP
2u,M
4u,M
6uM
TMS 58308
2,4-D
BAP
2^M
4 iM
6 iM
5|iM
* * *
DD
* * *
DD
* * *
UU
9u.M
* * *
DD
* * *
DD
* * *
UD
13^M
* * *
DD
* *
DU
* * *
D
5 iM
*
DU
* *
DD
* * *
UU
9^M
*
DU
* *
DD
* * *
UD
13nM
DD
*
UU
DD
*,** and *** refer to the relative number of cells in the culture, D and U reflect the
deformity or uniformity of the cell shapes.
Cells cultured in MS* medium with a range of concentrations of 2,4-D and BAP,
were counted using the chromium trioxide method (2.3.3.2) and their shapes
determined.

110
Figure 5. Cell suspension culture of Groot Rooi.(100 x). A uniform cell
shape and wall structure is evident. Cells were cultured in suspension culture
medium, MS* with 5 uM 2,4-D and 6 uM BAP (2.3.2.2).

Figure 6a. Growth curve of cell suspension cultures of Groot Rooi.
(•&) represents cells grown on suspension culture medium (2.3.2.1) with 4.5 jiM
2,4-D and 0.46 u.M kinetin and (-«-) cells grown on suspension culture medium
(2.3.2.2) with 5 u.M 2,4-D and 6 u.M BAP. Results shown are mean values of 3
replicates, where standard deviations (bars) are not shown they fall within the
size of the plot symbol.
Figure 6b. Packed cell volumes (%) of cell suspension cultures of
Groot Rooi. (<*) represents cells grown on suspension culture medium
(2.3.2.1) with 4.5 u.M 2,4-D and 0.46 uM kinetin and (••) cells grown on
suspension culture medium (2.3.2.2) with 5 uM 2,4-D and 6 u M BAP. Results
shown are mean values of 3 replicates, standard deviations (bars) are shown.

111
o o CC o o > O
3 E
CO
O c (0
a) Time (Days)
40-i
o o CC *—• o o O >
o > o a.
b)
Time (Days)

Figure 7a. Growth curve of cell suspension culture of T M S 58308 in
suspension culture medium. Cells were grown in suspension culture medium
(2.3.2.2) with 5 u.M 2,4-D and 6 u.M BAP. Results shown are mean values of 3
replicates. Standard deviations were within the size of the plot symbol.
Figure 7b. Packed cell volume (%) of cell suspension culture of T M S
58308. Cells were grown in suspension culture medium (2.3.2.2) with 5 u.M
2,4-D and 6 uM BAP. Results shown are mean values of 3 replicates, standard
deviations (bars) are shown.

112
CO
o m co IT) CO
>
o CD XI
E 3 CD
O c CO
a) Time (Days)
40 -i
co o GO
CO
>
>
o Q .
b) i — i — i — i — i — i
8 10 12 14
Time (Days)

113
Table 8a. Growth of cassava suspension cultures.
Time
(Days)
0
2
4
6
8
10
12
14
Cultivar:
M Aus 7
Cell No.
7.00x10⁵
9.20x10s
1.32x10⁶
6.35x10s
3.10X10⁷
3.14x10⁷
3.12x10⁷
3.11x10⁷
SD
2.5X10⁴
3.7x10⁴
6.6x10⁴
3.1x10s
9.2x10s
8.0x10s
8.2x10s
3.7x10s
Cultivar:
ACP 100
Cell No.
6.50x10s
8.70x10s
1.36x10s
6.44x10s
3.30X10⁷
3.33X10⁷
3.35X10⁷
3.34X10⁷
SD
2.8x10⁴
3.3X10⁴
7.2x10⁴
3.2x10s
9.3x10s
8.1x10s
5.1x10s
7.1x10s
Cultivar:
Comml
Cell No.
7.30x10s
8.40x10s
1.21x10s
6.31x10s
2.90X10⁷
3.01x10⁷
3.03x10⁷
3.02X10⁷
SD
1.65X10⁴
4.3x10⁴
7.1x10⁴
2.9x10s
7.8x10s
7.4x10s
4.2x10s
8.2x10s
Time
(Days)
0
2
4
6
8
10
12
14
Cultivar:
Thailand
Cell No.
5.80x10s
8.10x10s
1.29x10s
5.93x10s
2.60X10⁷
2.67x10⁷
2.69X10⁷
2.67X10⁷
SD
1.7x10⁴
4.6x10⁴
6.7x10⁴
2.5x10s
7.1x10s
6.9x10s
6.1x10s
6.7x10s
Cultivar:
M Mex 59
Cell No.
6.60x10s
8.40x10s
1.19x10s
6.83x10s
3.70X10⁷
3.69X10⁷
3.69X10⁷
3.68x10⁷
SD
2.0x10⁴
2.9x10⁴
6.1x10⁴
2.1x10s
8.3x10s
6.7x10s
3.5x10s
5.2x10s
Cells of MAus 7, A C P 100, Comml, Thailand and MMex59 were grown in suspension
culture medium as described in 2.3.2.2 with 5uJV1 2,4-D and 6uM BAP. Cells were
counted using the chromium trioxide method (2.3.3.2). Results are the mean values
and standard deviations of cell number of 3 replicates.

114
Table 8b. Packed cell volumes (%) of cassava suspension cultures.
Time
(Days)
0
2
4
6
8
1 0
1 2
14
Cultivar
M Aus 7
PCV(%)
0.90
1.20
1.70
8.25
40.30
40.8
40.50
40.30
SD
0.03
0.05
0.09
0.40
1.20
1.14
1.07
2.40
Cultivar
ACP100
PCV(%)
0.80
1.10
1.80
8.40
42.90
43.30
43.50
43.30
SD
0.04
0.04
0.09
0.42
2.21
1.15
2.73
2.31
Cultivar
Comml
PCV(%)
0.95
1.10
1.60
8.20
37.50
39.10
39.40
39.30
SD
0.02
0.06
0.08
0.38
1.96
1.14
1.98
2.67
Time
(Days)
0
2
4
6
8
1 0
1 2
1 4
Cultivar
Thailand
PCV(%)
0.75
1.05
1.70
7.70
33.8
34.70
35.00
34.70
SD
0.02
0.06
0.09
0.32
1.90
1.92
2.28
2.18
Cultivar
M Mex59
PCV(%)
0.90
1.10
1.50
8.90
48.10
48.00
47.90
47.18
SD
0.03
0.04
0.08
0.27
2.87
1.18
1.43
3.38
Cells of MAus 7, A C P 100, Comml, Thailand and MMex59 grown in suspension
culture medium as described in 2.3.2.2 with 5 uM 2,4-D and 6 uM BAP. Results
are mean values and standard deviations, of the percentage packed cell volume in a 10
ml sample, of 3 replicates.

1
3.3 Meristem Propagation
When meristem tips of cassava cultivars Thailand, Gomani and Groot Rooi were
excised and planted onto eradication medium, development was exceptionally slow.
Full regeneration of only 2 of a total of 50 meristems occurred. Although rooting
was common, shoot formation was poor.
When meristem tips of the same cultivars as above were excised and planted onto
M S * medium with 1.0 u.M NAA, 0.05 uM BAP and 0.01 u.M GA3 growth was more
rapid and full regeneration usually occurred within 3 - 5 weeks depending on the
cultivar.
For development of multiple shoot cultures for mass propagation, meristems of Groot
Rooi, Gomani, Thailand.Comml, MMex59, MAus7 and ACP100 were planted on solid
M S * medium with 0.05 uM NAA and 2.5 uM BAP. Plantlets on this medium
developed many axillary buds within 4 weeks. Transfer of this rosette plantlet to
liquid M S * medium with 0.25 uM BAP, 0.1 uM GA3 and 0.1 uM NAA, gave rise to
multiple shoots within 3 weeks. These cultures were harvested approximately every
2 weeks for 12 weeks.
3.3.1 Acclimatisation to Soil
Regenerated plantlets of the 7 cultivars tested (Groot Rooi, Gomani, Thailand,
Comml, MMex59, MAus7 and A C P 100), required a period of transition from the
environment of the culture vessel to soil. Using the method described in 2.4.2, a
survival rate for all cultivars, transplanted was 94%.

1
3.4 Bacterial Growth and Structure
The two field strains, Xiib and la, had distinct yellow mucoid colony morphology when
grown on nutrient agar + 5 % glucose (Figure 8a and 8b). Strain ECU (Figure 8c),
lacked the glossy mucoid growth and colonies were smooth, circular and raised with
entire margins. Based on light and electron microscopy, all 3 strains produced
capsulated cells when grown on nutrient agar + 5 % glucose.
The mucous produced by strains la and Xiib obscured the cell surface, forming a thick
layer around adjoining cells. In addition, arrays of cells were trapped in
extracellular material (Figure 9a-c)
The ability of ECU, la and Xiib to produce bacteriocins was evaluated, using the
method of Vantomme et al (1989). The bacteria, plated as described in 2.5.3 showed
no zones of inhibition when tested against each other and against test strains,
Escherichia coli, Bacillus subtilis, Salmonella typhimurium and Staphylococcus
aureus . Thus, under these experimental conditions the production of antagonistic
compounds was not detected for any of these strains.
3.5 Bioassays
3.5.1 Electrolyte Leakage
The suitability of an electrolyte leakage assay for this host - pathogen system, was
assessed using cassava leaf tissue incubated with cultures of the 3 bacterial strains
and bacterial cell free filtrates. Conductivity measurements (2.10.2), of leaf
samples of cassava cultivars in the presence of the 3 bacterial strains, ECU, la and

Figure 8 a-c. Colony appearance of pathogenic field strains and a
non pathogenic strain of Erwinia herbicola. Bacterial strains were grown
on NA+5% glucose at 27°C for 48h. (a) Strain la; (b) Strain Xiib; (c) Strain
ECU.

117

Figure 9 a-c. Electron micrographs of whole cells of the 3 bacterial
strains. Cells of (a) strain ECU (x12000) (b) strain la (x20000) and (c)
strain Xiib (x15000) were stained with 2 % uranyl acetate. Extracellular
polysaccharide (EPS); Flagella (F). Bar = 500 nm.

a)
b)
118
c)

119
Xiib, or filtrates of growth medium in which the bacteria had been grown, essentially
did not change during 64h. Figures 10 a and b show representative conductivity
measurements using cassava cultivar A C P 100 and bacterial cell and cell free
extracts, respectively. Thus leakage of electrolytes is not characteristic of this
bacterial - plant interaction.
3.5.2 The Detached Leaf Assay
The effect of bacterial extracellular components were assessed using young leaves,
collected and treated as described in section 2.10.1. Results using the cultivars,
Groot Rooi, Thailand, A C P 100, Comml, M Aus 7 and M M e x 59 were, however,
inconclusive. All 3 bacterial strains, bacterial cell-free filtrates and a medium
control, produced a blackening of the leaf tissue radiating from the leaf veins at the
point of test sample application.
3.6 Pathogen - Tissue Culture Interactions
3.6.1 Inoculation of Cell Suspension Cultures with Bacteria
Bacterial growth in cell suspension culture medium, as colony forming units/ml,
was followed to determine the bacterial growth curve in plant cell suspension
medium alone (Figure 11). W hen cell suspension cultures of cassava cultivars Groot
Rooi and T M S 58308 were inoculated with bacteria(2.9.2), final bacterial
concentrations were about 10 fold higher than in plant cell suspension medium alone
(Figures 12 and 13). Microscopically there were no visible effects of the bacteria
on the plant cells. Staining with Evan's blue, however, showed almost complete plant
cell death within 72 h by strains Xiib and la. On culture with the non pathogenic
strain, EC11 and in the control cultures, an approximate 5 % decrease in viability of

Figure 10a. The effect of the 3 Erwinia herbicola strains on the
leakage of electrolytes from leaf tissue. Results are shown minus the
control conductivity obtained from water treated samples. ( -o- ) represents strain
la, ( ••• ) strain Xiib, ( -n- ) ECU and ( -o- ) a control of uninoculated growth medium.
Values are means of 4 experiments, standard deviations (bars) are shown.
Figure 10b. The effect of bacterial conditioned medium on electrolyte
leakage from leaf tissue. Results are shown minus the control conductivity
obtained from water treated samples. Extracts were prepared from culture medium
in which the 3 strains of Erwinia herbicola had been grown.
( o- ) represents the extract obtained from the strain la, ( -•- ) from strain Xiib,
( -o- ) from strain ECU and ( •*- ) a control of uninoculated growth medium. Values
are means of 4 experiments, standard deviations (bars) are shown.

120
600 -i
550 w o -C E 3 500-a> o c c« o
c o O
450-
400
350
la
Xiib
ECU
MED
a) 1—'—1— 0 8
1 — 1 — 16
i
24 " ' — 1 — • — I -
32 40
Time (h)
" > — i — 48
- » — I -
56 " « — 1 — •
64
600 n
550 -</> O
E zi. 3 500 CD O
c rd u •a
c o O
b)
450
400 -
350
la f
Xiibf
ECU f
MEDf
T 1 1 1 1 1 1 1 1 1 1 1 1 1 1 1 1
0 8 16 24 32 40 48 56 64
Time (h)

1
plant cells of cultivars Groot Rooi and T M S 58308 occurred during the culture
period (Figure 14 and 15).
3.6.2 Inoculation of Suspension Cultures With Bacterial Cell Free
Filtrates
When cell free filtrates of bacterial cultures of strains la and Xiib were added at
various concentrations (0-10%; v/v) to the plant cell cultures, there was
significant (p< 0.05) decrease in viability of both Groot Rooi and T M S 58308
(Figure 16). There was essentially no decrease in cell viability in a medium control
and plant cell cultures exposed to medium from ECU with increasing concentration
during an incubation of 2 h. This effect was further confirmed in experiments using
cell suspension cultures of cultivars Thailand, A C P 100, M Aus 7, M M e x 5 9 and
Comml, where a significant decrease in viability (p<0.01) was observed when cells
were exposed to filtrates of the strains la and Xiib but not with a similarly prepared
filtrate of strain ECU or a medium control (Figure 17).
3.6.3 Protoplast Assay - Cell Free Filtrate
To determine whether there was a similar toxic effect when isolated cassava
protoplasts were exposed to pathogen conditioned media, bacterial cell free filtrates
were added to protoplasts after purification, as described in 2.9.3, and incubated for
2h. This treatment of freshly isolated protoplasts failed to elicit any detectable
response in the protoplast populations. The surface charge of the cell can affect
binding and as freshly isolated protoplasts are negatively charged, the effect of
addition of 1 0 0 m M CaCl2 to the protoplast incubation medium was investigated.

Figure 11 a-c. Bacterial cell growth in plant cell suspension
medium. The ability of strains ECU, la and Xiib ceils to grow in plant cell
suspension medium, without cassava cells was determined by standard serial
dilution plating technique. Initial bacterial starting concentrations were
approximately 10 3 (-o-), 10s ( +•) and 10 7 ( » ) cfu/ml. Graphs a, b and c
represent bacterial growth of strains EC11, la and Xiib respectively. The values
are means of 3 experiments. Bars indicate standard deviations.

122
(a)
T 1 1 1 1 24 48 72 96 120
Time (h) (b)
T 1 1 1 1 24 48 72 96 120
Time (h)
(c)
T 1 1 1 24 48 72 96 120
Time (h)
- o — 103 cfu/ml
-• 10s cfu/ml
10' cfu/ml

Figure I2a-c. Bacterial cell growth in Groot Rooi cell suspension
cultures. Growth was determined by standard serial dilution plating technique,
with approximate initial starting concentrations of 10 3 ( -o-), 10 5 (••-),
10 7 ( *• ) cfu/ml. Graphs a, b and c represent bacterial growth of strains EC11,
la and Xiib respectively. The values are means of 3 experiments. Bars indicate
standard deviations.

123
1Q10,
109-
1 0 8 ^
-,n7 4
3
IO' 1
JI06 1
105 J*
104d
10'
(a)
- I 1 1 1 1 24 48 72 96 120
Time (h)
10
(b)
3 A —, , 1 r i 24 48 72 96 120
Time (h)
(c)
T 1 1 r 24 48 72 96 120
1 0 J cfu/ml
• • 10 s cfu/ml
"• 107 cfu/ml
Time (h)

Figure I3a-c. Bacterial cell growth in T M S 58308 cell suspension
cultures. Growth was recorded by standard serial dilution plating technique,
with approximate initial starting concentrations of 10 3 (-o-), 10 5 (-••) and
10 7 ( -n-) cfu/ml. Graphs a, b and c represent bacterial growth of strains EC11,
la and Xiib respectively. The values are means of 3 experiments. Bars indicate
standard deviations.

124
io 1 0 .
109 -J
108 -
| I 0 7 •
3
10°
10 5 •%
10'
(a)
103 JL
0 _, , , , , 24 48 72 96 120
Time (h)
10 S
1° 9 1
i o 8 .
l i o 7 -j
°I06 •;
105--
i o 4 -
. 1
10'
(b)
T 1- 1 1 1 24 48 72 96 120
Time (h)
-a 1 0 3 cfu/ml
-•— 105 cfu/ml
"" 107 cfu/ml
— i 1 1 1 1
24 48 72 96 1°0
(c) Time (h)

Figure I4a-c. Viability of cultivar Groot Rooi cells after
inoculation with bacteria. Plant cultures were inoculated with bacteria at
initial concentrations of (a) 103, (b) 10 5and (c)107 cfu/ml. Graphs represent
plant cell viability at varying times after inoculation with bacterial strains
la (E2 ), Xiib ( H ), EC11 ( gg ), respectively and a control .uninoculated
suspension culture medium ( • ). The values are means of 3 experiments. Bars
indicate standard deviations.

125
100-1
ca
CD
O
a)
• Control
£2 ECU m xib E3 la
48 72
Time (h)
X>
CO
o
b)
CD
O
C)

Figure 15a-c. Viability of the cultivar T M S 58308 cells after
inoculation with bacteria. Plant cell cultures were inoculated with bacteria
at initial concentrations of (a) 103, (b) 10 s and (c)107 cfu/ml. Graphs
represent plant cell viability at varying times after inoculation with bacterial
strains la ( E3 ), Xiib ( H ), EC11 ( 0 ), respectively and a control, uninoculated
suspension culture medium ( • ). The values are means of 3 experiments. Bars
indicate standard deviations.

126
100 -i
x> CO
CD
O
(a)
Control
ECU
Xiib
la
120
Cfl
CD
O
(b)
.o CO
CD
O
(c)

Figure 16a and b. Viability of (a) Groot Rooi and (b) T M S 58308
suspension culture cells with increasing concentrations of bacterial
cell free filtrate. ( 0 ), ( H ), (13 ) and (• ) represent plant cell viabilities
after a 2 h incubation with cell free extracts from cultures of la, Xiib, ECU and a
control (cell suspension medium), respectively. The values are means of 6
experiments. Bars indicate standard deviations.

127
o o CE o o >
o
CD
O _cg
a) 7.5
I Medium
ECU
m xiib E3 la
10
% Filtrate
co o CO CO IO
CO > O
.a CO
> "55 O
J2 a.
b) % Filtrate

Figure 17a-e. Viability of suspension culture cells of cassava
cultivars (a) Comml, (b) A C P 100, (c) MMex59, (d) M Aus 7 and
(e) Thailand incubated with increasing concentrations of bacterial
cell free filtrate. ( 8 ), {S3 ), ( M ) and ( 0 ) represent plant cell viabilities
after a 2 h incubation with cell free extracts from cultures of la, X11b, ECU and a
control (cell suspension medium), respectively. The values are means of 4
independent experiments. Bars indicate standard deviations.

128
E E o O >' O J3 CO
CD
O
(a)
Medium 0 ECU
0 Xiib
1 2.5
% Filtrate
o o • « —
0.
o < > o >, 15 cd > —— CD o 5
100
80
60
40
20
0
(b) 2.5 5 % Filtrate
o> in X CD
2 2 >' O
£ !Q CO > — CD O 5s
100
80
60
40
20
0
(c) 2.5 5
% Filtrate
7.5

129
I^ 10 3
< 2 >
o >s +-•
!5 CO
> "CD
O
100-j .
80 -
•
60 -
40 -
20 -
(d) 2.5 5
% Filtrate 7.5 10
Medium
0 ECU H la 0 Xiib
T3 C JO CO
> O
CO
CD
o
(e)

1
CaCl2 (100 m M ) is sufficient to reverse the protoplast charge (Nagata and
Melchers, 1978). However, the addition of CaCl2 to the incubation medium failed to
cause any change in effect on the viability of protoplasts when inoculated with
bacterial cell free filtrates (Figure18). There was no significant difference between
treatments when cell free filtrates of control medium, the non pathogenic strain ECU
and the 2 pathogenic strains la and Xiib were used. Experiments using a 1 0 % (v/v)
cell free extract of medium in which the 3 bacterial strains had been grown and
protoplasts of cassava cultivars Thailand, MMex59, M Aus 7 and A C P 100 gave
similar results (Table 9). There was no decrease in viability of protoplasts 24h and
48h after addition of the bacterial cell free filtrate.
3.6.3.1 Protoplast Division Assay - Addition of Cell Free Filtrate
Although there was no apparent effect of bacterial cell free filtrates on freshly
isolated protoplasts, the possibility existed that the presence of such filtrates in the
protoplast plating medium could reduce the ability of the protoplast population to
undergo division. A protoplast division assay was performed to assess the effect of
bacterial cell free filtrates from the three bacterial strains, ECU, la and Xiib, on
plating efficiency. Addition of 1 0 % (v/v) cell free filtrate of the 2 pathogenic
bacterial strains la and Xiib, caused a significant reduction (p<0.01) in plating
efficiency. The filtrates severely inhibited colony formation (Figure 19). Similar
filtrates from the non pathogenic bacterium ECU and a medium control did not
significantly reduce plating efficiency. There was slight variability in plating
efficiency between cassava cultivars. However, all cultivars were susceptible to cell
free filtrates prepared from the medium in which the two pathogenic bacterial
strains la and Xiib had been grown.

Figure 18. The viability of freshly isolated protoplasts after
incubation with bacterial cell free filtrates. The viability of freshly
isolated protoplasts after a 2 h incubation with a 1 0 % (v/v) cell free filtrate
from cultures of ECU (Treatment 1 and 2), Xiib (Treatment 3 and 4), la
(Treatment 5 and 6) and a control of uninoculated medium (treatment 7 and 8)
was assessed. The influence of CaCl2 on the viability of freshly isolated protoplasts
of cassava cultivars Groot Rooi and Comml when incubated with a 1 0 % (v/v) cell
free filtrate was also assessed. Treatments 2,4,6 and 8 refer to protoplasts
treated with CaCl2 and treatments 1,3,5 and 7 to controls. The values are means of
3 experiments. Bars indicate standard deviations.

131
100 -i
80
60 -
40 -
20 -
E2 Comml
S3 Groot Rooi
1 2 3 4 5 6 7 8
Treatment

1
Table 9. Protoplast viability after exposure to bacterial conditioned medium.
10 %
(v/v)
CPE
Extract
ECU
Medium
Xiib
la
% Protoplast Viability
Cassava cultivars
Thailand
94.4
93.7
92.3
94.1
SD
0.56
0.5
2.4
0.14
MMex59
92.8
95.0
90.62
94.6
SD
1.9
0.42
3.1
1.55
MAus7
88.97
94.5
93.4
90.9
SD
3.5
2.5
2.3
4.5
ACP100
91.75
92.85
92.35
93.85
SD
0.07
1.5
0.78
2.9
A 1ml sample of freshly isolated protoplasts of cassava cultivars Thailand, MMex59,
M Aus 7 and A C P 100 at a concentration of 1 x 10 6 protoplasts /ml was prepared.
Protoplasts were incubated for 2 h with a 1 0 % (v/v) bacterial cell free filtrate
(CFE) prepared from cultures of strains ECU, la, Xiib and an uninoculated control.
Cell viability was assessed using Evans blue.

133
3.7 Precipitation and separation of extracellular material
Having established an efficient bioassay using cassava cell suspension cultures and
showing that the toxic activity was associated with extracellular material produced
by strains la and Xiib in vitro, attempts were made to isolate the toxic component or
components. The extracellular material produced by the 3 bacterial strains was
precipitated by sequential 2 0 % (v/v) acetone and 6 6 % (v/v) acetone additions
to harvested cell free extracellular material (2.6). The precipitates were further
separated by elution through Sephacryl S-300 H R (Figures 20-22). The fraction of
the extracellular material remaining in the acetone soluble fraction, was
separatedby elution through Sephadex G-100 (Figure 23). W h e n material resulting
from both the 2 0 % (v/v) acetone and 6 6 % (v/v) acetone precipitations was
fractionated through Sephacryl S-300 HR, protein, 5-7 u.g/ml (2.6), was
associated with extracts of all 3 strains and eluted with the void volume.
Carbohydrate was detected by the anthrone test for hexoses (2.6) and related to a
standard curve for galactose. The quantity of sugar was expressed as microgram
galactose equivalents. Sugar in fractions from both the pathogenic strains, la and
Xiib, was substantially higher (8-10 fold) than that for similar fractions of the non
pathogenic strain ECU. A range of 1000 - 10000 |ig galactose equivalents per
fraction was detected for the 2 pathogenic strains la and Xiib, while only 100 - 900
u,g galactose equivalents per fraction was detected for the non pathogenic bacterial
strain ECU. The sugar also eluted, from Sephacryl S-300 HR, with the void volume
from the 2 0 % (v/v) and 6 6 % (v/v)acetone precipitation (Figures 20-22).
No protein or sugar of apparent high molecular weight was detected in fractions
associated with the acetone soluble material isolated from any of the 3 bacterial
strains (Figure 23a-c). However, trace amounts of sugars were eluted with the
total column volume. The amount of material (u.g) recovered by lyophilization from

Figure 19. Plating efficiency (%) of protoplasts after addition of
10% (v/v) bacterial cell free filtrates. Protoplasts were isolated from
cassava cultivars Groot Rooi, ACP 100, Thailand, MMex59, M Aus 7 and Comml and
10% (v/v) cell free filtrates of medium in which bacterial strains ECU, la and
Xiib had been grown and a control, uninoculated medium, were added to the plating
medium. Plating efficiency (%) was determined 3 weeks after plating. Values are
means of 4 experiments. Bars indicate standard deviations.

134
Groot Rooi
W AcplOO
Wi Thailand
^ MMex59
Q M Aus7
Comml
Med ECU Xiib
1 0 % (v/v) Bacterial Free Filtrate

1
the peaks obtained after elution of the 2 0 % (v/v) acetone and 6 6 % (v/v) acetone
precipitates through Sephacryl S-300 HR, and the acetone soluble fraction
remaining after removal of the 6 6 % (v/v) acetone precipitate through Sephadex G-
100, is shown in Table 10.
Based on absorbance profiles, sugar and protein analysis, two sets of fractions (FI
and Fll) which eluted from the columns, were pooled (Figures 20-23).
The toxic activity of the pooled fractions (Table 10) was evaluated using plant cell
suspensions of 6 cassava cultivars. The toxic activity, from pathogenic strains la and
Xiib, to cell suspension cultures, of six cassava cultivars, was present in the first
pooled fraction (F l/F l*)(Table 11). No toxic activity was associated with the
second pooled fraction (F II) of either of these 2 strains. There was no decrease in
suspension cell viability associated with any of the fractions from non pathogenic
strain ECU or any of the acetone soluble material. In both 20 % (v/v) acetone and
6 6 % (v/v) acetone precipitates, the amount of lyophilized material recovered in
F l/F I* for pathogenic strains la and Xiib was between 3 and 4 fold greater than that
recovered for the non pathogenic strain ECU. As both sugar and protein were present
in pooled fraction,F I, of all 3 bacterial strains, further purification of this material
was carried out to investigate the role of either sugar, protein or both constituents
from the 2 pathogenic strains la and Xiib, in the toxicity to cell suspension cultures.
3.7.1 Exopolysaccharide - Purification and Separation
The toxic activity, as assessed by the cell suspension assay (Table 11), of the
extracellular material of the pathogenic strains la and Xiib was associated with the
pooled fraction, F l/F I*, containing sugar. No toxicity was associated with similar

Figure 20 a and b. Fractionation of extracellular material of strain
ECU on Sephacryl S-300 HR. Extracellular material was fractionated after
an initial (a) 2 0 % (v/v) and a second (b) 6 6 % (v/v) precipitation with acetone.
Precipitates were separated on Sephacryl S-300 H R (column 1.5 x 90 cm). Flow
rate was 8 ml/h and 4 ml fractions were collected. I and II are the pooled fractions
collected and referred to in the text. V° refers to the void volume. Fractions
containing protein ( ) and sugar ( ) are indicated.

136
r8
wugog sqy rO
wufjos sqy

Figure 21 a and b. Fractionation of extracellular material of strain
la on Sephacryl S-300 HR. Extracellular material was fractionated after an
initial (a) 2 0 % (v/v) and a second (b) 6 6 % (v/v) precipitation with acetone.
Precipitates were separated on Sephacryl S-300 H R (column 1.5 x 90 cm). Flow
rate was 8 ml/h and 4 ml fractions were collected. I and II are the pooled fractions
collected and referred to in the text. V° refers to the void volume. Fractions
containing protein ( ) and sugar ( ) are indicated.

137
rS
-a
-8
o LO
o co ©
Luugog sqv CO UJU902 sqv S"

Figure 22 a and b. Fractionation of extracellular material of Xiib on
Sephacryl S-300 HR. Extracellular material was fractionated after an initial
(a) 2 0 % (v/v) and a second (b) 6 6 % (v/v) precipitation with acetone.
Precipitates were separated on Sephacryl S-300 H R (column 1.5 x 90 cm). Flow
rate was 8 ml/h and 4 ml fractions were collected. I and II are the pooled fractions
collected and referred to in the text. V° refers to the void volume. Fractions
containing protein ( ) and sugar ( ) are indicated.

138
wijgoz sqv to
LUU 902 sqv

Figure 23 a-c. Fractionation of extracellular material in the
acetone soluble fraction. The material remaining after 2 0 % and 6 6 % acetone
precipitation of extracellular material produced by (a) strain ECU, (b) la and (c)
Xiib was separated on Sephadex G-100 (column 3 x 30 cm). Flow rate was 8 ml/h
and 4 ml fractions were collected. I and II are the pooled fractions collected and
referred to in the text. V° refers to the void volume.

139
E c CD O CM W
<
(a)
E c CD
o CM
<
(b) 20 T ' r 40 60 Fraction
E c CD O CVJ
co <
(c)

140
Table 10. Amount frig) of fractionated bacterial extracellular material obtained
after column chromatography.
Strain ECU u.g
20% F I 5500
FN 7600
66% F I 1800
FN 1600
AS FI 6750
Fll 14690
Strain Xllb _u,g
20% FI 21500
Fll 1500
66% FI 5900
Fll 2900
AS FI 1200
Fll 21000
Strain la u.g
20% F I 7900
F I* 23500
Fll 3900
66% F I 6200
Fll 3700
AS FI 3200
Fll 25200
Material was collected, by lyophilization, from the fractions shown in figures 20-
23.
2 0 % and 6 6 % F I, F1* and F II refer to pooled fractions eluted from Sephacryl S-
300 HR, after separation of the 2 0 % (v/v) and 6 6 % (v/v) acetone precipitates of
the extracellular material produced by the 3 bacterial strains, ECU, la and Xiib.
A S F I and F II refers to polled fractions of material recovered after elution of acetone
soluble material through Sephadex G-100.

1
material of the non pathogenic strain ECU. The presence of an apparently high
molecular weight sugar, as well as the mucoid growth observed for the 2 pathogenic
strains la and Xiib (Figures 8 b and c) indicated the production of E P S by these
strains. Consequently E P S was purified from the extracellular material produced by
all 3 strains under investigation and the final product desalted and lyophilized
(2.6.1). The amounts (mg) of crude acetone precipitate and the final purified E P S
isolated from the strains, ECU, Xiib and la are given in Table 12. Both pathogenic
strains, la and Xiib, produced 16-30 times more E P S than similarly prepared E P S
from the non pathogenic strain ECU. To produce an amount of E P S from the
nonpathogenic strain, ECU, comparable to that produced by the 2 pathogenic strains,
la and Xiib, approximately 300-900 bacterial spread plates would be required.
A 2.5 mg sample of the EPS from strains ECU, la and Xiib was resuspended in water
and passed through a Sephacryl S-500 H R (exclusion limit for dextrans 2 x 10⁷)
column to assess purity (Figure 24a-c). Both E P S samples from the pathogenic
strains la and Xiib gave similar elution profiles with the leading edge of the peak
eluting before the Dextran Blue 2000. The resuspended E P S from the non pathogenic
strain ECU has a different elution profile with only a trace amount of material
eluting before the Dextran Blue, the bulk of the material eluting later. This
difference suggests that polysaccharide produced by ECU, compared to strains la and
Xiib, has a lower molecular weight and different absorbance properties In addition,
resuspension of dried E P S from both strain la and Xiib, in water, required vigorous
stirring and gave highly viscous solutions. Resuspension of similar amounts of
material from strain ECU was immediately soluble in water with no apparent
increase in viscosity.

Table 11. Suspension cell viability (%) after incubation with fractionated
extracellular material from the 3 bacterial strains.
Cultivar
Pooled
Fraction3
ECU
20 % FI
Fll
66% FI
Fll
AS FI
AS Fll
la
20% FI
FI*
Fll
66% FI
Fll
AS FI
AS Fll
Xiib
20 % FI
Fll
66% FI
Fll
AS FI
AS Fll
Plant Cell Viability (%)
Thailand
84.0
82.1
82.4
79.1
87.6
85.4
24.5
17.5
80.4
30.4
80.4
84.9
84.8
18.0
83.26
17.5
83.8
81.5
78.8
SD
1.54
1.76
2.42
3.09
5.24
2.62
1.33
1.35
2.56
1.98
2.29
4.36
3.70
1.71
1.5
1.65
3.40
2.43
3.14
M Mex 59
82.3
87.7
82.9
82.3
80.8
82.5
28.3
19.5
80.2
23.1
80.0
86.0
88.1
16.0
83.1
19.5
84.2
86.1
81.4
SD
1.30
3.27
1.63
2.61
2.98
3.00
2.66
1.70
2.34
2.4
3.26
3.57
2.87
1.81
3.2
1.20
3.44
1.90
3.30
Comml
76.7
72.5
78.2
77.5
84.1
81.5
33.9
23.8
83.8
25.0
81.1
81.8
79.2
15.2
80.0
13.8
82.5
83.3
85.2
SD
2.31
4.48
2.55
2.34
1.35
2.68
1.94
2.22
2.16
2.55
2.28
2.66
3.86
1.36
3.37
1.76
3.61
1.40
2.13
continued

Cultivar
Pooled
Fraction3
ECU
20% FI
Fll
66% FI
Fll
AS FI
AS Fll
la
20% FI
FI*
Fll
66% FI
Fll
AS FI
AS Fll
Xiib
2 0 % FI
Fll
66% FI
Fll
AS FI
AS Fll
Plant Cell Viability (%)
ACP100
75.4
77.8
80.6
85.8
82.3
81.2
30.8
19.6
88.2
32.6
83.3
78.6
86.2
15.5
80.1
16.6
81.0
78.4
79.1
SD
6.00
5.00
3.74
2.72
1.50
2.21
1.47
2.62
3.8
2.23
3.27
4.42
2.99
2.21
2.55
1.78
2.91
4.25
4.98
Groot Rooi
77.9
80.0
74.2
78.5
70.6
71.9
25.0
20.4
82.3
31.2
83.1
78.4
79.1
16.1
75.7
20.4
74.4
76.9
69.4
SD
2.46
1.56
3.52
1.78
3.30
4.33
1.20
1.13
2.88
2.52
2.45
2.12
2.71
1.55
3.71
1.89
2.50
1.65
4.24
M Aus 7
76.1
75.0
78.5
75.4
78.4
77.8
22.2
18.6
82.2
24.6
89.0
81.4
84.8
16.9
78.3
18.6
79.8
74.5
81.2
SD
2.55
1.56
3.07
2.24
3.78
3.37
2.14
1.39
2.76
3.22
2.23
2.23
1.68
2.10
3.6
1.04
2.28
3.56
1.78
aPooled Fractions, obtained after acetone precipitation and elution through a
Sephacryl S-300HR column, of extracellular material from the 3 Erwinia herbicola
strains ECU, la and Xiib, was added (250 u.g/ml) to suspension cultures. Viability
was assessed after a 2h incubation period (2.9.2).
2 0 % , 6 6 % and A S (acetone soluble fraction) refer to material recovered during the
acetone precipitation (2.6). Results are mean values of 3 replicates.

144
Before G C - M S analysis, polysaccharide, isolated from the 3 strains was assessed for
purity. No contaminating protein, nucleic acid or LPS was detected in any of the
samples tested (2.6.1).
3.7.1.1 GC-MS Analysis
The monosaccharide composition of the EPS isolated from the 3 bacterial strains
ECU, la, and Xiib was analyzed by GC-MS. Monosaccharide derivatives were
prepared by hydrolysis of the EPS and subsequent conversion to per-O-TMS methyl
glycosides. The major monosaccharide components of the EPS were identified by
comparative G C - M S analysis of these glycosides and the standard sugars, fucose,
galactose, glucose, mannose, sialic acid, xylose N-acetylgalactosamine and N-
acetylglucosamine. An initial total ion current spectrum of the various TMS-methyl
glycoside derivatives of standard and test sugars was obtained (Figure 25-28; Table
13-17). Further G C - M S analysis of each of these peaks identified the component
monosaccharide (Appendix xiii). The relative molar content of the monosaccharides
in the respective EPS samples were:
EPS from the non pathogenic strain ECU contains the monosaccharides fucose,
galactose and glucose having relative molar contents (relative to a value of 1.0 for
fucose) of 1.0:2.3:2.0 respectively (Figure 26; Table 14)
EPS from the pathogenic strain la contains the monosaccharides fucose, galactose and
glucose having relative molar contents (relative to a value of 1.0 for fucose) of
1.0:2.0:2.5 respectively (Figure 27, Table 15)

Table 12. Yield of purified E P S (from 20 nutrient agar + 5 % glucose plates)
produced bv bacterial strains ECU, la and Xiib after a 48h culture period.
Bacterial strain
ECU
la
Xiib
1st lyophilization (mg)^
125.0
364.0
407.0
SD
19.0
23.0
35.0
Final EPS (mg)
7.5
125.0
226.0
SD
4.1
11.2
9.8
First lyophilization refers to the first crude precipitate obtained after addition of 4
volumes of cold acetone to the harvested cell free extracellular material (2.6.1).
Further purification of this crude precipitate by further cycles of precipitation and
resuspension, as detailed in section 2.6.1 yielded the material referred to as final
EPS.

Figure 24 a-c. The elution profiles obtained after separation of EPS
purified from the 3 bacterial strains through a Sephacryl S-500 HR
column. Purified EPS from strains, (a) ECU, (b) la and (c) Xiib was eluted
through a Sephacryl S-500 HR column (1.5 x 90 cm) with water as eluant. B D
refers to the elution point of the leading edge of the peak of Blue Dextran. Flow rate
was 8 ml/h and 4 ml fractions were collected.

1.9-
1.4-
146
to o cvl co .a
<
a)
0.9-
0.4-
-0.1
20
BD
r » r-40 60 Fraction
- 1 —
80 — I
100
E c CO
o CVJ CO JD
<
b)
1.9-
1.4 -
0.9-
0.4 -
-0.1 — f -
20 40 60 - r -
80 -1 100
Fraction
E c (£>
o CM
J3
"1 1.4
0.9
0.4-
•0.1
20 40 60 —r 80
— I 100
c) Fraction

147
EP S from the pathogenic strain Xiib contains the monosaccharides galactose and
glucose having relative molar contents (relative to a value of 1.0 for galactose) of
1.0:1.4 respectively (Figure 28, Table 16).
However, based on total ion current scans obtained for the methyl glycosides
derivatives of the E P S produced by the 3 bacterial strains, some peaks remain
unidentified, especially at later retention times (Figures 26-28, Tables 14-17).
While the monosaccharide composition of E P S isolated from non pathogenic strain
ECU and pathogenic strain la are similar, the profiles suggest the presence of other
unidentified constituents. In both strain ECU and la other components with retention
times of 14-15min and 27-28min are indicated. However, the E P S derived from la
contains additional components which have retention times of approximately 24, 27
and 29min (Figures 26 and 27; Tables 14 and 15). The monosaccharide
composition of E P S isolated from pathogenic strain Xiib differs from the
polysaccharides isolated from strains la and ECU in that fucose is not present.
However, unidentified constituents with retention times of approximately 25-27min
were also present (Figure 28; Table 16).
3.7.2 Protein
The polyphenol oxidase assay (2.10.3) originally developed by Daniels (1979) was
used to rapidly assess toxicity of: (a) the fractions (eluted from Sephacryl S-300
HR) of the precipitates obtained by 2 0 % (v/v) acetone and 6 6 % (v/v) acetone
precipitation of the extracellular material produced by the 3 bacterial strains and
(b) fractions (eluted from Sephadex G-100) of the acetone soluble material i.e the
supernatant remaining on removal of the 6 6 % acetone precipitate. The assay relies
on the production of black polyphenol oxidation products by broad bean leaves after
damage by toxins. The reaction is, however, qualitative and efforts to improve this

148
were unsuccessful. It was necessary to suspend the broad bean leaf homogenates and
dilute all test samples in 1 0 % (w/v) sorbitol. Failure to do this resulted in
blackening of all samples. The reactions obtained on collection of the leaf
homogenates onto glass fibre paper, using a Titertek cell harvester are shown in
Figure 29.
Of the fractions tested, only one gave a positive reaction, the first pooled fraction, F
I, obtained by elution (from the Sephacryl S-300 H R column) of the precipitate
resulting from 6 6 % (v/v) acetone precipitation of extracellular material produced
by non pathogenic strain ECU.
As only the non pathogenic strain ECU yielded a positive reaction on the
polyphenoloxidase assay. This reaction showed similarities to the H R reaction
recorded in planta for incompatible host-pathogen interactions. Therefore, the
possibility that ECU could induce H R in an incompatible host was considered. The
knowledge that pili due to their aggregative behaviour often elute with the void
volume in gel chromatography, together with reports implicating pili in the H R
response of other plant pathogens, prompted the investigation of piliation in these
bacteria.
3.7.2.1 Electron Microscopy
Based on electron microscopic examination of negatively stained bacterial cells
(2.5.2) all 3 strains, ECU, la and Xiib possessed pili although large numbers were
not observed (Figure 30a and b). The presence of the dense layer of E P S in the two
virulent strains may, however, obscure these fine filaments, as even the much
thicker flagella were partially concealed. The pili are slightly flexible and are
9-12 n m wide. The flagella found on these bacteria are 36-48 n m wide.

Figure 25. Total ion current of TMS-methyl glycosides of standard
monosaccharides. L-fucose, D-xylose, 3-O-methyl D-glucose, D-mannose,
D-galactose, D-glucose, N-acetylglucosamine, D-galactosamine, sialic acid were
used as standards.

149
Abundance
3600000 ;
3400000;
3200000;
3000000-
2800000 ;
2600000;
2400000;
2200000;
2000000;
1800000;
1600000-
1400000;
1200000:
1000000;
800000;
6J0000-
400000;
200000-
TIC: STDE.D
0 ^ IRwW r i T •—i—I '—' lAL
rime -> 10.00 15.00 20.00 25.00

Table 13. Area percentage report of total ion current for TMS-methyl glycosides
for standard monosaccharides and monosaccharide peak identification bv GC-MS.
Total Ion Chromatogram Retention time 7.001 7.449 7.858 8.323 8.681 9.518 9.602 10.034 10.162 10.335 11.324 11.524 12.036 12.378 12.473 13.171 13.855 13.970 14.381 14.568 14.929 16.783 17.167 17.370 17.525 18.793 19.756 19.951 22.557 23.877 25.956 26.889 27.617 27.744
Area 12084789 48892009 34849812 60516360 37366604 5885180 8093439 120503081 45004096 10353008 178721066 42469222 21256262 115788071 26935725 57931497 157187240 7355019 70149107 5711031 9431406 7778406 4629666 15323706 14139375 77882154 115320935 6584599 44865328 7161795 62689267 38841197 24717817 170377
Area % 0.807 3.267 2.329 4.044 2.497 0.393 0.541 8.052 3.007 0.692 11.942 2.838 1.420 7.737 1.800 3.871 10.503 0.491 4.687 0.382 0.630 0.520 0.309 1.024 0.945 5.204 7.706 0.440 2.998 0.479 4.189 2.595 1.652 0.011
Monosaccharide L-Fucose L-Fucose L-Fucose D-Xylose D-Xylose
3-0-Methyl-D-glucose 3-0-Methyl-D-glucose 3-0-Methyl-D-glucose D-Mannose D-Galactose D-Mannose D-Galactose
D-Galactose D-Glucose
D-Glucose
N-Acetylgalactosamine N-Acetylglucosamine
Sialic acid
Retention times and areas were calculated from the total ion chromatogram (Figure
25). Monosaccharides were identified by GC-MS.

Figure 26. Total ion current of TMS-methyl glycosides obtained
from EPS produced by the non pathogenic strain ECU. 3-O-methyl-D-
glucose (retention time 10.047-10.335 min) was added as the internal standard.
Arrows indicate unidentified peaks.

-> J- - -i
151
Abundance • IC : W 3 . D
1800000 ^
1700000;
1600000-
1500000;
1400000;
1300000:
1200000;
1100000;
1000000;
900000-
800000;
700000;
600000 -
500000;
400000;
300000-
200000;
100000-
oL M WM U
11
rime -> r
10.00
11
f-•!'•''.'"-i1"111 ' T I - T -
15.00 1
20.00
-i r i
25.00

Table 14. Area percentage report of total ion current for TMS-methvl glycosides
for monosaccharides released from E P S of bacterial strain ECU and monosaccharide
peak identification bv G C - M S .
Total Ion Chromatogram Retention time
7.462 7.876 9.637 10.047 10.174 11.540 12.386 12.490 13.190 13.853 14.395 14.586 14.708 1 5.420 27.688 27.803
Area
4192085 4394911 18148080 71048547 26153612 13102342 31775590 7235235 13994102 37013437 14499086 16566284 10954776 5446083 16843093 30853436
Area %
1.301 1.364 5.632 22.050 8.117 4.066 9.861 2.245 4.343 11.487 4.500 5.141 3.400 1 .690 5.227 9.575
Monosaccharide
L-Fucose L-Fucose Unidentified 3-O-Methyl-D-g 3-O-Methyl-D-g D-Galactose D-Galactose Unidentified D-Galactose D-Glucose D-Glucose Unidentified Unidentified Unidentified Unidentified Unidentified
ucose ucose
Retention times and areas were calculated from the total ion chromatogram (Figure
26). Monosaccharides were identified by GC-MS. Unidentified peaks possibly
indicating other components are printed in bold.

Figure 27. Total ion current of TMS-methyl glycosides obtained from
EPS produced by the pathogenic strain la. 3-O-methyl-D-glucose
(retention time 10.023-10.607 min) was added as the internal standard. Arrows
indicate unidentified peaks.

1
Abundance
•
1200000 -
1100000-
1000000 -
900000-
800000-
700000
600000-
500000
400000-
300000-
200000
100000-
'IC:
M •^•"^P4*^-! 1 1 1 1 y
i i i
Wr^V-rvVrf , rime -> 10.00 15.00 20.00 25.00

Table 15. Area percentage report of total ion current for TMS-methvl glycosides
for monosaccharides released from EPS of bacterial strain la and monosaccharide
peak identification bv GC-MS.
Total Ion Chromatog Retention time
7.446 7.856 9.451 9.606 10.023 10.152 10.607 11.517 11.935 12.366 12.476 13.161 13.827 14.367 14.566 1 4.687 14.937 15.387 26.822 26.989 27.605 27.781 29.303
ram Area
3723766 4207316 3341919 17961206 52537262 26519590 2478777 12551348 3647979 29328149 10674901 12998048 44746417 18845138 30580694 10685003 3195566 10211682 12170059 348689 19770502 9211698 7984359
Area %
1.071 1.210 0.961 5.165 15.109 7.627 0.713 3.610 1.049 8.434 3.070 3.738 12.869 5.420 8.795 3.073 0.919 2.937 3.500 0.100 5.686 2.649 2.296
Monosaccharide
L-Fucose L-Fucose unidentified unidentified 3-O-Methyl-D-g 3-O-Methyl-D-g 3-O-Methyl-D-g D-Galactose unidentified D-Galactose unidentified D-Galactose D-Glucose D-Glucose unidentified unidentified unidentified unidentified unidentified unidentified unidentified unidentified unidentified
ucose ucose ucose
Retention times and areas were calculated from the total ion chromatogram (Figure
27). Monosaccharides were identified by GC- M S . Unidentified peaks possibly
indicating other components are printed in bold.

Figure 28. Total ion current of TMS-methyl glycosides obtained
from EPS produced by the pathogenic strain Xiib. 3-O-methyl-D-
glucose (retention time 10.020-10.612 min) was added as the internal standard.
Arrows indicate unidentified peaks.

155
Abundance
45000G0 -
4000000 -
3500000
3000000-
2500000 -
2000000-
1500000-
1000000-
500000-
0 J—,—,—r-fc
'IC: W1A.D
w AJ EW-rime ->
T — r — - i — ] — i — i — i r'|—r-1 0 . 0 0 1 5 . 0 0 2 0 . 0 0
li' II
w -i 1 1 1 1 r
25.00

Table 16. Area percentage report of total ion current for TMS-methyl glycosides
for monosaccharides released from E P S of bacterial strain Xiib and monosaccharide
peak identification by GC-MS.
Total Ion Chromatogram Retention time
10.020 10.152 10.612 11.529 12.395 13.181 13.894 14.405 14.571 14.691 15.385 16.786 25.156 25.299 25.762 26.146 26.791 27.596 27.950 28.542
Area
46261757 18542004 3931789 74566502 207162332 82042765 305604382 139823627 25748912 17469057 6107289 12026772 441895732 158575064 26550859 50678443 40651640 4026837 196646554 48190568
Area %
2.427 0.973 0.206 3.911 10.866 4.303 16.030 7.334 1.351 0.916 0.320 0.631 23.178 8.318 1.393 2.658 2.132 0.211 10.315 2.528
Monosaccharide
3-O-Methyl-D-g 3-O-Methyl-D-g 3-O-Methyl-D-g D-Galactose D-Galactose D-Galactose D-Glucose D-Glucose unidentified unidentified unidentified unidentified unidentified unidentified unidentified unidentified unidentified unidentified unidentified unidentified
ucose ucose ucose
Retention times and areas were calculated from the total ion chromatogram (Figure
25). Monosaccharides were identified by GC-MS. Unidentified peaks possibly
indicating other components are printed in bold.

157
3.7.2.2 Purification of pilin
Pili from all 3 bacterial strains were purified (2.7) by an initial ammonium
sulphate precipitation. The purity of these preparations was confirmed by electron
microscopy. The pili in these preparations typically aggregated (Figure 31 a-c).
Further purification of the extracted pili by gel filtration on a Sepharose CL-4B
column in the presence of 2 M urea yielded 2 peaks on elution (Figures 32 - 34).
The profiles were similar to those obtained previously by others (Eshdat, Silverblatt
and Sharon, 1981) indicating that both these peaks possibly contained pilin protein.
The first peak, eluting with the void volume possibly contained whole pili and the
second peak, eluting later, dissociated pilin. The possibility that these 2 peaks
contained different forms of the same material was investigated by SDS-PAGE. If
running conditions of the Sepharose CL-4B column had not caused complete
dissociation of pili into pilin subunits, S D S - P A G E would presumably ensure such
breakdown.
Samples from these two peaks, fraction (FI) eluting with the V° and the second
fraction (Fll) eluting later, each yielded two bands after polyacrylamide gel
electrophoresis and subsequent silver staining (Figures 32b, 33b, 34b). The
estimated molecular weights of the proteins in the major and minor bands were
19000 and 17500 Da, respectively. In the presence of mercaptoethanol in the
denaturing solution, two bands are found associated with purified pilin preparations
(Isaacson and Richter, 1981). The possibility exists that the second minor band,
corresponding to a molecular weight of 17500 Da, is due to limited proteolytic
processing of the pilin protein (Fader et al, 1982).

158
B D
Figure 29. Production of polyphenol oxidation products in broad bean
leaf homogenates in response to pooled column eluates. After overnight
treatment leaf homogenates were extracted twice with methanol before being
collected onto glass fibre paper (2.10.3). 1A-C and 2A-C show replicates of the
positive reaction obtained with pooled fraction, FI from the 6 6 % (v/v) acetone cut of
extracellular material from non pathogenic strain ECU. 1D-F and 2D-F show the
negative reaction obtained with pooled fractions similarly obtained from
extracellular material of pathogenic strains la and Xiib respectively.

159
a)
b)
Figure 30 a and b. Electron micrographs of bacterial cells of strain
ECU. Pilus (P); Flagellum (F). Bar = 200nm

160
Based on these results, the material in pooled fractions FI and Fll recovered after
separation of purified pili from the 3 bacterial strains on Sepharose CL-4B, was
identified as undissociated and dissociated forms of pilin, respectively.
3.7.2.3 Haemagglutination
A common feature of pili is their ability to haemagglutinate red blood cells from a
variety of animals. The ability of the 3 bacterial strains, ECU, la and Xiib and their
associated pili to agglutinate human type A erythrocytes was assessed. In
haemagglutination tests (2.7.2), only cells of the non pathogenic strain caused
haemagglutination (Figure 35). Conversely, preparations of purified pili from all 3
strains were able to cause haemmagglutination at concentrations of 5 u.g/ml and
above (Table 17a).
Some sugars, notably mannose and its derivatives and capsular polysaccharides of
some bacteria, interact with the R B C surface, thereby inhibiting agglutination. The
capacity of the E P S isolated in this study to cause similar haemagglutination
inhibition was assessed. Pretreatment of R B C with 200 u.g/ml of purified E P S from
strains la and Xiib inhibited haemagglutination following addition of 1 0 8 cells of ECU
(Table 17b). Treatment of R B C with mannose (200 p.g/ml) completely inhibited
haemagglutination at all concentrations of strain ECU. Inhibition of
ha magglutination by glucose, galactose and fucose occurred when lower numbers of
bacteria were used (Table 17b).
To determine whether purified EPS acted as an agglutinin, twofold serial dilutions of
E P S (initial concentration of 500 u.g/ml), from bacterial sstrains la and Xiib, was
added to R B C and incubated for 2 h. A stable colloidal suspension of R B C resulted.

Figure 31a-c. Electron micrographs of purified pili from the
bacterial strains, (a) ECU, (b) la and (c) Xiib. Bar = 100 nm

161

Figure 32a and b. Elution profile of a purified pili preparation from
strain ECU from a Sepharose CL-4B column. The preparation was
fractionated by elution through Sepharose CL-4B (column 1.5 x 90 cm) using a
50 m m Na/K phosphate buffer (pH 7.5) containing 2 M urea. Flow rate was 8
ml/h and 4 ml fractions were collected. V° indicates the void volume. The insert
shows 1 5 % SDS-PAGE of preparations from the peaks FI (lane 2) and Fll (lane
3). Lane 1 contains the molecular weight markers.

162
-s
o ro
§
-S
I ' l~~ •**• CO
o o o d
CM -r-
o o o o
o 9
UJU902 sqv

Figure 33a and b. Elution profile of a purified pili preparation
from strain la from a Sepharose CL-4B column. The preparation was
fractionated by elution through Sepharose CL-4B (column 1.5 x 90 cm) using a
50 mm Na/K phosphate buffer (pH 7.5) containing 2 M urea. Flow rate was 8
ml/h and 4 ml fractions were collected. V° indicates the void volume. The insert
shows 15% SDS-PAGE of preparations from the peaks FI (lane 2) and Fll (lane
3). Lane 1 contains the molecular weight markers.

163
o o
- s
8
8 - > — r -
o o
o o
1 — f
o o
CM O O
• » — r -
o o
8 5 o o
uwgoz sqy ro

Figure 34a and b. Elution profile of a purified pili preparation from
strain Xiib from a Sepharose CL-4B column. Preparations were
fractionated by elution through Sepharose CL-4B (column 1.5 x 90 cm) using a
50 m m Na/K phosphate buffer (pH 7.5) containing 2 M urea. Flow rate was 8
ml/h and 4 ml fractions were collected. V° indicates the void volume. The insert
shows 1 5 % SDS-PAGE of preparations from the peaks FI (lane 2) and Fll (lane
3). Lane 1 contains the molecular weight markers.

164
•
CO
CM
5 h- CO OT CO TT
O T-
w d CM
-8
o o
o CO
- §
- a
1 — '
8 o
1 — J —
3 o
0.03 -
0.02 -
1 1 ' o o
0.00 -
-0.01 -
wugos sqv ro

165
This effect was observed up to a 1 in 8 dilution of polysaccharide, after which a
button of RBC was observed.
3.7.3. Plasmid DNA Extraction
No plasmid DNA was detected in any of the 3 bacterial strains, ECU, la and Xiib.using
the methods (2.8.1; 2.8.2) described in this study (Figure 36).
3.8 Cell Culture Assays Using Purified Polysaccharide
3.8.1 Suspension Culture Assay - Purified EPS
The role of EPS in the toxic reaction previously observed with cell suspension
cultures of cassava (3.6.2; Table 11) was assessed. Purified polysaccharide
isolated from the 2 pathogenic bacterial strains la and Xiib, was added in
concentrations ranging from 0-1000 u.g to cell suspensions of 6 cassava cultivars
(2.9.3). When these polysaccharides were added in concentrations greater than 250
u.g, there was a significant reduction (p<0.01) in cell viability within 2 h, as
monitored by Evans blue. All 6 cultivars tested (Groot Rooi, Thailand, M Mex 59,
MAus 7, Comml and ACP 100) showed a similar response (Figure 37 a-f).
3.8.2 Protoplast Assay - Addition of Purified EPS
To determine whether freshly isolated protoplasts were sensitive to EPS, the effect of
purified polysaccharide from the two pathogenic bacterial strains la and Xiib on
freshly isolated protoplasts was assessed in a 2 h incubation assay as described in
2.9.3. The addition of purified EPS (0-1000u.g) to freshly isolated protoplasts of
cassava cultivars Groot Rooi, Thailand, M Mex 59, MAus 7, Comml and ACP 100 did

166
Figure 35. Haemagglutination of h u m a n type A erythrocytes by
bacterial cells. No haemagglutination occurred upon incubation of R B C with
bacterial strains la and Xiib as shown in wells designated (1) and (2), respectively.
Wells designated (3) show haemagglutination by bacterial strain ECU, whilst those
designated (4) show haemagglutination inhibition by cells of strain ECU after
pretreatment of R B C with 200 u,g/ml of mannose. 109, 108, 107and 10 6 refer to
initial bacterial concentration per ml. 100 uJ of these preparations was added to
each test well and mixed with an equal aliquot of R B C (3%).

167
Table 17a. Haemagglutination bv partially purified pili of the 3 bacterial strains
la. Xiib and ECU.
Pilin Protein
Dilution;}-
0
1 12
1 /4
1 /8
1/32
Bacterial strains
la
+++
+ +
+ +
+
Xiib
+++
+ +
+ +
+
ECU
+++
++
++
+
t The initial protein concentration was 40 u.g/ml based on the Bio-Rad protein
assay.
Table 17b. Haemagglutination inhibition.
Test sugar
Galactose
Glucose
Mannose
Fucose
la EPS
Xiib EPS
Concentration of
109
+ +
+ + +
-
++++
-
-
108
-
-
-
-
-
ECU cells
107
-
-
-
-
-
106
-
-
-
-
"
A 100u.l aliquot of RBC, pretreated with 200 u.g/ml of either galactose, glucose,
mannose, fucose or polysaccharide (EPS) purified from bacterial strains la and Xiib,
was incubated with an equal volume of bacterial cells of strain ECU at initial
concentrations of 106, 107, 10 8 and 109/ml.
+, ++, +++ and ++++ indicate the level of haemagglutination and -
haemagglutination inhibition, visually assessed.

1 2 3 4 5 6 7
23130 b p ^ ^ ^
94lo •**
655/"' ^ ^ J
4361 f^0^\^A
2322 ^ ^ ^ \ 2027-^^"^
- : ' - -
• H ~ : w , f
*
\
N
Figure 36. Agarose gel electrophoresis of plasmid D N A preparations.
Lanes 2, 4 and 6 represent plasmid D N A preparations and lanes 3, 5 and 7
chromosomal DNA preparations from bacterial strains la, Xiib, and ECU
respectively. Lane 1 contains the molecular weight standards.

1
not elicit any response. Viabilities after 2 h were essentially the same, with no
significant difference (Table 18). A similar result occurred when protoplasts were
exposed to crude bacterial cell free extracts (3.6.3).
3.8.3 Protoplast Division Assay - Addition of Purified EPS
As the addition of a 10% v/v bacterial cell free filtrate caused a significant reduction
in protoplast plating efficiency (3.6.4 ), the ability of purified polysaccharide
isolated from the two pathogenic strains, la and Xiib, to cause a similar effect was
assessed. Addition of a minimum of 100 jig of purified E P S from bacterial strains la
and Xiib to protoplasts on plating, caused a significant reduction (p<0.005) in
plating efficiency of the 6 cultivars tested (Figure 38 a and b). There was no
significant difference in reduction of plating efficiency when purified polysaccharide
from either strain Xiib or la was used.
3.9 Plantlet Assays
Ten days after inoculation with strain la, plantlets had produced typical disease
symptoms characterized by Whitlock et al (1986) for this organism. Leaves
similarly inoculated with either strain ECU or mock - inoculated with plant cell
suspension medium showed no symptoms (Figure 39). Plantlets were similarly used
(2.10.4) to monitor effects of the extracellular material produced by the 3 bacterial
strains on whole plants, at stages throughout the purification (Figure 39 and Figure
40a-c). Inoculation of leaves (2.10.4) with bacterial cell free filtrate of medium in
which ECU had been grown or purified E P S preparations from this strain caused no
symptoms (Figure 40 a). Similar inoculations of leaves with cell free filtrates of
growth medium in which bacterial strains la and Xiib had been grown or

170
preparations of purified polysaccharide from these 2 strains (Figure 40 b and c )
showed typical lesion development.

Figure 37 a-f, The effect of purified EPS on the viability of cell
suspension cultures. Cell suspension cultures of cassava cultivars (a) Comml,
(b) A C P 100, (c) MMex59, (d) Groot Rooi, (e) M Aus 7 and (0 Thailand were
used. Plant cells in mid-log phase were incubated with 0-1000 ug of purified EPS
from strains la ( • ) and Xiib ( E3 )• Cell viability was assessed after 2 h. Values
are means of 3 experiments, standard deviations are shown, where no bar is shown
the deviation falls within the plot symbol.

171
100-1 100 -i
a) 0 100 250 500 750 1000
Polysaccharide (|i.g) b)
la
Xiib
0 100 250 500 750 1000
Polysaccharide (|ig)
100-1 100-1
0 100 250 500 750 1000 Polysaccharide (p.g)
d) 0 100 250 500 750 1000
Polysaccharide (|ig)
100-1 100 -i
0 100 250 500 750 1000
Polysaccharide (n.g) n 0 100 250 500 7501000
Polysaccharide (p.g)

172
Table 18. Viability of protoplasts after incubation with purified bacterial
polysaccharide.
Plant
Cultivar
PflPS
0
100
250
500
1000
Groot Rooi
% Cell Viability
% SD
Strain la
83.0
86.0
85.0
86.0
85.0
4.2
3.5
4.6
1.7
3.7
°/ /o
SD
Strain Xiib
84.0
84.0
86.0
83.0
82.0
2.2
2.9
3.9
3.8
4.6
Thailand
% Cell Viability
% SD
Strain la
94.0
92.0
94.0
93.0
92.0
2.5
2.4
1.4
3.1
2.9
% SD
Strain Xiib
91.0
92.0
96.0
94.0
90.0
3.4
3.1
1.8
2.6
3.2
Comml
% Cell Viability
% SD
Strain la
92.0
87.0
85.0
88.0
91.0
2.4
2.9
3.9
3.9
1.3
% SD
Strain Xiib
87.0
88.0
89.0
87.0
86.0
1.5
2.1
1.6
1.7
2.8
Plant
Cultivar
M P S
0
100
250
500
1000
ACP 100
% Cell Viability
% SD
Strain la
92.0
92.0
94.0
93.0
93.0
1.3
1.5
3.1
2.4
2.1
/o SD
Strain Xiib
90.0
91.0
92.0
92.0
94.0
3,4
2.3
1.2
1.8
2.5
M Mex 59
% Cell Viability
% SD
Strain la
93.0
91.0
95.0
94.0
95.0
1.9
3.1
1.6
1.5
2.4
% SD
Strain Xiib
89.0
90.0
91.0
94.0
88.0
3.8
2.3
3.1
2.3
4.5
M Aus 7
% Cell Viability
% SD
Strain la
89.0
93.0
94.0
91.0
94.0
3.5
2.4
2.3
4.5
2.5
% SD
Strain Xiib
90.0
94.0
90.0
93.0
92.0
2.4
1.6
1.8
2.4
2.3
Protoplasts were isolated from clonal plantlets of cassava cultivars Groot Rooi,
Thailand, Comml, M Mex 59, A C P 100 and MAus7 and incubated for 2h with purified
polysaccharide isolated from the 2 pathogenic bacterial strains la and Xiib. Figures
are means from 3 experiments performed in triplicate. Standard deviations (SD)
are given.

Figure 38a and b. The effect of purified E P S on cassava protoplast
plating efficiency. Protoplasts isolated from cassava cultivars Groot Rooi, A C P
100, Thailand, MMex59, M Aus 7 and Comml were used. 0-1000 u.g of purified
EPS from bacterial strains la (Figure a) and Xiib (Figure b) was added to
protoplast plating medium and plating efficiency (%) determined 3 weeks later.
Values are means of 4 experiments. Bars indicate standard deviations.

173
> • .
o c o 3= <D OJ
_c ro o.
12-i
10 -
8 -
6-
4 -
2-
Groot Rooi
E2 ACP 100
Thailand
E2 MMex59
D M Aus 7
Comml
a) 100 250 500
la Polysaccharide (ng)
1000

Figure 39 a-c. Leaves from regenerated plants inoculated with
bacterial strains la, ECU and a medium control, (a) strain la showing
the typical pathogenic reaction. Marginal and tip curling and angular chlorotic
lesions are clearly seen. Leaves inoculated with strain ECU (b) or mock-inoculated
with plant cell suspension medium (c) show no symptoms.

174

Figure 40 a-c Symptoms on cassava leaves after inoculation with
10% (v/v) bacterial cell free filtrates, (a) strain ECU, (b) strain la and
(c) strain Xiib. Symptom expression was assessed 48h after inoculation.

175

176
4.0 D I S C U S S I O N
Before a plant tissue culture system can be applied for a particular purpose, the
following variables must be optimized for the species under investigation:
composition of the medium, environmental conditions, age of the donor tissue, and
cell or explant origin. No basic medium encourages optimum growth of tissues and no
particular growth regulator or medium additive is able to induce development and
regeneration of all cultured plant tissues. Thus, the frequency of full plant
regeneration of cells and tissues from different plant species has generally been low.
An increase in the efficiency and reproducibility of methods leading to plant
regeneration is essential to fully exploit plant tissue culture technology. In order to
obtain protoplast derived plants, isolation of protoplasts and subsequent culture
conditions must be optimized.
Regeneration of protoplasts depends on two major aspects; firstly, effective isolation
procedures, involving cell plasmolysis, followed by enzymatic degradation or partial
breakdown of the cell wall leading to protoplast release; and secondly, establishment
of cultural conditions to maintain protoplasts and to provide the appropriate osmotic
conditions, nutrients and stimuli for cellular proliferation. To a great extent these
procedures remain empirical. It is therefore at this level that the greatest research
effort is required.
One of the most important factors affecting yield and viability of isolated protoplasts
is the condition of the source material used (Watts et a/, 1974; Shepard and
Totten,1977; Tal and Watts,1979; Shepard era/,1980; Evans and Bravo.1983;
Chanabe et al, 1989; Creemers-Molenaar et al, 1989). In this study, to obtain
consistently high yields of viable protoplasts, it was necessary to use plants or in
vitro plantlets which were maintained under strictly controlled culture conditions.

1
Plants used directly from the greenhouse produced protoplast preparations which
contained a considerable amount of debris and essentially no protoplasts.
The optimum conditions, for the isolation of viable cassava protoplasts reported by
Shahin and Shepard (1980), differed greatly from those determined in this study.
Isolation conditions were, therefore, redefined. Young partially expanded leaves,
were a better source of material than fully expanded, older leaves. Better yields
were obtained if these leaves were sterilized and used immediately for protoplast
isolation. The method described by Shahin and Shepard (1980) allows for a
pretreatment period lasting up to 72 h before leaves are used for protoplast
isolation. This process tended to yield a "soup" of plant material with few or no
protoplasts. This is probably due to the difference in the age of leaves used as, older
leaves are more resistant to extended pretreatment. Macerozyme and Cellulase at
concentrations double those previously reported as optimum (Shahin and Shepard,
1980) were required to release protoplasts in the same period of time, namely 4 - 5
h, for the cultivars used in this study. However, concentrations of 0.5%
Macerozyme and 1 % Cellulase effectively released protoplasts in overnight
incubations (14 - 15 h). Overnight incubation rather than the shorter 4- 5 h
incubation was selected for routine use. For the twelve cassava cultivars tested, both
short and overnight incubations gave high viable protoplast yields (Table 1), using
the one-step enzyme method. Although all plants were kept under the same growth
conditions, some variation in the yield and viability of protoplasts was observed in
all the cultivars tested (Table 1). Similar observations of differences in protoplast
yields, from different Petunia cultivars, were made by Frearson etal (1973).
Lightly brushing the lower surface of the sterilized leaves, when compared to
stabbing or cutting, proved the most efficient leaf treatment and yielded a high
number of protoplasts with little debris. W h e n micropropagated plants were used
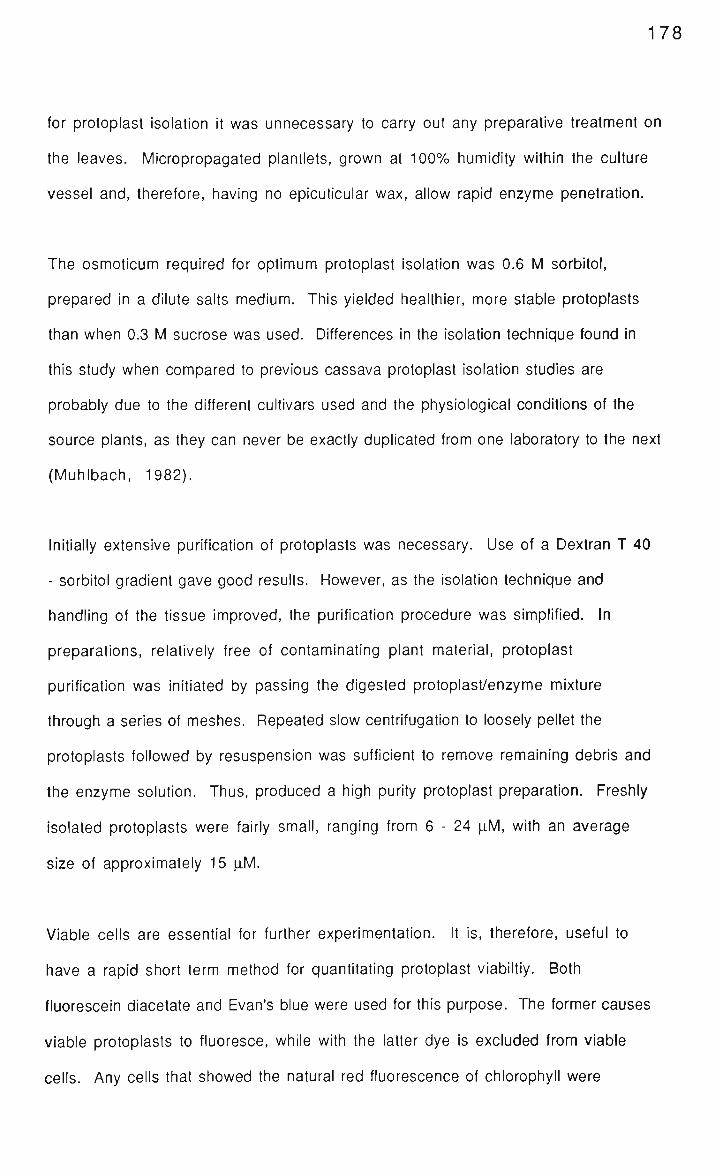
178
for protoplast isolation it was unnecessary to carry out any preparative treatment on
the leaves. Micropropagated plantlets, grown at 1 0 0 % humidity within the culture
vessel and, therefore, having no epicuticular wax, allow rapid enzyme penetration.
The osmoticum required for optimum protoplast isolation was 0.6 M sorbitol,
prepared in a dilute salts medium. This yielded healthier, more stable protoplasts
than when 0.3 M sucrose was used. Differences in the isolation technique found in
this study when compared to previous cassava protoplast isolation studies are
probably due to the different cultivars used and the physiological conditions of the
source plants, as they can never be exactly duplicated from one laboratory to the next
(Muhlbach, 1982).
Initially extensive purification of protoplasts was necessary. Use of a Dextran T 40
- sorbitol gradient gave good results. However, as the isolation technique and
handling of the tissue improved, the purification procedure was simplified. In
preparations, relatively free of contaminating plant material, protoplast
purification was initiated by passing the digested protoplast/enzyme mixture
through a series of meshes. Repeated slow centrifugation to loosely pellet the
protoplasts followed by resuspension was sufficient to remove remaining debris and
the enzyme solution. Thus, produced a high purity protoplast preparation. Freshly
isolated protoplasts were fairly small, ranging from 6 - 24 u.M, with an average
size of approximately 15 u.M.
Viable cells are essential for further experimentation. It is, therefore, useful to
have a rapid short term method for quantitating protoplast viabiltiy. Both
fluorescein diacetate and Evan's blue were used for this purpose. The former causes
viable protoplasts to fluoresce, while with the latter dye is excluded from viable
cells. Any cells that showed the natural red fluorescence of chlorophyll were

179
considered dead, as were those which took up the blue stain. Although these stains can
yield variable results (Gahan, 1989), viability of both protoplasts and suspension
cultured cells was essentially the same when the two procedures were compared.
Hence Evan's blue, being a simpler procedure, was adopted for routine, rapid
assessment of protoplast viability.
The techniques for viable protoplast production and culture have improved steadily
since the early work of Cocking (1960), Takebe et al (1968) and Power and
Cocking (1969). Numerous reports exist on protoplast isolation, however,
successful division of protoplast derived cells and regeneration of plants is limited.
The first step in the culture of protoplasts is the regeneration of a cell wall. Within
the first few days of culture , the spherical shape of cassava protoplasts in plating
medium, altered. This alteration, indicating the regeneration of a cell wall . Further
evidence of cell wall formation was the occurence of localized bulging of the
cytoplasm, "budding" (Figure 2). Although some "budding" cells were present
initially, resulting in cell death, three weeks later the remaining protoplasts
developed into small colonies. Plating efficiency was, however, low (approximately
1%) and on transfer to solid medium the callus stopped growing.(Figure 3).
Mabanza and Jonard (1984) have similarly obtained "budding" of cassava
protoplasts in the first days of culture.
After consideration of the following, various approaches were undertaken to improve
regeneration efficiency.
1. Concentrations of sucrose above 0.3 M or sorbitol above 0.5 M hinder wall
formation (Willison, 1976).

180
2. Bud formation occurs more often in media containing sucrose than in media
containing glucose (Bala Bawa and Torrey, 1971).
3. Cells in agar are slower to begin division than those in liquid medium (Vasil et
al, 1983).
4. Best results are obtained by starting the protoplast culture with either
cellobiose or glucose, as the carbohydrate source. W h e n sucrose at 0.05 M was
used throughout the culture period, the initiation of division was delayed by 1-2
days but the frequency of divisions was lowered to 20 - 5 0 % of that when
starting with glucose (Grambow et al, 1972). When sucrose was used in the
medium to regenerate Adsuki bean {Phaseolus angularis, Wight)protoplasts,
growth of protoplasts deteriorated and division, if it occurred, was low (Ge,
Wang, Yuan, Huang, Yang, Nie, Testa and Lee, 1989).
5. The first prerequisites for sustained division in protoplasts are conditions
conducive to a rapid and substantial cell wall regeneration (Bhojwani etal, 1977).
From the above sucrose is deleterious to the protoplasts in culture. Glucose is the
common carbon and energy source for plant protoplast culture.
Defining the optimum medium requirements is critical to the successful culture of
protoplasts from cassava. A medium screening experiment based on the multiple-
drop-array (MDA) technique was used for large scale testing of culture media
variations. Rather than using hanging drops in inverted petri-dishes 96 well plastic
microtiter trays were used to facilitate handling. This procedure enabled systematic
screening of large numbers of multiple combinations of culture media constituents.
This protocol, for multiple medium testing, used a minimum number of protoplasts

1
per test medium and, therefore, allowed the maximum number of combinations to be
tested with a single protoplast preparation.
In the current study, 648 media combinations were tested for increased ability to
support protoplast proliferation. Only one medium enhanced division on repeated
screening of the test media. Exact determination of percentage cell regeneration and
division was complicated by the fact that protoplasts tend to aggregate during culture.
However, estimation of plating efficiency (3.1.3) after 21 days in the new medium
(PI-85), averaged between 16 and 2 3 % for the cassava cultivars tested (3.1.3;
Table 4 ). This plating efficiency is considerably higher when compared to that
obtained for protoplasts in plating medium (1%).
Protoplasts in PI-85 showed better cell shape and size than those growing in plating
medium. Protoplasts in PI-85 increased in size on culture, whereas protoplasts in
plating medium shrank. The first division of protoplasts occurred earlier in PI-85
and after three weeks in culture showed numerous cell masses, many of which were
large enough to be seen with the naked eye (Figure 3 and Figure 4).The concentration
of salts and vitamins is much higher in plating medium than in PI-85. Increased
growth with earlier appearance of cell clusters in half-strength rather than full-
strength media has been similarly noted (Coutts and Wood, 1977; Zapata et al,
1981). Further, the use of filter sterilized PI-85 medium components may also be
advantageous. Autoclaved glucose can inhibit protoplast division (Davies etal,
1 9 8 9 ) .
In this study 2,4-D was more efficient than NAA for initial cassava protoplast
culture. Niedz et al (1985) have shown 2,4-D to be beneficial in tomato leaf
mesophyll protoplast cultures and to contribute to high plating efficiency. However,
in their studies 2,4-D was only essential to initiate division. Once division has

1
commenced 2,4-D is no longer required and N A A can be substituted as an auxin
source for continued growth. However, G e et al (1989) found that 2,4-D
throughout the culture period was the most effective auxin for plant regeneration.
Glucose, 0.6 M, was a more efficient osmoticum/carbohydrate source than the
combination of sugars (sucrose, mannitol, xylitol, inositol and sorbitol) in plating
medium or in any of the other osmoticum combinations used in the broad spectrum
medium experiment (2.2.2.1). Sucrose in the medium for culture of cassava
protoplasts tended to cause shrinkage of the protoplasts (Figure 4) and prevented
their division at high concentrations. As glucose is metabolically active the osmotic
potential is reduced during culture of protoplasts. Additionally, the osmoticum can
be further reduced by the addition of liquid medium with a lower osmotic potential.
This avoids some of the problems associated with a high molarity osmoticum, i.e
cessation of division and growth.
In this study, cassava protoplasts when plated in plating medium at a density of 3 - 5
x 10^ cells/ml produced very small colonies which soon ceased growth. This was
similar to results obtained for citrus protoplasts (Vardi, Spiegel-Roy and Galun,
1975). Such a high plating density causes problems in determining plating
efficiency. Moreover, as protoplasts settle and attach to the bottom of the plastic
petri-dishes mixing of regenerating protoplast callus occurs. Colony mixing
complicates the culture of a single cell clone. Using PI-85 medium and the plating
conditions employed for cassava protoplasts in the current study, an initial plating
density of 1 x 1 0 5 protoplasts/ml was optimum. The improvements made in cassava
protoplast regeneration medium may lower colony mixing during early division and
promote further colony growth.

1
Conditions promoting continued division of these cell colonies, allowing formation of
a callus capable of regenerating into whole plants, were determined. Continued
growth of protoplast derived callus on PI-85 requires a number of medium changes:
higher salt concentration; substitution of 2,4-D by NAA; lowering of the osmoticum
during the culture period; and use of a single carbohydrate source, glucose.
Growth may be furher enhanced by plating the p-calli onto sterile filter paper
supports overlying the solid medium (Partanen, 1981; Niedz etal, 1985), enabling
efficient gaseous exchange. Hence, if further callus growth on solid medium is
desired filter supports or the use of a conditioned medium or feeder layer technique
could be considered. Feeder cultures may contain a factor capable of stimulating cell
division (Bellincampi and Morpurgo, 1987; 1989). Finally, as the regeneration
potential of cassava protoplasts isolated from leaf mesophyll cells is low,
regeneration might be improved by using protoplasts isolated from morphogenic
tissue, such as clonal leaf tissue or mature seed, induced to undergo somatic
embryogenesis (Stamp and Henshaw, 1987). Indeed, such totipotent tissue has been
successfully used for a number of tissue culture recalcitrant species to obtain
improved cell division leading to regeneration (Creemers-Molenaar etal, 1989).
Optimum growth conditions for cassava callus initiation needed to be established to
obtain information on the chemical and physical factors influencing the production of
a variety of callus types from explants. Callus grown on M S * medium with 0.1 u.M
GA3, 1.0 u.M N A A and 0.5 u,M B A P was slow growing, firm and compact, and was not
suitable for the initiation of a fast growing suspension culture (2.3).
2,4-D causes rapid cell proliferation and addition of a cytokinin can further enhance
division. High cytokinin (0.5 - 4 mg/l kinetin or 0.1 - 0.4 mg/l BAP) encouraged
cassava callus growth (Berbee, Berbee and Hildebrandt, 1974). The hormone

184
concentrations which led to the development of a fast growing friable callus suitable
for the initiation of a fine, rapidly growing suspension culture were determined
(Table 5). Callus from cultivars, Thailand, Gomani, Groot Rooi, 1979 U T 4 (2) and
T M S 58308 ranged from firm, brilliant green to a pale friable tissue (Table 5).
Callus grown either in the light or in the dark grew equally well (Table 5). At low
concentrations of B A P (2 u,M) compact callus grew as a fine mat across the surface of
the explant. Explants grown on M S * medium with 2 u.M B A P and 5, 7, 9, 11 or 13
u.M 2,4-D developed a callus which was firm and bright green. This callus showed
promise for regeneration and was subsequently used for callus regeneration studies.
Friable callus was promoted by high concentrations of 2,4-D (8 u.M) and developed
as protruberances which eventually covered the explant with a light coloured,
friable callus mass. Callus grown on medium with 6 u.M B A P and 13 u,M 2,4-D
showed the highest growth rate and development of the most friable callus. Friability
increased with subculture. This callus was, therefore, selected for the initiation of
suspension cultures.
The strategy for plant regeneration from protoplasts has generally been to recover
rapidly growing callus from protoplasts and to transfer it to species specific medium
for regeneration (Vasil and Vasil, 1980). In an attempt to establish essential
medium requirements of protoplast callus for regeneration into whole plants,
previously published cassava growth media were evaluated. Regeneration of plants
from firm brilliant green callus via the development of roots and shoots or by
somatic embryogenesis, was attemted (Table 6). The callus was transferred to these
media at the first subculture as prolonged subculturing often leads to a loss of
morphogenetic potential (Yeoman and Forche, 1983; Thorpe, 1982).

185
Plants can be readily regenerated from cassava shoot-tip explants (Berbee et al,
1974; Kartha etal, 1974a; Nair, Kartha and Gamborg, 1979) but adventitious
regeneration of cassava from tissue other than meristem derived tissue is difficult.
Success has been reported with stem callus tissue (Tilquin, 1979) and infrequently
under ill-defined conditions from protoplast cultures (Shahin and Shepard, 1980).
In addition there is a low level of irregular regeneration in specific genotypes. The
success of Tilquin (1979) was not achieved in this laboratory (Table 6), and neither
by Nair etal (1979) nor Stamp and Henshaw (1982). The attempts by
Prabhudesai and Narayanaswamy (1975) and Nair etal (1979) to regenerate plants
from cassava callus were unsuccessful. Medium 1 and 2, (Stamp and Henshaw,
1982; 1987), were developed to promote somatic embryogenesis in cotyledonary
tissue and embryogenic axes taken from mature cassava seed. It was used here in an
attempt to promote somatic embryogenesis in the callus tissue. Stamp and Henshaw
(1982) reported the development of a friable callus on the abaxial surfaces, which
were in contact with the medium, and initiation of a range of organized structures on
the upper surfaces. Using the firm green callus grown in this laboratory, only a pale
brown friable callus developed on both media with nodule formation from only one
cultivar, Groot Rooi, on medium 2. However the morphogenetic responses
demonstrated by Stamp and Henshaw (1982) may have depended on the existing
organization of the tissues in the cotyledons, since the embryos always appeared to
develop from the organized swellings and ridges produced from the epidermis and
never from the callus tissue. In agreement with results reported here, they also
reported that in no cultures, except those derived from seeds, was adventitious shoot
initiation or somatic embryogenesis observed. That is, development was confined to
the initiation of a wide variety of callus types and the formation of roots.
Medium A and B (Tilquin, 1979), reported to stimulate leaf-like structures,
nodules and roots, only produced nodules and roots in the cultivars tested in this

1
study {viz. Thailand, Gomani, Groot Rooi, T M S 58308 and 1979 U T 4 (2)). Callus
differentiated into green and pale brown areas but nodules were not induced to
develop into full shoots and full plant regeneration did not occur.
Medium S (Shahin and Shepard, 1980) and SH (Gamborg et al, 1981) were
formulated to promote shooting from p-calli of cassava. Medium M S * (Kartha etal,
1974a), was developed for the single phase regeneration of meristems of cassava.
M S X medium is a 1.5 x strength M S * medium and was used as a higher level of
macronutrients can improve growth potential (Mellor and Stace-Smith,1969).
However, full regeneration did not occur on any of the above media and callus was
only induced to produce roots and meristematic nodules. Indeed, other than the
report of Tilquin (1979), there have been no reports of successful shoot
regeneration from callus of cassava obtained from a variety of areas of the plant.
The second type of callus obtained was fast growing, pale and friable, and was used for
the initiation and establishment of suspension cultures. Suspension cultures were
initiated from callus grown on M S * medium containing 0.1 u.M GA3, 1.0 u.M N A A and
0.5 u.M BAP. The cultures that resulted were made up of a variety of single odd-
shaped cells with very thin walls. Many dead and broken cells were observed.
Sloughing off of a "cloud" of single extravagantly shaped cells from large aggregates
indicates that growth conditions are incorrect and should not be mistaken for the
growth of a good single-celled suspension (King, 1984).
The conditions necessary for development of a rapidly growing friable callus were
determined (3.2). Rapidly growing friable callus was placed in liquid callus growth
medium (MS* + 6 u.M BA P and 13 u.M 2,4-D) to initiate suspension cultures.
However, the resulting suspension had abnormal shapes and were distorted. This
effect was probably due to the increased ability of single cells to take up nutrients in

1
a liquid medium. Varying concentrations of 2,4-D and B A P gave rise to cell
suspension cultures with many cell shapes, sizes and numbers (Table 7).
Suspension cultures which showed cells of a uniform shape and size, with a higher
proportion of free cells to cell aggregates, were obtained in the medium with 5 u.M
2,4-D and 6 u.M B A P (3.2.2). This medium has the same concentration of B A P as the
original suspension culture medium but a lower concentration of 2,4-D. The
importance of 2,4-D in suspension cultures, for increasing cell division rate and
reducing cell doubling time has been noted (Torrey and Reinert, 1961; King,1984).
Growth of Groot Rooi was promoted and rapidly growing cell suspensions of TMS
58308, Thailand, A C P 100, Comml, M Aus 7 and M Mex 59 was obtained using M S *
with 5 u,M 2,4-D and 6 u.M B A P (Figures 6 and 7; Tables 8a and 8b).
Homogenization and screening through a 1 m m 2 mesh to reduce the size of plant cell
aggregates, followed by weekly subculture, produced the most friable cultures.
Longer culture periods gave rise to a less friable culture with increased cell
aggregates. Individual cells within these suspension cultures were yellow to pale
brown in colour, vacuolate and uniform in size and shape (Figure 5). Cultures of
Groot Rooi contained a low percentage of extremely elongated cells. Nash and Davies
(1972) also reported the low incidence of elongated cells within a uniform culture.
The overall size and shape of the cells remained relatively constant throughout the
growth cycle and were evenly distributed between single cells and cell aggregates of
30 - 50 cells.
The growth of the cells of Groot Rooi and TMS 58308 in batch culture followed a
defined sequence. This included a relatively short lag phase of approximately 48 h
during which a small increase in cell number took place, followed by the exponential
phase, during which increase in cell number was maintained at a high rate. This
phase was also of short duration, approximately 96 h. The cells then entered a

1
stationary phase (Figures 6 and 7). The short duration of the high cell-division
phase could be the result of either the accumulation of a cell-division inhibitor or
depletion of a nutrient. The repetition of the entire growth cycle following
subculture of stationary phase cells into fresh medium strongly suggests that the
limitation of division is due to the depletion of an essential nutrient. However, the
dilution of a growth inhibitor produced by the cell suspension during culture cannot
be discounted.
Addition of zinacef®, a semi-synthetic cephalosporin, was used to establish
suspension cultures from callus. This was non-toxic to plant cells and effectively
controlled contaminating bacteria. Inoculation of callus into tissue culture medium
was often followed by bacterial contamination. It is most likely that the
contaminating organisms were introduced with the explant at the time of tissue
preparation. These bacteria remain undetected in callus culture but rapidly
overgrow cultures when transferred with the callus to the liquid shake cultures for
suspension cell culture initiation. The contribution of endogenous saprophytic
organisms, that live on or in plants, to this type of contamination has been noted (Hu
and Wang, 1983). Between 25 and 5 0 % of microbial contamination in plant
cultures has been attributed to this origin (Leifert, Waites and Nicholas, 1989).
The absence of a toxic effect by zinacef® on the plant cells is probably due to the
specific action of cephalosporins on components of the bacterial cell wall (Pollock,
Barfield and Shields, 1983).
Cassava meristems have been successfully regenerated by several groups (Berbee,
et al, 1973; Kartha and Gamborg, 1975; Kaiser and Teemba, 1979; Adejare and
Coutts, 1981). Meristem derived clonal plants are aseptic source material for
protoplast isolation and for the growth of large numbers of young plants. Such plants

189
were used for for in vivo plant assays for comparison with the in vitro cell culture
assays.
Meristem tips grown on Roca's eradication medium grew slowly and regenerated
poorly. Regeneration of meristems was then attempted on the single phase
regeneration medium (MS*) (Kartha et al, 1974a). Regeneration on this medium
was rapid and highly efficient, occurring within 4 - 5 weeks. Depending on the
cultivar used, different types of development were noted. Normal plantlets were
obtained from cultivars of Thailand, Groot Rooi, Gomani, Comml, M Aus 7, A C P 100
and M Mex 59. Cultivar 1979 UT 4 (2) regenerated infrequently. Usually only
slight enlargement of the explants with occasional leaf production occurred without
development of roots or stems. Meristems of the cultivar T M S 58308 have not been
regenerated. Although a slight enlargement of the tip occurred, prolific callus
production was initiated and a large friable callus developed. These differing
responses of meristem tips probably reflect differences, within the initial starting
tissue, of levels of endogenous growth substances and nutrients at a varietal level.
All donor plants were maintained under the same environmental and growth
conditions.
Numerous plants were obtained by clonal propagation using a multiple shoot culture
technique. Shoot elongation decreases with B A P concentration (Roca, 1984). At
optimum B A P concentration rosette cultures, composed of 5 - 10 nodes each, formed
(3.3). W h e n these cultures were transferred to liquid medium with reduced BAP,
elongation occured at the intemodes, giving rise to multiple shoot cultures. Apical
and single node cuttings from these multiple shoot cultures were regenerated in M S *
medium producing a large number of clonally propagated plantlets. Kartha et al
(1981) also reported that B A P alone or in combination with N A A could induce
multiple bud regeneration from meristems. The production of multiple buds

1
appeared to inhibit whole plant regeneration. However, transfer to liquid rotated
medium containing lower BAP, increased N A A and added GA3, allowed complete plant
regeneration of the developing multiple shoot cultures. All the cultivars used gave
rise to 40-50 single node and apical cuttings over the period of culture.
Although shoots could not be initiated from callus grown on MS* medium,
adventitious buds and shoots often formed on the basal callus of nodal and apical
cuttings. This is a relatively frequent event in meristem tip and clonal propagation
(Cailloux, 1984).
Optimum transition of regenerated cassava plantlets from the culture vessel to soil
was established with a high rate of transplanting efficiency. This efficient transfer
rate was achieved by transplanting plantlets into a sterile pot with a sterilized
sand/soil mixture and then maintaining the plantlet in a closed, sterile environment
(3.3.1). The problem of infection of young plantlets was surmounted and regulation
of humidity permitted. By slowly decreasing the relative humidity, the plantlet was
able to adapt to external conditions and a more extensive root system developed.
Inoculation of cassava plants with the two pathogenic Erwinia strains produced
typical disease symptoms on leaves, plants inoculated with the non pathogen were
unaffected. Subsequently the interaction of these bacteria with cassava tissue
cultures was assessed. All three bacterial strains , la, Xiib and ECU, showed
enhanced growth on co-culture with plant cells of cassava cultivars Groot Rooi and
T M S 58308. Bacterial concentrations at the end of the lag phase were about ten fold
higher when compared to growth in plant cell medium alone (Figures 11-13). The
non pathogenic strain ECU did not cause a substantial change in plant cell viability
with increasing culture time. As bacterial populations increased, thereby depleting
nutrients and oxygen accessibility there was a slight decrease in viability. The

191
decrease in viability (approximately 5%) observed in the culture inoculated with
the non pathogenic strain was comparable to that of the control (Figure 14 and 15).
Conversely both pathogenic strains of the bacterium caused extensive loss of cell
viability in all cultivars tested. It is improbable that death of the plant cells, when
incubated with the pathogenic strains, is caused by depletion of a plant nutrient.
Increasing the initial concentrations of bacteria had a deleterious effect on the
viability of suspension cultures of cassava cultivars Groot Rooi and T M S 58308. The
initial concentration of bacterial inoculum is an important parameter in the rate at
which bacteria alter the culture medium, indirectly affecting plant cell growth. A
small inoculum is often used. Fett and Zaccharius (1983) proposed that when
studying phytopathogenic bacteria- plant cell interactions in vitro, an alternative
carbohydrate source, which the bacteria cannot use efficiently, should be substituted
for sucrose in the plant tissue culture medium. The plant cells survive, using the
alternative carbohydrate as their primary carbon source. This requires the bacteria
to obtain additional nutrients from the plant cells, more closely approaching the in
vivo interaction.
Further, in this study, addition of (10%, v/v) bacterial free filtrate, medium in
which the pathogenic strains had been growing, to cassava cell suspension cultures in
mid-log phase caused almost total cell death within 2 h (Figure 16 and 17 ). Cell
suspensions of the seven cassava cultivars used, were highly sensitive to culture
filtrates of the pathogenic bacteria, but not to the non pathogenic strain or a medium
control. Indeed, it would appear that a metabolic product with a cytotoxic effect
causing rapid cell death was produced by the two pathogenic strains, la and Xiib, but
not by the non pathogenic strain, ECU. Thus, cassava suspension cells are sensitive
to both of the pathogenic strains and cell free filtrates obtained from their growth

medium. This observation led to the investigation of a role for extracellular
components produced by these bacteria in the pathogenic response.
As reported for several other plant pathogenic bacteria, the two pathogenic strains,
la and Xiib, were characterized by mucoid growth on solid culture medium. Colonies
of the non pathogenic strain ECU did not produce obvious mucous. Production of a
capsule and E P S was evident when samples of the three bacterial strains were
examined under the electron microscope. Cells of the non pathogen were surrounded
by a clear capsule, conversely, large amounts of E P S was observed in association
with cells of the two pathogenic bacterial strains, la and Xiib (Figure 9a-c). This
mucoid growth and association of E P S production with pathogenicity (Sijam et al,
1985; Billing, 1987; Van Alfen, 1989) possibly suggests a role for the
polysaccharide produced by strains la and Xiib in their interaction with cassava
plants and cell cultures.
The ability to produce antibiotic or bacteriocin is an adaptive advantage for
saprophytic and pathogenic bacteria, especially as most plant pathogenic bacteria
have a saprophytic phase associated with or away from their host plant (Coplin,
1989). The possibility that the three Erwinia herbicola strains investigated in this
study produced either bacteriocins or antibiotics was examined using a method
developed for Erwinia uredovora. Production of bacteriocins is expected to cause an
inhibition of growth in related organisms, such inhibition was not detected when any
of the strains ECU, la or Xiib were tested against each other or against Escherichia
coli (3.4). However, failure to detect bacteriocins, using the test described here,
does not preclude their production.
Using the methods outlined in this study no plasmid DNA was detected in any of the
three bacterial strains investigated (Figure 35). However, it is possible that

1
plasmids were present but remain undetected with the procedures used, these are
primarily for the isolation of small plasmids (<70 megadaltons). As the plasmid
usually comprises no more than 5 % of the total DNA, a major problem in
preparation of plasmid DNA, is the separation from chromosomal DNA, (Grinsted and
Bennett, 1984). Further, there is a tendency for most plant pathogenic bacteria to
have large plasmids. S o m e of these extremely large plasmids (megaplasmids 300-
500 megadaltons) isolated from plant pathogenic bacteria require gentle handling
procedures to obtain better recovery (Coplin, 1989).
Initial reactions observed in planta and in vivo on inoculation of cassava plants and
tissue cultures with bacterial strains, ECU, la and Xiib, led to further investigation
of the bacterial extracellular matrix. Isolation and fractionation of the extracellular
matrix was carried out in an attempt to recover any material which could account for
the effect of cell free filtrates on cell suspension cultures. The acetone precipitation
followed here was used previously to precipitate extracellular enzymes in fungal
culture fluids (Marcus and Schejter, 1983). Acetone (20%, v/v and 6 6 % , v/v)
precipitates of extracellular material produced by all three strains, had similar
Sephacryl S-300 H R elution profiles (Figures 10-12). Pooled fraction FI
(including FI* of la) of all three strains contained both protein and sugar. Although
the protein concentrations present in these peaks were approximately the same for
all three bacterial strains, the amount of sugar was considerably higher in the two
pathogenic strains la and Xiib (Table 10). As both these strains produce mucoid
growth this high sugar concentration was expected. The position of the peak eluting
from the column indicated that the sugar was a large molecule. A simple sugar of low
molecular weight would have eluted with the total volume.
No protein was detectable in the acetone soluble material isolated from any of the
strains ECU, la or Xiib after elution through Sephadex G-100 (Figure 13).

194
However, trace amounts of sugar were detected in fractions eluting with the total
volume. This may have been due to breakdown products of the capsule and E P S during
the purification procedure. The yellow colour of the acetone soluble material from
all three strains is most likely due to extracted pigments.
Only extracts from the two pathogenic strains, la and Xiib reduced viability of
suspension culture cells of cassava cultivars Thailand, M Mex 59, Comml, A C P 100,
Groot Rooi and M Aus 7. The toxic activity was only associated with Sephacryl S-300
H R pooled fraction FI, 2 0 % (v/v) acetone and 6 6 % (v/v) acetone precipitates of
extracellular material.
EPS was purified from bacteria grown on solid culture medium to avoid
contamination by medium components in broth culture. The polysaccharide (Table
12) obtained after the final ethanol precipitation step of the two pathogenic strains
la and Xiib and the non pathogenic strain ECU eluted as a single peak from a Sephacryl
S-500 H R column (Figure 14 a-c). The elution of the peak, obtained for the two
pathogenic strains la and Xiib, before Blue Dextran does not necessarily indicate that
the molecular weight of this material is greater than that of Blue Dextran (2 x 10 6
daltons). Aqueous solution properties of large molecular weight polysaccharides can
alter normal elution properties by forming larger aggregates (Sijam, Carr and
Goodman, 1983). This makes accurate determinations of molecular weight very
difficult. O n elution through Sephacryl S-500 H R the elution profile of purified
polysaccharide isolated from the non pathogenic strain, ECU, was characteristically
different to elution profiles of polysaccharide obtained for the two pathogenic strains
la and Xiib. This suggested that ECU produced a polysaccharide with a lower
molecular weight and different absorbance properties (Figure 24a).

195
No contaminating protein, nucleic acid or LPS was detected in samples of purified
EPS. Thus, relative purity of the isolated polysaccharide from strains ECU, la and
Xiib was considered high. Further results from G C - M S analysis of T M S methyl
glycosides (Figures 25-28, Tables 13-16) showed little contamination. The E P S of
the pathogenic strain Xiib is composed of glucose and galactose, whilst the E P S of
strains ia and ECU are similarly composed of fucose, galactose and glucose. However,
several peaks remain unidentified and the possibility exists that other components
may not have been identified in the current analysis. Additionally, strain la produced
much greater quantities of polysaccharide (Table 12). The presence of acyl groups
(o-acetyl, pyruvate and ketal) are c o m m o n on bacterial E P S (Sutherland, 1985).
The presence of these side groups could have a function in the conformation of the
polysaccharides isolated in the current study. Both pathogenic strains la and Xiib
produce between sixteen and thirty times more polysaccharide than non pathogenic
strain ECU. However, even when similar quantities of E P S from all three bacterial
strains was assayed on regenerated plantlets (3.9) the E P S isolated from strain ECU
failed to cause any effect. These results suggest that conformational differences as
well as production of E P S could be important in the pathogenicity of strains la and
Xiib. Studies, in planta, would verify these observations.
The protein produced extracellularly by the three Erwinia strains was investigated.
Sephacryl S-300 H R Fraction I of the 6 6 % (v/v) acetone precipitate of
extracellular material from the non pathogen ECU tested positive using the broad
bean polyphenoloxidase assay. Although not typical the positive response in vitro
showed some similarity with the in planta H R response. No reaction was observed
with similar fractions from either of the pathogenic strains. The possibility that
this was due to pili was indicated. Based on observations that pili of an avirulent
strain of Pseudomonas solanacearum attach to plant cell walls thereby eliciting a
hypersensitive response (Young etal, 1985; Young and Sequeira, 1986) and further

196
that pili are not readily dissociated and elute with column void volumes
(lsaacson,1977). The presence of pili was further investigated by electron
microscopy and pilin protein purification.
All three bacterial strains possess pili. The poor piliation shown by the bacteria is
possibly attributable to the bacterial growth medium used in this study (nutrient
agar with 5 % glucose). The presence of glucose in the medium causes decreased
expression of type 1 and K 99 pili (Old and Duguid, 1970; Isaacson, 1980).
Streptococcus suis pili were best observed on cells grown in broth rather than on
solid medium (Jacques, Gottschalk, Foiry and Higgins.1990). The possibility also
exists that collapse during preparation of the hydrated polymers which constitute the
capsule and associated EPS, obscured the pili when examined by electron microscopy.
Pili, due to their hydrophobicity are able to attach to many surfaces and can bind to
both other proteins and polysaccharides, a feature which can create problems in
their purification. However, the purification procedure used to isolate the pili from
the bacteria in this study (2.7) yielded two proteins. O n e with an approximate
molecular weight of 17500 Da and another of approximately 19000 Da. There were
no contaminating outer membrane proteins. The two proteins are both thought to be
pilin as different conformational or charge states of the pilus peptide may occur in
S D S solutions. These changes are dependent on the age of the preparation and the
degree of reduction by mercaptoethanol in the protein splitting solution (Michael and
Ou, 1979; Isaacson and Richter, 1981). Additionally, molecular weight variation
can be caused by proteolytic cleavage during purification of pili (Fader et al, 1982).
The pili reported here for the three Erwinia strains are similar to Escherichia coli
type 1 pili in that they are comprised of subunits with comparable molecular weight
(approximately 17000 Da). Moreover they are mannose specific as treatment of red

1
blood cells with mannose caused haemagglutination inhibition (Tablet 7b). Many
bacterial species produce proteinaceous appendages in the form of type 1 pili which
mediate a mannose specific adherence (Firon, Ofek and Sharon, 1984). However, the
pili purified in this study are slightly flexible and wider (9-12 nm) when compared
to the rigid type 1 pili (7 nm). These pili (Figure 31 a-c), are also similar to those
isolated from a variety of Pseudomonas species (Fuerst and Hayward, 1969).
Mannose specific bacteria preferentially bind structures in short oligomannose
chains of N-glycosyl-linked glycoproteins, suggesting the role of such structures as
bacterial receptors (Firon, Ofek and Sharon, 1983; 1984).
The possession of pili by the three bacterial strains of Erwinia herbicola under
investigation in this study and the ability of the isolated pili to haemagglutinate red
blood cells (Table 17a) indicates a possible role in the binding of these bacteria to
host cell surfaces. Unlike intact cells of the avirulent strain ECU, intact bacteria of
the two virulent strains Xiib and la, which produce large quantities of EPS, do not
haemagglutinate RBC. This suggests that the pili may not be exposed on the surface of
la and Xiib. Indeed, the ability of E P S purified from the two virulent strains, to
cause haemagglutination inhibition (Table 17b) suggests that the E P S could bind to
the plant cell wall preventing firm bacterial cell - plant cell interactions and
subsequent recognition. This could prevent the hypersensitive response by the plant
that would otherwise be expected to result and allow the bacteria to multiply.
Investigation of production of E P S by strains ECU, la and Xiib in planta would
substantiate this proposal.
Only saprophytic bacteria are bound to the cell wall of leaves of susceptible bean
cultivars (Sing and Schroth, 1977). However, El-Banoby and Rudolph (1979b)
report that compatible pathogens, as well as saprophytes are bound: but only
compatible bacteria were able to multiply. This is explained by the production of

198
E P S by the bacteria in the compatible combination. E P S is thought to induce water-
congestion which is essential for bacterial movement and multiplication. Indeed
leaves that are kept watersoaked, a symptom associated with the production of EPS,
showed no increase in electrolyte leakage and direct physical contact between
bacterial cells and the plant cell wall initiating a H R did not occur (Stall and Cooke,
1979; Mazzucchi etal, 1984; Mazzucchi, Gasperini, Nolti and Medeghini Bonatti,
1 9 8 8 ) .
Strain ECU is a saprophyte originally isolated from cassava. This strain causes a HR
type response on broad beans but does not elicit any measurable H R response on
cassava leaves or tissue cultures. The role, if any, of pili in the reaction of this
bacterium with cassava is, therefore, unknown. Little is known about the interaction
of saprophytes with plants, although there does appear to be some correlation
between successful saprophytic and pathogenic growth. Surface components of plant
pathogenic and saprophytic bacteria may have similar structural features that are
recognized by plant structures (Anderson, 1984). S o m e saprophytic bacteria, as
well as a few incompatible or avirulent phytopathogens, do not induce H R but instead
cause a mild necrosis of infiltrated tissue. Binding per se does not initiate H R as
saprophytic bacteria have been observed to bind to cell walls in both bean and tobacco
leaves without initiation of H R (Sing and Schroth, 1977; Sequiera, Gaard and De
Zoeten, 1977; Stall and Cook, 1979).
Piliation in strain ECU may enable its attachment and further growth as an epiphyte,
while its minor production of extracellular carbohydrate could modulate or prevent a
H R response.
To fully elaborate the role of the various factors isolated from pathogens, a suitable
bioassay is essential. Assays are needed throughout the purification of a new toxin to

1
determine which fractionation procedures are the most efficient and where biological
activity is found. In this study, a simple T test comparing the differences in sample
means corrected for sample variance was used to compare the effect of potential toxic
factors produced by the bacteria, a more complex analysis was considered unecessary
(Mize and Chun, 1988).
In the more traditional assays used in this study, electrolyte leakage (Figure 10a and
b) and the detached leaf assays (3.5.2), results were either negative or inconclusive.
These assays thus proved unsuitable for the metabolites under investigation. The
general blackening of the veins radiating from leaf puncture wounds, may be caused
by latex (Berglund et al, 1988). Leakage of electrolytes is associated with the action
of the E P S produced by Erwinia amylovora (Billing, 1984; Hignett and Roberts,
1985; Hignett, 1988), Xanthomonas species (Stall and Cook, 1979; Vidhyasekaran
etal, 1989) and Pseudomonas species (Pavlovkin etal, 1986; Keppler, Atkinson
and Baker, 1988). The presence of a capsule in Erwinia amylovora inhibits
electrolyte leakage. As all three strains of bacteria studied here were capsulated
(3.4), it is possible that a similar effect occurs with these Erwinia herbicola
strains.
In the current study, both protoplasts and suspension culture cells have been used as
convenient host cell material on which to test putative 'toxins' in vitro. These assays
are highly sensitive, and reduce the amount of both test plant material and 'toxin'
required for assay.
The active fraction in suspension assays associated with the two pathogenic bacterial
strains la and Xiib contained a sugar of high moleculer weight assessed by its
exclusion from a Sephacryl S-300HR column. No toxic activity was associated with
any of the fractions from strain ECU when tested in plant cell suspension assays

200
(Table 11). Subsequent suspension cell culture assay using purified E P S from the
two pathogenic strains at concentrations of 250 u.g/ml or more induced significant
cell death (p< 0.01) (3.8.1; Figure 37a-f).
Freshly isolated cassava protoplasts, however, were not affected when exposed to
bacterial cell free filtrates from all three bacterial strains (Table 9, Figure 18).
In contrast, the plating efficiency of cultured protoplasts exposed to bacterial cell
free filtrates from the two pathogenic strains significantly decreased (p < 0.01)
(Figures 19 and 38 a and b). A similar cell free filtrate prepared from medium in
which the non pathogenic strain ECU had been grown did not effect protoplast plating
efficiency. The effect on plating efficiency of filtrates from the two pathogenic
bacterial strains possibly indicates that the action of the polysaccharide is indeed at
the cell wall level as an effect is only apparent once protoplasts have regenerated a
cell wall. However, protoplasts may not be sensitive to toxins that act only on
tissues or that affect particular cell types.
Although, in this study, the effect of the filtrate and polysaccharide was noted on
plating efficiency after three weeks, the effects on undivided protoplasts may have
been manifested within a few days. This was not tested in the current study. It is
possible that E P S interferes with new wall production causing incomplete wall
formation, without which the cells are unable to divide. There was no significant
difference in viability of protoplasts in suspension compared to control cultures
after 24 and 48 h incubations with the bacterial cell free extracts (3.6.2).
However, rinse solution, in which the protoplasts are resuspended during this assay
does not promote cell wall division (2.9.3). The sensitivity to bacterial products
detected by the plating studies, which develops at some time after cell wall
formation, may be due either to differences in cell wall composition or to differences
in the plasma membrane, the structure of the latter possibly being altered by the

201
enzymes used to isolate the protoplasts. Cell wall formation in plating medium is
fairly rapid with the first division taking place after three days in culture (section
3.1.3). An assay monitoring the effects of the polysaccharide during the first few
days in culture, as cell wall material is being laid down, may aid in the elucidation of
the site of action. Indications from the in vitro studies performed here are that the
possible roie of E P S in planta may be to induce plugging of the xylem or binding and
blocking of pores at the cell wall. If the E P S has such a physical effect on cell walls
purified E P S of strain la and Xiib would not be expected to have an effect on the
plasma membrane of isolated protoplasts.
None of the three bacterial strains was able to cause electrolyte leakage (Figure 10a
and b) and there was no effect by either cell free extracts or isolated polysaccharide,
from the two pathogenic strains, on freshly isolated protoplasts. Thus, the action of
the 'toxin' is not due to alterations in membrane permeability or other membrane
functions. However, a further consideration, especially if the action of the
polysaccharide is a charge effect, is the changed surface conditions that occur on
removal of the plant cell wall. Freshly isolated protoplasts have a constant negative
charge (Nagata and Melchers, 1978). If the action of the polysaccharide was due to a
charge effect, experiments using 1 0 O m M CaCl2 to reverse the altered charge of
protoplasts before exposure to the polysaccharide, should have shown a decrease in
protoplast viability on addition of pathogenic bacterial cell free filtrates. This
treatment was however ineffective as protoplast viability was unaffected (Figure
1 8 ) .
The toxic effect observed with cell free filtrates of the pathogenic strains is
associated with their E P S (Figures 37a-f). The large quantities of polysaccharide
required to cause cell death, indicates a non-specific, purely physical interaction of
polysaccharide with host molecules. It is possible that the effect of the isolated

202
polysaccharide can be fairly readily explained by simple electrostatic considerations.
Considering the likelihood that ionic interactions at the cell wall could cause binding
of the EPS, it would not be difficult to envisage a mechanism by which the
polysaccharide by virtue of its size and charge interactions at the cell wall interface
was capable of blocking essential pathways between the cell and the external
environment.
Ionic interactions might have a role in this attachment of EPS. Surfaces to which
bacteria attach have an overall negative surface charge. The D L V O theory (due to
Derjaguin and Landau; Verwey and Overbeek) for the attraction and repulsion that
occurs between two bodies of like charge as they approach one another has been
proposed for the interactions between bacteria and other living or inanimate surfaces
(Rutter and Vincent, 1984). Such forces, attractive and repulsive, are additive in
effect and vary independently with the distance of separation of the bodies. The
production of adhesins, such as pili, that extend beyond the surface of the cell allows
the close approach of the adhesin to the surface which facilitates molecular
recognition between the adhesin and its receptor, resulting in irreversible
attachment. This state of irreversible attachment is characteristic of the adhesive
phase of many bacteria and possibly explains both a mechanism for attachment of the
non pathogenic strain ECU by pili and also a mechanism for the reaction of the E P S of
the two pathogenic strains la and Xiib.
The effectiveness of polysaccharides is due to their properties in solution, gel
formation or insolubility and interactions with both surfaces allowing the electrical
layer repulsion to be overcome (Jones and Isaacson, 1983). Polysaccharides are not
only involved in aggregative reactions, but can in certain instances inhibit
respiration and growth of viable cells as well (Harris and Mitchell, 1973).

203
None of the cassava cultivars used, Groot Rooi, T M S 58308, Thailand, Comml, A C P
100, M Mex 59 and M Aus 7, in either suspension culture or protoplast assays
showed any resistance when tested with purified polysaccharide. This could mean
that indeed, none of the cultivars used in this study are resistant to the
polysaccharide or that the polysaccharides isolated in this study, act in a non
specific manner binding by electrostatic charges to plant cell walls causing plugging
of essential water pathways as described above. Thus, polysaccharide from strains la
and Xiib although possibly contributing to disease would not be responsible for
species specificity.
A disadvantage to using tissue cultures in the assay of wilt inducing toxins is that it
provides no direct evidence of induction of wilt in the whole plant. However, the
potential advantage is that if a toxic metabolite is known to be involved in
pathogenicity and/or disease development regeneration of plants from cultures
exposed to such metabolites, could show resistance to the pathogen.
The data obtained in this study shows that the suspension culture cell assay is a rapid
(an incubation period of 2h) and sensitive procedure allowing identification of
putative toxic substances produced in vitro. The more established methods of
electrolyte leakage and the detached leaf assay unsuitable for the purpose of this
investigation. The absence of a cell wall is possibly the cause for the absence of effect
on freshly isolated protoplasts but alterations to the plasma membrane during
isolation cannot be ignored. Division of isolated protoplasts was affected. This may be
due to binding of the polysaccharide with the newly formed cell wall in a similar way
to that suspected with suspension cultured cells, although defective cell wall
regeneration, due to the presence of this EPS, may also account for this effect. A
disadvantage of the colony formation assay is that it is time consuming (3 weeks)

204
especially when compared to the relative rapidity of the suspension culture assay (2
h).
Meristem derived micropropagated plantlets are useful for establishing similarities
in effects on whole plants with results obtained in tissue culture (3.9). The toxic
effect of bacterial cell free filtrates and purified polysaccharides isolated from the
pathogenic bacterial strains, seen in tissue culture assays, was also reflected in
whole plant assays. Inoculations of leaflets of regenerated cassava plants using
extracts and purified E P S from the non pathogenic strain ECU had no effect. This
strain has no effect on mature plants. The lesions formed on leaves of regenerated
cassava plantlets treated with filtrates (10%, v/v) from the pathogenic strains la
and Xiib (Figure 40), were identical to the lesions formed when bacteria were used
to inoculate leaves of cassava plants (Figure 39). These results show further
evidence of the toxicity also displayed by the bacterial cell free filtrates and purified
E P S of the two pathogenic strains, la and Xiib, in cassava cell culture and protoplast
bioassays.
The use of micropropagated plantlets, transplanted to soil, allowed large numbers of
plants to be tested under controlled conditions. Apple plantlets inoculated with
Erwinia amylovora under in vitro conditions displayed the same symptoms as
greenhouse grown plants (Norelli et al, 1988). The use of in vitro plantlets further
shortens the time required to produce assay material as the hardening step for
transplantation of the in vitro grown plantlets to soil is avoided.
The assignation of the term "toxin" to microbial metabolites has been widely
discussed. Inclusion of high molecular weight polysaccharides, due to their apparent
physical action, in this category is sometimes disputed. However the definition of
Strobel (1977) "Thus, in the broadest sense, a bacterial phytotoxin is considered as

205
a compound of any size or chemical composition, arising from a bacterial
phytopathogen, that adversely affects the normal metabolism of the plant, resulting
in cell death", would allow the term to be applied to the E P S isolated in this study.
Relatively high concentrations of E P S (>250 u,g/ml) are needed to elicit toxicity in
cell culture. Results indicate that the E P S isolated in this study may, if verifiable in
planta, be regarded as an essential attribute contributing to the disease caused by
Erwinia herbicola strains la and Xiib.

5.0 GENERAL CONCLUSIONS
The methodology for the establishment of various cassava tissue cultures was
developed for cassava cultivars grown in both southern Africa and Australia.
A consistently high yielding protoplast isolation method was devised for regeneration
of plants and toxin assays.
Initial regeneration studies yielded low plating efficiencies and slow callus growth
rates. A medium with reduced salt concentrations was formulated for initiation of
protoplast cultures. This medium supports higher protoplast plating efficiency and
rapid callus growth. This rapidly growing p-callus should be useful in further
regeneration studies investigating the initiation of roots and shoots.
A rapidly growing callus culture was obtained. By varying the concentrations of
auxin and cytokinin either a bright green, compact callus or pale yellow, friable
callus was obtained. Bright green callus was used for regeneration studies.
However, only the production of roots and meristematic nodules was obtained. Pale
yellow friable callus was used to initiate cell suspension cultures which have a rapid
growth rate and high proportion of single cells.
Large numbers of plantlets were obtained from regeneration of meristem tips when
combined with a multiple shoot induction and clonal propagation. These plantlets
have been used as the starting material for protoplast isolation and as whole plant
assays in determination of toxicity of the Erwinia strains studied.
Cell culture assays, using protoplast and suspension cultures were developed. The
suspension culture system developed allowed the differentiation between pathogenic

207
and non pathogenic Erwinia strains isolated from cassava. Such a system may be
used to assess resistance potential of particular cultivars in the future.
The extracellular material produced by the three Erwinia strains was purified and
contains both pili and polysaccharide. Pure pilin preparations were demonstrated by
S D S - P A G E . E P S preparations from the three Erwinia strains was shown to have high
relative purity. Subsequent G C - M S analysis provided relative molar contents of the
constituent monosaccharides. The possible contribution of each of these components
to disease development is proposed. Results suggest that pili on the non pathogenic
bacteria may play a role in recognition, however the exact function remains
uncertain. The purified polysaccharide from the two pathogenic strains caused a
significant decrease in suspension culture viability and plating efficiency of cultured
protoplasts. These in vitro results suggested a possible role for this E P S in the host
- pathogen interaction. It is proposed that the polysaccharide, purified from the
pathogenic strains, probably acts in a purely physical manner to plug water
pathways within the plant, causing wilt. The lower production of E P S produced by
the non pathogenic strain and the apparent conformational differences of this
material could account for the absence of any effect of this E P S in plant assays.
Plant tissue cultures have thus far proved useful in the determination of
extracellular factors produced by strains of Erwinia herbicola. However, to fully
determine and confirm the roles proposed for both E P S and pili in the interaction of
these strains with cassava, correlation with results obtained in in planta studies is
required.

APPENDICES
Appendix i
Appendix ii
Appendix iii
Appendix iv
Appendix v
Appendix vi
Appendix vii
Appendix viii
Appendix ix
Appendix x
Appendix xi
Appendix xii
Appendix xiii
MS* medium
Enzyme and rinse solution
Holding solution
Plating medium
Proliferation medium
MSX medium
Broad spectrum medium components
Eradication Medium
Nutrient yeast extract glucose agar
Polyacrylamide gel electrophoresis
HA buffer
Plasmid solutions and agarose gels
GC-MS analysis of TMS methyl
glycosides

APPENDIX i
MS* Medium (Modified Murashige-Skoog after Kartha etal, 1974).
Constituent
KNO3
CaCl2.2H20
MgS04.7H20
KH2PO4
NH4NO3
ZnS04
H3BO3
MnS04.4H20
KI
Na2Mo04.2H20
CUSO4.5H2O
C0CI2.6H2O
Meso-inositol
Thiamine.HCI
Glycine
Nicotinic acid
Pyridoxine HCI
FeNaEDTA
Sucrose
agar
mg/l
1900
440
370
170
1650
8.60
6.20
22.30
0.83
0.25
0.025
0.025
100.0
10.00
2.00
1.0
1.0
36.70
20000
6000
pH 5.6. Autoclave for 20 min.

210
APPENDIX ii
Enzyme and rinse solution
Constituent
KNO3
CaCl2-2H20
MgS04.7H20
KH2PO4
ZnS04
H3BO3
MnCl2-4H20
KI
Na2Mo04.2H20
CUSO4.5H2O
C0SO4JH2O
FeS04.7H20
Na2EDTA.2H20
Casein hydrolysate
osmoticum
Sorbitol
mg/l
3800
880
740
340
2.30
1.55
4.95
0.21
0.0625
0.00625
0.0075
6.95
9.325
10
0.6 M
pH 5.6
Enzyme solution.
(i) Short term protoplast isolation. 1 % (w/v) Macerozyme R-10 (Yakult
Pharmaceutical Industry Co. Ltd., Nishinomiya, Japan) (0.1 g) and 2 %
(w/v) Cellulase "Onozuka" R-10 (Yakult Pharmaceutical Industry Co. Ltd.,
Nishinomiya, Japan) (0.2 g) added to 10 ml of the above solution and filter
sterilized.
(ii) Long term protoplast isolation. 0.5% (w/v) Macerozyme R-10 (0.05
g) and 1 % (w/v) Cellulase "Onozuka" R-10 (0.1 g) added to 10 ml of the
above solution and filter sterilized.
Rinse solution.
The above solution with no enzyme added is autoclaved for 20 min.

APPENDIX
Holding solution
Constituent
KNO3
CaCl2.2H20
MgS04.7H20
KH2PO4
ZnS04
H3BO3
MnCl2-4H20
KI
Na2Mo04.2H20
CUSO4.5H2O
C0SO4.7H2O
FeS04.7H20
Na2.EDTA.2H2-0
Casein hydrolysate
Osmoticum
Sucrose
Mannitol
Xylitol
Inositol
Sorbitol
mg/l
3800
880
740
340
2.30
1.55
4.95
0.21
0.0625
0.00625
0.0075
6.95
9.325
10
68.4g (0.2 M)
4.56g (0.025 M)
3.80g (0.025 M)
5.50g (0.025 M)
59.28g (0.325 M)
p H 5.6. Filter sterilize.

APPENDIX iv
Plating medium
Part 1
Constituent
Folic acid
meso-inositol
Thiamine HCI
Glycine
Nicotinic acid
Pyridoxine HCI
Biotin
ZnS04
H3BO3
MnCl2-4H20
KI Na2.MoO4.2H2O
CUSO4.5H2O
C0SO4.7H2O
FeS04-7H20
Na2EDTA.2H20
Casein hydrolysate
NAA
BAP
Agarose
mg/l
2.5
500
2.5
10
25
25
0.25
23
15.5
49.5
2.075
0.625
0.0625
0.075
69.5
93.25
50
1
0.4
10000
mg/l
on mixing
0.5
100
0.5
2.0
5
5
0.05
4.6
3.1
9.9
0.415
0.125
0.0125
0.015
13.9
18.65
10
0.2
0.08
2000
pH 5.6. Autoclave for 15 min continued...

Part 2
Constituent
KNO3
CaCl2-2H20
MgS04-7H20
KH2PO4
Osmoticum/
Carbon Source
Sucrose
Mannitol
Xylitol
Inositol
Sorbitol
mg/l
2375
550
462.5
212.5
85.55g
5.70g
4.75g
6.87g
74.1 Og
mg/l
on mixing
1900
440
370
170
g/i on mixing
68.4g (0.2 M)
4.56g (0.025 M)
3.8g (0.025 M)
5.5g (0.025 M)
59.28g (0.325 M)
pH 5.6. Filter sterilize. 5 ml of Part 1 is mixed with 20 ml of Part 2

APPENDIX v
Proliferation medium
Constituent
KNO3
CaCl2.2H20
MgS04.7H20
KH2PO4
NH4CI
ZnS04
H3BO3
MnCl2-4H20
KI
Na2Mo04.2H20
CUSO4.5H2O
C0SO4.7H2O
Folic acid
Meso-inositol
Thiamine HCI
Glycine
Nicotinic acid
Pyridoxine HCI
Biotin
Na2EDTA
FeS04
Sucrose
Sorbitol
Adenine sulphate
MES
agar
NAA
BAP
Casein hydrolysate
mg/l
1900
440
370
170
0.106
4.60
3.10
9.9
0.415
0.125
0.0125
0.015
0.5
100.0
0.5
2.00
5.0
5.0
0.05
18.65
13.9
2500
54640
40
0.976
9000
1.0
0.5
400
pH 5.6. Autoclave for 15 min.

215
APPENDIX vi
MSX Medium
Constituent
KNO3
CaCl2-2H20
MgS04.7H20
KH2PO4
NH4NO3
ZnS04
H3BO3
MnS04.4H20
KI
Na2Mo04.2H20
CUSO4.5H2O
C0CI2.6H2O
Meso-inositol
Thiamine.HCI
Glycine
Nicotinic acid
Pyridoxine HCI
FeNaEDTA
Sucrose
agar
NAA
BAP
GA3
mg/l
2850
660
555
255
2475
12.9
9.30
33.45
1.245
0.375
0.0375
0.0375
150.0
15.00
3.00
1.5
1.5
55.05
30000
9000
0.2793
0.1689
0.0525
pH 5.6. Autoclave for 20 min.

216
APPENDIX vii
Broad spectrum medium components
Constituents
Minerals
NH4NO3
KNO3
KH2PO4
NaH2P04
KCI
CaCl2
MgS04
H3BO3
MnS04
ZnS04
CUSO4
Na2Mo04
C0CI2
KI
FeS04
Na2EDTA
Auxin
Cytokinin
Concentration (mmol/l)
Low
5
0.1
1.9
1
0.5
0.01
0.01
0.001
0.00001
0.00001
0.0001
0.0005
0.01
0.01
0.0001
0.0001
Medium
1 0
1 0
1
2
1.5
0.05
0.05
0.02
0.0001
0.0001
0.0005
| 0.0025
0.05
0.05
0.001
0.001
High
20
20
2
3
3
0.15
0.1
0.04
0.0015
0.001
0.001
0.005
0.1
0.1
0.01
0.01
continued

Constituents
Organic nutrients
Inositol
Nicotinic acid
Pyridoxine HCI
Thiamine HCI
Biotin
Folic acid
Ca-D-Pantothenate
Riboflavin
Ascorbic acid
Choline chloride
L-Cysteine HCI
Glycine
Concentration (mmol/l)
low
0.1
0.004
0.0006
0.0001
0.00004
0.0005
0.0002
0.0001
0.0001
0.0001
0.01
0.0005
medium
0.3
0.02
0.003
0.002
0.0002
0.001
0.001
0.001
0.001
0.001
0.06
0.005
high
0.6
0.04
0.006
0.04
0.001
0.002
0.005
0.01
0.01
0.01
0.12
0.05

218
APPENDIX viii
Eradication medium
Eradication medium 1 : for the stimulation of callus and plant development.
Basal medium
Dissolve 4.3 g Murashige - Skoog powder
in 500 ml of water
Add 4 ml Thiamine HCI (stock 100 ppm)
Add 12.5 ml Inositol (stock 8000 ppm)
Dissolve 20 g sucrose
Add 5.0 ml BAP (stock 10 ppm)
Add 5.0 ml G A 3 (stock 10 ppm)
Add 2.0 ml NAA (stock 10 ppm)
Complete to 800 ml with double distilled water.
Adjust the pH to 5.7 - 5.8
Agar medium
Make up 6 g of agar in 175 ml double distilled water.
Heat to dissolve
Mix basal medium with agar
Make up to 1 I with double distilled water
Autoclave for 10 min only

Eradication medium 2 : for micro - propagation
Basal medium
Dissolve 1.43 g Murashige - Skoog powder in 450 ml
double distilled water.
Add 10 ml Thiamine HCI (stock 100 ppm)
Add 12.5 ml Inositol (stock 8000 ppm)
Dissolve 20 g sucrose
Add 1.0 ml NAA (stock 10 ppm)
Complete to 750 ml with double distilled water
Adjust pH to 5.7 - 5.8
Agar medium
Dissolve 8 g agar in 210 ml double distilled water
Heat to dissolve
Mix basal medium with agar thoroughly
Make up to 1 I with double distilled water
Autoclave for 15 min only

220
APPENDIX ix
Nutrient Yeast Extract-glucose agar
Constituents
Nutrient broth
Yeast extract
Glucose
K 2 HP0 4
KH2PO4
MgS04.7H20
Agar
g/i
8.00
2.00
5.00
2.00
0.50
0.25
18.00
pH 7.5. Autoclave for 20 min.

APPENDIX x
Polyacrylamide Gel Electrophoresis
Reagents and gel preparation for SDS-Page slab gels (Laemmli, 1970)
1. Acrylamide/Bis (30%T, 2.67%C)
Acrylamide: 29.2 g/100 ml
N'N'-Bis-methylene-acrylamide: 0.8 g/100 ml
The stock is made up to 100 ml with glass distilled water, filtered and stored at 4°C
in the dark (30 days maximum).
2. 1.5 M Tris-HCI, pH 8.8
Tris base: 18.5 g/100 ml
~60ml glass distilled water
The pH is adjusted to 8.8 with 1N HCI and the volume made up to 100 ml with glass
distilled water and stored at 4°C.
3. 0.5 M Tris-HCI, pH6.8
Tris base: 6 g
-60 ml glass distilled water
The pH is adjusted to 6.8 with 1N HCI and the volume made up to 100 ml with glass
distilled water and stored at 4°C.

4. 1 0 % S D S
10 g of S D S is disolved in water with gentle stirring and the
volume made up to 100 ml with glass distilled water.
5. Sample buffer (SDS reducing buffer). Stored at room temperature
Distilled water 4.0 ml
0.5 M Tris-HCI, pH 6.8 1.0 ml
Glycerol 0.8 ml
1 0 % (w/v) S D S 1.6 ml
2 b-mercaptoethanol 0.4 ml
0.05% (w/v) Bromophenol blue 0.2 ml
8.0 ml
The sample is diluted 1:4 with sample buffer and boiled for 5 min.
6. 5X Electrode (running) buffer, pH 8.3
Tris base 1 5g/l
Glycine 72g/l
SDS 15g/l
The stock is made up to 1000 ml with glass distilled water and stored at 4°C.
The stock is diluted 1:5 before use.

223
Separating gel preparation - 0.375M Tris, pH 8.8
Distilled water 18.0 ml
1.5 M Tris-HCI, pH8.8 25.0 ml
1 0 % SDS (w/v) stock 1.0 ml
Acrylamide/Bis stock 50.0 ml
Degas for > 15 min at room temperature (in vacuo)
10% Ammonium persulphate 500 u.l (0.05%)
(fresh daily)
TEMED 50 ul (0.05%)
TOTAL MONOMER 100 ml
Stacking gel preparation - 4.0% gel, 0.125M Tris, pH 6.8
Distilled water 12.2 ml
0.5 M Tris-HCI, pH6.8 5.0 ml
1 0 % (w/v) SDS 200 u.l
Acrylamide/Bis stock 2.6 ml
Degas for > 15 min at room temperature
10% Ammonium persulphate 100 u.l (0.05%)
TEMED 20 u.l (0.1%)
TOTAL MONOMER 20 mi

224
Low molecular weight calibration proteins (Pharmacia, Uppsala, Sweden.)
Phosphorylase b
Albumin
Ovalbumin
Carbonic Anhydrase
Trypsin Inhibitor
a - Lactalbumin
94000 Da
67000 Da
43000 Da
30000 Da
20100 Da
14400 Da

225
APPENDIX xi
HA Buffer
10 m M sodium/potassium phosphate buffer (pH 6.0) containing:
0.02% (w/v) sodium azide
0.9% (w/v) NaCl.

APPENDIX
Pharmacia Miniprep Solutions
Solution I
50 m M Tris-HCI (pH 8.0); 50 m M glucose; 10 m M EDTA
0.15% (v/v) Kathon® CG/ICP
Solution II
0.8 M NaOH; 4 % (v/v) Triton® X-100
Solution III
3 M sodium acetate (pH 4.8)
Column Buffer
10 m M Tris-HCI (pH 8.0); 1 m M EDTA
QIAGEN Pack Column Buffers
Buffer A
400 m M NaCl; 50 m M MOPS; 15% ethanol (pH 7.0)
Buffer C
1000 m M NaCl; 50 m M MOPS; 15% ethanol (pH 7.00)
Buffer F
1500 m M NaCl; 50 m M MOPS; 15% ethanol (pH 7.5)
Agarose Gels
1. TBE (Tris-borate EDTA) Buffer (5x concentrate)
Tris base 54 g
Boric acid 27.5 g
EDTA 20 ml 0.5 M EDTA (pH 8.0)
The stock is made up to 1 I with glass distilled water.

227
2. Running Dye
0.25% Bromophenol Blue
4 0 % sucrose
Solution prepared in glass distilled water.
3. Agarose gel
1 % NA (Pharmacia, Uppsala, Sweden) agarose in 1x TBE
The slurry is heated in a microwave oven until the agarose dissolves. The solution is
cooled to 50°C and ethidium bromide (from a stock solution of 5 mg/ml stored at 4°C
in a light proof bottle) added to a final concentration of 0.5 ug/ml.

APPENDIX xiii
GC-MS Analysis of TMS-methyl glycosides
GC-MS analysis of TMS-methyl glycosides of standard monosaccharides.
Abundance
50000
73
Scan 128 (6.997 m m ) : STDE.D 2l7
59 < • ¥ • • . <
117
101
V Z -> 50 4-f
| 147,^, 189
L-Fucose
247 u.
319 r—•/*•' i mkt—i—i—i—i—i—i—r
100 150. 200 250 300
Abundance
200000-
73 Scan 157 (7.446 rain): STDE.D
2<j4
59
133
117 •V • { • • , • * ! t
157
L-Fucose
217
i — r * r*"| 1 ' i — i " T | ' i " i — r i - ]
I 245 29(?0|19 363 * i A »' . ^ r • L i < I • I I • • i — r — i — r — r ^ — ' — " — i — i — r
H/Z -> 50 100 150 200 250 300 350
Abundance 200000i
100000-
73 Scan 184 (7.865 min): STDE.D
2<*4
59 •"V +•
133
,101 ,
147
163
L-Fucose
217
,1 ,»< T-*l 'l" t ' V 2 -> 50 100 150 200 250
4257 290005 T — i — i — r — i — i — r -
300
Abundance Scan 214 (8.3 30 min): STDE.D Tl3 204
200000
100000-1
59
13147
116 189
D-Xylose
24259 305 333 r*7—r* f'|—1—r^-i—t | ' i — i — r T
V Z -> 50 100 150 200 250 300

GC-MS analysis of TMS-methyl glycosides of standard monosaccharides.
Abundance
100000-
Scan 237 i'8.687 min): STDE.D 204
13
V Z -> 50
59 101
147
100
189 -r-i—• •> f
D-Xylose
217
, \ r ; 247 275 305 333
- t — r ^ — i — f — r * ~ i — i — r "
150 200 250 300
Abundance
400000- 73
200000-
0
Scan 324 (10.035 min): STDE.D 146 217 3-O-Methyl-D-glucose
V Z -> 50
59 I 1 1 7 159 ,_, i i J J hi , I 1 ? 1 259 28-203 332 361
[•••* •f^f* **• f*v r i"*| -'V i*" i -r |-'i 7 fik-|—r i- v-i—[—'—'—f-1—| ' ' 100 150 200 250 300 350
Abundance 200000-1
100000-
Scan 332 (10.160 m m ) : STDE.D 146 217
73
117 159
A/Z -> 50
59 J-j'. 15
, 1- 4, \ M M 4 191
i~-r 100 150 200
3-O-Methyl-D-glucose
259 287 332 377 ***] • T — T — r — " i — j — i — I — i — i — j — i — r
250 300 350
Abundance
20000-
Scan 344 (10.346 min): STDE.D
10000
73
55. 0 ' i • '• •• V i111'!1
3-O-Methyl-D-glucose
133 12!)
I ' ' ' ' I
147
8,9 T t II I I 175 191 2 -8
,.7 ..,.,il, , , j , , M'*%, w • »J7 • ••••'« i"1* M P"'"i'
243 I ' ' ' ' I r
4/z -> 60 80 100 120 140 160 180 200 220 240

230
GC-MS analysis of TMS-methyl glycosides of standard monosaccharides.
Abundance
500000-
73
Scan 407 (11.323 m i n ) : STDE.D 2d) 4
-Hf*Y
133
103 rf'\ f i'A *ri**| "cim i T 4
D-Mannose
k 31 293)05 335 377 i I " I i t i 'f I * I i i"t i f
467 i**l i — r i T | * i i i " i | — f i -i i | 1—n—r-r
K/Z -> 50 100 150 200 250 300 350 400 450
Abundance
50000-
73
Scan 453 (12.038 m i n ) : STDE.D 2<t>4
A/Z -> 50
59
133
103 147
169 I
D-Mannose
217
243 27129C005 r—lT—I** f l 1 1—I f—r^i—*"
100 150 200 250 300
Scan 420 (11.525 m m ) : STDE.D 2l7
Abundance 200000
100000-
73
59 -p—*>—r
133 47
103 189 2 4 7 23)B 3 1
D-Galactose
2.8
V Z -> 50 100 150 200 250
.9 1—I—'—r~ 300
Abundance
400000-
20000U
73
Scan 475 (12.379 min): STDE.D 2<J4
133
59 , 1 0 3. ll Il59 , 247 29005 335 361 V r*f\ p r*> V-V1^ "f *"i T f*i *t f i*"! f i i f |'i '» i i | f t
A/Z -> 50 100 150 200 250 300 350
D-Galactose
217

231
GC-MS analysis of TMS-methyl glycosides of standard monosaccharides.
Abundance
200000-
100000 -
Scan 526 (13.171 m m ) : STDE.D 2<t)4
73
59
133
D-Galactose
217
L1?3J L I159 247 29005 335 37 •t "T1 p r , , , i — ! r i"*^ " V r ' > " T ;*i -T f i " | — i — i — i — T | *I 1—I—I—|—I—r
M/Z -> 50 100 150 200 250 300 350
Abundance
500000-
0
73
Scan 570 (13.854 min): STDE.D 2(1)4
133
147
D-Glucose
217
5 9 i i I J I I d I 2 4 3 290317 361 r [ --f •rt-'S y-rS rr-^-v Y-I T |*S T t i"| i n T ' f i ' n i'| n-i
435 i i i i i
A/Z -> 50 100 150 200 250 300 350 400
Abundance Scan 604
•
200000-
n
73
59
133
117 L 1 l 1 k , .1159
u - ) — | ( • X T~ 1 [ T" » 1 1 | 1' 1
A/Z -> 50 100 150
(14.382 min): 2(
.. ,.it- i
14
2.
i
.7
L 2 47 i — i i • • • | •
200 250
STDE.D
D-Glucose
29005 345 377 r i " f j •! i i i | i i •
300 350
Abundance
10000
Scan 867 (18.459 min): STDE.D
N-Acetylglucosamine
59 +n-4
131 94 117
•|l'' '/'"'lllMn'h1 "i
p 147
I I ] I i"n | r'l i i |
186 204217
i, Ji', ,i 1',, ,V',,, ,,i 247259 I I ' 1 ' • 1
y Z -> 60 80 100 120 140 160 180 200 220 240 260

232
GC-MS analysis of TMS-methyl glycosides of standard monosaccharides,
Abundance
200000
Scan 950 (19.750 min): STDE.D
73
-*-t
131
rh pi-*i"f'i*,,|
N-Acetylglucosamine
204226 259 *V •r-i-tV-|-*-A-'r r*r4 t i • i t I'I i i
30114 348 404 436 - i — i — i — i — | — r ~ i — r
A/Z -> 50 100 150 200 250 300 350 400
kbundance
5000-
0
73 Scan 1084 (21.829 min): STDE.D
55 i i 'r r r TI
N-Ac-e #igi ucosarame
131
«r
••7 94 115 147 170
Ii,..*•'... '.'LA..",.!'1.,.1... I I I I I i | i i T I I T T I T 1 I F I I I f I I I T T T T ^
204 226 _L - i — i — [ t 'i
i/Z -> 60 80 100 120 140 160 180 200 220
Abundance 200000-1
100000-
73
1 5 9
0 ' rHr -i* •+*Hr
M/Z -> 50
Scan 889 (18.801 rain): STDE.D it 3
N-Acetylgalactosamme
131147 0 247 ..j1!6 Ii I , L , 7 |259 2 8 6 3 1 4 3 3 0
100 150 200 250 300
Abundance 200000-1 713
100000
Scan 1350 (25.956 min): STDE.D
Sialic Acid
298
103 147 186 259
, L.lJilL, l.,L J I 3f2 . 4f° 476 520 566 610 i [-1 fi'l f'Af I'-j-l'fi'r'p-)-) I'^rffT-f r n f p iSr; i r n ; 111 i 11 ii i 111
V Z -> 50 100 150 200 250 300 350 400 450 500 550 600

233
GC-MS analysis of TMS-methyl glycosides obtained from the EPS of the non
pathogenic bacterial strain ECU.
Abundance
5000 -
Scan 129 (7.011 m m ) : W3. D 7 L-Fucoi
''5
101
117
11 133
147 159 189
A/Z -> ^ — | — i — i i' i — p T — i — I — r — | — i — i ' i' i — | — i 'i' i i " | — i — r ~ l — i — | — i — r * — i — i — p — i — i — r — r 1 |
80 100 120 140 160 180 200 220
Abundance
20000-
73
Scan 158 (7.460 m m ) : W3.D 2<fr4
T A/Z -> 50
59
-4—Y
133
i_ 101
••A |" , ", 1"
147 I159 189
L-Fucose
100 150
245 305 — n — i — r — ' — i — i — i — i — i — p 1 —
300 200 250
Abundance
20000-
Scan 185 (7.878 min): W3.D
10000-
73
59
0 "1 i . 'I'V • i i
.-i^4o
133 147
8% 4 117 I 189
•*•"••• •'•'• i " ' • ' ' l ' i • -'"' i 1 ' ' I ' ' •'•• i i l"i
>se
217
| 'i i* i'i |**l—i i 'I' [ i I T i | 'I T l I | l I I I [ I I " I i -r
A/Z -> 60 80 100 120 140 160 180 200 220
abundance
200000-
Scan 325 (10.045 min): W3.D
146 73
59 r4
117
ff**!1 '
AX /
217 3-0-Methyl-D-glucose
159 191 -l i r
259 28303 332 361
A/Z -> 50 100 150 200 *i—r r | i — f i ' i ]—i—i i i | i i
250 300 350

GC-MS analysis of TMS-methyl glycosides obtained from the EPS of the non
pathogenic bacterial strain ECU.
Abundance
100000- 73
50000-
Scan 333 (10.170 min): W3.D 146 2l7
59
4--117
i xa:
r.\. f. ,,1, .pi,^.,^ 159 1 9 1
3-0-Methyl-D-glucose
259 287 I — r * I * " I — T — r — T - - T — i — i — i — i — i — i — r
377
M/Z -> 50 100 150 200 250 300 350
Abundance
10000^
5000-
0-A/Z - >
7
5 9
I ill hi
60
3
8
J1 '
Scan 347 (10
9 i: 103 117
. ll II Ii
.387
1< $3
hi
rain): W3.D
3-O-Methyl-D-glucose
c 159 217 \6 J-33 204
173 189 . n Ii i n 1 II r | I T • i | I i i r | i i i i | i i i i | • i i • | i i i i | • i • |
80 100 120 140 160 180 200 220
Abundance
50000-73
Scan 422 (11.549 rain): W3.D 2i7
59
13^
103 47
<• ,• • .
A/Z -> 50 V f' , ', M-,'-yV •'•• •» T--T V f |
100 150
189
200
D-Galactose
t 247 271 319 | I I" I I" | I 1 I '
250 300
Abundance Scan 476
100000-
n
73
59
i:
103 , L..x. .1 _J. Ii
53
[l59 U - 1 — | — r — i — r — - i -[ - T ™ I — i — r - [ i i
V Z -> 50 100 150
(12.385 rain): W3.D 2i
. ..hf-. f<
)4 D-Galactose
21
L .7
243 271 30517 361 i i r i i i i i i i i i i • • i
200 250 300 350

235
GC-MS analysis of TMS-methyl glycosides obtained from the EPS of the non
pathogenic bacterial strain ECU.
Abundance
50000-
Scan 528 (13.191 m m ) : W3 2<t>4
73
59 -\- Y*
133
A/Z -> 50
103 12f> 1. 169 ^ •
D-Galactose
217
u 100 150 200
243 290 -T" r*—[ 1 1 1 1
250
Abundance
100000-
50000-
0
73
Scan 571 (13.857 min): W3.D 2<t<4
133
A/Z -> 50
59 H 7 Jl59
D-Glucose
217
[ 247 29005 3: T " * T — ^ i*" | ' i — r — i — f — | • i ' i — r
100 150 200
31 377 ' I ' ' I '• ' ' r I
250 300 350
Abundance
50000-
0
73
Scan 606 (14.399 min): W3.D 2<t4
59
</Z -> 50
133
1 2 9 Il59 r4 tl i*\ V*.1*! ^ i ^r'4' f
D-Glucose
217
^ I*I r 247 305 377
- i — | — i — i — i — i — | — i — r — —
100 150 200 250 300 350

GC-MS analysis of TMS-methyl glycosides obtained from the EPS of the pathogenic
bacterial strain la.
Abundance
5000-
Scan 129 (7.009 min): W2A.D
73
5159
L-FucosV
117
94 133 1-47159
•Ur 189
7
0 i ' I I | i ' i i | i i i'i | i i i i' [ i i Y i | i 't -i i') i i i i | i i' i i t t i > y
A/Z -> 60 80 100 120 140 160 180 200 220
Abundance
20000
10000-
0
73 Scan 157 (7.442 ram): W2A.D
2d)4
59
133
101 il\f . ,lli(i I, i J jJL, fl
V Z -> 50
147
ll 189
L-Fucose
245 305 i " i l i ' i 1 — i — i r
100 150 200 250 300
Abundance
20000-
10000
Scan 184 (7.860 min): W2A.D 7 3 L-Fufe
5T i i I V Y i' i i
133
''5 89 117
I • ' ' ' I
147
"l | I I1 l'l I1 I I I V1 I I l111!'11! | 'l 'l' I I '| I I I I 1 I l''l . 159 189
I i i i i j i r "i i |
ose
217
V Z -> 60 80 100 120 140 160 180 200 220
Abundance 200000-
100000
73
Scan 324 (10.027 ram): W2A.D
217 3-O-Methyl-D-glucose
59 117
-UU-r I iJ- 159
191 f-T • W ' T ' pri—i—f
A/Z -> 50 100 15( )4'r>-rf
200
243 28^03 332 361 * i — r i*"i r r I r r "i ' i — | — i — i — r - i — | — r — r -
250 300 350

237
GC-MS analysis of TMS-methyl glycosides obtained from the EPS of the pathogenic
bacterial strain la.
Abundance
50000
0
73
Scan 332 (10.152 min): W2A.D 146 2l7
59
J. T V* • • •/•*-< • •¥
1 1 7
-UJ1-159
-V+ 191
' O' i • »• • *
3-O-Methyl-D-glucose
259 377 yli, , . frfc .1, ^ f. ,l.j , f—, , j r — , , , T
A/Z -> 50 100 150 200 250 300 350
Abundance
10000-
5000-
Scan 346 (10.369 min): W2A.D
0
59
, , 1 I, • •
3-O-Methyl-D-glucose
146 159
89 133
'"i r '
101 117 lux -j i 189
I'I [''i i i I' | i I' Y I | 'i**l i i [ i i i i | i i1 i i | r i i i
204 217
l V Z -> 60 80 100 120 140 160 180 200 220
Abundance
5.0000-
59
Scan 420 (11.515 rain): W2A.D 2i7
133 147
103 I 189 2|-9 247 271 -, , r1 • l> \l^K [\ 1-. T ,••-, H I- .••!•• r • i
D-Galactose
319 • \- • •
V Z -> 50 100 150 200 250 300
Abundance
100000-
50000-
73
Scan 475 (12.367 min): W2A.D 2t)4
133
59 I 103
VZ -r***f " T 1 p i
> 50 100
159 -Y—t-
D-Galactose
217
L T I I r
243 290 317 361 T r i •• i -1—ri r i 'i i
150 200 250 300 ' ' I '
350

GC-MS analysis of TMS-methyl glycosides obtained from the EPS of the pathogenic
bacterial strain la.
Abundance
50000-
0
Scan 527 (13.172 min): W2A.D 2*4
73
59 I 103 12
133
9 I159 191
. Ji . > . . , . . — i t — J
V Z -> 50 1 • ' • ' I
D-Galactose
243 290305 - r * — r " — i — i — i — i i
100 150 200 250 1 300
Abundance
100000-
0
73 Scan 569 (13.823 min): W2A.D
• 2<*4
133
D-Glucose
217
5,9 i , 1 ? 3 | L [159 . 247 29005 332 361 |-v n I 1 f r n •¥* f*\ •••" tmi"ifcyfci *> t i-| i t i—r |-i •» T- i |—i—r
V Z -> 50 100 150 200 250 300 350
Abundance
50000
0
73
59 i — • / — t
Scan 604 (14.365 min): W2A.D 2<J4
133
103
. , 4 ..|li..f.^ .Ifi,.^
147
,169
D-Glucose
V Z -> 50 100 150 200 250
217
, 234 259 291305 ; * * i " I — i * i ' * | — i — i — i — r — | • i
300

239
GC-MS analysis of TMS-methyl glycosides obtained from the EPS of the pathogenic
bacterial strain Xiib.
Abundance
100000-
Scan 323 (10.014 min): W1A.D 146
73 217 3-0-Methyl-D-glucose
cq 117 159
I I I 111 , L 1 ? 1 t 243 28-303 332 361 A/Z -> 50 100 150 200 250 300 350
Abundance
50000-
Scan 332 (10.154 min): W1A.D
73 146
V Z -> 50
59 I H 7
I JUf-,1 IT, D 100
2!.7
^ 9 191
3-O-Methyl-D-glucose
243 287 — r - * 1 — ( ' i k | t i — T - T — ] — i — i — i — i — | — i -
150 200 250 300 350
377 T—
Abundance
4000-
2000-
V Z ->
Scan 347 (10.386 min): W1A.D
8%4 117
rn—r-r—i—rT
129 146
3-0-Methyl-D-glucose
159 217
204
-i—i — i — r - i — r - r - i — r ~ i — r ~ i r—r T 80 100 120 140 160 180 200 220
Abundance
200000-
Scan 421 (11.533 min): W1A.D
73 2..
133
V Z -> 50
59 103 1159 20E •4 r*t-S p,-i l'1!^ i1. * )L>-
D-Galactose
100 150 200
247 291 31L§32 361 l t- i " * | *i i1 i *T | r r i' i | i i
250 300 350

240
GC-MS analysis of TMS-methyl glycosides obtained from the EPS of the pathogenic
bacterial strain Xiib.
Abundance
500000 -
Scan 477 01 m m > : WiA. 2
204 73
59 i • V r
133
103 159
.actose
217
247 29005 335 361 v i • i i i 1 * ! 'i- i" I ' M i ' ' f i ' ' ' ' i f r
yi/Z -> 50 100 150 200 250 300 350
Abundance 400000-1
200000-
73
Scan 527 (13.177 min): W1A.D 2(P4 D-Galactose
59
133
103 • * , \ f- i «S ¥•• I1
217
169 -T—1 1—T~
V Z -> 50 100 150 200
243 29005 335 377 * r — r i * * | — ' — i — i — i * | •' ' ' — i — i — I ' «
250 300 350
Abundance 1000000-]
500000-
Scan 573 (13.891 min): W1A.D 2(t)4 D-Glucose
73
133
147
V Z -> 50
103
217
•••>, n • h*1 * * 247 303.7 377 435 •i •» i r i T | •• i -i t i • | •• i • i i • i i
100 150 200 250 300 350 400
Abundance
500000-
0
Scan 606 (14.404 min): W1A.D 2($4 D-Glucose
73
59
133 217
I, \ ,.l J,7^!,.^9, , |. ,1,1 r 247 29005 345 377
T — i — t i ' r |" i 'i " i — " — | — i — r ~
A/Z -> 50 100 150 200 250 300 350

REFERENCES
Addy, S.K. 1976. Leakage of electrolytes and phenols from apple leaves caused by
virulent and avirulent strains of Erwinia amylovora. Phytopathology. 66: 1403-
1405.
Adejare, G.O. and Coutts, R.H.A. 1981. Eradication of cassava mosaic disease
from Nigerian cassava clones by meristem tip culture. Plant Cell Tissue and Organ
Culture. 1: 25-32.
Anderson, A.J. 1984. Differences between lipopolysaccharide compositions of
plant pathogenic and saprophytic Pseudomonas species. Applied and Environmental
Microbiology. 48: 31-35.
Aspinall, G.O. 1982. Chemical characterization and structure determination of
polysaccharides. In: The polysaccharides. Vol 1. Aspinall, G.O. (ed.). Academic
press, New York, pp 36-131.
Attanossov, A. and Brown, D.C.W. 1984. Plant regeneration from suspension
culture and mesophyll protoplasts of Medicago sativa L. Plant Cell, Tissue and Organ
Culture. 3: 149-162.
Ayers, A.R., Ayers, S.B. and Goodman, R.N. 1979. Extracellular
polysaccharide of Erwinia amylovora a correlation with virulence. Applied and
Environmental Microbiology. 38: 659-666.
Bajaj, Y.P.S. and Saettler, A.W. 1970. Effect of halo toxin containing
filtrates of Pseudomonas phaeseolicola on the growth of bean callus tissue.
Phytopathology. 60: 1065 -1067.
Bajaj, Y.P.S. 1989. Isolation culture and preservation of protoplasts. In:
Biotechnology in Agriculture and Forestry 8. Plant protoplasts and genetic
engineering I. Bajaj, Y.P.S. (ed.). Springer-Verlag, New York, pp 3-22.
Bala Bawa, S. and Torrey, J.G. 1971. "Budding" and nuclear division in
cultured protoplasts of corn, convolvulus, and onion. Botanical Gazette. 132:
240-245.

242
Balgopalan, C , Pajmaja, G., Nanda, S.K. and Moorthy, S.N. 1988.
Cassava in food, feed, and industry. C R C Press, Inc., Florida.
Bellincampi, D. and Morpurgo, G. 1987. Conditioning factor affecting growth
in plant cells in culture. Plant Science. 51: 83-91.
Bellincampi, D. and Morpurgo, G. 1989. Evidence for the presence of a second
conditioning factor in plant cell cultures. Plant Science. 65: 125-130.
Bender, C.L. and Cooksey, D.A. 1986. Indigenous plasmids in Pseudomonas
syringae pv. tomato : Conjugative transfer and role in copper resistance. Journal of
Bacteriology. 165: 534-541.
Bender, C.L., Malvick, D.K. and Mitchell, R.E. 1989. Plasmid mediated
production of the phytotoxin coranatine in Pseudomonas syringae pv. tomato .
Journal of Bacteriology. 171: 807-812.
Berbee, F.M., Berbee, J.G., Hildebrandt, A.C. 1974. Induction of callus and
virus - symptomless plants from stem tip cultures of cassava. In Vitro. 8: 421.
Berglund, D.L., Taffs, R.E. and Robertson, N.P. 1987. A rapid analytical
technique for flow cytometric analysis of cell viability using calcofluor white M2R.
Cytometry. 8: 421-426.
Berglund, D.L., Strobel, S., Sugawara, F. and Strobel. G.A. 1988. Flow
cytometry as a method for assaying the biological activity of phytotoxins. Plant
Science. 56: 183-188.
Bhojwani, S.S. and Razdan, M.K. 1983. Plant tissue culture theory and
practise. Elsevier, Amsterdam, pp 488.
Billing, E. 1984. Studies on avirulent strains of Erwinia amylovora. Acta
Horticulturae. 151: 249-253.
Billing, E. 1987. Bacteria as plant pathogens. Von Nostrand Reinhold (U.K.),
Wokingham, Berkshire, pp 79.

243
Boucher, C , Martinel, A., Barberis, P., Alloing, G. and Zischek, C.
1986. Virulence genes are carried by a megaplasmid of the plant pathogen
Pseudomonas solanacearum . Molecular and General Genetics. 205: 270-275.
Breiman, A. and Galun, E. 1981. Plant protoplasts as tools in quantitative
assays of phytotoxic compounds from culture filtrates of Phytophthora citrophthora.
Physiological Plant Pathology. 19: 181-191.
Brenner, D.J., Fanning, G.R., Leete Knutson, J.K., Steigerwalt, A.G.
and Krichevsky, M.I. 1984. Attempts to classify Herbicola group-Enterobacter
agglomerans strains by deoxyribonucleic acid hybridization and phenotypic tests.
International Journal of Systemic Bacteriology. 34: 45-55.
Brinton, CC. 1959. Non-flagellar appendages of bacteria. Nature. 183: 782-
786.
Brown, B. Wm. Jr. and Hollander, M. 1977. Statistics: A biomedical
introduction. John Wiley and Sons, New York, pp 109-129.
Brown, I.R. and Mansfield, J.W. 1988. An ultrastuctural study, including
cytochemistry and quantitative analyses, of the interactions between pseudomonads
and leaves of Phaseolus vulgaris L. Physiological and Molecular Plant Pathology.
33: 351-376.
Buchanan, G. E. and Starr, M. P. 1980. Phytotoxic material from association
between Erwinia amylovora and pear tissue culture: possible role in necrotic
symptomatology of fire blight disease. Current Microbiology. 4: 63-68.
Buchner, V., Nachmias, A. and Burstein, Y. 1982. Isolation and partial
characterization of a phytotoxic glycopeptide from a protein-lipopolysaccharide
complex produced by a potato isolate of Verticillium dahliae . FEBS letters. 138:
261-264.
Burkholder, W.H. 1948. Genus I Erwinia Winslow et al. In: Bergey's Manual of
Determinative Bacteriology. Breed, R.S, Murray R.G.E. and Hitchens, A.P. (eds.).
Williams and Wilkins Company, Baltimore. 6th edition, p 466.

244
Butcher, D.N. and Ingram, D. S. 1976. Plant tissue culture. Edward Arnold,
London, pp 67.
Cailloux, M. 1984. Plant tissue culture : rapid propagation, induced mutations,
and the potential role of protoplast techniques. In: Crop Breeding - A contemporary
basis. Vose, P. B. and Blixt, S. G. (eds.). Pergamon Press, Oxford, pp 311-346.
Chanabe, C, Burrus, M. and Alibert, G. 1989. Factors affecting the
improvement of colony formation from sunflower protoplasts. Plant Science. 64:
125-132.
Chatterjee, A.K. and Vidaver, A.K. 1986. Genetics of pathogenecity factors :
appplication to phytopathogenic bacteria. Advances in Plant Pathology. Vol. 4.
Academic Press, London, pp 224.
Christie, B.R. 1987. CRC Handbook of plant science in agriculture Vol. II. CRC
Press, Inc., Florida, pp 139-141.
Christofi, N., Wilson, M.I. and Old, D.C. 1979. Fimbriae and
haemagglutinins in Erwinias of the Carotovora group. Journal of Applied
Bacteriology. 46: 179-183.
Centro Internacional de Agricultura Tropical (CIAT). 1982. Cassava
programme - annual report. CIAT, Cali, Colombia, pp 213-228.
Centro Internacional de Agricultura Tropical (CIAT). 1983. Cassava
programme - annual report. CIAT, Cali, Colombia, pp 433-443.
Centro Internacional de Agricultura Tropical (CIAT). 1985. Cassava
programme - annual report, 1984. Working document No.1. CIAT, Cali, Colombia.
pp 197-217.
Centro Internacional de Agricultura Tropical (CIAT). 1988. Cassava
programme - annual report, 1985. Working document No.38. CIAT, Cali, Colombia.
pp 334-360.

245
Cocking, E.C. 1960. A method for the isolation of plant protoplasts and vacuoles.
Nature. 187: 962-963.
Constabel, F. 1984. Callus culture: induction and maintenance. In: Cell culture
and somatic cell genetics of plants. Vasil, I. K. (ed.). Academic press, Orlando,
Florida, pp 27-35.
Cooke, R. and Cock, J. 1989. Cassava crops up again. New Scientist. 122: 37-
42.
Coplin, D.L. 1982. Plasmids in plant pathogenic bacteria. In: Phytopathogenic
Prokaryotes Vol.2. M. S. Mount and G. H. Lacy (eds.). Academic Press, New York, pp
255-280.
Coplin, D.L. 1989. Plasmids and their role in the evolution of plant pathogenic
bacteria. Annual Review of Phytopathology. 27: 187-212.
Coplin, D.L. and Cook, D. 1990. Molecular genetics of extracellular
polysaccharide biosynthesis in vascular phytopathogenic bacteria. Molecular Plant-
Microbe Interactions. 3: 271-279.
Coplin, D.L. and Majerczak, D.R. 1990. Extracellular polysaccharide genes in
Erwinia stewartii: Directed mutagenesis and complementation analysis. Molecular
Plant-Microbe Interactions. 3: 286-292.
Coulibaly, M.Y. and Demarly, Y. 1986. Regeneration of plantlets from
protoplasts of rice, Oryza sativa L. Zeitschrift Pflanzenuchting. 96: 79-81.
Coursey, D.G. 1983. Potential utilization of major root crops, with special
emphasis on human, animal and industrial uses. In: Tropical root crops -
production and uses in Africa. Terry, E. R., Doku, E. V., Arene, 0. B. and Mahungu, N.
M. (eds.). Proceedings of the second triennial symposium of the international society
for tropical root crops. IDRC-221e, Ottawa, Canada, pp 25-35.
Coursey, D.G. and Haynes, R.H. 1970. Root crops and their potential as food in
the tropics. World Crops. 22: 261-265.

246
Coutts, R.H.A. and Wood, K.R. 1977. Improved isolation and culture methods
for cucumber mesophyll protoplasts. Plant Science Letters. 9: 45-51.
Creemers-Molenaar, J., Van Der Valk, P., Loeffen, J.P.M. and Zaal,
M.A.CM. 1989. Plant regeneration from suspension cultures and protoplasts of
Lolium perenne L. Plant Science. 63: 167-176.
D'Amato, F. 1977. Cytogenetics of differentiation in tissue and cell cultures. In:
Plant cell tissue and organ culture. Reinert, J. and Bajaj, Y. P. S. (eds.). New York.
Springer-Verlag. pp 333-356.
De Bruin, G.H. and Fresco, L.O. 1989. The importance of cassava in world food
production. Netherlands Journal of Agricultural Science. 37: 21-34.
de Fossard, R.A., Myint, A. and Lee, E.C.M. 1974. A broad spectrum tissue
culture experiment with tobacco Nicotiana tabacum pith callus tissue. Physiologia
Plantarum. 30: 125-130.
De Graaf, F.K., Klernm, P. and Gaastra, W. 1980. Purification,
characterization, and partial covalent structure of Escherichia coli adhesive antigen
K99. Infection and Immunity. 33: 877-883.
De Graaf, F.K. and Roorda, I. 1982. Production, purification, and
characterization of the fimbrial adhesive antigen F41 isolated from calf
enteropathogenic Escherichia coli strain B41M. Infection and Immunity. 36:
751-758.
de Vries, C.A., Ferwerda, J.D. and Flach, M. 1967. Choice of food crops in
relation to actual and potential production in the tropics. Netherlands Journal of
Agricultural Science. 15 : 241-248.
de Zoeten, G.A., Gaard, G., Haberlach, G.T. and Helgeson, J.P. 1982.
Infection of tobacco callus by Phytopthora parasitica var. nicotianae .
Phytopathology. 72: 743-746.
Daly, J.M. 1984. The role of recognition in plant disease. Annual Review of
Phytopathology. 22: 273-307.

247
Daniels, M.J. 1979. A simple technique for assaying certain microbial
phytotoxins and its application to the study of toxins produced by Spiroplasma citri.
Journal of General Microbiology. 114: 323-328.
Daniels, M.J., Dow, J.M. and Osbourn, A.E. 1988. Molecular genetics of
pathogenicity in phytopathogenic bacteria. Annual Review of Phytopathology. 26:
285-312.
Daphne, P.G. 1980. Cassava. A South African venture. Optimal: 61-68.
Daub, M.E. 1986. Tisssue culture and the selection of resistance to pathogens.
Annual Review of Phytopathology. 24: 159-186.
Davies, P.A., Larkin, P.J. and Tanner, G.J. 1989. Enhanced protoplast
division by media ultrafiltration. Plant Science. 60: 237-244.
Denny, T.P., Makini, F.W. and Brumbley, S.M. 1988. Characterization of
Pseudomonas solanacearum Tn5 mutants deficient in extracellular polysaccharide.
Molecular Plant-Microbe Interactions. 1: 215-223.
Denny, T.P., Carney, B.F. and Schell, M.A. 1990. Inactivation of multiple
virulence genes reduces the ability of Pseudomonas solanacearum to cause wilt
symptoms. Molecular Plant-Microbe Interactions. 3: 293-300.
Dische, Z. 1962. Colour reactions of carbohydrates. Methods in Carbohydrate
Chemistry. 1: 447-512.
Dolezel, J. and Binarova, P. 1989. The effects of colchicine on ploidy level,
morphology and embryogenic capacity of alfalfa suspension cultures. Plant Science.
64: 213-219.
Dons, J.J.M. and Colijn-Hooymans, CM. 1989. Agarose plating of
protoplasts and it's applications. In: Biotechnology in Agriculture and Forestry 8.
Plant protoplasts and genetic engineering I. Bajaj, Y.P.S. (ed.). Springer-Verlag,
New York, pp 50-62.
Duguid, J.P. 1951. The demonstration of bacterial capsules and slime. Journal of
Pathological Bacteriology. 63: 673-685.

248
Duguid, J.P., Smith, I.W., Dempster, G. and Edmunds, P.N. 1955. Non
flagellar filamentous appendages ('fimbriae') and haemagglutinating activity in
Bacterium coli . Journal of Pathological Bacteriology. 70: 335-348.
Durbin, R.D. 1982. Toxins and pathogenesis. In: Phytopathogenic prokaryotes.
Vol.1. Mount, M.S. and Lacy, G.H. (eds.). Academic Press, New York, pp 423-441.
Duvick, J.P. and Sequeira, L. 1984. Interaction of Pseudomonas solanacearum
with suspension cultured tobacco cells and tobacco leaf cell walls in vitro . Applied
and Environmental Microbiology. 48: 199-205.
Dye, D.W. 1969. A taxonomic study of the genus Erwinia 3. The "herbicola "
group. N e w Zealand Journal of Science. 12: 223-236.
Earle, E.D., Gracen, V.E., Yoder, O.C and Gemmill, K.P. 1978.
Cytoplasm-specific effects of Helminthosporium maydis Race T toxin on survival of
corn mesophyll protoplasts. Plant Physiology. 61: 420-424.
Earle, E.D. 1978. Phytotoxin studies with plant cells and protoplasts. In:
Frontiers of Plant Tissue Culture. Thorpe, T.A. (ed.). University of Calgary Press,
Calgary, Alberta, Canada, pp 363-372.
Earle, E.D. 1982. Application of plant tissue culture in the study of host-
pathogen interactions. In: Application of plant cell and tissue culture to agriculture
and industry. Tomes, D.T., Ellis, B.E., Harney, P.M., Kasha, K.J. and Peterson, R.L.
(eds.). University of Guelph, Guelph, Ontario, pp 45-62.
Edwards, G.E., Lilley, R. Mc C, Craig, S. and Hatch, M. 1979. Isolation
of intact and functional chloroplasts from mesophyll and bundle sheath protoplasts of
the C4 plant Panicum miliaceum. Plant Physiology. 63: 821-827.
El-Banoby, F.E. and Rudolph, K. 1977a. A polysaccharide from liquid
cultures of Pseudomonas phaseolicola which specifically induces water-soaking in
bean leaves (Phaseolus vulgaris L.). Phytopathologiese Zeitschrift. 95: 38-50.

249
El-Banoby, F.E. and Rudolph, K. 1977b. Induction of water-soaking in plant
leaves by extracellular polysaccharides from phytopathogenic pseudomonads and
xanthomonads. Physiological Plant Pathology. 15: 341-349.
El-Banoby, F.E. and Rudolph, K. 1980. Purification of extracellular
polysaccharides from Pseudomonas phaseolicola which induce water-soaking in bean
leaves. Physiological Plant Pathology. 16: 425-437.
Eriksson, T., Bonnett, H., Glimelius, K. and Wallin, A. 1974. Technical
advances in protoplast isolation, culture and fusion. In: Tissue culture and plant
science. Street, H. E. (ed.). Academic press, New York, pp 213-231.
Ersek, T., Gaborjanyi, R., Holtzl, P. and Kiraly, Z. 1985. Sugar-specific
attachment of Pseudomonas syringae pv. glycinea to isolated single leaf cells of
resistant soybean cultivars. Phytopathologiese Zeitschrift. 113: 260-270.
Eshdat, Y., Silverblatt, F.J. and Sharon, N. 1981. Dissociation and
reassembly of Escherichia coli type 1 pili. Journal of Bacteriology. 148: 308-
314.
Evans, D.A., Sharp, W.R. and Flick, C. E. 1981. Growth and behaviour of
cell cultures. In: Plant tissue culture - methods and applications in agriculture.
Thorpe, T. A. (ed.). Academic press, New York, pp 45-113.
Evans, D.A. and Bravo, J.E. 1983. Protoplast isolation and culture. In:
Handbook of plant tissue culture. Techniques for propagation and breeding. Evans, D.
A., Sharp, W . R., Ammirato, P. V. and Yamada, Y. (eds.). Macmillan, New York, pp
124-176.
Fader, R.C, Duffy, L.K., Davis, CP. and Kurovsky, A. 1982.
Purification and chemical characterization of type 1 pili isolated from Klebsiella
pneumoniae. Journal of Biological Chemistry. 257: 3301-3305.
Falkenstein, H., Zeiler, W. and Geider, K. 1989. The 29 kb plasmid,
common in strains of Erwinia amylovora, modulates development of fireblight
symptoms. Journal of General Microbiology. 135: 2643-2650.

250
Felker, F.C, Miernyk, J.A. and Crawford, C G . 1989. Characterization of
maize endosperm-derived suspension cells throughout the culture cycle and
enhancement of tissue friability. Plant Cell, Tissue and Organ Culture. 18: 153-
165.
Fett, W.F. and Zaccharius, R.M. 1982. Bacterially induced glyceollin -
production in soybean cell suspension cultures. Plant Science Letters. 24 : 303-
309.
Fett, W.F. and Zaccharius, R.M. 1983. Bacterial growth and elicitation in
soybean cell suspension cultures inoculated with Pseudomonas syringae pathovars.
Physiological Plant Pathology. 22: 151-172.
Fett, W.F. and Dunn, M.F. 1989. Exopolysaccharides produced by
phytopathogenic Pseudomonas syringae pathovars in infected leaves of susceptible
hosts. Plant Physiology. 89: 5-9.
Firon, N., Ofek, I. and Sharon, N. 1983. Carbohydrate specificity of the
surface lectins of Escherichia coli, Klebsiella pneumoniae and Salmonella
typhimurium. Carbohydrate Research. 120: 235-249.
Firon, N., Ofek, I. and Sharon, N. 1984. Carbohydrate-binding sites of the
mannose-specific fimbrial lectins of enterobacteria. Infection and Immunity. 43:
1088-1090.
Frearson, E.M., Power, J.B. and Cocking, E.C. 1973. The isolation, culture
and regeneration of petunia leaf protoplasts. Developmental Biology. 33: 130-
137.
Fuerst, J.A. and Hayward, A.C. 1969. Surface appendages similar to fimbriae
(pili) on Pseudomonas species. Journal of General Microbiology. 58: 227-237.
Fuson, G.B. and Pratt, D. 1988. Effects of the host-selective toxins of
Alternaria alternata f. sp. lycopersici on suspension-cultured tomato cells.
Phytopathology. 78: 1641-1648.
Gaff, D.F. and Okong'o-Ogola, O. 1971. The use of non-permeating pigments
for testing the survival of cells. Journal of Experimental Botany. 22: 756-758.

251
Gahan, P.B. 1989. Viability of plant protoplasts. In: Biotechnology in
Agriculture and Forestry 8. Plant protoplasts and genetic engineering I. Bajaj,
Y.P.S. (ed.). Springer-Verlag, New York, pp 34-49.
Gamborg, O.L., Miller, R.A. and Ojima, K. 1968. Nutrient requirements of
suspension cultures of soybean root cells. Experimental Cell Research. 50: 151-
158.
Gamborg. O.L., Shyluk, J and Kartha, K. K. 1975. Factors affecting the
isolation and callus formation in protoplasts from the shoot apices of Pisum sativum
L. Plant Science Letters. 4: 285-292.
Gamborg, O.L., Shyluk, J.P. and Shahin, E.A. 1981. Isolation, fusion and
culture of plant protoplasts. In: Plant tissue culture: Methods and applications in
agriculture. Thorpe, T. A. (ed.). Academic Press, New York, pp 115-152.
Gamborg, O.L., Murashige, T., Thorpe, T.A. and Vasil, I.K. 1976. Plant
tissue culture media. In Vitro. 12: 473-478.
Gantotti, B.V., Kindle, K.L. and Beer, S.V. 1981. Transfer of the drug
resistance transposon Tn5 to Erwinia herbicola and the induction of insertion
mutations. Current Microbiology. 6: 377-381.
Gantotti, B. V. and Beer, S. V. 1982. Plasmid-borne determinants of
pigmentation and thiamine prototrophy in Erwinia herbicola. Journal of
Bacteriology. 151: 1627-1629.
Gavini, F., Mergaert, J., Beji, A., Mielcarek, C, Izard, D., Kersters,
K. and De Ley, J. 1989. Transfer of Enterobacter agglomerans (Beijerinck
1888) Ewing and Fife 1972 to Pantoea gen. nov. as Pantoea agglomerans comb. nov.
and description of Pantoea dispersa sp. nov. International Journal of Systematic
Bacteriology. 39: 337-345.
Ge, K., Wang, Y., Yuan, X., Huang, P., Yang, J., Nie, Z., Testa, D. and
Lee, N. 1989. Plantlet regeneration from protoplasts isolated from mesophyll
cells of adsuki bean (Phaseolus vulgaris, Wight). Plant Science. 63: 209-216.

252
Gendloff, E.H., Scheffer, R.P. and Somerville, S.C 1987. An improved
bioassay for victorin based on the use of oat protoplasts. Physiological and Molecular
Plant Pathology. 31: 421-427.
Gibbins, L.N. 1978. Erwinia herbicola: A review and perspective. In:
Proceedings of the IV International Conference on Plant Pathogenic Bacteria. Station
de Pathologie Vegetale et phytobacteriologie (ed.). Institut National de la Recherche
Agronomique. pp 403-431.
Goodman, R.N., Huang, J.S. and Huang, Pi-Yu. 1974. Host-specific
phytotoxic polysaccharide from apple tissue infected by Erwinia amylovora.
Science. 183: 1081-1082.
Goodman, R.N. 1987. Indications of a role for amylovorin as a virulence factor of
Erwinia amylovora. In: Plant Pathogenic Bacteria (Proceedings of the Sixth
International Conference on Plant Pathogenic Bacteria, Maryland, 1985). Civerolo,
E. L., Collmer, A., Davis, R.E., and Gillaspie, A. G. (eds.). Martinus Nijhoff
Publishers, Dordrecht, pp 545-550.
Gray, L.E., Guan, Y.Q. and Widholm, J.M. 1986. Reaction of soybean callus
to culture filtrates of Phialophora gregata. Plant Science. 47: 45-55.
Grinsted, J. and Bennett, P.M. 1984. Isolation and purification of plasmid
DNA. Methods in Microbiology. 17: 123-131.
Grout, B.W.W. and Aston, M.J. 1977. Transplanting of cauliflower plants
regenerated from meristem culture.1. Water loss and water transfer related to
changes in leaf wax and xylem regeneration. Horticultural Research. 17: 1-7.
Hahn, S.K. 1982. Research priorities, techniques and accomplishments in cassava
breeding at IITA. In: Root crops in Eastern Africa. Proceedings of a workshop held
in Kigali, Ruanda. IDRC-177e, Ottawa, Canada, pp 19-22.
Hall, R.H., Maneval, D.R., Collins, J.H., Theibert, J.L. and Levine,
M.M. 1989. Purification and analysis of colonization factor antigen 1, coli surface
antigen 1, and coli surface antigen 3 fimbriae from enterotoxigenic Escherichia coli.
Journal of Bacteriology. 171: 6372-6374.

253
Hancock, I.C and Poxton, I.R. 1988. Bacterial Cell Surface Techniques. John
Wiley and Sons, Chichester, pp 329.
Handa, A.K., Bressan, R.A., Park, M.L. and Hasegawa, P.M. 1982. Use of
plant cell cultures to study production and phytotoxicity of Alternaria solani
toxin(s). Physiological Plant Pathology. 21: 295-309.
Harms, CT. 1984. The multiple drop array (MDA) screening technique. In: Cell
culture and somatic cell genetics of plants. Vasil, I. K. (ed.). Academic Press,
Orlando, Florida, pp 213-220.
Harris, R.H. and Mitchell, R. 1973. The role of polymers in microbial
aggregation. Annual Review of Microbiology. 27: 27-50.
Hartman, C.L., Secor, G.A., Venette, J.R. and Albaugh, D.A. 1986.
Response of bean calli to filtrate from Pseudomonas syringae pv. phaseolicola and
correlation with whole plant disease reaction. Physiological and Molecular Plant
Pathology. 28: 353-358.
Heckels, J.E. and Virji, M. 1988. Pili (fimbriae). In: Bacterial Cell Surface
Techniques. Hancock, I.C. and Poxton, I.R. (eds.). John Wiley and Sons, Chichester.
pp 67-72.
Helgeson, J.P. 1980. Plant tissue and cell suspension culture. In: Tissue
culture methods for plant pathologists. Ingram, D. S. and Helgeson, J. P. (eds.).
Blackwell Scientific, London, pp 19-25.
Helgeson, J.P. 1983. Studies of host-pathogen interactions in vitro. In: Use of
tissue culture and protoplasts in plant pathology. Helgeson, J.P. and Deverall, B.J.
(eds.). Academic Press, North Ryde, N S W . pp 9-38.
Henshaw, G.G., Jha, K.K., Mehta, A.R., Shakeshaft, D.J. and Street, H.E.
1966. Studies on the growth in culture of plant cells. Journal of Experimental
Botany. 17: 362-377.
Hignett, R.C. and Roberts, A.L. 1985. A possible regulatory function for
bacterial outer surface components in fireblight disease. Physiological Plant
Pathology. 27: 235-243.

254
Hignett, R.C. 1988. Effects of growth conditions on the surface structures and
extracellular products of virulent and avirulent forms of Erwinia amylovora.
Physiological and Molecular Plant Pathology. 32: 387-394.
Hsu, S-T. and Goodman, R.N. 1978. Production of a host-specific wilt -
inducing toxin in apple cell suspension cultures inoculated with Erwinia amylovora.
Phytopathology. 68: 351-354.
Hsu, T-S. and Goodman, R.N. 1978. Agglutinating activity in apple cell
suspension cultures inoculated with a virulent strain of Erwinia amylovora.
Phytopathology. 68: 355-360.
Hu, CY. and Wang, P.J. 1983. Meristem shoot tip and bud cultures. In:
Handbook of plant cell culture: techniques of propagation and breeding. Evans, D. A.,
Sharpe, W . R., Ammirato, P. V. and Yamada, Y. (eds.). Macmillan, New York, pp
177-227.
Huang, J-S. and Van Dyke, G.G. 1978. Interaction of tobacco callus tissue with
Pseudomonas tabaci, P. pisi, and P. fluorescens . Physiological Plant Pathology.
13: 65-72.
Huang, Y., Helgeson, J.P. and Sequeira, L. 1989. Isolation and purification
of a factor from Pseudomonas solanacearum that induces a hypersensitive - like
response in potato cells. Molecular Plant-Microbe Interactions. 3: 132-138.
Huang, Y., Peilin, X. and Sequeira, L. 1990. A second cluster of genes that
specify pathogenicity and host responses in Pseudomonas solanacearum. Molecular
Plant-Microbe Interactions. 3: 48-53.
Hunt, G. J. and Helgeson, J. P. 1989. A medium and simplified procedure for
growing single cells from Solanum species. Plant Science. 60: 251-257.
Imbrie-Milligan, C W. and Hodges, T.K. 1986. Microcallus formation from
maize protoplasts prepared from embryogenic callus. Planta. 168: 395-401.
Ingram, D. S. 1980. Tissue culture methods in plant pathology. In: Tissue
culture methods for plant pathologists. Ingram, D. S. and Helgeson, J. P. (eds.).
Blackwell scientific, London, pp 3-9.

255
Isaacson, R.E. 1977. K99 surface antigen of Escherichia coli: Purification and
partial characterization. Infection and Immunity. 15: 272-279.
Isaacson, R.E. 1980. Factors affecting expression of the Escherichia coli pilus
K99. Infection and Immunity. 28: 190-194.
Isaacson, R.E. and Richter, P. 1981. Escherichia coli 987P pilus:
purification and partial characterization. Journal of Bacteriology. 146: 784-789.
Ishimaru, CA., Klos, E.J. and Brubaker, R.R. 1988. Multiple antibiotic
production by Erwinia herbicola. Phytopathology. 78: 746 -750.
Ishii, S. 1989. Enzymes for the isolation of protoplasts. In: Biotechnology in
Agriculture and Forestry 8. Plant protoplasts and genetic engineering I. Bajaj,
Y.P.S. (ed.). Springer-Verlag, New York, pp 23-33.
Jann, K., Jann, B. and Schmidt, G. 1981. SDS polyacrylamide gel
electrophoresis and serological analysis of pili from Escherichia coli of different
pathogenic origin. F E M S Microbiology Letters. 11: 21-25.
Jacques, M., Gottschalk, M., Foiry, B. and Higgins, R. 1990.
Ultrastructural study of surface components of Streptococcus suis. Journal of
Bacteriology. 172: 2833-2838.
Jeannes, A., Rogovin, P., Cadmus, M.C, Silman, R.W. and Knutson, C.A.
1976. Polysaccharide (Xanthan) of Xanthomonas campestris N R R L B-1459:
Procedures for culture maintenance and polysaccharide production, purification and
analysis. Agricultural Research Service. U.S. Department of Agriculture. ARS-NC-
51. pp 14.
Jennings, D. L. 1970. Cassava in Africa. Field Crop Abstracts. 23: 271-278.
Jones, G.W. and Isaacson, R.E. 1983. Proteinaceous bacterial adhesins and
their receptors. C R C Critical Reviews in Microbiology. 10: 229 - 260.
Kado, Cl. and Liu, S.-T. 1981. Rapid procedure for detection and isolation of
large and small plasmids. Journal of Bacteriology. 145: 1365-1373.

256
Kaiser, W.J. and Teemba, L.A. 1979. Use of tissue culture and thermotherapy
to free East African cassava cultivars of african cassava mosaic and cassava brown
streak diseases. Plant Disease Reporter. 63: 780-784.
Kanai, R. and Edwards, G.E. 1973. Purification of enzymatically isolated
mesophyll protoplasts from C3, C4 and crassulacean acid metabolism plants using an
aqueous dextran-polyethylene glycol two-phase system. Plant Physiology. 52 :
484-490.
Kao, K.N. and Michayluk, M.R. 1980. Plant regeneration from mesophyll
protoplasts of alfalfa. Zeitschrift fur Pflanzenphysiologie. 96: 135-141.
Kartha, K.K., Gamborg, O.L., Constabel, F. and Shyluk, J.P. 1974a.
Regeneration of cassava plants from apical meristems. Plant Science Letters. 2:
107-113.
Kartha, K.K., Michayluk, M.R., Kao, K.N., Gamborg, O.L. and Constabel,
F. 1974b. Callus formation and plant regeneration from mesophyll protoplasts of
Rape plants (Brassica napus L cv Zephyr). Plant Science Letters. 3: 265-271.
Kartha, K.K. and Gamborg, O.L. 1975. Elimination of cassava mosaic disease
by meristem tip culture. Phytopathology. 65: 826-828.
Kartha, K.K., Pahl, K., Leung, N.L. and Mroginski, L.A. 1981. Plant
regeneration from meristems of grain legumes soybean, cowpea, peanut, chickpea
and bean. Canadian Journal of Botany. 59: 1671-1679.
Kassanis, B. 1957. The use of tissue cultures to produce virus-free clones from
infected potato varieties. Annals of Applied Biology. 45: 422-427.
Keen, N.T. and Staskawicz, B. 1988. Host range determinants in plant
pathogens and symbionts. Annual Review of Microbiology. 42: 421-440.
Keller, W.A., Setterfield, G., Douglas, G., Gleddie, S. and Nakamura, C.
1982. Production, characterization and utilization of somatic hybrids of higher
plants. In: Application of plant cell and tissue culture to agriculture and industry.
Tomes, D. T., Ellis, B. E., Harney, P. M., Kasha, K. J. and Peterson, R. L (eds.).
University of Guelph, Guelph. pp 81-114.

2
Kenne, L. and Lindberg, B. 1983. Bacterial polysaccharides. In: The
Polysaccharides Vol. 2. Aspinall. G.O. (ed.). Academic Press, New York, pp 287-
363.
Keppler, L.D. and Novacky, A. 1987. The initiation of lipid peroxidation
during bacteria-induced hypersensitive reaction. Physiological and Molecular Plant
Pathology. 30: 233-245.
Keppler, L.D., Atkinson, M.M. and Baker, CJ. 1988. Plasma membrane
alteration during bacteria-induced hypersensitive reaction in tobacco suspension
cells as monitored by intracellular accumulation of fluorescein. Physiological and
Molecular Plant Pathology. 32: 209-219.
Kerr, A. 1987. The impact of molecular genetics on plant pathology. Annual
Review of Phytopathology. 25: 87-100
King, P.J., Mansfield, K.J. and Street, H.E. 1972. Control of growth and
cell division in plant cell suspension cultures. Canadian Journal of Botany. 51:
1807-1823.
King, P.J. and Street, H.E. 1977. Growth patterns in cell cultures. In: Plant
tissue and cell culture. Street, H. E.( ed.). Blackwell Scientific, Oxford, pp 307-
387.
King, P.J. 1980. Cell proliferation and growth in suspension cultures.
International Review of Cytology. IIA: 25-53.
King, P.J. 1984. Induction and maintenance of cell suspension cultures. In: Cell
culture and somatic cell genetics of plants. Vasil, I. K. (ed.). Academic press,
Orlando, Florida, pp 130 - 138.
Kitson, F.G. and Larsen, B.S. 1990. Capillary GC/MS for the analysis of
biological materials. In: Mass spectrometry of biological materials. McEwen, C N .
and Larsen, B.S. (eds.). Marcel Dekker, Inc.New York, Basel, pp 437-468.
Kobza, J., Moore, B.D. and Seemann, J.R. 1989. Isolation of
photosynthetically active protoplasts and intact chloroplasts from Phaseolus
vulgaris. Plant Science. 65: 177-182.

258
Korhonen, T.K., Nurmiaho, E-L., Ranta, H. and Svanborg Eden, C
1980. N e w method for isolation of immunologically pure pili from Escherichia coli.
Infection and Immunity. 27: 569-575.
Kubek, D.J. and Shuler, M.L. 1978. On the generality of methods to obtain
single-cell suspension cultures. Canadian Journal of Botany. 56: 2521-2527.
Laemmli, U.K. 1970. Cleavage of structural proteins during the assembly of the
head protein of bacteriophage T4. Nature. 227: 680-685.
Lane, W.D. 1979a. Influence of growth regulators on root and shoot initiation
from flax meristem tips and hypocotyl in vitro. Physiologia Plantarum. 45: 260-
264.
Lane, W.D. 1979b. In vitro propagation of Spiraea bumalda and Prunus cistena
from shoot apices. Canadian Journal of Plant Science. 59: 1025-1029.
Larkin, P.J. 1976. Purification and viability determinations of plant
protoplasts. Planta. 128: 213-216.
Laurent, J., Barny, M-A., Kotoujansky, A., Dufriche, P. and Vanneste,
J.L. 1989. Characterization of a ubiquitous plasmid in Erwinia amylovora.
Molecular Plant-Microbe Interactions. 2: 160-164.
Lawrence, W.A. and Davies, D.R. 1985. A method for the micro-injection of
protoplasts at very low densities. Plant Cell Reports. 4: 33-35.
Leifert, C, Waites, W.M. and Nicholas, J.R. 1989. Bacterial contaminants
of micropropagated plant cultures. Journal of Applied Bacteriology. 67: 353-361.
Lozano, J.C. 1972. Status of virus and mycoplasma like diseases of cassava. In:
IDRC/IITA. Cassava mosaic workshop. Proceedings, pp 2-12. IITA, Ibadan, Nigeria.
Lozano, J.C. and Booth, R.H. 1974. Diseases of cassava (Manihot esculenta
Crantz.). PANS. 20: 30-54.

259
Lozano, J.C 1977. Cassava ( Manihot esculenta Crantz). In: Plant health and
quarantine in international transfer of genetic resources. Hewitt, W. B. and
Chiarappa, L. (eds.). C R C Press, Cleveland, Ohio, pp 103-109.
Lozano, J.C, Byrne, D. and Beilotti, A. 1980. Cassava/Ecosystem
relationships and their influence on breeding strategy. Tropical Pest Management.
26: 180-187.
Mabanza, J. and Jonard, R. 1983. L'isolement et le development in vitro des
protoplasts de Manioc (Manihot esculenta Crantz). Compte Rendus De La Societe De
Biologie De Montpelier. 177: 638-645.
Maheshwari, S.C, Gill, R., Maheshwari, N. and Gharyal, P.K. 1986.
Isolation and regeneration of protoplasts from higher plants. In: Differentiation of
protoplasts and transformed plant cells. Reinert, J. and Binding, H. (eds.).
Springer-Verlag, Berlin, pp 3-35.
Marcus, L. and Schejter, A. 1983. Single step chromatographic purification
and characterization of the endopolygalacturonases and pectinesterases of the fungus
Botrytis cinerea Pers. Physiological Plant Pathology. 22: 1-13.
Marmur, J. 1961. A procedure for the isolation of DNA from microorganisms.
Journal of Molecular Biololgy. 3: 208-218.
Martinez-Lopez, G. 1979. American virus and mycoplasma diseases of cassava.
In: Cassava protection workshop. Proceedings. CIAT, Cali, Colombia, pp 85-93.
Matthysse, A.G. 1983. The use of tissue culture in the study of crown gall and
other bacterial diseases. In: Use of tissue culture and protoplasts in plant
pathology. Helgeson, J. P. and Deverall. B. J. (eds.). Academic press, North Ryde,
N e w South Wales, pp 39-67.
Matthysse, A.G. 1987. Surface interactions between gram negative bacteria and
plants. In: Molecular Determinants of Plant Diseases. Nishimura, S., Vance, C. and
Doke, N. (eds.). Japan Science Society Press, Tokyo/Springer-Verlag, Berlin, pp
97-115.

260
Mazzucchi, U., Gasperini, C , Noli, E. and Medeghini Bonatti, P. 1988.
Increase in free space solutes in tobacco leaves in relation to the localized cellular
response following injections of a bacterial protein-lipopolysaccharide complex.
Journal of Phytopathology. 121: 193-208.
Mazzucchi, U., El-Banoby, F.E. and Rudolph, K. 1984. Inhibition of the
hypersensitive reaction in tobacco leaves by extracellular polysaccharides from
phytopathogenic pseudomonads. Phytopathologiese Zeitschrift. 111: 203-208.
McMichael, J.C. and Ou, J.T. 1979. Structure of common pili from
Escherichia coli. Journal of Bacteriology. 138: 969-975.
Mellor, F.C. and Stace-Smith, R. 1969. Development of excised potato buds in
nutrient culture. Canadian Journal of Botany. 47: 1617-1621.
Michayluk, M.R. and Kao, K.N. 1975. A comparitive study of sugars and sugar
alcohols on cell regeneration and sustained cell division in plant protoplasts.
Zeitschrift fur Pflanzenphysiologie. 75: 181-185.
Minsavage, G.V., Dahlbeck, D., Whalen, M.C, Kearney, B., Bonas, U.,
Staskawicz, B.J. and Stall, R.E. 1990. Gene-for-gene relationships
specifying disease resistance in Xanthomonas campestris pv. vesicatoria - pepper
interactions. Molecular Plant-Microbe Interactions. 3: 41-47.
Mitchell, R.E. 1984. The relevance of non-host-specific toxins in the expression
of virulence by pathogen. Annual Review of Phytopathology. 22: 215-245.
Mize, CW. and Chun, Y.W. 1988. Analysing treatment means in plant tissue
culture research. Plant cell, Tissue and Organ culture. 13: 201-217.
Mooi, F.R. and De Graaf, F.K. 1979. Isolation and characterization of K88
antigens. F E M S Microbiology Letters. 5: 17-20.
Morris, P. and Fowler, M.W. 1981. A new method for the production of fine
plant suspension cultures. Plant Cell, Tissue and Organ Culture. 1: 15-24.
Muhlbach, H.P. 1982. Plant cell cultures and protoplasts in plant virus
research. Current Topics in Microbiology. 99: 81-122.

261
Murashige, T. and Skoog, F. 1962. A revised medium for rapid growth and
bioassays with tobacco tissue cultures. Physiologia Plantarum. 15: 473-497.
Murashige, T. 1974. Plant propagation through tissue cultures. Annual Review
of Plant Physiology. 25: 135-166.
Murashige, T. 1979. Plant tissue culture and it's importance to agriculture. In:
Practical tissue culture applications. Maramorosch, K. and Hirumi, H. (eds.).
Academic press, New York, pp 27-44.
Nagata, T. and Takebe, I. 1971. Plating of isolated tobacco mesophyll
protoplasts on agar medium. Planta. 99: 12-20.
Nagata, T. and Melchers, G. 1978. Surface charge of protoplasts and their
significance in cell-cell interaction. Planta. 142: 235-238.
Nair, N.G., Kartha, K.K. and Gamborg, O.L. 1979. Effect of growth
regulators on plant regeneration from shoot apical meristems of cassava and on the
culture of internodes in vitro. Zeitschrift fur Pflanzenphysiologie. 95: 51-56.
Narayanaswamy, S. 1977. Regeneration of plants from tissue culture. In:
Applied and fundamental aspects of plant cell, tissue and organ culture. Reinert, J.
and Bajaj, Y. P. S. (eds.). Springer, Berlin, pp 179-206.
Niedz, R.P., Rutter, S.M., Handley, L.W. and Sink, K.C 1985. Plant
regeneration from leaf protoplasts of six tomato cultivars. Plant Science. 39:
199-204.
Norelli, J.L., Aldwinckle, H.S. and Beer, S.V. 1988. Virulence of Erwinia
amylovora strains to Malus sp. Novole plants grown in vitro and in the greenhouse.
Phytopathology. 78: 1292-1297.
Old, D.C and Duguid, J.P. 1970. Selective outgrowth of fimbriate bacteria in
static medium. Journal of Bacteriology. 103: 447-456.
Osbourn, A.E., Clarke, B.R. and Daniels, M.J. 1990. Identification and DNA
sequence of a pathogenicity gene of Xanthomonas campestris pv. campestris .
Molecular Plant-Microbe Interactions. 3: 280-285.

262
Ottow, J.C.G. 1975. Ecology, physiology and genetics of fimbriae and pili. Annual
Review of Microbiology. 29: 79-108.
Panopoulos, N.J. and Peet, R.C. 1985. The molecular genetics of plant
pathogenic bacteria and their plasmids. Annual Review of Phytopathology. 23:
381-419.
Paranchych, W. and Frost, L.S. 1988. The physiology and biochemistry of
pili. Advances in Microbial Physiology. 29: 53-114.
Partanen, CR. 1981. Filter paper as a support and carrier for plant protoplast
cultures. In Vitro. 17: 77-80.
Pavlovkin, J., Novacky, A. and Ullrich-Eberius, C.l. 1986. Membrane
potential changes during bacteria-induced hypersensitive reaction. Physiological
and Molecular Plant Pathology. 28: 125-135.
Pelcher, L.E., Gamborg, O.L. and Kao, K.K. 1974. Bean mesophyll
protoplasts: production, culture and callus formation. Plant Science Letters. 3:
107-111.
Perreaux, D., Maraite, H. and Meyer, J.A. 1982. Identification of 3
(methylthio) propionic acid as a blight inducing toxin produced by Xanthomonas
campestris pv. manihotis in vitro. Physiological Plant Pathology. 20: 313-319.
Perreaux, D., Maraite, H. and Meyer, J.A. 1986. Detection of 3
(methylthio) propionic acid in cassava leaves infected by Xanthmonas campestris
pv. manihotis . Physiological and Molecular Plant Pathology. 28: 323-328.
Peterson, J.F. and Yang, A.F. 1976. Characterization studies of cassava mosaic
agents: In: Report on the African Cassava Mosaic workshop, Muguga, Kenya. Nestel,
B. L (ed.). IDRC. Ottawa, Canada, pp 17-26.
Philips, T.P. 1974. Cassava utilisation and potential markets. IDRC, Ottawa,
Canada, pp 5-73.
Pollock, K., Barfield, D.G. and Shields, R. 1983. The toxicity of antibiotics
to plant cell cultures. Plant Cell Reports. 2: 36-39.

263
Poole, G.D. 1989. Antibodies in blood group serology. In: Antibodies: Volume II.
A practical approach. Catty, D. (ed.). IRL Press, Oxford, pp 1-10.
Powell, D.A. 1979. Structure, solution properties and biological interactions of
some microbial extracellular polysaccharides. In: Microbial polysaccharides and
polysaccharases. Berkeley, R.C.W., Gooday, G.W., Ellwood, D.C. (eds.). Academic
Press, London, pp 117-160.
Power, J.B. and Cocking, E.C. 1969. A simple method for the isolation of very
large numbers of leaf protoplasts by using mixtures of cellulase and pectinase.
Biochemistry Journal. 111: 33.
Quak, F. 1977. Meristem culture and virus-free plants. In: Applied and
fundamental aspects of plant cell, tissue and organ culture. Reinert, J. and Bajaj, Y.
P. S. (eds.). Springer-Verlag, Berlin, pp 598-615.
Raldugina, G.N. and Smolenskaya, I.N. 1984. Analysis of the growth of sugar
beet cell culture of cotyledon origin in a liquid nutrient medium. Soviet Journal of
Plant Physiology. 30: 885-891.
Rathore, K.S. and Goldsworthy, A. 1985a. Electrical control of growth in
tissue cultures. Biotechnology. 3: 253-254.
Rathore, K.S. and Goldsworthy, A. 1985b. Electrical control of shoot
regeneration in plant tissue cultures. Biotechnology. 3: 1107-1109.
Ratushnyak, Y.I., Piven, N.M. and Rudas, V.A. 1989. Protoplast culture
and plant regeneration in Lycium barbarum L. Plant Cell, Tissue and Organ Culture.
18: 167-179.
Read, R. 1989. Bacteria with a sticky touch. New Scientist. 124: 22-25.
Reinert, J. and Yeoman, M.M. 1982. Plant cell and tissue culture - a
laboratory manual. Springer-Verlag, Berlin, pp 12-17.
Reporter, M. 1984. Cocultures of plant and bacterial cells. In: Cell culture and
somatic cell genetics of plants. Vasil, I.K.( ed.). Academic Press, Orlando, Florida.
pp 587-597.

264
Rickauer, M., Fournier, J. and Esquerre-Tugaye, M-T. 1989. Induction
of proteinase inhibitors in tobacco cell suspension culture by elicitors of
Phytophthora parasitica var. nicotianae. 90: 1065-1070.
Robeson, D.J. and Cook, D.R. 1985. Production of low molecular weight
carboxylic acids by Xanthomonas campestris pv. campestris in relation to the amino
acid composition of the medium and their possible involvement in pathogenesis.
Physiological Plant Pathology. 26: 219-230.
Roca, W.M. 1984. Cassava. In: Handbook of plant cell culture. Volume 2. Crop
species. Sharp, W . R., Evans, D. A., Ammirato, P. V. and Yamada, Y. (eds.).
Macmillan, N e w York, pp 269-301.
Rudolph, K. 1976. Non-specific toxins. In: Physiological Plant Pathology.
Heitefuss, R. and Williams, P. H. (eds.). Springer-Verlag, Berlin, pp 247-265.
Rudolph, K. and Mendgen, K. 1985. Multiplication of Pseudomonas syringae
pv. phaseolicola "in planta" II. Characterization of susceptible and resistant
reactions by light and electron microscopy compared with bacterial countings.
Phytopathologiese Zeitschrift. 113: 200-212.
Rudolph, K., El-Banoby, F. and Gross, M. 1987. Effects of extracellular
polysaccharides on bacterial multiplication 'in planta '. In: Plant Pathogenic
Bacteria (Proceedings of the Sixth International Conference on Plant Pathogenic
Bacteria, Maryland, 1985). Civerolo, E. L., Collmer, A., Davis, R.E. and Gillaspie,
A. G. (eds.). Martinus Nijhoff Publishers, Dordrecht, pp 597-598.
Rutter, P.R. and Vincent, B. 1984. Physiochemical interactions of the
substratum, microorganisms and the fluid phase. In: Microbial adhesion and
aggregation. Marshall, K.C. (ed.). Springer-Verlag, Berlin, pp 21-38.
Salit, I.E. and Gotschlich, E.C. 1977. Haemagglutination by purified type 1
Escherichia coli pili. Journal of Experimental Medicine. 146: 1169-1181.
Sambrook, J., Fritsch, E.F. and Maniatis, T. 1989. Molecular Cloning. 2.
Cold Spring Harbor Laboratory Press, Cold Spring Harbour. 2nd Edition. Section
6.3.

265
Sambrook, J., Fritsch, E.F. and Maniatis, T. 1989. Molecular Cloning. 3.
Cold Spring Harbor Laboratory Press, Cold Spring Harbour. 2nd Edition. Section
E.5.
Scheffer, R.P. 1976. Forces by which the pathogen attacks the host plant. In:
Physiological Plant Pathology. Heitefuss, R. and Williams, P. H. (eds.). Springer-
Verlag, Berlin, pp 270-301.
Schenk, R.U. and Hildebrandt, A.C. 1972. Medium and techniques for
induction and growth of monocotyledonous and dicotyledonous plant cell cultures.
Canadian Journal of Botany. 50: 199-204.
Seif, A.A. and Chogoo, P. 1976. Cassava in Kenya. In: African cassava mosaic,
Report on an interdisciplinary workshop. Nestel, B. L. (ed.). IDRC, Ottawa, pp 39-
44.
Selva, E., Stouffs, B. and Briquet, M. 1989. In vitro propagation of Vicia
faba L. by micro-cutting and multiple shoot induction. Plant Cell, Tissue and Organ
Culture. 18: 167-179.
Sequeira, L., Gaard, G., and deZoeten, G.A. 1977. Interaction of bacteria and
host cell walls: it's relation to mechanisms of induced resistance. Physiological
Plant Pathology. 10: 43-50.
Sequeira, L. 1984. Recognition systems in plant-pathogenic interactions.
Biological Cell. 51: 281 - 286.
Shabde, M. and Murashige, T. 1977. Hormonal requirements of excised
Dianthus caryophyllus L. shoot apical meristems in vitro. American Journal of
Botany. 64: 443-448.
Shahin, E.A. and Shepard, J.F. 1980. Cassava mesophyll protoplasts :
isolation, proliferation and shoot formation. Plant Science Letters. 17: 459-465.
Shepard, J.F. and Totten, R.E. 1977. Mesophyll cell protoplasts of potato :
Isolation, proliferation and plant regeneration. Plant Physiology. 60: 313-316.

266
Shepard, J.F., Bidney, D. and Shahin, E.A. 1980. Potato protoplasts in crop
improvement. Science. 208: 17-24.
Shohet, S. and Strange, R.N. 1989. Use of isolated cells and protoplasts to
detect phytotoxic activity in cultures of Phytopthora drechsleri f.sp. cajani.
Physiological and Molecular Plant Pathology. 34: 345-359.
Sijam, K., Karr, A.L., and Goodman, R.N. 1983. Comparison of the
extracellular polysaccharide produced by Erwinia amylovora in apple tissue and
culture medium. Physiological Plant Pathology. 22: 221-231.
Sijam, K., Goodman, R.N. and Karr, A.L. 1985. The effect of salts on the
viscosity and wilt-inducing capacity of the capsular polysaccharide of Erwinia
amylovora. Physiological Plant Pathology. 26: 231-239.
Sing, V.O. and Schroth. M.V. 1977. Bacterial-plant cell surface interactions:
active immobilization of saprophytic bacteria in plant leaves. Science. 197: 759-
761.
Sjodin, C, Nyhammar, T. and Glimelius, K. 1988. Effects of toxic
metabolites produced by Phoma lingam (Tode ex Fr.) Desm. on protoplasts, cells and
plants of hosts and non-hosts of the pathogen. Physiological and Molecular Plant
Pathology. 32: 301-312.
Sjulin, T.M. and Beer, S.V. 1978. Mechanism of wilt induction by amylovorin
in cotoneaster shoots and its relation to wilting of shoots infected by Erwinia
amylovora. Phytopathology. 68: 89-94.
Skoog, F. and Miller, CO. 1957. Chemical regulation of growth and organ
formation in plant tissues cultured in vitro. Symposia for the Society of
Experimental Biology. 11: 118-130.
Slade, M.B. and Tiffin, A.l. 1984. Biochemical and serological
characterization of Erwinia. Methods in Microbiology. 15: 227-293.
Sleytr, U.B., Messner.P., Minnikin, D.E., Heckels, V.E. and Virji, M.
1988. Structure of bacteria and their envelopes. In: Bacterial cell surface
techniques. Hancock, I. and Poxton, I. (eds.). Wiley and Sons, Chichester, pp 1-30.

267
Smith, M.K., Biggs, B.J. and Scott, K.J. 1986a. Cassava tissue culture
research in Australia. Cassava Newsletter. 10: 6-7.
Smith, M.K., Biggs, B.J. and Scott, K.J. 1986b. In Vitro propagation of
cassava Manihot esculenta Crantz. Plant Cell, Tissue and Organ Culture. 6: 221-
228.
Stall, R.E. and Cook, A.A. 1979. Evidence that bacterial contact with the plant
cell is necessary for the hypersensitive reaction but not the susceptible reaction.
Physiological Plant Pathology. 14: 77-84.
Stall, R.E. 1987. Plasmid specified host specificity in Xanthomonas campestris
pv. vesicatoria. In: Sixth International Conference on Plant Pathogenic Bacteria
(College Park, Maryland, 1985). Civerolo, E.L., Collmer, A., Davis, R.E. and
Gillaspie, A.G. (eds.). Martinus Nijhoff, Dordrecht, pp 1042-1050.
Stamp, J.A. and Henshaw, G.G. 1982. Somatic embryogenesis in cassava.
Zeitschrift fur Pflanzenphysiologie. 105: 183-187.
Stamp, J.A. and Henshaw, G.G. 1987. Secondary somatic embryogenesis and
plant regeneration in cassava. Plant Cell, Tissue and Organ culture. 10: 227-233.
Stephens, G.J. and Wood, R.K.S. 1975. Killing of protoplasts by soft-rot
bacteria. Physiological Plant Pathology. 5: 165-181.
Strange, R.N., Pippard, D.J., and Strobel, G.A. 1982. A protoplast assay
for phytotoxic metabolites produced by Phytophthora drechsleri in culture.
Physiological Plant Pathology. 20: 359-364.
Street, H.E. 1977. Plant cell culture. In: The molecular biology of plant cells.
Smith, H. (ed.). Blackwell Scientific Publications, Oxford, pp 393-417.
Street, H.E. and Henshaw, G.G. 1963. Cell division and differentiation in
suspension cultures of higher plant cells. Symposia for the Society of Experimental
Biology. 17: 234-256.
Strobel, G.A. 1977. Bacterial phytotoxins. Annual Review of Microbiology. 31:
205-224.

268
Suhayda, C G . and Goodman, R.N. 1981. Early proliferation and migration and
subsequent xylem occlusion by Erwinia amylovora and the fate of its extracellular
polysaccharide (EPS) in apple shoots. Phytopathology. 71: 697-707.
Sutherland, I.W. 1985. Biosynthesis and composition of gram-negative bacterial
extracellular and wall polysaccharides. Annual Review of Microbiology. 39: 243-
270.
Takahashi, S. and Nagano, Y. 1984. Rapid procedure for isolation of plasmid
D N A and application to epidemiological analysis. Journal of Clinical Microbiology.
20: 608-613.
Takebe, I., Otsuki, Y. and Aoki, S. 1968. Isolation of tobacco mesophyll cells
in an active and intact state. Plant Cell Physiology. 9: 115-124.
Takebe, I., Labib, G., and Melchers, G. 1971. Regeneration of whole plants
from isolated mesophyll protoplasts of tobacco. Naturwissenschaften. 58: 318-
320.
Takebe, I. 1975. The use of protoplasts in plant virology. Annual Review of
Phytopathology. 13: 105-125.
Tal, M. and Watts, J.W. 1979. Plant growth conditions and yield of viable
protoplasts isolated from leaves of Lycopersicon esculentum and L peruvianum.
Zeitschrift fur Pflanzenphysiologie. 92: 207-214.
Thanutong, P., Furusawa, I. and Yamamoto, M. 1983. Resistant tobacco
plants from protoplast-derived calluses selected for their resistance to Pseudomonas
and Alternaria toxins. Theoretical and Applied Genetics. 66: 209-215.
Thompson, J.A., Abdullah, R. and Cocking, E.C. 1986. Protoplast culture of
rice (Oryza sativa L.) using media solidified with agarose. Plant Science. 47: 123-
133.
Thorpe, T.A. 1980. Organogenesis in vitro : Structural, Physiological, and
biochemical aspects. International Review of Cytology. Supplement 11 A: 71-111.

269
Thorpe, T.A. 1982. Callus organization and de novo formation of shoot, roots and
embryos in vitro. In: Application of plant cell and tissue culture to agriculture and
industry. Tomes, D. T.t Ellis, B. E., Harney, P. M., Kasha, K. J. and Peterson, R. L.
(eds.). University of Guelph, 1982. Guelph. pp 115-138.
Tilquin, J.P. 1979. Plant regeneration from stem callus of cassava. Canadian
Journal of Botany. 57: 1761-1763.
Torres-Cabassa, A., Gottesman, S., Frederick, R.D., Dolph, P.J. and
Coplin, D.L. 1987. Control of extracellular polysaccharide synthesis in Erwinia
stewartii and Escherichia coli K-12: a common regulatory function. Journal of
Bacteriology. 169: 4525-4531.
Torrey, J.G. and Reinert, J. 1961. Suspension cultures of higher plant cells
in synthetic media. Plant Physiology. 36: 483-491.
Troy, F.A. 1979. The chemistry and biosynthesis of selected bacterial capsular
polymers. Annual Review of Microbiology. 33: 519-560.
Uchimiya, H. and Murashige, T. 1974. Evaluation of the parameters in the
isolation of viable protoplasts from cultured tobacco cells. Plant Physiology. 54:
936-944.
Umetsu, N., Ojima, K. and Matsuda, K. 1975. Enhancement of cell
separation by colchicine in cell suspension cultures of soybean. Planta. 125: 197-
200.
Van Alfen, N.K. and Allard-Turner, V. 1979. Susceptibility of plants to
vascular disruption by macromolecules. Plant Physiology. 63: 1072-1075.
Van Alfen, N.K. 1989. Reassessment of plant wilt toxins. Annual Review of
Phytopathology. 27: 533-550.
Van Den Mooter, M., Maraite, H., Meiresonne, L., Swings, J., Gillis,
M., Kersters, K., and De Ley, J. 1987. Comparison between Xanthomonas
campestris pv. manihotis (ISPP list 1980) and X . campestris pv. cassavae (ISPP
list 1980) by means of phenotypic, protein electrophoretic, D N A hybridization and
phytopathological techniques. Journal of General Microbiology. 133: 57-71.

270
Vantomme, R., Mergaert, J., Verdonck, L. and De Ley, J. 1989.
Antagonistic effects in vitro of Erwinia uredovora L M G 2678 against some other
bacteria. Journal of Phytopathology. 124: 372-376.
Vardi, A., Spiegel-Roy, P. and Galun, E. 1975. Citrus cell culture: isolation
of protoplasts, plating densities, effect of mutagens and regeneration of embryos.
Plant Science Letters. 4: 231-236.
Vasil, I. and Vasil, V. 1980. Isolation and culture of protoplasts. International
Review of Cytology. Supplement 11B: 1-19.
Vasil, V., Wang, D.Y., and Vasil, I.K. 1983. Plant-regeneration from
protoplasts of Napier grass (Pennisetum purpureum Schmul.). Zeitschrift fur
Pflanzenphysiologie. 111: 233-239.
Vidhyasekaran, P., Borromeo, E.S. and Mew, T.W. 1986. Host-Specific
toxin production by Helminthosporium oryzae. Phytopathology. 76: 261-266.
Vidhyasekaran, P., Alvenda, M.E. and Meir, T.W. 1989. Physiological
changes in rice seedlings induced by the extracellular polysaccharide produced by
Xanthomonas campestris pv. oryzae . Physiological and Molecular Plant Pathology.
35: 391-402.
Von Arnold, S. and Eriksson, T. 1976. Factors influencing the growth and
division of pea mesophyll protoplasts. Physiologia Plantarum. 36: 193-196.
Walton, J.D. and Earle, E.D. 1984. Isolation and bioassay of fungal
phytotoxins. In: Cell culture and somatic cell genetics of plants. Vol. 1. Vasil, I.K
(ed.). Academic Press, Orlando, pp 598-607.
Wang, P.J. and Hu, C.Y. 1980. Regeneration of virus-free plants through in
vitro culture. Advances in Biochemical Engineering. 18: 61-99.
Watts, J.W., Motoyoshi, F. and King, J. M. 1974. Problems associated with
the production of stable protoplasts of cells of tobacco mesophyll. Annals of Botany.
38: 667-671.

271
Whitfield, C , Sutherland, I.W. and Cripps, R.E. 1981. Surface
polysaccharides in mutants of Xanthomonas campestris. Journal of General
Microbiology. 124: 385-392.
Whitlock, V.H., Hill, R.R. and Cowley, H.M. 1986. New bacterial pathogen
causing blight of cassava in southern africa. Plant Disease. 70: 167-169.
Widholm, J. 1972. The use of fluorescein diacetate and pheno-safranine for
determining viability of cultured cells. Stain Technology. 47: 189-194.
Wiehe, P.O. and Dowson, W.J. 1953. A bacterial disease of cassava (Manihot
utilissima) in Nyasaland. Empire Journal of Experimental Agriculture. 21: 141-
173.
Williams, P.D., Wilkinson, A.K., Lewis, J.A., Black, G.M. and
Mavituna, F. 1988. A method for the rapid production of fine plant cell
suspension cultures. Plant Cell Reports. 7: 459-462.
Willison, J.H.M. 1976. Synthesis of cell walls by higher plant protoplasts In:
Peberdy, J. F., Rose, A. H., Rogers, H. J. and Cocking, E. C. (eds.). Microbial and
plant protoplasts. Academic press, New York, pp 283-298.
Wilson, G.L. 1979. Production research in Australia. Cassava Newsletter. 7: 9.
Xu, P., Iwata, M., Leong, S. and Sequeira, L. 1990. Highly virulent strains
of Pseudomonas solanacearum that are defective in extracellular-polysaccharide
production. Journal of Bacteriology. 172: 3946-3951.
Yeoman, M. M. and Street, H. E. 1977. General cytology of cultured cells. In:
Plant tissue and cell culture. Street, H. E. (ed.). Blackwell scientific, Oxford, pp
137-176.
Yeoman, M. M. and Forche, E. 1980. Cell proliferation and growth in callus
cultures. International Review of Cytology Supplement. 11A: 1-25.
Yoder, O.C 1981. Assay. In: Toxins in plant disease. R.D. Durbin (ed.).
Academic Press, New York, pp 45-78.

272
Young, D.H., Stemmer, W.P.C and Sequeira, L. 1985. Reassembly of a
fimbrial haemagglutinin from Pseudomonas solanacearum after purification of the
subunit by preparative sodium dodecyl sulphate - polyacrylamide gel
electrophoresis. Applied and Environmental Microbiology. 50: 605-610.
Young, D.H. and Sequeira, L. 1986. Binding of Pseudomonas solanacearum
fimbriae to tobacco leaf cell walls and its inhibition by bacterial extracellular
polysaccharides. Physiological and Molecular Plant Pathology. 28: 393-402.
Zaitlin, M. and Beachy, R. 1974. Protoplasts and separated cells: some new
vistas for plant virology. In: Tissue culture and plant science. Street, H. E. (ed.).
Academic press, N e w York, pp 179-206.
Zapata, F.J., Evans, P.K., Power, J.B. and Cocking, E.C. 1977. The effect
of temperature on the division of leaf protoplasts of Lycopersicon esculentum and
Lycopersicon peruvianum. Plant Science Letters. 8: 119-124.
Zapata, F.J., Sink, K.C and Cocking, E.C. 1981. Callus formation from leaf
mesophyll protoplasts of three Lycopersicon species, L. esculentum c.v waiter, L .
pimpinillifolium and L. hirsutum F. Glabratum. Plant Science Letters. 23: 41-
46.
Ziv, M. and Gadasi, G. 1986. Enhanced embryogenesis and plant regeneration
from cucumber (Cucumis sativus L.) callus by activated charcoal in solid/liquid
double-layer cultures. Plant Science. 47: 115-122.