Embed Size (px)
Citation preview

8/13/2019 1982 Census of Manu 8231 Un
http://slidepdf.com/reader/full/1982-census-of-manu-8231-un 1/48

8/13/2019 1982 Census of Manu 8231 Un
http://slidepdf.com/reader/full/1982-census-of-manu-8231-un 2/48

8/13/2019 1982 Census of Manu 8231 Un
http://slidepdf.com/reader/full/1982-census-of-manu-8231-un 3/48
Bureau Census

8/13/2019 1982 Census of Manu 8231 Un
http://slidepdf.com/reader/full/1982-census-of-manu-8231-un 4/48

8/13/2019 1982 Census of Manu 8231 Un
http://slidepdf.com/reader/full/1982-census-of-manu-8231-un 5/48
J 1962Census of
ManufacturesMC82-I-31B
INDUSTRY SERIES
Leather Gloves; Luggage; and
Miscellaneous LeatherGoodsIndustries 3151 3161, 3171, 3172,and 3199
U.S. Department ofCommerceBUREAU OF THE CENSUS AU OF THE C^ISUS

8/13/2019 1982 Census of Manu 8231 Un
http://slidepdf.com/reader/full/1982-census-of-manu-8231-un 6/48
The publications
from the 1982 Economic and
Agriculture Censuses are dedicated
to the memory of Shirley Kallek,
Associate Director for Economic Fields.
During her career at the Bureau of the
Census (1955 to 1983), she continually
directed efforts to improve
the timeliness and accuracy of
economic statistics.

8/13/2019 1982 Census of Manu 8231 Un
http://slidepdf.com/reader/full/1982-census-of-manu-8231-un 7/48
1962Census of
ManufacturesMC82-I-31B
INDUSTRY SERIES
Leather Gloves; Luggage; andMiscellaneous LeatherGoods
3151 Leather Gloves and Mittens
3161 Luggage
3171 Women's Handbags and Purses
3172 Personal Leather Goods, N.E.C.
3199 Leather Goods, N.E.C.
Issued March 1985
An\^ATWSCf*
U.S. Department of Commerce
Malcolm Baldrige, Secretary
Clarence J. Brown, Deputy Secretary
Sidney Jones, Under Secretary for
Economic Affairs
BUREAU OF THE CENSUSJohn G. Keane,
Director

8/13/2019 1982 Census of Manu 8231 Un
http://slidepdf.com/reader/full/1982-census-of-manu-8231-un 8/48
BUREAU OF THE CENSUSJohn G. Keane, Director
C. L Kincannon, Deputy Director
Charles A. Waite, Associate Director for
Economic Fields
John H. Berry, Assistant Director for
Economic and Agriculture Censuses
INDUSTRY DIVISION
Gaylord E. Worden, Chief
Many persons participated in the various activities
the 1 982 Census of Manufactures. Primary direction of the program was
by Shirley Kallek, Associate Director for Economic Fields (until
1983), Charles A. Watte, her successor, and Michael G. Farrell, Assis-
t Director for Economic and Agriculture Censuses (until August 1984),
John H. Barry, his successor.
This report was prepared in the Industry Division under the general direc-
of Roger H. Bugenhagen, Chief (until April 1983), and
E. Worden. his successor. John P. Govonl, Assistant Chief for Cen-
Survey of Manufactures (ASM) Programs, was responsible for
overall management of the census of manufactures. He
the planning and implementation of the project and coordinated
with other divisions.
Program responsibility was shared by the following individuals who par-
importantly in the entire program: John P. McNamee, Chief, Minerals
Dale W. Gordon, Chief, Census/ASM Durables Branch; Michael J.
Chief, Census/ASM Nondurables Branch; Bernard J.
Chief, Census Special Reports Branch (until April 1983); and
M. GokJhk-sch, his successor; Kenneth I. Hansen. Chief, Annual Survey
Manufactures Branch; Malcolm E. Bernhardt, Chief, Current Durables
and Carole A. Ambler, Chief, Current Nondurables Branch.
Charles T. Lee, Jr., Chief, Food, Tobacco, Textiles, Apparel, and Leather
on, assisted by Anthony Oirveto, was directly responsible for the analysis
the data and preparation of this report.
Dr. Edward A. Robinson, Senior Industry Statistician, made significant con-
to the basic economic concepts and content of the census. The
processing systems were developed and coordinated under the
of WHIIam E. Norfolk, Assistant Chief for Operations. Sarah A.
Chief, Census Programming Branch, was responsible for implemen-
of the computer systems, and the computer programs were prepared
the supervision of David Onions and Gerald S. Turnage, assisted by
rbara A. Lambert. The mathematical techniques and quality control re-
were developed by Preston J. Waite. Assistant Chief for Research
Methodology, assisted by Stacey Cole, Pamela McKee, Amelia M.
Magdalena Ramos, and Ann M. Stephens.
Industry classification was controlled by Bruce M. Goldhirsch; coordina-
activities with Data Preparation Division were carried out by Eric Taylor;
the various phases of the publication process were coordinated
UHle Mae Skinner. Other persons made important contributions in such
as developing specifications, procedures, and resolving problems. They
Richard J. Sterner, Robert A. Rosati. Richard Sweeney, Cyr F. Unonfe,
Pomeroy, Patricia L. Homing, and Dennis L. Wagner.
Systems and procedures for mailout, receipt, correspondence, data input,
classification, other clerical processing, administrative record
processing, and quality control, along with the associated electron
computer programs, were developed in the Economic Surveys Divisio
W. Joel Richardson, Chief.
Planning, design, review, and composition of report forms were pe
formed in the Administrative Services Division, Robert L. Kirkland, Chie
Publication planning, design, editorial review, composition, a
printing procurement were performed in the Publications Services Divisio
Raymond J. Koski, Chief.
Geographic coding procedures and associated computer programs we
developed in the Geography Division, Robert W. Marx, Chief.
Mailout preparation and receipt operations, clerical and analytical revi
activities, data keying, and geocoding review were performed in the Da
Preparation Division, Don L. Adams, Chief.
Computer processing was performed in the Computer Services Divisio
C. Thomas DiNenna, Chief (until February 1984), and John E. Harterma
his successor.
Photocomposition programs for the statistical tables were developed
the Systems Support Division, Larry J. Patin, Chief (until October 1983
and Arnold E. Levin, his successor.
Special-purpose computer programs for disclosure analysis were develop
in the Business Division, Gerald F. Cranford, Chief (until December 1 983
and Howard N. Hamilton, his successor.
The overall planning and review of the census operations were perform
by the staff of the office of the Assistant Director for Economic and Agricult
Censuses.
Special acknowledgment is also due the many businesses whose cooper
tion has contributed to the publication of these data.
Library of Congress Cataloging in Publication Data
Census of manufactures (1982)
1 982 census of manufactures.
Contents: [1] Geographic area series
series.
Supt. of Docs, no.: C 3.24/8: MC82-I
1. United States—Manufactures— Statistics.
I. United States. Bureau of the Census. II
HD9724.C4 1984 338.4'767'0973
[2] Industry
Title.
83-6001
For sale by Superintendent of Documents, U.S. Government Printi
Office, Washington, D.C. 20402.
If you have any questions concerning the statistics in this report, call (301) 763-2510.
8/13/2019 1982 Census of Manu 8231 Un
http://slidepdf.com/reader/full/1982-census-of-manu-8231-un 9/48
INTRODUCTION
CENSUSES OVER TIME
early beginnings of America's industrial output were first
in the United States in the 1810 Decennial Census
again in 1820, when questions on manufacturing were in-
with those for population. Beginning with the 1840
Census, there were enumerations of manufactures andindustries at 10-year intervals up to and including the
1 900 for manufactures and 1 940 for mineral industries.
latter census was again taken for 1 954, 1 958, 1 963, and
of the increasing dominance of manufacturing in the
20th century, Congress directed that quinquennial cen-
of manufactures be taken beginning in 1905. However,
1919 through 1 939, these censuses were conducted every
The need for war-related current surveys in the early
postponed the next census of manufactures until 1 948
1 947). That census was again taken for 1 954, 1 958, 1 963,
1967.
and wholesale trade data were first collected in1
930,in 1 933 information on selected service industries was
to the data-collection operation. These business censuses,
were called, were again taken for 1 935, 1 939 (as part
1 940 decennial program), 1 948, 1 954, 1 958, 1 963, and
on construction industries was obtained first in
and again for 1 935 and 1 939. Data for the full spectrum
industries were not gathered again until 1 968
1967).
need for transportation data to supplement information
from existing governmental or private sources was
by Congress in the late 1950's and early 1960's.
census of transportation (consisting of several surveys) was
first for 1963 and again for 1967.
1 967, all of the above censuses have been taken quin-
as part of the Census Bureau's economic census pro-
(For the 1977 censuses, the coverage of the service in-
was broadened from selected services to all serv-
except religious organizations and private households. A
of 41 additional four-digit standard industrial
1 (SIC's) in 7 SIC major groups was added to the
of the census. While most of the industries included for
first time for 1 977 were covered again for 1 982, some were
i.e., hospitals; elementary and secondary schools; colleges,
and professional schools; junior colleges and
institutes; labor unions and similar labor organizations;
political organizations.)
first manufacturing census for an outlying area was con-
in Puerto Rico for the year 1 909. Thereafter, with the
of 1929, a census was taken at 10-year intervals
1 949. The first censuses of retail trade, wholesale trade,
selected service industries in Puerto Rico were conducted
1 939. These censuses also were taken for the years 1 949,
1958, 1963, and 1967. A census of construction in-
was introduced first in Puerto Rico for 1 967. These cen-
of Puerto Rico have been taken since then for the years
1977, and 1982.
of manufactures, retail trade, wholesale trade, and
service industries were conducted in Guam and the
Virgin Islands of the United States for 1 958, 1 963, 1 967, 1 972,
1 977, and 1 982. Censuses of mineral industries were taken in
the Virgin Islands of the United States for the years 1 958, 1 963,
and 1967 but not since that time. A census of construction
industries was also undertaken in these areas for 1 972, 1 977,
and 1982.
Retail trade, wholesale trade, selected service industries,
manufacturing, and construction industries were canvassed for
the first time in the Northern Mariana Islands in 1 983 (for 1 982).
For 1982, the economic censuses and agriculture censuses
were conducted concurrently.
USES OF THE ECONOMIC CENSUSES
The economic censuses are the major source for facts about
the structure and functioning of the Nation's economy and pro-
vide essential information for government, business, industry,
and the general public. They provide an important part of the
framework for such composite measures as the gross national
product, input-output measures, indexes of industrial produc-tion, and indexes measuring productivity and price levels. Infor-
mation from the censuses is used to establish sampling frames
and as benchmarks for current surveys of business activity,
which are essential for measuring short-term economic
conditions.
State and local governments use census data to assess
business activities within their jurisdictions. The private sector
uses the data to forecast general economic conditions; analyze
sales performance; lay out sales territories; allocate funds for
advertising; decide on locations for new plants, warehouses, or
stores; and measure potential markets in terms of size,
geographic areas, kinds of business, and kinds of products made
or sold.Following every census, thousands of businesses and other
users purchase reports. Likewise, census facts are disseminated
widely by trade associations, business journals, and newspapers.
Volumes containing census statistics are available in most major
public and college libraries. All 1982 data are available on
microfiche from the U.S. Government Printing Office and most
data on computer tape from the Census Bureau. Finally, the more
than 50 State Data Centers also are suppliers of economic cen-
sus statistics.
AUTHORITY AND SCOPE OF THE ECONOMIC
CENSUSES
The economic censuses are required by law under title 1 3 of
the United States Code, sections 131, 191, and 224, which
directs that they be taken at 5-year intervals for the years ending
in 2 and 7. The 1 982 Economic Censuses covered manufactur-
ing, mining, construction industries, retail trade, wholesale trade,
service industries, and selected transportation activities. Special
programs also cover minority-owned and women-owned
businesses. The next economic censuses are scheduled to be
taken in 1988 for the year 1987.
'Standard Industrial Classification Manual: 1972. For sale by Super-
intendent of Documents, U.S. Government Printing Office, Washington, D.C.
20402. Stock No. 041-001-00066-6. 1977 Supplement. Stock
No. 003-00500176-0.
INDUSTRY SERIES INTRODUCTION

8/13/2019 1982 Census of Manu 8231 Un
http://slidepdf.com/reader/full/1982-census-of-manu-8231-un 10/48
CENSUS OF MANUFACTURES
General
The 1982 Census of Manufactures is the 31st census of
manufactures of the United States. For 1 982, it was conducted
jointly with the censuses of mineral industries, construction in-
dustries, retail and wholesale trades, service industries, selected
transportation activities, and minority-owned and women-owned
businesses.
This report, from the 1 982 Census of Manufactures, is one
of a series of 82 industry reports, each of which provides
statistics for groups of related industries. Additional separate
reports will be issued for each State and on special subjects,
such as size of establishments, legal form of organization, and
fuels and electric energy consumed.
These separate reports will subsequently be issued as portions
of the final census volumes. Volume I, Subject Statistics, will
show comparative statistics for industries, States, and standard
metropolitan statistical areas. It also will show selected subjects,
such as concentration ratios in manufacturing, selected materials
consumed, manufacturing activity in government
establishments, and water use in manufacturing. Volume II, In-
dustry Statistics, will be a consolidation of reports for the 82
groups of industries showing the same information that is shown
in this report. Volume III, Geographic Area Statistics, will con-
tain establishment-based data (number of establishments,
employment, payroll, value added by manufacture, and capital
expenditures) for each State and its important standard
metropolitan statistical areas, counties, and places, by industry
groups and important individual industries. Totals for all
manufacturing will be shown for counties and places with more
than 450 manufacturing employees. The introduction to the final
volumes will discuss, at greater length, many of the subjects
described in this introduction. For example, the volume text will
discuss the relationship of value added by manufacture to
National income by industry of origin, the changes in statistical
concepts over the history of the censuses, and the valuation
problems arising from intracompanytransfers between manufac-
turing plants of a company and between manufacturing plants
and sales offices and sales branches of a company.
Scope of Census and Definition of Manufacturing
Industries
The 1 982 Census of Manufactures covers all establishments
employing one person or more primarily engaged in manufac-
turing as defined in the 1 972 Standard Industrial Classification
(SIC) Manual and its 1977 Supplement. 1
This is the system of
industrial classification developed over a period of years by ex-
perts on classification in government and private industry under
the guidance of the Office of Management and Budget. This
system of classification is in general use among government
agencies as well as organizations outside the government.
The SIC manual defines manufacturing as the mechanical or
chemical transformation of inorganic or organic substances
into new products. The assembly of component parts of products
is also considered to be manufacturing if the resulting product
is neither a structure nor other fixed improvement. These ac-
tivities are usually carried on in plants, factories, or mills that
characteristically use power-driven machines and materials
handling equipment.
'Standard Industrial Classification Manual: 1972. For sale by Super-
intendent of Documents, U.S. Government Printing Office, Washington, D.C.
20402. Stock No. 041-001-00066-6. 1977 Supplement. Stock
No. 003-00500176-0.
Manufacturing production is usually carried on for th
wholesale market, for transfers to other plants of the same com
pany, or to the order of industrial users rather than for dire
sale to the household consumer. Some manufacturers in a fe
industries sell chiefly at retail to household consumers throug
the mail, through house-to-house routes, or through sale
persons. Some activities of a service nature (enameling, engrav
ing, etc.) are included in manufacturing when they are performe
primarily for the trade. They are considered nonmanufacturin
when they are performed primarily to the order of the househol
consumer.
Relationship Between Annual Survey of Manufac
tures and Census of Manufactures
The Bureau of the Census conducts the annual survey o
manufactures (ASM) in each of the 4 years between the cen
suses of manufactures. The ASM is based on a scientificall
selected sample of approximately 55,000 establishments an
collects the same industry statistics (employment, payroll, valu
of shipments, etc.) as the census of manufactures. In additio
to collecting the information normally requested on the censu
form, the establishments in the ASM sample are requested t
supply detailed information on assets, capital expenditures
retirements, depreciation, rental payments, supplemental labo
costs, and costs of purchased services.
Establishment Basis of Reporting
The census of manufactures and the annual survey
manufactures are conducted on an establishment basis. A com
pany operating at more than one location is required to file
separate report for each location. Companies engaged in di
tinctly different lines of activity at one location are requeste
to submit separate reports if the plant records permit such
separation and if the activities are substantial in size.
In 1982, as in earlier years, a minimum size limit was set f
including establishments in the census. All establishment
employing one person or more at any time during the censu
year are included. The same size limitation has applied sinc
1947 in censuses and annual surveys of manufactures. In th
1 939 and earlier censuses, establishments with less than $5,00
value of products were excluded. The change in the minimu
size limit in 1 947 does not appreciably affect the historical com
parability of the census figures except for data on number
establishments for a few industries.
This report excludes information for separately operate
administrative offices, warehouses, garages, and other auxilia
units that service manufacturing establishments of the sam
company (see Auxiliaries).
Manufacturing Universe and Census Report Form
The 1 982 Census of Manufactures universe includes approx
imately 345,000 establishments. The amounts of informatio
requested from manufacturing establishments were dependen
upon a number of factors. The more important consideratio
were the size of the company and whether it was included
the annual survey of manufactures. The methods of obtaini
information for the various subsets of the universe to arrive
the aggregate figures shown in this publication are describe
below.
1. Small Single-Unit Companies Not Sent a Report Form
In the 1982 Census of Manufactures, approximatel
140,000 small single-establishment companies were e
cused from filing reports. Selection of these smal
IV INTRODUCTION MANUFACTURES- INDUSTRY SERIE

8/13/2019 1982 Census of Manu 8231 Un
http://slidepdf.com/reader/full/1982-census-of-manu-8231-un 11/48
establishments was done on an industry-by-industry basis
and was based on annual payroll and total shipments data
as well as on the industry classification codes contained
in the administrative records of other Federal agencies. The
cutoffs were selected so that these administrative records
cases would account for no more than 3 percent of the
value of shipments for the industry. Generally, all single-
establishment companies with less than 5 employees were
excused, while all establishments with more than 20
employees were mailed report forms.
Information on the physical location of the establish-
ment, as well as information on payrolls, receipts
(shipments), and industry classification, was obtained from
the administrative records of other Federal agencies under
special arrangements, which safeguarded their confi-
dentiality. Estimates of data for these small establishments
were developed using industry averages in conjunction
with the administrative information. The value of
shipments and cost of materials were not distributed
among specific products and materials for these
establishments but were included in the product and
material not specified by kind (n.s.k.) categories.
The industry classification codes included in the ad-
ministrative records files were assigned on the basis of
brief descriptions of the general activity of the establish-
ment. As a result, an indeterminate number of
establishments were erroneously coded to the four-digit
SIC level. This was especially true whenever there was
a relatively fine line of demarcation between industries or
between manufacturing and nonmanufacturing activity.
Sometimes these administrative record cases were given
only a two- or three-digit SIC group. For the 1 982 Census
of Manufactures, these establishments were sent a
separate classification form, which requested information
on the products and services of the establishment. This
form was used to code many of these establishments to
the four-digit SIC level. Establishments that did not return
the classification form were coded later to those four-digit
SIC industries identified as not elsewhere classified
(n.e.c.) within the given two- or three-digit industry groups.
As a result of these situations, a number of small
establishments may have been misclassified by industry.
However, such possible misclassifications have no signifi-
cant effect on the statistics other than on the number of
establishments.
The total establishment count for individual industries
should be viewed as an approximation rather than a precise
measurement. The counts for establishments with 20
employees or more are far more reliable than the count of
total number of establishments.
2. Establishments Sent a Report Form
The 205,000 establishments covered in the mail can-
vass were divided into three groups:
a. ASM sample establishments— This group consisted of
approximately 55,000 establishments covering all the
units of large manufacturing establishments as well as
a sample of the medium and smaller establishments.
The probability of selection was proportionate* to size
(see appendix, Annual Survey of Manufactures).
In a census of manufactures year, the ASM report
form (MA-1000) replaces the first page of the regular
census form for those establishments included in the
ASM. In addition to information on employment, payroll,
INDUSTRY SERIES
c.
and other items normally requested on the regular cen-
sus form, establishments in the ASM sample were
requested to supply information on assets, capital ex-
penditures, retirements, depreciation, rental payments,
supplemental labor costs, and costs of purchased serv-
ices. Results of the ASM inquiries are included in tables
3c and 3d of this report.
The census part of the report form is one of approx-
imately 200 versions containing product, material, and
special inquiries. The diversity of manufacturing
activities necessitated the use of this many forms to
canvass the approximately 450 manufacturing indus-
tries. Each form was developed for a group of related
industries.
Appearing on each form was a list of products primary
to the group of related industries, as well as secondary
products and miscellaneous services that establish-
ments classified in these industries were likely to be per-
forming. Respondents were requested to identify the
products, the value of each product, and, in a large
number of cases, the quantity of the product shipped
during the survey year. Space was also provided for the
respondent to describe products not specifically iden-
tified on the form.
The report form also contained a materials-consumed
inquiry, which varied from form to form depending on
the industries being canvassed. The respondents were
asked to review a list of materials generally used in their
production processes. From this list, each establishment
was requested to identify those materials consumedduring the survey year, the cost of each, and, in cer-
tain cases, the quantity consumed. Once again, space
was provided for the respondent to describe significant
materials not identified on the form.
Finally, a wide variety of special inquiries was in-
cluded to measure activities peculiar to a given industry,
such as operations performed and equipment used.
Large and medium establishments (non-ASM)—
Approximately 100,000 establishments were included
in this group. A variable cutoff, based on administrative
records payroll data and determined on an industry-by-
industry basis, was used to select those establishments
that were to receive one of the approximately 200 cen-
sus of manufactures regular forms. The first page,
requesting establishment data for items such as
employment and payroll, was standard but did not con-
tain the detailed statistics included on the ASM form.
The product, material, and special inquiry sections sup-
plied were based on the historical industry classifica-
tion of the establishment.
Small single-unit establishments (non-ASM)— This
group consisted of approximately 50,000
establishments. For those industries where application
of the variable cutoff for administrative records cases
resulted in a large number of small establishments
being included in the mail canvass, an abbreviated or
short form was used. These establishments received
one of the approximately 80 versions of the short form,
which requested summary product and material data
and totals but no details on employment, payrolls, cost
of materials, inventories, and capital expenditures.
Use of the short form has no adverse effect on
published totals for the industry statistics; the same
INTRODUCTION V

8/13/2019 1982 Census of Manu 8231 Un
http://slidepdf.com/reader/full/1982-census-of-manu-8231-un 12/48
data were collected on the short as well as the long
form. However, detailed information on materials con-
sumed was not collected on the short form; thus its use
would increase the values of the n.s.k. categories.
Auxiliaries
In this industry report, the data on employment and payroll
are limited to operating manufacturing establishments. The cen-
sus report form filed for auxiliaries (ES-9200) requested a
description of the activity of the establishments serviced.
However, the auxiliaries were coded only to the two-digit majorgroup of the establishments they served; whereas, the operating
establishments were coded to a four-digit manufacturing indus-
try. Data for the approximately 1 0,000 separately operated aux-
iliaries are included in the paperbound geographic area series,
the bound volumes of the census of manufactures, and in a
report issued as part of the 1 982 Enterprise Statistics survey.
Auxiliaries are establishments whose employees are primarily
engaged in performing supporting services for other
establishments of the same company, rather than for the general
public or for other business firms. They can be at different loca-
tions from the establishments served or at the same location as
one of those establishments but not operating as an integral part
thereof and serving two or more establishments. Where auxiliary
operations are conducted at the same location as the manufac-
turing operation and operate as an integral part thereof, they
usually are included in the report for the operating manufactur-
ing establishment.
Included in the broad category of auxiliaries are administrative
offices. Employees in administrative offices are concerned with
the general management of multiestablishment companies, i.e.,
with the general supervision and control of two units or more,
such as manufacturing plants, mines, sales branches, or stores.
The functions of these employees may include (1 ) program plan-
ning, including sales research and coordination of purchasing,
production, and distribution; (2) company purchasing, including
general contracts and purchasing methods; (3) company finan-
cial policy and accounting, tax accounting, company sales and
profit reports, and personnel accounting; (4) general engineering,
including design of product machinery and equipment, and direc-
tion of engineering effort conducted at the individual operation
locations; (5) direction of company personnel matters; and (6)
legal and patent matters.
Other types of auxiliaries serving the plants or central manage-
ment of the company include purchasing offices, sales promo-
tion offices, research and development organizations, etc.
Industry Classification of Establishments
Each of the establishments covered in the census was
classified in one of approximately 450 manufacturing industries
in accordance with the industry definitions in the SIC system.
Under this system of classification, an industry is generally
defined as a group of establishments producing a single product
or a closely related group of products. The product groupings
from which industry classifications are derived are based on con-
siderations such as similarity of manufacturing processes, types
of materials used, types of customers, and the like. The resulting
group of plants must be significant in terms of its number, value
added by manufacture, value of shipments, and number of
employees. The system operates in such a way that the defini-
tions progressively became narrower with successive additions
of numerical digits. There are 20 major groups (two-digit SIC),
143 industry groups (three-digit SIC), and approximately 450
VI INTRODUCTION
industries (four-digit SIC). The product classes and products o
the manufacturing industries have been assigned codes base
on the industry from which they originate. There are about 1 ,50
classes of products, identified by a five-digit code, and abou
1 1 ,000 products, identified by a seven-digit code. The seven
digit products are considered the primary products of the industr
with the same four digits.
Accordingly, an establishment is usually classified in a pa
ticular industry on the basis of its major activity during a pa
ticular year, i.e., production of the products primary to tha
industry exceeds, in value, production of the products primar
to any other single industry. In a few instances, however, th
industry classification of an establishment is not only determine
by the products it makes but also by the process employed
making those products. For example, establishments engage
in blast furnace operations, refining of nonferrous metals fro
ore, or rolling and drawing of nonferrous metals (processes whic
involve heavy capitalization in specialized equipment) would b
classified according to the process used during a census yea
These establishments then would be frozen in that indust
during the following ASM years.
In either a census or ASM year, establishments included
the ASM sample with certainty weight, other than those involv
with heavily capitalized activities described above, a
reclassified by industry only if the change in the primary activi
from the prior year is significant or the change has occurred f
two successive years. This procedure prevents reclassificati
when there are minor shifts in product mix.
In ASM years, establishments included in the ASM sampl
with noncertainty weight are not shifted from one indust
classification to another. They are retained in the industry wher
they were classified in the base census year (see appendi
Annual Survey of Manufactures). However, in the following ce
sus year, these ASM plants are allowed to shift from one indust
to another.
The result of these rules covering the switching of plants fr
one industry classification to another is that, at the aggrega
levei, some industries comprise different mixes of establishmen
between survey years, and establishment data for such indust
statistics as employment and payroll may be tabulated in d
ferent industries between survey years. Hence, comparisons b
tween prior-year and current-year published totals, particula
at the four-digit SIC level, should be viewed with caution. Th
is true particularly for the comparison between the data sho
for a census year versus the data shown for the previous AS
year.
As previously noted, the small establishments that may ha
been misclassified by industry are usually administrative-reco
cases whose industry codes were assigned on the basis
incomplete descriptions of the general activity of the establis
ment. Such possible misclassifications have no significant effe
on the statistics other than on the number of establishment
While some establishments produce only the primary produc
of the industry in which they are classified, all establishmen
of an industry rarely specialize to this extent. The indust
statistics (employment, inventories, value added by manufa
ture, total value of shipments including resales and miscellaneo
receipts, etc.) shown in tables 1 a through 5a, therefore, refl
not only the primary activities of the establishments in that
dustry but also their secondary activities. The product statist
in tables 6a through 6c represent the output of all establishmen
whether or not they are classified in the same industry as t
product. For this reason, in relating the industry statistic
especially the value of shipments to the product statistics, t
MANUFACTURES- INDUSTRY SERI

8/13/2019 1982 Census of Manu 8231 Un
http://slidepdf.com/reader/full/1982-census-of-manu-8231-un 13/48
of the industry's output shown in table 5b should
extent to which industry and product statistics may be
with each other is measured by two ratios, which are
from the figures shown in table 5b. The first of these
called the primary product specialization ratio, measures
proportion of product shipments (both primary and second-
of the establishments classified in the industry represented
primary products of those establishments. The second
called the coverage ratio, is the proportion of primary prod-
shipped by the establishments classified in the industry to
shipments of such products by all manufacturing
establishments making products falling into the
industry category may use a variety of processes and
to produce them. Also, the same industry classifica-
(based on end products) may include both establishments
are highly integrated and those that put only the finishing
on an already highly fabricated item. For example, the
industry includes instances of almost complete inte-
(production of the compressor, condensing unit, electric
casting, stamping of the case, and final assembly) all car-
on at one plant. On the other hand, the condensing unit,
motor, and the case may be purchased and only assembledthe finished product.
some instances, separate industry categories have been
for integrated and nonintegrated establishments. For
industries, the census provides separate statistics on the
of intermediate commodities made and used in the
plant. For some industries characterized by many
of the same company, separate figures on interplant
of products usually are shown.
in the integration of production processes, types
and alternatives in types of materials used should
sidered when relating the industry statistics (employment,
value added, etc.) to the product and material data.
of Shipments for the Industry Compared With
of Product Shipments
industry report shows value of shipments data for indus-
and products. In tables 1 a through 5a, these data represent
total value of shipments of all establishments classified in
industry. The data include the shipments of the prod-
classified in the industry (primary to the industry), products
in other industries (secondary to the industry), and
receipts (repair work, sale of scrap, research and
installation receipts, and resales). Product
shown in table 6a represent the total value of
of products classified as primary to an industry that
shipped by all manufacturing establishments regardless of
industry classification.
DISCLOSURE RULES
accordance with Federal law governing census reports, no
are published that would disclose the data for an indi-
establishment or company. However, the number of
classified in a specific industry is not considered
sclosure, so this item may be given even though other
is withheld.
The disclosure analysis for the industry statistics in tables 1 a
through 5a of this report is based on the total value of shipments.
When the total value of shipments cannot be shown without
disclosing information for individual companies, the complete
line has been suppressed. However, the suppressed data are in-
cluded in higher level totals. Additional disclosure analysis is per-
formed for new capital expenditures that can be suppressed even
though value of shipments data are publishable.
MICROFICHE AND COMPUTER TAPES
All the data in this report are available on microfiche. Selected
data are also available on computer tape.
In addition to selected published data being on computer tape,
one major data series, the location of manufacturing plants, will
be available only on computer tape. This series presents the
number of establishments by employment size class by four-digit
SIC industry codes for States, counties, and places of 2,500
inhabitants or more. These data are available for both State and
county by industry, and State and place by industry.
Microfiche reports are sold by the Superintendent of
Documents, U.S. Government Printing Office, Washington, D.C.
20402. Computer tapes are sold by the Data User Services
Division, Customer Services (Tapes), Bureau of the Census,
Washington, D.C. 20233.
SPECIAL TABULATIONS
Special tabulations of data collected in the 1 982 Census of
Manufactures may be obtained on computer tape or in tabular
form. The data will be in summary form and subject to the same
rules prohibiting disclosure of confidential information (including
name, address, kind of business, or other data for individual
business establishments or companies) as are the regular
publications.
Special tabulations are prepared on a cost basis. A request
for a cost estimate, as well as exact specifications on the type
and format of the data to be provided, should be directed to the
Chief, Industry Division, Bureau of the Census, Washington, D.C.
20233.
ABBREVIATIONS AND SYMBOLS
The following abbreviations and symbols are used in this
publication:
(D)
(NA)
(NO(S)
(X)
(Z)
n.e.c.
n.s.k.
pt.
r
SIC
Represents zero.
Withheld to avoid disclosing data for individual com-
panies; data are included in higher level totals.
Not available.
Not comparable.
Withheld because estimate did not meet publication
standards on the basis of either the response rate or a
consistency review.
Not applicable.
Less than half the unit shown.
Not elsewhere classified.
Not specified by kind.
Part.
Revised.
Standard Industrial Classification.
Other abbreviations, such as lb, gal, yd, doz, bbl, and s tons,
are used in the customary sense.
INDUSTRY SERIES INTRODUCTION VII

8/13/2019 1982 Census of Manu 8231 Un
http://slidepdf.com/reader/full/1982-census-of-manu-8231-un 14/48
Users' Guide for Statistic
[For explanation of terms, see appendixes]
Item
Four-digit industry statistics
Historical
Operating
ratios
By
geographi
are
1
2
3
4
5
6
7
8
9
10
11
12
13
14
15
16
17
18
19
20
21
22
23
24
25
26
27
Number of companies
Number of manufacturing establishments
Employment and payroll:
Number of employees
Payroll
Supplemental labor costs
Production workers
Production-worker hours
Production-worker wages
Shipments, cost of materials, and value added:
Value of shipments (four-digit)
Product class shipments (five-digit)
Product shipments (seven-digit)
Value added by manufacture
Cost of materials
Fuels and electric energy
Materials consumed by kind
Inventories:
Total, end of year
By method of valuation
By stage of fabrication
Capital expenditures, assets, rental payments, and purchased services:
New capital expenditures
Used plant and equipment expenditures
Gross assets
Depreciation
Retirements of buildings and machinery
Rental payments
Purchased services
Ratios:
Specialization
Coverage
1a
1a
1a
1a
1a
1a
1a
1a
1a
1a
1a
1a
1a
1a
1b
1b
1b
1b
1b
1b
1b
1b
*Number of companies with shipments of over $100 thousand.
**Detailed information shown.
VIII USERS' GUIDE MANUFACTURES- INDUSTRY SERIE

8/13/2019 1982 Census of Manu 8231 Un
http://slidepdf.com/reader/full/1982-census-of-manu-8231-un 15/48
This Reportby Table Number
Four-digit industry statistics — Con.Five-digit product class and seven-digit product
statistics
By By Product
Summary employ- industry and Materials Industry- class by Historical
and ment product class consumed product Product geographic product
supplemental size specialization by kind analysis shipments area class
3a *6a 1
**3a 4 5a 2
3a 4 5a 3
3a 4 5a 4
**3d 5
**3a 4 5a 6
**3a 4 5a 7
3a 4 5a 8
3a 4 5a 5b, 5c 9
5b, 5c 6a
6a
6b 6c 10
1 1
3a 4 5a 12
»*3a 4 5a 13
3a, 3d
7
14
15
3b, 3c 4 16
3b, 3c 173b 18
**3a, **3d 4 5a 19
**3a, **3d 20
**3d 21
**3d 22
**3d 23
**3d 24
**3d 25
3a 5b 263a 5b 27
INDUSTRY SERIES USERS' GUIDE IX

8/13/2019 1982 Census of Manu 8231 Un
http://slidepdf.com/reader/full/1982-census-of-manu-8231-un 16/48

8/13/2019 1982 Census of Manu 8231 Un
http://slidepdf.com/reader/full/1982-census-of-manu-8231-un 17/48
Leather Gloves; Luggage; and Miscellaneous
LeatherGoods
CONTENTS
[Page numbers listed here omit the prefix that
appears as part of the number of each page]
Page
Ml
Guide for Locating Statistics in This Report by Table Number VIM
of Industries and Summary of Findings 2
STATISTICS
Historical Statistics for the Industry: 1 982 and Earlier Years 5
Selected Operating Ratios for the Industry: 1982 and Earlier Years 6
Industry Statistics for Selected States: 1 982 and 1 977 7
Summary Statistics for the Industry: 1 982 9
Value of Inventories for the Industry: End of 1 981 and 1 982 9
Inventories by Specific Method of Valuation for the Industry: End of 1982 10
Supplemental Industry Statistics Based on Sample Estimates: 1982 10
Industry Statistics by Employment Size of Establishment: 1982 11
Industry Statistics by Industry and Primary Product Class Specialization: 1982 12
STATISTICS
Industry-Product Analysis— Value of Shipments and Primary Product Shipments, Specialization and Coverage
Ratios for the Industry: 1 982 and Earlier Census Years 12
Industry-Product Analysis— Shipments by Product Class and Industry: 1982 13
Industry-Product Analysis— Other Industries With Shipments of Primary Products: 1982 13
Product and Product Classes — Quantity and Value of Shipments by All Producers: 1982 and 1977 14
Product Classes — Value of Shipments by All Producers for Specified States: 1982 and 1977
Product Classes — Value Shipped by All Producers: 1982 and Earlier Years 15
STATISTICS
Materials Consumed by Kind: 1 982 and 1 977 16
Explanation of Terms A-1
Annual Survey of Manufactures Sampling and Estimating Methodologies B-1
Program Inside back cover
- Not applicable.
INDUSTRY SERIES CONTENTS 31B-1
8/13/2019 1982 Census of Manu 8231 Un
http://slidepdf.com/reader/full/1982-census-of-manu-8231-un 18/48
DESCRIPTION OF INDUSTRIESANDSUMMARYOF FINDINGS
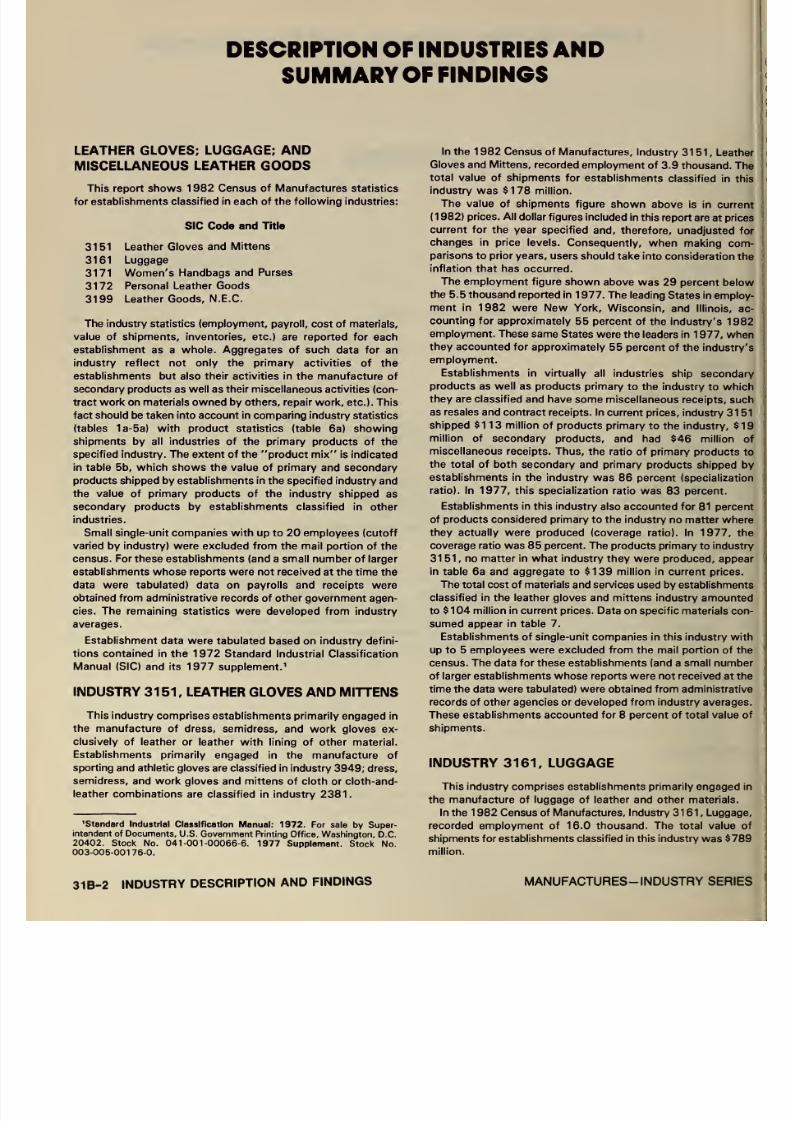
LEATHER GLOVES; LUGGAGE; ANDMISCELLANEOUS LEATHER GOODS
This report shows 1 982 Census of Manufactures statistics
for establishments classified in each of the following industries:
SIC Code and Title
3151 Leather Gloves and Mittens
3161 Luggage
3171 Women's Handbags and Purses
3172 Personal Leather Goods
3199 Leather Goods, N.E.C.
The industry statistics (employment, payroll, cost of materials,
value of shipments, inventories, etc.) are reported for each
establishment as a whole. Aggregates of such data for an
industry reflect not only the primary activities of the
establishments but also their activities in the manufacture of
secondary products as well as their miscellaneous activities (con-
tract work on materials owned by others, repair work, etc.). This
fact should be taken into account in comparing industry statistics
(tables 1a-5a) with product statistics (table 6a) showing
shipments by all industries of the primary products of the
specified industry. The extent of the product mix is indicated
in table 5b, which shows the value of primary and secondary
products shipped by establishments in the specified industry and
the value of primary products of the industry shipped as
secondary products by establishments classified in other
industries.
Small single-unit companies with up to 20 employees (cutoff
varied by industry) were excluded from the mail portion of the
census. For these establishments (and a small number of larger
establishments whose reports were not received at the time the
data were tabulated) data on payrolls and receipts were
obtained from administrative records of other government agen-
cies. The remaining statistics were developed from industry
averages.
Establishment data were tabulated based on industry defini-
tions contained in the 1 972 Standard Industrial Classification
Manual (SIC) and its 1977 supplement. 1
INDUSTRY 3151, LEATHER GLOVES AND MITTENS
This industry comprises establishments primarily engaged in
the manufacture of dress, semidress, and work gloves ex-
clusively of leather or leather with lining of other material.
Establishments primarily engaged in the manufacture of
sporting and athletic gloves are classified in industry 3949; dress,
semidress, and work gloves and mittens of cloth or cloth-and-
leather combinations are classified in industry 2381.
'Standard Industrial Classification Manual: 1972. For sale by Super-
intendent of Documents, U.S. Government Printing Office, Washington, D.C.
20402. Stock No. 041-001-00066-6. 1977 Supplement. Stock No.
003-005-00176-0.
In the 1 982 Census of Manufactures, Industry 3151, Leath
Gloves and Mittens, recorded employment of 3.9 thousand. T
total value of shipments for establishments classified in t
industry was $178 million.
The value of shipments figure shown above is in curre
(1 982) prices. All dollar figures included in this report are at pri
current for the year specified and, therefore, unadjusted
changes in price levels. Consequently, when making co
parisons to prior years, users should take into consideration t
inflation that has occurred.
The employment figure shown above was 29 percent bel
the 5.5 thousand reported in 1 977. The leading States in emplo
ment in 1982 were New York, Wisconsin, and Illinois,
counting for approximately 55 percent of the industry's 1 9
employment. These same States were the leaders in 1 977, wh
they accounted for approximately 55 percent of the industr
employment.
Establishments in virtually all industries ship seconda
products as well as products primary to the industry to whi
they are classified and have some miscellaneous receipts, su
as resales and contract receipts. In current prices, industry 31
shipped $113 million of products primary to the industry, $
million of secondary products, and had $46 million
miscellaneous receipts. Thus, the ratio of primary products
the total of both secondary and primary products shipped
establishments in the industry was 86 percent (specializati
ratio). In 1977, this specialization ratio was 83 percent.
Establishments in this industry also accounted for 81 perce
of products considered primary to the industry no matter whethey actually were produced (coverage ratio). In 1977, t
coverage ratio was 85 percent. The products primary to indus
3151, no matter in what industry they were produced, appe
in table 6a and aggregate to $139 million in current prices
The total cost of materials and services used by establishmen
classified in the leather gloves and mittens industry amount
to $ 1 04 million in current prices. Data on specific materials co
sumed appear in table 7.
Establishments of single-unit companies in this industry wi
up to 5 employees were excluded from the mail portion of t
census. The data for these establishments (and a small numb
of larger establishments whose reports were not received at t
time the data were tabulated) were obtained from administratirecords of other agencies or developed from industry average
These establishments accounted for 8 percent of total value
shipments.
INDUSTRY 3161, LUGGAGE
This industry comprises establishments primarily engaged
the manufacture of luggage of leather and other materials.
In the 1 982 Census of Manufactures, Industry 3161, Luggag
recorded employment of 16.0 thousand. The total value
shipments for establishments classified in this industry was $7
million.
31B-2 INDUSTRY DESCRIPTION AND FINDINGS MANUFACTURES- INDUSTRY SERIE

8/13/2019 1982 Census of Manu 8231 Un
http://slidepdf.com/reader/full/1982-census-of-manu-8231-un 19/48
value of shipments figure shown above is in current
prices. All dollar figures included in this report are at prices
for the year specified and, therefore, unadjusted for
in price levels. Consequently, when making com-
to prior years, users should take into consideration the
that has occurred.
employment figure shown above was 1 7 percent below
19.2 thousand reported in 1977. The leading States in
in 1 982 were New York, Tennessee, Colorado, and
accounting for approximately 65 percent of the in-
1982 employment. Data for Colorado have been
to avoid disclosing data for individual companies. This
a shift from 1 977 when New York, Colorado, New
and Tennessee accounted for approximately 55 percent
industry's employment.
in virtually all industries ship secondary
as well as products primary to the industry to which
are classified and have some miscellaneous receipts, such
and contract receipts. In current prices, industry 31 61
$61 5 million of products primary to the industry, $44
of secondary products, and had $130 million of
receipts. Thus, the ratio of primary products to
otal of both secondary and primary products shipped by
in the industry was 93 percent (specialization
In 1977, this specialization ratio was 94 percent.
in this industry also accounted for 95 percent
considered primary to the industry no matter where
actually were produced (coverage ratio). In 1977, the
ratio was 98 percent. The products primary to industry
no matter in what industry they were produced, appear
6a and aggregate to $647 million in current prices.
total cost of materials and services used by establishments
in the luggage industry amounted to $356 million in
prices. Data on specific materials consumed appear in
7.
of single-unit companies in this industry with
10 employees were excluded from the mail portion of the
The data for these establishments (and a small number
establishments whose reports were not received at the
the data were tabulated) were obtained from administrative
of other agencies or developed from industry averages.
establishments accounted for 1 5 percent of total value
3171, WOMEN'S HANDBAGS AND
industry comprises establishments primarily engaged in
manufacture of women's handbags and purses of leather
other materials, except precious metals (industry 3911).
the 1982 Census of Manufactures, Industry 3171,
Handbags and Purses, recorded employment of 1 5.4
The total value of shipments for establishments
in this industry was $624 million.
value of shipments figure shown above is in current
prices. All dollar figures included in this report are at prices
for the year specified and, therefore, unadjusted for
in price levels. Consequently, when making com-
to prior years, users should take into consideration the
that has occurred.
employment figure shown above was 24 percent below
20.3 thousand reported in 1977. The leading States in
employment in 1982 were New York, Florida, California, and
Massachusetts, accounting for approximately 65 percent of the
industry's 1982 employment.
Data for Massachusetts have been withheld to avoid disclos-
ing data for individual companies. This represents a shift from
1977 when New York, Florida, California, and New Jersey ac-
counted for approximately 71 percent of the industry's
employment.
Establishments in virtually all industries ship secondary
products as well as products primary to the industry to which
they are classified and have some miscellaneous receipts, such
as resales and contract receipts. In current prices, industry 3171
shipped $496 million of products primary to the industry, $20
million of secondary products, and had $108 million of
miscellaneous receipts. Thus, the ratio of primary products to
the total of both secondary and primary products shipped by
establishments in the industry was 96 percent (specialization
ratio). In 1977, this specialization ratio was 97 percent.
Establishments in this industry also accounted for 94 percent
of products considered primary to the industry no matter where
they actually were produced (coverage ratio). In 1977, the
coverage ratio was 97 percent. The products primary to industry
3171, no matter in what industry they were produced, appear
in table 6a and aggregate to $525 million in current prices.
The total cost of materials and services used by establishments
classified in the women's handbags and purses industry
amounted to $302 million in current prices. Data on specific
materials consumed appear in table 7.
Establishments of single-unit companies in this industry with
up to 10 employees were excluded from the mail portion of the
census. The data for these establishments (and a small number
of larger establishments whose reports were not received at the
time the data were tabulated) were obtained from administrative
records of other agencies or developed from industry averages.
These establishments accounted for 24 percent of total value
of shipments.
INDUSTRY 3172, PERSONAL LEATHER GOODS,
N.E.C.
This industry comprises establishments primarily engaged in
the manufacture of small articles, such as billfolds, key cases,
and coin purses of leather or other materials, except precious
metal (industry 3911).
In the 1 982 Census of Manufactures, Industry 31 72, Personal
Leather Goods, N.E.C, recorded employment of 9.9 thousand.
The total value of shipments for establishments classified in this
industry was $41 1 million.
The value of shipments figure shown above is in current
(1 982) prices. All dollar figures included in this report are at prices
current for the year specified and, therefore, unadjusted for
changes in price levels. Consequently, when making com-
parisons to prior years, users should take into consideration the
inflation that has occurred.
The employment figure shown above was 1 7 percent below
the 11.9 thousand reported in 1977. The leading States in
employment in 1 982 were New York, Massachusetts, Wiscon-
sin, and New Jersey, accounting for approximately 60 percent
of the industry's 1 982 employment. Data for Wisconsin have
been withheld to avoid disclosing data for individual companies.
This represents a shift from 1977 when New York,
Massachusetts, Missouri, and Wisconsin accounted for approx-
imately 65 percent of the industry's employment.
INDUSTRY SERIES INDUSTRY DESCRIPTION AND FINDINGS 31B-3

8/13/2019 1982 Census of Manu 8231 Un
http://slidepdf.com/reader/full/1982-census-of-manu-8231-un 20/48
Establishments in virtually all industries ship secondary
products as well as products primary to the industry to which
they are classified and have some miscellaneous receipts, such
as resales and contract receipts. In current prices, industry 31 72
shipped $327 million of products primary to the industry, $21
million of secondary products, and had $63 million of
miscellaneous receipts. Thus, the ratio of primary products to
the total of both secondary and primary products shipped by
establishments in the industry was 94 percent (specialization
ratio). In 1977, this specialization ratio was 96 percent.
Establishments in this industry also accounted for 83 percent
of products considered primary to the industry no matter where
they actually were produced (coverage ratio). In 1977, the
coverage ratio was 91 percent. The products primary to industry
31 72, no matter in what industry they were produced, appear
in table 6a and aggregate to $393 million in current prices.
The total cost of materials and services used by establishments
classified in the personal leather goods, n.e.c, industry
amounted to $167 million in current prices. Data on specific
materials consumed appear in table 7.
Establishments of single-unit companies in this industry with
up to 5 employees were excluded from the mail portion of the
census. The data for these establishments (and a small numberof larger establishments whose reports were not received at the
time the data were tabulated) were obtained from administrative
records of other agencies or developed from industry averages.
These establishments accounted for 1 8 percent of total value
of shipments.
INDUSTRY 3199, LEATHER GOODS, N.E.C.
This industry comprises establishments primarily engaged in
the manufacture of leather goods, not elsewhere classified, such
as saddlery, harness, and whips, embossed leather goods,
leather desk sets, and industrial leather belting. Establishments
primarily engaged in the manufacture of gaskets and packingare classified in industry 3293.
In the 1 982 Census of Manufactures, Industry 31 99, Leather
Goods, N.E.C, recorded employment of 6.9 thousand. The total
value of shipments for establishments classified in this industry
was $325 million.
The value of shipments figure shown above is in curre
(1 982) prices. All dollar figures included in this report are at pric
current for the year specified and, therefore, unadjusted f
changes in price levels. Consequently, when making com
parisons to prior years, users should take into consideration t
inflation that has occurred.
The employment figure shown above was 20 percent belo
the 8.6 thousand reported in 1 977. The leading States in emplo
ment in 1982 were California, Texas, New York, an
Massachusetts, accounting for approximately 50 percent of t
industry's 1 982 employment. This represents a shift from 1 97
when Texas, California, New York, and Tennessee accounte
for approximately 55 percent of the industry's employment.
Establishments in virtually all industries ship seconda
products as well as products primary to the industry to whic
they are classified and have some miscellaneous receipts, suc
as resales and contract receipts. In current prices, industry 31 9
shipped $288 million of products primary to the industry, $1
million of secondary products, and had $25 million
miscellaneous receipts. Thus, the ratio of primary products
the total of both secondary and primary products shipped b
establishments in the industry was 96 percent (specializati
ratio). In 1977, this specialization ratio was 94 percent.Establishments in this industry also accounted for 94 perce
of products considered primary to the industry no matter wher
they actually were produced (coverage ratio). In 1977, t
coverage ratio also was 95 percent. The products primary
industry 31 99, no matter in what industry they were produced
appear in table 6a and aggregate to $305 million in current price
The total cost of materials and services used by establishment
classified in the leather goods, n.e.c, industry amounted to $1 6
million in current prices. Data on specific materials consume
appear in table 7.
Establishments of single-unit companies in this industry wi
up to 5 employees were excluded from the mail portion of t
census. The data for these establishments (and a small numbeof larger establishments whose reports were not received at t
time the data were tabulated) were obtained from administrati
records of other agencies or developed from industry average
These establishments accounted for 27 percent of total val
of shipments.
31B-4 INDUSTRY DESCRIPTION AND FINDINGS MANUFACTURES-INDUSTRY SERIE

8/13/2019 1982 Census of Manu 8231 Un
http://slidepdf.com/reader/full/1982-census-of-manu-8231-un 21/48
1a. Historical Statistics for the Industry: 1982 and Earlier Years
des data for auxiliaries. For meaning of abbreviations and symbols, see introductory text. For explanation of terms, see appendixes]
Com-panies2
(no.)
All establishments3 All employees Production workers
Value
added by
manufac-
ture4
(million
dollars)
Cost of
materials
(million
dollars)
Value of
shipments
(million
dollars)
Newcapital
expend-
itures
(million
dollars)
End-of-
year
inven-
tories4
(million
dollars)
Ratios
Year1
Total
(no.)
With 20
employ-
ees or
more(no.)
Number
(1,000)
Payroll
(million
dollars)
Number(1,000)
Hours
(millions)
Wages(million
dollars)
Spe-
cial-
ization
(per-
cent)
Cover-
age
(per-
cent)
INDUSTRY 3151, LEATHER GLOVES AND MITTENS
Census 80(NA)
(NA)
(NA)
(NA)
84
(NA)
(NA)
(NA)
(NA)
95
(NA)
(NA)
(NA)
(NA)
136
96(NA)
(NA)
(NA)
(NA)
101
(NA)
(NA)
(NA)
(NA)
106
(NA)
(NA)
(NA)
(NA)
147
54(NA)
(NA)
(NA)
(NA)
66
(NA)
(NA)
(NA)
(NA)
60
(NA)
(NA)
(NA)
(NA)
71
3.9
5.7
6.1
6.2
5.3
5.5
6.2
6.0
7.1
5.2
4.9
4.9
5.5
6.0
6.0
6.3
36.641.7
38.9
38.6
35.0
33.9
34.4
32.3
37.2
24.5
22.1
21.4
22.2
23.3
22.5
22.4
3.34.9
5.3
5.5
4.7
4.7
5.3
5.5
6.4
4.5
4.3
4.2
4.8
5.3
5.3
5.6
5.6
8.4
8.9
9.2
8.3
8.2
8.6
8.2
11.0
8.1
7.6
7.3
8.2
9.4
9.5
9.9
26.928.8
27.7
29.0
27.2
25.5
25.8
24.4
29.1
19.1
17.1
16.6
17.3
18.3
17.8
17.9
72.574.3
62470.0
72.1
67.6
62.1
54.5
65.7
52.2
43.0
41.8
48.3
36.7
34.7
36.3
104.4118.4
115.1
115.2
111.3
111.8
86.8
81.4
101.9
69.6
55.0
48.7
54.1
55.8
47.6
49.3
177.6196.3
180.7
181.0
176.1
178.0
147.6
132.5
165.7
120.1
98.2
92.1
100.5
91.8
83.5
86.7
.7
1.36.9
.9
5.5
1.9
.8
1.4
1.96.6
.5
.5
«.6
«.9
.6
.8
33.041.5
41.3
41.5
35.8
33.7
30.4
28.8
28.3
22.9
20.3
17.9
19.5
15.5
13.3
14.2
86(NA)
(NA)
(NA)
(NA)
83
(NA)
(NA)
(NA)
(NA)
92
(NA)
(NA)
(NA)
(NA)
90
81
ASM (NA)
ASM. (NA)
ASM6 (NA)
ASM6 (NA)
Census 85
ASM6 (NA)
ASM 6
ASM 6
ASM
(NA)
(NA)
(NA)
Census 85
ASM... (NA)
ASM (NA)
ASM (NA)
ASM (NA)
Census 84
INDUSTRY 3161, LUGGAGE
Census 287
(NA)
(NA)
(NA)(NA)
286
(NA)
(NA)
(NA)
(NA)
266
(NA)
(NA)
(NA)
(NA)
328
292
(NA)
(NA)
(NA)(NA)
298
(NA)
(NA)
(NA)
(NA)
277
(NA)
(NA)
(NA)
(NA)
333
131
(NA)
(NA)
(NA)(NA)
130
(NA)
(NA)
(NA)
(NA)
130
(NA)
(NA)
(NA)
(NA)
156
16.0
18.6
20.7
22.020.1
19.2
17.6
16.6
17.7
19.0
17.1
14.8
16.6
21.9
21.3
21.4
193.8
215.7
229.8
224.5175.5
164.1
143.6
124.9
118.7
117.7
106.8
87.6
89.7
108.2
99.9
96.6
12.5
14.7
16.7
17.8
16.4
15.8
14.4
13.4
14.3
15.9
14.3
12.2
13.9
19.1
18.4
18.4
21.0
22.8
26.9
29.230.3
29.0
26.1
23.8
25.5
29.9
26.4
22.3
24.8
34.7
33.7
34.2
112.5
134.5
141.1
141.6114.1
105.5
94.6
30.2
78.6
83.3
75.6
59.2
60.7
78.4
71.7
69.4
432.8
500.4
527.1
447.8368.0
328.3
288.6
244.8
247.2
210.0
194.1
156.0
165.9
221.9
199.2
186.0
355.5
436.3
441.4
435.7368.4
328.0
281.8
220.4
211.1
204.1
171.9
125.0
130.2
166.8
158.4
155.2
789.0
928.5
957.3
872.8717.0
654.9
565.3
469.1
446.6
410.5
364.5
283.3
301.5
379.0
357.6
334.2
12.0617.9616.3
11.1
9.3
8.1
64.9
4.2
6.4
5.2
8.9
5.563.7
5.6
8.5
8.8
150.7
180.9
171.1
156.5140.4
113.5
89.2
79.2
84.3
74.4
66.0
46.3
48.6
55.5
45.6
45.3
93
(NA)
(NA)
(NA)(NA)
94
(NA)
(NA)
(NA)
(NA)
92(NA)
(NA)
(NA)
(NA)
96
95
ASM (NA)
ASM (NA)
ASM (NA)
ASM (NA)
Census 98
ASM (NA)
ASM (NA)
ASM— (NA)
ASM (NA)
Census 97
ASM (NA)
ASM (NA)
ASM (NA)
ASM (NA)
Census 94
INDUSTRY 3171, WOMEN'S HANDBAGS AND PURSES
Census 383
(NA)
(NA)
(NA)
(NA)
404(NA)
(NA)
(NA)
(NA)
431
(NA)
(NA)
(NA)
(NA)
488
393
(NA)
(NA)
(NA)
(NA)
418(NA)
(NA)
(NA)
(NA)
444
(NA)
(NA)
(NA)
(NA)
496
148
(NA)
(NA)
(NA)
(NA)
186(NA)
(NA)
(NA)
(NA)
214(NA)
(NA)
(NA)
(NA)
247
15.4
21.2
21.6
22.0
21.7
20.3
23.3
22.3
20.8
21.8
22.2
19.5
21.4
25.9
25.9
24.1
158.5
190.4
180.3
164.0
161.7
144.0155.5
143.6
117.6
120.5
121.7
93.8
96.0
118.8
119.0
104.5
13.2
18.8
19.2
19.6
19.1
18.2
20.7
19.8
18.5
19.5
19.8
17.8
19.3
23.6
23.7
21.7
25.6
27.3
25.7
32.9
35.3
32.837.9
37.4
32.9
36.2
36.6
32.0
35.1
45.7
45.8
41.7
111.7
144.5
135.0
124.0
122.7
109.1
117.5
107.7
89.7
93.8
93.2
74.5
76.9
96.0
96.2
82.8
320.4
320.9
303.9
304.3
332.0
266.5283.1
248.1
202.2
192.5
201.5
159.3
164.5
200.8
201.8
173.6
302.2
309.9
274.3
279.4
284.8
241.9237.5
210.1
167.0
157.4
166.5
113.4
117.0
156.5
156.2
154.2
623.7
622.2
573.4
579.3
613.6
505.2514.3
452.0
366.8
348.6
365.0
272.6
280.8
358.2
358.6
327.2
5.666.0
(S)
•4.6
•7.7
6.6
•7.1
•3.8
•2.7
•4.5
3.7
3.1
2.8
3.0
3.5
2.2
76.6
97.6
88.6
73.4
66.3
61.958.3
48.7
39.3
39.2
37.1
28.1
27.2
31.0
30.5
26.1
96
(NA)
(NA)
(NA)
(NA)
97(NA)
(NA)
(NA)
(NA)
95
(NA)
(NA)
(NA)
(NA)
98
94
ASM (NA)
ASM (NA)
ASM (NA)
ASM (NA)
Census 97ASM (NA)
ASM (NA)
ASM (NA)
ASM (NA)
Census 97
ASM (NA)
ASM (NA)
ASM (NA)
ASM 6
Census
(NA)
98
INDUSTRY 3172, PERSONAL LEATHER GOODS
Census 239(NA)
(NA)
(NA)
(NA)
253(NA)
(NA)
(NA)
(NA)
238
(NA)
(NA)
(NA)
(NA)
293
243
(NA)
(NA)
(NA)
(NA)
260
(NA)
(NA)
(NA)
(NA)
244(NA)
(NA)
(NA)
(NA)
296
87
(NA)
(NA)
(NA)
(NA)
97
(NA)
(NA)
(NA)
(NA)
98
(NA)
(NA)
(NA)
(NA)
105
9.9
10.6
10.8
11.8
12.4
11.9
12.0
11.4
12.2
12.4
11.5
12.8
15.0
12.3
12.1
12.7
112.6
108.1
100.9
105.6
107.7
98.2
94.4
87.3
84.4
83.7
73.4
76.5
81.7
61.6
60.0
58.2
7.3
7.9
8.3
9.5
10.1
9.6
9.8
9.2
9.9
10.1
9.3
10.3
12.3
10.2
9.9
10.7
13.4
13.9
14.1
17.3
18.7
17.2
17.3
16.7
17.8
19.0
16.9
18.7
22.3
18.5
18.3
19.7
66.3
66.9
62.0
63.1
67.5
60.9
59.2
54.8
54.1
50.8
45.6
46.5
50.3
38.9
38.8
38.4
243.6
268.8
247.8
241.5
238.7
205.8
198.4
179.3
175.5
158.8
143.7
137.3
143.0
112.1
112.5
105.1
167.0
161.0
153.4
158.8
166.7
161.2
148.0
124.9
116.5
118.6
103.4
96.1
105.7
86.0
81.9
80.9
411.4
426.8
406.3
400.9
400.0
366.8
342.3
308.4
286.6
272.5
242.2
236.5
247.1
198.7
191.6
186.2
3.2
•3.2
•1.9
•3.6
6.1
4.8
3.2
2.4
2.1
•4.8
2.8
1.3
2.1
1.3
1.3
2.0
97.2
71.7
55.8
67.8
76.5
62.5
51.8
47.7
54.1
52.6
38.3
35.6
40.7
30.6
29.3
26.0
94
(NA)
(NA)
(NA)
(NA)
96(NA)
(NA)
(NA)
(NA)
94
(NA)
(NA)
(NA)
(NA)
94
83
ASM (NA)
ASM (NA)
ASM (NA)
ASM (NA)
Census 91
ASM (NA)
ASM (NA)
ASM (NA)
ASM (NA)
Census 91
ASM (NA)
ASM (NA)
ASM. (NA)
ASM _ (NA)
Census 92
INDUSTRY 3199, LEATHER GOODS, N.E.C.7
Census 399
(NA)
(NA)
(NA)
(NA)
512
(NA)
(NA)
(NA)
(NA)
433
414(NA)
(NA)
(NA)
(NA)
532
(NA)
(NA)
(NA)
(NA)
448
104
(NA)
(NA)
(NA)
(NA)
117
(NA)
(NA)
(NA)
(NA)
99
6.9
7.9
7.7
7.4
8.7
8.6
7.1
7.4
7.4
7.5
7.2
75.0
83.0
71.9
66.3
70.3
67.9
60.4
57.0
47.7
46.3
42.5
5.7
6.8
5.9
5.9
7.0
7.0
5.8
6.1
6.5
6.2
6.1
10.3
12.7
10.7
10.4
12.6
12.4
10.6
10.2
10.6
11.6
11.2
52.1
53.5
43.1
41.7
44.7
43.7
41.9
39.1
34.0
32.3
29.4
159.4
211.1
158.5
152.3
134.0
136.7
128.8
116.5
100.4
61.8
84.3
163.8
178.5
152.9
163.0
168.3
154.0
157.4
130.8
99.6
97.8
81.0
325.1
380.3
310.5
311.6
298.6
284.2
282.1
247.2
194.6
183.8
161.3
5.7
11.1
•2.9
2.5
•10.8
4.1
1.9
4.8
1.666.3
2.2
57.2
66.2
53.7
53.5
58.2
50.6
45.7
43.0
36.9
33.1
30.2
96
(NA)
(NA)
(NA)
(NA)
94
(NA)
(NA)
(NA)
(NA)
92
94
ASM6
ASM(NA)
(NA)
ASM6
ASM..(NA)
(NA)
Census 95
ASM6 (NA)
ASM 6
ASM6
(NA)
(NA)
ASM (NA)
Census 90
See footnotes at end of table.
INDUSTRY SERIES LEATHER GLOVES; LUGGAGE; & MISC. GOODS 31B-5
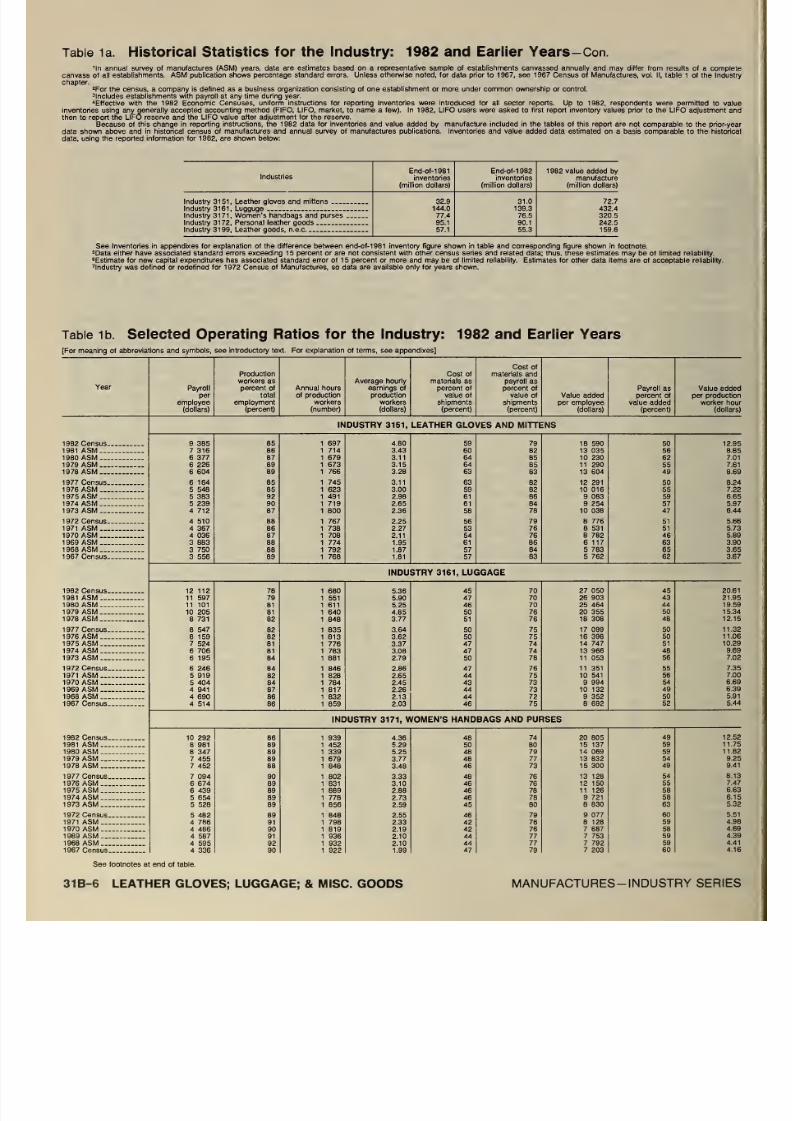
8/13/2019 1982 Census of Manu 8231 Un
http://slidepdf.com/reader/full/1982-census-of-manu-8231-un 22/48
Table 1a. Historical Statistics for the Industry: 1982 and Earlier Years-Con.
'In annual survey of manufactures (ASM) years, data are estimates based on a representative sample of establishments canvassed annually and may differ from results of a complete
canvass of all establishments. ASM publication shows percentage standard errors. Unless otherwise noted, for data prior to 1967, see 1967 Census of Manufactures, vol. II, table 1 of the Industry
chapter.2For the census, a company is defined as a business organization consisting of one establishment or more under common ownership or control.
includes establishments with payroll at any time during year.
•Effective with the 1982 Economic Censuses, uniform instructions for reporting inventories were introduced for all sector reports. Up to 1982, respondents were permitted to value
inventories using any generally accepted accounting method (FIFO, UFO, market, to name a few). In 1982, LIFO users were asked to first report inventory values prior to the LIFO adjustment and
then to report the LIFO reserve and the LIFO value after adjustment for the reserve.
Because of this change in reporting instructions, the 1982 data for inventories and value added by manufacture included in the tables of this report are not comparable to the prior-yea
data shown above and in historical census of manufactures and annual survey of manufactures publications. Inventories and value added data estimated on a basis comparable to the historical
data, using the reported information for 1982, are shown below:
IndustriesEnd-of-1981inventories
(million dollars)
End-of-1982inventories
(million dollars)
1982 value added bymanufacture
(million dollars)
Industry 3151, Leather gloves and mittens 32.9
144.0
77.4
95.1
57.1
31.0
139.3
76.5
90.1
55.3
72.7
Industry 3161, Lugguge
Industry 3171, Women's handbags and purses
Industry 3172, Personal leather goods
432.4
320.5
242.5
159.6
See Inventories in appendixes for explanation of the difference between end-of-1981 inventory figure shown in table and corresponding figure shown in footnote.5Data either have associated standard errors exceeding 1 5 percent or are not consistent with other census series and related data; thus, these estimates may be of limited reliability.
6Estimate for new capital expenditures has associated standard error of 15 percent or more and may be of limited reliability. Estimates for other data items are of acceptable reliability.
'Industry was defined or redefined for 1972 Census of Manufactures, so data are available only for years shown.
Table 1b. Selected Operating Ratios for the Industry: 1982 and Earlier Years
[For meaning of abbreviations and symbols, see introductory text. For explanation of terms, see appendixes]
Year Payroll
per
employee
(dollars)
Production
workers as
percent of
total
employment
(percent)
Annual hours
of production
workers
(number)
Average hourly
earnings of
production
workers
(dollars)
Cost Of
materials as
percent of
value of
shipments
(percent)
Cost of
materials and
payroll as
percent of
value of
shipments
(percent)
Value added
per employee
(dollars)
Payroll as
percent of
value added
(percent)
Value addedper production
worker hour
(dollars)
INDUSTRY 3151, LEATHER GLOVES AND MITTENS
1982 Census 9 385
7 316
6 377
6 226
6 604
6 164
5 548
5 383
5 239
4 712
4 5104 367
4 036
3 883
3 750
3 556
85
86
87
89
89
85
85
92
90
87
8886
87
88
88
89
1 697
1 714
1 679
1 673
1 766
1 745
1 6231 491
1 719
1 800
1 7671 738
1 708
1 774
1 792
1 768
4.80
3.43
3.11
3.15
3.28
3.11
3.00
2.98
2.65
2.36
2.25
2.27
2.11
1.95
1.87
1.81
59
60
64
64
63
63
59
61
61
58
56
53
54
61
57
57
79
82
85
85
83
82
82
86
84
78
79
76
76
86
84
83
18 590
13 035
10 230
11 290
13 604
12 291
10 016
9 083
9 254
10 038
8 7768 531
8 782
6 117
5 783
5 762
50
56
62
55
49
50
55
59
57
47
51
51
46
63
65
62
12.95
1981 ASM 8.85
1980 ASM.. 7.01
1979 ASM 7.61
1978 ASM 8.69
1977 Census 8.24
1976 ASM 7.22
1975 ASM 6.65
1974 ASM 5.97
1973 ASM .. 6.44
1972 Census 5.66
1971 ASM 5.73
1970 ASM 5.89
1969 ASM 3.90
1968 ASM 3.65
1967 Census 3.67
INDUSTRY 3161, LUGGAGE
1982 Census- - 12 112
11 597
11 101
10 205
8 731
8 547
8 159
7 524
6 706
6 195
6 246
5 919
5 404
4 941
4 690
4 514
78
79
81
81
82
82
82
81
81
84
84
82
84
87
86
86
1 680
1 551
1 611
1 640
1 848
1 835
1 813
1 776
1 783
1 881
1 846
1 828
1 784
1 8171 832
1 859
5.36
5.90
5.25
4.85
3.77
3.64
3.62
3.37
3.08
2.79
2.86
2.65
2.45
2.26
2.13
2.03
45
47
46
50
51
50
50
47
47
50
47
44
43
44
44
46
70
70
70
7676
75
75
74
74
78
76
75
73
73
72
75
27 050
26 903
25 464
20 355
18 308
17 099
16 398
14 747
13 966
11 053
11 351
10 541
9 994
10 132
9 352
8 692
45
43
44
50
48
50
50
51
48
56
55
56
54
49
50
52
20.61
1981 ASM - 21.95
1980 ASM 19.59
1979 ASM 15.34
1978 ASM 12.15
1977 Census 11.32
1976 ASM-- 11.06
1975 ASM ... 10.29
1974 ASM 9.69
1973 ASM 7.02
1972 Census 7.35
1971 ASM 7.00
1970 ASM 6.69
1969 ASM 6.39
1968 ASM 5.91
1967 Census... 5.44
INDUSTRY 3171, WOMEN'S HANDBAGS AND PURSES
1982 Census 10 292
8 981
8 347
7 455
7 452
7 094
6 674
6 439
5 654
5 528
5 482
4 786
4 486
4 587
4 595
4 336
86
89
89
89
88
90
89
89
89
89
89
91
90
91
92
90
1 939
1 452
1 339
1 679
1 848
1 802
1 831
1 8891 778
1 856
1 848
1 798
1 819
1 936
1 932
1 922
4.36
5.29
5.25
3.77
3.48
3.33
3.10
2.88
2.73
2.59
2.55
2.33
2.19
2.10
2.10
1.99
48
50
48
48
46
48
46
46
46
45
46
42
42
44
44
47
74
80
79
77
73
76
76
78
78
80
79
76
76
77
77
79
20 805
15 137
14 069
13 832
15 300
13 128
12 150
11 126
9 721
8 830
9 077
8 128
7 687
7 753
7 792
7 203
49
59
59
54
49
54
55
58
58
63
60
59
58
59
59
60
12.52
1981 ASM 11.75
1980 ASM 11.82
1979 ASM 9.25
1978 ASM 9.41
1977 Census 8.13
1976 ASM -... 7.47
1975 ASM 6.63
1974 ASM 6.15
1973 ASM 5.32
1972 Census 5.51
1971 ASM 4.98
1970 ASM 4.69
1969 ASM 4.39
1968 ASM 4.41
1967 Census - 4.16
See footnotes at end of table.
31B-6 LEATHER GLOVES; LUGGAGE; & MISC. GOODS MANUFACTURES- INDUSTRY SERIES

8/13/2019 1982 Census of Manu 8231 Un
http://slidepdf.com/reader/full/1982-census-of-manu-8231-un 23/48
1b. Selected Operating Ratios for the Industry: 1982 and Earlier Years-Con.
meaning of abbreviations and symbols, see introductory text. For explanation of terms, see appendixes]
Year Payroll
per
employee
(dollars)
Production
workers as
percent of
total
employment
(percent)
Annual hours
of production
workers
(number)
Average hourly
earnings of
production
workers
(dollars)
Cost of
materials as
percent of
value of
shipments
(percent)
Cost of
materials and
payroll as
percent of
value of
shipments
(percent)
Value addedper employee
(dollars)
Payroll as
percent of
value added(percent)
Value addedper production
worker hour
(dollars)
INDUSTRY 3172, PERSONAL LEATHER GOODS
Census 11 374
10 198
9 343
8 949
8 685
8 252
7 867
7 658
6 918
6 750
6 383
5 977
5 447
5 008
4 959
4 583
74
7577
81
81
81
82
81
81
81
81
8082
83
82
84
1 836
1 7591 699
1 821
1 851
1 792
1 765
1 815
1 798
1 881
1 817
1 8161 813
1 8141 8481 841
4.95
4.81
4.40
3.65
3.61
3.54
3.42
3.28
3.04
2.67
2.70
2.49
2.26
2.10
2.12
1.95
41
38
3840
42
44
43
40
41
44
43
41
43
43
43
43
68
63
63
66
69
71
71
69
70
74
73
73
7674
74
75
24 606
25 35822 944
20 466
19 250
17 294
16 533
15 728
14 385
12 806
12 496
10 727
9 533
9 114
9 298
8 276
46
4041
44
45
48
48
49
48
53
51
56
57
55
53
55
18.18
ASM 19.34
ASM— 17.57
ASM 13.96
ASM 12.76
Census 11.97
ASM 11.47
ASM 10.74
ASM 9.86
ASM.. - 8.36
CensusASM
8.50
7.34
ASM 6.41
ASM 6.06
ASM 6.15
Census 5.34
INDUSTRY 3199, LEATHER GOODS, N.E.C.
Census 10 870
10 506
9 338
8 9598 080
7 895
8 507
7 703
6 446
6 173
5 903
83
86
77
8080
81
8282
88
83
85
1 807
1 868
1 814
1 7631 800
1 771
1 828
1 6721 631
1 871
1 836
5.06
4.21
4.03
4.01
3.55
3.52
3.95
3.83
3.21
2.78
2.63
5047
49
5256
54
56
53
51
53
50
73
69
72
7480
78
77
76
7678
77
23 101
26 722
20 584
20 58115 402
15 895
18 141
15 743
13 568
8 240
11 708
47
39
45
4452
50
47
49
48
75
50
15.48
ASM... 16.62
ASM... 14.81
ASM.. 14.64
ASM. 10.63
Census 11.02
ASM. 12.15
ASM 11.42
ASM. 9.47
ASM 5.33
Census 7.53
Note: For qualifications of data, see footnotes on table 1a.
2. Industry Statistics for Selected States: 1982 and 1977
data for auxiliaries. Includes data for States with 150 employees or more. For meaning of abbreviations and symbols, see introductory text. For explanation of terms, see appendixes]
and geographic area
1982
E 1
All establishments2
Total
(no.)
With 20
employ-
ees or
more(no.)
All employees
Number3
(1,000)
Payroll
(million
dollars)
Production workers
Number
(1,000)
Hours
(millions)
Wages(million
dollars)
Value
added by
manufac-
ture4
(million
dollars)
Cost of
materials
(million
dollars)
Value of
shipments
(million
dollars)
Newcapital
expend-
itures
(million
dollars)
1977
All
employ-
ees3
(1,000)
Value
added by
manufac-
ture
(million
dollars)
3151, LEATHERAND MITTENS
United States.
.
.
York .
3161, LUGGAGE
United States.
...
.
Jersey ...
York
.
Island
.
..
E1
E6
96
3
7
3
1
24
316
292
437
3
14
27
6
12
16
64
8
12
5
10
15
4
4
54
3
7
3
1
10
310
131
18
3
2
6
12
4
4
6
40
3
4
3
9
3
2
2
3.9
AABBAAAA1.0
AA.5
16.0
1.3
EEBB.6
.7
.2
BBCC3.6
.3
.7
EE2.8
.2
CC
AA
36.6
(D)
(D)
(D)
(D)
10.8
(D)4.8
193.S
14.4
(D)
(D)
5.8
7.3
2.2
(D)
(D)
40.2
3.9
7.1
(D)
32.8
2.0
(D)
(D)
3.3
(D)
(D)
(D)
(D)
.8
(D).4
12.5
1.1
(D)
(D)
.5
.6
.2
(D)
(D)
3.0
.2
.5
(D)
1.9
.2
(D)
(D)
5.6
(D)
(D)
(D)
(D)
1.3
(D).8
21.0
2.0
(D)
(D)
.8
1.0
.3
(D)
(D)
5.3
.4
.8
(D)
3.0
.3
(D)
(D)
26.9 72.5 104.4
(D) (D) (D)
<L>) (D) (D)
(U) (D) (D)
<L>> (D) (D)
6.9 15.6 44.2
(D) (D) (D)3.3 8.5 12.5
112.5
9.4
(D)
(D)
4.0
4.9
1.6
(D)
(D)
27.0
2.6
4.3
(D)
16.2
1.3
(D)
(D)
432.8
27.2
(D)
(D)
12.5
16.1
3.6
(D)
(D)
82.7
6.7
12.8
(D)
72.1
3.6
(D)
(D)
355.5
22.4
(D)
(D)
11.2
12.5
3.1
(D)
(D)
66.2
5.8
25.9
(D)
42.7
3.1
(D)
(D)
177.6
(D)
(D)
(D)
(D)
61.6
(D)21.1
789.0
49.3
(D)
(D)
23.1
28.7
6.7
(D)
(0)
149.7
12.5
38.1
(D)
112.7
6.7
(D)
(D)
(D)
(D)
(D)
(D)
.2
(D).1
12.0
.7
(D)
(D)
.1
.5
(D)
(D)
(D)
2.4
.1
.3
(D)
3.5
.1
(D)
(D)
5.5
AA.7
AAAA1.4
.4
.8
19.2
1.1
EE(NA)
.6
.5
.7
.4
1.7
3.9
.3
.9
EE1.6
(NA)'
CC
BB
67.6
(D)
5.4
(D)
(D)
15.3
6.310.4
328.3
19.0
(D)
(NA)
7.8
9.7
7.1
6.3
23.5
60.8
5.1
14.9
(D)
27.0
(NA)
(D)
(D)
See footnotes at end of table.
INDUSTRY SERIES LEATHER GLOVES; LUGGAGE; & MISC. GOODS 31B-7

8/13/2019 1982 Census of Manu 8231 Un
http://slidepdf.com/reader/full/1982-census-of-manu-8231-un 24/48
Table 2. Industry Statistics for Selected States: 1982 and 1977-Con.
[Excludes data for auxiliaries. Includes data for States with 150 employees or more. For meaning of abbreviations and symbols, see introductory text. For explanation of terms, see appendixes]
Industry and geographic area
1982
E 1
All establishments2
Total
(no.)
With 20
employ-
ees or
more(no.)
All employees
Number3
(1,000)
Payroll
(million
dollars)
Production workers
Number(1,000)
Hours
(millions)
Wages(million
dollars)
Value
added by
manufac-
ture4
(million
dollars)
Cost of
materials
(million
dollars)
Value of
shipments
(million
dollars)
Newcapital
expend-
itures
(million
dollars)
1977
All
employ-
ees3
(1,000)
INDUSTRY 3171, WOMEN'S
HANDBAGS AND PURSES
United States
California
Connecticut
Florida
Georgia
Illinois
Maine
Massachusetts
Missouri
New Jersey
New York
North Carolina
Pennsylvania
Tennessee
Texas
INDUSTRY 3172, PERSONALLEATHER GOODS
United States
Arizona
Arkansas
California
Illinois
Indiana
Massachusetts
Missouri
New Jersey
New Mexico
New York
Pennsylvania
Rhode Island
Texas
Utah
Wisconsin
INDUSTRY 3199, LEATHERGOODS, N.E.C.
United States
California
Colorado
Illinois
Massachusetts
Missouri
New Jersey
New York
North CarolinaOklahomaPennsylvania
Tennessee
Texas
E1
E3
393
42
7
19
5
4
3
21
7
22
193
8
10
6
14
243
2
1
52
8
2
12
6
13
4
69
5
5
8
3
3
414
55
11
9
21
10
10
55
11
11
19
16
52
148
10
5
8
4
2
2
8
2
11
78
3
3
1
6
87
1
1
13
3
2
6
2
7
1
26
2
5
3
2
3
104
15
3
3
7
5
5
10
2
3
6
7
15
15.4
1.2
BB1.3
CCAA
BBEECC1.1
6.2
BB.5
BB.6
9.9
AAAA.7
AABB
EECC.8
BB2.7
AA
CC.2
AACC
6.9
1.2
.2
AA.5
.2
BB.6
.2
.2
.3
BB1.1
158.5
10.4
(D)
10.4
(D)
(D)
(D)
(D)
(D)
11.6
69.9
(D)
4.5
(D)
5.0
112.6
(D)
(D)
5.9
(D)
(D)
(D)
(D)
10.6
(D)
26.8
(D)
(D)
3.1
(D)
(D)
75.0
13.8
1.8
(D)
5.3
1.9
(D)
8.2
2.7
1.8
4.0
(D)
10.6
13.2
1.1
(D)
1.2
(D)
(D)
(D)
(D)
(D)
.9
5.2
(D)
.4
(D)
.5
7.3
(D)
(D)
.5
(D)
(D)
(D)
(D)
.7
(D)
2.1
(D)
(D)
.1
(D)
(D)
5.7
1.0
.1
(D)
.4
.2
(D)
.5
.2
.2
.3
(D)
.9
25.6
1.9
(D)
2.1
(D)
(D)
(D)
(D)
(D)
1.8
10.4
(D)
.6
(D)
.9
13.4
(D)
(D)
1.0
(D)
(D)
(D)
(D)
1.3
(D)
3.8
(D)
(D)
.3
(D)
(D)
10.3
1.9
.2
(D)
.8
.3
(D)
1.0
.3
.3
.5
(D)
1.6
111.7
6.9
(D)
8.4
(D)
(D)
(D)
(D)
(D)
8.3
46.1
(D)
3.1
(D)
3.7
66.3
(D)
(D)
4.1
(D)
(D)
(D)
(D)
7.1
(D)
17.4
(D)
(D)
.8
(D)
(D)
52.1
320.4
15.6
(D)
17.2
(D)
(D)
(D)
(D)
(D)
21.0
170.0
(D)
9.8
(D)
6.5
243.6
(D)
(D)
13.0
(D)
(D)
(D)
(D)
32.3
(D)
60.5
(D)
(D)
6.4
(D)
(D)
159.4
302.2
12.0
(D)
14.0
(D)
(D)
(D)
(D)
(D)
20.3
172.8
(D)
4.8
(D)
6.0
167.0
(D)
(D)
7.1
(D)
(D)
(D)
(D)
16.0
(D)
46.9
(D)
(D)
6.2
(D)
(D)
163.8
9.8 27.6 23.0
1.3 4.4 3.8
(D)
3.8
(D)
13.9
(D)
10.2
1.4 4.2 5.7
(D)
4.9
(D)
14.1
(D)
13.3
1.7 6.0 5.7
1.4 4.7 2.7
2.8 9.3 13.5
(D)
7.1
(D)
22.4
(D)
25.1
623.7
28.7
(D)
31.1
(D)
(D)
(D)
(D)
(D)
42.0
342.9
(D)
14.9
(D)
13.2
411.4
(D)
(D)
20.3
(D)
(D)
(D)
(D)
48.8
(D)
109.5
(D)
(D)
12.5
(D)
(D)
325.1
5.6
.2
(D)
(D)
(D)
(D)
(D)
(D)
(D)
.2
2.7
(D)
.1
(D)
.1
3.2
(D)
(D)
.2
(D)
(D)
(D)
(D)
.2
(D)
.5
(D)
(D)
(Z)
(D)
(D)
5.7
20.3
1.7
1.1
EEBB
(NA)
AA.6
CC2.9
8.4
BBCCCC.7
11.9
AA(NA)
.5
BB(NA)
1.8
EE.7
BB3.1
AACC
(NA)
(NA)
CC
8.6
51.2 .9 1.2
8.1 .1 .3
(D) (D) BB24.6 (D) .5
9.9 .1 .2
(D) (D) (NA)
2 A3 .4 1.2
11.6 (D) AA7.4 .1 .3
23.1 .1 .3
(D) (D) .8
48.0 .3 1.5
Note: For qualifications of data, see footnotes on table 1a.
'Payroll and sales data for some small single-unit companies with up to 20 employees (cutoff varied by industry) were obtained from administrative records of other government agencies
rather than from census report forms. These data were then used in conjunction with industry averages to estimate the items shown for these small establishments. This technique was also usedfor a small number of other establishments whose reports were not received at time data were tabulated. The following symbols are shown for those States where estimated data based onadministrative records data account for 10 percent or more of figures shown: E1 — 10 to 19 percent; E2—20 to 29 percent; E3—30 to 39 percent; E4— 40 to 49 percent; E5-50 to 59 percent; E6-60 to 69 percent; E7—70 to 79 percent; E8—80 to 89 percent; E9— 90 percent or more.
includes establishments with payroll at any time during year.
statistics for some producing States have been withheld to avoid disclosing data for individual companies. However, for States with 1 50 employees or more, number of establishments is
shown and employment size range is indicated by one of the following symbols: AA— 150 to 249 employees; BB—250 to 499 employees; CC-500 to 999 employees; EE-1,000 to 2,499
employees; FF— 2,500 employees or more.
•Beginning in 1982, all respondents were requested to report their inventories at cost or market prior to adjustment to UFO cost. This is a change from prior years in which respondents
were permitted to value their inventories using any generally accepted accounting method. Consequently, data for inventories and value added by manufacture are not comparable to prior-year
data.
31B-8 LEATHER GLOVES; LUGGAGE; & MISC. GOODS MANUFACTURES- INDUSTRY SERIES

8/13/2019 1982 Census of Manu 8231 Un
http://slidepdf.com/reader/full/1982-census-of-manu-8231-un 25/48
3a. Summary Statistics for the Industry: 1982
of abbreviations and symbols, see introductory text. For explanation of terms, see appendixes]
Item
Leather gloves and
mittens
(SIC 3151)
Luggage(SIC 3161)
Women's handbags and
purses
(SIC 3171)
Personal leather goods(SIC 3172)
Leather goods, n.e.c.
(SIC 3199)
number.
2 do.
1 to 19 employees do.
20 to 99 employees do.
100 employees or more do.
for year 1,000.
payroll3 mil. dol..
on workers:
for year 1,000.
do.
do.
do.
do.
millions.
to March do.
to June do.
to September do.
to December do.
mil. dol..
by manufacture4 do.
materials, etc.5 do.
parts, containers, etc., consumed do.
do.
consumed6 do.
electric energy7 do.
work do.
shipments, including resales do.
of resales do.
inventories (see tables 3b and 3c)
expenditures for plant and equipment6 do.
capital expenditures do.
buildings and other structures do.
machinery and equipment do.
capital expenditures do.
product specialization ratio9 percent.
ratio' do.
80
96
42
43
11
3.9
36.6
3.3
3.3
3.4
3.2
3.3
5.6
1.4
1.4
1.3
1.5
26.9
72.5
104.4
70.5
25.7
1.8
1.9
4.4
177.6
42.6
1.3
.7
.2
.5
86
81
287
292
161
96
35
16.0
193.8
12.5
12.7
12.3
12.5
12.4
21.0
5.0
5.3
5.4
5.3
112.5
432.8
355.5
271.5
67.2
3.0
5.3
8.6
789.0
123.7
15.2
12.0
2.5
9.5
3.3
93
95
383
393
245
110
38
15.4
158.5
13.2
13.1
12.9
13.8
12.9
25.6
6.4
6.4
6.5
6.2
111.7
320.4
302.2
208.2
(D)
.9
3.4
(D)
623.7
(D)
6.0
5.6
1.4
4.2
.4
96
94
239
243
156
66
21
9.9
112.6
7.3
6.9
7.2
7.6
7.7
13.4
3.0
3.5
3.4
3.5
66.3
243.6
167.0
123.2
37.6
1.2
2.4
2.5
411.4
62.3
4.9
3.2
.1
3.0
1.8
94
83
399
414
310
93
11
6.9
75.0
5.7
5.8
5.8
5.7
5.5
10.3
2.5
2.6
2.5
2.6
52.1
159.4
163.8
142.4
15.4
1.8
2.7
1.5
325.1
22.6
6.5
5.7
1.9
3.8
.8
96
94
'For the census, a company is defined as a business organization consisting of one establishment or more under common ownership or control.
includes establishments with payroll at any time during year.
3Data on supplemental labor costs are not included in annual payroll, but are shown in table 3d.
Value added by manufacture is computed using inventory data reported on a cost or market basis prior to any adjustment to LIFO cost. See table 3b, footnote 1 for further explanation.5Data on purchased services for the repair of buildings and machinery and for communication services are not included in cost of materials, etc., but are shown in table 3d.6Data on purchased fuels by type were not collected for 1982. See MC82-S-4, Fuels and Electric Energy Consumed, for 1981 data on purchased fuels by type.7Data on quantity of electric energy used for heat and power are included in table 3d.6Data on capital expenditures for new machinery and equipment by type, depreciable assets, retirements, rental payments, and depreciation are included in table 3d.
Represents ratio of primary product shipments to total product shipments (primary and secondary, excluding miscellaneous receipts) for establishments classified in industry.
' Represents ratio of primary products shipped by establishments classified in industry to total shipments of such products by all manufacturing establishments, wherever classified.
3b. Value of Inventories for the Industry: End of 1981 and 1982
dollars. For meaning of abbreviations and symbols, see introductory text. For explanation of terms, see appendixes]
Item
Leather gloves and
mittens
(SIC 3151)
End of
1981
End of
1982
Luggage
(SIC 3161)
End of
1981
End of
1982
Women's handbags and
purses
(SIC 3171)
End of
1981
End of
1982
Personal leather goods
(SIC 3172)
End of
1981
End of
1982
Leather goods, n.e.c.
(SIC 3199)
End of
1981
End of
1982
Total inventories'
method of valuation:
to LIFO costing2
reserve
value.
to LIFO costing
method not reported3
subject to LIFO reported without associated
and value4
stage of fabrication:
goods
in process
and supplies
35.2
8.1
2.4
5.7
20.9
6.3
14.4
6.3
14.5
33.0
7.7
2.4
5.4
19.9
5.4
14.4
5.5
13.2
156.1
80.2
12.0
68.2
40.2
35.2
83.1
17.2
55.8
150.7
71.9
12.0
59.9
44.4
34.0
.5
84.9
14.7
51.1
77.5
(S)
(S)
(S)
46.3
(S)
(S)
36.0
12.3
29.3
76.6
(S)
(S)
(S)
51.8
(S)
(S)
36.3
11.0
29.3
100.0
15.6
4.8
10.8
58.0
26.3
.1
59.1
8.7
32.3
97.2
18.0
6.3
11.7
61.1
18.0
.1
60.1
6.8
30.3
59.1
8.6
1.6
6.9
22.3
27.8
28.2
11.2
19.7
57.2
9.4
1.9
7.6
24.8
22.5
.5
28.0
9.5
19.7
'Effective with the 1982 Economic Censuses, uniform instructions for reporting inventories were introduced for all sector reports. Prior to 1982, respondents were permitted to value
using any generally accepted accounting method (LIFO, FIFO, market, to name a few). In 1982, all respondents were requested to report inventories at cost or market. LIFO users were
first report inventory values prior to the LIFO adjustment and then to report the LIFO reserve and the LIFO value after adjustment for the reserve. For further explanation, see inventories
2Only includes data reported by respondents who (a) indicated amount of inventories subject to LIFO cost, and (b) provided sufficient information to determine associated LIFO reserve
figures.
includes data estimated for nonresponse and nonmail administrative records and data reported by respondents who provided total inventory figures without other information.
Includes data reported by respondents who indicated their inventories were subject to LIFO cost, but did not provide associated LIFO reserve and value figures.
INDUSTRY SERIES LEATHER GLOVES; LUGGAGE; & MISC. GOODS 31B-9

8/13/2019 1982 Census of Manu 8231 Un
http://slidepdf.com/reader/full/1982-census-of-manu-8231-un 26/48
Table 3c. Inventories by Specific Method of Valuation for the Industry: End of 1982
[For meaning of abbreviations and symbols, see introductory text. For explanation of terms, see appendixes]
Item
Leather gloves andmittens
(SIC 3151)
Percent
of total
Absolute
standard
error
(percent)
Luggage
(SIC 3161)
Percent
of total
Absolute
standard
error
(percent)
Women's handbags and
purses
(SIC 3171)
Percent
of total
Absolute
standard
error
(percent)
Personal leather goods
(SIC 3172)
Percent
of total
Absolute
standard
error
(percent)
Leather goods, n.e.c.
(SIC 3199)
Percent
of total
Absolu
standa
er
(perce
Total Inventories
Last-In, First-Out (LIFO) methods ..
Non-LIFO methods
Cost basis:
First-ln, First-Out (FIFO)
Average cost
Specific or actual cost
Standard cost
Other —Market basis:
Market lower than cost
Market always used
Valuation method not reported
Amount subject to LIFO reported without associated reserve
and value
100.0
23.4
60.2
43.7
(S)
(S)
(S)
(S)
2.2
(S)
16.4
(Z)
(X)
(X)
(X)
7.8
(S)
(S)
(S)
(S)
.8
(S)
(X)
(X)
100.0
47.7
29.5
26.4
(S)
.5
1.8
(S)
(S)
(S)
22.5
.3
(X)
(X)
(X)
1.0
(S)
.1
.5
(S)
(S)
(S)
(X)
(X)
100.0
(S)
67.7
39.9
(S)
7.5
11.2
(S)
3.1
(S)
(S)
(S)
(X)
(X)
(X)
6.7
(S)
1.7
2.5
(S)
1.1
(S)
(X)
(X)
100.0
18.5
62.8
45.2
(S)
4.2
9.2
4.2
(S)
(S)
18.5
.1
(X)
(X)
(X)
5.4
(S)
1.3
2.8
1.7
(S)
(S)
(X)
(X)
100.0
16.5
43.3
18.5
(S)
(S)
(S)
(S)
(S)
(S)
39.3
.9
Note: The percentages shown for the LIFO and non-LIFO totals and the categories valuation method not reported and amount subject to LIFO reported... are based on the cens
universe estimates included in table 3b. The percentages shown for the specific non-LIFO methods of valuation (e.g., FIFO, etc.) are based on a representative sample of establishments includ
in the annual survey of manufactures (ASM) panel for 1982 (see appendixes for description of ASM). The absolute standard error of each of the ASM estimates is shown above.
Table 3d. Supplemental Industry Statistics Based on Sample Estimates: 1982
[For meaning of abbreviations and symbols, see introductory text. For explanation of terms, see appendixes]
Item
Leather gloves and
mittens
(SIC 3151)
Amount(million
dollars)
Relative
standard
error of
estimate1
(percent)
Luggage(SIC 3161)
Amount(million
dollars)
Relative
standard
error of
estimate1
(percent)
Women's handbags and
purses
(SIC 3171)
Amount(million
dollars)
Relative
standard
error of
estimate1
(percent)
Personal leather goods
(SIC 3172)
Amount(million
dollars)
Relative
standard
error of
estimate1
(percent)
Leather goods, n.e.c.
(SIC 3199)
Amount(million
dollars)
Relati
standa
error
estima
(perce
Supplemental labor costs:
Total
Legal costs
Voluntary costs
Purchased services:
Cost of purchased services for the repair of—Buildings and other structures
Response coverage ratio (percent)2
Machinery
Response coverage ratio (percent)2
Cost of purchased communication services
Response coverage ratio (percent)2
Electric energy used for heat and power:
Purchased:
Quantity (million kWh)
Cost
Generated less sold (million kWh)
Gross book value of depreciable assets:
Total:
Beginning of year
New capital expenditures
Used capital expenditures
Retirements
End of year
Buildings and other structures:
Beginning of year
New capital expenditures
Used capital expenditures
Retirements
End of year
Machinery and equipment:
Beginning of year
New capital expenditures
Automobiles, trucks, etc., for highway use.
Computers and peripheral data processing
equipment
All other
New machinery and equipment, n.s.k.3
Used capital expenditures
Retirements
End of year
Rental payments:
Total
Buildings and other structures
Machinery and equipment
Depreciation charges during 1 982:
Total
Buildings and other structures
Machinery and equipment
5.0
3.0
2.0
.1
84.2
.4
84.2
.8
93.1
15.6
1.9
18.0
.5
1.2
.4
19.3
6.8
.2
(Z)
6.9
11.3
.4
.1
(Z)
.2
(Z)
1.2
.4
12.4
1.0
.8
.2
1.8
.8
1.0
12
10
20
19
(X)
48
(X)
61
(X)
13
(X)
15
30
48
52
16
41
1
1
40
14
41
70
30
35
(S)
48
52
16
57
66
30
25
73
23
35.0
19.5
15.5
.5
44.7
3.1
56.2
2.0
64.6
94.1
5.3
(S)
118.7
8.0
2.4
5.6
123.6
46.2
.9
.2
2.2
45.1
72.6
7.1
.5
.7
5.1
.8
2.2
3.4
78.5
3.4
2.2
1.1
9.0
2.3
6.8
1
(X)
15
(X)
10
(X)
8
(X)
(S)
6
16
16
21
6
9
16
1
49
9
6
16
55
12
23
30
17
9
5
21
24
17
16.4
9.7
6.7
.4
56.8
.3
46.3
.5
58.4
56.3
3.4
42.7
3.6
.1
2.4
43.9
9.1
.8
(Z)
.7
9.3
33.6
2.7
.4
.1
1.6
.7
.1
1.8
34.6
5.9
4.5
1.4
4.2
.8
3.4
20
21
19
1
(X)
13
(X)
37
(X)
11
(X)
8
38
31
63
7
15
19
1
63
15
7
46
91
1
51
72
54
63
8
26
30
28
22.0
10.5
11.5
.3
66.9
.8
66.9
.7
66.9
35.8
2.4
35.8
3.0
4.8
1.1
42.4
12.4
.1
4.5
.1
16.9
23.4
2.8
.7
.2
1.7
.3
.3
1.0
25.6
3.6
1.9
1.8
4.1
.5
3.5
1
(X)
17
(X)
23
(X)
1
(X)
6
29
79
27
11
12
26
85
18
18
6
29
54
83
21
75
7
30
7
17
36
8
9
9
10
10.0
5.6
4.3
.5
48.5
1.1
64.7
.4
46.3
42.7
2.7
53.0
7.5
1.7
8.8
53.4
26.0
1.8
1.4
4.5
24.7
27.0
5.7
.1
.5
2.8
2.3
.3
4.2
28.8
5.7
1.8
3.8
3.9
1.5
2.4
See footnotes at end of table.
31B-10 LEATHER GLOVES; LUGGAGE; & MISC. GOODS MANUFACTURES- INDUSTRY SERIE

8/13/2019 1982 Census of Manu 8231 Un
http://slidepdf.com/reader/full/1982-census-of-manu-8231-un 27/48
3d. Supplemental Industry Statistics Based on Sample Estimates: 1982-Con.
Note: Data for total new capital expenditures, new building expenditures, new machinery expenditures, and total used expenditures are also shown in table 3a. Data in table 3a are census
totals and may differ from annual survey of manufactures (ASM) sample estimates shown in this table. Data in this table represent best estimates of year-to-year change as measured by
ASM sample. However, they are subject to sampling error and, hence, as estimates of level, are not as reliable as universe figures shown in table 3a.
1 For description of relative standard error of estimate, see Qualifications of the Data in appendixes.2Measure of extent to which respondents reported each item. Derived for each item by calculating the ratio of weighted employment for those sample establishments that reported the
inquiry to weighted total employment for all sample establishments classified in industry. (See appendixes for explanation of sample weight.)
Represents total machinery and equipment expenditures for establishments that did not break down their expenditures by specific type.
4. Industry Statistics by Employment Size of Establishment: 1982
of abbreviations and symbols, see introductory text. For explanation of terms, see appendixes]
Industry and employment size class
All
estab-
lish-
ments
(no.)
All employees
Number(1,000)
Payroll
(million
dollars)
Production workers
Number
(1,000)
Hours
(millions)
Wages(million
dollars)
Value
added by
manufac-
ture
(million
dollars)
Cost of
materials
(million
dollars)
Value of
shipments
(million
dollars)
Newcapital
expend-
itures
(million
dollars)
End-of-
year
inven-
tories
(million
dollars)
3151, LEATHER GLOVES AND
Total.
with an average of—employees
employees
19 employees
49 employees
99 employees
249 employees
by administrative records2
3161, LUGGAGE
Total
with an average of—employees
employees
19 employees
49 employees
99 employees
249 employees
499 employees
999 employees
to 2,499 employees
by administrative records2
3171, WOMEN'S HANDBAGSPURSES
Total
with an average of—
employeesemployees
19 employees
49 employees
99 employees
249 employees
499 employees
999 employees
by administrative records2
3172, PERSONAL LEATHER
Total
with an average of—employees
employees
19 employees
49 employees
99 employees
249 employees
499 employees
999 employees
by administrative records2
3199, LEATHER GOODS, N.E.C.
Total-
with an average of—employees
employees
19 employees
49 employees
99 employees
249 employees499 employees
by administrative records2
E9
E9
E9
96
19
617
28
15
11
24
292
65
38
58
60
36
23
7
3
2
87
393
11957
69
69
41
26
8
4
104
243
84
35
37
39
27
12
7
2
65
414
181
72
57
73
20
9
2
120
3.9
(Z)
(Z)
.3
1.0
1.0
1.6
16.0
.1
.3
.8
2.0
2.4
3.4
2.4
(D)
.5
15.4
.2
.4
1.0
2.2
2.8
3.9
2.5
2.4
9.9
.2
.2
.5
1.2
1.9
2.0
3.8
W)
.3
6.9
.3
.5
.8
2.2
1.4
1Z(D)
.3
36.6
.4
.4
2.4
9.3
8.4
15.7
1.4
193.8
1.4
2.8
8.2
19.7
23.7
36.6
27.7
73.6
(D)
4.7
158.5
2.1
3.6
9.6
22.5
27.5
42.3
29.0
21.8
3.1
112.6
1.6
2.2
4.4
12.2
22.6
21.8
47.8
(D)
2.1
75.0
3.3
4.2
8.7
24.8
14.0
20.0
ID)
2.6
3.3
(Z)
(Z)
.2
.9
.9
1.3
12.5
.1
.2
.7
1.6
2.1
2.7
2.0
3J.(D)
.4
13.2
.2
.3
.9
1.9
2.4
3.3
2.1
2.1
7.3
.1
.2
.4
1.0
1.4
1.4
Z8(D)
.2
5.7
.3
.4
.7
1.9
1.1
14(D)
.3
5.6
.1
.1
.4
1.5
1.4
2.2
21.0
.2
.4
1.1
2.7
3.5
4.8
3.3
5£(D)
.7
25.6
.4
.7
1.6
3.5
4.5
6.1
4.1
4.8
13.4
.2
.3
.7
1.8
2.8
2.5
5X)
(D)
.3
10.3
.5
.7
1.3
3.3
1.9
2,6
(D)
.5
26.9
.3
.3
1.8
6.9
6.5
11.1
1.1
112.5
1.1
1.9
5.7
12.7
16.4
21.7
17.7
35.2
(D)
3.1
111.7
1.9
2.7
7.1
16.4
18.9
28.7
18.3
17.6
2.6
66.3
1.2
1.4
3.0
8.4
12.7
11.3
28.3
(D)
1.4
52.1
3.0
3.0
5.9
17.0
9.2
14.1
ID)
2.2
72.5
.8
.7
3.8
20.1
16.4
30.8
2.2
432.8
320.4
4.9
6.2
17.1
38.4
60.4
67.7
89.3
36.3
5.9
243.6
4.1
6.7
10.5
25.3
60.4
41.7
94.9
ID)
5.3
159.4
8.0
8.4
16.3
51.3
27.3
48.1
(D)
6.0
104.4
1.2
1.1
5.0
23.6
21.5
52.0
3.4
355.5
2.7
4.9
13.2
29.4
48.8
67.4
57.5
131.5
(D)
9.2
302.2
4.7
7.5
14.5
38.5
50.8
58.0
102.5
25.8
5.7
167.0
3.0
3.8
6.5
18.0
35.8
29.7
70.1
ID)
3.0
163.8
8.3
9.3
14.8
55.7
32.2
43.6
(D)
6.0
177.6
2.0
1.8
8.8
43.7
38.9
82.4
5.7
789.0
6.1
10.7
30.2
64.4
110.0
146.9
103.8
316.8
(D)
19.5
623.7
9.7
14.5
31.9
77.0
110.2
126.7
190.5
63.1
11.7
411.4
325.1
(Z)
(Z)
(Z)
.2
.1
.4
(Z)
12.0
.1
.2
.4
1.5
1.3
1.0
1.3
63(D)
.3
5.6
.1
.1
.3
.9
1.4
1.0
.9
.9
3.2
.1
(Z)
.1
.3
.9
.7
LI(D)
(Z)
5.7
33.0
.3
.3
1.6
7.5
8.0
15.3
1.0
150.7
.9
2.0
6.5
11.2
19.7
34.1
20455.9
(D)
3.4
76.6
1.2
1.6
3.4
8.6
13.3
17.2
21.2
10.1
1.4
97.2
1.3
2.2
3.2
7.3
22.7
14.4
46.1
1D5
2.0
57.2
16.5 .1 3.1
17.8 .2 3.4
31.4 .3 5.4
107.2 1.5 17.9
59.0 .3 10.9
93.2 3.3 16.5
(D) (Dj ID)
12.2 .1 2.5
Note: For qualifications of data, see footnotes on table 1a. Data shown as a (D) are included in underscored figures above.
'Payroll and sales data for some small single-unit companies with up to 20 employees (cutoff varied by industry) were obtained from administrative records of other government agenciesfrom census report forms. These data were then used in conjunction with industry averages to estimate the items shown for these small establishments. This technique was also usednumber of other establishments whose reports were not received at time data were tabulated. The following symbols are shown for those States where estimated data based on
records data account for 10 percent or more of figures shown: E1 -10 to 19 percent; E2-20 to 29 percent; E3-30 to 39 percent; E4-40 to 49 percent; E5-50 to 59 percent; E6-percent; E7-70 to 79 percent; E8-80 to 89 percent; E9-90 percent or more.2Report forms were not mailed to small single-unit companies with up to 20 employees (cutoff varied by industry). Payroll and sales data for 1982 were obtained from administrative records
by other agencies of the Federal Government. Those data were then used in conjunction with industry averages to estimate the items shown. Data are also included in respective size
shown.
INDUSTRY SERIES LEATHER GLOVES; LUGGAGE; & MISC. GOODS 31B-11

8/13/2019 1982 Census of Manu 8231 Un
http://slidepdf.com/reader/full/1982-census-of-manu-8231-un 28/48
Table 5a. Industry Statistics by Industry and Primary Product Class Specialization: 1982
[Table presents selected statistics for establishments according to their degree of specialization in products primary to their industry. Measures of plant specialization shown are (1) indus
specialization: ratio of primary product shipments to total product shipments (primary plus secondary, excluding miscellaneous receipts) for the establishment; and (2) product class specializati
ratio of largest primary product class shipments to total product shipments (primary plus secondary, excluding miscellaneous receipts) for the establishment. See appendix for method of comput
ratios. Statistics for establishments with specialization ratios of less than 75 percent are included in total lines but are not shown as a separate class. In addition, data may not be shownvarious reasons; e.g., to avoid disclosing data for individual companies. For meaning of abbreviations and symbols, see introductory text. For explanation of terms, see appendixes.]
Indus-
try or
prod-
uct
class
code
Industry or product class by percent of specialization
All
estab-
lish-
ments
(number)
All employees
Number
(1,000)
Payroll
(million
dollars)
Production workers
Number
(1,000)
Hours
(millions)
Wages(million
dollars)
Value
added by
manufac-
ture
(million
dollars)
Cost of
materials
(million
dollars)
Value of
shipments
(million
dollars)
Ncap
expe
it
(mil
doll
31S1
3161
3171
3172
3199
Leather gloves and mittens:
Entire industry
Establishments with 75 percent specialization or more
Luggage:
Entire industry
Establishments with 75 percent specialization or more
Women's handbags and purses:
Entire industry
Establishments with 75 percent specialization or more
Personal leather goods, n.e.c:
Entire industry
Establishments with 75 percent specialization or more
Leather goods, n.e.c:
Entire industry
Establishments with 75 percent specialization or more
96
76
292
271
393
370
243
225
414
394
3.9
2.4
16.0
13.6
15.4
14.4
9.9
8.9
6.9
6.5
36.6
20.5
193.8
166.6
158.5
150.3
112.6
100.8
75.0
70.6
3.3
2.1
12.5
10.5
13.2
12.4
7.3
6.6
5.7
5.3
5.6
3.4
21.0
18.0
25.6
24.3
13.4
11.7
10.3
9.7
26.9
16.3
112.5
94.1
111.7
106.0
66.3
59.7
52.1
49.1
72.5
42.3
432.8
369.3
320.4
303.7
243.6
221.1
159.4
150.8
104.4
54.0
355.5
316.8
302.2
291.8
167.0
150.3
163.8
156.8
177.6
96.5
789.0
689.8
623.7
596.7
411.4
371.2
325.1
309.5
1
Note: For qualifications of data, see footnotes on table 1a.
Table 5b. Industry-Product Analysis— Value of Shipments and Primary Product Shipments,
Specialization and Coverage Ratios for the Industry: 1982 and Earlier Census
Years
[An establishment is assigned to an industry based on shipment values of products representing largest amount considered primary to an industry. Frequently, establishment shipments compr
mixtures of products assigned to an industry (primary), those considered primary to other industries (secondary), and receipts for activities such as merchandising or contract work. Columns A
show this product pattern for an industry, and column E shows primary product specialization ratio. The extent to which an industry's primary products are shipped by establishments classified
and out of an industry is shown in columns F-H and coverage ratio is shown in column I. For meaning of abbreviations and symbols, see introductory text. For explanation of terms, s
appendixes]
Industry
and
product
group
code
Industry and census year
Value of shipments
Total
(million
dollars)
Primary
products
(million
dollars)
B
Secondary
products
(million
dollars)
Miscel-
laneous
receipts
(million
dollars)
Primary
product
special-
ization
ratio
Col. B-=-
Col. B+C(percent)
Value of primary product shipments
Total
made in
all indus-
tries
(million
dollars)
Made in
this
industry
(million
dollars)
Made in
other
indus-
tries
(million
dollars)
H
Covera
r
Col. BCol
(perce
3151
3161
3171
3172
3199
Leather gloves and mittens 1982—1977-.
1972..
Luggage 1982—1977..
1972..
Women's handbags and purses 1982..
1977..
1972..
Personal leather goods 1982—1977..
1972..
Leather goods, n.e.c. 1982—1977..
1972..
177.6
178.0
98.2
789.0
654.9
364.5
623.7
505.2
365.0
411.4
366.8
242.2
325.1
284.2
161.3
112.9
104.1
67.8
615.3
575.3
314.0
495.8
425.1
334.2
327.4
335.5
211.0
288.1
225.4
132.1
18.6
20.9
5.4
44.0
34.2
25.5
20.0
13.3
15.0
20.9
12.4
12.7
11.7
13.6
10.1
46.1
53.0
24.9
129.7
45.4
25.0
107.9
66.8
15.7
63.1
18.8
18.4
25.4
45.2
19.2
86
83
92
93
94
92
96
97
95
94
96
94
96
94
92
138.7
121.9
79.9
647.3
585.3
321.9
524.9
436.2
344.4
393.1
369.2
231.8
305.1
237.4
146.1
112.9
104.1
67.8
615.3
575.3
314.0
495.8
425.1
334.2
327.4
335.5
211.0
288.1
225.4
132.1
25.8
17.8
12.1
32.0
10.0
7.9
29.1
11.1
10.2
65.6
33.7
20.8
17.0
12.0
14.0
31B-12 LEATHER GLOVES; LUGGAGE; & MISC. GOODS MANUFACTURES- INDUSTRY SERIE

8/13/2019 1982 Census of Manu 8231 Un
http://slidepdf.com/reader/full/1982-census-of-manu-8231-un 29/48
5c-i. Industry-Product Analysis— Shipments by Product Class and Industry: 1982
on dollars. Table shows where products of an industry (referred to as primary and listed in table 6a) are made and what products are made by establishments classified in an industry. Head
an industry column to find what products are produced in an industry. Only those product groups that have at least $2 million in shipments from establishments classified in one of industries
in this chapter are shown. Read across to determine where products of industries in this chapter are produced. To extent that some of primary products are made in industries not
in this chapter, value of such shipments is shown in Other industries column. Specified Other industries are listed in table 5c-2 if they account for more than $5 million of products
to this chapter . For meaning of abbreviations and symbols, see explanatory text. For explanation of terms, see appendixes]
Product group, product class, and miscellaneous receiptsAll
industries
Leather gloves
and mittens
(SIC 3151)
Luggage
(SIC 3161)
Women'shandbags and
purses
(SIC 3171)
Personal
leather goods,
n.e.c.
(SIC 3172)
Leather goods,
n.e.c.
(SIC 3199)
Other
industries
0 00
00
00
Total
Primary products
Secondary products
Miscellaneous receipts
Leather gloves and mittens
Suitcases, briefcases, bags, and musical instrument
cases
Women's and children's handbags and purses
Personal leather goods, except handbags and purses..
Saddlery, harnesses and whips, and other leather
products, n.e.c
OTHER SHIPMENTS BY FOUR-DIGIT PRODUCTGROUP
Fabric dress and work gloves
Apparel belts
Wood products, n.e.c
Upholstered household furniture
Surgical appliances and supplies
Costume jewelry
MISCELLANEOUS RECEIPTS
Receipts for work done tor others on their materials
Miscellaneous receipts, including receipts for repair work,
sales of scrap and refuse, etc
Sales of products bought and resold without further
manufacture, processing, or assembly at establishment.—
(X)
(X)
(X)
(X)
138.7
647.3
524.9
393.1
305.1
(X)
(X)
(X)
(X)
(X)
(X)
(X)
(X)
(X)
177.6
112.9
18.6
46.1
112.9
(D)
14.3
(D)
(D)
(D)
42.6
789.0
615.3
44.0
129.7
615.3
19.8
8.9
(D)
(D)
(D)
(D)
(D)
(D)
2.3
3.7
123.7
623.7
495.8
20.0
107.9
(D)
495.8
7.3
(D)
(D)
(D)
5.6
(D)
(D)
411.4
327.4
20.9
63.1
2.8
4.2
327.4
1.4
(D)
(D)
3.2
(D)
(D)
62.3
325.1
288.1
11.7
25.4
(D)
(D)
(Z)
1.9
288.1
1.6
(D)
2.1
.7
22.6
(X)
(X)
(X)
(X)
(D)
(D)
5.1
47.6
(D)
(X)
(X)
(X)
(X)
(X)
(X)
(X)
(X)
(X)
5c-2. Industry-Product Analysis—Other Industries With Shipments of Primary
Products: 1982
dollars.
Tableis
a continuationof
table 5c-1 and shows where products ofindustries in
this chapter(referred
to as primary products and listedin
table 6a) are made. To extent that some ofproducts are made in industries not included in this chapter, value of such shipments is shown in Other industries column of table 5c-1. Specified Other industries are listed in this table
account for more than $5 million of products primary to this chapter. For meaning of abbreviations and symbols, see introductory text. For explanation of terms, see appendixes]
productOther industries
Value
1982 product
codeOther industries
Value
LEATHER GLOVES AND MITTENS
2381 Fabric dress and work gloves 21.7
(D)
3172- PERSONAL LEATHER GOODS, N.E.C.
2387 Apparel belts
2782 Blankbooks and looseleaf binders
LUGGAGE
2782 Blankbooks and looseleaf binders
30.3
(D)
INDUSTRY SERIES LEATHER GLOVES; LUGGAGE; & MISC. GOODS 31B-13

8/13/2019 1982 Census of Manu 8231 Un
http://slidepdf.com/reader/full/1982-census-of-manu-8231-un 30/48
Table 6a. Product and Product Classes—Quantity and Value of Shipments by All Producers:
1982 and 1977
[Includes quantity and value of products of this industry produced by (1) establishments classified in this industry (primary) and (2) establishments classified in other industries (secondary). Transf
of products of this industry from one establishment of a company to another establishment of the same company (interplant transfers) are also included. For further explanation, see Value
Shipments in appendix. For meaning of abbreviations and symbols, see introductory text]
1982
product
code
Product
1982
Number of
companies
with
shipments
of
$100,000
or more
Product shipments 1
Quantity2
Value
(million
dollars)
1977
Number of
companies
with
shipments
of
$100,000
or more
Product shipments 1
Quantity2
3151
31510 —31510 20
31510 70
31510 81
31510 83
31510 89
31510 75
31510 00
31510 02
3161
31610 —
31610 16
31610 18
31610 24
31610 35
31610 37
31610 32
31610 39
31610 43
31610 53
31610 63
31610 73
31610 81
31610 84
31610 86
31610 00
31610 02
3171
31710 —31710 11
31710 51
31710 71
31710 00
31710 02
3172- —
31720 —
31720 11
31720 15
31720 31
31720 53
31720 61
31720 93
31720 97
31720 00
LEATHER GLOVES AND MITTENS
Total
Dress and work gloves and mittens, all leather:
Dress and semidress:
As reported in the census of manufactures
As reported in the Current Industrial Report MA-23D,
Gloves and Mittens 1,000 doz
pairs..
Work gloves and mittens:
As reported in the census of manufactures
As reported in the Current Industrial Report MA-23D,
Gloves and Mittens 1,000 doz
pairs..
All grain, except welders do..
All split, except welders do—Leather, except all grain and all split (including
welders) do..
Work gloves and mittens, n.s.k. do..
Leather gloves and mittens, n.s.k., typically for
establishments with 5 employees or more (see note)
Leather gloves and mittens, n.s.k., typically for
establishments with less than 5 employees (see note)
LUGGAGE
Total
Suitcases, briefcases, bags, and musical instrument cases:
Women's hand luggage, all types (except zippered) thousands-
Hard side do..
Soft side (lock construction) do..
Molded (fully molded and semimolded) do..
Men's hand luggage, all types (except zippered) do..
Hard side do..
Soft side (lock construction) do..
Molded (fully molded or semimolded) do..
Zippered hand luggage, men's and women's do..
Tote bags, open without closures do..
Occupational luggage cases, sample cases, binocular and
camera cases do..
Trunks, hand trunks, and lockers do..
Briefcases, brief bags, school bags, envelopes, catalog
cases, and zippered ring binders do—Musical instrument cases do..
Attache cases do..
Other luggage do..
Luggage, n.s.k., typically for establishments with 10
employees or more (see note)
Luggage, n.s.k., typically for establishments with less than
10 employees (see note)
WOMEN'S HANDBAGS AND PURSES
Total
Women's and children's handbags and purses:
All leather and chiefly leather millions.
Plastics or chiefly plastics do.
Other materials, except precious metal do.
Women's and children's handbags and purses, n.s.k.,
typically for establishments with 10 employees or more(see note)
Women's and children's handbags and purses, n.s.k.,
typically for establishments with less than 1 employees
(see note)
PERSONAL LEATHER GOODS, N.E.C.
Total
Personal leather goods, except handbags and purses:
Billfolds, wallets, French purses, and clutches thousands.
Leather do.
Other than leather (plastics, fiber, etc.) do.
Travel kits (fitted and unfitted) do.
Jewelry boxes and cases (leather, plastics, wood, etc.,
except precious metal) do.
Leather compacts and vanity cases do.
Other personal goods (including key, cigarette, eyeglass,
pass card, and instrument (except musical) cases; pocket
secretaries; tobacco pouches, cosmetic bags, etc.):
Leather
Other than leather (plastics, fiber, etc.)
Personal leather goods, n.e.c, n.s.k., typically for
establishments with 5 employees or more (see note)
(NA)
16
(NA)
47
(NA)
(NA)
(NA)
(NA)
(NA)
(NA)
(NA)
(NA)
J
(NA)
93
52
45
(NA)
(NA)
(NA)
60
51
18
8
12
3
30
44
(NA)
(X)
(X)
969
(X)
1 747
1 017
418
312
(X)
(X)
(X)
(NA)
3
10
4
(NA)
2 432.7
(D)
(S)
(D)
1 066.9
(NA) (S)
6
37
15
901.6
6 304.7
(S)
36
17
**5 324.3
985.9
30 3 663.4
22
27
18
1 251.3*2 157.0*7 938.3
(NA) (X)
(NA) (X)
(X)
13.2
12.4
11.0
(X)
(X)
(X)
45 408.4
*27 391.0
18 017.4
1 848.5
(S)
1 256.3
(X)
(X)
(X)
138.7
32.3
33.6
94.2
95.5
(X)
(X)
(X)
(X)
6.5
5.7
647.3
88.2
(D)
21.2
(D)
50.5
19.0
31.5
165.7
14.7
45.1
23.0
34.9
19.6
56.4
46.0
83.8
19.5
524.9
234.9
111.6
72.2
94.5
11.7
393.1
186.9
157.8
29.1
10.0
26.4
1.8
38.1
65.2
56.3
(NA)
20
(NA)
52
(NA)
(NA)
(NA)
(NA)
(NA)
(NA)
(NA)
(NA)
(NA)
7
17
6
(NA)
(NA)
6
34
(NA)
24
7
1812
23
(NA)
(NA)
(NA)
(NA)
52
67
35
(NA)
(NA)
(NA)
(NA)
26
6
12
16
(
5)
529
29
(NA)
(X)
(X)
412
(X)
2 315
1 173
396
463
283
(X)
(X)
(X)
5 123.0
(D)
*1 946.4
(D)
2 956.9
1 397.5
1 559.4
*9 916.7
(X)
•3 569.7
*1 619.9
5 395.2
641.0*3 875.7
(X)
(X)
(X)
(X)
(S)
•25.1
(S)
(X)
(X)
(X)
(S)
•23 078.2
(S)
(S)
*13 091.2
(X)
(X)
(X)
(X)
See footnotes at end of table.
31B-14 LEATHER GLOVES; LUGGAGE; & MISC. GOODS MANUFACTURES-INDUSTRY SERIE

8/13/2019 1982 Census of Manu 8231 Un
http://slidepdf.com/reader/full/1982-census-of-manu-8231-un 31/48
6a. Product and Product Classes—Quantity and Value of Shipments by All Producers:
1982 and 1977-Con.
quantity and value of products of this industry produced by (1) establishments classified in this industry (primary) and (2) establishments classified in other industries (secondary). Transfers
of this industry from one establishment of a company to another establishment of the same company (interplant transfers) are also included. For further explanation, see Value of
in appendix. For meaning of abbreviations and symbols, see introductory text]
Product
1982
Number of
companies
with
shipments
of
$100,000or more
Product shipments 1
Quantity2
Value
(milliondollars)
1977
Number of
companies
with
shipments
of
$100,000or more
Product shipments 1
Quantity 2
Value
(milliondollars)
PERSONAL LEATHER GOODS, N.E.C.-Con.
—02
Personal leather goods, except handbags and purses
Personal leather goods, n.e.c. n.s.k., typically for
establishments with less than 5 employees (see note)
Con.
(NA) (X) 8.4 (NA) (X) 7.3
Product
1982
Number of
companies
with
shipments
of
$100,000
or more
Value of
product
shipments 1
(million
dollars)
1977
Number of
companies
with
shipments
of
$100,000
or more
Value of
product
shipments 1
(million
dollars)
LEATHER GOODS, N.E.C.
——11
31
91
96
97
00
02
Total .
Saddlery, harness and whips, and other leather products, n.e.c:
Leather novelties
Saddlery, harness, and accouterments
Industrial leather belting and other industrial leather products made wholly
or partly of leather, including textile leather, but excluding gaskets and
washers
Dog collars, leashes, and other household pet accessories made of
leather
Other leather goods (desk sets, holsters, etc.)
Leather goods, n.e.c, n.s.k., typically for establishments with 5 employees
or more (see note)
Leather goods, n.e.c, n.s.k., typically for establishments with less than 5
employees (see note)
(NA)
16
51
19
16
65
(NA)
(NA)
305.1
27.2
56.2
26.3
36.6
95.0
51.5
12.2
(NA)
11
27
27
11
34
(NA)
(NA)
237.4
11.6
28.1
37.3
15.8
48.2
76.4
20.0
Note: In 1982 Census of Manufactures, data for establishments of small single-unit companies with up to 20 employees were estimated from administrative-record data rather than data
collected from respondents. Employment cutoff used for administrative records for each industry and shipments figures are included in code ending with 002 . In both 1982 and 1977
of Manufactures, products not completely identified on standard forms were coded in appropriate product class (five-digit) followed by 00 or to appropriate product group code (four-digit)
by 000 .
^ata reported by all producers, not just those with shipments of $100,000 or more.2For some establishments, data have been estimated from central unit values which are based on quantity-value relationships of reported data. The following symbols are used when
of each quantity figure estimated in this manner equals or exceeds 10 percent of published figure: * 10 to 19 percent estimated; ** 20 to 29 percent estimated. If 30 percent or more is
figure is replaced by (S).3For 1977, product code 31610 43 was included with product code 31610 86.
*Companies found reporting shipping containers and metal display boxes for jewelry were reclassified in 1982. Therefore, 1982 data may not be directly comparable to 1977 and prior
5For 1977, product code 31720 61 was included with product code 31720 93.
6b. Product Classes—Value of Shipments by All Producers for Specified States:
and 1977
1982
6c. Product Classes—Value Shipped by All Producers: 1982 and Earlier Years
dollars. For meaning of abbreviations and symbols, see introductory text For explanation of terms, see appendixes
Product class
1982 1981 1 1980 1 1979 1 1978 1 1977 1972 1967
Dress and work gloves and mittens, all leather 138.7
647.3
524.9
393.1
305.1
157.8
740.2
542.0
441.6
343.8
146.7
808.1
501.0
426.4
269.2
151.7
728.7
491.3
407.0
272.4
139.7
622.3
531.5
413.8
256.8
121.9
585.3
436.2
369.2
237.4
79.9
321.9
344.4
231.8
146.1
73.3
Suitcases, briefcases, bags, and musical instrument cases
Women's and children's handbags and purses
Personal leather goods, except handbags and purses
Saddlery, harnesses and whips, and other leather products, n.e.c. ...
320.1
312.1
178.9
109.0
figures are estimates derived from a representative sample of manufacturing establishments canvassed in annual survey of manufactures and. therefore, may differ from results that would
from a complete canvass of all manufacturing establishments. Standard errors associated with estimates are published in annual survey of manufactures volumes for this period.
INDUSTRY SERIES LEATHER GLOVES; LUGGAGE; & MISC. GOODS 31B-15

8/13/2019 1982 Census of Manu 8231 Un
http://slidepdf.com/reader/full/1982-census-of-manu-8231-un 32/48
Table 7. Materials Consumed by Kind: 1982 and 1977
[Includes quantity and cost of materials consumed or put into production by establishments classified only in this industry. For further explanation, see Cost of Materials in appendix. For meanof abbreviations and symbols, see introductory text]
1982
material
code
Material
1982
Quantity 1
Delivered cost
(million
dollars)
1977
Quantity'
Delivered c
(mil
doll
311100220129
225078970099
971000
220129
229503
282104
307903
311100
342983970099
971000
220129
229503282104
307903
311100342983970099
971000
220129
229503282104
307903
311100342983970099
971000
INDUSTRY 3151, LEATHER GLOVES ANDMITTENS
Materials, containers, and supplies
Finished leather mil sq ft.
Broad woven fabrics mil lin yd.
Purchased knitted fabrics mil lb.
All other materials and components, parts, containers, and
supplies
Materials, containers, and supplies, n.s.k.2
INDUSTRY 3161, LUGGAGE
Materials, containers, and supplies
Broad woven fabrics (piece goods) mil lin yd.
Plastics coated, impregnated, or laminated fabrics
Plastics resins consumed in the form of granules, pellets,
powders, liquids, etc., but excluding sheets, rods, tubes, and
shapes mil lb.
Plastics products consumed in the form of sheets, rods,
tubes, and other shapes
Finished leather
Trunk and luggage hardware, including locks
Other materials and components, parts, containers, and
supplies
Materials, containers, and supplies, n.s.k.2
INDUSTRY 3171, WOMEN'S HANDBAGS ANDPURSES
Materials, parts, containers, and supplies
Broad woven fabrics (piece goods) mil lin yd.
Plastics coated, impregnated, or laminated fabrics
Plastics resins consumed in the form of granules, pellets,
powders, liquids, etc., but excluding sheets, rods, tubes, and
shapes mil lb.
Plastics products consumed in the form of sheets, rods,
tubes, and other shapes
Finished leather
Trunk and luggage hardware, including locks
Other materials and components, parts, containers, and
suppliesMaterials, parts, containers, and supplies, n.s.k.2
INDUSTRY 3172, PERSONAL LEATHER GOODS,N.E.C.
Materials, parts, containers, and supplies
Broad woven fabrics (piece goods) mil lin yd-
Plastics coated, impregnated or laminated fabrics
Plastics resins consumed in the form of granules, pellets,
powders, liquids, etc., but excluding sheets, rods, tubes, andshapes mil lb-
Plastics products consumed in the form of sheets, rods,
tubes, and other shapes
Finished leather
Trunk and luggage hardware, including locks
All other materials and components, parts, containers, andsupplies
Materials, parts, containers, and supplies, n.s.k.2
(X)
*72.7
3.9
(S)
(X)
(X)
(X)
(S)
(X)
(S)
(X)
(X)
(X)
(X)
(X)
(X)
(S)
(X)
(S)
(X)
(X)
(X)
(X)
(X)
(X)
*6.6
(X)
(D)
(X)
(X)
(X)
(X)
(X)
70.5
47.0
5.4
4.8
6.9
6.4
271.5
24.2
46.4
11.7
20.1
15.1
34.4
65.6
54.0
208.2
11.5
21.5
.6
7.8
76.0
5.6
25.260.0
123.2
11.8
8.4
(4)
6.2
38.1
2.6
29.8
26.3
(X)
74.1
4.2
3.7
(X)
(X)
(X)
19.0
(NA)
32.1
(X)
(X)
(X)
(X)
(X)
(X)
(S)
(NA)
(X)
(X)
(X)
(X)
(X)
(X)
(X)
(S)
(NA)
11.6
(X)
(X)
(X)
(X)
(X)
6
4
27
1
5
1
3
'9
4
18
1
2
32
3
35
14
1
3
3
3
1982 material
codeMaterial
1 982 delivered cost
(million
dollars)
1977 delivered c
(mil
dolla
INDUSTRY 3199, LEATHER GOODS, N.E.C.
Materials, parts, containers, and supplies .
311100
970099971000
Finished leather
All other materials and components, parts, containers, and supplies.
Materials, parts, containers, and supplies n.s.k. 2
142.4
72.3
40.7
29.4
12
2
3
5
1 For some establishments, data have been estimated from central unit values which are based on quantity-cost relationships of reported data. The following symbols are used whpercentage of each quantity figure estimated in this manner equals or exceeds 10 percent of published figure: ' 10 to 19 percent estimated;
** 20 to 29 percent estimated. If 30 percent or moreestimated, figure is replaced by (S).
2Total cost of materials of establishments that did not report detailed materials data, including establishments that were not mailed a form.3For 1977, material code 307903 was combined with material code 282104.
For 1982, data for material code 282104 are included with material code 970099.
31B-16 LEATHER GLOVES; LUGGAGE; & MISC. GOODS MANUFACTURES-INDUSTRY SERIE

8/13/2019 1982 Census of Manu 8231 Un
http://slidepdf.com/reader/full/1982-census-of-manu-8231-un 33/48
APPENDIX A.
Explanation of Terms
appendix is in two sections. Section 1 includes items which were requested of all establishments that were mailed census
forms including annual survey of manufactures (ASM) forms. Note that this section also includes several items
of establishments and companies, value added, classes of products, and specialization and coverage ratios) that were not
on the report forms but were derived from information collected on the forms. Section 2 covers supplementary items that
requested only from establishments included in the ASM sample. Results of the supplementary ASM inquiries are included
3c and 3d of this report.
SECTION 1 ITEMS COLLECTED OR DERIVED BASED ON ALL CENSUS OF MANUFACTURES(INCLUDING ASM) REPORT FORMS
of establishments and companies— As discussed in
Introduction, a separate report was required for each
establishment (plant) with one employee or more.
is defined as a single physical location where
is performed. A company, on the other hand, is
as a business organization consisting of one establish-
or more under common ownership or control.
company operates at different physical locations, even
individual locations are producing the same line of goods,
report was requested for each location. If the com-
operates in two or more distinct lines of manufacturing at
location, a separate report was requested for each
establishment not in operation for any portion of the year
requested to return the report form with the proper
in the Operational Status section of the form. In
the establishment was requested to report data on the
of custodial employees, capital expenditures, inven-
or any shipments from inventories during the portion of
ar the plant was in operation.
report, data are shown for establishments in operation
time during the year. A comparison with the number of
in operation at the end of the year will be pro-
in the Introduction to Part 1 of the General Summary sub-
report.
and related items— The regular report forms
separate information on production workers as of a
period for each quarter of the year and on other
as of the payroll period which included the 1 2th of
employees— This item includes all full-time and part-time
on the payrolls of operating manufacturing
during any part of the pay period ending nearest
of the months specified on the report form. Included
persons on paid sick leave, paid holidays, and paid vaca-
during these pay periods. Officers of corporations are
as employees; proprietors and partners of unincor-
firms are excluded. The all employees number is the
number of production workers plus the number of other
in mid-March. The number of production workers is
for the payroll periods including the 1 2th of March,
August, and November.
Production workers— This item includes workers (up through
the line-supervisor level) engaged in fabricating, processing,
assembling, inspecting, receiving, storing, handling, packing,
warehousing, shipping (but not delivering), maintenance, repair,
janitorial and guard services, product development, auxiliary pro-
duction for plant's own use (e.g., power plant), recordkeeping,
and other services closely associated with these production
operations at the establishment covered by the report.
Employees above the working-supervisor level are excluded from
this item.
All other employees—This item covers nonproduction
employees of the manufacturing establishment including those
engaged in factory supervision above the line-supervisor level.
It includes sales (including driver salespersons), sales delivery
(highway truck drivers and their helpers), advertising, credit, col-
lection, installation and servicing of own products, clerical and
routine office function, executive, purchasing, financing, legal,
personnel (including cafeteria, medical, etc.), professional, and
technical employees. Also included are employees on the payroll
of the manufacturing establishment who are engaged in the con-
struction of major additions or alterations to the plant and who
are utilized as a separate work force.
In addition to reports sent to operating manufacturing
establishments, information on employment during the payroll
period which included March 12 and annual payrolls was also
requested of auxiliary units (e.g., administrative offices,
warehouses, and research and development laboratories) of
multiestablishment companies. However, these figures are not
included in the totals for individual industries shown in this report.
They are included in the general summary and geographic area
reports and in the final bound volumes as a separate category.
Payrolls— This item includes the gross earnings of all
employees on the payroll of operating manufacturing
establishments paid in the calendar year 1982. Respondents
were told they could follow the definition of payrolls used for
calculating the Federal withholding tax. It includes all forms of
compensation, such as salaries, wages, commissions, dismissal
pay, all bonuses, vacation and sick leave pay, and compensa-
tion in kind, prior to such deductions as employees' Social Secu-
rity contributions, withholding taxes, group insurance, union
dues, and savings bonds. The total includes salaries of officers
INDUSTRY SERIES APPENDIX A A-1

8/13/2019 1982 Census of Manu 8231 Un
http://slidepdf.com/reader/full/1982-census-of-manu-8231-un 34/48
of corporations, but excludes payments to proprietors or part-
ners of unincorporated concerns. Also excluded are payments
to members of Armed Forces and pensioners carried on the
active payroll of manufacturing establishments.
The census definition of payrolls is identical to that recom-
mended to all Federal statistical agencies by the Office of
Management and Budget. It should be noted that this definition
does not include employers' Social Security contributions or
other nonpayroll labor costs, such as employees' pension plans,
group insurance premiums, and workers' compensation.
The ASM provides estimates of employers' supplemental labor
costs, both those required by Federal and State laws and those
incurred voluntarily or as part of collective bargaining
agreements. (Supplemental labor costs are explained later in this
appendix.)
As in the case of employment figures, the payrolls of separate
auxiliary units of multiestablishment companies are not included
in the totals for individual industries or industry groups.
Production-worker hours— This item covers hours worked or
paid for at the plant, including actual overtime hours (not straight-
time equivalent hours). It excludes hours paid for vacations,
holidays, or sick leave.
Cost of materials—This term refers to direct charges actually
paid or payable for items consumed or put into production dur-
ing the year, including freight charges and other direct charges
incurred by the establishment in acquiring these materials. It in-
cludes the cost of materials or fuel consumed, whether pur-
chased by the individual establishment from other companies,
transferred to it from other establishments of the same company,
or withdrawn from inventory during the year.
The important components of this cost item are (1) all raw
materials, semifinished goods, parts, components, containers,
scrap, and supplies put into production or used as operating sup-
plies and for repair and maintenance during the year, (2) elec-
tric energy purchased, (3) fuels consumed for heat, power, or
the generation of electricity, (4) work done by others on materials
or parts furnished by manufacturing establishments (contract
work), and (5) products bought and resold in the same condi-
tion. (See discussion of duplication of data below.)
Specific materials consumed— In addition to the total cost of
materials, which every establishment was required to report, in-
formation was also collected for most manufacturing industries
on the consumption of major materials used in manufacturing.
The inquiries were restricted to those materials which were im-
portant parts of the cost of production in a particular industry
and for which cost information was available from manufac-
turers' records. Information on the specific materials consumed
is shown in table 7 if appropriate to the industry. Establishments
consuming less than a specified amount (usually $10,000) of
a specific material were not requested to report consumption
of that material separately. Also, the cost of materials for the
small establishments for which either administrative records or
short forms were used was imputed as not specified by kind.
(See the introduction for the importance of administrative records
in the industry.)
Value of shipments— This item covers the received or
receivable net selling values, f.o.b. plant (exclusive of freight
and taxes), of all products shipped, both primary and secondary,
as well as all miscellaneous receipts, such as receipts for con-
tract work performed for others, installation and repair, sales
of scrap, and sales of products bought and resold without further
processing. Included are all items made by or for t
establishments from materials owned by it, whether so
transferred to other plants of the same company, or shipped
consignment. The net selling value of products made in one pl
on a contract basis from materials owned by another w
reported by the plant providing the materials.
In the case of multiunit companies, the manufacturer was
quested to report the value of products transferred to oth
establishments of the same company at full economic or co
mercial value, including not only the direct cost of producti
but also a reasonable proportionof all other costs (includ
company overhead) and profit. (See discussion of duplicati
of data below.)
Individual products—As in previous censuses, data were c
lected for almost all industries on the quantity and value
individual products shipped. In the 1982 census progra
information was collected on the output of approximate
1 1 ,000 individual product items. The term product, as us
in the census of manufactures, represents the finest level
detail for which output information was requeste
Consequently, it is not necessarily synonymous with the te
product as used in the marketing sense. In some cases it m
be much more detailed and, in other cases, it is more aggregativ
For example, pharmaceutical preparations was distributed i
over 100 items; whereas, motor gasoline was reported a
single item.
Approximately 6,000 of the product items were lis
separately on the 1 982 census report forms. Data for abo
5,000 products were obtained in the monthly, quarterly,
annual surveys comprising the Current Industrial Reports ser
of the Census Bureau. Totals for the year 1 982 for these item
as derived from the commodity surveys, are shown in the pro
ucts shipped table (table 6a) together with the tieline total va
collected in the census for reconciliation purposes.
The list of products for which separate information was c
lected was prepared after consultation with industry and gover
ment representatives. Comparability with previous figures wgiven considerable weight in the selection of product categor
so that comparable 1977 information is presented for mo
products.
Typically, both quantity and value of shipments informati
was collected. However, if quantity was not significant or cou
not be reported by manufacturers, only value of shipments w
collected.
Shipments include both commercial shipments and transf
of products to other plants of the same company. For industr
in which a considerable portion of the total shipments is tra
ferred to other plants of the same company, separate informati
on interplant transfers was also collected. Moreover, for produc
that are used to a large degree within the same establishme
as materials or components in the fabrication of other product
total production and often consumption of the item within t
plant was collected. Typically, the information on production w
also collected for products for which there are significant d
ferences between total production and shipments in a given ye
because of wide fluctuations in finished goods inventories. Oth
measures of output of products with long production cycles we
used as appropriate and feasible.
Classes of products— To summarize the product informatio
the separate products were aggregated into classes of produc
that, in turn, were grouped into all primary products of each
dustry. The code structure used is a seven-digit number for t
A-2 APPENDIX A MANUFACTURES- INDUSTRY SERI

8/13/2019 1982 Census of Manu 8231 Un
http://slidepdf.com/reader/full/1982-census-of-manu-8231-un 35/48
product, a five-digit number for the class of product,
a four-digit number for the total primary products in an
(See Introduction, Industry Classification of
for application of the coding structure to the
of SIC codes for establishments.)
the 1 982 census, the 1 1 ,000 products were grouped into
1,500 separate classes on the basis of general
of manufacturing processes, types of materials used,
the like. However, the grouping of products was affected
economic significance of the class and, in some cases,
products were grouped because the products were not
significant to warrant separate classes.
in cost of materials and value of shipments—The
of the cost of materials and value of shipments figures
industry groups and for all manufacturing industries includes
amounts of duplication, since the products of some in-
are used as materials by others. With some important
such as for motor vehicles and parts, this duplica-
is not significant at the four-digit industry level. However,
significant at the two-digit and three-digit industry group
because these totals often include industries that repre-
successive stages in the production of a finished manufac-
product.Examples
are the addition of flour millsto bakeries
Food group and the addition of pulp mills to paper mills
Paper and Allied Products group of industries. Estimates
overall extent of this duplication indicate that the value
products exclusive of such duplication (the
of finished manufactures) tends to approximate two-thirds
the total value of products reported in the census of
added by manufacture — This measure of manufactur-
is derived by subtracting the cost of materials, sup-
containers, fuel, purchased electricity, and contract work
the value of shipments (products manufactured plus
for services rendered). The result of this calculation is
by the addition of value added by merchandising opera-
(i.e., the difference between the sales value and the cost
sold without further manufacture, processing,
plus the net change in finished goods and work-
between the beginning- and end-of-year inventories.
of the change in instructions for reporting inventories
the 1982 figure for value added is not strictly com-
to prior-year data. This is explained more fully in the
section below.
added avoids the duplication in the figure for value
that results from the use of products of some
as materials by others. Value added is considered
the best value measure available for comparing the relative
importance of manufacturing among industries andareas.
and used capital expenditures— For establishments in
and establishments under construction but not yet in
manufacturers were asked to report their new expend-
for (1) permanent additions and major alterations to
establishments, and (2) machinery and equipment
for replacement and additions to plant capacity if they were
type for which depreciation accounts were ordinarily
totals for new expenditures exclude that portion of ex-
leased from nonmanufacturing concerns, new
owned by the Federal Government but operated under
INDUSTRY SERIES
contract by private companies, and plant and equipment fur-
nished to the manufacturer by communities and nonprofit
organizations. Also excluded are expenditures for used plant and
equipment (although reported in the census), expenditures for
land, and cost of maintenance and repairs charged as current
operating expenses.
Manufacturers were also requested to report the value of all
used buildings and equipment purchased during the year at the
purchase price. For any equipment or structure transferred to
the use of the reporting establishment by the parent company
or one of its subsidiaries, the value at which it was transferred
to the establishment was to be reported. Furthermore, if the
establishment changed ownership during the year, the cost of
the fixed assets (building and equipment) was to be reported
under used capital expenditures.
Total expenditures for used plant and equipment is a universe
figure; i.e., it is collected on all census forms. However, the
breakdown of this figure between expenditures for used buildings
and other structures and expenditures for used machinery and
equipment is collected only on the ASM form and is subject to
sampling error (see table 3d). The data for total new capital
expenditures, new building expenditures, and new machinery
expenditures, as well as the data for total used expenditures,
are shown in both tables 3a and 3d. The figure in table 3a is
a census universe total and may differ from the results of the
ASM sample shown in table 3d. Since the figures in table 3d
are subject to sampling error, they are not considered as reliable
as the universe figures.
End-of-year inventories— Respondents were asked to report
their 1 981 and 1 982 end-of-year inventories at cost or market.
Effective with the 1 982 Economic Censuses, this change to a
uniform instruction for reporting inventories was introduced for
all sector reports. Prior to 1982, respondents were permitted
to value inventories using any generally accepted accounting
method (FIFO, LIFO, market, to name a few). In 1 982, LIFO users
were asked to first report inventory values prior to the LIFO ad-
justment and then to report the LIFO reserve and the LIFO value
after adjustment for the reserve.
Because of this change in reporting instructions, the 1 982 data
for inventories and value added by manufacture included in the
tables of this report are not comparable to the prior-year data
shown in table 1a of this report and in historical census of
manufactures and annual survey of manufactures publications.
Inventories and value added data estimated on a basis com-
parable to the historical data, using the reported information for
1 982, are shown in footnote 4 of table 1 a. However, the end-
of-1 981 figure shown in this footnote may differ from the corre-
sponding value published as part of the 1 981 Annual Survey of
Manufactures.
This difference at the four-digit SIC level is due primarily to
the effects of industry shifts. As described in the Industry
Classification of Establishments section of the Introduction, ASMnoncertainty plants are allowed to shift from one industry to
another in a census year; whereas, they are frozen in a partic-
ular industry in ASM years. Other explanations for this difference
include the effects of sampling and processing errors and revi-
sions to end-of-1981 data reported by respondents.
In using inventory data by stage of fabrication for all in-
dustries and at the two-digit industry level, it should be noted
that an item treated as a finished product by an establishment
in one industry may be reported as a raw material by another
establishment in a different industry. For example, the finished-
product inventories of a steel mill would be reported as raw
APPENDIX A A-3

8/13/2019 1982 Census of Manu 8231 Un
http://slidepdf.com/reader/full/1982-census-of-manu-8231-un 36/48
materials by a stamping plant. Such differences are present in
the inventory figures by stage of fabrication shown for individual
industries, industry groups, and all manufacturing, which are
aggregates of figures reported by establishments in specified
industries.
Specialization and coverage ratios— These items are not col-
lected on the report forms but are derived from the data shown
in table 5b. An establishment is classified in a particular industry
if its shipments of primary products of that industry exceed in
value its shipments of the products of any other single industry.
As noted in the Introduction, an establishment's shipments
include those products assigned to an industry (primary prod-
ucts), those considered primary to other industries (secondary
products), and receipts for miscellaneous activities (merchan-
dising, contract work, resales, etc.). Specialization and coverage
ratios have been developed to measure the relationship of
primary product shipments to the data on shipments for the in-
dustry shown in tables 1a through 5a and data on product
shipments shown in tables 6a through 6c.
Specialization ratio represents the ratio of primary product
shipments to total product shipments (primary and secondary,
excluding miscellaneous receipts) for the establishments
classified in the industry.
Coverage ratio represents the ratio of primary products shipped
by the establishments classified in the industry to the total
shipments of such products that are shipped by all manufactur-
ing establishments wherever classified.
SECTION 2. ITEMS COLLECTED ONLY ON ASM REPORT FORMS
Supplemental labor costs— Supplemental labor costs are
divided into legally required expenditures and payments for
voluntary programs. The legally required portion consists pri-
marily of Federal old age and survivors' insurance, unemploy-ment compensation, and workers' compensation. Payments for
voluntary programs include all programs not specifically required
by legislation whether they were employer initiated or the result
of collective bargaining. They include the employer portion of
such plans as insurance premiums, premiums for supplemental
accident and sickness insurance, pension plans, supplemental
unemployment compensation, welfare plans, stock purchase
plans on which the employer payment is not subject to
withholding tax, and deferred profit-sharing plans. They exclude
such items as company-operated cafeterias, in-plant medical
services, free parking lots, discounts on employee purchases,
and uniforms and work clothing for employees. While the ex-
cluded items do benefit employees and all or part of their cost
generally is similar to the items covered in the ASM labor costs
statistics, accounting records do not generally provide reliable
figures on net employee benefits of these types.
Cost of purchased services—ASM establishments were re-
quested to provide information on the cost of purchased ser-
vices for the repair of buildings and other structures, the repair
of machinery, and communication services. Included in the cost
of purchased services for the repair of buildings and machinery
are payments made for all maintenance and repair work on
buildings and equipment, such as painting, roof repairs, replac-
ing parts, and overhauling equipment. Such payments made to
other establishments of the same company and for repair and
maintenance of any leased property are also included. Exten-sive repairs or reconstruction that were capitalized are considered
capital expenditures for used buildings and machinery and are,
therefore, excluded from this item. Repair and maintenance costs
provided by an owner as part of a rental contract or incurred
directly by an establishment in using its own work force are also
excluded.
The response coverage ratio shown in table 3d for each of
the three types of purchased services listed above is a measure
of the extent to which respondents reported for each item. It
is derived for each item by calculating the ratio of the weighted
employment (establishment data multiplied by sample weight;
see section 3) for those ASM establishments that reported the
specific inquiry to the weighted total employment for all ASMestablishments classified in the industry.
Electric energy used for heat and power— Data on the cost
of purchased electric energy were collected on all census forms.
However, data on the quantity of purchased electric energy and
quantity of generated-less-sold electric energy were collected
only on the ASM forms. The cost and quantity of purchased elec-
tric energy represent the amount actually used during the year
for heat and power. In addition, information was collected on
the quantity of electric energy generated by the establishment
and the quantity of electric energy sold or transferred to other
plants of the same company.
Beginning- and end-of-year depreciable assets— The data en-
compass ail fixed depreciable assets on the books of
establishments at the beginning and at the end of the year. The
values shown (book value) represent the actual cost of assets
at the time they were acquired, including all costs incurred in
making the assets usable (such as transportation and installa-
tion). Included are all buildings, structures, machinery, and equip-
ment (production, office, and transportation equipment) for
which depreciation reserves are maintained. Excluded are non-
depreciable capital assets, including inventories and intangible
assets, such as patent rights and royalties. Also excluded are
land and depletable assets, such as timber and mineral rights.
The definition of fixed depreciable assets is consistent with
the definition of capital expenditures. For example, expenditures
include actual capital outlays during the year, rather than the
final value of equipment put in place and buildings completed
during the year. Accordingly, the value of assets at the end of
the year includes the value of construction in progress. In addi-
tion, respondents were requested to make certain that assets
at the beginning of the year plus new and used capital expendi-
tures, less retirements, equalled assets at the end of the year.
New and used capital expenditures—The data for total new
capital expenditures, new building expenditures, new machinery
expenditures, and total used capital expenditures are collected
on all census forms. However, the breakdown between expendi-
tures for used buildings and other structures and expenditures
for used machinery and equipment is collected only on the
ASM form. (See further explanation on capital expenditures in
section 1 .)
A-4 APPENDIX A MANUFACTURES- INDUSTRY SERIES

8/13/2019 1982 Census of Manu 8231 Un
http://slidepdf.com/reader/full/1982-census-of-manu-8231-un 37/48
of new capital expenditures for machinery and
ASM establishments were requested to separate
capital expenditures for new machinery and equipment in-
) automobiles, trucks, etc., for highway use, (2) computers
peripheral data processing equipment, and (3) all other.
category automobiles, trucks, etc., for highway use
to measure expenditures for vehicles designed for
use that were acquired through a purchase or lease-
agreement. Vehicles normally operating off public
(vehicles specifically designed to transport materials,
or equipment on mining, construction, logging, and
development projects) are excluded from this item.
not specified by kind or n.s.k. item for expenditures
machinery and buildings, shown in table 3d, represents
total machinery and equipment expenditures for
that did not break down their expenditures for
specific categories. This means that for most industries
specific categories are understated.
Included in this item is the gross value of assets
retired, scrapped, destroyed, etc., during 1982. When a
operation or establishment changed ownership, the
was instructed to report the value of the assets sold
original cost as recorded in the books of the seller. The
was also requested to report retirements of equip-
or structures owned by a parent company that the
was using as if it were a tenant.
Rental payments— This item includes rental payments for the
use of all items for which depreciation reserves would be main-
tained if they were owned by the establishment, e.g., structures
and buildings, and production, office, and transportation equip-
ment. Excluded are royalties and other payments for the use of
intangibles and depletable assets, and land rents where
separable.
When an establishment of a multiestablishment company was
charged rent by another part of the same company for the use
of assets owned by the company, it was instructed to exclude
that cost from rental payments. However, the book value
(original cost) of these company-owned assets was to be
reported as assets of the establishment at the end of the year.
If there were assets at an establishment rented from another
company, and the rents were paid centrally by the head office
of the establishment, the company was instructed to report these
rental payments as if they were paid directly by the
establishment.
Depreciation charges—This item includes depreciation and
amortization charged during the year against assets. Deprecia-
tion charged against fixed assets acquired since the beginning
of the year and against assets sold or retired during the year are
components of this category. Respondents were requested to
make certain that they did not report accumulated depreciation.
INDUSTRY SERIES APPENDIX A A-5

8/13/2019 1982 Census of Manu 8231 Un
http://slidepdf.com/reader/full/1982-census-of-manu-8231-un 38/48

8/13/2019 1982 Census of Manu 8231 Un
http://slidepdf.com/reader/full/1982-census-of-manu-8231-un 39/48
APPENDIX B.
Annual Survey of Manufactures (ASM) Samplingand Estimating
OF SURVEY SAMPLE
Annual Survey of Manufactures (ASM) contains two com-
The mail portion of the survey is a probability sample
55,000 manufacturing establishments selected from
of about 225,000 establishments. These 225,000
represent all manufacturing establishments of
companies and all single-unit manufacturing
ishments with five employees or more tabulated in the
Census of Manufactures. This mail portion is supplemented
Social Security Administration list of new manufacturing
opened after 1977. The individual establishments
defined as the sampling unit for this sample. This is a
from the previous ASM sample when companies were
as the sampling unit. The implication of this change is that
of selection of any establishment relates only to
of the establishment itself and is independent of the size
company with which the establishment is affiliated. The
associated with the change to an establishment sam-
made it possible to reduce the mail sample panel from
establishments in 1 978 to 55,000 establishments in the
panel.
nonmail portion of the survey includes all single-unit
that were tabulated with less than five employees
1 977 Census of Manufactures. Although this portion con-
approximately 1 25,000 establishments, it accounted for
2 percent of the estimate for total value of shipments
total manufacturing level. This portion was not sampled;
the data for every establishment in this group were
based on selectedinformation obtained annually from
records of other Federal agencies. This ad-
record information, which includes payroll, total
industry classification, and physical location of the
was obtained under special conditions, which
the confidentiality of both tax and census records.
for data for these small establishments were
using industry averages in conjunction with the
information.
corresponding estimates for the mail and nonmail
were added together, along with the adjusted
differences as defined in Description of Estimating Pro-
below. The remaining description of the survey sample
only to the mail portion of the ASM sample.
establishments with 250 employees or more in the 1 977
were included in the survey panel with certainty. These
collectively account for approximately 65 per-
of the total value of shipments for manufacturing
in the 1977 census. Smaller establishments were
with probabilities ranging from 1 .000 down to 0.005
with mathematical theory for optimum allocation
sample.
probabilities of selection assigned to the smaller
were proportional to measures of size determined
establishment. For establishments included in the 1 977
of Manufactures, the measure of size depended directly
each establishment's 1977 product class values and the
historic variability of the year-to-year shipments of each product
class. Roughly equivalent measures of size were assigned to
postcensus birth establishments based on their industry codes
and anticipated payroll and employment.
The method of assigning measures of size was used in order
to maximize the precision (that is, minimize the variance of
estimates of the year-to-year change) in the value of product
class shipments. Implicitly, it also gave weight to differences
in employment, value added, and other general statistics, for
these are highly correlated with value of shipments. Individual
sample selection probabilities were obtained by multiplying each
establishment's final measure of size by an overall sampling frac-
tion coefficient calculated to yield a total expected sample size.
The sample selection procedure gave each establishment in
the sampling frame an independent chance of selection. This
method of independent selection permits the rotation of
establishments into and out of a given sample panel without in-
troducing a bias into the survey estimates.
DESCRIPTION OF ESTIMATING PROCEDURES
Most of the ASM estimates for the years 1978-1981 were
computed using a modified difference estimate formula. For
each item, a base-year difference was developed. This base-year
difference is equal to the difference between the 1 977 census
published number for an item total and the linear ASM estimate
of the total for 1977. The ASM linear estimate was obtained
by multiplying each sample establishment's data by its sample
weight (the reciprocal of its probability of selection) and summing
the weighted values.
This base-year difference was then adjusted to reflect the
estimated growth at the four-digit or, in the case of product
classes, five-digit based Standard Industrial Classification (SIC)
level from 1 977 to the year of the survey; for example, 1 981
.
It should be noted that due to processing constraints, the growth
factors lagged one year; i.e., if 1981 is the survey year, they
were not based on the estimated growth from 1977 to 1981
but rather the growth from 1 977 to 1 980. This one-year lag had
negligible effect on the estimates, particularly at the total
manufacturing level where the adjusted base-year difference
accounted for less than 1 percent of the estimate for total value
of shipments.
These adjusted base-year differences were then added to the
corresponding current-year linear estimates, which include the
sum of the estimates for the mail and nonmail establishments,
to produce the estimates for the years 1 978-1 981 . Estimates
developed by this procedure usually are far more reliable
than comparable linear estimates developed from the current
sample data alone.
The 1982 sample data included in table 3d were also
developed using difference estimates. However, since the
universe totals for the census year (1977 or 1982) were not
known, a modification of the procedure described above was
necessary. For each item in table 3d, except purchased services
and breakdown of expenditures for new machinery and equip-
ment (see further description in appendix A, section 2), linear
INDUSTRY SERIES APPENDIX B B-1

8/13/2019 1982 Census of Manu 8231 Un
http://slidepdf.com/reader/full/1982-census-of-manu-8231-un 40/48
estimates of the publication totals from the ASM mail sample
were adjusted by the difference between imputed census totals
and the corresponding ASM mail sample estimates of these im-
puted totals. These imputed totals are obtained by applying in-
dustry averdge ratios to control item values at the establishment
level. For example, an imputed total beginning assets figure is
obtained by multiplying each establishment's total value of
shipments by the industry (four-digit SIC) average for the ratio
of beginning assets to shipments.
Separate estimates for the nonmail establishments were not
developed. However, their contribution to the publication
estimates is reflectedin
the differenceadjustment.
The method of inventory valuation percentages included in
table 3c was developed using both complete census informa-
tion and ASM estimates. The percentages for the four major
categories (LIFO, non-LIFO, valuation method not reported, and
LIFO reported without associated value and reserve) were
derived from the complete census and correspond to the values
included in table 3d. The percentages for the specific non-LIFO
methods of valuations (FIFO, average cost, specific costs, etc.)
are ratio estimates developed from the ASM in conjunction with
the census universe estimate for the total of the non-LIFO
methods.
QUALIFICATIONS OF THE DATA
The estimates developed from the sample are apt to differ
somewhat from the results of a survey covering all companies
in the sampled lists but otherwise conducted under essentially
the same conditions as the actual sample survey. The estimates
of the magnitude of the sampling errors (the differences between
the estimates obtained and the results theoretically obtained
from a comparable, complete-coverage survey) are provided by
the standard errors of the estimates.
The particular sample selected for the ASM is one of a large
number of similar probability samples that, by chance, might
have beenselected under the same specifications. Each of the
possible samples would yield somewhat different sets of results,
and the standard errors are measures of the variation of all the
possible sample estimates around the theoretical, comparable,
complete-coverage values.
Estimates of the standard errors have been computed from
the sample data for selected statistics in this report. Except for
table 3c, they are presented in the form of relative standard
errors, the standard errors divided by the estimated values to
which they refer. In table 3c, absolute standard errors of the
estimates are presented.
In conjunction with its associated estimate, the relative stand-
ard error may be used to define confidence intervals (ranges that
would include the comparable, complete-coverage value for
specified percentages of all the possible samples).
The complete coverage value would be included in the range:
1 . From one standard error below to one standard error above
the derived estimate for about two-thirds of all possible
samples.
2. From two standard errors below to two standard erro
above the derived estimate for about 1 9 out of 20 of
possible samples.
3. From three standard errors below to three standard erro
above the derived estimate for nearly all samples.
An inference that the comparable, complete-survey resu
would be within the indicated ranges would be correct in approx
mately the relative frequencies shown. Those proportion
therefore, may be interpreted as defining the confidence th
the estimates from a particular sample would differ from co
plete-coverage results by as much as one, two, or thrstandard errors, respectively.
For example, suppose an estimated total is shown as 50,0
with an associated relative standard error of 2 percent, that
a standard error of 1 ,000 (2 percent of 50,000). There is approx
mately 67 percent confidence that the interval 49,000 to 51 ,0
includes the complete-coverage total and about 95 percent co
fidence that the interval 48,000 to 52,000 includes t
complete-coverage total.
In addition to the sample errors, the estimates are subject
various response and operational errors: errors of collectio
reporting, coding, transcription, imputation for nonresponse, e
These operational errors would also occur if a complete canva
were to be conducted under the same conditions as the surve
Explicit measures of their effects generally are not availabl
However, it is believed that most of the important operation
errors were detected and corrected in the course of the Bureau
review of the data for reasonableness and consistency. The sma
operational errors usually remain. To some extent, they are co
pensating in the aggregated totals shown. When importa
operational errors were detected too late to correct t
estimates, the data were suppressed or were specifica
qualified in the tables.
As derived, the estimated standard errors included part of t
effect of the operational errors. The total errors, which depe
upon the joint effect of the sampling and operational errors, a
usually of the order of size indicated by the standard error,
only moderately higher. However, for particular estimates, t
total error may considerably exceed the standard errors show
The concept of complete coverage under the conditio
prevailing for the ASM is not identical to the complete covera
of the census of manufactures, as the censuses have been co
ducted. Nearly all types of operational errors that affect the AS
also occur in the censuses. The ASM and the censuses, are co
ducted under quite different conditions, and operational erro
can be better controlled in the ASM than in the censuses.
a result, for many of the census figures, the errors are of t
same order of size as the total errors of the corresponding annu
survey estimates. The differences between the census and AS
operating conditions also disturb, to some degree, the co
parability of the ASM and census data.
Any figures shown in the tables in this publication having
associated standard error exceeding 1 5 percent may be of limi
reliability. However, the figure may be combined with highe
level totals, creating a broader aggregate, which then may
of acceptable reliability.
B-2 APPENDIX B MANUFACTURES-INDUSTRY SERI

8/13/2019 1982 Census of Manu 8231 Un
http://slidepdf.com/reader/full/1982-census-of-manu-8231-un 41/48
REFERENCE MATERIALS • ORDER FORMS • PUBLICATION CORRECTIONS
Please send me the items marked (X) below.
O Corrections (if there are any) for this publication — Manufactures, Leather Gloves; Luggage; and
Miscellaneous Leather Goods, MC82-I-31B
If you purchase several different reports from the 1 982 Economic Censuses,
you should complete this form from each of the reports and return it to the
address shown below to receive publication corrections. However, you
should complete the following on only one of the forms.
LJ Guide to the 1 982 Economic Censuses and Related Statistics
LJ Monthly Product Announcement—A monthly notice of all products released by the
Census Bureau during the previous month— useful primarily to persons who plan to
purchase publications, tapes, etc., in the future.
Publication announcements and order forms — Mark (X) subjects in which you are interested.
Retail Trade
LJ Wholesale Trade
LJ Service Industries
LJ Construction Industries
LJ Manufacturing
LJ Mineral Industries
LJ Transportation
I—I Economic Censuses of
Outlying Areas (Puerto Rico,
Guam, Virgin Islands, and
Northern Mariana Islands)
LJ Enterprise Statistics
LJ Minority- and Women-Owned Businesses
LJ Agriculture
LJ County Business Patterns
LJ Quarterly Financial Report
LJ Governments
LJ Foreign Trade
LJ Population
LJ Housing
LJ International Statistics
LJ Geography
LJ Guides, Catalogs, etc.
Name
Organization
Address/PO Box
City State ZIP Code
Mail completed form to
7
Customer Services
DUSDBureau of the CensusWashington, D.C. 20233

8/13/2019 1982 Census of Manu 8231 Un
http://slidepdf.com/reader/full/1982-census-of-manu-8231-un 42/48

8/13/2019 1982 Census of Manu 8231 Un
http://slidepdf.com/reader/full/1982-census-of-manu-8231-un 43/48
PUBLICATION PROGRAM
CENSUS OF MANUFACTURES
of the 1982 Census of Manufactures, containing prelim-
and final data on manufacturing establishments in the United States,
below. Publication order forms for the specific reports may
from any Department of Commerce district office or from
User Services Division, Customer Services (Publications),
of the Census, Washington, D.C. 20233
Reports
industry data are issued in 443 separate reports covering
industries (or combinations of industries). Preliminary data for
are grouped and released in reports for each of the nine census
divisions.
Reports
detailed statistics are issued in separate paperbound reports.
series-82 reports (MC82-I-20A to -39D)
of the 82 reports provides information for a group of related
(e.g., dairy products includes industries for butter, cheese,
etc.). Final figures for the United States are shown for each of
manufacturing industries on quantity and value of products
and materials consumed, cost of fuels and electric energy, capital
assets, rents, inventories, employment, payroll, payroll
ments, hours worked, value added by manufacture, number of
and number of companies. Comparative statistics for
years are provided where available.
each industry, data on value of shipments, value added by manu-
capital expenditures, employment, and payroll are shown
class of establishment and degree of primary product
Statistics are given on production of specific products and
of energy and various materials by industry.
area series—51 reports (MC82-A-1 to -51)
separate report for each State and the District of Columbia presents
industry groups and industries on value of shipments, cost of
value added by manufacture, employment, payroll, hours
new capital expenditures, and number of manufacturing estab-
for the State, SMSA's, and large industrial counties and places.
statistics for earlier census years are shown for the State and
SMSA's. Manufacturing totals are presented for each county and
with significant manufacturing activity. Detailed statistics-
inventories, assets, rents, and energy costs-are presented only
totals.
series-10 reports (MC82-S-1 to -10)
of the 10 reports contains detailed statistics for an individual
such as: selected materials consumed, selected metalworking
operations, manufacturing activity in government establishments, concen-
tration ratios in manufacturing, type of organization, water use in manu-
facturing, fuels and electric energy consumed (separate publications for
industry statistics, and State and SMSA statistics), textile machinery in
place, production indexes, and a general National-level summary.
Final Report Volumes
Final paperbound reports subsequently are assembled and reissued in
clothbound volumes.
• Volume I. Summary and Subject Statistics-data previously issued in
series MC82-S.
• Volume II. Industry Statistics-data previously issued in series MC82-I.
Part 1. Major Groups 20 to 26
Part 2. Major Groups 27 to 34
Part 3. Major Groups 35 to 39
• Volume III. Geographic Area Statistics-data previously issued in
series MC82-A.
Parti. Alabama to Montana
Part 2. Nebraska to Wyoming
Microfiche
All published data also are available on microfiche.
Computer Tapes
Selected data-generally detailed information by industry and/or
geographic area-also are available on public-use computer tapes. For the
selected data, these tapes will provide the same information found in
the final reports. Public-use computer tapes are available for users who
wish to summarize, rearrange, or process large amounts of data. These
tapes, with corresponding technical documentation, are sold by Data
User Services Division, Customer Services (Tapes), Bureau of the Census,
Washington, D.C. 20233.
OTHER ECONOMIC CENSUSES REPORTS
Data on retail trade, wholesale trade, service industries, construction
industries, mineral industries, enterprise statistics, minority-owned
businesses, women-owned businesses, and transportation also are issued
as part of the 1982 Economic Censuses. A separate series of reports
covers the censuses of outlying areas-Puerto Rico, Virgin Islands of the
United States, Guam, and the Northern Mariana Islands. All published
reports and microfiche are sold by the Superintendent of Documents,
U. S. Government Printing Office. Appropriate announcements and order
forms describing these products are available free of charge from
Data User Services Division, Customer Services (Publications),
Bureau of the Census, Washington, D.C. 20233.

8/13/2019 1982 Census of Manu 8231 Un
http://slidepdf.com/reader/full/1982-census-of-manu-8231-un 44/48
Superintendent of Documents
U.S. Government Printing Office
Washington, D.C. 20402
Official Business
Penalty for Private Use, $300POSTAGE AND FEES P
U.S. DEPARTMENT OF COMMERCOM
Special Fourth-Cl
Rate—Bo

8/13/2019 1982 Census of Manu 8231 Un
http://slidepdf.com/reader/full/1982-census-of-manu-8231-un 45/48

8/13/2019 1982 Census of Manu 8231 Un
http://slidepdf.com/reader/full/1982-census-of-manu-8231-un 46/48

8/13/2019 1982 Census of Manu 8231 Un
http://slidepdf.com/reader/full/1982-census-of-manu-8231-un 47/48

8/13/2019 1982 Census of Manu 8231 Un
http://slidepdf.com/reader/full/1982-census-of-manu-8231-un 48/48