Embed Size (px)
Citation preview

HEWLETT-PACKARD JOURNAL
JUNE 1969 © Copr. 1949-1998 Hewlett-Packard Co.

Portable, Rugged Cable Fault Locator For VHF Communica t ions and CATV
D e s i g n e d f o r f i e l d u s e , a n e a s y - t o - o p e r a t e T D R u n i t c h e c k s C A T V a n d c o m m u n i c a t i o n s y s t e m c a b l e s w i t h h i g h a c c u r a c y .
By Ronald D. Lowe
TIME DOMAIN REFLECTOMETRY MEASUREMENTS fall into
two categories: pulse echo testing and laboratory type TDR.
Instruments that perform a simple pulse echo test have been used by the power utilities for fault locating on long lines, typically greater than 1 mile. These instruments are basically low frequency real time oscilloscopes, capable of isolating a fault to not much better than 20 feet on the shortest range. Output pulses range from 10 volts to sev eral hundred volts.
The other class of TDR equipment is the precision lab oratory unit that is capable of precise impedance meas-
F ig . 1 . A t yp i ca l back -ma tched tap used i n CATV sys tems . S o m e t a p s h a v e a s m a n y a s f o u r o u t p u t s , h o w e v e r t h i s s i m p l e t a p i l l u s t r a t e s h o w t h e s i g n a l i s t r a n s f e r r e d f r o m t h e c a b l e t o t h e c u s t o m e r .
urements and is able to resolve discontinuities as close together as 0.25 inch. Two precision laboratory TDR units are available — the HP Model 141 5 A with a rise- time of 150 ps, and the HP Model 1815A with a risetime of 35 ps. These 50 ohm system instruments use sampling and fast pulse generation techniques. Their applications include connector, cable, and similar problems.
With the tremendous explosion of the communications industry in the form of community antenna television (CATV), wideband telephone carrier and military com munications, there is a need for a TDR to solve the spe cific problem of precisely locating faults on coaxial cable at very high frequencies.
In the CATV industry, there are a number of impor tant requirements. For CATV applications, the instru ment should be a 75 ohm unit, and its output pulse not destructive to the line amplifiers. It should be portable, lightweight and rugged. The unit must also be designed to withstand voltages and static charges that are often present in the system. Nearly all coaxial cable in commu nication systems carry dc or 60 Hz ac voltages to supply remote power, and this remote power may not be turned off during tests. Because the user is primarily interested in locating and repairing faults, not in mastering new measuring techniques, the units must be easy to operate and answers cannot be ambiguous.
It is common to find a small 60 Hz voltage on a coax ial line even though the system power is turned off. This voltage may be the result of leakage through isolating line
P R I N T E D I N U . S . A . OHEWL © Copr. 1949-1998 Hewlett-Packard Co.

amplifiers, or voltage induced from a nearby high-voltage power line. Some form of 60 Hz filter is needed to operate a TDR in the presence of this voltage.
TDR Resolut ion
Fault location by TDR methods is in the time domain. That is, the observed pattern is signal amplitude versus time. At present there is no satisfactory definition for resolution of TDR instruments. Attempts are made to relate system risetime to bandwidth with the equation BW = 0.35/T, where T = system risetime. This equation is a bandwidth approximation for the step response of a linear system with less than 5% overshoot. Another ap proximate equation used is s = Vr/4 where v = velocity of propagation, and s is minimum echo separation. These equations can be used to compare instrument specifica tions, even though the absolute error may be large. A slow risetime implies a narrow bandwidth at low frequen cies. Very little high frequency spectral energy exists in the incident pulse and even less can be reflected by a fault to be displayed on the oscilloscope. One would assume that the faster the risetime the better the resolving power. While this is true, there exists a point of diminishing re turns. Too fast a risetime yields too many reflections, making it difficult for maintenance personnel to interpret the display. In this area of testing in the communications industry, it becomes necessary to assure: • Sufficient spectral energy within the bandwidth of the
system tested. A slow risetime (greater than 20 ns) pulse echo tester would yield minimal, if any, reflec tions at VHP frequencies. It would take over 20 feet
C o v e r : C h e c k o u t o f a 2 0 0 0 - f t . r e e l o f c o a x i a l c a b l e w i t h t h e H P M o d e l 4 9 2 0 A C o a x i a l F a u l t A n a l y z e r s h o w s n e i t h e r d i s c o n t i n u i t i e s n o r s h o r t s . T h i s p o r t a b l e T D R i n s t r u m e n t i s d e s i g n e d e s p e c i a l l y f o r f i e l d t e s t i n g o f c o m m u n i c a t i o n s a n d C A T V s y s t e m s .
I n t h i s I s s u e : P o r t a b l e , R u g g e d C a b l e F a u l t Loca to r ; page 2 . T radeo f f s i n Impu lse Tes t i ng ; p a g e 8 . C o m p a c t F u n c t i o n G e n e r a t o r ; p a g e 1 0 . 1 C L o g i c C h e c k o u t S i m p l i f i e d ; p a g e 1 4 . Pu l sa r Op t i ca l and Rad io Emiss ions ; page 17 . A re Pu lsa rs Ro ta t ing Neu t ron S ta rs? ; page 20 .
I
1 f t M v r> •
Fig . 2 . F ron t -pane l con t ro ls on the HP Mode l 4920 A Cab le F a u l t A n a l y z e r a r e d e s i g n e d f o r e a s y o p e r a t i o n i n f i e l d use . Th i s i ns t rumen t was des igned spec i f i ca l l y f o r use on 7 5 n c o a x i a l c a b l e u s e d i n C A T V s y s t e m s , a n d i s a l s o e a s i l y a d a p t a b l e f o r u s e o n 5 0 V . c o m m u n i c a t i o n s c a b l e .
of lossless coaxial cable for the pulse to reach full am plitude. A fast risetime system (less than 150 ps) yields reflections at frequencies in the gigahertz range. The operator is required to interpret the trace to separate the reflections caused by cable faults from reflections from good components. A series of risetime converters is available for use with the HP Model 141 5 A to handle this problem. The spectral energy must be of the proper shape to be compatible with the system under test. In some CATV systems, a component called a back-matched tap is used, Fig. 1 . The capacitor C and the primary trans former inductance L form a series circuit with a res onant frequency below the VHF bandwidth. The step response of the line with these taps installed will show this as a fault when in reality it is not a fault at all. Fig. 3 shows a more meaningful display if the step is differentiated and an impulse response test performed instead.
© Copr. 1949-1998 Hewlett-Packard Co.
New Por table TDR
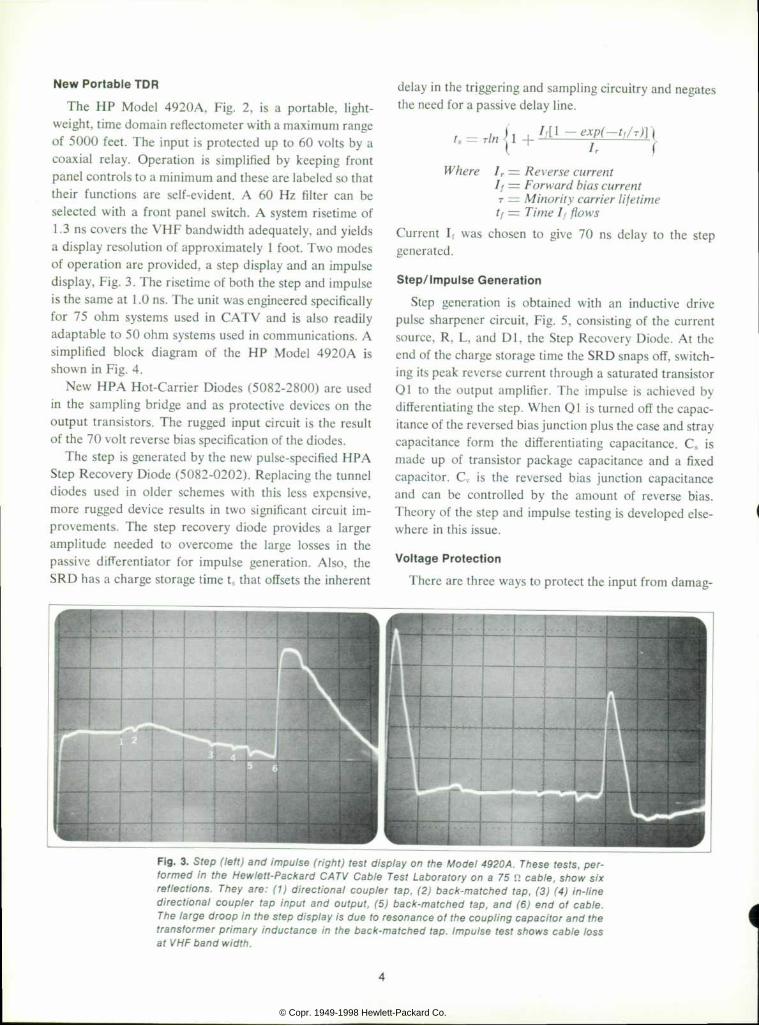
The HP Model 4920A, Fig. 2, is a portable, light weight, time domain reflectometer with a maximum range of 5000 feet. The input is protected up to 60 volts by a coaxial relay. Operation is simplified by keeping front panel controls to a minimum and these are labeled so that their functions are self-evident. A 60 Hz filter can be selected with a front panel switch. A system risetime of 1.3 ns covers the VHP bandwidth adequately, and yields a display resolution of approximately 1 foot. Two modes of operation are provided, a step display and an impulse display, Fig. 3. The risetime of both the step and impulse is the same at 1.0 ns. The unit was engineered specifically for 75 ohm systems used in CATV and is also readily adaptable to 50 ohm systems used in communications. A simplified block diagram of the HP Model 4920A is shown in Fig. 4.
New HPA Hot-Carrier Diodes (5082-2800) are used in the sampling bridge and as protective devices on the output transistors. The rugged input circuit is the result of the 70 volt reverse bias specification of the diodes.
The step is generated by the new pulse-specified HPA Step Recovery Diode (5082-0202). Replacing the tunnel diodes used in older schemes with this less expensive, more rugged device results in two significant circuit im provements. The step recovery diode provides a larger amplitude needed to overcome the large losses in the passive differentiator for impulse generation. Also, the SRD has a charge storage time ts that offsets the inherent
delay in the triggering and sampling circuitry and negates the need for a passive delay line.
t . = r l n 1 + I j l l - expf- t t /r»]
Where IT = Reverse current If = Forward bias current T = Minority carrier lifetime t/ = Time I/ flows
Current If was chosen to give 70 ns delay to the step generated.
Step/ Impulse Generat ion
Step generation is obtained with an inductive drive pulse sharpener circuit, Fig. 5, consisting of the current source, R, L, and Dl, the Step Recovery Diode. At the end of the charge storage time the SRD snaps off, switch ing its peak reverse current through a saturated transistor Ql to the output amplifier. The impulse is achieved by differentiating the step. When Ql is turned off the capac itance of the reversed bias junction plus the case and stray capacitance form the differentiating capacitance. C8 is made up of transistor package capacitance and a fixed capacitor. Cv is the reversed bias junction capacitance and can be controlled by the amount of reverse bias. Theory of the step and impulse testing is developed else where in this issue.
Voltage Protect ion
There are three ways to protect the input from damag-
Fig . 4920A. per ( le f t ) and impu lse ( r igh t ) tes t d isp lay on the Mode l 4920A. These tes ts , per f o r m e d s i x t h e H e w l e t t - P a c k a r d C A T V C a b l e T e s t L a b o r a t o r y o n a 7 5 V . c a b l e , s h o w s i x r e f l e c t i o n s . T h e y a r e : ( 1 ) d i r e c t i o n a l c o u p l e r t a p , ( 2 ) b a c k - m a t c h e d t a p , ( 3 ) ( 4 ) i n - l i n e d i r e c t i o n a l c o u p l e r t a p i n p u t a n d o u t p u t , ( 5 ) b a c k - m a t c h e d t a p , a n d ( 6 ) e n d o f c a b l e . The l a rge d roop i n t he s tep d i sp lay i s due to resonance o f t he coup l i ng capac i t o r and the t r a n s f o r m e r p r i m a r y i n d u c t a n c e i n t h e b a c k - m a t c h e d t a p . I m p u l s e t e s t s h o w s c a b l e l o s s a t VHF band w id th .
© Copr. 1949-1998 Hewlett-Packard Co.
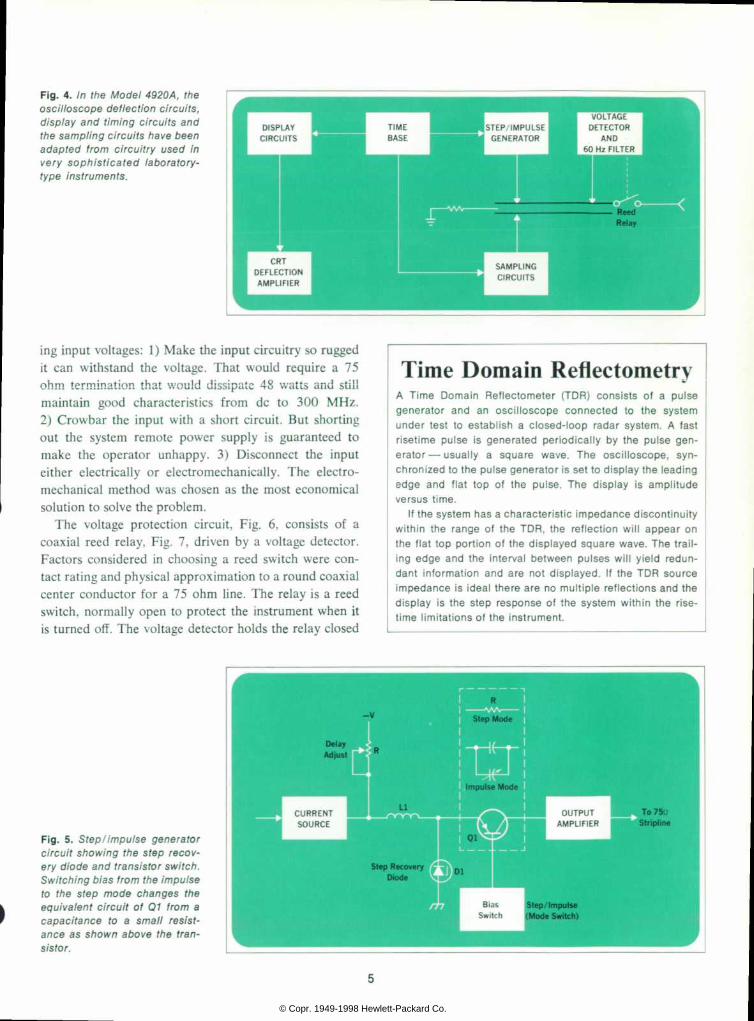
F i g . 4 . I n t h e M o d e l 4 9 2 0 A , t h e osc i l l o scope de f l ec t i on c i r cu i t s , d i s p l a y a n d t i m i n g c i r c u i t s a n d t he samp l i ng c i r cu i t s have been a d a p t e d f r o m c i r c u i t r y u s e d i n v e r y s o p h i s t i c a t e d l a b o r a t o r y - t ype i ns t r umen ts .
ing input voltages: 1) Make the input circuitry so rugged it can withstand the voltage. That would require a 75 ohm termination that would dissipate 48 watts and still maintain good characteristics from dc to 300 MHz. 2) Crowbar the input with a short circuit. But shorting out the system remote power supply is guaranteed to make the operator unhappy. 3) Disconnect the input either electrically or electromechanically. The electro mechanical method was chosen as the most economical solution to solve the problem.
The voltage protection circuit, Fig. 6, consists of a coaxial reed relay, Fig. 7, driven by a voltage detector. Factors considered in choosing a reed switch were con tact rating and physical approximation to a round coaxial center conductor for a 75 ohm line. The relay is a reed switch, normally open to protect the instrument when it is turned off. The voltage detector holds the relay closed
Time Domain Reflectometry A T i m e D o m a i n R e f l e c t o m e t e r ( T D R ) c o n s i s t s o f a p u l s e g e n e r a t o r a n d a n o s c i l l o s c o p e c o n n e c t e d t o t h e s y s t e m u n d e r t e s t t o e s t a b l i s h a c l o s e d - l o o p r a d a r s y s t e m . A f a s t r i s e t i m e p u l s e i s g e n e r a t e d p e r i o d i c a l l y b y t h e p u l s e g e n e r a t o r â € ” u s u a l l y a s q u a r e w a v e . T h e o s c i l l o s c o p e , s y n ch ron ized to the pu lse genera to r i s se t to d i sp lay the lead ing e d g e a n d f l a t t o p o f t h e p u l s e . T h e d i s p l a y i s a m p l i t u d e versus t ime.
I f t he sys tem has a cha rac te r i s t i c impedance d i scon t inu i t y w i t h i n t h e r a n g e o f t h e T D R , t h e r e f l e c t i o n w i l l a p p e a r o n t h e f l a t t o p p o r t i o n o f t h e d i s p l a y e d s q u a r e w a v e . T h e t r a i l i n g e d g e a n d t h e i n t e r v a l b e t w e e n p u l s e s w i l l y i e l d r e d u n d a n t i n f o r m a t i o n a n d a r e n o t d i s p l a y e d . I f t h e T D R s o u r c e i m pedance i s i dea l t he r e a r e no m u l t i p l e r e f l e c t i ons and t he d i s p l a y i s t h e s t e p r e s p o n s e o f t h e s y s t e m w i t h i n t h e r i s e - t ime l im i ta t i ons o f t he i ns t rumen t .
F i g . 5 . S t e p / i m p u l s e g e n e r a t o r c i r c u i t s h o w i n g t h e s t e p r e c o v e ry d i ode and t r ans i s to r sw i t ch . Sw i t ch ing b ias f r om the impu l se t o t h e s t e p m o d e c h a n g e s t h e e q u i v a l e n t c i r c u i t o f 0 1 f r o m a c a p a c i t a n c e t o a s m a l l r e s i s t a n c e a s s h o w n a b o v e t h e t r a n s is tor .
© Copr. 1949-1998 Hewlett-Packard Co.

F i g . 6 . S t r i p l i n e i n p u t c i r c u i t w i t h t he p ro tec t i ve re l ay and i t s a s s o c i a t e d v o l t a g e d e t e c t o r , 6 0 H z f i l t e r , s a m p l e r v e r t i c a l c h a n n e l , t r a n s i s t o r b u f f e r a m p l i f i e r and 75 t t t e rm ina t i on .
until a voltage of greater than ±5 volts appears at the input. The circuit will respond, opening the relay in less than 100 /<s. It latches open until reset by front panel RESET switch. A built-in time delay prevents cheating by holding the reset button. The relay and its circuitry have been cycled over a temperature range of —20 de grees C to +70 degrees C and operated 8 x 10lï times interrupting a 1.0 ampere current with no failures. Since the relay is required to operate only on instrument turn- on or during a faulty operating circumstance, it is es timated that the life of the relay under the worst expected usage would be 220 years.
Referring to Fig. 6, the sampling bridge diodes have 70 volt breakdown ratings, a capacitor protects the hum filter, the output transistor emitter is current limited and base is diode protected. The only possibility of failure of the 75 ohm termination at these voltages is a heating effect. But it is negligible because of the very short time involved.
Expansion System
The expansion window, an intensified trace 1 cm wide, is positioned by the MARKER POSITION control over the entire 10 cm horizontal trace. With x 10 on EX-
S P E C I F I C A T I O N S HP Model 4920A
Coaxial Fault Analyzer
OUTPUT ( INCIDENCE PULSE) SAMPL ING RATE: 25 kHz (nom ina l ) SYSTEM R ISE T IME :
S t e p M o d e : < 1 . 3 n s I m p u l s e M o d e : < 1 . 3 n s
O V E R S H O O T ( s t e p m o d e ) : < 5 % D R O O P ( s t e p m o d e ) : < 1 % AMPLITUDE:
S t e p M o d e : 1 . 0 V n o m i n a l i n t o 7 5 o h m s . Impulse Mode: 1 .0 V (nominal ) In to 75 ohms.
INPUT (REFLECTED PULSE) S C A L E : 4 r a n g e s ; 5 0 % / D i v . 2 5 % / D i v , 5 % / D i v a n d 2 . 5 % / D i v R E F L E C T I O N R E S O L U T I O N : < 0 . 5 % R E F L E C T I O N A C C U R A C Y : â € ” 2 % o f f u l l - s c r e e n d e f l e c t i o n .
I M P E D A N C E : 7 5 o h m s , d c c o u p l e d . I N P U T P R O T E C T I O N : A u t o m a t i c f r o m - 5 V u p t o  ± 6 0 V . H U M F I L T E R : N o m i n a l l y 4 0 d B r e j e c t i o n a t 6 0 H z .
HORIZONTAL (DISTANCE SCALE) S C A L E : 5 r a n g e s : 5 F t / D i v . 1 0 F t / D i v . 5 0 F t / D l v . 1 0 0 F t D i v .
5 0 0 F t / D i v . DISTANCE RESOLUTION; 2% ot fu l l -screen range. DISPLAY ACCURACY: :±5% of ful l -screen def lect ion. D I E L E C T R I C C A L I B R A T I O N : F i x e d c a l i b r a t i o n s e l e c t e d a t f r o n t
p a n e l f o r s o l i d ( V c  » . 6 6 ) a n d f o a m ( V e - . 8 1 ) d i e l e c t r i c s . V a r i a b l e c a l i b r a t i o n f r o m f r o n t p a n e l f o r a r t y v e l o c i t y c o n s t a n t ( V c ) b e t w e e n . 6 a n d 1 . 0 .
M A R K E R : V a r i a b l e p o s i t i o n ; s e l e c t s o n e d i v i s i o n o f b a s i c t r a c e f o r l u l l s c r e e n d i s p l a y i n e x p a n d m o d e .
E X P A N D : I n t e n s i f i e d p o r t i o n o f t r a c e i s m a g n i f i e d b y f a c t o r of 10.
DISPLAY C A T H O D E - R A Y T U B E : P 3 1 p h o s p h o r w i t h a n a t u r a l p e r s i s t e n c e
o f a p p r o x i m a t e l y 0 . 1 s e c o n d .
G R A T I C U L E : 8 x 1 0 m a j o r d i v i s i o n s : f i v e s u b d i v i s i o n s p e r m a j o r d i v i s i o n o n h o r i z o n t a l a n d v e r t i c a l a x e s
GENERAL C O N N E C T O R : T y p e F ( o t h e r t y p e s a v a i l a b l e o n s p e c i a l o r d e r ) . T E M P E R A T U R E R A N G E : O p e r a t i n g . 0 " t o 5 5 Â ° C ( 3 2 t o 1 3 T F )
storage. POWER REQUIREMENTS: 115 o r 230 vo l t s ( - 10%) . 47 t o 440
H z . a p p r o x i m a t e l y 6 6 w a t t s . W E I G H T : N e t . 2 3 " j I b s ( 1 0 . 6 k g ) ; s h i p p i n g . 3 3 I t s ( 1 5 . 0 k g ) . D I M E N S I O N S : 1 1 * 4 i n h i g h ; 8 % Â » i n w i d e : 1 8 ! l / n I n d e e p ( 2 9 8 . 5
x 2 1 1 . 1 x 4 7 4 . 4 m m ) . P R I C E : $ 1 8 2 5 . 0 0 ACCESSORIES FURNISHED: 10179A Cont ras t F i l te r ACCESSORIES AVAILABLE: 10176A V iew ing Hood. $7 .00 . C O M P L E M E N T A R Y E Q U I P M E N T A V A I L A B L E : 1 9 7 A O s c i l l o
s c o p e C a m e r a , $ 5 4 0 . 0 0 .
M A N U F A C T U R I N G D I V I S I O N : D E L C O N D I V I S I O N 3 3 3 L o g u e A v e n u e M o u n t a i n V i e w , C a l i f o r n i a 9 4 0 4 0
© Copr. 1949-1998 Hewlett-Packard Co.

F i g . v o l t a g e c i r c u i t . c o a x i a l r e e d r e l a y a s s e m b l y u s e d i n t h e v o l t a g e p r o t e c t i o n c i r c u i t .
P AND, the intensified spot expands to full screen with the left edge of the spot appearing at the left edge of the screen, thus maintaining distance calibration.
A p p l i c a t i o n s This instrument is intended to be used as a fault locator
in any coaxial cable environment. The Model 4920A is readily usable on C ATV, CCTV, telephone coaxial trans mission systems, and other 75 Q systems. The Model
r
Ronald D. Lowe f ^ ^ ^ * j R o n j o i n e d F & T D i v i s i o n o f H P
â € ¢ ^ H i n 1 9 6 4 t o w o r k o n t h e 5 2 6 0 A â € ¢ f I A u t o m a t i c F r e q u e n c y D i v i d e r .
He then des igned the i n teg ra ted c i r cu i t coun te r fo r t h e 5 2 4 0 A D i g i t a l F r e q u e n c y Meter . In 1967 he t rans fe r red to the De lcon D iv is ion in Moun ta in V iew where he was a p p o i n t e d G r o u p L e a d e r t o head up the 4920A deve lopmen t p r o g r a m . R o n g r a d u a t e d w i t h a BSEE in 1964 f rom the
U n i v e r s i t y o f I l l i n o i s a n d h a s comp le ted the cou rse requ i remen ts fo r a MSEE a t San Jose S ta te Co l lege . Pr io r to jo in ing HP, Ron worked as a r ad io b roadcas t eng inee r , w i t h r ad io d i r ec t i on f i nd i ng sys tems and is a ve teran o f the U.S. Army. Ron is a Member o f IEEE. H is hobby i s mode l ra i l road ing , and he i s an ac t i ve member o f t he Na t iona l Mode l Ra i l road Assoc ia t ion .
4920A is easily adaptable to 50 n systems such as mil itary communications, antenna feedlines, shipboard, air craft, and even in R&D labs by the plant maintenance people for troubleshooting the in-house coaxial cable. To simplify distance calculation, a slide rule, Fig. 8, is furnished. A table for converting percent reflection to worst-case return loss is printed on the reverse side.
D I S T A N C E F I N D E R
F ig . 8 . Th i s range ca l cu la t i ng s l i de ru le has a conve rs ion cha r t f o r pe rcen t r e f l ec t i on ve rsus wo rs t - case re tu rn l oss on the reverse s ide
© Copr. 1949-1998 Hewlett-Packard Co.

Acknowledgments
Full time members of the design group were Fred DeVilliers, who did the mechanical design and Jim Hood, who developed the step-impulse generator, fast ramp and output circuits. Thanks is due Paula Hescock for her excellent effort on printed circuit layout. The support and encouragement of our Engineering Manager, Bob Allen is greatly appreciated. Special mention goes to Al Best and many others of the HP Colorado Springs Divi sion for their cooperation and encouragement, g
Bibliography
1. B. M. Oliver, Time Domain Reflectometry; Hewlett- Packard Journal, Vol. 15, No. 6, Feb. 1964. 2. Time Domain Reflectometry; Application Note 62, Hewlett-Packard Company. 3. 'Cable Testing with Time Domain Reflectometry; Ap plication Note 67, Hewlett-Packard Company. 4. 'Selected Articles on Time Domain Reflectometry Ap plications; Application Note 75, Hewlett-Packard Company. 5. 'Pulse and Waveform Generation with Step Recovery Diodes; Application Note No. 918.
Tradeoffs in Impulse Testing By James M. Hood
AN IMPULSE CAN BE DESCRIBED as a pulse so brief that measuring equipment of a given resolving power is unable to distinguish it from even briefer pulses.
Impulse testing of linear systems is rarely performed because the frequency spectrum of the impulse must be flat over the entire frequency range of the device under test. To get appreciable energy over a broad frequency range requires such large amplitude impulses that the device may be driven into non-linear operation. The low frequency characteristics of a wideband device are diffi cult to observe when tested with an impulse.
Ideally, an impulse could be created by differentiating a perfect step:
Ideal Step
Vin(t) J
t = 0 t = 0
Vout(t) for such a pulse would be of flat frequency re sponse from w = — oo to + oo .
A realizable impulse has two practical limitations: Vln(t) does not have zero risetime, and the differentiation of Vln(t) will be an approximation. The limitations of im pulse generation by R-C differentiation are shown by:
Differentiator
= R1C1 = R1C1
Analysis of the RC differentiator yields:
V0(t) = R2C2
(1)
(2)
C2
Hf- V¡n(s)
O
R2 V0(s)
O
The time tmax at which the impulse amplitude is max
imum may
solving for t.
imum may be found by equating --r2 to zero and
V0(t)
R2C2 I n R l 1 1 (3,
T, R2C2
(V0)mai is obtained by substituting tmax in the equation V0 = f(t)
© Copr. 1949-1998 Hewlett-Packard Co.
f ^ 0/maar — \~VR2C2 \_R2C2 —TI
w
The preceding equations are easily programmed for a computer solution. A 10 volt, 300 picosecond step is differentiated:
V i n ( t ) A
T , = R 2 C 2 = 2 0 0 0 p s
10 rolls V0(t)
8 .22 vo l t s
O t
= 136ps V o < t ) = 1 0 . 7 3 \ â € ” e i x " â € ¢ f e 2 0 0 0 *
The resulting impulse is plotted by the computer:
P L 8 T Â » r T H E F U N C T I O N
M A X V A L U E 0 F F ( I ) Â » M I N V A L U E Â » F F ( T > â € ¢
8 . 2 1 8 4 0
SCALE UNIT •
V A L U E 0 F T
•j ! .
t . - .
- !
Ã̄
. ' .
I .
1 . 4 . -,
-• •
1 .4
. : .
• 1,1
• 1 Q • 1 n • : a • •
•t • ̂
•
and tmax can be obtained directly from the plot. The LaPlace transform of Eq. 2 gives an indication
of the frequency domain characteristics of the impulse.
:
R2C2
= (VR2C2) (5)
While Vu(t) is not an ideal impulse, it is a sufficient ap proximation if the upper corner frequency of the system to be tested in much less than VÃ-R2C2. The loss in re sponse at lower frequencies resulting from differentiating the step function is shown by:
Ideal Step - 6 d B / O c t a v e
20 log | V0 1 - 6 d B / O c t a v e
This is an advantage when low-frequency resonant cir cuits are connected to the system.
The 4920A Coaxial Fault Analyzer has an impulse generator that was designed for the VHP bandwidth. The two poles, VÃ7rR2C2 and VÃ7rT,, are set high so the im pulse in the time domain is narrow enough to meet the resolution requirements of the instrument. If this condi tion were not satisfied, a reflected impulse could become too wide and would be indistinguishable from the incident impulse:
( 7 ,
Coaxial Cable
Impulse Generator
V¡ = Incident Impulse Vr= Ref lected Impulse
Jim Hood J im Hood j o i ned t he H e w l e t t - P a c k a r d M i c r o w a v e D iv i s ion i n 1967 , immed ia te l y a f te r rece iv ing h is BS in EE f rom New Mex i co S ta te Un ivers i t y . He has been w i th the HP De lcon D iv i s ion s ince 1968 work ing on the
à development of step and i m p u l s e c i r c u i t r y f o r t h e Mode l 4920A.
I J i m i s a m e m b e r o f E t a K a p p a N u a n d I E E E . H e i s c u r r e n t l y
a t t e n d i n g S t a n f o r d U n i v e r s i t y on the HP Honors Coopera t i ve Program. In h is f ree t ime, he pu rsues h i s hobb ies o f sk i i ng and r i d ing mo to rcyc les .
© Copr. 1949-1998 Hewlett-Packard Co.

Compact Funct ion Generator Covers 0 . 0 0 0 5 H z t o 5 M H z N e w i n s t r u m e n t g e n e r a t e s s e v e n t y p e s o f w a v e f o r m s o v e r a w i d e f r e q u e n c y r a n g e .
By Raymond C. Hanson
MOST OF us HAVE at one time or another coveted one of those pocket knives with a dozen blades that can do practically everything. The advantages of a universal tool are many: economy, space saving, and time saving be cause of convenience. A close parallel in the electronics field is the function generator, which is a 'universal' signal source. Consider for example the sources required to test an amplifier:
F ig . 1 . Th is new HP Mode l 331 OA Func t ion Genera to r has a f r e q u e n c y r a n g e f r o m 0 . 0 0 0 5 H z t o 5 M H z a n d g e n e r a t e s s i n e , s q u a r e , a n d t r i a n g u l a r w a v e s a s w e l l a s p u l s e s a n d r a m p s .
• A power supply to set the input bias level
• A sine wave oscillator for frequency response meas urements
• A square wave generator for checking transient re sponse
A function generator provides all of these sources in one cabinet. Economy and space savings are obvious. Time savings result from the convenience of not having to hook up and isolate three separate devices.
Since the function generator's claim to fame is versa tility, improving this versatility is indeed a contribution. The new HP Model 3310A, Fig. 1 succeeds in this in several ways:
• Wide bandwidth. 10 decades of frequency from 0.0005 Hz to 5 MHz.
• More functions. In addition to the traditional sine, square, and triangle waveforms, the Model 33 10A has four others: a positive ramp, a negative ramp, and positive pulse, and a negative pulse.
• Greater output level range. A full 60 dB of attenuation is available providing signal levels from 15 volts peak- to-peak into 50 ohms to 15 millivolts peak-to-peak into 50 ohms.
• A useful sync output. Fast and dc coupled, the sync output supplies rectangular signals of 4 volts peak-to- peak into 50 ohms.
© Copr. 1949-1998 Hewlett-Packard Co.

• Other features. DC offset of ±5 volts into 50 ohms, and voltage control of frequency over a 50 to 1 range.
These features are obtained in the HP Model 3310A through the use of some interesting circuit techniques.
How Waveforms are Generated The function generator, Fig. 2, generates a triangle by
linearly charging and discharging a capacitor, between fixed voltage limits. Voltage limits are determined by a
detector whose output is a square wave. The detector output is used to alter the direction in which the capacitor is charging. This defines a closed loop with two outputs: a triangle and a square wave. A sine wave is synthesized from the triangle by means of a nonlinear network.
In the HP Model 3310A the capacitor is driven from two oppositely-polarized current sources, one of which is switched on and off by the detector. If the current source which is switched on and off is of value 21 while the other
Fig. simultaneously Pulse and square waves may be obtained from the sync output simultaneously w i th any o f the func t ions f rom the ma in ou tpu t .
11
© Copr. 1949-1998 Hewlett-Packard Co.

F i g . 3 . T y p i c a l s i n e a n d s q u a r e w a v e o u t p u t ( a ) f r o m t h e M o d e l 3 3 1 0 A . T h e s i n e w a v e i s t a k e n f r o m t h e m a i n o u t p u t a n d t h e s q u a r e w a v e s i m u l t a n e o u s l y f r o m t h e s y n c o u t p u t . T h e p o s i t i v e - g o i n g r a m p ( b ) i s t a k e n f r o m t h e m a i n o u t p u t w i t h t h e p u l s e f r o m t h e s y n c o u t p u t .
current source is of value I, then the resulting wave form is a symmetrical triangle. The frequency is changed over one decade by changing I by 10 to 1.
Ramp signals are obtained by altering the ratio of the currents in two current sources in such a way that the symmetry is changed while the net period remains the same. Pulses are obtained from the detector since it must have the same dissymmetry as the ramp.
High Frequency Limitat ions Loop delay is the major factor that determines the
highest operating frequency. Current in the integrating capacitor does not reverse at the precise time that the triangle reaches its desired voltage, but continues in the same direction for an amount of time equal to the loop delay. Thus at high frequencies, where loop delay is an appreciable part of the period, the triangle amplitude de pends upon the operating frequency.
Not only is frequency response degraded, but the delay also affects frequency calibration, and the change in tri angle amplitude destroys sine wave purity. In the HP Model 33 10A the loop delay is about 25 ns in each direc tion. At 5 MHz, the delay is about 25% of the period and would result in a 25% increase in the amplitude of the triangle. However, the loop delay problem is overcome by causing the detector to prefire at a point on the triangle such that, after a time equal to the loop delay, the capac itor current reverses at the same time that the triangle reaches its proper peak amplitude.
The 'prefiring' circuit uses two automatic leveling loops which sense the amplitude of the positive and negative peaks and cause the detector to fire at a level such that these peaks maintain a constant amplitude. As a result, the highest operating frequency of the HP Model 3310A is determined only by the frequency at which the instru ment no longer produces clean, crisp wave forms. The minimum duty cycle of the pulses and ramps are deter mined by the loop delay. At 5 MHz with a duty cycle of 15% the fast part of the ramp occurs in 30 nanoseconds, hence it is not possible to prefire by more than 30 nano seconds. Since the loop delay is about 25 nanoseconds the duty cycle was chosen to be 15%.
Low Frequency Limitat ions Very low frequencies are obtained by using large inte
grating capacitors and small currents. Space and cost limit the size of the capacitors. For good stability, the integrating current must be large so that leakage currents do not contribute a significant error. In the HP Model 3310A, very stable low frequencies are obtained by means of a feedback scheme which uses a differentiating
12
© Copr. 1949-1998 Hewlett-Packard Co.

operational amplifier to control the integrating current by sampling the slope of the triangle. With this arrangement, the triangle is essentially insensitive to the leakage cur rents of the current sources and is subject only to the leakage current and voltage drift at the input to the dif ferentiator. Fortunately good, low-drift, low-leakage dual FET's are available to solve that problem. In the HP Model 3310A a very stable 0.0005 Hz signal is obtained with this technique with only one nanoamp of integrating current.
Applications
Sine waves and square waves, Fig. 3 (a), are used at subaudio through video frequencies for testing steady state and transient response of linear systems. At low fre quencies, triangles and ramps, Fig. 3(b) are used for driving recorders or sweeping oscillators. At higher fre quencies they are used for testing devices where it is necessary to determine a rate of change. Two examples are the testing of amplifier slew rate, and testing logic devices that are triggered by a certain rate of change of voltage. Pulses and square waves are useful at low fre quencies for timing signals, and at higher frequencies for testing logic devices. Their usefulness in driving logic devices is enhanced by dc offset capability.
Acknowledgments
This has been a team effort from the beginning with equal credits to all: Steve Venzke, Glen Worstell and Virgil Leenerts. £
Raymond C. Hanson Th is i s the second t ime in about two years tha t Ray Hanson has con t r ibu ted to the Hewle t t - P a c k a r d J o u r n a l . H i s f i r s t a r t i c le was abou t the recovery o f w e a k s i g n a l s f r o m n o i s e ( H e w l e t t - P a c k a r d J o u r n a l , M a y 1967, page 11) . S ince he jo ined t h e H e w l e t t - P a c k a r d L o v e l a n d Div is ion in 1963, Ray has w o r k e d o n l o w - l e v e l d e t e c t i o n sys tems . He was p ro j ec t l eade r o n t h e H P M o d e l 3 4 1 0 A A C M ic rovo l tme te r d i scussed i n h is p rev ious a r t i c le . He has been p ro jec t l eader on the HP Model 331 OA Funct ion Genera tor .
Ray earned h is BSEE f rom the Un ivers i t y o f Ca l i fo rn ia in Berke ley (1 959) and an MSEE f rom New York Un ivers i ty (1 961 ) . He spent several years wi th Bel l Telephone Labo ra to r i es wo rk ing on vo i ce - f requency tes t equ ipmen t . Ray is a sk ier and l ikes to hunt and f ish .
S P E C I F I C A T I O N S H P M o d e l 3 3 1 O A
F u n c t i o n G e n e r a t o r
O U T P U T W A V E F O R M S : S i n u s o i d a l , s q u a r e , t r i a n g l e , p o s i t i v a p u l s e , n e g a t i v e p u l s e ,
pos i t i ve ramp, and nega t i ve ramp. Pu lses and ramps nave a 15 /65% ra t io .
FREQUENCY RANGE 0.0005 Hz to 5 MHz in ten decade ranges.
S I N E W A V E F R E Q U E N C Y R E S P O N S E :  ± 1 % . 0 . 0 0 0 5 H z t o 5 0 k H z  ± 3 % . 0 . 0 0 0 5 H z t o 5 M H I R e f e r e n c e . 1 k H z .
or division. 0.0005 Hz to 500 kHz nor division. 500 kHz to 5 MHz.
D I A L A C C U R A C Y :  ± 1 % o l s e t t i n g r o n e m i  ± 3 % o f s e t t i n g - t h r e e n
M A X I M U M O U T P U T : > 3 0 v o l t s p - p o p e n c i r c u i t > 1 5 v o l t s P - P i n t o 5 0 Ã ¼ ( e x c e p t l o r p u l s e s a t f r e q u e n c y
> 1 M H z l . P U L S E S :
>24 vo l t s p -p open c i r cu i t . > 12 vol ts p-p wi th 50 0 ( f requency > 2 MHz).
M I N I M U M I N P U T : < 3 0 m i l l i v o l t s p - p o p e n c i r c u i t . < 1 5 m i l l i v o l t s P - P i n t o 5 0 Q . L o w o u t p u t i s 3 0 d B d o w n f r o m h i g h o u t p u t .
S I N E W A V E D I S T O R T I O N : < 4 0 d B 0 . 0 0 0 5 H z t o 1 0 H z < Â « d B 1 0 H z t o 5 0 k H z ( o n 1 k r a n g e ) < 4 0 d B 5 0 k H z t o 5 0 0 k H z < 3 0 d B 5 0 0 k H z t o 5 M H z .
S Q U A R E W A V E A N D P U L S E R E S P O N S E : < 3 0 n s r i s e a n d f a l l t i m e s a t f u l l o u t p u t . < 3 5 n s a m p l i t u d e c o n t r o l n o t f u l l y c l o c k w i s e . < 5 % t o t a l a b e r r a t i o n s .
T R I A N G L E A N D R A M P L I N E A R I T Y : < 1 % 0 . 0 0 0 5 H z t o 5 0 k H z .
T R I A N G L E S Y M M E T R Y : < 1 % 0 . 0 0 0 5 H z t o 2 0 H z < 0 . 5 % 2 0 H z t o 5 0 k H z .
I M P E D A N C E : 5 0 0 .
O U T P U T L E V E L C O N T R O L : Range >30 dB (h igh and l ow ou tpu ts ove r lap fo r a t o ta l r ange
o f > 6 0 d B ) .
S Y N C : AMPLITUDE:
> 4 v o l t s P - P o p e n c i r c u i t >2 volts p-P into 50 Ü.
RISE AND FALL TIMES: < 2 0 n s .
W A V E F O R M : S q u a r e f o r s y m m e t r i c a l f u n c t i o n s . R e c t a n g u l a r f o r p u l s e a n d r a m p .
O U T P U T I M P E D A N C E : 50 D.
O F F S E T : A M P L I T U D E :
 ± 1 0 v o l t s o p e n c i r c u i t  ± 5 v o l t s i n t o 5 0 à . ' c o n t i n u o u s l y a d j u s t a b l e .
N O T E : M a x i m u m V A C P + V D C o f f s e t i s  ± 1 5 v o l t s o p e n c i r c u i t  ± 7 . 5 v o l t s i n t o 5 0 0 .
E X T E R N A L F R E Q U E N C Y C O N T R O L : R A N G E :
5 0 : 1 o n a n y r a n g e . I N P U T R E Q U I R E M E N T :
W i t h d i a l s e t t o l o w e n d m a r k . 0 t o + 1 0 v o l t s w i l l l i n e a r l y i n c r e a s e f r e q u e n c y 5 0 : 1 . W i t h d i a l s e t a t 5 0 . 0 t o - 1 0 v o l t s w i l l l i n e a r l y d e c r e a s e f r e q u e n c y 5 0 : 1 . A n a c v o l t a g e w i l l F M t h e f r e q u e n c y a b o u t a d i a l s e t t i n g w i t h i n t h e l i m i t s ( 1 < f < 5 0 ) x r a n g e s e t t i n g .
S E N S I T I V I T Y : A p p r o x i m a t e l y 1 0 0 m V / m l n o r d i v i s i o n .
I N P U T I M P E D A N C E : 10 kd.
NOTE: Speci f icat ions apply f rom 5 to 50 on f requency d ia l .
G E N E R A L : D I M E N S I O N S :
8 i n x 4 . 5 i n x 8 i n W E I G H T :
N e t : 6 I b ( 2 . 7 k g ) : S h i p p i n g , 7 I b ( 3 . 2 k g ) .
P O W E R : 1 1 5 V o r 2 3 0 v o l t s  ± 1 0 % . 5 0 H z t o 4 0 0 H z < 2 0 W .
P R I C E : $ 5 7 5 .
M A N U F A C T U R I N G D I V I S I O N : L O V E L A N D D I V I S I O N P 0 . B o x 3 0 1 815 Fourteenth Street S W. Loveland. Colorado S0537
© Copr. 1949-1998 Hewlett-Packard Co.

1C Logic Checkout Simplified Simple but e legant , th is touch-and-read log ic probe c lear ly s igna ls the p resence o f nanosecond pu lses and ind i ca tes logic levels in TTL and DTL integrated-circui t logic networks.
By Gary B. Gordon
IN CHECKING OUT INTEGRATED LOGIC CIRCUITS, VOlt-
meters and oscilloscopes are indispensable for measuring logic levels and observing pulse shapes. However, now that 1C logic threshold voltages and switching charac teristics are becoming standardized, the checkout prob lem often reduces to questions like 'Is the voltage on this logic line in the high state or is it in the low state?; or
'Are pulses present on such-an-such line?! In these cases the voltmeter and the oscilloscope give more informa tion than is wanted. What's more, an oscilloscope requires several adjustments to display pulses, and it may also require a viewing hood, if the pulses are narrow and widely spaced. A better instrument for checking 1C logic would be a small one which would clearly indicate levels
F i g . 1 . M o d e l 1 0 5 2 5 A L o g i c P r o b e i s a s i m p l e t o u c h - a n d - r e a d i n s t r u m e n t f o r t r a c i n g l o g i c s i g n a l s i n T T L a n d D T L l o g i c n e t w o r k s . I t s t i p - m o u n t e d l a m p g i v e s r a p i d a n d u n a m b i g u o u s i n d i c a t i o n s o f p u l s e s and l og i c l eve l s .
14
© Copr. 1949-1998 Hewlett-Packard Co.

F i g . 2 . T h e l o g i c p r o b e ' s l a m p s t a y s o n w h e n t h e p r o b e i s t o u c h e d t o a h i g h l o g i c l e v e l o r t o a n o p e n c i r c u i t . I t t u r n s o f f f o r a l ow l eve l , and g l ows a t p a r t i a l b r i l l i a n c e f o r a p u l s e t ra in . Pu lses be tween 25 ns and 0 . 1 s a r e s t r e t c h e d t o t u r n t h e lamp on ( fo r a pos i t i ve pu lse ) o r o f t ( f o r a n e g a t i v e p u l s e ) f o r a fu l l 0 .1 s .
and pulses, even single narrow pulses, and wouldn't re quire the user to shift his eyes from his circuit. Triggering should be automatic, without slope or level adjustments.
From these considerations came the idea for the Model 10525 A Logic Probe, Fig. 1. The probe is an inexpen sive logic-signal-tracing instrument compatible with TTL and DTL integrated circuits, which account for the ma jority of new logic design. Mounted near the tip of the probe is an indicator lamp which flashes on for 0. 1 sec ond when a positive pulse occurs on the line being probed, extinguishes for 0. 1 second when a negative pulse occurs, glows brightly for a high logic state or an open circuit, turns off for a low logic state, and glows at partial brightness for pulse trains. Single pulses as narrow as 25 nanoseconds will trigger the probe. Fig. 2 summarizes the probe's behavior.
To see whether the probe would be useful to logic designers, several prototypes were built and made avail able in our own laboratory. The response was enthusias tic; all of the probes were soon in constant use. There seems to be no doubt that the probe fills a need in the development and troubleshooting of logic networks.
How It 's Used
For operation, the probe requires a source of five volts and a ground return. Usually the probe can simply be clipped into the Vcr and ground buses of the circuit being tested. A small laboratory power supply and a ground jumper may also be used. Certain new HP instruments have an internal 5 V connector for powering the probe.
One way to use the probe is to operate a logic circuit at its normal clock rate and probe from point to point, checking for the presence of timely pulses such as clock, reset, start, count, shift, transfer, and so on. This gives a quick indication of any sections of the circuit which are not operating. A second technique, which is especially useful in serial arithmetic units and other sequential machines, is to replace a unit's internal clock generator with a slow external pulse generator which produces ap proximately one pulse per second. Then single pulses and state changes can be observed in real time with one or more logic probes. (Multiple probes are especially help ful for observing timing relationships.) These real-time observations, and the ease with which the probe's indica tions can be interpreted, usually give an experienced de signer a strong intuitive feeling for what a logic network is actually doing.
How I t Works
Inside the probe is a logic board containing 22 discrete components and an integrated circuit. Fig. 3 is the circuit diagram. The probe has an input protection circuit which will withstand overloads as high as ±200 V The input circuit is followed by a high-impedance input amplifier which sets the input threshold at + 1 .4 volts with respect to the probe's ground lead. This is compatible with TTL, DTL and some other types of logic (but not ECL). Non linear negative feedback prevents saturation and en hances the switching speed of the input amplifier. Two
15
© Copr. 1949-1998 Hewlett-Packard Co.
F i g . 3 . I n s i d e t h e l o g i c p r o b e a re 22 d isc re te e lements and an i n t e g r a t e d c i r c u i t . T h e p r o b e g e t s f i v e - v o l t p o w e r f r o m t h e c i r c u i t b e i n g t e s t e d o r f r o m a s e p a r a t e p o w e r s u p p l y . T h e p r o b e ' s c i r c u i t s a r e p r o t e c t e d a g a i n s t i n p u t o v e r l o a d s a s h i g h as ±200V.
pulse stretchers follow the input amplifier; one triggers on incoming positive pulses and the other on incoming negative pulses. Each stretcher is a monostable multi vibrator formed by cross-connecting two NAND gates. When one multivibrator is stretching the other acts as an inverting amplifier. The second stretcher controls the lamp driver.
Acknowledgments The idea for the logic probe grew out of design work
on the HP 5360A Computing Counter. I wish to thank France Rodé and Charles Hill for their suggestions, and for encouraging me to pursue the development of the probe. I also wish to thank Larry Brendlen for his clever and graceful mechanical design, g
S P E C I F I C A T I O N S HP Model 10525A
Logic Probe INPUT
IMPEDANCE: 10 k' . : TRIGGER THRESHOLD: -t- 1.4 V, nominal. PULSE WIDTH SENSITIVITY: 25 ns lo r -2 V pu lses re ferenced
symmetr ica l ly about + 1.4 V. OVERLOAD PROTECTION:
-50 V t o 200 V con t i nuous - 200 V to + 200 V transient 120 V ac lor 10 s
POWER REQUIREMENTS 5 V ±10% at 75 mA, BNC power connector In te rna l overvo l tage pro tec t ion to -7 V supp ly
TEMPERATURE: 0 to 55 'C ACCESSORIES INCLUDED:
BNC to a l l i ga to r c l i ps BNC to banana plug adapter BNC bu lkhead connec to r Ground cab le assembly
PRICE: $95.00. Quant i ty d iscounts avai lab le. MANUFACTURING DIVISION: HP FREQUENCY AND
T IME DIV IS ION 1501 Page Mi l l Road Palo Al to. Cal i fornia 94304
Gary B. Gordon Gary Gordon i s a 1962 g radua te o f the Un ive rs i t y o f Ca l i fo rn ia a t Berke ley w i th a degree in e l ec t r i ca l eng inee r i ng . A s u m m e r e m p l o y e e a t H P i n 1961 , Gary re jo ined the company in 1966 a f te r se rv ing four years in the Un i ted S ta tes Navy . He ass is ted in deve lop ing the a r i thmet i c un i t o f the c o m p u t i n g c o u n t e r a n d deve loped the l og i c p robe . He is a member o f IEEE and has severa l pa ten ts pend ing in t he f i e l d o f d i g i t a l des ign .
Ga ry has spen t many l e i su re hou rs des ign ing and bu i ld ing fu rn i tu re fo r h i s home and , in add i t i on , he p lays the ban jo , sa i l s an E l Toro , and i s an amateur as t ronomer . <
16
© Copr. 1949-1998 Hewlett-Packard Co.

Pulsar Optical and Radio Emissions Observed Simultaneously
Detec t ion o f a t ime in te rva l be tween the op t i ca l and r a d i o p u l s e s h a s p r o v i d e d a n i m p o r t a n t t e s t o f t h e various theories developed to explain why pulsars pulse
By Charles N. Taubman
SCIENTISTS AT THE UNIVERSITY OF CALIFORNIA and STANFORD UNIVERSITY have recently successfully mon itored simultaneous optical and radio signals from the pulsar in the Crab Nebula, NP 0532. The experiment was similar to the one previously reported in these pages'1' in that signal averaging!2' was used to pull the signals out of noise. This time, however, the phase difference between the optical and radio signals was measured to see whether the two signals are emitted from different positions or at different times. After correcting their data for systematic phase differences and differences in the interstellar delay of the optical and radio signals, the scientists observed that the optical and radio emissions are separated at the source by 1.42 ±0.34 ms[3]. While the results are not conclusive, that the signals do appear to have a phase difference is consistent with the rotating neutron star theory, the pulsar theory that is now most in favor (see page 20).
Pulsar NP 0532 Pulsars, of course, are pulsating radio sources in outer
space14'. Characterized by a precise repetition rate, these sources emit pulses of enormous energy over broad fre-
* J . S . M i l l e r a n d E . J . W a m p l e r , L i c k O b s e r v a t o r y , U n i v e r s i t y o f C a l i f o r n i a , S a n t a Cruz, Cal i forn ia . * E. Stanford Stan and H. T. Howard, Radiosc ience Laboratory , Stanford Univers i ty , Stan ford, Cal i forn ia .
quency ranges. The first pulsar was detected less than two years ago, and now more than thirty are known. The possibility of an intelligent source has been con sidered, but the energy involved and the frequency dis tribution strongly imply that the sources are natural. Numerous theories as to the origin of pulsars have been proposed'5'1'11. The one currently most in favor'7' ascribes the phenomena to rotating neutron stars, which are hy pothesized to be the exceedingly dense remnants of super- novae.
There are several particularly exciting aspects to NP 0532. It is in the Crab Nebula, a supernova first ob served by the Chinese on July 4, 1054, and its location is approximately where the remnant of the Crab Nebula is thought to be. The brevity of its period (33 ms) and the fact that it is gradually slowing down are consistent with the rotating neutron star theory. In separate experiments, both optical and radio emissions from NP 0532 have been detected'8'. Theoretically, knowing the approximate location of the source and the propagation velocity of electromagnetic waves, one should be able to make a si multaneous observation that would yield knowledge of any differences in the source positions or times of emis sion of the optical and radio pulses. Measurement of this phase difference was the primary objective of the Stan- ford-U.C. experiment.
17
© Copr. 1949-1998 Hewlett-Packard Co.

(Synthesizer Frequency
Adjusted for Stable Scope
Display)
F i g . r a d i o p u l s a r f o r s i m u l t a n e o u s l y m o n i t o r i n g t h e o p t i c a l a n d r a d i o p u l s e s f r o m p u l s a r N P 0 5 3 2 . t o m u l t i c h a n n e l a n a l y z e r a n d t h e s i g n a l a n a l y z e r w e r e u s e d a s a v e r a g e r s t o
improve s igna l - t o -no i se ra t i o .
Exper imental Setup
Fig. 1 is a block diagram of the equipment used in the experiment. At Lick Observatory, optical emissions from the pulsar were detected by an ITT FW 130 Photomulti- plier located at the prime focus of the 120 inch telescope. Pulses from the photomultiplier were counted by an HP 5401 A Multichannel Analyzer'9! operating in its mul tichannel scaling mode. The analyzer sweep was triggered externally at the pulsar's repetition rate by a trigger source consisting of an HP 5 1 03 A Frequency Synthesizer whose output was scaled down by an HP 5245L Counter.
The trigger signal was transmitted to Stanford Univer sity where another synthesizer (HP 5100A) and sealer (HP 5245L) were adjusted to the same frequency and phase. This synchronizing source triggered an HP 5480A Signal Analyzer/ Averager'1'1' which monitored the radio pulses from NP 0532 detected at 424 MHz by Stanford's 150 foot parabolic radio telescope.
Experimental Results
Fig. 2(a) shows the optical pulse shape displayed on the multichannel analyzer after about 5000 sweeps were summed. The pulse shape is quite distinct, indicating that the pulse position can be determined to within 50 ¡¿s, the width of one channel of the multichannel analyzer.
Fig. 2(b) shows the radio pulses displayed on the signal analyzer at Stanford after about 22,000 repetitions were averaged. The input signal-to-noise ratio was quite small (Fig. 2(c)), and even after averaging, the uncertainty in the pulse position is about 500 microseconds.
The apparent positions of the optical and radio pulses had to be corrected for systematic phase differences (such as the travel time of the trigger signal between Lick and Stanford) and for interstellar dispersion, or delay, of the radio signal with respect to the optical signal. When these adjustments were made, the optical and radio signals appeared to be separated at the source by an average of
© Copr. 1949-1998 Hewlett-Packard Co.

_ Charles N. Taubman C h u c k T a u b m a n r e c e i v e d h i s BSEE f rom S tan fo rd Un ive rs i t y in 1965 and h is MSEE f rom the Massachuse t ts Ins t i tu te o f Techno logy i n 1966 , whe re he w ro te h i s t hes i s on compu te r - a i d e d a n a l y s i s o f p r o c e s s con t ro l sys tems. He was e lec ted to S igma X i , Tau Beta P i , and Ph i Beta Kappa, and he is a lso
A a m e m b e r o f I E E E .
S ince j o i n i ng Hew le t t -Packa rd in 1 966, Chuck has been invo lved wi th the 5480A Signa l Ana lyze r and i s one o f t he p ro jec t eng inee rs work ing on the sys tem. He en joys a var ie ty o f spor ts and f inds t ime to p lay go l f , tenn is , Sof tba l l , and basketba l l .
1.42 milliseconds, the optical signal being detected first. Incorporating the uncertainty in the calculated value of the interstellar dispersion, and the experimental uncer tainty in the positions of the radio pulses, the average time separation can be stated as 1.42 ±0.34 ms (see table, page 20, for summary of results). By comparison, the rotating neutron star theory predicts a time separation of about 5 ms.
Another prediction of the rotating neutron star theory is that the radio waves should be linearly polarized. The optical emissions, however, can have any polarization, or none. Data taken at Lick Observatory are now being analyzed to determine the state of the optical polarization.
Linear polarization of some pulsar radio waves has been verified many times. The antenna at Stanford is right-circularly polarized, so linear polarization of the radio waves may account for the fact that in the observed optical signal the main pulse has 3.5 times the height of the subpulse, while in the observed radio signal the ratio is only 1.2. f
Fig . 2 (a ) . F ive-minu te average (5000 repe t i t i ons) o f wh i te - l i g h t o p t i c a l p u l s e s o n M a r c h 1 5 , 1 9 6 9 . ( b ) T w e n t y - t i v e - m i n u t e a v e r a g e ( 2 2 , 0 0 0 r e p e t i t i o n s ) o f 4 2 4 M H z r a d i o p u l s e s o n M a r c h 1 5 . T h e s e p h o t o g r a p h s s h o w o n l y t h e p u l s e s h a p e s , n o t t h e c o r r e c t e d t i m e r e l a t i o n s h i p b e tween the op t i ca l and rad io s igna ls , ( c ) Rad io s igna l a f te r a v e r a g i n g o n l y 2 5 6 r e p e t i t i o n s s h o w s n o d i s c e r n i b l e p u l s e s , i n d i c a t i n g h o w b a d t h e s i g n a l - t o - n o i s e r a t i o w a s . The s igna l was a lso fad ing .
19
© Copr. 1949-1998 Hewlett-Packard Co.

Are Pulsars Rotating Neutron Stars? T h e m o s t c o m p l e t e p u l s a r t h e o r y t o d a t e i s t h e r o t a t i n g n e u t r o n s t a r t h e o r y p r o p o s e d b y T h o m a s G o l d o f C o r n e l l U n i v e r s i t y . A c c o r d i n g t o t h i s t h e o r y a p l a s m a o f c h a r g e d p a r t i c l e s c o m i n g f r o m a s p o t o n t h e n e u t r o n s t a r m o v e s o u t w a r d r a d i a l l y , f o l l o w i n g t h e s t a r ' s m a g n e t i c f i e l d , w h i c h i s s i m i l a r i n s h a p e t o t h e e a r t h ' s . T h e f a r t h e r o u t t h e p a r t i c l e s g o t h e f a s t e r t h e m a g n e t i c f i e l d m o v e s , a n d t h e p a r t i c l e s ' t a n g e n t i a l v e l o c i t y i n c r e a s e s a c c o r d i n g l y , e v e n t u a l l y a p p r o a c h i n g t h e v e l o c i t y o f l i g h t . W h e n t h i s h a p p e n s t h e p a r t i c l e s e m i t h i g h - e n e r g y e l e c t r o m a g n e t i c r a d i a t i o n , c a l l e d s y n c h r o t r o n r a d i a t i o n , j u s t a s c h a r g e d p a r t i c l e s d o w h e n t h e y a r e a c c e l e r a t e d b y c i r c u l a r a c c e l e r a t o r s o n e a r t h . T h i s r a d i a t i o n i s l i n e a r l y p o l a r i z e d a n d c o n c e n t r a t e d i n t h e f o r w a r d d i r e c t i o n . I t s w e e p s b y t h e e a r t h o n c e e a c h t i m e t h e s t a r r o t a tes . Op t i ca l r ad i a t i on com ing f r om the same spo t on t h e s t a r i s a l s o s e e n o n e a r t h o n c e f o r e a c h r o t a t i o n , b u t t h e r e s h o u l d b e a t i m e d e l a y b e t w e e n t h e o p t i c a l a n d r a d i o p u l s e s c o r r e s p o n d i n g t o t h e t i m e i t t a k e s f o r t h e p l a s m a t o t r a v e l o u t w a r d t o t h e p o i n t w h e r e t h e s y n c h r o t r o n r a d i a t i o n t a k e s p l a c e . F o r p u l s a r N P 0 5 3 2 t h i s t i m e d e l a y s h o u l d b e a b o u t 5 m s . I n t h e e x p e r i m e n t r e p o r t e d i n t h e a c c o m p a n y i n g a r t i c l e i t w a s m e a s u r e d t o b e 1 . 4 2 Â ± 0 . 3 4 m s . I f t h e r e s u l t s a r e v a l i d , G o l d ' s t h e o r y w i l l h a v e t o b e m o d i f i e d .
T a n g e n t i a l V e l o c i t y S p e e d o f L i g h t
Table I — Summary of Observations^
March 13 March 15 March 15
T ime (PST) A p p a r e n t P e r i o d ( m s ) Rad io F requency (MHz ) O b s e r v e d R a d i o D e l a y ( m s ) C a l c u l a t e d D e l a y * ( m s ) C a l c u l a t e d D e l a y
m inus 39 Per iods (ms) D i f f e r e n c e * ( m s )
W e i g h t e d A v e r a g e * ( m s )
2000-2020 33.09876 423.28 26.13 ±0.60 1316.96 ±6.0
26.11 ±6.0 + 0.02 ±6.0
2000-2030 33.09885 424.00 21.09 ±0.40 1312.49 ±6.0
21.63 ±6.0 -0.54 ±6.0
2100 -2130 33.09887 424.00 20.48 ±0.40 1312.49 ±6.0
-0.63 ±6.0
* The Observatory, delay obtained f rom the Arecibo Ionospher ic Observatory, Puerto Rico, has s ince been cor rec ted . The new we igh ted average i s +1 .42 ±0.34 ms .
References
:i] L. D. Shergalis, 'Stanford Scientists Study Space Signals; Hewlett-Packard Journal, May 1968. Ã2' C. R. Trimble, 'What Is Signal Averaging?; Hewlett-Pack ard Journal, April 1968. '3 'E. K. Conkl in , H. T. Howard, J . S . Mil ler , and E. J .
Wampler, Nature 222 (1969). The conclusions reported in this refer ence are slightly different from those reported here because after the in formation was submitted to Nature, a correction was made in the calcu lated interstellar dispersion. WE D. Drake, 'Pulsars; 1969 IEEE National Convention, Paper IE.2. !5 'H. L . Davis , 'Key to mys te ry pulses: rotating neutron stars; Scien tific Research, May 13, 1968. [6'T. R. McDonough, They're Try ing to Tell Us Something: Part 2, ' Analog, April 1969. ?l T. Gold, Nature, 221, 25 (1969). 81 The optical emissions were first
detected by W. J. Cocke, M. J. Dis ney, and D. J. Taylor, Nature, 221, 525 (1969). Radio emissions were first detected by Staelin and Reifen-
stein, IAU Circular No. 21 10 (1968). 9' W. A. Ross, 'A Multichannel Pulse-Height Analyzer with
a Very Fast Analog-Digital Converter,' Hewlett-Packard Journal, March 1968.
°l J. E. Deardorff and C. R. Trimble, 'Calibrated Real-Time Signal Averaging,' Hewlett-Packard Journal, April 1968.
HEWLETT-PACKARD JOURNAL • JUNE volume 20 -Number 10 T E C H N I C A L A L T O F R O M T H E L A B O R A T O R Y O F T H E H E W L E T T - P A C K A R D C O M P A N Y P U B U S H E D A T , 5 0 , P A G E M , L L R O A D . P A L O A L T O C A U F O R N . A 9  « 0 4
H . S n y d e r E d i t o r i a l B o a r d : R . P . D o l a n , L . D . S h e r g a l i s _ _ _ _ A r t S t a f f : J o h n C . A l l e n , C l a y t o n A s s o c i a t e s , D i r e c t o r ; M a r i d e l J o r d a n A s s i s t a n t
© Copr. 1949-1998 Hewlett-Packard Co.