Embed Size (px)
Citation preview

Investor Relations
Q4 2017 results and capital update
7 February 2018analyst & investor call presentation

2
Highlights Q4 2017 are vs. Q4 2016
Highlights at Q4, a solid quarter
Net profit up at EUR 542m, reflecting good growth in operating result and impairment releases
On track to achieve financial targets: NII remains resilient and cost saving programmes are delivering
Dividend EUR 1.45 per share (full year) benefits from increased pay-out (50%) on sharply improved reported profit
Strong CET1 capital of 17.7%
Capital update
− Basel IV impact of around 35% RWA increase
− CET1 target for 2018 of 17.5-18.5% under Basel III
− Dividend pay-out 50% of sustainable profit, additional distributions will be considered. Combined at least 50%

3
1) Dividend 2017: final dividend per share of EUR 0.80 per share, interim dividend per share of EUR 0.65
Good progress on profit, capital and dividend over the past 4 years
Profit development Dividends per share and pay-out 1)
Strong profit development driven by high business returns and declining impairments
FY2017 dividend up sharply vs 2016 from rise in pay-out ratio to 50% and increased profit
Strong CET1 capital position built ahead of Basel IV
Build up CET1 capital
Basel III CET1 ratio EUR m
1,5511,924 2,076
2,791
2014 2015 2016 2017
ReportedUnderlying
14.1%15.5%
17.0% 17.7%
YE2014 YE2015 YE2016 YE2017
0.430.81 0.84
1.45
35%
40%
45%
50%
2014 2015 2016 2017
Dividend per share (EUR)Dividend pay-out (%)

4
1) Sustainable profit excludes exceptional items that significantly distort profitability; examples are book gain on PB Asia sale (2017) and provision for SME derivatives (2016). Additional distributions may be special dividends or share buy-backs (subject to regulatory approval) and are subject to other circumstances, including regulatory and commercial considerations
Updated capital target range reflects Basel IV impact
Estimated Basel IV impact Updated targets
Basel IV impact estimated at around 35% RWA increase
Well placed for Basel IV given strong current CET1 of 17.7%
Final impact subject to EU implementation (2022), transitional arrangements (from 2022), ongoing business developments and mitigating actions
Updated capital target range of 17.5-18.5% CET1 ratio under Basel III for 2018
Dividend pay-out of 50% of sustainable profit from 2018.Additional distributions will be considered when capital is within or above target range. Combined at least 50% 1)
ROE and Cost/Income target ranges remain unchanged
13.5%
4-5% 17.5-18.5%
Formertarget
Basel IV imple-mentation buffer
Updatedtarget 2018
in B
asel
III t
erm
s
Fully loaded CET1 ratio RWA bn
~ 35%
Basel IIIYE2017
Pro forma YE2017Basel IV at 72.5% floor

5
Senior management simplification
Head office cost reductions
IT simplification, standardisation and agile
Digitalisation in Retail Banking
Private Banking disposal, simplification and digitalisation
Sector approach in Commercial Banking
Digital initiatives launched
Cost savings from transformation and business simplification
Progress on transformation Business simplification: lower headcount & branches
Transformation delivering on cost savings
FTEs declined 10% from YE2015 vs. our 13% target by 2020
Increase in digital processes, products and services enables further reduction in retail branches
FTEs ‘000
26.5 26.024.0
YE2015 YE2016 YE2017
Internal External
260221
202
YE2015 YE2016 YE2017
Retail branches
-2%-8%
6
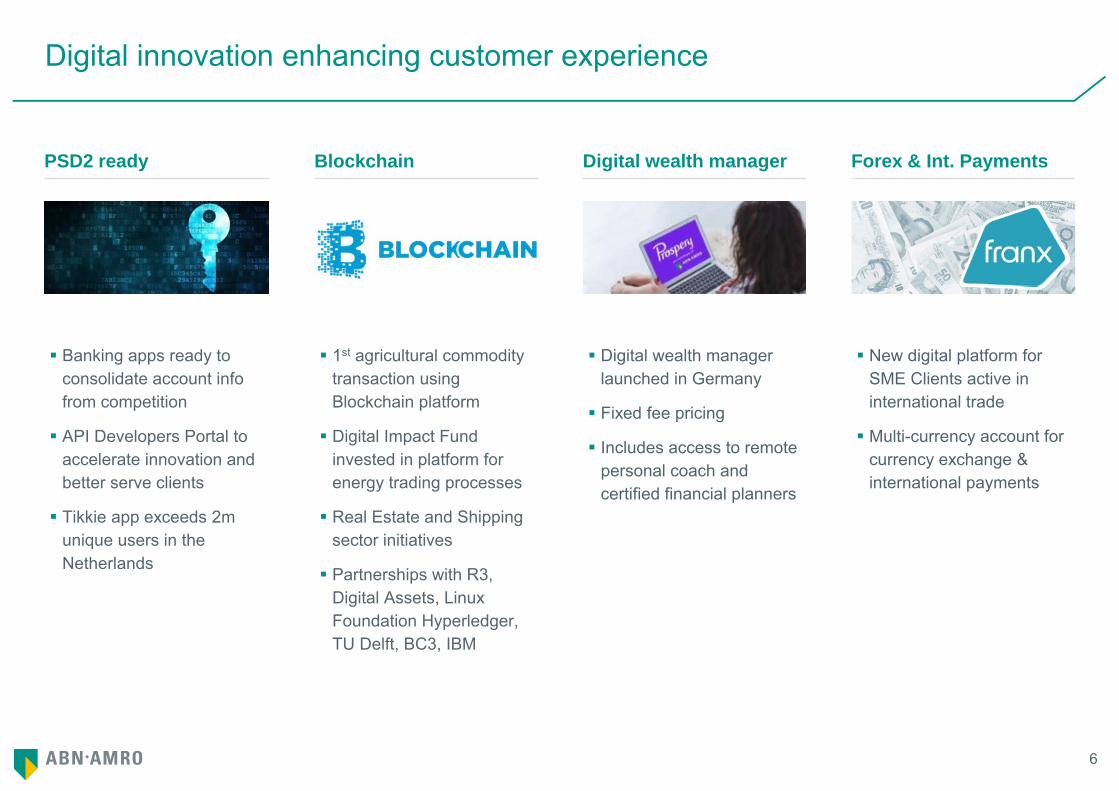
Digital innovation enhancing customer experience
PSD2 ready Blockchain
Banking apps ready to consolidate account info from competition
API Developers Portal to accelerate innovation and better serve clients
Tikkie app exceeds 2m unique users in the Netherlands
Digital wealth manager
1st agricultural commodity transaction using Blockchain platform
Digital Impact Fund invested in platform for energy trading processes
Real Estate and Shipping sector initiatives
Partnerships with R3, Digital Assets, Linux Foundation Hyperledger, TU Delft, BC3, IBM
Digital wealth manager launched in Germany
Fixed fee pricing
Includes access to remote personal coach and certified financial planners
Forex & Int. Payments
New digital platform for SME Clients active in international trade
Multi-currency account for currency exchange & international payments

7
1) Awarded at The World Economic Forum in Davos, 22 Jan 2018. The Circulars is an initiative of the World Economic Forum and the Forum of Young Global Leaders
Good progress on sustainability
High sustainability score Award Circular Economy Investor
Top 5% of both Dow Jones Sustainability Index for global banks and FTSE4Good index
‘Circular Economy Investor’ award for being at forefront of circular finance and financing of new business models emerging from the principles of the circular economy 1)
Percentage of female employees in senior management up from 23% to 38% since the introduction of the new management structure last year
Women at the top
43
14 23
43
2238
YE2016YE2017
SupervisoryBoard
ExecutiveCommittee
Senior management
% female employees91
2013 2014 2015 2016 2017
score of 91out of 100 points
‘Circular Economy Investor’Award
World Economic ForumDavos, 2018

8
Solid quarter
Net profit up at EUR 542m
No meaningful effect of incidentals on profit of Q4 2017. Q4 2016 profit was negatively impacted by incidentals
Operating income up 11%
Operating expenses down 3%
Low impairments reflect good performance of Dutch economy, IBNI effects and a model update
Tax expenses up, including US tax reform
Key pointsEUR m 2017 Q4 2016 Q4 Delta
Net interest income 1,696 1,575 8%
Net fee and commission income 443 459 -3%
Other operating income 290 161 79%
Operating income 2,429 2,195 11%
o/w incidentals 208 -27
Operating expenses 1,653 1,706 -3%
o/w incidentals 237 318
Operating result 776 489 59%
Impairment charges -34 35
Income tax expenses 268 120 123%
Underlying profit 542 333 63%
Special items - -
Reported profit 542 333 63%

9
1) As of Q4 2016 reported IFRS figures are used, historic figures before Q4 2016 exclude the impact of IFRIC adjustments2) Corporate loans in CIB (including ECT) increased EUR 0.6bn in 2017, including the effect of an increase in commodity prices (EUR +1.2bn) and USD depreciation (EUR -3.5bn)
Client lending picking up vs. Q4 2016
Mortgage client lending 1) Corporate loans client lending 1)
Mortgages are up for the year
Corporate loans are up for the year, reflecting growth driven by SME and ECT clients 2)
Consumer lending more or less stabilised over the past year
Consumer loans client lending
EUR bn EUR bn EUR bnCAGR = 1.5% CAGR = 4.2% CB , 10.9% CIB CAGR = -2.6% (ex PB Asia)
149.
3
151.
4
150.
6
110
125
140
155
Q1 Q2 Q3 Q4 Q1 Q2 Q3 Q4
2016 2017
38.3
37.6
38.9
38.6 39.8
39.6
20
30
40
50
Q1 Q2 Q3 Q4 Q1 Q2 Q3 Q4
2016 2017
CIB Commercial Banking
12.5
12.4
12.4
0
10
20
30
Q1 Q2 Q3 Q4 Q1 Q2 Q3 Q4
2016 2017
PB Asia (sold)

10
1) Positive effects of release of unearned interest on defaulted loans (EUR 74m) and mortgage penalties (EUR 49m) and T-LTRO benefits for 2017 (EUR 29m) were partly offset by provisions for Euribor based mortgages (EUR -52m) and the ICS compensation scheme (EUR -8m)
Net interest income resilient despite low rate environment
Net Interest Income (NII) Net Interest Margin (NIM)
NII up reflecting net positive incidentals in Q4 2017 1)
Margins up in CIB and on consumer loans, stable margins in other businesses and products
NIM improved strongly in Q4 reflecting incidental NII effects and seasonal balance sheet deleveraging
EUR m NIM bps
1,57
5
1,56
6
1,60
492
1,000
1,250
1,500
1,750
Q1 Q2 Q3 Q4 Q1 Q2 Q3 Q4
2016 2017
Net interest income Incidental effect
120
140
160
180
Q1 Q2 Q3 Q4 Q1 Q2 Q3 Q4
2016 2017
NIM NIM ex incidental effect4Q rolling average

11
1) In Q4 2017 the income of Stater (mortgage service provider) is reclassified from Other operating income to Net fee income. Historic figures have been restated
Non-interest income benefitted from incidental gains
Net fee income 1)
Fees flat vs. Q4 2016 and improved vs. Q3, mainly in Commercial Banking and CIB
Other income up in most segments and includes sale of Visa shares contributing EUR 114m in Retail Banking
Accounting effects Q4 2017 (Q4 2016): hedge accounting EUR 54m (EUR 79m), CVA/DVA/FVA EUR 32m (EUR 25m)
EUR m EUR m
Other operating income 1)
161
141
176
114
-25
150
325
500
Q1 Q2 Q3 Q4 Q1 Q2 Q3 Q4
2016 2017
Gain PB Asia (Q2) / Visa (Q4)Other incomeGuidance
439
416
443
0
175
350
525
Q1 Q2 Q3 Q4 Q1 Q2 Q3 Q4
2016 2017
Net fee income PB Asia (sold)

12
Operating expenses trending down
Operating expenses Volatile items and levies in operating expenses
EUR m EUR m
Personnel expenses before restructuring costs and volatile items trending down, mainly reflecting lower FTE levels
Other expenses before levies and volatile items flat vs. Q4, but up vs. Q3 reflecting higher project costs, marketing and external staffing costs
Restructuring provisions for reorganisations related to digitalisation and process optimisation 3)
1) Compensation schemes for SME derivatives and ICS credit cards2) Private Banking volatile items: Q3 2016 settlement of insurance claim, Q2 2017 costs relating to sale of PB Asia, Q3 2017 settlement of insurance claim, Q4 2017 Goodwill impairment3) Restructuring provisions in 2017 (2016) were EUR 164m (EUR 348m); in Q4 2017 (Q4 2016) this was EUR 98m (EUR 204m)
600
587
596
711
577
698
0
500
1,000
1,500
2,000
Q1 Q2 Q3 Q4 Q1 Q2 Q3 Q4
2016 2017
Personnel Other expenses Regulatory levies Other volatile items
395
45
358
-50
150
350
550
Q1 Q2 Q3 Q4 Q1 Q2 Q3 Q4
2016 2017
Restructuring provisions Regulatory leviesCompensation schemes Private Banking 1)Group Functions
2)1)

13
Continued impairment releases
IFRS9 replaces current impairment rules, effective 1 Jan 2018
First time adoption effect of c. -0.15% on CET1 ratio and c. -1bps on leverage ratio
IFRS9 impact on capital fully results from Classification & Measurement of Public Sector loans
As permitted by IFRS9, no restated historic data
IFRS9 may lead to more future impairment volatility
Impairments by business segment IFRS9 accounting rules on impairments
Strong Dutch economy contributes to negligible inflow of net new impairments
Impairments reflect IBNI (EUR 7m release) and a model update (EUR 31m release)
ECT impairments of EUR 33m in Q4, meaning 2016-2017 impairments remained well within our modelled impairment scenarios
EUR m
355
-34
-200
-100
0
100
200
Q1 Q2 Q3 Q4 Q1 Q2 Q3 Q4
2016 2017
RB CB CIB PB & GF

14
1) EBA Q&A on interpretation of CRR: portion of AT1 & T2 instruments, issued by ABN AMRO Bank (resolution entity) exceeding minimum own funds, can no longer fully contribute to consolidated capital ratios of ABN AMRO Group
Strong CET1 capital provides resilience against Basel IV impact
CET1 fully loaded capital Risk weighted assets
Well placed for Basel IV given strong CET1 ratio
RWAs are up in Q4, reflecting mainly business growth in CIB
Following AT1 issuance and despite EBA Q&A ruling, fully loaded leverage ratio improved to 4.1% at year-end 2017 1)
Leverage ratio fully loaded
Fully loaded CET1% RWA bn
0.2%-0.1% -0.1%17.0%
17.6% 17.7%
2016
Q4
2017
Q3
Ret
aine
dea
rnin
gs
RW
A
Reg
ulat
ory
adju
stm
.
2017
Q4
104.2 105.8 106.21.1
-0.7
2016
Q4
2017
Q3
Cre
dit
risk
Ops
. &M
arke
tris
k
2017
Q4
0.2% 0.1%
-0.2%
3.9% 3.9%
4.1%
2016
Q4
2017
Q3
T1 C
apita
l
EB
AQ
&A
Exp
osur
eM
easu
re
2017
Q4

15
Basel IV impact on RWAs subject to further developments
Based on Q4 2017, assuming a static balance sheet
Aggregate output floor is the binding constraint
Loan splitting for mortgages and Commercial Real Estate
Estimated Basel IV impact on RWA Estimation approach and key assumptions
Further developments and remaining uncertainties can change the RWA impact
EU implementation, future decisions of supervisors, regulatory interpretation and data limitations
Effects of mitigating actions, management actions, portfolio changes and resolving data limitations
Other regulatory developments, such as TRIM, SREP requirements and stress testing
Full phased-in RWA bn
~ 35%
Basel IIIYE2017
Pro forma YE2017Basel IV at 72.5% floor

16
Updated capital target range of 17.5-18.5% for 2018
Buffer of 4-5% CET1 accommodates Basel IV implementation
Prudent buffer for Basel IV implementation
Aim to meet fully loaded Basel IV CET1 requirement early in the phase-in period
Capital target range to be reviewed at YE2018, to reflect e.g. TRIM and other regulatory developments
Aim to maintain leverage ratio of at least 4% for YE2018. Basel IV allows for early adoption of revised exposure measure for derivatives (SACCR) and possibly cash pooling benefits, in total, estimated at 0.5-0.6%
1.7%11.78%
13.5%
4-5% 17.5-18.5%
SREP2019E
P2G & MgtBuffer
Formertarget
Basel IV imple-mentation buffer
Updatedtarget 2018
in B
asel
III t
erm
s
YE2017CET1 ratio 17.7%
Pillar 1 and 2R
Systemic Risk Buffer, Capital Conservation Buffer & Counter Cyclical Buffer

17
1) Sustainable profit excludes exceptional items that significantly distort profitability; examples are book gain on PB Asia sale (2017) and provision for SME derivatives (2016)2) Additional distributions can be special dividends or share buy-backs (subject to regulatory approval)
Dividend pay-out of 50% plus possible additional distributions
Capital use as percentage of sustainable profit from 2018
Dividend pay-out of 50% of sustainable profit, from 2018 1)
Additional distributions will be considered when capital is within or above the target range and depending on other circumstances, including regulatory and commercial considerations 2)
Combined at least 50%
sustainable profit
Organic RWA developments
Modest profitable business growth
Credit quality developments
Modelling and regulatory developments
Dividend pay-out 50%
Other capital uses
Additions to CET1
Special dividends or share buy-backs
Inorganic growth

18
1) Excluding the gain on PB Asia sale the ROE was 13.4% and C/I was 61.2%2) Capital target range to be reviewed at YE2018, to reflect e.g. TRIM and other regulatory developments3) Sustainable profit excludes exceptional items that significantly distort profitability; examples are book gain on PB Asia sale (2017) and provision for SME derivatives (2016). Additional distributions,
special dividends or share buy-backs (subject to regulatory approval), will be considered when capital is within or above the target range, are subject to other circumstances, including regulatory and commercial considerations
Updated financial targets
2016 2017 Targets
Return on Equity 11.8% 14.5% 1) 10-13%
Cost/Income ratio 65.9% 60.1% 1) 56-58%(by 2020)
CET1 ratio (FL) 17.0% 17.7% 17.5-18.5% 2)
(2018)
Dividend - per share (EUR)- pay-out ratio
0.8445%
1.4550%
50% of sustainable profit 3)
Additional distributionswill be considered 3)
Combined at least 50%

19
Wrap up and key messages
Net profit up at EUR 542m, reflecting good growth in operating result and impairment releases
On track to achieve financial targets: NII remains resilient and cost saving programmes are delivering
Dividend EUR 1.45 per share (full year) benefits from increased pay-out (50%) on sharply improved reported profit
Strong CET1 capital of 17.7%
Capital update
− Basel IV impact of around 35% RWA increase
− CET1 target for 2018 of 17.5-18.5% under Basel III
− Dividend pay-out 50% of sustainable profit, additional distributions will be considered. Combined at least 50%

20
For the purposes of this disclaimer ABN AMRO Group N.V. and its consolidated subsidiaries are referred to as "ABN AMRO“. This document (the “Presentation”) has been prepared by ABN AMRO. For purposes of this notice, the Presentation shall include any document that follows and relates to any oral briefings by ABN AMRO and any question-and-answer session that follows such briefings. The Presentation is informative in nature and is solely intended to provide financial and general information about ABN AMRO following the publication of its most recent financial figures. This Presentation has been prepared with care and must be read in connection with the relevant Financial Documents (latest Quarterly Report and Annual Financial Statements, "Financial Documents"). In case of any difference between the Financial Documents and this Presentation the Financial Documents are leading. The Presentation does not constitute an offer of securities or a solicitation to make such an offer, and may not be used for such purposes, in any jurisdiction (including the member states of the European Union and the United States) nor does it constitute investment advice or an investment recommendation in respect of any financial instrument. Any securities referred to in the Presentation have not been and will not be registered under the US Securities Act of 1933.
The information in the Presentation is, unless expressly stated otherwise, not intended for residents of the United States or any "U.S. person" (as defined in Regulation S of the US Securities Act 1933). No reliance may be placed on the information contained in the Presentation. No representation or warranty, express or implied, is given by or on behalf of ABN AMRO, or any of its directors or employees as to the accuracy or completeness of the information contained in the Presentation. ABN AMRO accepts no liability for any loss arising, directly or indirectly, from the use of such information. Nothing contained herein shall form the basis of any commitment whatsoever. ABN AMRO has included in this Presentation, and from time to time may make certain statements in its public statements that may constitute “forward-looking statements”. This includes, without limitation, such statements that include the words ‘expect’, ‘estimate’, ‘project’, ‘anticipate’, ‘should’, ‘intend’, ‘plan’, ‘probability’, ‘risk’, ‘Value-at-Risk (“VaR”)’, ‘target’, ‘goal’, ‘objective’, ‘will’, ‘endeavour’, ‘outlook’, 'optimistic', 'prospects' and similar expressions or variations on such expressions. In particular, the Presentation may include forward-looking statements relating but not limited to ABN AMRO’s potential exposures to various types of operational, credit and market risk. Such statements are subject to
uncertainties. Forward-looking statements are not historical facts and represent only ABN AMRO's current views and assumptions on future events, many of which, by their nature, are inherently uncertain and beyond our control. Factors that could cause actual results to differ materially from those anticipated by forward-looking statements include, but are not limited to, (macro)-economic, demographic and political conditions and risks, actions taken and policies applied by governments and their agencies, financial regulators and private organisations (including credit rating agencies), market conditions and turbulence in financial and other markets, and the success of ABN AMRO in managing the risks involved in the foregoing. Any forward-looking statements made by ABN AMRO are current views as at the date they are made. Subject to statutory obligations, ABN AMRO does not intend to publicly update or revise forward-looking statements to reflect events or circumstances after the date the statements were made, and ABN AMRO assumes no obligation to do so.
Disclaimer

WebsiteABN AMRO Group www.abnamro.com/ir
AddressGustav Mahlerlaan 101082 PP AmsterdamThe Netherlands
20180207 Investor Relations - non-US 4Q17


![Investor Presentation - Analyst / Institutional Investor Meeting [Company Update]](https://img.dokumen.tips/doc/110x75/577c98301a28ab163a8b4855/investor-presentation-analyst-institutional-investor-meeting-company-update.jpg)