Embed Size (px)
Citation preview

Title of the Report Highlights
17 March 2021
• World oil demand is expected to rebound by 5.5 mb/d in 2021 after contracting by 8.7 mb/d in 2020. Consumption appears to be slightly higher than expected in 1Q21, supported by cold weather in northern Asia, Europe and the US. A stronger economy and vaccine deployment will support growth in 2H21, reducing the oil demand gap vs 2019 from 4.8 mb/d in 1Q21 to 1.4 mb/d in 4Q21.
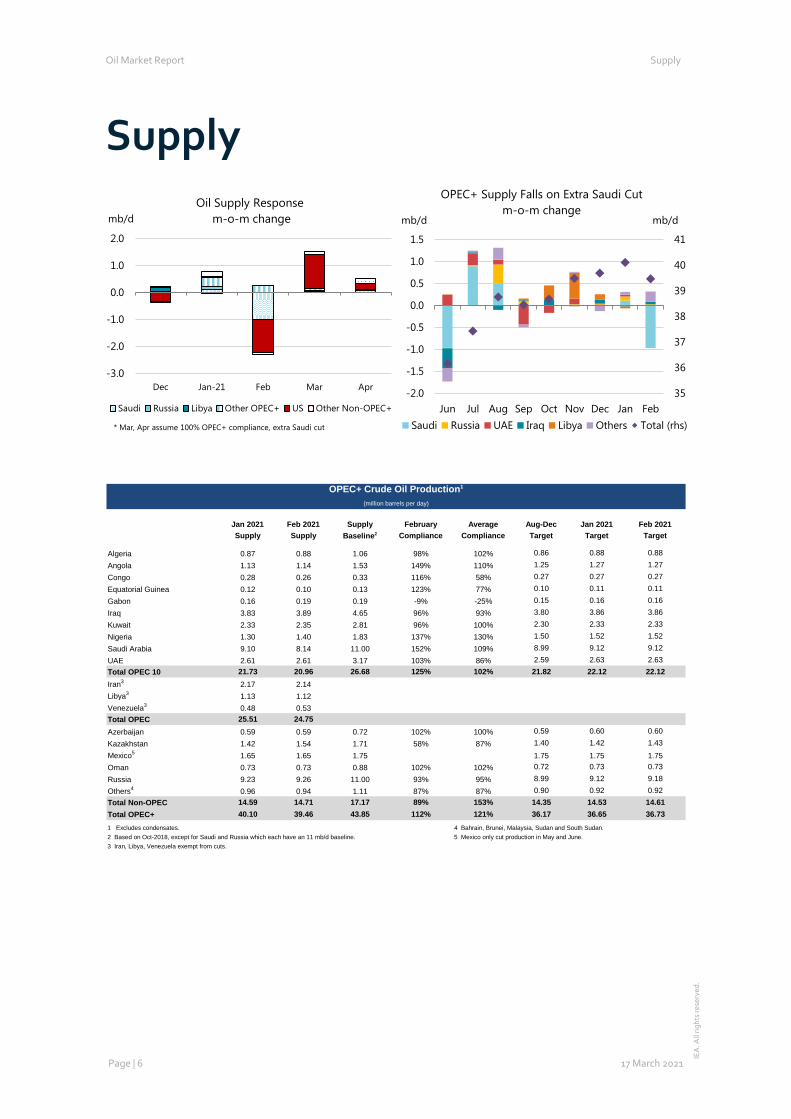
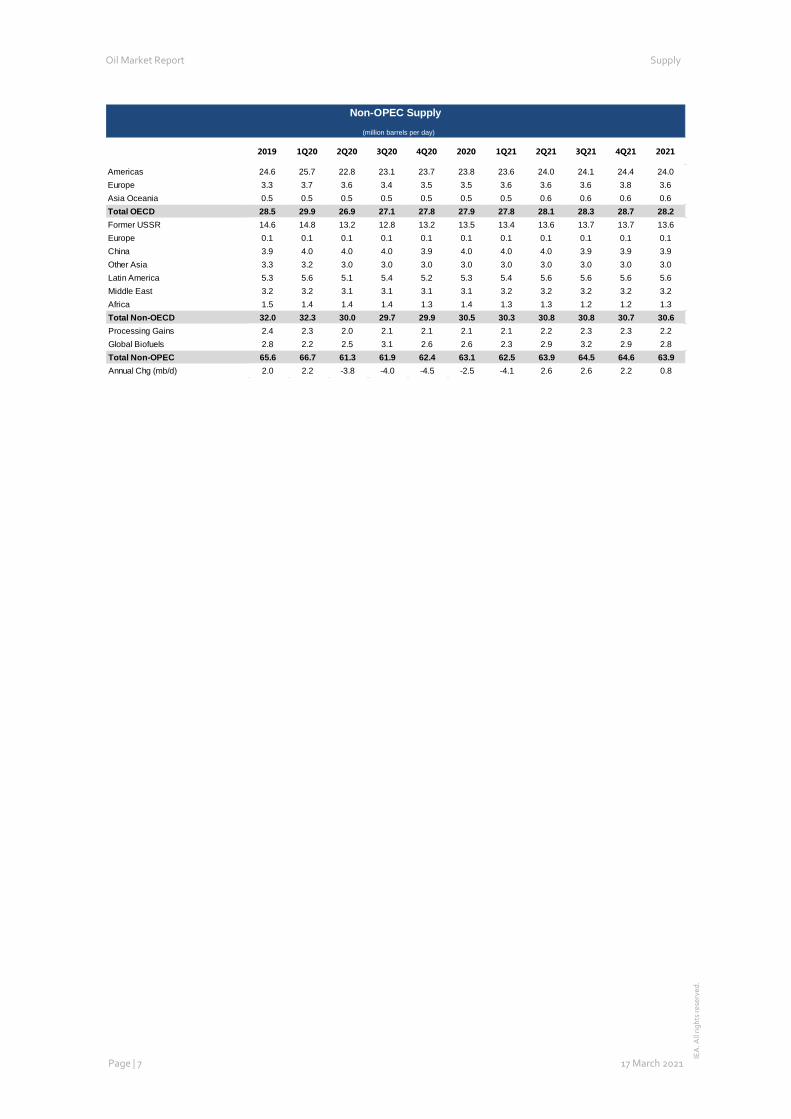
• Global oil supply fell 2 mb/d in February to 91.6 mb/d after a cold snap shut in US production and Saudi Arabia made an extra cut of 1 mb/d. OPEC+ agreed to extend most of its cuts through April, with Saudi keeping its extra cut in place. Non-OPEC+ will see output rise by 700 kb/d in 2021 after a 1.3 mb/d drop in 2020. US oil supply is set to decline by 180 kb/d, after a fall of 600 kb/d in 2020.
• Global refinery throughput rose 440 kb/d in January but was 5 mb/d lower year-on-year. Arctic weather in the US caused a 1.9 mb/d m-o-m decline in February throughput and a 1 mb/d downward revision to the global 1Q21 estimate. Chinese refinery runs were 2.2 mb/d higher than a year ago in January-February, and are estimated to have reached a new record high of 14.3 mb/d in February. Global throughput is set to resume growth from 2Q21.
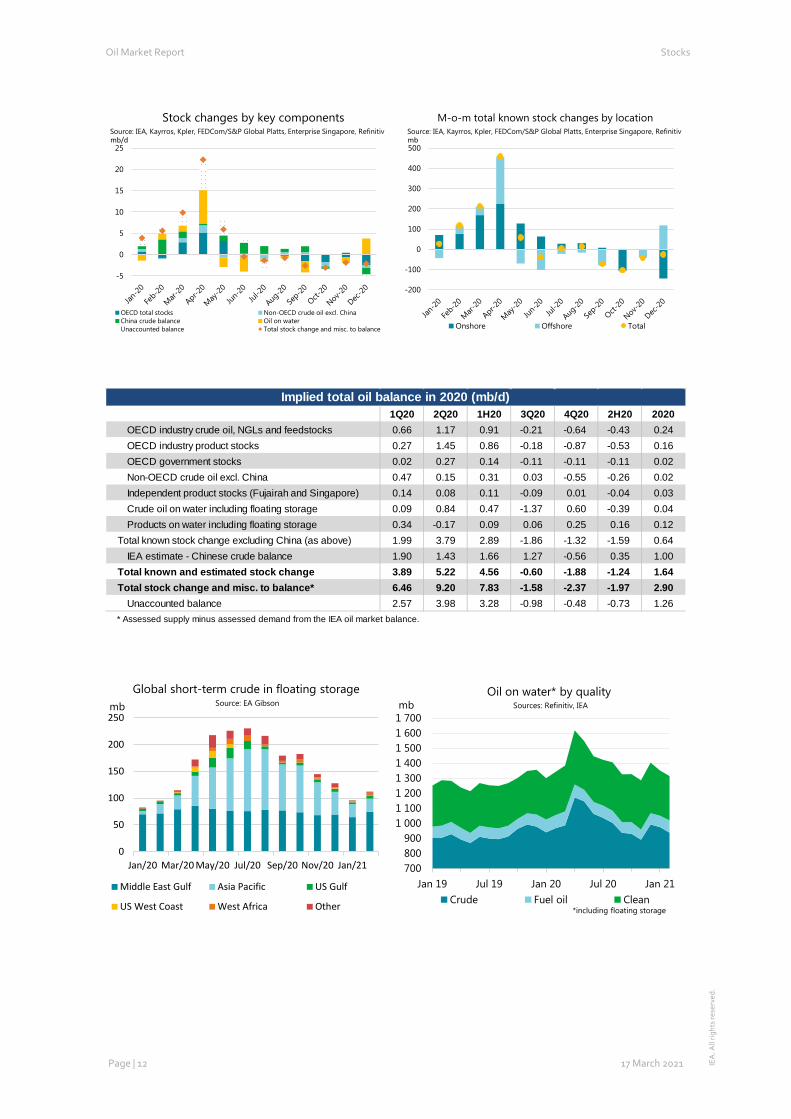
• OECD industry stocks fell for the sixth consecutive month in January. A monthly decline of 14.2 mb left inventories at 3 023 mb, 63.2 mb above their 2016-2020 average. Crude oil stocks led the fall with a counter-seasonal 23.7 mb draw. February data for the US, Europe and Japan show that total industry stocks fell by 52.6 mb (1.88 mb/d) in total, led by lower gasoline and middle distillate stocks in the US.
• Crude futures rose $7/bbl in February to an average $62/bbl and leapt to $70/bbl in early March after OPEC+ rolled-over cuts and following an attack on the Saudi Ras Tanura terminal. Prices rose with cold weather in the northern hemisphere and were supported by growing confidence in vaccine rollouts and the economy. Forward price curves rose above $50/bbl on NYMEX WTI, boosting producer hedging. At the time of writing, Brent was trading at $68/bbl and WTI near $65/bbl.
.

Table of contents
Plenty to spare ........................................................................................................................................... 3
Demand ..................................................................................................................................................... 4
Supply .......................................................................................................................................................6
Refining .................................................................................................................................................... 8
Stocks ...................................................................................................................................................... 11
Prices ....................................................................................................................................................... 14
Tables ...................................................................................................................................................... 16
Note to Subscribers:
This month’s Oil Market Report is an abbreviated version as it is published along with Oil 2021: Analysis and forecasts to 2026.
The usual OMR format, with written analysis, will resume for the 14 April

Oil Market Report Market Overview
Page | 3 17 March 2021
IEA
. All
right
s re
serv
ed.
Plenty to spare Oil’s sharp rally to near $70/bbl has spurred talk of a new super-cycle and a looming supply shortfall. Our data and analysis suggest otherwise. For a start, oil inventories still look ample compared with historical levels despite a steady decline from a massive overhang that piled up during 2Q20. By the end of January, OECD industry stocks, at 3 023 mb, were still 110 mb higher than a year ago – at the onset of the Covid crisis.
On top of the stock cushion, a hefty amount of spare production capacity has built up as a result of OPEC+ supply curbs. The group agreed a record 9.7 mb/d output cut last year and is still withholding roughly 8 mb/d from the market. In February, OPEC’s spare capacity (excluding Iran) stood at 7.7 mb/d, with much of it in the Middle East. Non-OPEC countries taking part in the deal hold an additional 1.6 mb/d that could be brought on to the market in short order.
For now, OPEC+ continues to restrict supply. Lofty stock levels and a still fragile recovery in oil demand led the group to agree on 4 March to broadly extend cuts by one month into April. Saudi Arabia also rolled over its extra 1 mb/d cut and said it would gradually phase it out at the right time. The OPEC+ decision helped boost crude to its highest since May 2019, with Brent near $70/bbl and WTI at around $65/bbl. OPEC+ is to meet on 1 April to chart policy for May.
Producers not taking part in the deal will see output rise by 700 kb/d in 2021 after a decline of 1.3 mb/d in 2020. US production, hit hard by freezing temperatures in February, is expected to decline by 180 kb/d in 2021, despite a gradual improvement in activity from last year’s slump.
As for demand, a return to growth lies ahead. Global oil demand was stronger than expected at the start of the year, boosted by colder weather and improved industrial activity in the US and elsewhere. Demand is set to rise by 5.3 mb/d from 1Q21 to 4Q21, as the economic recovery and vaccine programmes gather pace and containment measures ease. For 2021, global oil demand is forecast to grow by 5.5 mb/d to 96.5 mb/d, recovering around 60% of the volume lost in 2020. Oil demand will return to 2019 levels by 2023, as shown in our OIL 2021 report released today.
The prospect of stronger demand and continued OPEC+ production restraint point to a sharp decline in inventories during the second half of the year. For now, however, there is more than enough oil in tanks and under the ground to keep global oil markets adequately supplied.
2500
2600
2700
2800
2900
3000
3100
3200
3300
Jan-14 Jul-15 Jan-17 Jul-18 Jan-20
mbOECD Total Oil Industry Stocks
0
2
4
6
8
10
12
14
Jan-20 Apr-20 Jul-20 Oct-20 Jan-21
mb/dOPEC+ Spare Production Capacity*
Saudi Other OPEC Russia Other non-OPEC
*OPEC crude oil only. Excludes Iran.

Oil Market Report Demand
Page | 4 17 March 2021 IEA
. All
right
s re
serv
ed.
Demand
-7-6-5-4-3-2-1012
Jan-2021 Mar-2021 May-2021 Jul-2021 Sep-2021 Nov-2021
mb/d2021 vs 2019 Oil Demand By Product
Gasoline Gasoil/Diesel Jet/Kero LPG/Ethane Other Products
Global Oil Demand (2019-2021) (million barrels per day)*
1Q19 2Q19 3Q19 4Q19 2019 1Q20 2Q20 3Q20 4Q20 2020 1Q21 2Q21 3Q21 4Q21 2021Africa 4.3 4.3 4.2 4.3 4.3 4.2 3.3 3.9 4.0 3.8 4.1 4.0 4.0 4.1 4.0
Americas 31.4 31.7 32.3 32.1 31.9 30.1 24.9 28.5 29.1 28.2 29.1 29.5 30.7 31.2 30.1
Asia/Pacific 35.6 35.1 34.9 36.1 35.4 33.0 32.0 33.8 35.7 33.6 35.7 35.4 35.3 36.8 35.8
Europe 14.8 15.0 15.5 14.9 15.0 14.1 11.6 13.6 13.3 13.2 13.0 13.9 14.4 14.4 13.9
FSU 4.6 4.7 5.0 4.9 4.8 4.6 4.0 4.8 4.8 4.6 4.5 4.5 4.9 4.9 4.7
Middle East 8.1 8.1 8.7 8.3 8.3 7.8 7.0 8.1 7.7 7.6 7.6 7.7 8.4 7.8 7.9
World 98.7 98.9 100.6 100.6 99.7 93.8 82.9 92.7 94.7 91.0 93.9 95.0 97.8 99.2 96.5Annual Chg (%) 0.1 0.0 0.4 1.0 0.4 -5.0 -16.2 -7.9 -5.8 -8.7 0.2 14.6 5.5 4.7 6.0
Annual Chg (mb/d) 0.1 0.0 0.5 1.0 0.4 -4.9 -16.0 -7.9 -5.9 -8.7 0.2 12.1 5.1 4.5 5.5Changes from last OMR (mb/d) 0.0 0.0 0.0 0.0 0.0 0.0 0.0 0.0 0.1 0.0 0.3 0.0 -0.2 0.0 0.0
* Including biofuels
OECD Demand based on Adjusted Preliminary Submissions - January 21(million barrels per day)
mb/d % pa mb/d % pa mb/d % pa mb/d % pa mb/d % pa mb/d % pa mb/d % pa mb/d % paOECD Americas 9.20 -12.1 1.36 -33.0 4.50 -3.3 0.75 3.5 4.70 12.5 0.56 17.9 2.37 -2.2 23.32 -6.1 US* 7.86 -10.9 1.19 -31.3 3.85 -0.7 0.31 10.0 3.79 14.5 0.36 6.6 1.89 -2.3 19.17 -5.1
Canada 0.70 -15.7 0.10 -42.4 0.24 -6.7 0.33 0.3 0.43 22.3 0.05 3.5 0.30 -4.4 2.15 -6.6
Mexico 0.56 -24.0 0.05 -44.6 0.23 -31.6 0.11 -3.1 0.43 -7.8 0.14 68.3 0.16 0.2 1.65 -15.9
OECD Europe 1.45 -24.6 0.61 -54.8 3.88 -14.1 1.69 -6.1 1.14 -7.5 0.73 1.6 2.22 4.2 11.47 -14.6 Germany 0.33 -31.4 0.07 -64.5 0.52 -26.3 0.21 -38.8 0.10 -15.7 0.04 61.4 0.41 7.7 1.67 -25.4
United Kingdom 0.14 -46.6 0.16 -51.4 0.30 -33.9 0.13 7.2 0.15 -2.5 0.02 -3.2 0.14 -2.9 1.02 -30.5
France 0.15 -18.7 0.07 -54.2 0.55 -14.2 0.28 8.1 0.13 0.0 0.03 2.0 0.18 -11.1 1.39 -13.4
Italy 0.12 -31.8 0.02 -74.4 0.32 -22.4 0.07 2.5 0.10 -18.5 0.06 -2.7 0.20 0.2 0.88 -21.7
Spain 0.10 -13.2 0.06 -51.9 0.40 -8.9 0.27 -4.9 0.10 2.7 0.12 15.1 0.19 16.7 1.17 -7.0
OECD Asia & Oceania 1.31 -4.8 1.11 -2.6 1.26 1.9 0.55 9.2 0.85 -2.2 0.53 21.3 2.20 -7.3 7.77 -1.5 Japan 0.70 -7.3 0.75 13.0 0.38 3.9 0.36 15.3 0.43 13.0 0.28 25.9 0.97 -3.4 3.88 4.6
Korea 0.20 -0.2 0.20 -13.5 0.37 8.0 0.11 0.7 0.34 -15.4 0.21 16.8 1.06 -11.5 2.46 -6.5
Australia 0.29 -4.2 0.11 -37.2 0.46 -3.1 0.00 -68.0 0.05 -3.2 0.02 39.8 0.11 -0.1 1.03 -8.1
OECD Total 11.96 -13.1 3.07 -31.8 9.65 -7.4 2.99 -1.3 6.69 6.5 1.82 11.6 6.79 -2.0 42.56 -7.8
* Including US territories
RFO OtherOther Gasoil Total ProductsGasoline Jet/Kerosene Diesel LPG/Ethane
Oil Market Report Demand
Page | 5 17 March 2021 IEA
. All
right
s re
serv
ed.
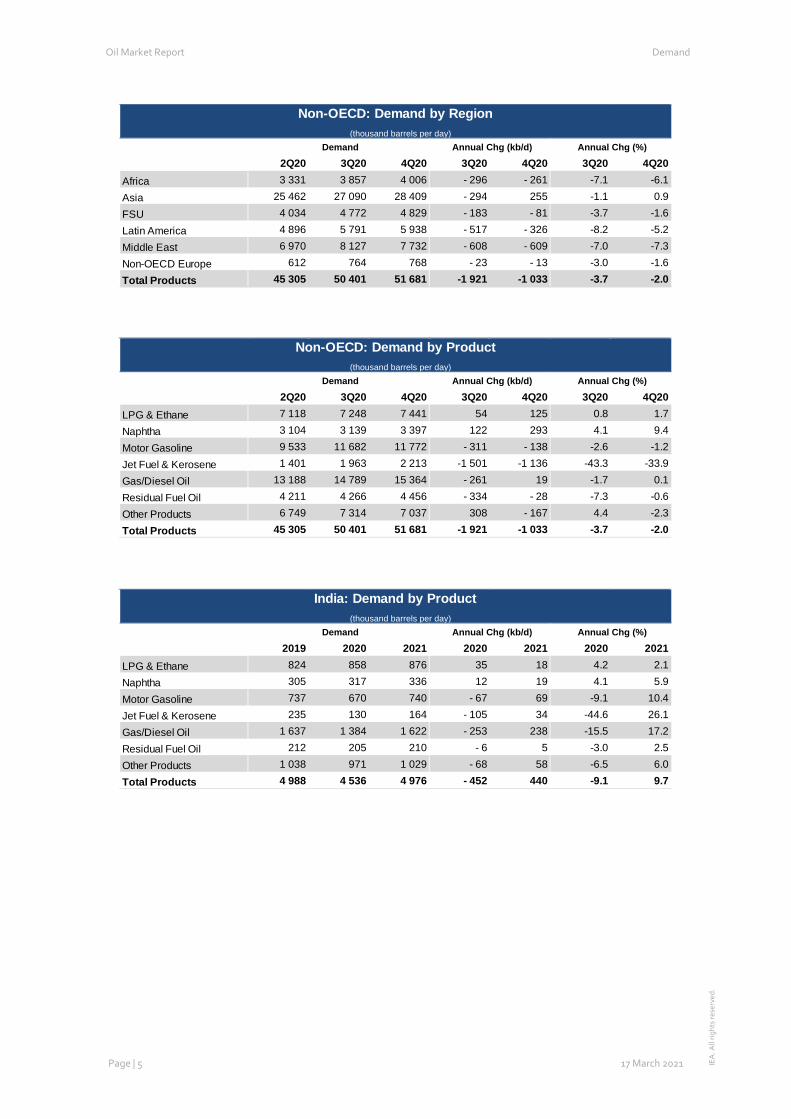
Non-OECD: Demand by Region(thousand barrels per day)
2Q20 3Q20 4Q20 3Q20 4Q20 3Q20 4Q20Africa 3 331 3 857 4 006 - 296 - 261 -7.1 -6.1
Asia 25 462 27 090 28 409 - 294 255 -1.1 0.9
FSU 4 034 4 772 4 829 - 183 - 81 -3.7 -1.6
Latin America 4 896 5 791 5 938 - 517 - 326 -8.2 -5.2
Middle East 6 970 8 127 7 732 - 608 - 609 -7.0 -7.3
Non-OECD Europe 612 764 768 - 23 - 13 -3.0 -1.6
Total Products 45 305 50 401 51 681 -1 921 -1 033 -3.7 -2.0
Demand Annual Chg (kb/d) Annual Chg (%)
Non-OECD: Demand by Product(thousand barrels per day)
2Q20 3Q20 4Q20 3Q20 4Q20 3Q20 4Q20LPG & Ethane 7 118 7 248 7 441 54 125 0.8 1.7
Naphtha 3 104 3 139 3 397 122 293 4.1 9.4
Motor Gasoline 9 533 11 682 11 772 - 311 - 138 -2.6 -1.2
Jet Fuel & Kerosene 1 401 1 963 2 213 -1 501 -1 136 -43.3 -33.9
Gas/Diesel Oil 13 188 14 789 15 364 - 261 19 -1.7 0.1
Residual Fuel Oil 4 211 4 266 4 456 - 334 - 28 -7.3 -0.6
Other Products 6 749 7 314 7 037 308 - 167 4.4 -2.3
Total Products 45 305 50 401 51 681 -1 921 -1 033 -3.7 -2.0
Demand Annual Chg (kb/d) Annual Chg (%)
India: Demand by Product(thousand barrels per day)
2019 2020 2021 2020 2021 2020 2021LPG & Ethane 824 858 876 35 18 4.2 2.1
Naphtha 305 317 336 12 19 4.1 5.9
Motor Gasoline 737 670 740 - 67 69 -9.1 10.4
Jet Fuel & Kerosene 235 130 164 - 105 34 -44.6 26.1
Gas/Diesel Oil 1 637 1 384 1 622 - 253 238 -15.5 17.2
Residual Fuel Oil 212 205 210 - 6 5 -3.0 2.5
Other Products 1 038 971 1 029 - 68 58 -6.5 6.0
Total Products 4 988 4 536 4 976 - 452 440 -9.1 9.7
Demand Annual Chg (%)Annual Chg (kb/d)
Oil Market Report Supply
Page | 6 17 March 2021
IEA
. All
right
s re
serv
ed.
Supply
-3.0
-2.0
-1.0
0.0
1.0
2.0
Dec Jan-21 Feb Mar Apr
mb/dOil Supply Response
m-o-m change
Saudi Russia Libya Other OPEC+ US Other Non-OPEC+
* Mar, Apr assume 100% OPEC+ compliance, extra Saudi cut
35
36
37
38
39
40
41
-2.0
-1.5
-1.0
-0.5
0.0
0.5
1.0
1.5
Jun Jul Aug Sep Oct Nov Dec Jan Feb
mb/dmb/d
OPEC+ Supply Falls on Extra Saudi Cutm-o-m change
Saudi Russia UAE Iraq Libya Others Total (rhs)
OPEC+ Crude Oil Production1
(million barrels per day)
Jan 2021 Feb 2021 Supply February Average Aug-Dec Jan 2021 Feb 2021Supply Supply Baseline2 Compliance Compliance Target Target Target
Algeria 0.87 0.88 1.06 98% 102% 0.86 0.88 0.88Angola 1.13 1.14 1.53 149% 110% 1.25 1.27 1.27Congo 0.28 0.26 0.33 116% 58% 0.27 0.27 0.27Equatorial Guinea 0.12 0.10 0.13 123% 77% 0.10 0.11 0.11Gabon 0.16 0.19 0.19 -9% -25% 0.15 0.16 0.16Iraq 3.83 3.89 4.65 96% 93% 3.80 3.86 3.86Kuwait 2.33 2.35 2.81 96% 100% 2.30 2.33 2.33Nigeria 1.30 1.40 1.83 137% 130% 1.50 1.52 1.52Saudi Arabia 9.10 8.14 11.00 152% 109% 8.99 9.12 9.12UAE 2.61 2.61 3.17 103% 86% 2.59 2.63 2.63Total OPEC 10 21.73 20.96 26.68 125% 102% 21.82 22.12 22.12Iran3 2.17 2.14Libya3 1.13 1.12Venezuela3 0.48 0.53Total OPEC 25.51 24.75Azerbaijan 0.59 0.59 0.72 102% 100% 0.59 0.60 0.60Kazakhstan 1.42 1.54 1.71 58% 87% 1.40 1.42 1.43Mexico5 1.65 1.65 1.75 1.75 1.75 1.75Oman 0.73 0.73 0.88 102% 102% 0.72 0.73 0.73Russia 9.23 9.26 11.00 93% 95% 8.99 9.12 9.18Others4 0.96 0.94 1.11 87% 87% 0.90 0.92 0.92Total Non-OPEC 14.59 14.71 17.17 89% 153% 14.35 14.53 14.61Total OPEC+ 40.10 39.46 43.85 112% 121% 36.17 36.65 36.731 Excludes condensates. 4 Bahrain, Brunei, Malaysia, Sudan and South Sudan.2 Based on Oct-2018, except for Saudi and Russia which each have an 11 mb/d baseline. 5 Mexico only cut production in May and June.3 Iran, Libya, Venezuela exempt from cuts.
Oil Market Report Supply
Page | 7 17 March 2021
IEA
. All
right
s re
serv
ed.
2019 1Q20 2Q20 3Q20 4Q20 2020 1Q21 2Q21 3Q21 4Q21 2021
Americas 24.6 25.7 22.8 23.1 23.7 23.8 23.6 24.0 24.1 24.4 24.0Europe 3.3 3.7 3.6 3.4 3.5 3.5 3.6 3.6 3.6 3.8 3.6Asia Oceania 0.5 0.5 0.5 0.5 0.5 0.5 0.5 0.6 0.6 0.6 0.6Total OECD 28.5 29.9 26.9 27.1 27.8 27.9 27.8 28.1 28.3 28.7 28.2Former USSR 14.6 14.8 13.2 12.8 13.2 13.5 13.4 13.6 13.7 13.7 13.6Europe 0.1 0.1 0.1 0.1 0.1 0.1 0.1 0.1 0.1 0.1 0.1China 3.9 4.0 4.0 4.0 3.9 4.0 4.0 4.0 3.9 3.9 3.9Other Asia 3.3 3.2 3.0 3.0 3.0 3.0 3.0 3.0 3.0 3.0 3.0Latin America 5.3 5.6 5.1 5.4 5.2 5.3 5.4 5.6 5.6 5.6 5.6Middle East 3.2 3.2 3.1 3.1 3.1 3.1 3.2 3.2 3.2 3.2 3.2Africa 1.5 1.4 1.4 1.4 1.3 1.4 1.3 1.3 1.2 1.2 1.3Total Non-OECD 32.0 32.3 30.0 29.7 29.9 30.5 30.3 30.8 30.8 30.7 30.6Processing Gains 2.4 2.3 2.0 2.1 2.1 2.1 2.1 2.2 2.3 2.3 2.2Global Biofuels 2.8 2.2 2.5 3.1 2.6 2.6 2.3 2.9 3.2 2.9 2.8Total Non-OPEC 65.6 66.7 61.3 61.9 62.4 63.1 62.5 63.9 64.5 64.6 63.9Annual Chg (mb/d) 2.0 2.2 -3.8 -4.0 -4.5 -2.5 -4.1 2.6 2.6 2.2 0.8
Non-OPEC Supply
(million barrels per day)

Oil Market Report Refining
Page | 8 17 March 2021
IEA
. All
right
s re
serv
ed.
Refining
Global Refinery Crude Throughput1
(million barrels per day)
2019 1Q20 2Q20 3Q20 4Q20 2020 Jan 21 Feb 21 Mar 21 1Q21 2Q21 2021
Americas 19.1 18.3 15.3 16.3 16.4 16.6 17.1 15.2 16.2 16.2 18.1 18.1 Europe 12.2 11.7 9.9 10.7 10.4 10.7 10.2 10.4 10.6 10.4 10.7 11.0 Asia Oceania 6.8 6.7 5.5 5.5 5.9 5.9 6.1 5.8 5.8 5.9 5.6 5.9 Total OECD 38.0 36.6 30.7 32.5 32.7 33.1 33.4 31.4 32.6 32.5 34.4 34.9
FSU 6.8 6.9 6.1 6.4 6.5 6.5 6.5 6.8 6.6 6.6 6.3 6.5 Non-OECD Europe 0.5 0.5 0.4 0.4 0.5 0.4 0.4 0.4 0.4 0.4 0.4 0.4 China 13.0 11.9 13.5 14.0 14.1 13.4 14.0 14.3 13.8 14.0 14.1 14.1 Other Asia 10.3 10.6 8.6 8.7 9.5 9.3 9.9 9.3 9.3 9.5 9.8 10.0 Latin America 3.2 3.1 2.6 3.1 3.2 3.0 3.2 3.2 3.2 3.2 3.3 3.3 Middle East 7.7 6.9 6.1 7.0 7.2 6.8 7.5 7.8 7.7 7.6 7.6 7.7 Africa 2.0 2.1 1.8 1.9 1.8 1.9 1.8 1.8 1.9 1.9 1.9 1.9 Total Non-OECD 43.6 41.9 39.1 41.5 42.8 41.3 43.3 43.6 42.8 43.2 43.5 43.9
Total 81.6 78.5 69.8 74.0 75.4 74.4 76.7 75.1 75.4 75.7 77.9 78.8 Year-on-year change -0.4 -3.2 -11.2 -8.6 -5.9 -7.2 -5.0 -2.7 -0.6 -2.8 8.0 4.3
1 Preliminary and estimated runs based on capacity, known outages, economic runcuts and global demand forecast
Refinery Crude Throughput and Utilisation in OECD Countries(million barrels per day)
Change from Utilisation rate 1
Aug 20 Sep 20 Oct 20 Nov 20 Dec 20 Jan 21 Dec 20 Jan 20 Jan 21 Jan 20
US2 14.15 13.58 13.48 14.19 14.20 14.63 0.42 -1.60 77% 85%Canada 1.44 1.65 1.58 1.68 1.67 1.64 -0.03 -0.14 82% 89%Chile 0.12 0.18 0.21 0.17 0.20 0.17 -0.03 -0.05 73% 93%Mexico 0.62 0.70 0.58 0.52 0.65 0.71 0.05 0.13 43% 35%
OECD Americas3 16.32 16.11 15.86 16.56 16.73 17.14 0.42 -1.66 75% 82%France 0.71 0.79 0.83 0.75 0.54 0.55 0.01 -0.20 44% 61%Germany 1.75 1.66 1.74 1.68 1.58 1.61 0.02 -0.25 80% 92%Italy 1.21 1.14 1.07 1.10 1.07 1.04 -0.03 -0.26 60% 75%Netherlands 0.91 1.03 0.96 1.08 1.03 0.95 -0.08 -0.28 73% 95%Spain 1.08 1.09 1.06 1.11 1.04 1.04 0.00 -0.22 74% 89%United Kingdom 0.84 0.90 0.90 0.87 0.90 0.84 -0.06 -0.34 66% 93%Other OECD Europe 4.33 4.19 3.70 4.10 4.12 4.16 0.04 -0.28 77% 85%
OECD Europe 10.82 10.79 10.25 10.68 10.28 10.18 -0.10 -1.83 71% 84%Japan 2.34 2.29 2.27 2.48 2.77 2.73 -0.05 -0.35 77% 86%South Korea 2.67 2.57 2.55 2.56 2.72 2.55 -0.17 -0.42 72% 84%Other Asia Oceania 0.60 0.68 0.74 0.77 0.78 0.80 0.02 -0.05 92% 98%
OECD Asia Oceania 5.61 5.53 5.56 5.81 6.27 6.08 -0.19 -0.82 76% 87%OECD Total 32.75 32.44 31.67 33.04 33.27 33.40 0.13 -4.30 74% 83%1 Expressed as a percentage, based on crude throughput and current operable refining capacity
2 US50
3 OECD Americas includes Chile and OECD Asia Oceania includes Israel. OECD Europe includes Slovenia and Estonia, though neither country has a refinery

Oil Market Report Refining
Page | 9 17 March 2021
IEA
. All
right
s re
serv
ed.
Feb-Jan Week EndingChg % 12 Feb 19 Feb 26 Feb 05 Mar 12 Mar
Rotterdam, Barges FOB Differential to North Sea DatedGasoline EBOB oxy 50.77 58.22 65.90 7.68 13.2 63.73 67.48 70.57 71.90 74.21 1.05 3.49 3.67 0.18Naphtha 48.16 55.84 62.06 6.22 11.1 60.50 62.87 65.68 65.48 66.48 -1.56 1.11 -0.17 -1.28Jet/Kerosene 53.72 58.79 65.40 6.61 11.2 64.37 67.22 68.63 68.07 69.77 3.99 4.06 3.17 -0.89ULSD 10ppm 55.20 60.06 67.89 7.83 13.0 66.85 69.75 71.62 70.85 72.57 5.48 5.33 5.66 0.33Gasoil 0.1% 54.37 59.16 66.71 7.55 12.8 65.69 68.47 70.29 69.67 71.24 4.65 4.43 4.48 0.05VGO 2.0% 52.53 58.79 65.28 6.49 11.0 64.38 66.20 68.74 69.23 72.33 2.81 4.07 3.06 -1.01Fuel Oil 0.5% 57.00 63.16 71.75 8.58 13.6 71.16 73.36 75.17 75.13 77.13 7.27 8.44 9.52 1.08LSFO 1% 50.76 56.30 64.26 7.96 14.1 63.61 65.53 67.66 67.82 69.88 1.03 1.57 2.03 0.46HSFO 3.5% 44.99 50.34 56.05 5.70 11.3 55.27 56.98 58.82 59.16 61.49 -4.73 -4.38 -6.18 -1.80
Mediterranean, FOB Cargoes Differential to UralsPremium Unl 10 ppm 51.33 58.92 66.86 7.94 13.5 64.83 68.46 71.24 72.50 75.73 1.27 4.03 5.38 1.36Naphtha 47.08 54.51 60.28 5.77 10.6 59.17 60.57 63.62 64.16 65.24 -2.99 -0.38 -1.19 -0.81Jet Aviation fuel 52.75 57.67 63.87 6.19 10.7 63.27 65.12 66.85 66.99 68.79 2.69 2.78 2.40 -0.39ULSD 10ppm 55.33 59.93 67.18 7.25 12.1 66.55 68.66 70.57 70.38 72.29 5.26 5.04 5.71 0.67Gasoil 0.1% 54.94 59.31 66.02 6.70 11.3 65.41 67.36 69.38 69.16 71.14 4.87 4.42 4.54 0.12LSFO 1% 51.18 56.92 65.16 8.23 14.5 64.42 66.69 68.85 68.73 70.61 1.11 2.03 3.69 1.65HSFO 3.5% 43.19 48.92 54.37 5.46 11.2 53.71 55.22 56.88 57.23 59.43 -6.87 -5.97 -7.10 -1.12
US Gulf, FOB Pipeline Differential to WTI HoustonSuper Unleaded 58.28 66.25 75.36 9.11 13.8 71.01 79.16 82.06 84.07 89.78 9.69 12.57 14.87 2.30Jet/Kerosene 55.52 59.42 67.50 8.08 13.6 65.85 69.86 71.82 70.34 72.64 6.94 5.73 7.00 1.27ULSD 10ppm 58.92 64.07 73.16 9.09 14.2 71.51 75.25 77.70 77.20 80.07 10.34 10.39 12.67 2.28Heating Oil 53.67 57.65 64.26 6.61 11.5 62.83 65.03 68.63 67.33 70.55 5.08 3.97 3.77 -0.20No. 6 3%* 43.67 48.00 52.87 4.87 10.1 52.40 53.84 55.05 55.44 57.35 -4.92 -5.68 -7.63 -1.94
Singapore, FOB Cargoes Differential to DubaiPremium Unleaded 53.43 60.03 67.83 7.81 13.0 66.01 69.41 72.07 71.64 75.36 3.66 5.27 6.98 1.71Naphtha 47.80 55.83 61.85 6.01 10.8 60.57 62.47 65.39 65.36 67.65 -1.98 1.08 1.00 -0.08Jet/Kerosene 53.87 58.02 65.15 7.12 12.3 64.19 66.93 68.37 66.93 69.49 4.10 3.27 4.30 1.03Gasoil 0.001% 55.41 59.95 67.88 7.94 13.2 67.15 69.52 71.24 69.96 72.35 5.63 5.19 7.03 1.84Fuel Oil 0.5% 58.77 66.32 74.88 8.55 12.9 74.69 76.13 77.95 76.31 78.98 9.00 11.57 14.03 2.46HSFO 180 CST 47.43 51.40 57.61 6.21 12.1 57.21 58.84 59.75 59.52 63.16 -2.35 -3.36 -3.24 0.12HSFO 380 CST 4% 46.83 51.17 56.64 5.47 10.7 56.14 57.81 58.86 58.90 62.65 -2.94 -3.59 -4.21 -0.62
Copyright © 2021 Argus Media Ltd - All rights reserved * Waterborne
Spot Product Prices(monthly and weekly averages, $/bbl)
FebDec Jan Feb Dec Jan Chg

Oil Market Report Refining
Page | 10 17 March 2021
IEA
. All
right
s re
serv
ed.
IEA/KBC Global Indicator Refining Margins1
($/bbl)
Monthly Average Change Average for week ending:
Nov 20 Dec 20 Jan 21 Feb 21 Feb-Jan 12 Feb 19 Feb 26 Feb 05 Mar 12 Mar
NW Europe
Brent (Cracking) 0.85 0.20 0.86 0.46 -0.40 0.38 0.20 0.60 0.31 -0.08
Urals (Cracking) 0.69 0.79 1.05 1.45 0.40 1.26 1.44 2.24 2.04 1.43
Brent (Hydroskimming) 0.86 -0.18 0.19 -0.03 -0.23 0.14 -0.39 -0.05 -0.42 -0.77
Urals (Hydroskimming) -0.39 -0.95 -0.97 -0.98 -0.01 -0.95 -1.17 -0.51 -0.76 -1.26
Mediterranean
Es Sider (Cracking) 3.33 2.12 2.94 2.49 -0.45 2.77 2.13 2.14 2.56 2.61
Urals (Cracking) 0.21 0.19 0.55 0.75 0.20 1.17 0.83 0.88 0.42 0.38
Es Sider (Hydroskimming) 3.34 1.50 2.40 2.15 -0.25 2.52 1.76 1.84 2.30 2.33
Urals (Hydroskimming) -1.55 -2.48 -1.99 -2.25 -0.26 -1.71 -2.39 -2.38 -2.67 -2.65
US Gulf Coast
Mars (Cracking) 1.37 0.97 2.41 3.33 0.92 1.49 4.33 4.73 5.37 5.81
50/50 HLS/LLS (Coking) 4.92 5.77 7.66 9.06 1.40 6.92 10.48 10.69 11.92 13.23
50/50 Maya/Mars (Coking) 2.62 2.61 3.84 5.00 1.16 3.16 6.23 6.12 7.24 7.75
ASCI (Coking) 3.14 3.43 5.15 6.94 1.79 4.62 8.28 9.03 9.50 10.26
US Midwest
30/70 WCS/Bakken (Cracking) 6.12 6.86 8.89 9.69 0.81 8.07 11.51 10.96 9.99 12.56
Bakken (Cracking) 6.89 7.32 9.63 11.55 1.92 9.71 13.51 13.45 11.79 14.52
WTI (Coking) 5.50 5.45 7.36 10.92 3.57 9.26 12.77 13.10 13.29 16.80
30/70 WCS/Bakken (Coking) 7.23 8.26 10.30 12.00 1.70 10.16 14.07 13.77 12.78 15.74
Singapore
Dubai (Hydroskimming) -0.77 -1.96 -2.03 -1.83 0.20 -1.98 -2.03 -1.73 -1.93 -2.50
Tapis (Hydroskimming) 3.22 1.78 2.20 2.43 0.22 3.14 2.21 1.83 -0.06 0.44
Dubai (Hydrocracking) 1.59 1.80 2.53 3.71 1.18 3.45 3.62 4.26 3.57 2.56
Tapis (Hydrocracking) 2.28 1.15 1.21 1.14 -0.06 1.66 0.97 0.62 -1.08 -0.55 1 Global Indicator Refining Margins are calculated for various complexity configurations, each optimised for processing the specific crude(s) in a specific refining centre. Margins include energy cost, but exclude other variable costs, depreciation and amortisation. Consequently, reported margins should be taken as an indication, or proxy, of changes in profitability for a given refining centre. No attempt is made to model or otherwise comment upon the relative economics of specific refineries running individual crude slates and producing custom product sales, nor are these calculations intended to infer the marginal values of crude for pricing purposes.
Source: IEA, KBC Advanced Technologies (KBC)

Oil Market Report Stocks
Page | 11 17 March 2021 IEA
. All
right
s re
serv
ed.
Stocks
2 800
2 900
3 000
3 100
3 200
3 300
Jan Mar May Jul Sep Nov Jan
mbOECD Total Oil Industry Stocks
Range 2016-2020 Avg 2016-20202020 2021
-100
0
100
200
300
400
500
2016 2017 2018 2019 2020 2021
mb OECD Industry Stocks Vs 5-Year Average
Oil Products Crude + NGL + Feedstocks
(million barrels)
Nov-20 Dec-20 Nov-20 Dec-20 Nov-20 Dec-20 Nov-20 Dec-20
Crude Oil 0.1 -2.5 0.2 -3.0 0.0 0.3 0.3 -5.2 Gasoline -0.4 -3.9 0.0 0.2 -0.7 -0.4 -1.1 -4.1 Middle Distillates 0.5 -4.9 0.1 -1.1 0.8 -0.4 1.4 -6.4 Residual Fuel Oil -0.6 -0.9 0.0 -0.9 0.0 -0.1 -0.6 -1.8 Other Products 0.1 0.2 0.1 0.1 0.0 -2.0 0.2 -1.8 Total Products -0.4 -9.5 0.2 -1.6 0.0 -3.0 -0.1 -14.1 Other Oils1 1.1 -8.8 0.0 1.7 0.0 -0.2 1.1 -7.3 Total Oil 0.8 -20.7 0.4 -3.0 0.0 -2.8 1.3 -26.5 1 Other oils includes NGLs, feedstocks and other hydrocarbons.
Revisions versus February 2021 Oil Market Report
Americas Europe Asia Oceania OECD
Am Europe As.Ocean Total Am Europe As.Ocean Total Am Europe As.Ocean Total
Crude Oil -12.7 -2.2 -8.8 -23.7 -0.4 -0.1 -0.3 -0.8 -0.1 -0.1 -0.1 -0.3 Gasoline 12.9 -1.0 2.3 14.3 0.4 0.0 0.1 0.5 0.2 0.1 0.0 0.3 Middle Distillates 7.1 13.7 2.2 22.9 0.2 0.4 0.1 0.7 -0.1 -0.2 -0.1 -0.4 Residual Fuel Oil 2.4 -0.1 0.2 2.4 0.1 0.0 0.0 0.1 0.0 0.0 0.0 0.0 Other Products -40.3 3.9 -2.9 -39.3 -1.3 0.1 -0.1 -1.3 -0.6 -0.1 -0.1 -0.7 Total Products -18.0 16.5 1.8 0.3 -0.6 0.5 0.1 0.0 -0.5 -0.2 -0.2 -0.9 Other Oils1 6.9 1.7 0.6 9.3 0.2 0.1 0.0 0.3 -0.2 -0.1 -0.1 -0.4 Total Oil -23.7 15.9 -6.4 -14.2 -0.8 0.5 -0.2 -0.5 -0.8 -0.4 -0.3 -1.5 1 Other oils includes NGLs, feedstocks and other hydrocarbons.
Preliminary Industry Stock Change in January 2021 and Fourth Quarter 2020January 2021 (preliminary) Fourth Quarter 2020
(million barrels) (million barrels per day) (million barrels per day)
Oil Market Report Stocks
Page | 12 17 March 2021 IEA
. All
right
s re
serv
ed.
-5
0
5
10
15
20
25
Stock changes by key components
OECD total stocks Non-OECD crude oil excl. ChinaChina crude balance Oil on waterUnaccounted balance Total stock change and misc. to balance
Source: IEA, Kayrros, Kpler, FEDCom/S&P Global Platts, Enterprise Singapore, Refinitiv mb/d
-200
-100
0
100
200
300
400
500
M-o-m total known stock changes by location
Onshore Offshore Total
Source: IEA, Kayrros, Kpler, FEDCom/S&P Global Platts, Enterprise Singapore, Refinitiv mb
1Q20 2Q20 1H20 3Q20 4Q20 2H20 2020OECD industry crude oil, NGLs and feedstocks 0.66 1.17 0.91 -0.21 -0.64 -0.43 0.24OECD industry product stocks 0.27 1.45 0.86 -0.18 -0.87 -0.53 0.16OECD government stocks 0.02 0.27 0.14 -0.11 -0.11 -0.11 0.02Non-OECD crude oil excl. China 0.47 0.15 0.31 0.03 -0.55 -0.26 0.02Independent product stocks (Fujairah and Singapore) 0.14 0.08 0.11 -0.09 0.01 -0.04 0.03Crude oil on water including floating storage 0.09 0.84 0.47 -1.37 0.60 -0.39 0.04Products on water including floating storage 0.34 -0.17 0.09 0.06 0.25 0.16 0.12
Total known stock change excluding China (as above) 1.99 3.79 2.89 -1.86 -1.32 -1.59 0.64IEA estimate - Chinese crude balance 1.90 1.43 1.66 1.27 -0.56 0.35 1.00
Total known and estimated stock change 3.89 5.22 4.56 -0.60 -1.88 -1.24 1.64Total stock change and misc. to balance* 6.46 9.20 7.83 -1.58 -2.37 -1.97 2.90
Unaccounted balance 2.57 3.98 3.28 -0.98 -0.48 -0.73 1.26* Assessed supply minus assessed demand from the IEA oil market balance.
Implied total oil balance in 2020 (mb/d)
0
50
100
150
200
250
Jan/20 Mar/20 May/20 Jul/20 Sep/20 Nov/20 Jan/21
Global short-term crude in floating storage
Middle East Gulf Asia Pacific US Gulf
US West Coast West Africa Other
mb Source: EA Gibson
700 800 900
1 0001 1001 2001 3001 4001 5001 6001 700
Jan 19 Jul 19 Jan 20 Jul 20 Jan 21
mbOil on water* by quality
Crude Fuel oil Clean
Sources: Refinitiv, IEA
*including floating storage

Oil Market Report Stocks
Page | 13 17 March 2021 IEA
. All
right
s re
serv
ed.
1 Days of forward demand are based on average OECD demand over the next three months.
Days1 Million Barrels
Regional OECD End-of-Month Industry Stocks(in days of forward demand and million barrels of total oil)
55
60
65
70
75
80
85
Jan Mar May Jul Sep Nov Jan
Days OECD Total Oil
Range 2016-2020 Avg 2016-2020
2020 2021
55
60
65
70
75
80
Jan Mar May Jul Sep Nov Jan
Days Americas
Range 2016-2020 Avg 2016-2020
2020 2021
60
70
80
90
100
Jan Mar May Jul Sep Nov Jan
Days Europe
Range 2016-2020 Avg 2016-2020
2020 2021
45
50
55
60
65
Jan Mar May Jul Sep Nov Jan
Days Asia Oceania
Range 2016-2020 Avg 2016-2020
2020 2021
1,400
1,450
1,500
1,550
1,600
1,650
1,700
1,750
Jan Mar May Jul Sep Nov Jan
mb Americas
Range 2016-2020 Avg 2016-2020
2020 2021
900
950
1,000
1,050
1,100
1,150
Jan Mar May Jul Sep Nov Jan
mb Europe
Range 2016-2020 Avg 2016-2020
2020 2021
340
360
380
400
420
440
460
Jan Mar May Jul Sep Nov Jan
mb Asia Oceania
Range 2016-2020 Avg 2016-2020
2020 2021
2,700
2,800
2,900
3,000
3,100
3,200
3,300
Jan Mar May Jul Sep Nov Jan
mb OECD Total Oil
Range 2016-2020 Avg 2016-2020
2020 2021

Oil Market Report Prices
Page | 14 17 March 2021
IEA
. All
right
s re
serv
ed.
Prices
Feb-20 Dec-20 Jan-21 Feb-21m-o-m Chg y-o-y Chg 25 Jan 01 Feb 08 Feb 15 Feb 22 Feb 01 Mar
NYMEXLight Sweet Crude Oil (WTI) 50.54 47.07 52.10 59.06 6.96 8.52 52.55 55.42 58.54 60.24 62.28 62.32RBOB 64.56 55.79 64.29 73.04 8.75 8.48 66.14 68.45 70.09 75.44 78.67 83.11ULSD 68.16 60.81 66.29 74.97 8.69 6.82 67.23 70.78 73.76 76.77 78.94 78.15ULSD ($/mmbtu) 12.02 10.72 11.69 13.22 1.53 1.20 11.86 12.48 13.01 13.54 13.92 13.78Henry Hub Natural Gas ($/mmbtu 1.84 2.58 2.65 2.92 0.27 1.07 2.65 2.86 2.88 3.13 2.85 2.78
ICEBrent 55.48 50.22 55.32 62.28 6.96 6.80 55.80 58.09 61.34 63.57 66.13 65.31Gasoil 66.36 55.36 60.15 68.03 7.88 1.67 60.59 63.52 66.97 69.87 71.78 71.07
Prompt Month DifferentialsNYMEX WTI - ICE Brent -4.94 -3.15 -3.22 -3.22 0.00 1.72 -3.25 -2.67 -2.80 -3.33 -3.85 -2.99NYMEX ULSD - WTI 17.62 13.74 14.19 15.91 1.73 -1.70 14.68 15.36 15.22 16.53 16.66 15.83NYMEX RBOB - WTI 14.02 8.72 12.19 13.98 1.79 -0.04 13.59 13.03 11.55 15.20 16.39 20.79NYMEX 3-2-1 Crack (RBOB) 15.22 10.39 12.85 14.63 1.77 -0.59 13.96 13.81 12.78 15.64 16.48 19.13
NYMEX ULSD - Natural Gas ($/mm 10.18 8.14 9.04 10.31 1.26 0.13 9.21 9.63 10.13 10.41 11.08 11.01
ICE Gasoil - ICE Brent 10.88 5.14 4.83 5.75 0.92 -5.13 4.79 5.43 5.63 6.30 5.65 5.76Source: ICE, NYMEX.
Prompt Month Oil Futures Prices(monthly and weekly averages, $/bbl)
Week Commencing:Feb-21
2025303540455055606570
Jan 20 May 20 Sep 20 Jan 21
$/bbl Crude Futures Month 1 vs Month 36
WTI M1 WTI M36Brent M1 Brent M36
Source: ICE, NYMEX
-4.0
-3.0
-2.0
-1.0
0.0
1.0
2.0
Jan 20 May 20 Sep 20 Jan 21
$/bbl Crude Futures Front Month Spreads
WTI M1-M2 Brent M1-M2
Source: ICE, NYMEX
46485052545658606264666870
M1 2 3 4 5 6 7 8 9 10 11 12
$/bbl Forward Price Curves
01 Jan 21 01 Feb 21 15 Mar 2101 Jan 21 01 Feb 21 15 Mar 21
Source: ICE, NYMEX
NYMEX WTI
ICE Brent
-12-10-8-6-4-202468
02468
101214161820
Jan 20 May 20 Sep 20 Jan 21
NYMEX 3-2-1 Crack spread Front Month (US$/bbl)
3-2-1 Crack Spread LHSWTI M1-M12
Source: NYMEX

Oil Market Report Prices
Page | 15 17 March 2021
IEA
. All
right
s re
serv
ed.
-12
-10
-8
-6
-4
-2
0
2
4
Jan 20 May 20 Sep 20 Jan 21
$/bbl North Sea Dated vs ICE Brent
ICE Brent - North Sea Dated
Source: ICE, NYMEX
-6.0
-5.0
-4.0
-3.0
-2.0
-1.0
0.0
1.0
2.0
Jan 20 Jun 20 Nov 20
$/bbl Crude Prices Prompt Month Differentials
WTI M1 - M2 North Sea M1 - M2Dubai M1 - M2
Copyright © 2021 Argus Media Ltd
Feb-20 Dec-20 Jan-21 Feb-21m-o-m Chg y-o-y Chg 01 Feb 08 Feb 15 Feb 22 Feb 01 Mar 08 Mar
CrudesNorth Sea Dated 55.45 49.72 54.73 62.23 7.50 6.78 58.15 61.07 64.00 65.70 66.09 68.17North Sea Mth 1 56.06 50.28 55.38 62.68 7.29 6.62 58.42 61.59 64.28 66.42 66.32 69.05WTI (Cushing) Mth 1 50.53 47.05 52.10 59.06 6.96 8.53 55.42 58.54 60.24 62.27 62.32 65.03WTI (Houston) Mth 1 53.60 48.59 53.69 60.50 6.81 6.90 56.69 60.03 61.77 63.75 63.69 66.38Urals (NWE) 53.95 49.01 54.23 60.72 6.49 6.76 57.53 59.70 62.21 63.43 63.69 66.15Urals (Mediterranean) 55.11 50.07 54.89 61.47 6.58 6.36 58.36 60.03 62.90 64.60 64.90 66.92Dubai (1st month) 54.25 49.78 54.76 60.85 6.09 6.60 57.22 60.24 62.32 63.50 63.25 66.86Tapis (Dated) 62.67 50.88 55.98 63.06 7.08 0.39 58.85 61.50 64.70 66.88 67.69 69.77
Differential to North Sea Dated WTI (Houston) -1.86 -1.14 -1.04 -1.73 -0.69 0.12 -1.47 -1.03 -2.23 -1.95 -2.40 -1.79Urals (NWE) -1.50 -0.71 -0.50 -1.51 -1.01 -0.01 -0.63 -1.37 -1.79 -2.26 -2.40 -2.02Urals (Mediterranean) -0.34 0.34 0.16 -0.76 -0.92 -0.41 0.21 -1.04 -1.10 -1.10 -1.19 -1.25Dubai -1.21 0.05 0.03 -1.38 -1.41 -0.17 -0.94 -0.83 -1.68 -2.20 -2.84 -1.31Tapis (Dated) 7.22 1.16 1.25 0.83 -0.42 -6.38 0.70 0.43 0.70 1.18 1.60 1.60
Prompt Month DifferentialForw ard Cash Brent Mth1-Mth2 0.41 0.12 0.05 0.35 0.30 -0.06 0.23 0.26 0.48 0.43 0.49 0.36Forw ard WTI Cushing Mth1-Mth2 -0.19 -0.16 -0.01 0.06 0.08 0.25 0.15 0.11 -0.02 0.00 0.19 0.03Forw ard Dubai Mth1-Mth2 0.16 0.34 0.29 0.27 -0.02 0.11 0.24 0.30 0.38 0.18 0.53 0.59
Copyright © 2021 Argus Media Ltd - All rights reserved
Spot Crude Oil Prices and Differentials(monthly and weekly averages, $/bbl)
Week Commencing:Feb-21
Week EndingFeb-20 Dec-20 Jan-21 Feb-21 m-o-m chg y-o-y chg 05 Feb 12 Feb 19 Feb 26 Feb 05 Mar
Crude TankersVLCC MEG-Asia 1.38 1.10 0.93 0.84 -0.09 -0.5 0.84 0.85 0.85 0.84 0.77130Kt WAF - UKC 1.93 0.92 0.95 1.09 0.13 -0.8 1.03 1.03 1.13 1.08 1.18Baltic Aframax 1.22 0.58 0.63 0.75 0.12 -0.5 0.59 0.59 0.91 0.86 0.94North Sea Aframax 0.98 0.61 0.60 0.66 0.06 -0.3 0.58 0.58 0.77 0.75 0.75
Product TankersLR MEG - Japan 2.72 2.25 1.95 1.64 -0.31 -1.1 1.66 1.54 1.60 1.77 1.81MR Sing - JPN 2.05 1.83 1.74 1.50 -0.24 -0.5 1.46 1.43 1.46 1.64 1.74MR Carib - US Atlantic 1.77 1.18 1.21 1.19 -0.03 -0.6 1.19 1.19 1.19 1.19 1.16MR UK-US Atlantic 2.83 1.37 1.67 2.01 0.34 -0.8 1.90 1.74 2.46 1.90 1.71
Copyright © 2020 Argus Media Ltd
Freight Costs(monthly and weekly averages, $/bbl)
1-Feb-21

Oil Market Report Tables
Page | 16 17 March 2021 IEA
. All
right
s re
serv
ed.
Tables
Table 1: World Oil Supply And Demand 2017 2018 1Q19 2Q19 3Q19 4Q19 2019 1Q20 2Q20 3Q20 4Q20 2020 1Q21 2Q21 3Q21 4Q21 2021
OECD DEMANDAmericas 25.1 25.7 25.3 25.5 26.0 25.8 25.7 24.3 20.0 22.7 23.2 22.6 23.3 23.7 24.7 25.1 24.2Europe 14.4 14.3 14.0 14.2 14.7 14.1 14.3 13.3 11.0 12.9 12.6 12.4 12.2 13.2 13.7 13.6 13.2Asia Oceania 8.1 8.0 8.2 7.4 7.6 8.0 7.8 7.8 6.5 6.7 7.3 7.1 7.7 6.9 7.1 7.7 7.4
Total OECD 47.7 48.0 47.5 47.1 48.3 47.9 47.7 45.4 37.6 42.3 43.1 42.1 43.3 43.8 45.4 46.5 44.8
NON-OECD DEMANDFSU 4.7 4.7 4.6 4.7 5.0 4.9 4.8 4.6 4.0 4.8 4.8 4.6 4.5 4.5 4.9 4.9 4.7Europe 0.8 0.8 0.7 0.8 0.8 0.8 0.8 0.7 0.6 0.8 0.8 0.7 0.7 0.7 0.8 0.8 0.8China 12.6 13.0 13.1 13.6 13.9 14.1 13.7 11.8 14.2 14.7 14.9 13.9 14.3 14.7 14.9 15.1 14.8Other Asia 13.7 14.0 14.3 14.1 13.5 14.0 14.0 13.4 11.2 12.4 13.5 12.6 13.6 13.7 13.3 13.9 13.6Americas 6.4 6.2 6.1 6.2 6.3 6.3 6.2 5.8 4.9 5.8 5.9 5.6 5.8 5.8 6.1 6.0 5.9Middle East 8.3 8.3 8.1 8.1 8.7 8.3 8.3 7.8 7.0 8.1 7.7 7.6 7.6 7.7 8.4 7.8 7.9Africa 4.2 4.3 4.3 4.3 4.2 4.3 4.3 4.2 3.3 3.9 4.0 3.8 4.1 4.0 4.0 4.1 4.0
Total Non-OECD 50.5 51.3 51.2 51.8 52.3 52.7 52.0 48.3 45.3 50.4 51.7 48.9 50.7 51.2 52.3 52.7 51.7Total Demand1 98.2 99.3 98.7 98.9 100.6 100.6 99.7 93.8 82.9 92.7 94.7 91.0 93.9 95.0 97.8 99.2 96.5
OECD SUPPLYAmericas 20.5 23.0 24.0 24.5 24.6 25.5 24.6 25.7 22.8 23.1 23.7 23.8 23.6 24.0 24.1 24.4 24.0Europe 3.5 3.5 3.5 3.2 3.2 3.5 3.3 3.7 3.6 3.4 3.5 3.5 3.6 3.6 3.6 3.8 3.6Asia Oceania 0.4 0.4 0.5 0.5 0.6 0.6 0.5 0.5 0.5 0.5 0.5 0.5 0.5 0.6 0.6 0.6 0.6
Total OECD4 24.4 26.9 27.9 28.2 28.4 29.6 28.5 29.9 26.9 27.1 27.8 27.9 27.8 28.1 28.3 28.7 28.2
NON-OECD SUPPLYFSU 14.3 14.6 14.8 14.4 14.6 14.7 14.6 14.8 13.2 12.8 13.2 13.5 13.4 13.6 13.7 13.7 13.6Europe 0.1 0.1 0.1 0.1 0.1 0.1 0.1 0.1 0.1 0.1 0.1 0.1 0.1 0.1 0.1 0.1 0.1China 3.9 3.8 3.9 3.9 3.9 3.9 3.9 4.0 4.0 4.0 3.9 4.0 4.0 4.0 3.9 3.9 3.9Other Asia 3.5 3.4 3.4 3.3 3.2 3.2 3.3 3.2 3.0 3.0 3.0 3.0 3.0 3.0 3.0 3.0 3.0Americas 5.1 5.1 5.1 5.2 5.5 5.6 5.3 5.6 5.1 5.4 5.2 5.3 5.4 5.6 5.6 5.6 5.6Middle East 3.1 3.2 3.2 3.2 3.2 3.2 3.2 3.2 3.1 3.1 3.1 3.1 3.2 3.2 3.2 3.2 3.2Africa 1.4 1.5 1.5 1.5 1.5 1.5 1.5 1.4 1.4 1.4 1.3 1.4 1.3 1.3 1.2 1.2 1.3
Total Non-OECD4 31.5 31.7 32.0 31.7 31.9 32.2 32.0 32.3 30.0 29.7 29.9 30.5 30.3 30.8 30.8 30.7 30.6Processing gains3 2.3 2.4 2.3 2.4 2.4 2.3 2.4 2.3 2.0 2.1 2.1 2.1 2.1 2.2 2.3 2.3 2.2
Global Biofuels 2.5 2.7 2.2 2.9 3.2 2.7 2.8 2.2 2.5 3.1 2.6 2.6 2.3 2.9 3.2 2.9 2.8
Total Non-OPEC Supply 60.7 63.6 64.5 65.1 65.9 66.8 65.6 66.7 61.3 61.9 62.4 63.1 62.5 63.9 64.5 64.6 63.9
OPEC2
Crude 31.5 31.4 30.1 29.6 29.0 29.3 29.5 28.2 25.6 24.1 24.9 25.7NGLs 5.4 5.5 5.5 5.4 5.4 5.3 5.4 5.4 5.2 5.1 5.2 5.2 5.2 5.3 5.3 5.3 5.3Total OPEC 36.9 36.8 35.6 35.0 34.4 34.6 34.9 33.6 30.8 29.2 30.0 30.9Total Supply 97.6 100.5 100.1 100.1 100.2 101.5 100.5 100.2 92.1 91.1 92.4 93.9
STOCK CHANGES AND MISCELLANEOUSReported OECDIndustry -0.4 0.1 0.0 0.6 0.1 -0.6 0.0 0.9 2.6 -0.4 -1.5 0.4Government -0.1 -0.1 0.1 -0.1 0.0 -0.1 0.0 0.0 0.3 -0.1 -0.1 0.0
Total -0.5 0.0 0.1 0.5 0.1 -0.7 0.0 0.9 2.9 -0.5 -1.6 0.4Floating storage/Oil in transit 0.4 0.0 -0.3 -0.1 0.0 0.9 0.1 0.4 0.7 -1.3 0.9 0.2Miscellaneous to balance5 -0.5 1.1 1.6 0.8 -0.4 0.6 0.7 5.1 5.6 0.2 -1.6 2.3
Total Stock Ch. & Misc -0.6 1.1 1.4 1.2 -0.3 0.9 0.8 6.5 9.2 -1.6 -2.4 2.9
Memo items:Call on OPEC crude + Stock ch.6 32.1 30.2 28.7 28.4 29.3 28.4 28.7 21.7 16.4 25.7 27.2 22.8 26.2 25.7 27.9 29.3 27.31 Measured as deliveries from refineries and primary stocks, comprises inland deliveries, international marine bunkers, refinery fuel, crude for direct burning, oil from non-conventional sources and other sources of supply. Includes Biofuels.2 OPEC data based on today's membership throughout the time series. 3 Net volumetric gains and losses in the refining process and marine transportation losses.4 Comprises crude oil, condensates, NGLs, oil from non-conventional sources and other sources of supply.5 Includes changes in non-reported stocks in OECD and non-OECD areas.6 Equals the arithmetic difference between total demand minus total non-OPEC supply minus OPEC NGLs.
Table 1WORLD OIL SUPPLY AND DEMAND
(million barrels per day)

Oil Market Report Tables
Page | 17 17 March 2021 IEA
. All
right
s re
serv
ed.
Table 1a: World Oil Supply And Demand: Changes From Last Month’s Table 1
2017 2018 1Q19 2Q19 3Q19 4Q19 2019 1Q20 2Q20 3Q20 4Q20 2020 1Q21 2Q21 3Q21 4Q21 2021
OECD DEMANDAmericas - - - - - - - - - - 0.1 - 0.3 0.1 - - 0.1Europe - - - - - - - - - - 0.1 - -0.1 - - - -Asia Oceania - - - - - - - - - - -0.1 - - - - - -
Total OECD - - - - - - - - - - 0.1 - 0.2 0.1 -0.1 -0.1 -
NON-OECD DEMANDFSU - - - - - - - - - - - - - - -0.1 - -Europe - - - - - - - - - - - - - - - - -China - - - - - - - - - - - - - -0.1 - - -Other Asia - - - - - - - - - - - - - 0.1 - 0.1 -Americas - - - - - - - - - - - - 0.1 - - - -Middle East - - - - - - - - - - - - - - - - -Africa - - - - - - - - - - - - - - - - -
Total Non-OECD - - - - - - - - - - - - 0.1 -0.1 -0.1 0.1 -Total Demand - - - - - - - - - - 0.1 - 0.3 - -0.2 - -
OECD SUPPLYAmericas - - - - - - - - - - -0.1 - -0.6 - - - -0.2Europe - - - - - - - - - - 0.1 - 0.1 0.1 0.1 0.1 0.1Asia Oceania - - - - - - - - - - - - - - - - -
Total OECD - - - - - - - - - - - - -0.6 0.1 0.1 0.1 -0.1
NON-OECD SUPPLYFSU - - - - - - - - - - - - 0.1 - - - -Europe - - - - - - - - - - - - - - - - -China - - - - - - - - - - - - - 0.1 - - -Other Asia - - - - - - - - - - - - - - - - -Americas2 - - - - - - - - - - - - - - - - -Middle East - - - - - - - - - - - - - - - - -Africa - - - - - - - - - - - - - - - - -
Total Non-OECD - - - - - - - - - - - - 0.1 0.1 -0.1 -0.1 -Processing gains - - - - - - - - - - - - -0.1 -0.1 - - -
Global Biofuels - - - - - - - - - - - - - - - - -
Total Non-OPEC Supply - - - - - - - - - - - - -0.5 0.1 - - -0.1
OPECCrude2 - - - - - - - - - - - -NGLs - - - - - - - - - - - - - - - - -Total OPEC - - - - - - - - - - - -Total Supply - - - -0.1 -0.1 -0.1 - - - - -0.1 -
STOCK CHANGES AND MISCELLANEOUSREPORTED OECDIndustry - - - - - - - - - - -0.3 -0.1Government - - - - - - - - - - - -
Total - - - - - - - - - - -0.3 -0.1Floating storage/Oil in transit - - - - - - - - - - 0.2 0.1Miscellaneous to balance - - - -0.1 -0.1 -0.1 -0.1 - -0.1 - -0.1 -0.1
Total Stock Ch. & Misc - - - -0.1 -0.1 -0.1 -0.1 - -0.1 - -0.1 -0.1
Memo items:Call on OPEC crude + Stock ch. - - - 0.1 0.1 0.1 0.1 - 0.1 - 0.1 0.1 0.9 - -0.2 0.1 0.21 When submitting their monthly oil statistics, OECD Member countries periodically update data for prior periods. Similar updates to non-OECD data can occur.
Table 1aWORLD OIL SUPPLY AND DEMAND: CHANGES FROM LAST MONTH'S TABLE 1
(million barrels per day)

Oil Market Report Tables
Page | 18 17 March 2021 IEA
. All
right
s re
serv
ed.
Table 2: Summary of Global Oil Demand 2018 1Q19 2Q19 3Q19 4Q19 2019 1Q20 2Q20 3Q20 4Q20 2020 1Q21 2Q21 3Q21 4Q21 2021
Demand (mb/d)Americas 25.73 25.29 25.47 26.02 25.82 25.65 24.35 20.01 22.72 23.15 22.56 23.30 23.68 24.66 25.14 24.20Europe 14.32 14.02 14.20 14.68 14.09 14.25 13.34 11.03 12.85 12.56 12.45 12.23 13.19 13.65 13.65 13.19Asia Oceania 7.95 8.22 7.41 7.55 7.99 7.79 7.75 6.54 6.69 7.34 7.08 7.73 6.93 7.13 7.69 7.37Total OECD 47.99 47.54 47.08 48.26 47.90 47.70 45.44 37.58 42.26 43.05 42.09 43.26 43.80 45.44 46.47 44.76Asia 27.03 27.36 27.73 27.38 28.15 27.66 25.26 25.46 27.09 28.41 26.56 27.98 28.42 28.20 29.09 28.43Middle East 8.29 8.08 8.14 8.74 8.34 8.32 7.76 6.97 8.13 7.73 7.65 7.57 7.70 8.38 7.82 7.87Americas 6.23 6.12 6.21 6.31 6.26 6.23 5.75 4.90 5.79 5.94 5.60 5.79 5.80 6.06 6.04 5.93FSU 4.69 4.56 4.69 4.96 4.91 4.78 4.62 4.03 4.77 4.83 4.57 4.55 4.54 4.91 4.89 4.72Africa 4.34 4.31 4.30 4.15 4.27 4.26 4.20 3.33 3.86 4.01 3.85 4.06 3.97 3.98 4.11 4.03Europe 0.76 0.74 0.78 0.79 0.78 0.77 0.73 0.61 0.76 0.77 0.72 0.73 0.72 0.79 0.78 0.76Total Non-OECD 51.33 51.17 51.84 52.32 52.71 52.02 48.33 45.30 50.40 51.68 48.94 50.68 51.16 52.32 52.73 51.73World 99.33 98.71 98.92 100.58 100.61 99.71 93.77 82.89 92.67 94.73 91.03 93.95 94.96 97.76 99.20 96.49
of which: US50 20.50 20.36 20.46 20.72 20.63 20.54 19.33 16.08 18.36 18.71 18.12 18.68 18.98 19.73 20.11 19.38Europe 5* 8.23 8.13 8.13 8.32 8.03 8.15 7.62 5.95 7.07 7.04 6.92 6.74 7.47 7.68 7.77 7.42
China 13.00 13.11 13.62 13.85 14.13 13.68 11.84 14.24 14.71 14.92 13.93 14.33 14.75 14.88 15.14 14.78Japan 3.79 4.05 3.39 3.43 3.74 3.65 3.69 2.89 3.03 3.53 3.28 3.79 3.13 3.24 3.66 3.45India 4.94 5.11 5.05 4.75 5.04 4.99 4.93 3.90 4.28 5.02 4.54 5.10 5.07 4.67 5.07 4.98
Russia 3.50 3.43 3.50 3.74 3.63 3.58 3.53 3.09 3.60 3.61 3.46 3.43 3.43 3.70 3.63 3.55Brazil 2.98 2.99 3.03 3.14 3.15 3.08 2.95 2.64 2.99 3.13 2.93 2.91 2.95 3.04 3.05 2.99
Saudi Arabia 3.06 2.90 2.99 3.42 3.03 3.08 2.90 2.73 3.26 2.98 2.97 2.83 3.01 3.31 2.90 3.01Canada 2.53 2.15 2.27 2.57 2.49 2.37 2.33 1.88 2.16 2.03 2.10 2.12 2.11 2.36 2.44 2.26
Korea 2.57 2.58 2.43 2.54 2.63 2.55 2.51 2.42 2.34 2.38 2.41 2.49 2.38 2.44 2.51 2.46Mexico 2.01 2.07 2.08 2.06 2.00 2.05 1.97 1.48 1.59 1.68 1.68 1.79 1.93 1.89 1.90 1.88
Iran 1.98 1.99 1.95 1.95 2.02 1.98 1.86 1.68 1.81 1.76 1.78 1.84 1.76 1.86 1.85 1.83Total 69.10 68.88 68.90 70.49 70.50 69.70 65.46 58.97 65.19 66.80 64.11 66.06 66.95 68.83 70.02 67.98
% of World 69.6% 69.8% 69.7% 70.1% 70.1% 69.9% 69.8% 71.1% 70.4% 70.5% 70.4% 70.3% 70.5% 70.4% 70.6% 70.5%Annual Change (% per annum)Americas 2.4 -0.9 -0.2 -0.1 0.1 -0.3 -3.7 -21.4 -12.7 -10.3 -12.1 -4.3 18.4 8.5 8.6 7.3Europe -0.7 -0.7 -0.6 -0.2 -0.5 -0.5 -4.9 -22.3 -12.5 -10.9 -12.6 -8.3 19.5 6.2 8.7 5.9Asia Oceania -2.4 -4.1 -2.7 -1.1 0.1 -2.0 -5.7 -11.7 -11.4 -8.1 -9.1 -0.2 5.9 6.5 4.7 4.1Total OECD 0.7 -1.4 -0.7 -0.3 -0.1 -0.6 -4.4 -20.2 -12.4 -10.1 -11.8 -4.8 16.5 7.5 7.9 6.3Asia 2.9 2.6 1.9 1.8 3.1 2.3 -7.7 -8.2 -1.1 0.9 -4.0 10.8 11.6 4.1 2.4 7.0Middle East -0.3 0.3 -2.7 1.3 3.0 0.4 -3.9 -14.4 -7.0 -7.3 -8.1 -2.5 10.4 3.1 1.1 2.9Americas -2.3 -0.2 0.3 -0.2 -0.3 -0.1 -6.1 -21.1 -8.2 -5.2 -10.1 0.7 18.5 4.7 1.8 5.9FSU 0.7 2.2 2.0 1.6 2.0 2.0 1.4 -14.0 -3.7 -1.6 -4.5 -1.6 12.6 2.9 1.2 3.5Africa 4.2 -2.0 -1.4 -2.0 -2.4 -2.0 -2.6 -22.5 -7.1 -6.1 -9.6 -3.2 19.3 3.1 2.7 4.8Europe -0.7 1.6 4.7 2.3 -0.8 1.9 -0.9 -21.0 -3.0 -1.6 -6.7 -0.1 18.4 3.0 1.5 5.1Total Non-OECD 1.6 1.4 0.7 1.2 2.0 1.3 -5.6 -12.6 -3.7 -2.0 -5.9 4.9 12.9 3.8 2.0 5.7World 1.1 0.1 0.0 0.4 1.0 0.4 -5.0 -16.2 -7.9 -5.8 -8.7 0.2 14.6 5.5 4.7 6.0Annual Change (mb/d)Americas 0.61 -0.22 -0.06 -0.04 0.03 -0.07 -0.95 -5.46 -3.30 -2.67 -3.09 -1.05 3.67 1.94 1.99 1.64Europe -0.10 -0.09 -0.08 -0.03 -0.07 -0.07 -0.69 -3.17 -1.83 -1.53 -1.80 -1.11 2.16 0.80 1.09 0.74Asia Oceania -0.20 -0.36 -0.21 -0.08 0.00 -0.16 -0.47 -0.86 -0.86 -0.65 -0.71 -0.02 0.39 0.44 0.35 0.29Total OECD 0.32 -0.67 -0.35 -0.15 -0.04 -0.30 -2.10 -9.49 -5.99 -4.84 -5.61 -2.18 6.22 3.18 3.42 2.67Asia 0.76 0.69 0.50 0.49 0.84 0.63 -2.10 -2.27 -0.29 0.26 -1.10 2.72 2.96 1.11 0.68 1.86Middle East -0.03 0.02 -0.23 0.11 0.24 0.04 -0.31 -1.17 -0.61 -0.61 -0.68 -0.19 0.73 0.25 0.09 0.22Americas -0.14 -0.01 0.02 -0.01 -0.02 -0.01 -0.37 -1.31 -0.52 -0.33 -0.63 0.04 0.91 0.27 0.11 0.33FSU 0.03 0.10 0.09 0.08 0.10 0.09 0.06 -0.66 -0.18 -0.08 -0.22 -0.07 0.51 0.14 0.06 0.16Africa 0.18 -0.09 -0.06 -0.08 -0.10 -0.08 -0.11 -0.97 -0.30 -0.26 -0.41 -0.13 0.64 0.12 0.11 0.18Europe -0.01 0.01 0.04 0.02 -0.01 0.01 -0.01 -0.16 -0.02 -0.01 -0.05 0.00 0.11 0.02 0.01 0.04Total Non-OECD 0.80 0.72 0.37 0.60 1.05 0.68 -2.84 -6.54 -1.92 -1.03 -3.08 2.35 5.85 1.92 1.05 2.79World 1.12 0.05 0.02 0.45 1.01 0.39 -4.94 -16.03 -7.91 -5.88 -8.68 0.18 12.07 5.10 4.47 5.46Revisions to Oil Demand from Last Month's Report (mb/d)Americas 0.00 0.00 0.00 0.00 0.00 0.00 0.00 0.00 0.00 0.11 0.03 0.31 0.13 -0.03 -0.03 0.10Europe 0.00 0.00 0.00 0.00 0.00 0.00 -0.01 0.00 0.00 0.06 0.01 -0.10 0.00 -0.03 -0.02 -0.04Asia Oceania 0.00 0.00 0.00 0.00 0.00 0.00 0.00 0.00 0.00 -0.08 -0.02 0.00 -0.03 -0.03 -0.01 -0.02Total OECD - - - - - - -0.00 0.00 0.00 0.09 0.02 0.21 0.10 -0.09 -0.06 0.04Asia 0.00 0.00 0.00 0.00 0.00 0.00 0.00 0.00 0.00 -0.05 -0.01 -0.01 0.00 -0.02 0.09 0.01Middle East 0.00 0.00 0.00 0.00 0.00 0.00 0.00 0.00 0.00 0.01 0.00 -0.03 -0.03 -0.01 0.01 -0.02Americas 0.00 0.00 0.00 0.00 0.00 0.00 0.00 0.00 0.00 0.00 0.00 0.07 0.01 0.02 0.01 0.03FSU 0.00 0.00 0.00 0.00 0.00 0.00 0.00 0.00 0.00 0.04 0.01 0.04 -0.04 -0.08 -0.01 -0.02Africa 0.01 0.01 0.01 0.01 0.01 0.01 0.01 0.02 -0.01 -0.03 0.00 0.01 -0.01 0.00 0.01 0.00Europe 0.00 0.00 0.00 0.00 0.00 0.00 0.00 0.00 0.00 0.00 0.00 0.00 0.00 0.00 0.00 0.00Total Non-OECD 0.01 0.01 0.01 0.01 0.01 0.01 0.01 0.03 -0.01 -0.03 -0.00 0.08 -0.07 -0.09 0.10 0.01World 0.01 0.01 0.01 0.01 0.01 0.01 0.01 0.03 -0.01 0.05 0.02 0.29 0.03 -0.17 0.04 0.05Revisions to Oil Demand Growth from Last Month's Report (mb/d)World 0.00 0.00 0.00 0.00 0.00 0.00 0.00 0.02 -0.02 0.04 0.01 0.28 0.01 -0.17 -0.01 0.03* France, Germany, Italy, Spain and UK
Table 2SUMMARY OF GLOBAL OIL DEMAND

Oil Market Report Tables
Page | 19 17 March 2021 IEA
. All
right
s re
serv
ed.
Table 2a: OECD Regional Oil Demand 2019 2020 1Q20 2Q20 3Q20 4Q20 Oct 20 Nov 20 Dec 20 2 Nov 20 Dec 19
AmericasLPG and ethane 3.84 3.84 4.13 3.50 3.50 4.22 3.88 4.31 4.47 0.16 0.23 Naphtha 0.24 0.23 0.25 0.21 0.23 0.24 0.23 0.24 0.24 0.00 -0.03 Motor gasoline 11.09 9.52 10.16 8.38 10.02 9.53 9.80 9.46 9.32 -0.14 -1.46 Jet and kerosene 2.08 1.26 1.87 0.78 1.13 1.26 1.17 1.29 1.32 0.02 -0.83 Gasoil/diesel oil 5.41 4.94 5.27 4.56 4.82 5.10 5.22 5.11 4.98 -0.13 -0.21 Residual fuel oil 0.56 0.44 0.41 0.38 0.53 0.45 0.53 0.42 0.39 -0.03 -0.07 Other products 2.43 2.32 2.25 2.20 2.48 2.36 2.26 2.37 2.44 0.06 -0.08
Total 25.65 22.56 24.35 20.01 22.72 23.15 23.09 23.21 23.16 -0.05 -2.45
EuropeLPG and ethane 1.17 1.10 1.23 0.98 1.11 1.08 1.07 1.09 1.08 -0.01 -0.09 Naphtha 1.01 1.07 1.06 1.07 1.02 1.14 1.07 1.13 1.22 0.09 0.18 Motor gasoline 2.04 1.78 1.82 1.46 2.07 1.77 1.93 1.64 1.73 0.09 -0.28 Jet and kerosene 1.55 0.75 1.25 0.40 0.67 0.66 0.68 0.64 0.68 0.04 -0.74 Gasoil/diesel oil 6.45 5.91 6.22 5.36 6.03 6.05 6.26 5.93 5.95 0.02 -0.30 Residual fuel oil 0.83 0.68 0.70 0.65 0.69 0.68 0.71 0.65 0.68 0.03 -0.05 Other products 1.20 1.16 1.06 1.12 1.27 1.18 1.26 1.25 1.02 -0.23 -0.04
Total 14.25 12.45 13.34 11.03 12.85 12.56 12.96 12.35 12.37 0.02 -1.32
Asia OceaniaLPG and ethane 0.76 0.73 0.82 0.69 0.67 0.73 0.67 0.74 0.77 0.03 -0.12 Naphtha 1.96 1.80 1.93 1.75 1.80 1.72 1.68 1.67 1.82 0.15 -0.24 Motor gasoline 1.53 1.40 1.40 1.25 1.48 1.47 1.40 1.49 1.53 0.04 -0.04 Jet and kerosene 0.91 0.62 0.99 0.40 0.37 0.73 0.48 0.75 0.96 0.21 -0.26 Gasoil/diesel oil 1.92 1.83 1.83 1.78 1.77 1.93 1.84 2.00 1.94 -0.06 -0.05 Residual fuel oil 0.42 0.42 0.45 0.41 0.39 0.44 0.42 0.46 0.45 -0.01 -0.03 Other products 0.29 0.28 0.32 0.26 0.23 0.31 0.32 0.28 0.33 0.05 0.02
Total 7.79 7.08 7.75 6.54 6.69 7.34 6.82 7.40 7.80 0.40 -0.71
OECDLPG and ethane 5.77 5.66 6.18 5.17 5.28 6.03 5.62 6.14 6.31 0.17 0.02 Naphtha 3.21 3.11 3.25 3.04 3.05 3.10 2.98 3.05 3.28 0.24 -0.08 Motor gasoline 14.66 12.71 13.38 11.09 13.57 12.77 13.13 12.59 12.58 -0.01 -1.78 Jet and kerosene 4.55 2.63 4.11 1.58 2.16 2.66 2.33 2.68 2.96 0.27 -1.83 Gasoil/diesel oil 13.77 12.68 13.32 11.70 12.61 13.08 13.32 13.05 12.88 -0.17 -0.56 Residual fuel oil 1.81 1.54 1.57 1.44 1.60 1.57 1.66 1.53 1.52 -0.01 -0.15 Other products 3.93 3.76 3.63 3.57 3.98 3.84 3.83 3.91 3.79 -0.12 -0.10
Total 47.70 42.09 45.44 37.58 42.26 43.05 42.87 42.96 43.33 0.37 -4.481 Demand, measured as deliveries from refineries and primary stocks, comprises inland deliveries, international bunkers and refinery fuel. It includes crude for direct burning, oil from non-conventional sources and other sources of supply. Jet/kerosene comprises jet kerosene and non-aviation kerosene. Gasoil comprises diesel, light heating oil and other gasoils. North America comprises US 50 states, US territories, Mexico and Canada. 2 Latest official OECD submissions (MOS).
Latest month vs.
Table 2aOECD REGIONAL OIL DEMAND1
(million barrels per day)

Oil Market Report Tables
Page | 20 17 March 2021 IEA
. All
right
s re
serv
ed.
Table 2b: Oil Demand in Selected OECD Countries
2019 2020 1Q20 2Q20 3Q20 4Q20 Oct 20 Nov 20 Dec 20 2 Nov 20 Dec 19
United States3
LPG and ethane 2.94 2.99 3.22 2.71 2.69 3.34 3.05 3.41 3.57 0.16 0.28 Naphtha 0.21 0.18 0.20 0.16 0.19 0.19 0.19 0.18 0.19 0.01 -0.05 Motor gasoline 9.31 8.03 8.49 7.11 8.50 8.02 8.26 7.98 7.84 -0.14 -1.14 Jet and kerosene 1.75 1.09 1.58 0.69 0.97 1.10 1.01 1.13 1.15 0.02 -0.67 Gasoil/diesel oil 4.10 3.78 3.97 3.51 3.70 3.92 4.02 3.89 3.86 -0.03 -0.07 Residual fuel oil 0.28 0.22 0.17 0.15 0.32 0.23 0.28 0.21 0.20 -0.01 -0.09 Other products 1.96 1.83 1.70 1.75 1.99 1.90 1.82 1.90 1.98 0.08 0.09
Total 20.54 18.12 19.33 16.08 18.36 18.71 18.62 18.71 18.80 0.09 -1.65JapanLPG and ethane 0.35 0.33 0.40 0.31 0.27 0.34 0.28 0.34 0.41 0.07 -0.01 Naphtha 0.73 0.67 0.70 0.62 0.66 0.70 0.66 0.74 0.71 -0.03 -0.08 Motor gasoline 0.85 0.78 0.78 0.69 0.85 0.82 0.79 0.80 0.86 0.06 -0.02 Jet and kerosene 0.48 0.38 0.61 0.22 0.19 0.48 0.28 0.51 0.66 0.15 -0.07 Diesel 0.44 0.41 0.41 0.39 0.40 0.43 0.42 0.43 0.44 0.02 -0.01 Other gasoil 0.33 0.31 0.34 0.29 0.28 0.33 0.30 0.32 0.37 0.05 0.00 Residual fuel oil 0.23 0.21 0.23 0.20 0.19 0.23 0.23 0.23 0.23 -0.01 -0.02 Other products 0.24 0.20 0.23 0.18 0.18 0.19 0.19 0.19 0.21 0.02 -0.04
Total 3.65 3.28 3.69 2.89 3.03 3.53 3.15 3.55 3.89 0.34 -0.25GermanyLPG and ethane 0.12 0.11 0.12 0.12 0.11 0.10 0.09 0.10 0.11 0.01 0.00 Naphtha 0.27 0.28 0.29 0.28 0.27 0.31 0.31 0.30 0.31 0.01 -0.02 Motor gasoline 0.50 0.45 0.46 0.40 0.49 0.44 0.48 0.43 0.42 -0.01 -0.07 Jet and kerosene 0.22 0.10 0.18 0.06 0.09 0.08 0.08 0.09 0.08 -0.01 -0.12 Diesel 0.77 0.71 0.72 0.65 0.75 0.71 0.77 0.69 0.67 -0.03 -0.03 Other gasoil 0.35 0.36 0.43 0.44 0.26 0.33 0.32 0.30 0.36 0.06 0.05 Residual fuel oil 0.05 0.04 0.04 0.04 0.05 0.05 0.05 0.05 0.04 -0.01 -0.01 Other products 0.09 0.08 0.08 0.08 0.10 0.07 0.09 0.09 0.04 -0.04 -0.02
Total 2.36 2.15 2.31 2.07 2.11 2.10 2.21 2.05 2.04 -0.01 -0.21ItalyLPG and ethane 0.10 0.09 0.11 0.07 0.09 0.10 0.10 0.08 0.11 0.03 -0.01 Naphtha 0.10 0.10 0.08 0.09 0.11 0.12 0.12 0.12 0.13 0.00 0.04 Motor gasoline 0.18 0.16 0.15 0.13 0.20 0.16 0.18 0.15 0.16 0.02 -0.02 Jet and kerosene 0.11 0.05 0.07 0.03 0.06 0.05 0.05 0.06 0.05 0.00 -0.05 Diesel 0.44 0.36 0.36 0.27 0.41 0.39 0.42 0.35 0.38 0.03 -0.05 Other gasoil 0.07 0.07 0.06 0.07 0.07 0.08 0.08 0.09 0.08 -0.01 0.00 Residual fuel oil 0.06 0.06 0.06 0.05 0.06 0.05 0.07 0.05 0.05 0.00 -0.01 Other products 0.14 0.13 0.12 0.12 0.15 0.14 0.15 0.15 0.12 -0.03 -0.03
Total 1.20 1.02 1.02 0.82 1.14 1.10 1.17 1.05 1.08 0.03 -0.13FranceLPG and ethane 0.13 0.13 0.14 0.10 0.13 0.13 0.12 0.13 0.13 0.01 0.00 Naphtha 0.11 0.13 0.11 0.14 0.11 0.14 0.14 0.13 0.16 0.03 0.07 Motor gasoline 0.20 0.17 0.18 0.13 0.22 0.17 0.20 0.13 0.18 0.06 -0.02 Jet and kerosene 0.17 0.09 0.14 0.04 0.08 0.08 0.08 0.07 0.08 0.01 -0.08 Diesel 0.68 0.66 0.65 0.54 0.75 0.68 0.76 0.61 0.67 0.06 0.00 Other gasoil 0.23 0.14 0.22 0.16 0.07 0.13 0.13 0.11 0.16 0.05 -0.05 Residual fuel oil 0.05 0.03 0.03 0.02 0.03 0.03 0.03 0.03 0.03 0.00 0.01 Other products 0.12 0.09 0.08 0.08 0.11 0.09 0.12 0.09 0.07 -0.02 -0.02
Total 1.69 1.43 1.54 1.22 1.52 1.45 1.58 1.29 1.49 0.20 -0.09United KingdomLPG and ethane 0.14 0.13 0.15 0.13 0.12 0.13 0.12 0.13 0.13 0.00 0.00 Naphtha 0.03 0.03 0.04 0.05 0.03 0.01 0.01 0.01 0.00 -0.01 -0.03 Motor gasoline 0.29 0.22 0.27 0.14 0.23 0.24 0.26 0.24 0.23 0.00 -0.05 Jet and kerosene 0.33 0.18 0.32 0.11 0.13 0.17 0.16 0.16 0.18 0.03 -0.15 Diesel 0.51 0.42 0.49 0.31 0.43 0.47 0.46 0.47 0.47 0.00 -0.04 Other gasoil 0.14 0.12 0.12 0.11 0.12 0.12 0.13 0.13 0.11 -0.02 -0.02 Residual fuel oil 0.02 0.02 0.02 0.02 0.02 0.02 0.02 0.02 0.02 0.00 0.00 Other products 0.12 0.10 0.10 0.08 0.11 0.10 0.11 0.11 0.10 -0.01 -0.02
Total 1.57 1.23 1.52 0.96 1.18 1.25 1.26 1.26 1.25 -0.01 -0.31CanadaLPG and ethane 0.44 0.40 0.41 0.41 0.39 0.39 0.35 0.44 0.38 -0.06 -0.06 Naphtha 0.01 0.02 0.02 0.02 0.01 0.02 0.02 0.03 0.03 0.00 0.01 Motor gasoline 0.83 0.72 0.78 0.62 0.78 0.71 0.73 0.72 0.68 -0.04 -0.18 Jet and kerosene 0.18 0.08 0.14 0.04 0.07 0.07 0.07 0.07 0.07 0.00 -0.10 Diesel 0.26 0.27 0.27 0.27 0.26 0.26 0.26 0.27 0.26 -0.01 0.01 Other gasoil 0.34 0.30 0.33 0.24 0.31 0.31 0.31 0.36 0.28 -0.08 -0.07 Residual fuel oil 0.04 0.03 0.04 0.03 0.02 0.02 0.02 0.02 0.02 0.00 -0.01 Other products 0.26 0.29 0.34 0.25 0.31 0.25 0.22 0.27 0.25 -0.02 -0.16
Total 2.37 2.10 2.33 1.88 2.16 2.03 1.97 2.17 1.96 -0.21 -0.551 Demand, measured as deliveries from refineries and primary stocks, comprises inland deliveries, international bunkers and refinery fuel. It includes crude for direct burning, oil from non-conventional sources and other sources of supply. Jet/kerosene comprises jet kerosene and non-aviation kerosene. Gasoil comprises diesel, light heating oil and other gasoils. 2 Latest official OECD submissions (MOS).3 US figures exclude US territories.
Latest month vs.
Table 2bOIL DEMAND IN SELECTED OECD COUNTRIES1
(million barrels per day)

Oil Market Report Tables
Page | 21 17 March 2021 IEA
. All
right
s re
serv
ed.
Table 3: World Oil Production 2019 2020 2021 3Q20 4Q20 1Q21 2Q21 3Q21 Dec 20 Jan 21 Feb 21
OPECCrude Oil Saudi Arabia 9.80 9.21 8.78 8.99 8.99 9.10 8.14 Iran 2.36 1.98 1.96 2.00 2.04 2.17 2.14 Iraq 4.71 4.05 3.69 3.81 3.86 3.83 3.89 UAE 3.18 2.86 2.84 2.51 2.57 2.61 2.61 Kuwait 2.68 2.42 2.25 2.30 2.30 2.33 2.35 Angola 1.39 1.27 1.24 1.18 1.14 1.13 1.14 Nigeria 1.73 1.49 1.37 1.31 1.26 1.30 1.40 Libya 1.09 0.35 0.11 0.89 1.17 1.13 1.12 Algeria 1.02 0.90 0.84 0.86 0.86 0.87 0.88 Congo 0.33 0.30 0.30 0.28 0.28 0.28 0.26 Gabon 0.21 0.20 0.19 0.20 0.19 0.16 0.19 Equatorial Guinea 0.11 0.11 0.11 0.11 0.11 0.12 0.10 Venezuela 0.87 0.53 0.40 0.42 0.44 0.48 0.53
Total Crude Oil 29.49 25.68 24.10 24.86 25.21 25.51 24.75 of which Neutral Zone 1 0.00 0.11 0.13 0.20 0.20 0.20 0.24 Total NGLs2 5.41 5.20 5.27 5.08 5.16 5.20 5.29 5.30 5.17 5.20 5.19
Total OPEC3 34.90 30.88 29.17 30.02 30.38 30.71 29.94 NON-OPEC4
OECDAmericas 24.65 23.82 24.00 23.13 23.72 23.56 23.95 24.10 24.00 23.95 22.72 United States 17.16 16.57 16.39 16.25 16.20 15.88 16.54 16.52 16.23 16.27 15.01 Mexico 1.93 1.93 1.92 1.91 1.90 1.92 1.92 1.91 1.92 1.90 1.91 Canada 5.54 5.31 5.69 4.96 5.61 5.75 5.49 5.66 5.85 5.77 5.79 Chile 0.01 0.01 0.01 0.01 0.01 0.01 0.01 0.01 0.01 0.01 0.01 Europe 3.33 3.54 3.64 3.40 3.51 3.65 3.55 3.62 3.68 3.60 3.67 UK 1.13 1.06 1.01 0.96 1.01 1.02 0.96 1.00 1.07 0.98 1.04 Norway 1.74 2.00 2.16 1.95 2.01 2.15 2.11 2.15 2.13 2.14 2.15 Others 0.46 0.48 0.48 0.49 0.49 0.48 0.48 0.48 0.48 0.48 0.48 Asia Oceania 0.53 0.53 0.56 0.54 0.52 0.55 0.56 0.56 0.52 0.54 0.55 Australia 0.46 0.46 0.49 0.47 0.46 0.48 0.49 0.49 0.45 0.48 0.48 Others 0.07 0.07 0.07 0.07 0.06 0.07 0.07 0.07 0.07 0.07 0.07
Total OECD 28.51 27.89 28.20 27.06 27.76 27.75 28.07 28.28 28.20 28.09 26.93 NON-OECDFormer USSR 14.64 13.50 13.62 12.78 13.19 13.41 13.61 13.71 13.25 13.39 13.46 Russia 11.58 10.61 10.72 10.08 10.37 10.52 10.75 10.81 10.40 10.51 10.51 Azerbaijan 0.77 0.70 0.72 0.66 0.68 0.72 0.71 0.73 0.69 0.75 0.70 Kazakhstan 1.94 1.84 1.81 1.69 1.79 1.81 1.81 1.82 1.80 1.77 1.89 Others 0.35 0.36 0.35 0.36 0.36 0.35 0.35 0.35 0.35 0.35 0.35 Asia 7.19 7.01 6.92 6.96 6.92 6.96 6.98 6.91 6.89 6.93 6.95 China 3.92 3.97 3.94 3.98 3.93 3.96 3.99 3.93 3.90 3.93 3.97 Malaysia 0.67 0.60 0.66 0.58 0.60 0.63 0.66 0.67 0.61 0.62 0.61 India 0.80 0.75 0.73 0.75 0.74 0.74 0.73 0.73 0.74 0.74 0.74 Indonesia 0.77 0.74 0.70 0.72 0.74 0.71 0.70 0.69 0.72 0.71 0.71 Others 1.03 0.95 0.89 0.92 0.92 0.92 0.90 0.88 0.92 0.93 0.93 Europe 0.12 0.11 0.11 0.11 0.11 0.11 0.11 0.10 0.11 0.11 0.11 Americas 5.34 5.33 5.55 5.40 5.20 5.37 5.61 5.60 5.17 5.33 5.30 Brazil 2.90 3.05 3.21 3.14 2.89 3.02 3.26 3.27 2.83 2.98 2.95 Argentina 0.65 0.61 0.62 0.60 0.60 0.61 0.62 0.62 0.61 0.62 0.61 Colombia 0.89 0.79 0.75 0.75 0.76 0.76 0.76 0.75 0.77 0.75 0.77 Ecuador 0.54 0.49 0.54 0.52 0.52 0.53 0.54 0.54 0.52 0.53 0.54 Others 0.36 0.40 0.43 0.39 0.42 0.44 0.44 0.43 0.45 0.45 0.44 Middle East 3.18 3.13 3.19 3.08 3.13 3.16 3.18 3.20 3.13 3.17 3.16 Oman 0.98 0.96 0.98 0.92 0.95 0.96 0.98 1.00 0.95 0.97 0.96 Qatar 1.89 1.88 1.91 1.88 1.89 1.90 1.90 1.91 1.89 1.90 1.90 Others 0.31 0.29 0.30 0.28 0.29 0.30 0.30 0.30 0.29 0.30 0.30 Africa 1.48 1.38 1.26 1.37 1.33 1.32 1.27 1.22 1.34 1.35 1.34 Egypt 0.63 0.60 0.55 0.59 0.57 0.56 0.56 0.55 0.57 0.57 0.56 Others 0.85 0.79 0.71 0.77 0.76 0.76 0.71 0.68 0.77 0.79 0.78
Total Non-OECD 31.95 30.46 30.64 29.70 29.89 30.33 30.76 30.75 29.89 30.28 30.32 Processing gains5 2.35 2.12 2.22 2.10 2.13 2.11 2.20 2.30 2.16 2.19 2.07 Global Biofuels 2.78 2.58 2.83 3.06 2.58 2.32 2.93 3.21 2.21 2.32 2.31 TOTAL NON-OPEC 65.60 63.06 63.90 61.92 62.35 62.50 63.95 64.55 62.48 62.88 61.62 TOTAL SUPPLY 100.50 93.93 91.09 92.37 92.86 93.59 91.57 1 Neutral Zone production is already included in Saudi Arabia and Kuwait production with their respective shares.2 Includes condensates reported by OPEC countries, oil from non-conventional sources, e.g. NGLs in Qatar and Nigeria and non-oil inputs to Saudi Arabian MTBE.3 OPEC data based on today's membership throughout the time series. 4 Comprises crude oil, condensates, NGLs and oil from non-conventional sources5 Net volumetric gains and losses in refining and marine transportation losses.
Table 3WORLD OIL PRODUCTION
(million barrels per day)

Oil Market Report Tables
Page | 22 17 March 2021 IEA
. All
right
s re
serv
ed.
Table 3a: Oil Supply in OECD Countries 2019 2020 2021 3Q20 4Q20 1Q21 2Q21 3Q21 Dec 20 Jan 21 Feb 21
United StatesAlaska 466 448 436 443 462 460 442 391 463 464 461 California 455 407 374 394 383 379 375 372 381 381 379 Texas 5070 4866 4679 4692 4639 4702 4670 4654 4619 4630 4721 Federal Gulf of Mexico2 1897 1652 1858 1448 1508 1810 1868 1887 1772 1789 1814 Other US Lower 48 4360 3935 3739 3831 3879 3435 3858 3850 3828 3854 2717 NGLs3 4825 5161 5202 5334 5226 4998 5223 5260 5060 5066 4830 Other Hydrocarbons 92 100 103 106 104 91 104 109 106 83 88
Total 17164 16569 16390 16249 16202 15876 16538 16522 16228 16266 15010 CanadaAlberta Light/Medium/Heavy 487 423 410 411 419 422 410 407 424 418 424 Alberta Bitumen 1837 1718 2007 1662 1890 1937 1842 2082 1955 1918 1954 Saskatchewan 487 435 428 420 441 434 430 426 450 438 432 Other Crude 489 489 496 459 475 494 491 494 480 497 492 NGLs 961 954 997 911 984 994 1026 958 981 965 1025 Other Upgraders 172 173 181 148 188 198 173 174 210 206 197 Synthetic Crudes 1111 1116 1166 952 1212 1275 1116 1120 1351 1330 1268
Total 5544 5308 5686 4963 5609 5754 5489 5662 5850 5773 5792 MexicoCrude 1705 1721 1719 1696 1710 1732 1715 1707 1728 1727 1733 NGLs 218 206 192 209 185 181 199 196 184 172 170
Total 1928 1932 1916 1908 1899 1917 1919 1907 1916 1903 1907 UKBrent Fields 44 35 28 33 32 32 31 23 36 31 32 Forties Fields 327 297 241 257 279 267 207 233 264 260 273 Ninian Fields 37 31 24 31 25 26 21 23 34 24 27 Flotta Fields 57 51 46 47 48 48 44 47 51 47 49 Other Fields 591 564 594 514 545 568 583 596 604 536 578 NGLs 79 82 76 73 86 78 77 76 78 78 77
Total 1135 1060 1009 955 1015 1019 963 998 1067 977 1036
Norway5
Ekofisk-Ula Area 138 132 127 131 129 131 126 118 133 130 131 Oseberg-Troll Area 259 234 241 204 240 245 240 239 240 244 248 Statfjord-Gullfaks Area 237 231 282 251 191 268 279 282 265 267 259 Haltenbanken Area 283 274 304 259 282 296 301 304 287 289 304 Sleipner-Frigg Area 429 744 829 725 810 827 828 821 834 823 830 Other Fields 91 99 83 105 82 76 43 99 68 62 83 NGLs 299 288 290 278 279 304 294 283 301 321 294
Total 1737 2001 2157 1953 2012 2148 2110 2147 2128 2137 2148
Other OECD EuropeDenmark 101 71 61 70 66 64 62 60 61 65 63 Italy 78 101 121 105 112 119 122 121 111 117 118 Turkey 58 62 64 63 64 64 64 64 65 64 64 Other 95 88 102 83 98 105 103 101 110 105 106 NGLs 8 7 6 6 6 6 6 6 6 6 6 Non-Conventional Oils 124 154 124 162 139 124 124 124 129 126 123
Total 463 482 478 489 485 483 481 476 483 484 480
AustraliaGippsland Basin 9 8 7 7 7 7 7 7 7 7 7 Cooper-Eromanga Basin 34 36 33 35 35 34 33 33 35 34 34 Carnarvon Basin 72 108 121 118 124 123 122 120 124 123 123 Other Crude 246 200 210 188 183 204 210 214 178 199 205 NGLs 98 113 118 122 111 114 119 120 110 112 113
Total 458 464 489 470 460 481 490 493 454 476 482
Other OECD Asia OceaniaNew Zealand 24 18 19 18 18 19 19 18 20 19 19 Japan 4 4 4 5 4 4 4 4 4 4 4 NGLs 12 11 10 11 11 10 10 10 11 10 10 Non-Conventional Oils 28 34 34 36 31 34 34 34 34 35 33
Total 69 69 67 69 65 68 67 66 69 69 67
OECDCrude Oil 20469 19482 19689 18704 19182 19334 19551 19798 19632 19570 18686 NGLs 6509 6830 6900 6952 6896 6693 6961 6918 6739 6739 6533 Non-Conventional Oils4 1532 1582 1611 1406 1678 1727 1555 1565 1834 1785 1713
Total 28510 27894 28200 27063 27756 27754 28067 28280 28205 28093 26932
1 Subcategories refer to crude oil only unless otherwise noted.2 Only production from Federal waters is included.3 To the extent possible, condensates from natural gas processing plants are included with NGLs, while field condensates are counted as crude oil.4 Does not include biofuels.5 North Sea production is grouped by area including all fields being processed through the named field complex, ie, not just the field of that name.6 Other North Sea NGLs is included.
Table 3aOIL SUPPLY IN OECD COUNTRIES1
(thousand of barrels per day)

Oil Market Report Tables
Page | 23 17 March 2021 IEA
. All
right
s re
serv
ed.
Table 4: OECD Industry Stocks and Quarterly Stock Changes
RECENT MONTHLY STOCKS2 PRIOR YEARS' STOCKS2 STOCK CHANGESin Million Barrels in Million Barrels in mb/d
Sep2020 Oct2020 Nov2020 Dec2020 Jan2021* Jan2018 Jan2019 Jan2020 1Q2020 2Q2020 3Q2020 4Q2020
OECD INDUSTRY-CONTROLLED STOCKS1
OECD AmericasCrude 659.3 654.8 664.6 650.8 638.1 582.0 612.1 594.4 0.71 0.52 -0.36 -0.09 Motor Gasoline 255.2 255.7 270.2 271.8 284.7 278.6 292.8 291.7 0.11 -0.10 -0.28 0.18 Middle Distillate 234.3 216.5 217.9 224.1 231.2 218.0 213.0 209.4 -0.14 0.54 -0.07 -0.11 Residual Fuel Oil 38.5 38.1 38.1 37.3 39.7 37.7 37.9 36.5 0.04 0.07 -0.09 -0.01 Total Products3 815.9 786.2 787.9 768.3 750.3 724.9 743.2 756.8 -0.19 0.90 -0.04 -0.52
Total4 1686.8 1650.8 1657.8 1614.8 1591.0 1484.3 1538.2 1538.1 0.56 1.51 -0.29 -0.78
OECD EuropeCrude 377.9 371.5 360.9 371.0 368.7 341.7 337.9 351.9 0.13 0.15 0.00 -0.07 Motor Gasoline 90.2 96.1 102.2 98.9 97.9 100.8 105.5 96.7 0.09 0.00 -0.10 0.09 Middle Distillate 333.0 332.5 326.9 315.2 328.9 287.7 256.4 298.2 0.17 0.51 -0.07 -0.19 Residual Fuel Oil 68.6 64.7 65.8 67.1 67.0 60.0 58.1 66.4 0.13 0.04 -0.06 -0.02 Total Products3 611.2 607.5 610.5 593.7 610.2 565.2 533.9 573.1 0.44 0.50 -0.22 -0.19
Total4 1078.1 1062.4 1055.6 1042.3 1058.3 984.0 954.9 1005.2 0.61 0.73 -0.23 -0.39
OECD Asia OceaniaCrude 163.3 170.0 155.5 152.7 143.9 187.2 152.8 118.3 -0.25 0.29 0.05 -0.12 Motor Gasoline 26.8 26.1 25.5 25.9 28.2 24.7 27.4 27.3 0.01 -0.01 0.02 -0.01 Middle Distillate 72.0 73.3 71.4 66.0 68.1 62.8 64.8 75.6 -0.04 -0.01 0.05 -0.07 Residual Fuel Oil 17.2 16.2 16.1 15.6 15.7 19.1 20.3 20.0 0.02 -0.01 0.00 -0.02 Total Products3 183.4 181.1 178.3 168.1 169.9 163.9 171.4 184.6 -0.01 0.05 0.07 -0.17
Total4 411.3 413.9 395.8 379.7 373.3 411.1 386.4 367.8 -0.29 0.37 0.12 -0.34
Total OECDCrude 1200.5 1196.2 1180.9 1174.4 1150.6 1110.9 1102.8 1064.6 0.59 0.97 -0.31 -0.28 Motor Gasoline 372.1 377.8 397.9 396.5 410.8 404.1 425.6 415.8 0.21 -0.10 -0.37 0.27 Middle Distillate 639.2 622.3 616.2 605.3 628.2 568.5 534.2 583.2 -0.01 1.04 -0.08 -0.37 Residual Fuel Oil 124.4 118.9 120.0 119.9 122.4 116.8 116.4 122.8 0.18 0.09 -0.15 -0.05 Total Products3 1610.4 1574.8 1576.7 1530.1 1530.3 1453.9 1448.4 1514.5 0.25 1.45 -0.18 -0.87
Total4 3176.2 3127.0 3109.2 3036.8 3022.6 2879.4 2879.5 2911.1 0.88 2.61 -0.39 -1.51
OECD GOVERNMENT-CONTROLLED STOCKS5
OECD Americas
Crude 642.2 638.6 638.1 638.1 638.0 664.2 649.1 635.0 0.00 0.23 -0.15 -0.04 Products 2.0 2.0 2.0 2.0 2.0 2.0 2.0 2.0 0.00 0.00 0.00 0.00
OECD EuropeCrude 207.4 204.9 207.1 205.2 205.5 207.2 207.7 206.1 -0.01 0.02 -0.01 -0.02
Products 280.6 282.4 282.1 280.0 280.6 274.6 273.0 275.1 0.03 0.01 0.04 -0.01
OECD Asia OceaniaCrude 377.6 374.5 374.5 374.6 374.6 383.4 380.6 377.4 0.00 0.00 0.00 -0.03 Products 39.4 39.1 39.1 39.1 39.1 38.7 38.8 38.9 0.00 0.00 0.00 0.00
Total OECDCrude 1227.1 1218.0 1219.7 1217.9 1218.1 1254.8 1237.4 1218.4 -0.01 0.25 -0.16 -0.10 Products 322.0 323.4 323.2 321.1 321.7 315.3 313.7 316.0 0.03 0.01 0.05 -0.01
Total4 1551.4 1543.5 1544.8 1541.1 1541.7 1573.1 1554.3 1536.2 0.02 0.27 -0.11 -0.11
* estimated1 Stocks are primary national territory stocks on land (excluding utility stocks and including pipeline and entrepot stocks where known) and include stocks held by industry to meet IEA, EU and national emergency reserve commitments and are subject to government control in emergencies. 2 Closing stock levels.3 Total products includes gasoline, middle distillates, fuel oil and other products. 4 Total includes NGLs, refinery feedstocks, additives/oxygenates and other hydrocarbons. 5 Includes government-owned stocks and stock holding organisation stocks held for emergency purposes.
Table 4OECD STOCKS AND QUARTERLY STOCK CHANGES

Oil Market Report Tables
Page | 24 17 March 2021 IEA
. All
right
s re
serv
ed.
Table 4a: Industry Stocks on Land in Selected Countries
August September October November December
2019 2020 % 2019 2020 % 2019 2020 % 2019 2020 % 2019 2020 %
United States2
Crude 430.1 504.0 17.2 425.6 497.3 16.8 443.4 493.6 11.3 445.9 500.4 12.2 432.8 485.3 12.1 Motor Gasoline 230.4 236.6 2.7 232.0 226.5 -2.4 224.5 227.3 1.2 233.7 241.2 3.2 254.1 243.2 -4.3 Middle Distillate 180.9 221.4 22.4 178.2 214.1 20.1 162.4 195.5 20.4 169.6 196.6 15.9 183.4 201.7 10.0 Residual Fuel Oil 28.8 34.8 20.8 30.0 32.1 7.0 29.7 31.2 5.1 32.7 31.2 -4.6 30.5 30.2 -1.0 Other Products 243.5 260.9 7.1 246.2 270.6 9.9 236.7 259.0 9.4 221.3 244.4 10.4 210.5 218.5 3.8 Total Products 683.6 753.7 10.3 686.4 743.3 8.3 653.3 713.0 9.1 657.3 713.4 8.5 678.5 693.6 2.2 Other3 187.0 178.5 -4.5 186.3 181.3 -2.7 188.9 179.1 -5.2 180.1 175.6 -2.5 170.6 165.4 -3.0
Total 1300.7 1436.2 10.4 1298.3 1421.9 9.5 1285.6 1385.7 7.8 1283.3 1389.4 8.3 1281.9 1344.3 4.9 JapanCrude 96.5 94.2 -2.4 86.3 90.2 4.5 88.9 89.7 0.9 86.9 79.6 -8.4 92.1 79.8 -13.4 Motor Gasoline 10.0 12.1 21.0 9.5 12.2 28.4 10.1 12.1 19.8 10.4 12.5 20.2 10.8 12.5 15.7 Middle Distillate 35.8 37.1 3.6 34.6 37.7 9.0 36.2 38.3 5.8 37.1 38.6 4.0 33.1 34.6 4.5 Residual Fuel Oil 7.5 7.2 -4.0 7.9 6.9 -12.7 8.1 6.9 -14.8 8.5 7.0 -17.6 7.2 6.6 -8.3 Other Products 42.0 38.4 -8.6 39.4 38.5 -2.3 39.0 36.0 -7.7 36.3 35.5 -2.2 35.8 32.3 -9.8 Total Products 95.3 94.8 -0.5 91.4 95.3 4.3 93.4 93.3 -0.1 92.3 93.6 1.4 86.9 86.0 -1.0 Other3 56.7 56.1 -1.1 54.2 54.4 0.4 56.0 52.5 -6.3 54.4 52.4 -3.7 53.1 49.9 -6.0
Total 248.5 245.1 -1.4 231.9 239.9 3.4 238.3 235.5 -1.2 233.6 225.6 -3.4 232.1 215.7 -7.1 GermanyCrude 48.6 50.2 3.3 47.1 49.6 5.3 47.6 48.8 2.5 47.4 50.1 5.7 47.3 51.9 9.7 Motor Gasoline 10.1 10.0 -1.0 10.6 9.3 -12.3 10.9 10.2 -6.4 11.3 11.7 3.5 11.4 10.9 -4.4 Middle Distillate 24.4 27.6 13.1 24.1 22.3 -7.5 22.9 21.7 -5.2 22.7 24.3 7.0 24.8 23.3 -6.0 Residual Fuel Oil 7.2 8.3 15.3 7.4 7.9 6.8 7.0 7.1 1.4 8.0 7.2 -10.0 7.0 6.6 -5.7 Other Products 10.5 9.6 -8.6 10.3 9.8 -4.9 10.2 9.7 -4.9 9.7 9.1 -6.2 10.2 9.3 -8.8 Total Products 52.2 55.5 6.3 52.4 49.3 -5.9 51.0 48.7 -4.5 51.7 52.3 1.2 53.4 50.1 -6.2 Other3 0.0 0.0 0.0 0.0 0.0 0.0 0.0 0.0 0.0 0.0 0.0 0.0 0.0 0.0 0.0
Total 100.8 105.7 4.9 99.5 98.9 -0.6 98.6 97.5 -1.1 99.1 102.4 3.3 100.7 102.0 1.3 ItalyCrude 41.6 40.8 -1.9 42.7 40.0 -6.3 44.0 40.4 -8.2 35.9 36.7 2.2 39.4 40.1 1.8 Motor Gasoline 11.5 11.4 -0.9 12.5 11.5 -8.0 13.1 11.8 -9.9 12.5 12.8 2.4 12.9 11.9 -7.8 Middle Distillate 30.9 31.3 1.3 31.1 30.1 -3.2 29.1 29.2 0.3 29.0 29.3 1.0 28.1 26.9 -4.3 Residual Fuel Oil 9.4 8.4 -10.6 8.8 7.9 -10.2 9.1 7.9 -13.2 8.9 7.6 -14.6 8.9 7.9 -11.2 Other Products 12.8 19.0 48.4 13.8 19.9 44.2 13.8 19.4 40.6 14.1 19.9 41.1 13.9 19.3 38.8 Total Products 64.6 70.1 8.5 66.2 69.4 4.8 65.1 68.3 4.9 64.5 69.6 7.9 63.8 66.0 3.4 Other3 15.1 17.6 16.6 15.7 17.3 10.2 15.2 16.1 5.9 14.5 17.0 17.2 14.9 16.6 11.4
Total 121.3 128.5 5.9 124.6 126.7 1.7 124.3 124.8 0.4 114.9 123.3 7.3 118.1 122.7 3.9 FranceCrude 14.0 11.6 -17.1 11.0 13.9 26.4 16.8 9.4 -44.0 17.3 13.3 -23.1 11.9 12.4 4.2 Motor Gasoline 5.5 5.0 -9.1 4.9 4.9 0.0 4.7 5.4 14.9 3.8 6.1 60.5 3.8 4.8 26.3 Middle Distillate 22.1 25.9 17.2 20.1 24.7 22.9 19.3 24.4 26.4 19.3 24.1 24.9 21.5 21.5 0.0 Residual Fuel Oil 1.6 1.5 -6.3 0.6 1.6 166.7 1.2 1.5 25.0 1.5 1.7 13.3 1.5 2.3 53.3 Other Products 4.4 4.1 -6.8 4.1 3.9 -4.9 4.0 4.1 2.5 3.9 4.3 10.3 4.3 3.4 -20.9 Total Products 33.6 36.5 8.6 29.7 35.1 18.2 29.2 35.4 21.2 28.5 36.2 27.0 31.1 32.0 2.9 Other3 8.4 9.1 8.3 7.5 8.2 9.3 7.4 8.2 10.8 7.8 7.6 -2.6 7.7 6.5 -15.6
Total 56.0 57.2 2.1 48.2 57.2 18.7 53.4 53.0 -0.7 53.6 57.1 6.5 50.7 50.9 0.4 United KingdomCrude 27.8 28.5 2.5 26.2 27.7 5.7 28.6 27.8 -2.8 27.6 26.1 -5.4 28.7 27.9 -2.8 Motor Gasoline 8.9 9.3 4.5 9.3 9.9 6.5 9.4 10.4 10.6 9.2 10.7 16.3 9.1 11.3 24.2 Middle Distillate 27.5 32.0 16.4 25.3 30.3 19.8 25.9 32.5 25.5 28.3 30.6 8.1 27.3 30.7 12.5 Residual Fuel Oil 1.3 1.8 38.5 1.4 1.2 -14.3 1.4 1.1 -21.4 1.3 1.1 -15.4 1.3 1.2 -7.7 Other Products 7.2 7.2 0.0 7.0 6.4 -8.6 7.1 6.5 -8.5 6.7 6.4 -4.5 7.0 6.8 -2.9 Total Products 44.9 50.3 12.0 43.0 47.8 11.2 43.8 50.5 15.3 45.5 48.8 7.3 44.7 50.0 11.9 Other3 9.7 7.3 -24.7 9.0 7.8 -13.3 9.0 8.5 -5.6 8.7 8.7 0.0 7.9 7.4 -6.3
Total 82.4 86.1 4.5 78.2 83.3 6.5 81.4 86.8 6.6 81.8 83.6 2.2 81.3 85.3 4.9 Canada4
Crude 122.3 130.9 7.0 122.2 129.0 5.6 119.0 128.1 7.6 125.5 131.3 4.6 125.3 132.6 5.8 Motor Gasoline 14.7 14.3 -2.7 14.5 15.0 3.4 14.7 15.6 6.1 14.8 16.2 9.5 15.3 15.9 3.9 Middle Distillate 15.8 11.6 -26.6 14.4 10.6 -26.4 12.9 11.7 -9.3 11.5 11.9 3.5 12.0 13.0 8.3 Residual Fuel Oil 1.5 2.7 80.0 1.8 3.0 66.7 1.7 2.7 58.8 1.9 2.6 36.8 2.4 2.3 -4.2 Other Products 10.0 8.6 -14.0 9.8 8.1 -17.3 9.4 8.4 -10.6 9.4 8.6 -8.5 9.0 8.0 -11.1 Total Products 42.0 37.2 -11.4 40.5 36.7 -9.4 38.7 38.4 -0.8 37.6 39.3 4.5 38.7 39.2 1.3 Other3 23.8 30.9 29.8 22.8 30.0 31.6 22.6 30.3 34.1 19.6 29.4 50.0 17.4 29.9 71.8
Total 188.1 199.0 5.8 185.5 195.7 5.5 180.3 196.8 9.2 182.7 200.0 9.5 181.4 201.7 11.2 1 Stocks are primary national territory stocks on land (excluding utilitity stocks and including pipeline and entrepot stocks where known) and include stocks held by industry to meet IEA, EU and national emergency reserve commitments and are subject to government control in emergencies.2 US figures exclude US territories.3 Other includes NGLs, refinery feedstocks, additives/oxygenates and other hydrocarbons.4 Canadian stock information for recent months is the administration's best estimate. Data are usually finalised three months after first publication.
Table 4aINDUSTRY STOCKS1
ON LAND IN SELECTED COUNTRIES(million barrels)
Oil Market Report Tables
Page | 25 17 March 2021 IEA
. All
right
s re
serv
ed.
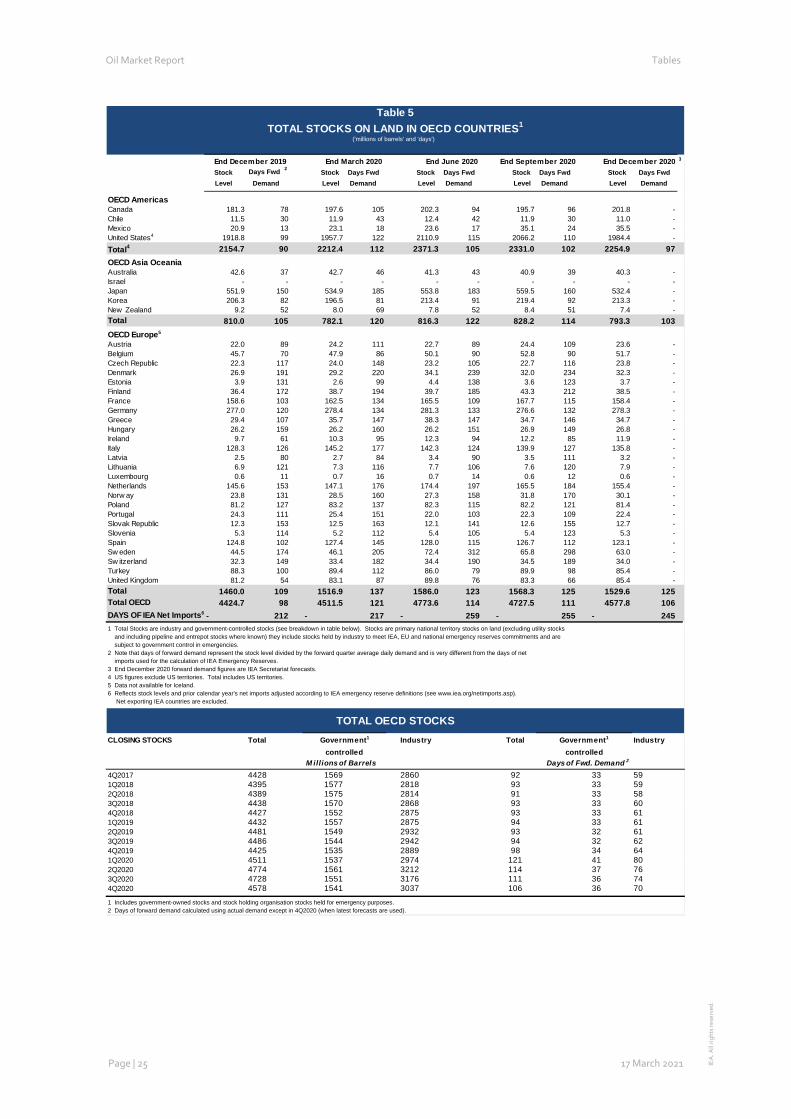
Table 5: Total Stocks on Land in OECD Countries
3
Stock Days Fwd 2Stock Days Fwd Stock Days Fwd Stock Days Fwd Stock Days Fwd
Level Demand Level Demand Level Demand Level Demand Level Demand
OECD AmericasCanada 181.3 78 197.6 105 202.3 94 195.7 96 201.8 -Chile 11.5 30 11.9 43 12.4 42 11.9 30 11.0 -Mexico 20.9 13 23.1 18 23.6 17 35.1 24 35.5 -United States4 1918.8 99 1957.7 122 2110.9 115 2066.2 110 1984.4 -Total4 2154.7 90 2212.4 112 2371.3 105 2331.0 102 2254.9 97OECD Asia OceaniaAustralia 42.6 37 42.7 46 41.3 43 40.9 39 40.3 -Israel - - - - - - - - - -Japan 551.9 150 534.9 185 553.8 183 559.5 160 532.4 -Korea 206.3 82 196.5 81 213.4 91 219.4 92 213.3 -New Zealand 9.2 52 8.0 69 7.8 52 8.4 51 7.4 -Total 810.0 105 782.1 120 816.3 122 828.2 114 793.3 103OECD Europe5
Austria 22.0 89 24.2 111 22.7 89 24.4 109 23.6 -Belgium 45.7 70 47.9 86 50.1 90 52.8 90 51.7 -Czech Republic 22.3 117 24.0 148 23.2 105 22.7 116 23.8 -Denmark 26.9 191 29.2 220 34.1 239 32.0 234 32.3 -Estonia 3.9 131 2.6 99 4.4 138 3.6 123 3.7 -Finland 36.4 172 38.7 194 39.7 185 43.3 212 38.5 -France 158.6 103 162.5 134 165.5 109 167.7 115 158.4 -Germany 277.0 120 278.4 134 281.3 133 276.6 132 278.3 -Greece 29.4 107 35.7 147 38.3 147 34.7 146 34.7 -Hungary 26.2 159 26.2 160 26.2 151 26.9 149 26.8 -Ireland 9.7 61 10.3 95 12.3 94 12.2 85 11.9 -Italy 128.3 126 145.2 177 142.3 124 139.9 127 135.8 -Latvia 2.5 80 2.7 84 3.4 90 3.5 111 3.2 -Lithuania 6.9 121 7.3 116 7.7 106 7.6 120 7.9 -Luxembourg 0.6 11 0.7 16 0.7 14 0.6 12 0.6 -Netherlands 145.6 153 147.1 176 174.4 197 165.5 184 155.4 -Norw ay 23.8 131 28.5 160 27.3 158 31.8 170 30.1 -Poland 81.2 127 83.2 137 82.3 115 82.2 121 81.4 -Portugal 24.3 111 25.4 151 22.0 103 22.3 109 22.4 -Slovak Republic 12.3 153 12.5 163 12.1 141 12.6 155 12.7 -Slovenia 5.3 114 5.2 112 5.4 105 5.4 123 5.3 -Spain 124.8 102 127.4 145 128.0 115 126.7 112 123.1 -Sw eden 44.5 174 46.1 205 72.4 312 65.8 298 63.0 -Sw itzerland 32.3 149 33.4 182 34.4 190 34.5 189 34.0 -Turkey 88.3 100 89.4 112 86.0 79 89.9 98 85.4 -United Kingdom 81.2 54 83.1 87 89.8 76 83.3 66 85.4 -Total 1460.0 109 1516.9 137 1586.0 123 1568.3 125 1529.6 125Total OECD 4424.7 98 4511.5 121 4773.6 114 4727.5 111 4577.8 106DAYS OF IEA Net Imports6 - 212 - 217 - 259 - 255 - 2451 Total Stocks are industry and government-controlled stocks (see breakdown in table below). Stocks are primary national territory stocks on land (excluding utility stocks and including pipeline and entrepot stocks where known) they include stocks held by industry to meet IEA, EU and national emergency reserves commitments and are subject to government control in emergencies.2 Note that days of forward demand represent the stock level divided by the forward quarter average daily demand and is very different from the days of net imports used for the calculation of IEA Emergency Reserves.3 End December 2020 forward demand figures are IEA Secretariat forecasts. 4 US figures exclude US territories. Total includes US territories.5 Data not available for Iceland.6 Reflects stock levels and prior calendar year's net imports adjusted according to IEA emergency reserve definitions (see www.iea.org/netimports.asp). Net exporting IEA countries are excluded.
CLOSING STOCKS Total Industry Total Industry
4Q2017 4428 1569 2860 92 33 591Q2018 4395 1577 2818 93 33 592Q2018 4389 1575 2814 91 33 583Q2018 4438 1570 2868 93 33 604Q2018 4427 1552 2875 93 33 611Q2019 4432 1557 2875 94 33 612Q2019 4481 1549 2932 93 32 613Q2019 4486 1544 2942 94 32 624Q2019 4425 1535 2889 98 34 641Q2020 4511 1537 2974 121 41 802Q2020 4774 1561 3212 114 37 763Q2020 4728 1551 3176 111 36 744Q2020 4578 1541 3037 106 36 70
1 Includes government-owned stocks and stock holding organisation stocks held for emergency purposes.2 Days of forward demand calculated using actual demand except in 4Q2020 (when latest forecasts are used).
Government1
controlledGovernment1
('millions of barrels' and 'days')
TOTAL OECD STOCKS
Table 5TOTAL STOCKS ON LAND IN OECD COUNTRIES1
controlledDays of Fwd. Demand 2
End December 2020End March 2020 End December 2019 End June 2020 End September 2020
M illions of Barrels

Oil Market Report Tables
Page | 26 17 March 2021 IEA
. All
right
s re
serv
ed.
Table 6: IEA Member Country Destinations of Selected Crude Streams
2018 2019 2020 1Q20 2Q20 3Q20 4Q20 Oct 20 Nov 20 Dec 20 Dec 19 change
Saudi Light & Extra LightAmericas 0.66 0.20 0.26 0.49 0.41 0.03 0.11 0.06 0.26 0.02 0.43 -0.42Europe 0.69 0.68 0.59 0.56 0.79 0.50 0.53 0.52 0.55 0.53 0.54 -0.01Asia Oceania 1.45 1.42 1.39 1.41 1.36 1.34 1.44 1.41 1.35 1.57 1.36 0.21
Saudi MediumAmericas 0.30 0.12 0.14 0.06 0.39 0.06 0.03 0.09 - - - -Europe 0.01 0.02 0.02 0.05 0.03 0.01 0.01 0.02 - 0.00 0.02 -0.02Asia Oceania 0.41 0.23 0.25 0.22 0.26 0.25 0.26 0.27 0.23 0.27 0.15 0.12
Canada HeavyAmericas 2.41 2.27 2.39 2.64 2.14 2.23 2.55 2.56 2.64 2.47 2.59 -0.12Europe 0.04 0.04 0.03 0.04 0.02 0.03 0.03 0.01 0.03 0.06 0.08 -0.02Asia Oceania 0.00 0.00 0.00 - - 0.01 - - - - - -
Iraqi Basrah Light2
Americas 0.50 0.31 0.11 0.26 0.05 0.07 0.05 0.08 - 0.08 0.36 -0.28Europe 0.76 0.85 0.58 0.62 0.60 0.54 0.54 0.53 0.70 0.38 0.56 -0.18Asia Oceania 0.43 0.37 0.22 0.27 0.20 0.23 0.20 0.11 0.16 0.34 0.44 -0.10
Kuwait BlendAmericas 0.02 - - - - - - - - - - -Europe 0.13 0.11 0.04 0.08 0.09 0.01 - - - - 0.13 -Asia Oceania 0.66 0.61 0.55 0.63 0.67 0.43 0.47 0.48 0.47 0.47 0.57 -0.10
Iranian LightAmericas - - - - - - - - - - - -Europe 0.16 0.00 - - - - - - - - - -Asia Oceania 0.01 0.00 - - - - - - - - - -
Iranian Heavy3
Americas - - - - - - - - - - - -Europe 0.35 0.04 - - - - - - - - - -Asia Oceania 0.28 0.14 - - - - - - - - - -
BFOEAmericas 0.00 0.00 - - - - - - - - - -Europe 0.35 0.37 0.43 0.48 0.32 0.48 0.43 0.40 0.33 0.54 0.57 -0.03Asia Oceania 0.09 0.01 0.03 - 0.02 0.06 0.03 0.07 - 0.03 - -
KazakhstanAmericas - - - - - - - - - - - -Europe 0.75 0.76 0.75 0.80 0.69 0.76 0.74 0.74 0.77 0.71 0.66 0.05Asia Oceania 0.19 0.18 0.07 0.10 0.07 0.08 0.03 - 0.04 0.07 0.14 -0.07
Venezuelan 22 API and heavierAmericas 0.44 0.05 - - - - - - - - - -Europe 0.03 0.09 0.04 0.03 0.04 0.08 0.01 0.03 - - 0.08 -Asia Oceania - - - - - - - - - - - -
Mexican MayaAmericas 0.63 0.51 0.48 0.55 0.53 0.47 0.37 0.30 0.42 0.39 0.52 -0.13Europe 0.21 0.19 0.16 0.13 0.15 0.16 0.18 0.15 0.19 0.20 0.19 0.01Asia Oceania 0.08 0.13 0.12 0.14 0.10 0.10 0.16 0.20 0.09 0.18 0.15 0.03
Russian UralsAmericas 0.01 0.01 - - - - - - - - - -Europe 1.40 1.37 1.15 1.40 1.10 1.04 1.07 1.18 0.91 1.12 1.12 0.00Asia Oceania 0.00 - - - - - - - - - - -
Cabinda and Other AngolaNorth America 0.06 0.01 0.01 - 0.03 - - - - - - -Europe 0.14 0.15 0.12 0.18 0.11 0.09 0.10 0.16 0.07 0.06 0.11 -0.05Pacific 0.01 0.00 - - - - - - - - - -
Nigerian Light4
Americas 0.01 0.03 - - - - - - - - - -Europe 0.53 0.51 0.49 0.50 0.39 0.57 0.52 0.46 0.59 0.50 0.38 0.13Asia Oceania 0.02 0.02 0.02 0.04 0.01 0.01 0.02 0.03 0.02 0.01 0.05 -0.04
Libya Light and MediumAmericas - 0.00 - - - - - - - - - -Europe 0.62 0.67 0.19 0.20 0.03 0.04 0.49 0.11 0.49 0.87 0.75 0.12Asia Oceania 0.02 0.03 0.01 0.04 - - - - - - - -1 Data based on monthly submissions from IEA countries to the crude oil import register (in '000 bbl), subject to availability. May differ from Table 8 of the Report. IEA Americas includes United States and Canada. IEA Europe includes all countries in OECD Europe except Estonia, Hungary, Slovenia and Latvia. IEA Asia Oceania includes Australia, New Zealand, Korea and Japan.2 Iraqi Total minus Kirkuk.3 Iranian Total minus Iranian Light.4 33° API and lighter (e.g., Bonny Light, Escravos, Qua Iboe and Oso Condensate).
Year Earlier
Table 6IEA MEMBER COUNTRY DESTINATIONS OF SELECTED CRUDE STREAMS1
(million barrels per day)

Oil Market Report Tables
Page | 27 17 March 2021 IEA
. All
right
s re
serv
ed.
Table 7: Regional OECD Imports 2017 2018 2019 1Q20 2Q20 3Q20 4Q20 Oct 20 Nov 20 Dec 20 Dec 19 % change
Crude Oil Americas 4361 3759 2698 2097 2134 1671 1625 1721 1610 1543 2434 -37%Europe 9902 9814 9872 9309 7883 8214 8051 7824 8283 8053 9291 -13%Asia Oceania 6849 6697 6542 6372 5298 5237 5511 5462 5029 6027 6889 -13%
Total OECD 21112 20269 19111 17779 15315 15122 15187 15007 14923 15624 18613 -16%
LPGAmericas 20 22 26 31 28 26 115 14 27 301 27 1000%Europe 432 457 434 533 305 430 429 470 401 414 410 1%Asia Oceania 551 553 582 647 551 532 506 495 509 515 684 -25%
Total OECD 1003 1032 1042 1210 884 988 1050 979 936 1230 1121 10%
NaphthaAmericas 19 8 5 7 7 10 5 6 7 4 3 30%Europe 369 391 347 421 466 289 398 390 347 456 453 1%Asia Oceania 978 1021 993 1109 1044 981 889 740 926 1001 1128 -11%
Total OECD 1366 1420 1345 1536 1517 1280 1292 1135 1280 1461 1584 -8%
Gasoline3
Americas 727 773 817 507 499 695 727 551 564 1062 595 78%Europe 153 110 112 112 123 59 108 106 83 135 86 57%Asia Oceania 102 113 114 103 111 175 115 126 103 115 109 6%
Total OECD 983 996 1043 722 734 929 950 784 750 1311 789 66%
Jet & KeroseneAmericas 171 140 175 164 146 175 157 163 146 163 180 -10%Europe 504 509 520 424 325 311 295 457 174 249 404 -38%Asia Oceania 80 89 76 119 35 41 57 25 58 89 103 -14%
Total OECD 755 738 771 706 506 527 510 646 378 501 686 -27%
Gasoil/DieselAmericas 77 124 118 77 115 91 331 176 237 577 166 247%Europe 1337 1339 1300 1263 1218 1125 1184 1328 1026 1193 1097 9%Asia Oceania 196 253 262 281 346 365 323 312 357 302 266 13%
Total OECD 1610 1716 1680 1622 1679 1581 1838 1817 1619 2071 1529 35%
Heavy Fuel OilAmericas 131 161 116 156 153 136 131 189 146 58 104 -44%Europe 233 197 223 283 267 343 310 388 394 151 217 -30%Asia Oceania 146 162 101 108 46 118 80 63 107 71 141 -50%
Total OECD 510 520 440 546 466 596 521 639 648 280 461 -39%
Other ProductsAmericas 717 679 713 704 542 606 515 557 584 406 807 -50%Europe 1012 1011 865 665 601 553 491 414 565 497 676 -26%Asia Oceania 263 263 268 288 215 229 232 234 278 185 292 -37%
Total OECD 1991 1952 1846 1656 1359 1388 1238 1204 1427 1089 1775 -39%
Total ProductsAmericas 1862 1908 1971 1645 1491 1739 1981 1655 1709 2571 1882 37%Europe 4040 4013 3800 3701 3305 3110 3215 3553 2991 3094 3341 -7%Asia Oceania 2316 2454 2397 2654 2349 2440 2203 1996 2338 2278 2723 -16%
Total OECD 8218 8374 8168 8000 7145 7289 7399 7204 7038 7944 7946 0%
Total OilAmericas 6223 5666 4669 3742 3625 3410 3606 3376 3319 4114 4316 -5%Europe 13942 13827 13672 13010 11188 11325 11266 11378 11274 11148 12631 -12%Asia Oceania 9164 9151 8939 9027 7647 7677 7714 7458 7368 8305 9612 -14%
Total OECD 29330 28644 27279 25778 22460 22411 22586 22211 21961 23567 26559 -11%
1 Based on Monthly Oil Questionnaire data submitted by OECD countries in tonnes and converted to barrels. 2 Excludes intra-regional trade.3 Includes additives.
Year Earlier
Table 7REGIONAL OECD IMPORTS1,2
(thousand barrels per day)
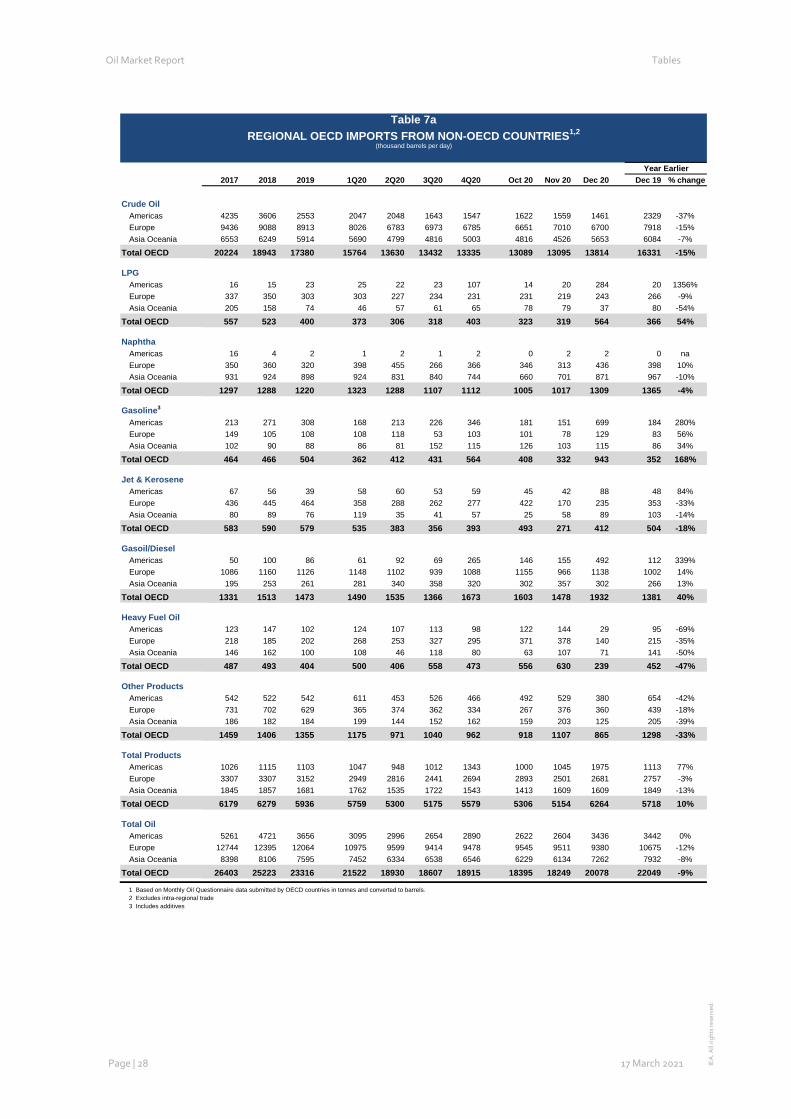
Oil Market Report Tables
Page | 28 17 March 2021 IEA
. All
right
s re
serv
ed.
Table 7a: Regional OECD Imports From Non- OECD Countries
Year Earlier2017 2018 2019 1Q20 2Q20 3Q20 4Q20 Oct 20 Nov 20 Dec 20 Dec 19 % change
Crude Oil Americas 4235 3606 2553 2047 2048 1643 1547 1622 1559 1461 2329 -37%Europe 9436 9088 8913 8026 6783 6973 6785 6651 7010 6700 7918 -15%Asia Oceania 6553 6249 5914 5690 4799 4816 5003 4816 4526 5653 6084 -7%
Total OECD 20224 18943 17380 15764 13630 13432 13335 13089 13095 13814 16331 -15%
LPGAmericas 16 15 23 25 22 23 107 14 20 284 20 1356%Europe 337 350 303 303 227 234 231 231 219 243 266 -9%Asia Oceania 205 158 74 46 57 61 65 78 79 37 80 -54%
Total OECD 557 523 400 373 306 318 403 323 319 564 366 54%
NaphthaAmericas 16 4 2 1 2 1 2 0 2 2 0 naEurope 350 360 320 398 455 266 366 346 313 436 398 10%Asia Oceania 931 924 898 924 831 840 744 660 701 871 967 -10%
Total OECD 1297 1288 1220 1323 1288 1107 1112 1005 1017 1309 1365 -4%
Gasoline3
Americas 213 271 308 168 213 226 346 181 151 699 184 280%Europe 149 105 108 108 118 53 103 101 78 129 83 56%Asia Oceania 102 90 88 86 81 152 115 126 103 115 86 34%
Total OECD 464 466 504 362 412 431 564 408 332 943 352 168%
Jet & KeroseneAmericas 67 56 39 58 60 53 59 45 42 88 48 84%Europe 436 445 464 358 288 262 277 422 170 235 353 -33%Asia Oceania 80 89 76 119 35 41 57 25 58 89 103 -14%
Total OECD 583 590 579 535 383 356 393 493 271 412 504 -18%
Gasoil/DieselAmericas 50 100 86 61 92 69 265 146 155 492 112 339%Europe 1086 1160 1126 1148 1102 939 1088 1155 966 1138 1002 14%Asia Oceania 195 253 261 281 340 358 320 302 357 302 266 13%
Total OECD 1331 1513 1473 1490 1535 1366 1673 1603 1478 1932 1381 40%
Heavy Fuel OilAmericas 123 147 102 124 107 113 98 122 144 29 95 -69%Europe 218 185 202 268 253 327 295 371 378 140 215 -35%Asia Oceania 146 162 100 108 46 118 80 63 107 71 141 -50%
Total OECD 487 493 404 500 406 558 473 556 630 239 452 -47%
Other ProductsAmericas 542 522 542 611 453 526 466 492 529 380 654 -42%Europe 731 702 629 365 374 362 334 267 376 360 439 -18%Asia Oceania 186 182 184 199 144 152 162 159 203 125 205 -39%
Total OECD 1459 1406 1355 1175 971 1040 962 918 1107 865 1298 -33%
Total ProductsAmericas 1026 1115 1103 1047 948 1012 1343 1000 1045 1975 1113 77%Europe 3307 3307 3152 2949 2816 2441 2694 2893 2501 2681 2757 -3%Asia Oceania 1845 1857 1681 1762 1535 1722 1543 1413 1609 1609 1849 -13%
Total OECD 6179 6279 5936 5759 5300 5175 5579 5306 5154 6264 5718 10%
Total OilAmericas 5261 4721 3656 3095 2996 2654 2890 2622 2604 3436 3442 0%Europe 12744 12395 12064 10975 9599 9414 9478 9545 9511 9380 10675 -12%Asia Oceania 8398 8106 7595 7452 6334 6538 6546 6229 6134 7262 7932 -8%
Total OECD 26403 25223 23316 21522 18930 18607 18915 18395 18249 20078 22049 -9%
1 Based on Monthly Oil Questionnaire data submitted by OECD countries in tonnes and converted to barrels. 2 Excludes intra-regional trade3 Includes additives
Table 7aREGIONAL OECD IMPORTS FROM NON-OECD COUNTRIES1,2
(thousand barrels per day)
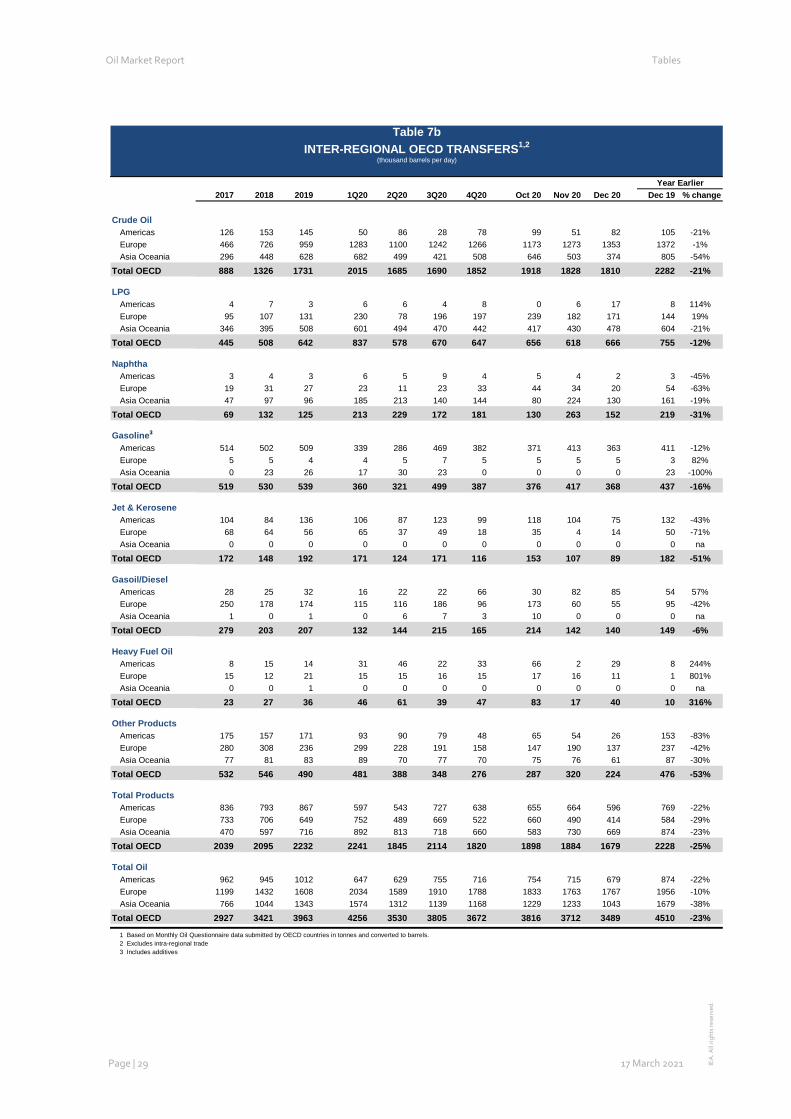
Oil Market Report Tables
Page | 29 17 March 2021 IEA
. All
right
s re
serv
ed.
Table 7b: Inter-Regional OECD Transfers Year Earlier
2017 2018 2019 1Q20 2Q20 3Q20 4Q20 Oct 20 Nov 20 Dec 20 Dec 19 % change
Crude Oil Americas 126 153 145 50 86 28 78 99 51 82 105 -21%Europe 466 726 959 1283 1100 1242 1266 1173 1273 1353 1372 -1%Asia Oceania 296 448 628 682 499 421 508 646 503 374 805 -54%
Total OECD 888 1326 1731 2015 1685 1690 1852 1918 1828 1810 2282 -21%
LPGAmericas 4 7 3 6 6 4 8 0 6 17 8 114%Europe 95 107 131 230 78 196 197 239 182 171 144 19%Asia Oceania 346 395 508 601 494 470 442 417 430 478 604 -21%
Total OECD 445 508 642 837 578 670 647 656 618 666 755 -12%
NaphthaAmericas 3 4 3 6 5 9 4 5 4 2 3 -45%Europe 19 31 27 23 11 23 33 44 34 20 54 -63%Asia Oceania 47 97 96 185 213 140 144 80 224 130 161 -19%
Total OECD 69 132 125 213 229 172 181 130 263 152 219 -31%
Gasoline3
Americas 514 502 509 339 286 469 382 371 413 363 411 -12%Europe 5 5 4 4 5 7 5 5 5 5 3 82%Asia Oceania 0 23 26 17 30 23 0 0 0 0 23 -100%
Total OECD 519 530 539 360 321 499 387 376 417 368 437 -16%
Jet & KeroseneAmericas 104 84 136 106 87 123 99 118 104 75 132 -43%Europe 68 64 56 65 37 49 18 35 4 14 50 -71%Asia Oceania 0 0 0 0 0 0 0 0 0 0 0 na
Total OECD 172 148 192 171 124 171 116 153 107 89 182 -51%
Gasoil/DieselAmericas 28 25 32 16 22 22 66 30 82 85 54 57%Europe 250 178 174 115 116 186 96 173 60 55 95 -42%Asia Oceania 1 0 1 0 6 7 3 10 0 0 0 na
Total OECD 279 203 207 132 144 215 165 214 142 140 149 -6%
Heavy Fuel OilAmericas 8 15 14 31 46 22 33 66 2 29 8 244%Europe 15 12 21 15 15 16 15 17 16 11 1 801%Asia Oceania 0 0 1 0 0 0 0 0 0 0 0 na
Total OECD 23 27 36 46 61 39 47 83 17 40 10 316%
Other ProductsAmericas 175 157 171 93 90 79 48 65 54 26 153 -83%Europe 280 308 236 299 228 191 158 147 190 137 237 -42%Asia Oceania 77 81 83 89 70 77 70 75 76 61 87 -30%
Total OECD 532 546 490 481 388 348 276 287 320 224 476 -53%
Total ProductsAmericas 836 793 867 597 543 727 638 655 664 596 769 -22%Europe 733 706 649 752 489 669 522 660 490 414 584 -29%Asia Oceania 470 597 716 892 813 718 660 583 730 669 874 -23%
Total OECD 2039 2095 2232 2241 1845 2114 1820 1898 1884 1679 2228 -25%
Total OilAmericas 962 945 1012 647 629 755 716 754 715 679 874 -22%Europe 1199 1432 1608 2034 1589 1910 1788 1833 1763 1767 1956 -10%Asia Oceania 766 1044 1343 1574 1312 1139 1168 1229 1233 1043 1679 -38%
Total OECD 2927 3421 3963 4256 3530 3805 3672 3816 3712 3489 4510 -23%
1 Based on Monthly Oil Questionnaire data submitted by OECD countries in tonnes and converted to barrels. 2 Excludes intra-regional trade3 Includes additives
Table 7bINTER-REGIONAL OECD TRANSFERS1,2
(thousand barrels per day)

Oil Market Report Tables
Page | 30 17 March 2021 IEA
. All
right
s re
serv
ed.
Table 8: Regional OECD Crude Imports by Source
Year Earlier2018 2019 2020 1Q20 2Q20 3Q20 4Q20 Oct 20 Nov 20 Dec 20 Dec 19 change
OECD AmericasVenezuela 506 81 - - - - - - - - - -Other Central & South America 795 867 745 823 625 782 750 703 678 865 850 15North Sea 150 143 60 50 83 28 78 99 51 82 105 -22Other OECD Europe 1 2 1 - 4 - - - - - - -Non-OECD Europe - - - - - - - - - - - -Former Soviet Union 145 189 91 146 42 80 96 145 79 62 169 -107Saudi Arabia 983 601 572 545 1015 441 293 375 373 133 520 -387Kuwait 78 45 21 37 - 29 16 25 24 - 38 -Iran - - - - - - - - - - - -Iraq 519 331 177 284 176 143 107 121 111 89 386 -297Oman - - - - - - - - - - - -United Arab Emirates 5 3 5 - 9 2 10 31 - - - -Other Middle East - - - - - - - - - - - -West Africa2 317 267 145 118 146 128 188 169 241 156 216 -60Other Africa 196 137 45 56 24 34 67 21 54 125 54 71Asia 61 32 17 40 12 4 11 32 - - 96 -Other 3 0 3 - - - 10 - - 31 - -
Total 3759 2698 1880 2097 2134 1671 1625 1721 1610 1543 2434 -891of which Non-OECD 3606 2553 1820 2047 2048 1643 1547 1622 1559 1461 2329 -868
OECD EuropeCanada 81 60 95 115 67 81 118 108 92 152 128 24Mexico + USA 645 900 1128 1167 1033 1161 1149 1065 1181 1202 1245 -43Venezuela 57 106 44 33 40 91 13 38 - - 87 -Other Central & South America 132 118 208 229 151 248 205 203 164 247 191 55Non-OECD Europe 12 14 25 34 13 21 34 54 20 27 29 -2Former Soviet Union 4149 4240 3515 4131 3217 3446 3270 3395 3316 3100 3765 -665Saudi Arabia 818 792 756 716 1071 637 602 585 673 550 614 -63Kuwait 137 97 61 90 64 61 30 - 4 85 82 3Iran 536 74 5 18 - 1 2 2 3 - - -Iraq 962 1124 813 828 847 819 759 757 910 615 845 -231Oman - - - - - - - - - - - -United Arab Emirates 2 2 - - - - - - - - - -Other Middle East - 3 8 - 16 13 1 2 - - - -West Africa2 1115 1140 1076 1317 876 1134 976 1103 1010 817 1007 -190Other Africa 1161 1180 593 599 474 442 858 488 839 1245 1262 -17Asia - - 0 - - 1 - - - - - -Other 9 13 13 10 17 19 5 14 - 1 35 -34
Total 9816 9863 8340 9287 7886 8174 8020 7814 8212 8041 9291 -1250of which Non-OECD 9088 8913 7140 8026 6783 6973 6785 6651 7010 6700 7918 -1219
OECD Asia OceaniaCanada 3 5 1 - - 6 - - - - - -Mexico + USA 344 613 477 674 457 336 444 578 404 348 781 -433Venezuela - - - - - - - - - - - -Other Central & South America 35 48 91 79 96 75 114 131 89 121 49 72North Sea 100 10 49 8 42 79 64 68 99 26 24 2Other OECD Europe - - - - - - - - - - - -Non-OECD Europe - - - - - - - - - - - -Former Soviet Union 435 435 300 402 218 286 295 234 347 304 402 -98Saudi Arabia 2040 1878 1867 1844 1790 1858 1976 1964 1831 2128 1768 360Kuwait 672 666 584 668 704 459 508 514 503 507 622 -115Iran 274 137 - - - - - - - - - -Iraq 435 364 224 267 201 226 205 111 160 342 444 -103Oman 56 59 22 35 - 35 19 39 17 - 43 -United Arab Emirates 1098 1256 1096 1434 1018 975 960 1001 779 1095 1412 -317Other Middle East 450 449 387 454 345 374 374 293 423 406 577 -172West Africa2 95 56 65 96 46 70 49 53 25 67 71 -4Other Africa 105 90 42 79 26 40 23 23 24 23 136 -113Non-OECD Asia 319 220 161 198 109 128 207 212 201 208 208 1Other 235 255 234 134 245 290 268 239 117 442 353 90
Total 6697 6542 5602 6372 5298 5237 5505 5462 5020 6018 6889 -871of which Non-OECD 6249 5914 5076 5690 4799 4816 5003 4816 4526 5653 6084 -430
Total OECD Trade 20271 19103 15823 17757 15318 15081 15150 14996 14842 15601 18613 -3011of which Non-OECD 18943 17380 14036 15764 13630 13432 13335 13089 13095 13814 16331 -25171 Based on Monthly Oil Questionnaire data submitted by OECD countries in tonnes, and converted to barrels at 7.37 barrels per tonne. Data will differ from Table 6 which is based on submissions in barrels.2 West Africa includes Angola, Nigeria, Gabon, Equatorial Guniea, Congo and Democratic Republic of Congo.
Table 8REGIONAL OECD CRUDE IMPORTS BY SOURCE1
(thousand barrels per day)

Oil Market Report Tables
Page | 31 17 March 2021 IEA
. All
right
s re
serv
ed.
Table 9: Regional OECD Gasoline Imports by Source
Year Earlier2018 2019 2020 1Q20 2Q20 3Q20 4Q20 Oct 20 Nov 20 Dec 20 Dec 19 change
OECD AmericasVenezuela 23 4 - - - - - - - - - -Other Central & South America 64 83 40 28 65 44 24 14 28 29 41 -12ARA (Belgium Germany Netherlands) 167 189 141 119 126 199 122 75 162 129 129 1Other Europe 323 293 207 201 131 255 241 289 221 213 283 -70FSU 80 100 67 57 49 71 89 82 81 105 100 4Saudi Arabia 11 7 6 4 6 16 - - - - - -Algeria 1 - 4 10 2 5 - - - - - -Other Middle East & Africa 19 14 13 9 8 15 20 51 5 3 7 -4Singapore 8 5 1 - 2 3 - - - - - -OECD Asia Oceania 13 28 21 21 30 15 19 7 30 22 - -Non-OECD Asia (excl. Singapore) 84 116 71 63 88 84 46 54 60 26 69 -42Other 0 0 46 - - - 185 - - 548 - -
Total2 794 838 619 512 508 707 747 572 588 1075 628 448of which Non-OECD 271 308 238 168 213 226 346 181 151 699 184 515
OECD EuropeOECD Americas 4 3 4 2 4 5 4 5 2 4 2 2Venezuela 0 0 0 - 1 - - - - - - -Other Central & South America 5 3 3 7 1 0 5 1 10 3 0 2Non-OECD Europe 11 18 18 21 15 23 12 14 6 15 14 1FSU 70 62 44 57 51 27 41 13 19 89 50 39Saudi Arabia 2 0 7 - 7 - 21 64 - - - -Algeria 0 0 1 - 3 - - - - - - -Other Middle East & Africa 4 8 4 3 5 5 3 2 1 6 13 -7Singapore 2 3 2 2 1 2 1 2 - - 2 -OECD Asia Oceania 1 1 1 1 1 1 1 - 3 1 1 0Non-OECD Asia (excl. Singapore) 2 0 0 0 0 - 2 - 4 2 0 1Other 20 21 27 28 46 9 27 11 43 27 13 14
Total2 122 121 111 122 134 73 116 112 89 146 96 50of which Non-OECD 105 108 95 108 118 53 103 101 78 129 83 46
OECD Asia OceaniaOECD Americas 4 6 4 8 8 0 0 0 0 0 - -Venezuela - - - - - - - - - - - -Other Central & South America - - - - - - - - - - - -ARA (Belgium Germany Netherlands) 13 14 4 9 1 6 - - - - 23 -Other Europe 7 5 10 1 22 17 - - - - - -FSU 1 0 2 1 7 - - - - - - -Saudi Arabia 0 1 - - - - - - - - - -Algeria - - - - - - - - - - - -Other Middle East & Africa 1 - 1 - - 3 - - - - - -Singapore 49 46 51 49 40 72 43 36 52 42 44 -2Non-OECD Asia (excl. Singapore) 19 21 37 18 21 55 52 71 32 54 23 31Other 20 21 19 20 20 19 19 19 20 19 19 0
Total2 114 114 128 104 118 173 115 126 103 115 109 6of which Non-OECD 90 88 109 86 81 152 115 126 103 115 86 29
Total OECD Trade2 1029 1073 858 738 760 954 978 811 780 1337 832 504of which Non-OECD 466 504 443 362 412 431 564 408 332 943 352 5901 Based on Monthly Oil Questionnaire data submitted by OECD countries in tonnes.2 Total figure excludes intra-regional trade.
Table 9REGIONAL OECD GASOLINE IMPORTS BY SOURCE1
(thousand barrels per day)

Oil Market Report Tables
Page | 32 17 March 2021 IEA
. All
right
s re
serv
ed.
Table 10: Regional OECD Gasoil/Diesel Imports by Source
2018 2019 2020 1Q20 2Q20 3Q20 4Q20 Oct 20 Nov 20 Dec 20 Dec 19 change
OECD AmericasVenezuela 4 1 - - - - - - - - - -Other Central and South America 30 38 34 25 34 40 39 46 34 36 39 -3ARA (Belgium Germany Netherlands) 6 5 11 7 - 2 36 25 39 45 43 1Other Europe 3 2 5 1 11 2 4 5 5 3 3 1FSU 16 6 12 1 22 - 26 15 42 22 22 0Saudi Arabia 17 3 8 3 - 10 17 2 2 46 - -Algeria - - - - - - - - - - - -Other Middle East and Africa 8 2 9 4 - 4 29 25 25 37 - -Singapore 1 0 - - - - - - - - - -OECD Asia Oceania 15 24 16 8 11 18 25 0 38 37 8 29Non-OECD Asia (excl. Singapore) 23 30 34 28 31 13 64 54 50 87 51 37Other - 7 25 - 6 3 90 4 2 263 - -
Total2 124 118 154 77 115 91 331 176 237 577 166 411of which Non-OECD 100 86 122 61 92 69 265 146 155 492 112 380
OECD EuropeOECD Americas 154 138 98 89 84 153 64 134 32 26 65 -39Venezuela - - - - - - - - - - - -Other Central and South America 4 0 3 2 1 7 2 4 2 1 - -Non-OECD Europe 39 41 30 27 27 34 33 31 36 31 36 -5FSU 714 685 661 816 630 562 637 556 621 734 641 93Saudi Arabia 225 205 197 113 222 192 262 335 231 219 161 58Algeria - 0 2 - 7 - - - - - - -Other Middle East and Africa 76 83 71 79 65 67 74 81 74 66 61 5Singapore 14 27 17 16 29 10 13 19 16 3 17 -14OECD Asia Oceania 25 36 31 27 32 33 32 39 28 29 30 -1Non-OECD Asia (excl. Singapore) 151 152 103 150 95 78 89 104 68 93 147 -54Other 12 10 17 -21 61 17 10 52 -46 24 8 16
Total2 1413 1378 1229 1297 1253 1152 1216 1356 1062 1225 1165 60of which Non-OECD 1160 1126 1069 1148 1102 939 1088 1155 966 1138 1002 136
OECD Asia OceaniaOECD Americas - 1 4 - 6 7 3 10 - - - -Venezuela - - - - - - - - - - - -Other Central and South America - - 0 - - - 0 - 0 - - -ARA (Belgium Germany Netherlands) - - 0 - 0 - - - - - - -Other Europe - - - - - - - - - - - -FSU 4 4 2 3 3 1 1 2 1 2 5 -3Saudi Arabia 3 - - - - - - - - - - -Algeria - - - - - - - - - - - -Other Middle East and Africa 8 7 13 0 22 23 8 - 24 - 24 -Singapore 141 111 91 78 96 103 85 57 105 95 94 1Non-OECD Asia (excl. Singapore) 91 133 209 194 209 214 217 234 221 198 139 59Other 5 5 10 6 10 16 8 10 6 8 5 3
Total2 253 262 329 281 346 365 323 312 357 302 266 35of which Non-OECD 253 261 325 281 340 358 320 302 357 302 266 35
Total OECD Trade2 1790 1758 1712 1655 1714 1608 1870 1844 1655 2104 1598 506of which Non-OECD 1513 1473 1516 1490 1535 1366 1673 1603 1478 1932 1381 551
1 Based on Monthly Oil Questionnaire data submitted by OECD countries in tonnes.2 Total figure excludes intra-regional trade.
Year Earlier
Table 10REGIONAL OECD GASOIL/DIESEL IMPORTS BY SOURCE1
(thousand barrels per day)

Oil Market Report Tables
Page | 33 17 March 2021 IEA
. All
right
s re
serv
ed.
Table 11: Regional OECD Jet and Kerosene Imports by Source
Table 11: Regional OECD Jet and Kerosene Imports by Source
Year Earlier2018 2019 2020 1Q20 2Q20 3Q20 4Q20 Oct 20 Nov 20 Dec 20 Dec 19 change
OECD AmericasVenezuela 6 0 - - - - - - - - - -Other Central and South America 2 7 5 5 5 7 5 10 - 5 21 -17ARA (Belgium Germany Netherlands) 0 - - - - - - - - - - -Other Europe 0 0 4 3 0 8 4 10 - - - -FSU 0 - 0 - - 1 - - - - - -Saudi Arabia 1 2 6 3 7 1 14 - 11 32 - -Algeria - - 1 1 1 3 - - - - - -Other Middle East and Africa 2 10 11 11 4 13 18 29 21 4 17 -13Singapore 6 3 4 13 1 3 - - - - - -OECD Asia Oceania 84 136 100 103 87 115 95 107 104 75 132 -57Non-OECD Asia (excl. Singapore) 27 14 22 21 31 24 10 7 11 12 10 2Other 11 3 7 4 11 - 12 - - 36 - -
Total2 140 175 161 164 146 175 157 163 146 163 180 -17of which Non-OECD 56 39 57 58 60 53 59 45 42 88 48 40
OECD EuropeOECD Americas 32 20 13 35 14 3 1 2 2 0 5 -4Venezuela 1 - - - - - - - - - - -Other Central and South America 2 1 0 0 - - - - - - - -Non-OECD Europe 6 2 0 - - 1 - - - - - -FSU 40 45 23 33 17 18 26 17 36 24 28 -3Saudi Arabia 98 105 40 54 47 31 30 41 33 17 56 -39Algeria 9 11 9 12 13 6 6 18 - - 8 -Other Middle East and Africa 197 199 152 174 128 153 152 240 96 119 184 -65Singapore 25 29 15 21 6 26 8 22 - - 38 -OECD Asia Oceania 32 36 29 31 23 46 16 33 2 14 46 -32Non-OECD Asia (excl. Singapore) 69 73 48 67 40 31 53 37 22 100 22 79Other 1 2 8 -2 38 -4 2 48 -17 -25 18 -44
Total2 512 523 339 423 326 311 295 459 174 249 404 -155of which Non-OECD 445 464 296 358 288 262 277 422 170 235 353 -118
OECD Asia OceaniaOECD Americas - - - - - - - - - - - -Venezuela - - - - - - - - - - - -Other Central and South America - - - - - - - - - - - -ARA (Belgium Germany Netherlands) - - - - - - - - - - - -Other Europe - - - - - - - - - - - -FSU - - - - - - - - - - - -Saudi Arabia 1 - - - - - - - - - - -Algeria - - - - - - - - - - - -Other Middle East and Africa 1 - - - - - - - - - - -Singapore 28 21 14 25 5 17 10 1 20 10 17 -7Non-OECD Asia (excl. Singapore) 26 29 28 52 15 16 28 16 28 39 48 -9Other 33 26 21 42 16 9 19 8 9 40 38 2
Total2 89 76 63 119 35 41 57 25 58 89 103 -14of which Non-OECD 89 76 63 119 35 41 57 25 58 89 103 -14
Total OECD Trade2 741 774 562 705 507 527 510 648 378 501 687 -186of which Non-OECD 590 579 416 535 383 356 393 493 271 412 504 -921 Based on Monthly Oil Questionnaire data submitted by OECD countries in tonnes.2 Total figure excludes intra-regional trade.
Table 11REGIONAL OECD JET AND KEROSENE IMPORTS BY SOURCE1
(thousand barrels per day)
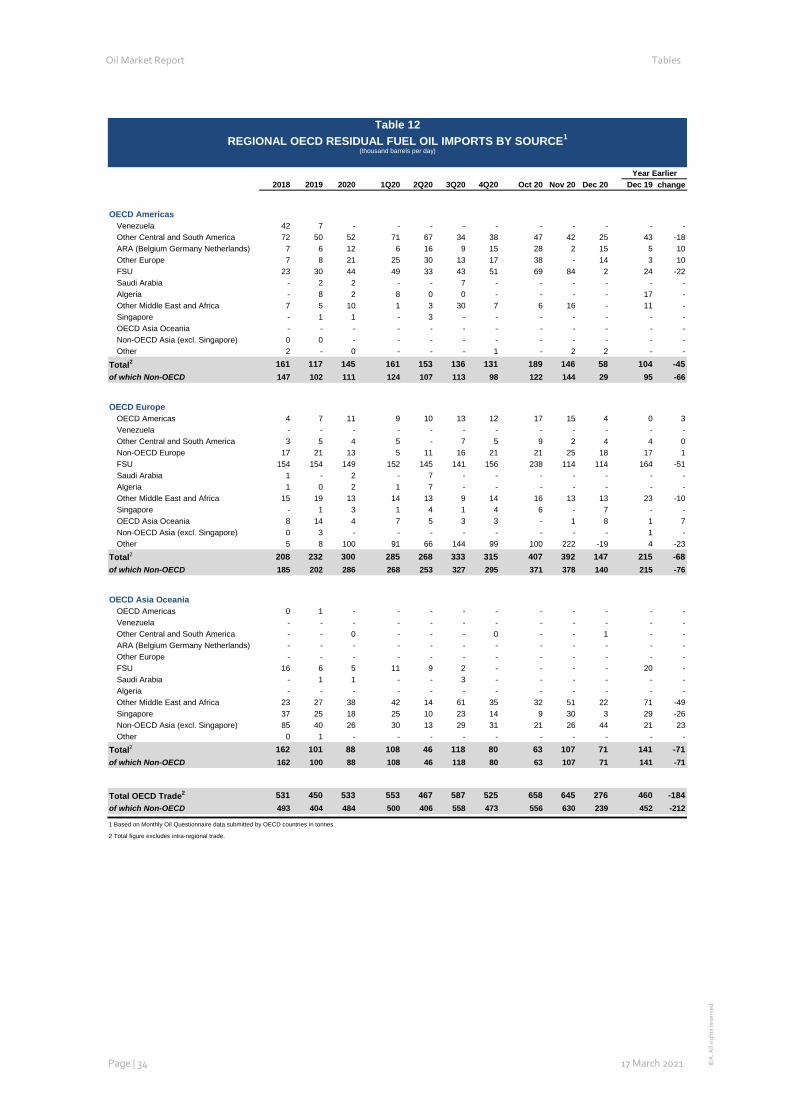
Oil Market Report Tables
Page | 34 17 March 2021 IEA
. All
right
s re
serv
ed.
Table 12: Regional OECD Residual Fuel Oil Imports by Source
Year Earlier2018 2019 2020 1Q20 2Q20 3Q20 4Q20 Oct 20 Nov 20 Dec 20 Dec 19 change
OECD AmericasVenezuela 42 7 - - - - - - - - - -Other Central and South America 72 50 52 71 67 34 38 47 42 25 43 -18ARA (Belgium Germany Netherlands) 7 6 12 6 16 9 15 28 2 15 5 10Other Europe 7 8 21 25 30 13 17 38 - 14 3 10FSU 23 30 44 49 33 43 51 69 84 2 24 -22Saudi Arabia - 2 2 - - 7 - - - - - -Algeria - 8 2 8 0 0 - - - - 17 -Other Middle East and Africa 7 5 10 1 3 30 7 6 16 - 11 -Singapore - 1 1 - 3 - - - - - - -OECD Asia Oceania - - - - - - - - - - - -Non-OECD Asia (excl. Singapore) 0 0 - - - - - - - - - -Other 2 - 0 - - - 1 - 2 2 - -
Total2 161 117 145 161 153 136 131 189 146 58 104 -45of which Non-OECD 147 102 111 124 107 113 98 122 144 29 95 -66
OECD EuropeOECD Americas 4 7 11 9 10 13 12 17 15 4 0 3Venezuela - - - - - - - - - - - -Other Central and South America 3 5 4 5 - 7 5 9 2 4 4 0Non-OECD Europe 17 21 13 5 11 16 21 21 25 18 17 1FSU 154 154 149 152 145 141 156 238 114 114 164 -51Saudi Arabia 1 - 2 - 7 - - - - - - -Algeria 1 0 2 1 7 - - - - - - -Other Middle East and Africa 15 19 13 14 13 9 14 16 13 13 23 -10Singapore - 1 3 1 4 1 4 6 - 7 - -OECD Asia Oceania 8 14 4 7 5 3 3 - 1 8 1 7Non-OECD Asia (excl. Singapore) 0 3 - - - - - - - - 1 -Other 5 8 100 91 66 144 99 100 222 -19 4 -23
Total2 208 232 300 285 268 333 315 407 392 147 215 -68of which Non-OECD 185 202 286 268 253 327 295 371 378 140 215 -76
OECD Asia OceaniaOECD Americas 0 1 - - - - - - - - - -Venezuela - - - - - - - - - - - -Other Central and South America - - 0 - - - 0 - - 1 - -ARA (Belgium Germany Netherlands) - - - - - - - - - - - -Other Europe - - - - - - - - - - - -FSU 16 6 5 11 9 2 - - - - 20 -Saudi Arabia - 1 1 - - 3 - - - - - -Algeria - - - - - - - - - - - -Other Middle East and Africa 23 27 38 42 14 61 35 32 51 22 71 -49Singapore 37 25 18 25 10 23 14 9 30 3 29 -26Non-OECD Asia (excl. Singapore) 85 40 26 30 13 29 31 21 26 44 21 23Other 0 1 - - - - - - - - - -
Total2 162 101 88 108 46 118 80 63 107 71 141 -71of which Non-OECD 162 100 88 108 46 118 80 63 107 71 141 -71
Total OECD Trade2 531 450 533 553 467 587 525 658 645 276 460 -184of which Non-OECD 493 404 484 500 406 558 473 556 630 239 452 -212
1 Based on Monthly Oil Questionnaire data submitted by OECD countries in tonnes.
2 Total figure excludes intra-regional trade.
Table 12REGIONAL OECD RESIDUAL FUEL OIL IMPORTS BY SOURCE1
(thousand barrels per day)

Oil Market Report Tables
Page | 35 17 March 2021 IEA
. All
right
s re
serv
ed.
Table 13: Average IEA CIF Crude Cost and Spot Crude and Production Prices
2018 2019 2020 1Q20 2Q20 3Q20 4Q20 Sep 20 Oct 20 Nov 20 Dec 20 Jan 21 Feb 21
CRUDE OIL PRICES
IEA CIF Average Import1
IEA Americas 60.02 56.93 37.30 44.57 24.30 39.34 40.14 38.61 37.91 38.79 43.73IEA Europe 70.52 64.25 42.88 53.74 28.35 43.29 43.98 42.07 40.60 42.36 48.89IEA Asia Oceania 72.46 66.38 46.28 64.01 30.10 42.99 44.27 45.29 43.41 42.74 46.34
IEA Total 67.77 62.75 42.17 53.85 27.60 42.12 42.99 41.93 40.59 41.43 46.80
FOB SpotNorth Sea Dated 71.27 64.12 41.76 50.02 29.57 42.82 44.03 40.58 40.01 42.54 49.72 54.73 62.23Brent (Asia) Mth 1 72.23 64.86 44.86 52.63 36.46 44.20 45.86 42.92 42.12 44.70 50.72 55.29 62.51WTI (Cushing) Mth 1 65.20 57.03 39.25 45.57 27.95 40.90 42.63 39.60 39.53 41.10 47.05 52.10 59.06Urals (Mediterranean) 70.17 64.31 41.93 48.97 30.29 43.39 44.49 40.98 40.26 43.35 50.07 54.89 61.47Dubai (1st month) 69.65 63.49 42.36 50.41 31.17 42.80 44.62 41.45 40.70 43.33 49.78 54.76 60.85
Tapis (Dated)2 71.56 69.16 43.28 56.06 28.66 43.69 44.21 39.48 39.15 42.54 50.88 55.98 63.06
PRODUCT PRICES
Rotterdam, Barges FOB
Premium Unl 10 ppm 78.78 71.35 44.65 53.77 30.56 46.58 46.99 46.48 45.30 44.97 50.77 58.22 65.90Naphtha 64.48 56.27 39.64 45.86 26.52 41.90 43.64 40.78 41.72 41.13 48.16 55.84 62.06Jet/Kerosene 86.39 79.24 44.79 60.06 29.76 41.92 46.75 38.95 41.45 45.33 53.72 58.79 65.40ULSD 10ppm 86.22 79.45 49.32 62.85 37.55 47.49 48.86 43.36 44.17 47.45 55.20 60.06 67.89Gasoil 0.1 % 84.28 77.73 48.10 61.41 36.43 45.99 48.05 42.19 43.34 46.66 54.37 59.16 66.71LSFO 1% 63.22 62.21 42.78 52.84 30.10 41.34 46.27 40.11 42.48 45.74 50.76 56.30 64.26HSFO 3.5% 61.13 50.31 34.43 33.39 24.05 38.33 41.40 37.37 38.25 41.12 44.99 50.34 56.05
Mediterranean, FOB Cargoes
Premium Unl 10 ppm 79.41 71.31 45.59 54.91 31.91 47.45 47.42 47.44 45.56 45.45 51.33 58.92 66.86Naphtha 66.08 54.43 37.81 43.27 23.72 40.74 42.80 39.21 41.07 40.34 47.08 54.51 60.28Jet Aviation Fuel 85.37 77.76 43.28 58.08 27.43 40.88 46.01 37.51 40.89 44.62 52.75 57.67 63.87ULSD 10ppm 86.03 79.05 48.76 61.86 36.15 47.45 49.02 43.14 44.47 47.47 55.33 59.93 67.18Gasoil 0.1 % 84.74 77.70 47.60 60.94 34.06 46.32 48.48 42.28 43.78 46.96 54.94 59.31 66.02LSFO 1% 64.31 63.90 44.06 54.94 31.39 42.26 47.07 40.89 43.63 46.55 51.18 56.92 65.16HSFO 3.5% 62.06 52.17 34.36 35.67 24.32 37.23 39.72 35.74 36.95 39.15 43.19 48.92 54.37
US Gulf, FOB Pipeline
Super Unleaded 85.71 79.24 50.64 60.05 39.80 52.55 52.94 51.53 50.83 49.81 57.76 65.73 74.84Unleaded 80.10 72.28 46.02 54.57 34.95 49.24 49.93 48.10 47.68 47.25 54.50 63.02 72.03Jet/Kerosene 85.12 78.81 46.20 58.25 32.58 45.02 49.16 42.52 44.21 47.51 55.52 59.42 67.50ULSD 10 ppm 85.94 79.09 50.17 61.81 38.27 48.59 52.24 45.57 46.64 51.00 58.92 64.07 73.16No. 6 3%2 60.20 52.57 34.63 35.91 24.69 37.70 40.20 35.99 37.37 39.44 43.67 48.00 52.87
Singapore, FOB Cargoes
Premium Unleaded 80.21 72.55 46.65 56.85 33.23 47.32 48.72 47.27 45.96 46.67 53.43 60.03 67.83Naphtha 67.50 57.15 40.77 47.72 28.05 43.29 43.51 43.19 41.88 40.71 47.80 55.83 61.85Jet/Kerosene 85.05 77.26 44.83 58.88 30.73 42.13 47.08 39.37 41.65 45.64 53.87 58.02 65.15Gasoil 0.05% 84.33 77.23 48.43 61.38 36.58 47.00 48.38 43.30 43.43 47.15 54.50 58.87 66.70HSFO 180 CST 67.04 58.62 39.32 43.14 29.24 40.35 44.09 39.61 41.19 43.64 47.43 51.40 57.61HSFO 380 CST 4% 66.01 57.57 38.25 41.71 27.95 39.59 43.26 38.59 39.53 43.41 46.83 51.17 56.64
1 IEA CIF Average Import price for December is an estimate. IEA Americas includes United States and Canada. IEA Europe includes all countries in OECD Europe except Estonia, Hungary and Slovenia. IEA Asia Oceania includes Australia, New Zealand, Korea and Japan.
2 WaterborneCopyright © 2021 Argus Media Ltd - All rights reserved
Table 13AVERAGE IEA CIF CRUDE COST AND SPOT CRUDE AND PRODUCT PRICES
($/bbl)

Oil Market Report Tables
Page | 36 17 March 2021 IEA
. All
right
s re
serv
ed.
Table 14: Monthly Average End-User Prices for Petroleum Products Total Ex-Tax Total Ex-Tax
Price Jan-21 Feb-20 Price Jan-21 Feb-20 Price Jan-21 Feb-20 Price Jan-21 Feb-20
GASOLINE 1 (per litre) France 1.442 2.6 - 3.8 0.511 6.5 -8.4 1.744 2.0 6.7 0.618 5.8 1.6 Germany 1.432 2.4 2.1 0.548 5.0 4.6 1.732 1.7 13.3 0.663 4.3 16.0 Italy 1.497 2.5 - 3.7 0.499 6.4 -8.6 1.811 1.9 6.8 0.604 5.8 1.4 Spain 1.246 3.0 - 4.2 0.557 5.7 -7.5 1.507 2.3 6.2 0.674 5.1 2.6 United Kingdom 1.202 3.1 - 3.5 0.422 7.7 -7.9 1.667 4.9 3.3 0.585 9.5 -1.4 Japan 140.9 2.6 - 5.7 71.5 4.8 -9.7 1.337 1.0 -1.5 0.679 3.2 -5.7 Canada 1.195 6.1 3.6 0.754 9.1 3.4 0.941 6.3 8.3 0.594 9.3 8.2 United States 0.661 7.1 2.5 0.533 9.0 2.9 0.661 7.1 2.5 0.533 9.0 2.9
AUTOMOTIVE DIESEL FOR NON COMMERCIAL USE (per litre) France 1.334 2.8 - 5.3 0.503 6.3 -11.0 1.614 2.1 5.0 0.608 5.7 -1.3 Germany 1.263 2.8 1.8 0.591 5.0 3.1 1.528 2.1 12.9 0.715 4.3 14.4 Italy 1.369 2.7 - 5.5 0.505 6.1 -11.6 1.656 2.1 4.8 0.611 5.4 -1.9 Spain 1.128 3.1 - 6.6 0.553 5.3 -10.7 1.364 2.5 3.6 0.669 4.7 -0.9 United Kingdom 1.247 2.8 - 3.5 0.459 6.5 -7.8 1.729 4.6 3.3 0.637 8.3 -1.3 Japan 121.3 3.0 - 6.5 78.3 4.3 -8.8 1.151 1.3 -2.3 0.743 2.6 -4.8 Canada 1.161 4.8 - 4.4 0.773 6.8 -7.9 0.914 5.0 -0.0 0.609 7.0 -3.6 United States 0.752 6.2 - 2.2 0.603 7.9 -2.9 0.752 6.2 -2.2 0.603 7.9 -2.9
DOMESTIC HEATING OIL (per litre) France 0.817 4.3 - 8.5 0.524 5.6 -10.7 0.988 3.6 1.5 0.634 5.0 -1.0 Germany 0.658 5.4 2.4 0.492 6.1 2.7 0.796 4.7 13.5 0.595 5.5 13.9 Italy 1.194 3.0 - 7.4 0.575 5.2 -12.0 1.444 2.3 2.7 0.696 4.5 -2.4 Spain 0.634 5.1 - 11.7 0.428 6.3 -14.0 0.767 4.5 -2.1 0.517 5.7 -4.6 United Kingdom 0.522 5.6 - 3.4 0.385 7.3 -4.3 0.723 7.4 3.4 0.534 9.1 2.4 Japan 2 84.2 3.4 - 9.1 73.7 3.5 -9.4 0.799 1.8 -5.0 0.700 1.9 -5.3 Canada 1.061 4.3 - 4.6 0.939 4.4 -4.1 0.835 4.5 -0.2 0.739 4.6 0.3 United States - - - - - - - - - - - -
LOW SULPHUR FUEL OIL FOR INDUSTRY 3 (per kg) France 0.547 7.7 - 5.3 0.407 17.4 -7.0 0.662 7.0 5.0 0.493 16.7 3.2 Germany - - - - - - - - - - - - Italy 0.467 8.9 - 6.3 0.436 12.5 -6.7 0.565 8.3 3.9 0.527 11.8 3.4 Spain 0.471 16.2 0.5 0.454 23.8 0.5 0.570 15.5 11.5 0.549 23.0 11.5 United Kingdom - - - - - - - - - - - - Japan - - - - - - - - - - - - Canada - - - - - - - - - - - - United States - - - - - - - - - - - -1 Unleaded premium (95 RON) for France, Germany, Italy, Spain, UK; regular unleaded for Canada, Japan and the United States.2 Kerosene for Japan.3 VAT excluded from prices for low sulphur fuel oil when refunded to industry.
* Prices for France, Germany, Italy and Spain are in Euros; UK in British Pounds, Japan in Yen, Canada in Canadian Dollars.
% change from% change from
Table 14MONTHLY AVERAGE END-USER PRICES FOR PETROLEUM PRODUCTS
February 2021
NATIONAL CURRENCY * US DOLLARS
% change from % change from

Oil Market Report Tables
Page | 37 17 March 2021 IEA
. All
right
s re
serv
ed.
Table 15: IEA/KBC Global Indicator Refining Margins Change
Nov 20 Dec 20 Jan 21 Feb 21 Feb-Jan 12 Feb 19 Feb 26 Feb 05 Mar 12 Mar
NW EuropeBrent (Cracking) 0.85 0.20 0.86 0.46 -0.40 0.38 0.20 0.60 0.31 -0.08 Urals (Cracking) 0.69 0.79 1.05 1.45 0.40 1.26 1.44 2.24 2.04 1.43 Brent (Hydroskimming) 0.86 -0.18 0.19 -0.03 -0.23 0.14 -0.39 -0.05 -0.42 -0.77 Urals (Hydroskimming) -0.39 -0.95 -0.97 -0.98 -0.01 -0.95 -1.17 -0.51 -0.76 -1.26
MediterraneanEs Sider (Cracking) 3.33 2.12 2.94 2.49 -0.45 2.77 2.13 2.14 2.56 2.61 Urals (Cracking) 0.21 0.19 0.55 0.75 0.20 1.17 0.83 0.88 0.42 0.38 Es Sider (Hydroskimming) 3.34 1.50 2.40 2.15 -0.25 2.52 1.76 1.84 2.30 2.33 Urals (Hydroskimming) -1.55 -2.48 -1.99 -2.25 -0.26 -1.71 -2.39 -2.38 -2.67 -2.65
US Gulf CoastMars (Cracking) 1.37 0.97 2.41 3.33 0.92 1.49 4.33 4.73 5.37 5.81 50/50 HLS/LLS (Coking) 4.92 5.77 7.66 9.06 1.40 6.92 10.48 10.69 11.92 13.23 50/50 Maya/Mars (Coking) 2.62 2.61 3.84 5.00 1.16 3.16 6.23 6.12 7.24 7.75 ASCI (Coking) 3.14 3.43 5.15 6.94 1.79 4.62 8.28 9.03 9.50 10.26
US Midwest30/70 WCS/Bakken (Cracking) 6.12 6.86 8.89 9.69 0.81 8.07 11.51 10.96 9.99 12.56 Bakken (Cracking) 6.89 7.32 9.63 11.55 1.92 9.71 13.51 13.45 11.79 14.52 WTI (Coking) 5.50 5.45 7.36 10.92 3.57 9.26 12.77 13.10 13.29 16.80 30/70 WCS/Bakken (Coking) 7.23 8.26 10.30 12.00 1.70 10.16 14.07 13.77 12.78 15.74
SingaporeDubai (Hydroskimming) -0.77 -1.96 -2.03 -1.83 0.20 -1.98 -2.03 -1.73 -1.93 -2.50 Tapis (Hydroskimming) 3.22 1.78 2.20 2.43 0.22 3.14 2.21 1.83 -0.06 0.44 Dubai (Hydrocracking) 1.59 1.80 2.53 3.71 1.18 3.45 3.62 4.26 3.57 2.56 Tapis (Hydrocracking) 2.28 1.15 1.21 1.14 -0.06 1.66 0.97 0.62 -1.08 -0.55
1 Global Indicator Refining Margins are calculated for various complexity configurations, each optimised for processing the specific crude(s) in a specific refining centre. Margins include energy cost, but exclude other variable costs, depreciation and amortisation. Consequently, reported margins should be taken as an indication, or proxy, of changes in profitability for a given refining centre. No attempt is made to model or otherwise comment upon the relative economics of specific refineries running individual crude slates and producing custom product sales, nor are these calculations intended to infer the marginal values of crude for pricing purposes. Source: IEA, KBC Advanced Technologies (KBC)
Table 15IEA/KBC Global Indicator Refining Margins1
($/bbl)
Monthly Average Average for week ending:

Oil Market Report Tables
Page | 38 17 March 2021 IEA
. All
right
s re
serv
ed.
Table 16: Refined Product Yields Based On Total Input (%) Oct-20 Nov-20 Dec-20 Dec-19
Dec 20 vs Previous
Month
Dec 20 vs Previous
Year
Dec 20 vs 5 Year
Average 5 Year
Average
OECD AmericasNaphtha 1.3 1.4 1.4 1.4 0.0 0.0 -0.2 1.6Motor gasoline 49.7 48.4 46.5 46.9 -1.9 -0.4 -1.3 47.8Jet/kerosene 5.2 6.4 6.9 9.6 0.5 -2.6 -2.3 9.2Gasoil/diesel oil 28.5 29.1 30.0 28.4 0.9 1.6 1.2 28.8Residual fuel oil 2.7 2.5 2.8 2.2 0.3 0.6 -0.3 3.1Petroleum coke 4.4 4.2 4.3 4.5 0.1 -0.3 -0.3 4.6Other products 12.1 11.4 11.3 11.2 -0.1 0.1 1.3 10.0
OECD EuropeNaphtha 8.5 9.4 9.4 8.4 -0.1 0.9 1.2 8.2Motor gasoline 22.7 21.2 20.7 21.0 -0.5 -0.3 -0.6 21.3Jet/kerosene 4.4 4.8 5.1 9.2 0.3 -4.1 -3.1 8.2Gasoil/diesel oil 42.1 41.6 42.6 41.0 1.0 1.6 2.1 40.5Residual fuel oil 6.8 6.9 7.9 7.9 1.0 0.0 -1.8 9.6Petroleum coke 1.5 1.5 1.6 1.5 0.1 0.1 0.2 1.4Other products 15.7 16.8 15.2 13.6 -1.6 1.6 2.0 13.2
OECD Asia OceaniaNaphtha 15.5 15.9 15.8 15.6 -0.1 0.2 0.4 15.4Motor gasoline 22.9 22.7 22.5 22.5 -0.2 0.0 0.6 22.0Jet/kerosene 11.3 12.6 13.5 16.0 0.9 -2.5 -2.1 15.5Gasoil/diesel oil 32.3 30.8 30.5 29.4 -0.3 1.1 1.3 29.2Residual fuel oil 7.4 8.2 7.2 6.5 -1.0 0.8 0.1 7.1Petroleum coke 0.4 0.3 0.4 0.4 0.0 0.0 0.0 0.4Other products 12.8 12.7 12.2 11.6 -0.5 0.6 0.5 11.7
OECD TotalNaphtha 6.2 6.5 6.6 6.2 0.1 0.5 0.4 6.3Motor gasoline 36.2 35.1 33.8 34.4 -1.3 -0.6 -0.8 34.6Jet/kerosene 6.0 7.0 7.6 10.6 0.6 -3.0 -2.4 10.0Gasoil/diesel oil 33.6 33.4 34.1 32.5 0.7 1.5 1.5 32.6Residual fuel oil 4.9 5.0 5.2 4.7 0.3 0.5 -0.7 5.9Petroleum coke 2.8 2.7 2.7 2.8 0.0 -0.1 -0.1 2.8Other products 13.4 13.4 12.7 12.0 -0.6 0.7 1.4 11.41 Due to processing gains and losses, yields in % will not always add up to 100%
Table 16REFINED PRODUCT YIELDS BASED ON TOTAL INPUT (%)1

Oil Market Report Tables
Page | 39 17 March 2021 IEA
. All
right
s re
serv
ed.
Table 17: World Biofuels Production 2018 2019 2020 2Q20 3Q20 4Q20 Dec 20 Jan 21 Feb 21
ETHANOLOECD Americas1 1078 1060 936 734 953 1002 1001 1036 1036
United States 1048 1029 906 703 923 972 971 1005 1005Other 31 31 30 30 30 30 30 31 31
OECD Europe2 98 97 89 75 102 84 81 99 99France 21 20 16 11 22 15 17 17 17Germany 14 12 11 9 14 10 7 12 12Spain 9 9 8 7 8 8 8 9 9United Kingdom 9 5 4 4 4 4 4 11 11Other 45 51 50 45 54 48
OECD Asia Oceania3 4 5 4 4 4 5 5 5 5Australia 4 4 3 3 3 3 4 3 3Other 0 1 1 1 1 1 1 1 1
Total OECD Ethanol 1180 1163 1030 812 1060 1091 1087 1140 1140Total Non-OECD Ethanol 728 812 742 890 1146 663 336 329 316
Brazil 557 621 560 707 959 467 140 99 85China 56 67 69 70 74 83Argentina 19 19 15 15 15 15Other 95 105 98 98 98 98 196 230 230
TOTAL ETHANOL 1908 1975 1772 1702 2206 1754 1423 1469 1455
BIODIESELOECD Americas1 126 119 125 123 132 128 128 128 128
United States 121 113 118 117 125 122 122 120 120Other 5 7 6 6 6 6 6 7 7
OECD Europe2 275 281 261 235 288 274 242 289 289France 52 42 41 35 47 41 46 43 43Germany 65 66 60 58 68 56 50 66 66Italy 15 18 28 27 29 28 23 31 31Spain 33 38 34 30 38 36 34 39 39Other 110 116 99 84 106 113 89 111 111
OECD Asia Oceania3 14 15 20 24 24 17 16 23 23Australia 1 2 3 3 3 3 3 4 4Other 13 13 17 21 21 14 14 19 19
Total OECD Biodiesel 415 415 406 382 444 419 386 440 440Total Non-OECD Biodiesel 345 388 405 406 406 406 406 411 411
Brazil 92 102 111 101 124 113 105 99 116Argentina* 47 42 27 27 27 27Other 205 245 267 278 254 265
TOTAL BIODIESEL 759 803 810 788 849 824 792 851 851
GLOBAL BIOFUELS 2667 2778 2582 2489 3055 2578 2215 2320 2307* monthly data not available.
Table 17WORLD BIOFUELS PRODUCTION
(thousand barrels per day)

Oil Market Report
IEA
. All
right
s re
serv
ed.
Source: IEA 2021. All Rights Reserved
Without prejudice to the terms and conditions on the IEA website at www.iea.org/t&c/termsandconditions/ (the Terms), which also apply to this Oil Market Report (OMR) and its related publications, the Executive Director and the Secretariat of the IEA are responsible for the publication of the OMR. Although some of the data are supplied by IEA Member-country governments, largely on the basis of information they in turn receive from oil companies, neither these governments nor these oil companies necessarily share the Secretariat’s views or conclusions as expressed in the OMR. The OMR is prepared for general circulation and is distributed for general information only. Neither the information nor any opinion expressed in the OMR constitutes an offer, or an invitation to make an offer, to buy or sell any securities or any options, futures or other derivatives related to such securities.
As set out in the Terms, the IEA owns the copyright in this OMR. However, in relation to the edition of OMR made available to Subscribers (as defined in the Terms), all Argus information is sourced as Copyright © 2021 Argus Media Limited and is published here with the permission of Argus. The spot crude and product price assessments are based on daily Argus prices, converted when appropriate to USD per barrel according to the Argus specification of products. Argus Media Limited reserves all rights in relation to all Argus information. Any reproduction of Argus information requires the express prior written permission of Argus. Argus shall not be liable to any party for any inaccuracy, error or omission contained or provided in Argus information contained in this OMR or for any loss, or damage, whether or not due to reliance placed by that party on information in this OMR.

Oil Market Team
Editor
Toril Bosoni +33 (0)1 40 57 67 18
Statistics Luis Fernando Rosa +33 (0)1 40 57 65 56
Demand Christophe Barret +33 (0)1 40 57 65 16
Statistics Edwin Gouemo +33 (0) 1 40 57 68 18
Demand Olivier Lejeune +33 (0)1 40 57 67 58
OPEC Supply Peg Mackey +33 (0)1 40 57 65 81
Editorial Assistant Deven Mooneesawmy +33 (0)1 40 57 65 03
Non-OPEC Supply
Anne Kloss +33 (0)1 40 57 67 28
Refining Kristine Petrosyan +33 (0)1 40 57 66 05
Data Enquiries to Oil Market Report: [email protected]
Stocks Masataka Yarita +33 (0)1 40 57 67 64
Subscription & Delivery Enquiries
+33 (0)1 40 57 66 90 [email protected]
Prices Joel R. Couse +33 (0)1 40 57 67 22
Media Enquiries IEA Press Office
+33 (0)1 40 57 66 94 [email protected]
Next Issue: 14 April 2021
For information on the data sources, definitions, technical terms and general approach used in preparing the Oil Market Report (OMR), Market Report Series_Oil and Annual Statistical Supplement (current issue of the Statistical Supplement dated 14 August 2020), readers are referred to the Users’ Guide at https://www.iea.org/articles/oil-market-report-glossary. It should be noted that the spot crude and product price assessments are based on daily Argus prices, converted when appropriate to US$ per barrel according to the Argus specification of products (Copyright © 2021 Argus Media Limited - all rights reserved)