Embed Size (px)
Citation preview

Journal of Theoretical and Applied Information Technology 20
th February 2015. Vol.72 No.2
© 2005 - 2015 JATIT & LLS. All rights reserved.
ISSN: 1992-8645 www.jatit.org E-ISSN: 1817-3195
294
DESIGNING A DISTRIBUTION NETWORK USING A TWO
LEVEL CAPACITY LOCATION ALLOCATION PROBLEM:
FORMULATION AND EFFICIENT GENETIC ALGORITHM
RESOLUTION WITH AN APPLICATION TO A MOROCCAN
RETAIL COMPANY
1M.HLYAL,
2A.AIT BASSOU,
3A.SOULHI,
4J. EL ALAMI,
5N. EL ALAMI
1 School of Textile and Clothing - (ESITH), Casablanca, Morocco 1,2,3,4 LASTIMI LAB, Med V University, EMI School, Rabat, Morocco
4 Prof, Med V University, High school of technology EST, Salé, Morocco 5 Prof, LA2I LAB, Med V University, EMI School, Rabat, Morocco
3 Prof, High School of Mineral Industry, Rabat, Morocco
E-mail: 1 [email protected], [email protected] , [email protected], [email protected] , [email protected] ,
ABSTRACT
Distribution network design as a strategic decision has long-term effect on tactical and operational supply chain management. In this research, a supply chain design problem based on a two level capacity location allocation problem (TLCLAP) is presented. A product must be transported from a set of seaport to meet stores demands, passing out by intermediate warehouses. The objective is to locate the warehouses, allocate warehouse to seaport in the first distribution network level and allocate stores to warehouse for in the second one. The finality is to minimize the global cost of the underlying two-level costs thereby satisfying store demand and warehouse capacity constraints. In this study, a new mathematical model for the two-level capacitated facility location allocation, with restrictions in the real-world environments of logistics distribution is given. In order to solve the model, an efficient Genetic Algorithm (GA) for TLCLAP in distribution logistic network has been developed for optimal distribution network design.
Keywords: Distribution network, Genetic Algorithm, Location-allocation decisions, Logistics network,
Mathematical modeling.
1. INTRODUCTION
In the past, the success and prosperity of the
company depended mainly on its policy and approach to its internal organization. With the current trends in supply and demand, and globalization, the company must, in addition to improving its organization, have the constant concern of the performance and effectiveness of all links in the global supply chains to which it belongs. A business can be profitable, with no worries of Seles and / or cost-effectiveness; bat may cease to exist following the breakdown of a single link "a vendor or supplier of the supplier no longer meets the conditions for cooperation."
Regardless of the business strategy, performance is dependent on other actors who can influence the success or failure of the chain by the interrelations
between their behaviors. The global optimum of the chain is the sum of local optima; this implies that the strategy must be global thinking with the involvement of all the links in the "principle of totality." In other words, the links in the chain must interact collaboratively in a common goal of maximizing the performance of the overall system.
A company's logistics network strategy should conform with, and be part of, its overall corporate strategy. Hence, if a company strives to become a leader in retail, it must consider establishing stores and locating warehouses in regions that are consistent with its strategy and that are optimally located to serve its global customers. The desired aim in designing a distribution network is to determine the design of a network architecture that can meet the demand of various customers at the lowest cost, taking into account capacity constraints

Journal of Theoretical and Applied Information Technology 20
th February 2015. Vol.72 No.2
© 2005 - 2015 JATIT & LLS. All rights reserved.
ISSN: 1992-8645 www.jatit.org E-ISSN: 1817-3195
295
warehouses. It is therefore to determine the trade-off between the costs of the system include operating costs and opening warehouses, and the costs of inbound and outbound transport. In real-world environments, since the purpose of business is to minimize the overall cost of the distribution network the use of location allocution facilities is justified. For example, suppose a company aims to locate a number of new facilities in a certain region where the demands and locations of the stores are known in advance, it will make the study on two levels: between ports and warehouses (level 1) and between warehouses and stores (level 2). Since the seaports positions are given as it will try to study the location of warehouse in which it will attach its stores.
In this paper, we propose a relatively simple model, which takes into account the practical and theoretical constraints of the network and the use of genetic algorithm whose effectiveness and efficiency are proven in various issues like optimization. The setting of the various parameters of the algorithm based on the target performance helps make the result fairly realistic in terms of response time and quality of solutions.
The structure of this research is as follows. In Section 2, we presented a literature review about facilities allocation location. In Section3, we give a mathematical formulation for our problem then we explored the structure of the problem and then proposed and developed a genetic algorithm to solve the problem. To evaluate the computational effectiveness we apply our method to a distribution company, located in Morocco. Testing our concluding remarks is summarized in Section 4.
2. LITERATURE REVIEW
The spectacular growth in demand for effective management of the supply chain has developed location allocation problems as significant research topics. The objective of this problem is to have a network design that contain a new installation sites in the space to serve the customers demand in such a manner as to minimize the total cost of logistics network. In general, location allocation modeling is used to help solve the problems of site selection in the public and private economic sectors, in situations where an organization needs to get the most effective and efficient distribution system facilities.
The literature review revealed that many researchers have granted interest to the problems related to the logistics distribution networks. In this context, previous studies are identified by Aikens
[1], Brandeau [2] and Avella [3]. In the same context, Jayaraman studied the problem of the location of the warehouse that empowerment is to locate a number of warehouses to meet customer demands for different products [4]. However, Pirkul have extended the above problem by taking into account also the location a number of plants [5] . He formulated the problem as a mixed integer model and developed a heuristic solution procedure of Lagrange. The procedure was tested using instances of problems with up to 100 guests, 20 warehouses and 10 potential candidate sites.
Daskin, Snyder, and Berger outline the importance of facility location decisions in supply chain design. They begin with a review of classical models including the traditional fixed charge facility location problem. They expand the context of facility location decisions to incorporate additional features of a supply chain [6].Meng, Huang, and Cheu identify basic features that distribution model must capture to support decision-making involved in strategic supply chain planning[7]. In particular, the integration of location decisions with other decisions relevant to the design of a supply chain network. Also, Amrani studied a problem identified as an extension of the two echelon multi commodity called capacitated facility location problem with single sourcing [8]. He considered direct shipments from manufacturing facilities. The solution approach was a heuristic based on a variable neighborhood search. Recently, a models distribution network, without taking into account capacity constraints of warehouses has been deeply studied [9],[10].
The problem of designing a logistics network or choice is of strategic importance, it is to consider all available and potential facilities, suppliers, and distribution centers with several possible configurations and customer demand with various types of service requirements to determine the configuration of the system suppliers, production-distribution among the various subsidiaries that maximizes profit.
The distribution network design models involves a problem which is NP hard [11].It is for this reason that research in this area provides solutions based on metaheuristics. A tabu search algorithm for solving the incapacitated facility location problem was proposed in [12]. Also, a heuristic based on combination of volume algorithm and randomized rounding in order to solve the capacitated and incapacitated facility location problems was explained in [13]. An efficient heuristics to solve large-scale production–distribution network design
Journal of Theoretical and Applied Information Technology 20
th February 2015. Vol.72 No.2
© 2005 - 2015 JATIT & LLS. All rights reserved.
ISSN: 1992-8645 www.jatit.org E-ISSN: 1817-3195
296
models was studied in [14]. The problem studied is an extension of the two echelon multi commodity (capacitated facility location problem with single sourcing).
3. METHODS
The capacitated facility location allocation is based in a two-level system for the distribution of one product in a single time period. In the first level, the seaport send product to warehouse. The second level corresponds to the flow of product from the warehouse to the stores. The number and location of seaports and stores are known. There is a set of potential locations to open warehouse. The number of open facilities is not defined a priori. Each candidate site has a fixed cost for opening a facility. The potential locations (warehouse) have a limited capacity. Supply constraints that each store is supplied at most by one warehouse. There are several alternatives to transport the product from one facility to the other in each level of the network.
3.1. Assumptions
The model is provided for a distribution network with 2 levels: from seaports to warehouses, and from warehouse to stores. The product is sent from seaports to warehouse and then distributed to stores based on their demands.
Comprehensively flows can pass through P ports and warehouses to serve W S stores. Or 2 level of nodes (ports and warehouses retained). The choice of node should be while optimizing costs upstream and downstream transmission. The overall network may be represented as shown in “Fig. 1,”
Figure 1: Two Level Distribution Network
We have formulated our model based on the following assumptions:
� A warehouse will be assigned to only one seaport;
� Warehouses will serve S stores and each store is assigned to a single warehouse;
� The warehouse capacity must not be exceeded; � We consider the opening and operation of each
warehouse costs. � A seaport may not be elected, but at least, one
port should be selected in the network; � A warehouse may not be elected, but at least,
one warehouse should be selected in the network;
� We did our study over a period of one year; Also, in this study, we consider the product as a
single unit “pallet”. Indeed even if distributed can vary and range incomplete, in practice the cost charged to the storage, handling and transport is that of a complete pallet;
In our problem, we considered too the seaport charges that have an impact on the distribution cost. These charges for port services, broadly defined, vary from one port to another, depending on its size and facilities include charges for ships (royalty’s room, lighting, mooring and towing) and charges levied on all goods through the port facilities. These are levied on all goods shipped, unloaded, in transit or transshipment. Added to it the occupation of medians storage charges and hangars as well as the charges levied on various services provided by the Port Authority (water supply, electric power and authority to access ...).
3.2. Mathematical Formulation
3.2.1. Data
P = 1{ }1, pL a set of seaports;
W = 1{ }1, wL a set of warehouses;
S = 1{ }1, sL a set of stores;
3.2.2. Parameters:
P: number of seaports; W: number of warehouses; k: number of stores;
iP : Seaport i;
jW : Warehouse j;
kS : Store k;
ijC : Unit shipping cost of product from seaport
iP to warehouse j
W ;
Seaports
Warehouses
Stores
Level 1
Level 2

Journal of Theoretical and Applied Information Technology 20
th February 2015. Vol.72 No.2
© 2005 - 2015 JATIT & LLS. All rights reserved.
ISSN: 1992-8645 www.jatit.org E-ISSN: 1817-3195
297
jkC : Unit shipping cost of product from
warehouse to Storek
S ;
jΓ : Max capacity for a Warehouse j
W :
jF : Fixed cost associated to the establishment of
a Warehouse jW :
ijZ : Flow from seaport
iP to warehouse j
W ;
jkZ : Flow from warehouse jW Port to Store
kS ;
iV : Storage and handling cost for seaport i;
3.2.3. Decision variable:
1 ,
0 ;{ if Flow from seaport t
ij
o warehouse
otherwiseX
1 ,
_
0
i f F lo w fro m s to r e k is s e r v e d
b y w a r e h o u se jj k
o th e rw is e
Y
− −
1,
0 , {
if warehouse j is opened
otherwisejH− − −
3.2.4. Objective function:
( )
1 1 1 1
1 1 1
Min
; 1
p w w sp p p w w
ij ij ij jk jk ij
i j j k
wp
j j i ij ij
j i j
C Z X C Z Y
FY VZ X
= = = =
= = =
+ +
+
∑∑ ∑∑
∑ ∑∑
St:
1,ij
i
X j W≤ ∀ ∈∑ (2)
1,jk
j
Y S= ∀κ∈∑ (3)
w p
ik ij ij
i j
Z X Z=∑ ∑ (4)
w
ij j j
i j
Z H≤ Γ∑ ∑ (5)
j jk
j k
H Y≤∑ ∑ (6)
0,jk j
k
Y H k− ≥ ∀∑ (7)
0,ij j
i
X H i− ∀∑ � (8)
{ }0,1 , ,jk
Y j k∈ ∀ (9)
{ }0,1 , ,ij
X j∈ ∀ι (10)
{ }0, ,1j
H j∈ ∀ (11)
Since, according to the problem hypotheses, all the products requested by a store will be delivered by a single warehouse we will formulate a demand
of store k as k jk jkd Z Y= ∑ .
The objective function (1) minimizes the total cost of setting up and operating the distribution network. The first part gives the total cost for transportation product from seaports to warehouses, the second part present the total cost for product transportation from warehouses to stores. The third part is a cost for opening warehouse. The last part is a total cost for seaports charges.
3.2.5. Constraints explanation
(2) Ensures that a warehouse will be affected to only one seaport; (3) Ensures that a store will be affected to only one warehouse; (4) Ensure that the total flow between warehouses and seaports is equal to the total flow between stores and warehouses.(5)Ensure the allowed flow in a warehouse to not exceed the his capacity; (6) Ensures that at the last one warehouse should be open. (7) Ensures that when a warehouse facility is closed, it can’t serve any store; (8) Ensures that when a warehouse facility is closed, it can’t be attached to any seaport; (9), (10), (11) binary variables.
3.3. Solution Approach
The problem considered in this paper is two-level capacitated facility location problem TLCLAP inspired by the case of a Moroccan company specializing in retail. The company wants to develop the Supply chain network to better manage their products, select seaports and identify warehouses to open up and develop the strategy of distribution that will satisfy all stores opened in Morocco.
The TLCLAP is a variant of location– allocation (LA) problem. The final goal is to locate a set of new facilities between a numbers of specific stores in a specified area such that the global cost in the network is minimized. As a variant of p-median problem, that is proved to be NP-hard which
Journal of Theoretical and Applied Information Technology 20
th February 2015. Vol.72 No.2
© 2005 - 2015 JATIT & LLS. All rights reserved.
ISSN: 1992-8645 www.jatit.org E-ISSN: 1817-3195
298
implies a non-polynomial increase in the size of the solutions space when the number of network nodes is increased even when the network has a simple structure[15], the problem require an heuristic methodology in order to solve large instances. A heuristic algorithm is a solution method that does not guarantee an optimal solution, but in general has a good level of performance in terms of solution quality and convergence.
The p-median problem is an NP-Hard combinatorial optimization problem with interesting real-world applications in various areas including operational research. It has a number of real-world applications and it was also used as a tested for heuristic and meta-heuristic optimization algorithm.
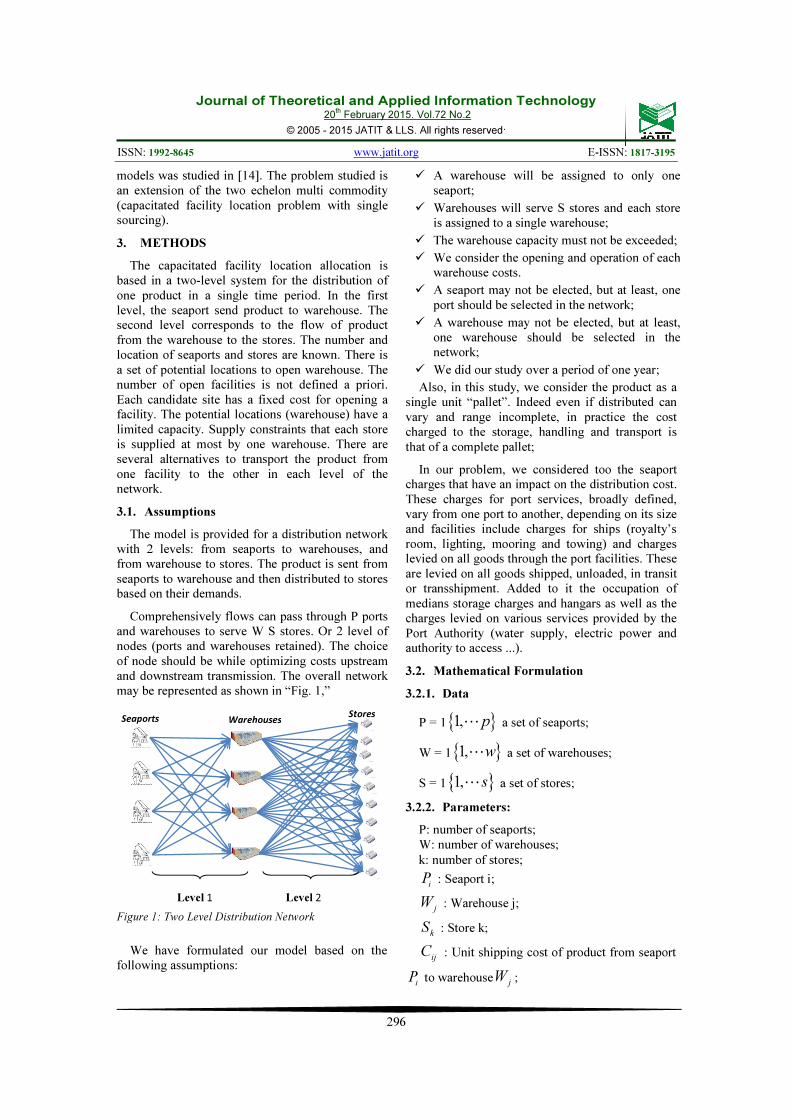
In recent years, many metaheuristics are developed to give a resolution approach for LA problem. Two new heuristic approaches to solve the Discrete Ordered Median Problem was detailed in [16]. Heuristic methods proposed are based on a hybrid genetic algorithms and a generalization of the well-known Fast Interchange heuristic. So, they investigate the effect of encoding on GA performance, by using two different encoding schemes: binary encoding and integer representation. Tien present a hybrid genetic algorithm to solve the uncapacitated location allocation problems. The method proposed incorporates a modified K-means algorithm that clusters the customers into groups based on the rectilinear distance, and then the initial population of solutions is calculated according to the derived centers of clusters[17]. Stanimirovi uses a Genetic Algorithm Approach for solving the Capacitated Single Allocation p-Hub Median Problem[18] . The algorithm uses binary encoding and modified genetic operators. The caching technique is also implemented in the GA in order to improve its effectiveness.
A new hybrid optimization method called Hybrid Evolutionary Firefly-Genetic Algorithm was proposed in [19] and that is inspired by social behavior of fireflies and the phenomenon of bioluminescent communication. The method combines the discrete Firefly Algorithm (FA) with the standard Genetic Algorithm (GA). The study conducted in [20] addresses a facility location and task allocation problem of a two-echelon supply chain against stochastic demand.
In this paper, our proposal is to use a metaheuristic algorithm based on Genetic Algorithm (GA) to solve a TLCLAP, with some
adjustment related to genetic operators that has proven to give quite good results.
3.3.1. Presentation of GA
Genetic Algorithm (GA) is a class of Evolutionary Algorithm (EA) which generates solutions to optimization problems. They are a stochastic optimization algorithms based on the mechanisms of natural selection and genetics.
The idea is to start with a population of potential solutions (chromosomes) initial arbitrarily chosen. The population size is an important factor that has a direct influence on its efficiency and effectiveness. , if the population is composed by a large number of individuals, the probability of obtaining a solution with good quality increases during the evolutionary process of the algorithm, but computational time increases, making it less efficient[21].Performance (fitness) is evaluated relative. Based on this performance, it is possible to create a new population of potential solutions using simple evolutionary operators: selection, crossover and mutation. This cycle is repeated until a satisfactory solution is found (see Algorithm 1). Also, it should be noted that the GA has been successfully applied to the NP-hard problem [22].
Algorithm 1: General Structure of GA
Begin Create an initial population of chromosomes
While stopping condition is not satisfied do
Repeat If (Crossover condition satisfied) then
• Select parent chromosomes
• Define parameters to crossover
• Apply the crossover operator End if
If (Mutation condition satisfied) then Choose mutation points Apply the mutation operator
End if Evaluate fitness of offspring Until sufficient offspring created Select the new population End while
Return the best individual found End
3.3.2. Initial population
GA uses an initial population in the beginning of the evolutionary process which takes place through a sequence of crossing and mutation operators. In this work, The GA starts by randomly generating an initial population of individual representing

Journal of Theoretical and Applied Information Technology 20
th February 2015. Vol.72 No.2
© 2005 - 2015 JATIT & LLS. All rights reserved.
ISSN: 1992-8645 www.jatit.org E-ISSN: 1817-3195
299
potentials solutions which taking in account the constraints.
The initial population is performed by the random generation of variables relating to decision matrix taking into account the constraints of the TLCLAP.
For this, the algorithm 2 provides a manner in which the individual is generated. This generation adopts as strategy of construction a solution which start from the first level (between stores and warehouses) and then move to the second level (between stores and seaports). The transportation costs and the warehouse capacity are considered together, thus enabling the integration between the two distribution levels. The individual will be saved as a set of cluster which represents the delivery route for a store k.
Algorithm 2: Initialization Of Individual
Begin
While (S is not empty) Select randomly k in S
While j kdΓ ≤ and *djk k jC F+
is minimum • Affect k to j
• j j kdΓ →Γ −
• j j kW W d→ +
• Pull k from S End While
End While
For j in W
While ( )*ij i j
C V W+ is minimum
• Affect j to i End While
End For
• Save(Cluster(k,j,i)) End
In this algorithm, we just apply the traditional random initialization method: randomly chose a store and then assign it his relevant warehouse by calculating the total cost from store to warehouse. Then affect by the same process the other stores to their relevant warehouses. After, we assign each warehouse to the sea port according to the most economic delivery route.
The risk for having duplicated individuals is reduced because the technique used for population generation ensures it. Indeed, this is a very effective method for saving the diversity of genetic
material and keeping the algorithm away from premature convergence.
For population selection, we employ the roulette wheel selection with the elite strategy. The roulette wheel selection simply chooses parent according to the fitness value. In order to minimize the total cost, the chromosome with the least fitness value owns the highest chance to be selected. A figure 2 shows an example of TLCLAP solution by considering S=12, W=6 and P=4.
1 2 3 4 5 6 7 8 9 10 11 12
1 0 0 0 0 0 0 0 0 0 0 0 0
2 1 0 0 0 0 0 0 1 0 0 1 0
3 0 0 1 0 0 1 0 0 1 0 0 1
4 0 1 0 0 0 0 1 0 0 0 0 0
5 0 0 0 1 0 0 0 0 0 1 0 0
6 0 0 0 0 1 0 0 0 0 0 0 0
jkj
Y∑
1 1 1 1 1 1 1 1 1 1 1 1
jkY Matrix
Store 1 2 3 4 5 6 7 8 9 10 11 12
Warehouse 2 4 3 5 6 3 4 2 3 5 2 3
Seaport 4 2 3 2 1 3 2 4 3 2 4 3
Merger of the two matrices (ij
X andjk
Y )
Figure 2: Example of Problem Solution
3.3.3. Chromosome encoding
The GA with binary string representation for solving location allocation problem and other similar location problems was used in several researches [23]. In this paper, an integer-coded GA is adopted. Compared with the binary-code GA, the integer -coded GA has several advantages. Indeed it is more convenient for the real-coded GA to denote large scale numbers and search in large scope, and thus the computation complexity is amended and the computation efficiency is improved. The
1 2 3 4 5 6
1 0 0 0 1 0 0
2 0 0 0 0 1 0
3 0 0 1 0 0 1
4 0 1 0 0 0 0
jH
0 1 1 1 1 1
ijX Matrix

Journal of Theoretical and Applied Information Technology 20
th February 2015. Vol.72 No.2
© 2005 - 2015 JATIT & LLS. All rights reserved.
ISSN: 1992-8645 www.jatit.org E-ISSN: 1817-3195
300
solution precision of the real-coded GA is much higher than that of the binary-coded GA[24] .
The genetic code of each individual in GA consists of a string of length 3*S, where the gene is represented as a cluster (route) which indicates the affection of stores and warehouses. Each cluster contains three digits which take values from the set {1, 2,...,S} for the first part of cluster, {0,1, 2,...,W} for the second part of cluster and {0,1, 2,...,P} for the last part. From the genetic code we obtain indices of established facilities in each network level. We can notice the value 0 in the second and third set. This means that we can find a warehouse that is not elected to serve any store and also a port that is not connected to any warehouse.
Almost, this representation of the chromosomes was proposed in [23], in order to propose a simple and effective Genetic Algorithm (GA) to resolve the two-stage capacitated facility location problem. An example is given in “Fig. 3,” according to the network example given.
Figure 3: Chromosome representation
This way of representing an individual is very beneficial because we can easily calculate the fitness function and make crossover and mutation of genes in an easy manner. “Fig. 4,” shows a cluster or a gene unit for GA. This gene contains the following information: the store affectation and the warehouse.
Figure 4: Example of a Gene Unit
3.3.4. Evaluation of Chromosome Fitness
The proposed GA can use the objective function formulation (1) given below as the fitness fitness(chr) of a chromosome. To evaluate the fitness of a chromosome, its representation is first mapped into an allocation array. First, we calculate the total cost of transportation between stores and warehouses. Then we calculate the total flow at each warehouse, which will allow us later to calculate the total transportation costs between warehouses and ports. We take in account the
others cost specially seaport charge and cost for warehouse establishment.
Another method is to calculate the cost of each delivery route in the network and then calculate the sum of costs. A delivery route is the representation given in “Fig. 4,”. In our problem we have exactly S delivery route. The fitness of a chromosome is given according to Algorithm 3.
Algorithm 3: Chromosome Fitness Calculation
Begin
Fitness(chr) =0
For (c In Clusters)
( ) ( ) d
d ( )
jk k
k ij i
fitness chr fitness chr C
C V
= + +
+
×
×
End For
For (w In W)
If (w is opened)
jfitness fitness F= +
End if Return fitness(chr)
End
The performance of a crossover in a problem implementing the genetic algorithm depends on the effective propagation of the building blocks of the solution of the problem. In addition, the contribution of fitness of a cluster in terms of minimizing the objective function depends on the costs in the two levels, the flow in each warehouse and costs in each seaport.
The representation of the gene unit, for the selected chromosome, corresponds to a delivery route in the distribution network. In our case, and to alleviate the implementation of the genetic algorithm problems for combinatorial optimization problems, which mainly concern the respect for the constraints of the TLCLAP we propose a new approach that allows the inclusion of both the function to be minimized and the constraints associated with the problem.
Indeed, we will consider the cost of each delivery route, denoted by ‘s’, in the network including the constraints related to the warehouse capacity, since it is this constraint that requires more interest for the problem. As such, we will define a fitness function as follows:
1
( )(s)
f sφ
= ; (10)
With,
1 2 4 2 4 2 3 3 3 4 5 2 ……. 12 3 3
Cluster
Store Warehouse
Seaport
1 2 4

Journal of Theoretical and Applied Information Technology 20
th February 2015. Vol.72 No.2
© 2005 - 2015 JATIT & LLS. All rights reserved.
ISSN: 1992-8645 www.jatit.org E-ISSN: 1817-3195
301
+ + ) if
0 ;
(Cd C d(s){
ws sw s pwp w
otherwise
QVφ
≤ Γ (11)
And sww ss S
Q Xd∈
=∑
According to this fitness function definition, we can calculate the total fitness for a chromosome and satisfy, wherever possible the warehouse capacity constraint. So, to evaluate a chromosome, simply calculate the sum of gene unit fitness:
( ) ( )s S
fitness chr sφ∈
=∑
3.3.5. Crossover and Mutation
As the GA is a metaheuristics based on biological function selection, the operator responsible for the parental chromosomes crossover select arbitrarily the genes of two parents with an equal probability of selection. The crossover and mutation operators may generate infeasible chromosomes. Verify the feasibility of a chromosome involves applying a correction mechanism that has a very low impact on the computation time.
Once a pair of parents is selected, crossover operator is applied to them producing two offspring. The operator we use in this GA implementation is one-point crossover. One-point crossover is realized with probability P = 0.90. This ensures that approximately 90% pairs of individuals exchange their genetic material. In “Fig. 5,” the crossing of two parental chromosomes generates a child (offspring) chromosome with some genes from parents 1 and 2. This procedure diversifies the population because the children generated replace the parents in the next generation.
1 2 3 4 5 6 7 8 9 10 11 12
4 4 3 5 6 4 1 2 3 5 4 3
4 4 1 2 1 4 2 4 1 2 2 1 Chromosome 1 Cross Over point
Chromosome 2
1 2 3 4 5 6 7 8 9 10 11 12
4 4 3 5 6 4 1 2 3 5 4 3
4 4 1 2 1 4 2 4 3 2 2 3 Offspring 1
1 2 3 4 5 6 7 8 9 10 11 12
2 4 3 5 6 3 4 2 3 5 2 3
4 2 3 2 1 3 2 4 1 2 4 1
Offspring 2
Figure 5: Crossover Operator
As in biology, during crossing, there is a small
possibility that abnormalities occur without a logical reason. After the operation, we can see an infeasible Offspring. For example, when we look at the cluster 1 and 2 for the Offspring 1, we observe that warehouse 4 is allocated at the seaport 4 and at the same time at the seaport 2. In order to obtain correct individuals in the population, we apply a correction mechanism.
Above correction mechanism is applicable only when crossover operation is performed. So, we introduce a sub-cluster definition to indicate a route in the second level of distribution network between warehouse and seaport. So, corrections will be made only in a sub-cluster. Correction method is conducted in accordance with the following steps for each Offspring:
1. Searching the infeasible clusters;
2. Arranging sub-cluster into sets according to
destination route (warehouse);
3. Calculate the cluster’s fitness cost ;
4. Compare the fitness of each cluster in each set
according to equation (11) ;
5. Extract sub-cluster for cluster that have a best
fitness value in each set;
6. Substitute sub-clusters in each set by the sub-
cluster obtained in step 5.
The correction mechanism is applied to the generated offspring so that every time a crossover occurs, since is generated an incorrect offspring. Furthermore, this method seems to be efficient to avoid risk of losing the regions of the search space. It converges since it retains the lowest cost route with respect of warehouse capacity. “Fig. 6,” shows an example of the correction mechanism operated for the offspring 1. The infeasible clusters are arranged in two sets.
Figure 1.
Figure 6: Sets of clusters Concerned by the Correction
Mechanism
The fitness of each cluster (gene unit) is calculated for the two sets. After calculating, we find that for Set 1, f(11)<f(1)<f(2)<f(6) and for the set 2, f(9)=f(12)<f(3). The next step consists of extracting the sub-cluster for cluster 2 and cluster 9.
1 2 3 4 5 6 7 8 9 10 11 12
2 4 3 5 6 3 4 2 3 5 4 3
4 2 3 2 1 3 2 4 3 2 2 3
1
2
6
11
4
4
4
4
4
4
4
2
Set 1 of clusters
3
9
12
3
3
3
1
3
3
Set 2 of clusters
Journal of Theoretical and Applied Information Technology 20
th February 2015. Vol.72 No.2
© 2005 - 2015 JATIT & LLS. All rights reserved.
ISSN: 1992-8645 www.jatit.org E-ISSN: 1817-3195
302
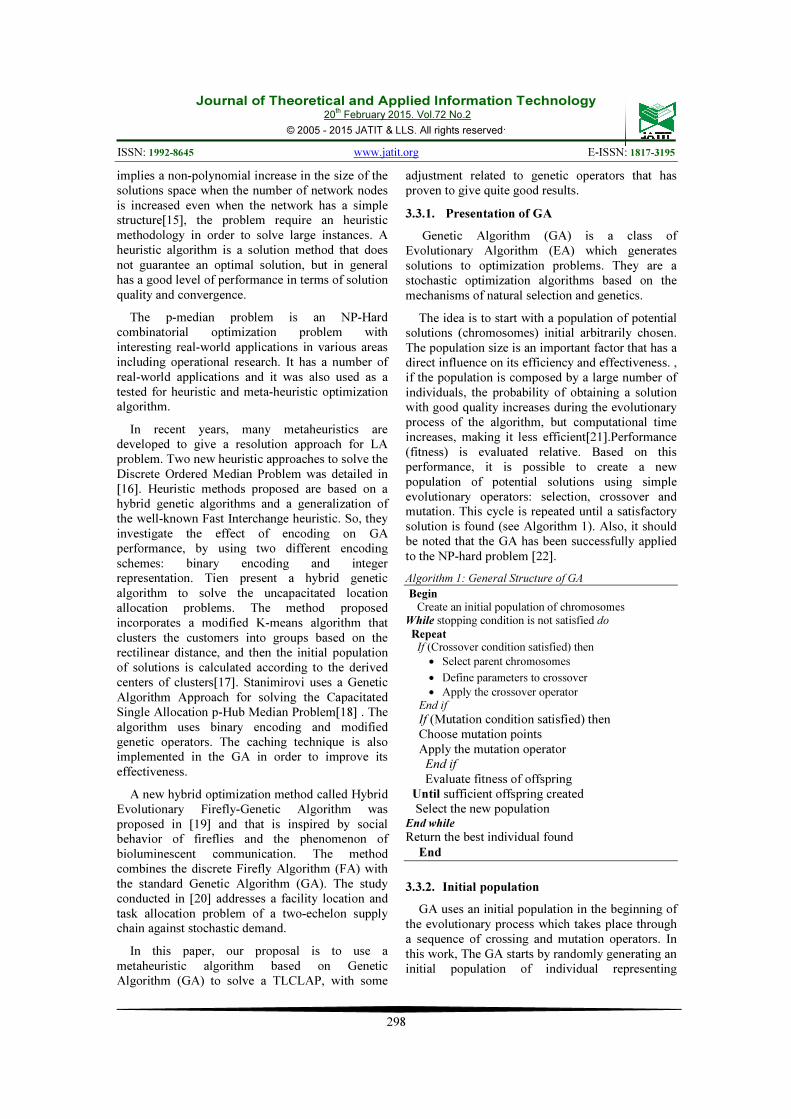
“Fig. 7,” shows how the cluster substitution is performed.
Figure 7: Example of Sub-cluster Correction
Thus, we note that the offspring 1 has been corrected. The same correction is used for the offspring 2. In case of having the same fitness value, we will select randomly one of sub-clusters to make substitution.
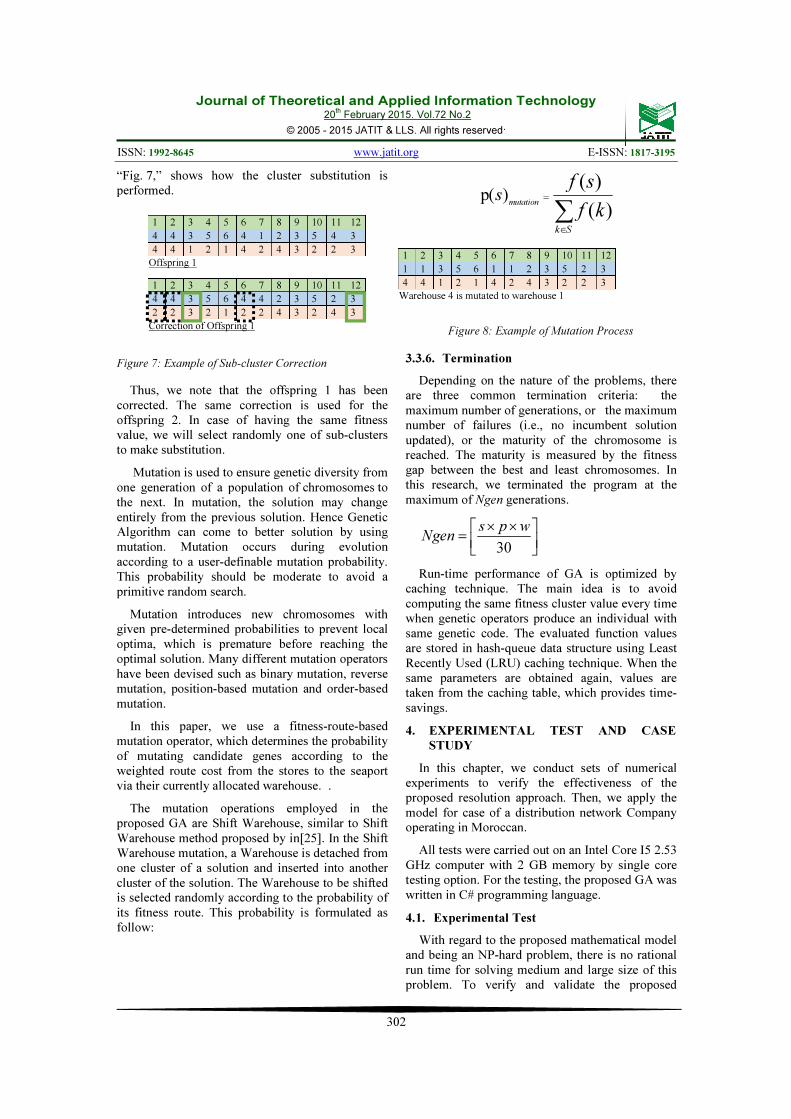
Mutation is used to ensure genetic diversity from one generation of a population of chromosomes to the next. In mutation, the solution may change entirely from the previous solution. Hence Genetic Algorithm can come to better solution by using mutation. Mutation occurs during evolution according to a user-definable mutation probability. This probability should be moderate to avoid a primitive random search.
Mutation introduces new chromosomes with given pre-determined probabilities to prevent local optima, which is premature before reaching the optimal solution. Many different mutation operators have been devised such as binary mutation, reverse mutation, position-based mutation and order-based mutation.
In this paper, we use a fitness-route-based mutation operator, which determines the probability of mutating candidate genes according to the weighted route cost from the stores to the seaport via their currently allocated warehouse. .
The mutation operations employed in the proposed GA are Shift Warehouse, similar to Shift Warehouse method proposed by in[25]. In the Shift Warehouse mutation, a Warehouse is detached from one cluster of a solution and inserted into another cluster of the solution. The Warehouse to be shifted is selected randomly according to the probability of its fitness route. This probability is formulated as follow:
p( )( )
( )mutation
k S
s
f s
f k=
∈
∑
Figure 8: Example of Mutation Process
3.3.6. Termination
Depending on the nature of the problems, there are three common termination criteria: the maximum number of generations, or the maximum number of failures (i.e., no incumbent solution updated), or the maturity of the chromosome is reached. The maturity is measured by the fitness gap between the best and least chromosomes. In this research, we terminated the program at the maximum of Ngen generations.
30
s p wNgen
× × =
Run-time performance of GA is optimized by caching technique. The main idea is to avoid computing the same fitness cluster value every time when genetic operators produce an individual with same genetic code. The evaluated function values are stored in hash-queue data structure using Least Recently Used (LRU) caching technique. When the same parameters are obtained again, values are taken from the caching table, which provides time-savings.
4. EXPERIMENTAL TEST AND CASE
STUDY
In this chapter, we conduct sets of numerical experiments to verify the effectiveness of the proposed resolution approach. Then, we apply the model for case of a distribution network Company operating in Moroccan.
All tests were carried out on an Intel Core I5 2.53 GHz computer with 2 GB memory by single core testing option. For the testing, the proposed GA was written in C# programming language.
4.1. Experimental Test
With regard to the proposed mathematical model and being an NP-hard problem, there is no rational run time for solving medium and large size of this problem. To verify and validate the proposed
1 2 3 4 5 6 7 8 9 10 11 12
4 4 3 5 6 4 4 2 3 5 2 3
2 2 3 2 1 2 2 4 3 2 4 3
Correction of Offspring 1
1 2 3 4 5 6 7 8 9 10 11 12
4 4 3 5 6 4 1 2 3 5 4 3
4 4 1 2 1 4 2 4 3 2 2 3
Offspring 1 1 2 3 4 5 6 7 8 9 10 11 12
1 1 3 5 6 1 1 2 3 5 2 3
4 4 1 2 1 4 2 4 3 2 2 3
Warehouse 4 is mutated to warehouse 1

Journal of Theoretical and Applied Information Technology 20
th February 2015. Vol.72 No.2
© 2005 - 2015 JATIT & LLS. All rights reserved.
ISSN: 1992-8645 www.jatit.org E-ISSN: 1817-3195
303
algorithm, some small scale problems with simple parameters are solved by exact solutions are compared with the answers of the proposed genetic algorithm. Thus, we use CPLEX software to solve the mathematical model with exact approach.
The results of solving small-size problems with exact algorithms show that they are identical with the solutions resulting from the proposed genetic algorithm. Exact algorithms find the optimal solution with exploring all the search space of the problems. In consequence, this result indicates that the proposed genetic algorithm can achieve optimality in problems with small size and this demonstrates the validation of the algorithm. Therefore, it can be concluded that the proposed algorithm is appropriate for solving medium and large scale problems.
For the experimental test in medium and large scale, the size of TLCLAP in terms of number of seaports, warehouses and stores vary from a relatively small one (2, 4, 12) to an excitingly large one (14, 36, 162) for real-world case, respectively. The size and computing complexity for each initial network parameters are given in Table 1. The indexes of the instances are given in first column. The instance’s index carries information about the number of seaports, the number of warehouses, the number of stores and the variables involved respectively.
Table 1: Initial Problems Parameters
Ten trial runs were performed for each instance. The performance was compared using two criteria: the average value of the solution obtained in all trials; the processing time to reach the optimum target value. The initial population size was fixed at the value IPS.
2
s p wIPS
× × =
Table 2: GA Results On The Instances
As it can be seen in Table 2, the average running times for generating initial population is very important regarding the average GA total run time (about 41,26%).This can be explained by the great value of initial population and the algorithm responsible for this generation requires compliance with the problem constraints. Thus, the important algorithm workload is devoted at this GA step.
As expected, solutions of the improved GA are obtained in a reasonable computational time. The GA is accomplished on instances with the greater number of stores and greater number of warehouses facilities (instance 5 and 6). It is interesting to observe that the behavior of each test problems was consistent in term of running time and solution quality. It can be concluded that the GA proposed is a promising optimization approach.
4.2. Case Study
The proposed model was applied to a Moroccan company specialized in retails through a project conducted by their top management. The project aims to optimize the costs of transportation to various levels of the chain, regardless of the value of the products and their storage costs. It also includes the cost of depreciation over 5 years of each new site and its operating costs. It assesses the impact of changing a node (a seaport or warehouse distribution) on the overall cost.
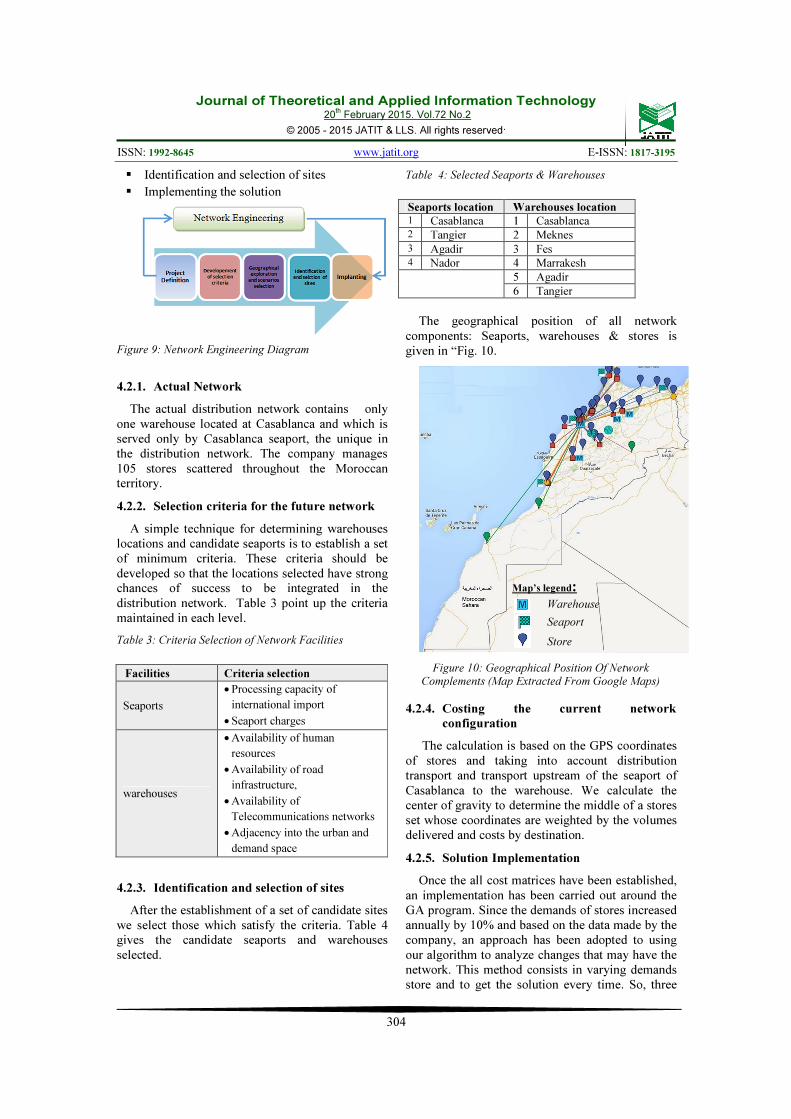
To accomplish effectively the above project we adopted the following steps given in “Fig 9,” by the framework of Network engineering [26]:
� Definition of the project and its scope � Development of selection criteria for various
scenarios � Geographic Exploration of various expansion
options
Inst Initial
Population
size
Avg
run
time
(ms)
Avg
solution
GA
optimal
Sol
Avg
Total
run
Time
(s)
1 144 11 68058,43 67092,68 0,27
2 1512 379 59693,14 58724,25 0,94
3 5184 2916 63316,57 62498,71 6,89
4 12240 12006 68687,71 67785,96 34,11
5 23760 37348 66352,85 65407,35 84,83
6 40824 82457 71424,42 70602,59 185,52
Inst
Number
of
Seaport
Number of Warehouse
Number of
Stores
Number of
decision
variables
Order Complexity
1 4 6 12 96 Ɵ�6� ∗ 12��
2 6 12 42 576 Ɵ�12� ∗ 42���
3 8 18 72 1440 Ɵ�18� ∗ 72���
4 10 24 102 2688 Ɵ�24�� ∗ 102���
5 12 30 132 4320 Ɵ�30�� ∗ 132���
6 14 36 162 6336 Ɵ�36�� ∗ 162���
Journal of Theoretical and Applied Information Technology 20
th February 2015. Vol.72 No.2
© 2005 - 2015 JATIT & LLS. All rights reserved.
ISSN: 1992-8645 www.jatit.org E-ISSN: 1817-3195
304
� Identification and selection of sites � Implementing the solution
Figure 9: Network Engineering Diagram
4.2.1. Actual Network
The actual distribution network contains only one warehouse located at Casablanca and which is served only by Casablanca seaport, the unique in the distribution network. The company manages 105 stores scattered throughout the Moroccan territory.
4.2.2. Selection criteria for the future network
A simple technique for determining warehouses locations and candidate seaports is to establish a set of minimum criteria. These criteria should be developed so that the locations selected have strong chances of success to be integrated in the distribution network. Table 3 point up the criteria maintained in each level.
Table 3: Criteria Selection of Network Facilities
Facilities Criteria selection
Seaports
• Processing capacity of
international import
• Seaport charges
warehouses
• Availability of human
resources
• Availability of road
infrastructure,
• Availability of
Telecommunications networks
• Adjacency into the urban and
demand space
4.2.3. Identification and selection of sites
After the establishment of a set of candidate sites we select those which satisfy the criteria. Table 4 gives the candidate seaports and warehouses selected.
Table 4: Selected Seaports & Warehouses
Seaports location Warehouses location 1 Casablanca 1 Casablanca 2 Tangier 2 Meknes 3 Agadir 3 Fes 4 Nador 4 Marrakesh
5 Agadir
6 Tangier
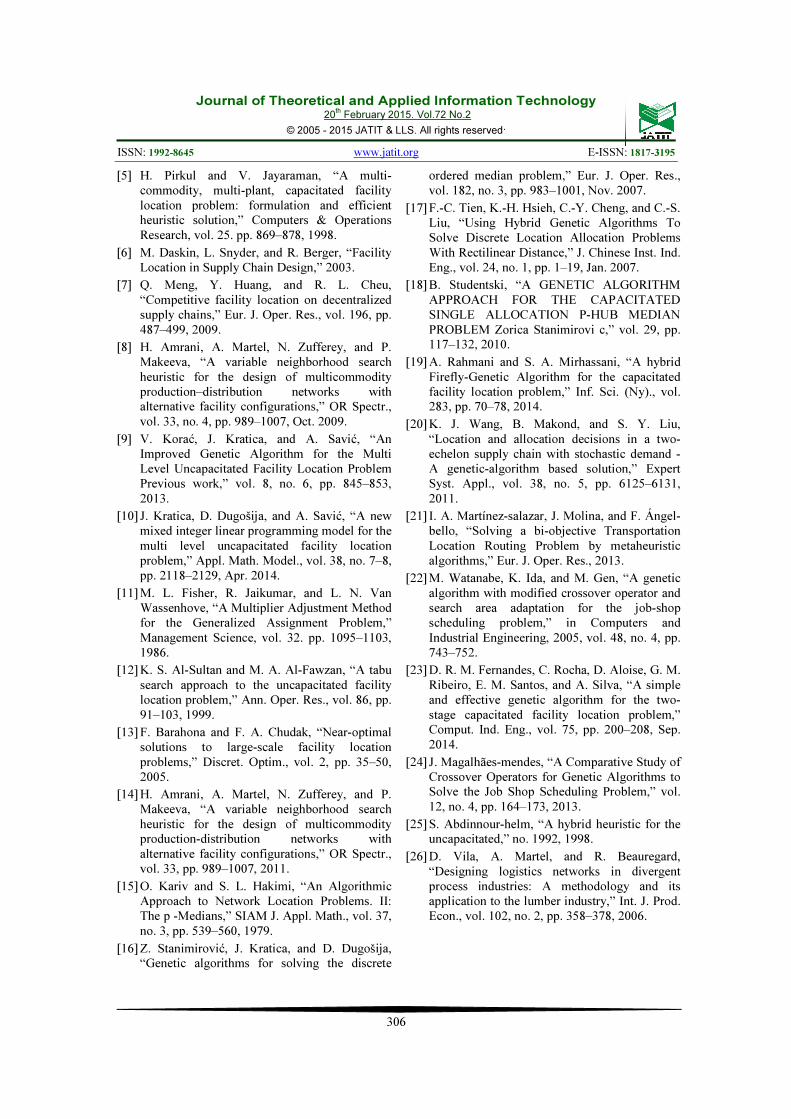
The geographical position of all network components: Seaports, warehouses & stores is given in “Fig. 10.
Figure 10: Geographical Position Of Network Complements (Map Extracted From Google Maps)
4.2.4. Costing the current network
configuration
The calculation is based on the GPS coordinates of stores and taking into account distribution transport and transport upstream of the seaport of Casablanca to the warehouse. We calculate the center of gravity to determine the middle of a stores set whose coordinates are weighted by the volumes delivered and costs by destination.
4.2.5. Solution Implementation
Once the all cost matrices have been established, an implementation has been carried out around the GA program. Since the demands of stores increased annually by 10% and based on the data made by the company, an approach has been adopted to using our algorithm to analyze changes that may have the network. This method consists in varying demands store and to get the solution every time. So, three
Map’s legend:
Warehouse
Seaport
Store

Journal of Theoretical and Applied Information Technology 20
th February 2015. Vol.72 No.2
© 2005 - 2015 JATIT & LLS. All rights reserved.
ISSN: 1992-8645 www.jatit.org E-ISSN: 1817-3195
305
scenarios are created based on this investigation. The implementation of the GA solution gives the results hereinafter in table 5.
Table 5 Network Solutions And Analysis
Seaports=4;Warehouses=6; Stores=105
GA solution
Scenario Seaport warehouse Projection
Period
Total
cost
(MDH)
1 Seaport 2
(Tangier)
Warehouse 1
(Casablanca)
Year
2014(Actual
Situation)
44
2 Seaport 2
(Tangier)
Warehouse 1
(Casablanca)
Warehouse 2
(Meknes)
After 12
years (2026) 130
3 Seaport 2
(Tangier)
Warehouse 1
(Casablanca)
Warehouse 2
(Meknes)
Warehouse 2
(Agadir)
After 17
years (2031) 270
4.3. Discussions
With current volumes and taking in account the progression rate of stores demands, the only change to be making in the network is to change the seaport (network Level 1). Instead of the Casablanca seaport we should select Tangier seaport that provides the ability to save about 10% on international transport.
Investing in a warehouse in the north west of Morocco would be profitable only after 12 years. Indeed, the savings on transportation costs equalize the distribution of investment costs on a warehouse in the region of Meknes. On the same principle, opening a warehouse on the region of Agadir is justified after 17 years.
According to this analysis, we can talk about the robustness of the model that reflect the property of a distribution network configuration which is able to guarantee the lowest expected cost in the long-run, over the potential scenarios determined by the changes in the external context. Also, it was noted the model stability ensures by the property of a distribution network configuration to show a restricted sensitivity to demand variability.
5. CONCLUSION
Concern about performance improvement in distribution fields motivates the study of the design network to better manage to cost generated by operating in a logistic network. This paper deals with the two-level capacitated facility location problem. New genetic algorithm approach is
proposed. After having formulated the mathematical formulation, an improved Genetic Algorithm was detailed. Improvements are achieved, firstly, by using an efficient approach for generating the initial population Secondly, by adopting a new representation of chromosomes that facilitate the GA implementation. A good method is developed to preserve the solutions feasibility during the GA process. The GA approach given in our study seems to be efficient in terms of best-known solutions and running times. It can be concluded that techniques related to generation of initial population and chromosome encoding with the fitness for each cluster represent considerable improvements in solving two-level capacitated facility location problem.
Through the application of the approach presented in this paper for a real case of Moroccan distribution Company, it also turns out that it is an effective tool for analysis, design and projection of distribution networks regarding its robustness and stability.
This research can be extended in several ways. It would be desirable to investigate the application of the proposed GA in case of three or four levels including suppliers and/or customers. Further research should also be directed at solving similar problems taking in account the risk in establishment a distribution networks.
REFERENCES:
[1] C. H. Aikens, “Facility location models for distribution planning,” Eur. J. Oper. Res., vol. 22, no. 3, pp. 263–279, Dec. 1985.
[2] M. L. Brandeau and S. S. Chiu, “An Overview of Representative Problems in Location Research,” Management Science, vol. 35. pp. 645–674, 1989.
[3] P. Avella, S. Benati, L. Cánovas Martinez, K. Dalby, D. Di Girolamo, B. Dimitrijevic, G. Ghiani, I. Giannikos, N. Guttmann, T. H. Hultberg, J. Fliege, A. Marin, M. Munõz Márquez, M. M. Ndiaye, S. Nickel, P. Peeters, D. Pérez Brito, S. Policastro, F. A. Saldanha de Gama, and P. Zidda, “Some personal views on the current state and the future of locational analysis,” European Journal of Operational Research, vol. 104. pp. 269–287, 1998.
[4] V. Jayaraman, “An Efficient Heuristic Procedure for Practical-Sized Capacitated Warehouse Design and Management,” Decis. Sci., vol. 29, pp. 729–745, 1998.
Journal of Theoretical and Applied Information Technology 20
th February 2015. Vol.72 No.2
© 2005 - 2015 JATIT & LLS. All rights reserved.
ISSN: 1992-8645 www.jatit.org E-ISSN: 1817-3195
306
[5] H. Pirkul and V. Jayaraman, “A multi-commodity, multi-plant, capacitated facility location problem: formulation and efficient heuristic solution,” Computers & Operations Research, vol. 25. pp. 869–878, 1998.
[6] M. Daskin, L. Snyder, and R. Berger, “Facility Location in Supply Chain Design,” 2003.
[7] Q. Meng, Y. Huang, and R. L. Cheu, “Competitive facility location on decentralized supply chains,” Eur. J. Oper. Res., vol. 196, pp. 487–499, 2009.
[8] H. Amrani, A. Martel, N. Zufferey, and P. Makeeva, “A variable neighborhood search heuristic for the design of multicommodity production–distribution networks with alternative facility configurations,” OR Spectr., vol. 33, no. 4, pp. 989–1007, Oct. 2009.
[9] V. Korać, J. Kratica, and A. Savić, “An Improved Genetic Algorithm for the Multi Level Uncapacitated Facility Location Problem Previous work,” vol. 8, no. 6, pp. 845–853, 2013.
[10] J. Kratica, D. Dugošija, and A. Savić, “A new mixed integer linear programming model for the multi level uncapacitated facility location problem,” Appl. Math. Model., vol. 38, no. 7–8, pp. 2118–2129, Apr. 2014.
[11] M. L. Fisher, R. Jaikumar, and L. N. Van Wassenhove, “A Multiplier Adjustment Method for the Generalized Assignment Problem,” Management Science, vol. 32. pp. 1095–1103, 1986.
[12] K. S. Al-Sultan and M. A. Al-Fawzan, “A tabu search approach to the uncapacitated facility location problem,” Ann. Oper. Res., vol. 86, pp. 91–103, 1999.
[13] F. Barahona and F. A. Chudak, “Near-optimal solutions to large-scale facility location problems,” Discret. Optim., vol. 2, pp. 35–50, 2005.
[14] H. Amrani, A. Martel, N. Zufferey, and P. Makeeva, “A variable neighborhood search heuristic for the design of multicommodity production-distribution networks with alternative facility configurations,” OR Spectr., vol. 33, pp. 989–1007, 2011.
[15] O. Kariv and S. L. Hakimi, “An Algorithmic Approach to Network Location Problems. II: The p -Medians,” SIAM J. Appl. Math., vol. 37, no. 3, pp. 539–560, 1979.
[16] Z. Stanimirović, J. Kratica, and D. Dugošija, “Genetic algorithms for solving the discrete
ordered median problem,” Eur. J. Oper. Res., vol. 182, no. 3, pp. 983–1001, Nov. 2007.
[17] F.-C. Tien, K.-H. Hsieh, C.-Y. Cheng, and C.-S. Liu, “Using Hybrid Genetic Algorithms To Solve Discrete Location Allocation Problems With Rectilinear Distance,” J. Chinese Inst. Ind. Eng., vol. 24, no. 1, pp. 1–19, Jan. 2007.
[18] B. Studentski, “A GENETIC ALGORITHM APPROACH FOR THE CAPACITATED SINGLE ALLOCATION P-HUB MEDIAN PROBLEM Zorica Stanimirovi c,” vol. 29, pp. 117–132, 2010.
[19] A. Rahmani and S. A. Mirhassani, “A hybrid Firefly-Genetic Algorithm for the capacitated facility location problem,” Inf. Sci. (Ny)., vol. 283, pp. 70–78, 2014.
[20] K. J. Wang, B. Makond, and S. Y. Liu, “Location and allocation decisions in a two-echelon supply chain with stochastic demand - A genetic-algorithm based solution,” Expert Syst. Appl., vol. 38, no. 5, pp. 6125–6131, 2011.
[21] I. A. Martínez-salazar, J. Molina, and F. Ángel-bello, “Solving a bi-objective Transportation Location Routing Problem by metaheuristic algorithms,” Eur. J. Oper. Res., 2013.
[22] M. Watanabe, K. Ida, and M. Gen, “A genetic algorithm with modified crossover operator and search area adaptation for the job-shop scheduling problem,” in Computers and Industrial Engineering, 2005, vol. 48, no. 4, pp. 743–752.
[23] D. R. M. Fernandes, C. Rocha, D. Aloise, G. M. Ribeiro, E. M. Santos, and A. Silva, “A simple and effective genetic algorithm for the two-stage capacitated facility location problem,” Comput. Ind. Eng., vol. 75, pp. 200–208, Sep. 2014.
[24] J. Magalhães-mendes, “A Comparative Study of Crossover Operators for Genetic Algorithms to Solve the Job Shop Scheduling Problem,” vol. 12, no. 4, pp. 164–173, 2013.
[25] S. Abdinnour-helm, “A hybrid heuristic for the uncapacitated,” no. 1992, 1998.
[26] D. Vila, A. Martel, and R. Beauregard, “Designing logistics networks in divergent process industries: A methodology and its application to the lumber industry,” Int. J. Prod. Econ., vol. 102, no. 2, pp. 358–378, 2006.