Embed Size (px)
Citation preview
162. PROFILE ON THE PRODUCTION OF
CORRUGATED IRON SHEET

162-1
TABLE OF CONTENTS
PAGE
I. SUMMARY 162-2
II. PRODUCT DESCRIPTION & APPLICATION 162-2
III. MARKET STUDY AND PLANT CAPACITY 162-3
A. MARKET STUDY 162-3
B. PLANT CAPACITY & PRODUCTION PROGRAM 162-6
IV. MATERIALS AND INPUTS 162-7
A. RAW & AUXILIARY MATERIALS 162-7
B. UTILITIES 162-8
V. TECHNOLOGY & ENGINEERING 162-9
A. TECHNOLOGY 162-9
B. ENGINEERING 162-9
VI. HUMAN RESOURCE & TRAINING REQUIREMENT 162-13
A. HUMAN RESOURCE REQUIREMENT 162-13
B. TRAINING REQUIREMENT 162-14
VII. FINANCIAL ANLYSIS 162-15
A. TOTAL INITIAL INVESTMENT COST 162-15
B. PRODUCTION COST 162-16
C. FINANCIAL EVALUATION 162-17
D. ECONOMIC AND SOCIAL BENEFITS 162-19

162-2
I. SUMMARY
This profile envisages the establishment of a plant for the production of corrugated iron sheet
with a capacity of 15,000 tons per annum. Corrugated iron sheet is used for roofing of houses and
other construction.
The demand for corrugated iron sheet is met through both local production and import. The
present (2012) demand for corrugated iron sheet is estimated at 705,195 tons. The demand for
corrugated iron sheet is projected to reach 1,418,399 tons and 2,852,906 tons by the year 2017
and 2022, respectively.
The principal raw materials required is plain iron sheet which has to be imported.
The total investment cost of the project including working capital is estimated at Birr 48.87
million. From the total investment cost the highest share (Birr 30.60 million or 62.62%) is
accounted by initial working capital followed by fixed investment cost (Birr 14.31 million or
29.29%) and pre operation cost (Birr 3.95 million or 8.09%). From the total investment cost Birr
7.74 million or 15.83% is required in foreign currency.
The project is financially viable with an internal rate of return (IRR) of 34.48% and a net present
value (NPV) of Birr 67.82 million discounted at 10%.
The project can create employment for 28 persons. The establishment of such factory will have a
foreign exchange saving effect to the country by substituting the current imports. The project
will also create forward linkage with the construction sub sector and also generates income for
the Government in terms of tax revenue and payroll tax.
II. PRODUCT DESCRIPTION AND APPLICATION
Corrugated iron sheet is used for roofing of houses and other construction. Corrugated iron
sheets are classified according to their thickness and surface area. Standard gauge sizes are 28,
30 and 32. It is usually manufactured 2 meters in length and 1.2 meters in width. Corrugated

162-3
iron sheets are mostly used for roofing and fencing. Corrugation is a process of deforming plain
sheets in the uniform way or zigzag shapes pattern by rolling mills across their entire width.
III. MARKET AND PLANT CAPACITY
A. MARKET STUDY
1. Past Supply and Present Demand
The country’s requirement of corrugated iron sheet is met through both local production and
imports. According to CSA as of 2010 there are 23 local producers of corrugated iron sheet
while the products are imported from various countries. Table 3.1 summarizes local production,
import and total supply or apparent consumption of corrugated iron sheet.
Table 3.1
LOCAL PRODUCTION, IMPORT AND TOTAL SUPPLY OR APPARENT
CONSUMPTION OF CORRUGATED IRON SHEET (TONS)
Year
Local *
production Import** Total
2002 35,341 6,023 41,364
2003 30,688 6,173 36,861
2004 70,760 3,048 73,808
2005 35,628 2,997 38,625
2006 114,223 592 114,815
2007 604,973 157 605,130
2008 643,903 763 644,666
2009 785,925 16,547 802,472
2010 464,308 17,064 481,372
2011 631,3791 8,036 639,415
Source: * CSA’s “Survey on Large and medium scale manufacturing”
** Ethiopian Revenues & Customs Authority
1 Local production data for 2011 is not available. Hence the average production during the previous three years
(2008-2010) is considered as the production level in 2011

162-4
As can be seen from Table 3.1, the total supply or apparent consumption of corrugated iron sheet
during the period 2002 – 2011 reveals a growth trend specially beginning from year 2007. The
annual average total supply or apparent consumption which was 61,095 tons during the period
2002-2006 has increased to an annual average of 634,611 tons during the period 2007-2011.
Considering the nature of the trend in the apparent consumption of corrugated iron sheet it is
assumed that the growth rate registered in the past will also continue in the near future. During
the period 2002 – 2011 total supply of corrugated iron sheet has registered an average annual
growth rate of 76.65% which is on the high side. Hence, in order to be conservative a growth rate
of 10% is considered.
Accordingly, taking the average apparent consumption during the period 2009-2011 as a base
and applying a growth rate of 10% the present effective demand (2012) for corrugated iron sheet
is estimated at 705,195 tons.
2. Projected Demand
The demand for corrugated iron sheet depends mainly on the performance of its end-user (i.e. the
construction sector or more specifically the building construction sector). Therefore, the demand
for the products under consideration is a derived demand, which depends directly on the
performance of its major end – user.
The construction sector of the country has undergone tremendous changes and development in
recent years. The contribution of the construction sector to the GDP during the period 2001 –
2010 have been growing at annual average growth rate of 13 percent which is above the
average annual growth rate of real GDP during the period under consideration (11.4 %),
indicating a rise in the share of the construction sector within the overall economy. Moreover,
during the GTP period (2010 – 2015), the construction sector is expected to grow at annual
average growth rate of 20%.

162-5
On the other hand, among the factors that influence the demand for corrugated iron sheet one of
the critical factor is identified to be economic growth leading to growth of the construction
sector. According to the government’s “Growth and Transformation Plan” during the period
2010 – 2015 the GDP of the country is expected to grow at a minimum average annual growth
rate of 11.2%.
Accordingly, based on the above discussion a growth rate of 15% which is slightly higher than
the expected growth rate of the country’s GDP during the GTP period (2011 – 2015) is used.
Moreover, it is assumed that the highest local production during 2002 – 2011 indicates the
current local production capacity of corrugated iron sheet.
Based on the above assumption and using the estimated present demand as a base the projected
demand for corrugated iron sheet and demand supply gap is shown in Table 3.5.
Table 3.5
PROJECTED DEMAND FOR CORRUGATED IRON SHEET AND DEMAND SUPPLY GAP (TONS)
Year
Projected
Demand Existing
Capacity
Demand
Supply
Gap
2013 810,974 786,000 24,974
2014 932,620 786,000 146,620
2015 1,072,513 786,000 286,513
2016 1,233,390 786,000 447,390
2017 1,418,399 786,000 632,399
2018 1,631,158 786,000 845,158
2019 1,875,832 786,000 1,089,832
2020 2,157,207 786,000 1,371,207
2021 2,480,788 786,000 1,694,788
2022 2,852,906 786,000 2,066,906
2023 3,280,842 786,000 2,494,842
2024 3,772,969 786,000 2,986,969
2025 4,338,914 786,000 3,552,914
162-6
3. Pricing and Distribution
The current retail price of gauge 30 corrugated iron sheet is Birr 60 per pieces. Considering
wholesalers and retailers margin of 25% the recommended factory gate price for the envisaged
factory is Birr 45 per pieces or Birr 10,000 per ton.
Considering the nature of the products and the characteristics of the end users a combination
both direct distribution to end users (for bulk purchasers) and indirect distribution (using agents)
is selected as the most appropriate distribution channel.
B. PLANT CAPACITY AND PRODUCTION PROGRAM
1. Plant Capacity
The annual production capacity for the envisaged plant will be 15,000 tons. This is based on a
single shift of 8 hours operation per day and for 300 days a year. When demand rises the
production capacity will also be increased either by feeding or rolling multiple sheets at the same
time or by introducing additional shifts. The product mix is scheduled as 50%, 30% and 20%
for 32, 30 and 28 gauges, respectively.
2. Production Program
The production programme will be carried out in such a way that the plant will initially produce
at 75% of its capacity, and then will raise its production to 85% in the second year. It will then
attain full capacity production in the third and succeeding years. Such a gradual build-up of
production is required inorder to give opportunity for production workers and technicians to
develop skills and experience on operation and maintenance on plant machinery and equipment.
Table 3.3 shows production program.
162-7
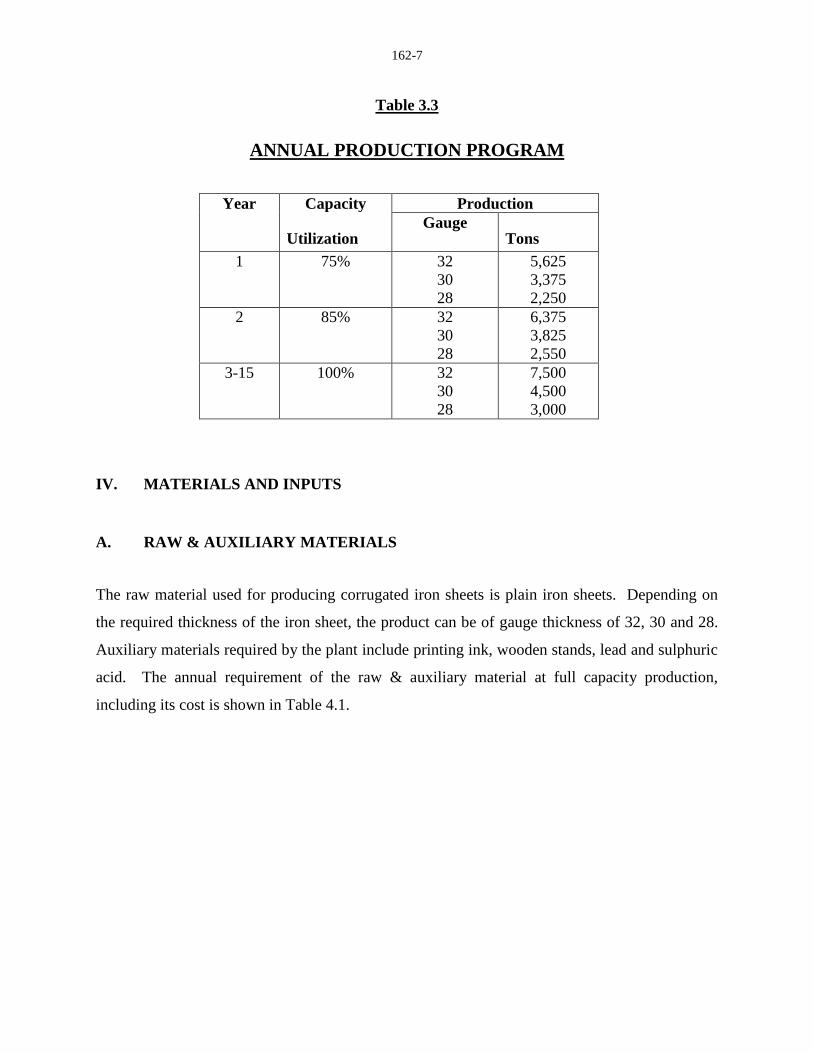
Table 3.3
ANNUAL PRODUCTION PROGRAM
Year Capacity Production
Utilization
Gauge Tons
1 75% 32
30
28
5,625
3,375
2,250
2 85% 32
30
28
6,375
3,825
2,550
3-15 100% 32
30
28
7,500
4,500
3,000
IV. MATERIALS AND INPUTS
A. RAW & AUXILIARY MATERIALS
The raw material used for producing corrugated iron sheets is plain iron sheets. Depending on
the required thickness of the iron sheet, the product can be of gauge thickness of 32, 30 and 28.
Auxiliary materials required by the plant include printing ink, wooden stands, lead and sulphuric
acid. The annual requirement of the raw & auxiliary material at full capacity production,
including its cost is shown in Table 4.1.

162-8
Table 4.1
RAW AND AUXILIARY MATERIALS AND COST
Sr. Description Qty
(tons)
Unit
Price ( Birr)
Cost ('000 Birr)
No. FC LC TC
1
A. Raw Materials
Plain iron sheet
a) 28 gauge
b) 30 gauge
c) 32 gauge
3,000
7,500
4,500
8,700
8,700
8,700
26,100
65,250
39,150
-
-
-
26,100
65,250
39,150
Sub-total 15,000 130,500 130,500
1
2
3
4
B. Auxiliary Materials
Printing ink
Lead
Wooden stands
Sulphuric acid
1,500
kg
3,000
kg
As reqd.
As reqd
-
-
-
-
67.5
9
-
-
-
-
25
15
67.5
9
25
15
Sub-total 76.5 40 116.5
Bank, insurance and customs
charges, transportation and
material handling costs
-
-
-
150
150
Total Landed Cost 130,576.5 190 130,766.50
Thus, the total annual raw and auxiliary materials cost at full production capacity of the plant is
estimated at Birr 130.77 million.
B. UTILITIES
Electricity and water are inputs required for the envisaged plant. Annual requirements of
electricity and water at full production capacity are estimated to be 1,000,000 kWh and 150m3,
respectively. At the unit rate of Birr 0.5778 and 10/ m3 for electricity and water, respectively,
the annual requirement of utilities is estimated to be Birr 706,116.

162-9
V. TECHNOLOGY AND ENGINEERING
A. TECHNOLOGY
1. Production Process
The production process of making corrugated iron sheet consisted of cleaning the rust and other
ingredients from the plain iron sheet, then drying by dry, hot air. Then the iron sheet is passed
into the molten lead to attain the required thickness. It is then dried by forced air from where it
is fed to feeding table by a suitable hoist or crane. Then they are conveyed to the corrugating
machine. After corrugation, the product is passed to correcting machine where deformation is
corrected. The product is then cut to standard size and trade mark of the company is printed.
2. Environmental Impact
Since the raw material used by the plant is pre coated steel sheet the production process does not
have negative environmental impact.
B. ENGINEERING
1. Machinery and Equipment
The total cost of machinery and equipment is estimated at Birr 8.115 million, of which Birr 7.74
million is required in foreign currency, and the remaining Birr 0.375 million is in local currency.
The machinery & equipment required for the envisaged plant and corresponding cost is depicted
in Table 5.1.

162-10
Table 5.1
MACHINERY AND EQUIPMENT REQUIREMENT & COST
Sr. Description Qty. Cost (‘000 Birr)
No. No. FC
LC TC
1 Crane (10 tons) for loading and
unloading
1
2,100
2,100
2 Feeding conveyor 1 900 900
3 Feeding table 1 90 90
4 Corrugating machine 1 1,800 1,800
5 Correcting machine 1 1,350 1,350
6 cutting (rimming) machine 1 900 900
7 Furnace (oil fired) 1 180 180
8 Boiler (oil fired) 1 330 330
9 Other auxiliary equipment Req. 90 90
Sub-total 7,740 7,740
Bank, customs and insurance
charges, transport and handling
costs
375 375
Total Landed Cost 7,740 375 8,115
2. Land, Building and Civil Works
Land is required to accommodate plant building, management offices, social building for
workers, stores, internal roads, adequate space for expansion and other industry related activities.
The total land area for the envisaged plant is estimated at 2,000 m2. The built-up area is
estimated at 1,000 m2. At building rate of Birr 5,000 per m
2 the cost of building and civil works
will be Birr 5 million
According to the Federal Legislation on the Lease Holding of Urban Land (Proclamation No
721/2004) in principle, urban land permit by lease is on auction or negotiation basis, however,
the time and condition of applying the proclamation shall be determined by the concerned
regional or city government depending on the level of development.

162-11
The legislation has also set the maximum on lease period and the payment of lease prices. The
lease period ranges from 99 years for education, cultural research health, sport, NGO , religious
and residential area to 80 years for industry and 70 years for trade while the lease payment
period ranges from 10 years to 60 years based on the towns grade and type of investment.
Moreover, advance payment of lease based on the type of investment ranges from 5% to
10%.The lease price is payable after the grace period annually. For those that pay the entire
amount of the lease will receive 0.5% discount from the total lease value and those that pay in
installments will be charged interest based on the prevailing interest rate of banks. Moreover,
based on the type of investment, two to seven years grace period shall also be provided.
However, the Federal Legislation on the Lease Holding of Urban Land apart from setting the
maximum has conferred on regional and city governments the power to issue regulations on the
exact terms based on the development level of each region.
In Addis Ababa, the City’s Land Administration and Development Authority is directly
responsible in dealing with matters concerning land. However, regarding the manufacturing
sector, industrial zone preparation is one of the strategic intervention measures adopted by the
City Administration for the promotion of the sector and all manufacturing projects are assumed
to be located in the developed industrial zones.
Regarding land allocation of industrial zones if the land requirement of the project is below 5000
m2, the land lease request is evaluated and decided upon by the Industrial Zone Development and
Coordination Committee of the City’s Investment Authority. However, if the land request is
above 5,000 m2, the request is evaluated by the City’s Investment Authority and passed with
recommendation to the Land Development and Administration Authority for decision, while the
lease price is the same for both cases.
Moreover, the Addis Ababa City Administration has recently adopted a new land lease floor
price for plots in the city. The new prices will be used as a benchmark for plots that are going to
be auctioned by the city government or transferred under the new “Urban Lands Lease Holding
Proclamation.”
162-12
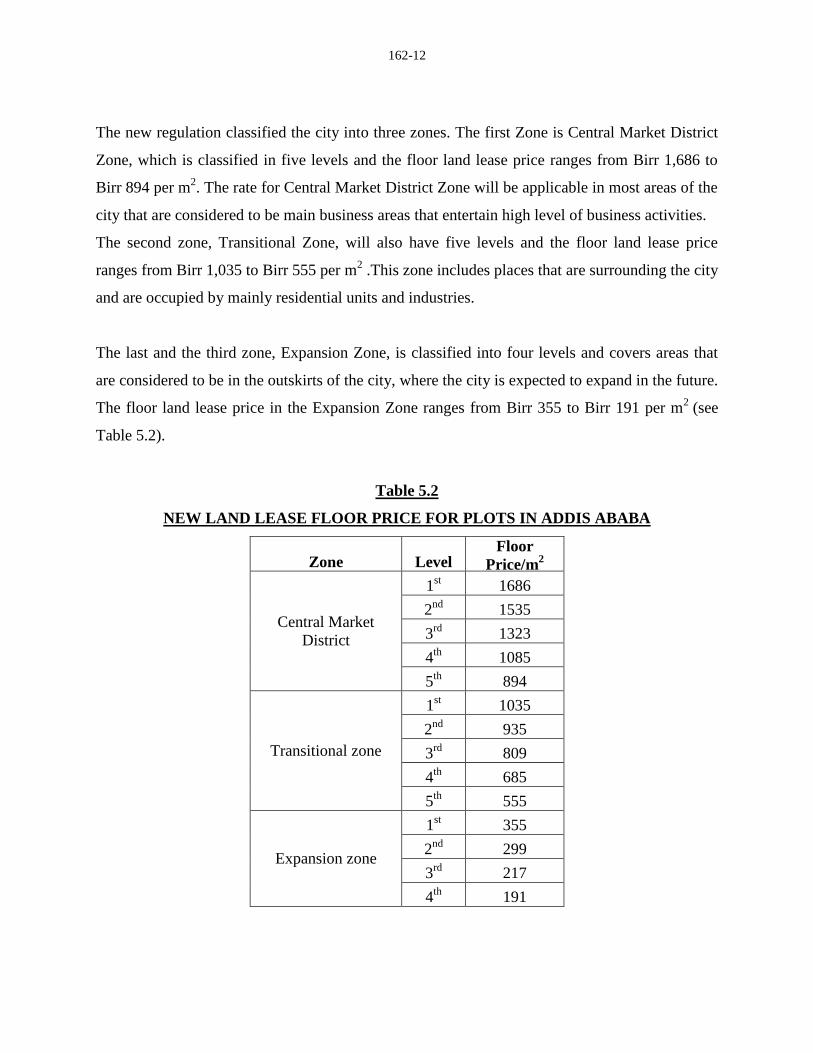
The new regulation classified the city into three zones. The first Zone is Central Market District
Zone, which is classified in five levels and the floor land lease price ranges from Birr 1,686 to
Birr 894 per m2. The rate for Central Market District Zone will be applicable in most areas of the
city that are considered to be main business areas that entertain high level of business activities.
The second zone, Transitional Zone, will also have five levels and the floor land lease price
ranges from Birr 1,035 to Birr 555 per m2 .This zone includes places that are surrounding the city
and are occupied by mainly residential units and industries.
The last and the third zone, Expansion Zone, is classified into four levels and covers areas that
are considered to be in the outskirts of the city, where the city is expected to expand in the future.
The floor land lease price in the Expansion Zone ranges from Birr 355 to Birr 191 per m2
(see
Table 5.2).
Table 5.2
NEW LAND LEASE FLOOR PRICE FOR PLOTS IN ADDIS ABABA
Zone Level Floor
Price/m2
Central Market
District
1st 1686
2nd
1535
3rd
1323
4th
1085
5th
894
Transitional zone
1st 1035
2nd
935
3rd
809
4th
685
5th
555
Expansion zone
1st 355
2nd
299
3rd
217
4th
191

162-13
Accordingly, in order to estimate the land lease cost of the project profiles it is assumed that all
new manufacturing projects will be located in industrial zones located in expansion zones.
Therefore, for the profile a land lease rate of Birr 266 per m2
which is equivalent to the average
floor price of plots located in expansion zone is adopted.
On the other hand, some of the investment incentives arranged by the Addis Ababa City
Administration on lease payment for industrial projects are granting longer grace period and
extending the lease payment period. The criterions are creation of job opportunity, foreign
exchange saving, investment capital and land utilization tendency etc. Accordingly, Table 5.3
shows incentives for lease payment.
Table 5.3
INCENTIVES FOR LEASE PAYMENT OF INDUSTRIAL PROJECTS
Scored Point
Grace
Period
Payment
Completion
Period
Down
Payment
Above 75% 5 Years 30 Years 10%
From 50 - 75% 5 Years 28 Years 10%
From 25 - 49% 4 Years 25 Years 10%
For the purpose of this project profile, the average i.e. five years grace period, 28 years payment
completion period and 10% down payment is used. The land lease period for industry is 60
years.
Accordingly, the total land lease cost at a rate of Birr 266 per m2 is estimated at Birr 532,000 of
which 10% or Birr 53,200 will be paid in advance. The remaining Birr 478,800 will be paid in
equal installments with in 28 years i.e. Birr 17,100 annually.
VI. HUMAN RESOURCE AND TRAINING REQUIREMENT
A. HUMAN RESOURCE REQUIREMENT
The plant requires both direct and indirect labor. The direct labor requires engineer, production
head, machine operators, technicians and unskilled workers. The indirect manpower consists of
162-14
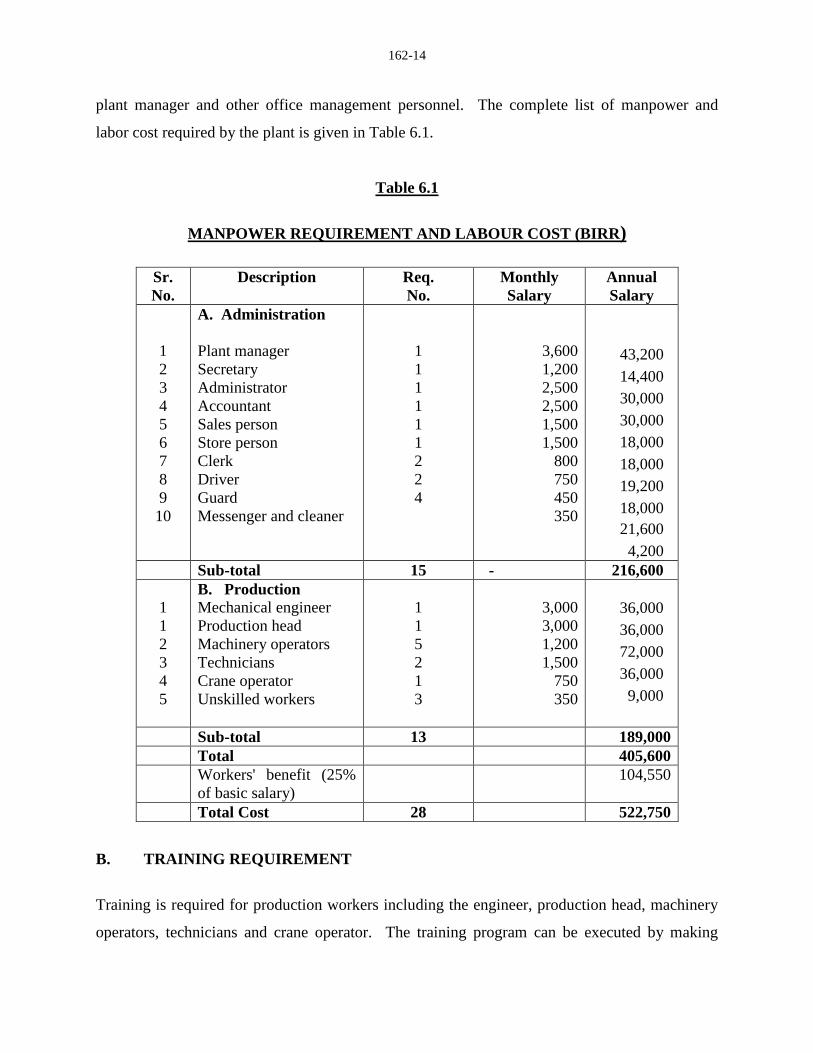
plant manager and other office management personnel. The complete list of manpower and
labor cost required by the plant is given in Table 6.1.
Table 6.1
MANPOWER REQUIREMENT AND LABOUR COST (BIRR)
Sr.
No.
Description Req.
No.
Monthly
Salary
Annual
Salary
1
2
3
4
5
6
7
8
9
10
A. Administration
Plant manager
Secretary
Administrator
Accountant
Sales person
Store person
Clerk
Driver
Guard
Messenger and cleaner
1
1
1
1
1
1
2
2
4
3,600
1,200
2,500
2,500
1,500
1,500
800
750
450
350
43,200
14,400
30,000
30,000
18,000
18,000
19,200
18,000
21,600
4,200
Sub-total 15 - 216,600
1
1
2
3
4
5
B. Production
Mechanical engineer
Production head
Machinery operators
Technicians
Crane operator
Unskilled workers
1
1
5
2
1
3
3,000
3,000
1,200
1,500
750
350
36,000
36,000
72,000
36,000
9,000
Sub-total 13 189,000
Total 405,600
Workers' benefit (25%
of basic salary)
104,550
Total Cost 28 522,750
B. TRAINING REQUIREMENT
Training is required for production workers including the engineer, production head, machinery
operators, technicians and crane operator. The training program can be executed by making
162-15
special arrangements with either public or private industries that are engaged with similar
activities. A total of Birr 50,000 is allotted to conduct the training programme that will take
three to four weeks.
VII. FINANCIAL ANALYSIS
The financial analysis of the corrugated iron sheet project is based on the data presented in the
previous chapters and the following assumptions:-
Construction period 1 year
Source of finance 30 % equity & 70% loan
Tax holidays 5 years
Bank interest 10%
Discount cash flow 10%
Accounts receivable 30 days
Work in progress 1 day
Finished products 30 days
Cash in hand 5 days
Accounts payable 30 days
Repair and maintenance 5% of machinery cost
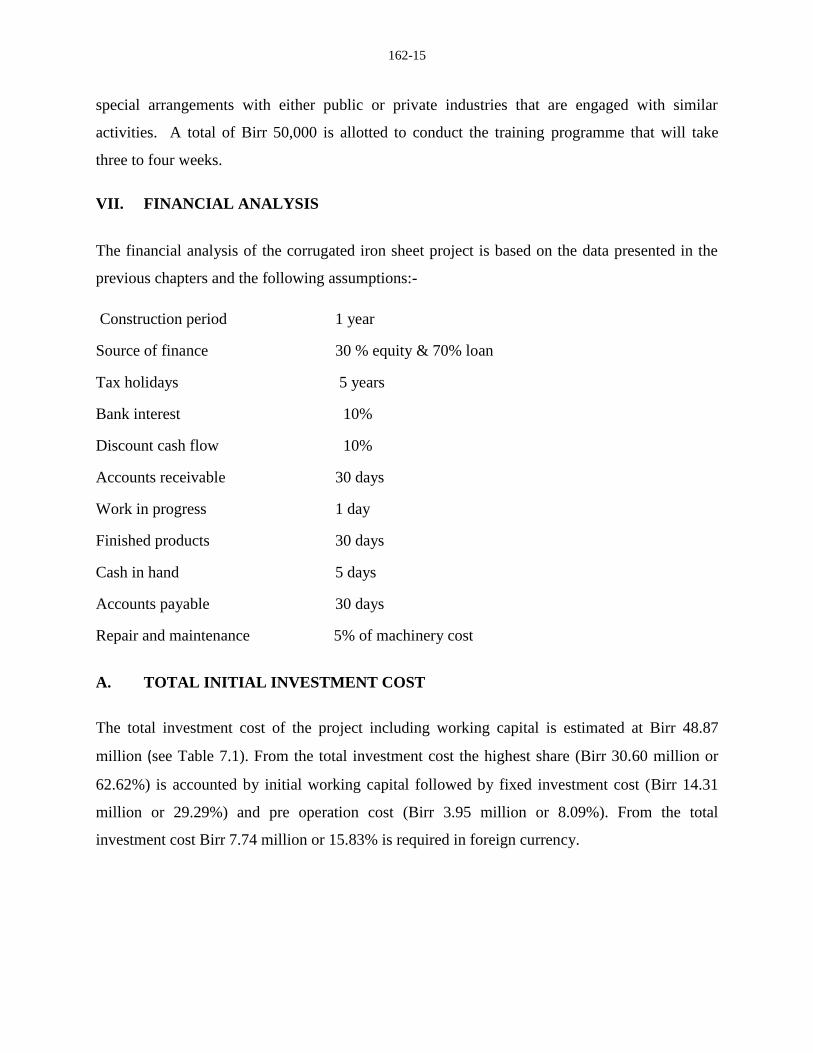
A. TOTAL INITIAL INVESTMENT COST
The total investment cost of the project including working capital is estimated at Birr 48.87
million (see Table 7.1). From the total investment cost the highest share (Birr 30.60 million or
62.62%) is accounted by initial working capital followed by fixed investment cost (Birr 14.31
million or 29.29%) and pre operation cost (Birr 3.95 million or 8.09%). From the total
investment cost Birr 7.74 million or 15.83% is required in foreign currency.

162-16
Table 7.1
INITIAL INVESTMENT COST (‘000 Birr)
Sr. No Cost Items
Local
Cost
Foreign
Cost
Total
Cost
%
Share
1 Fixed investment
1.1 Land Lease 53.20
53.20 0.11
1.2 Building and civil work 5,000.00
5,000.00 10.23
1.3 Machinery and equipment 375.00 7,740.00 8,115.00 16.60
1.4 Vehicles 900.00
900.00 1.84
1.5 Office furniture and equipment 250.00
250.00 0.51
Sub total 6,578.20 7,740.00 14,318.20 29.29
2 Pre operating cost *
2.1 Pre operating cost 755.75
755.75 1.55
2.2 Interest during construction 3,197.72
3,197.72 6.54
Sub total 3,953.47
3,953.47 8.09
3 Working capital ** 30,607.73
30,607.73 62.62
Grand Total 41,139.40 7,740.00 48,879.40 100
* N.B Pre operating cost include project implementation cost such as installation, startup,
commissioning, project engineering, project management etc and capitalized interest during
construction.
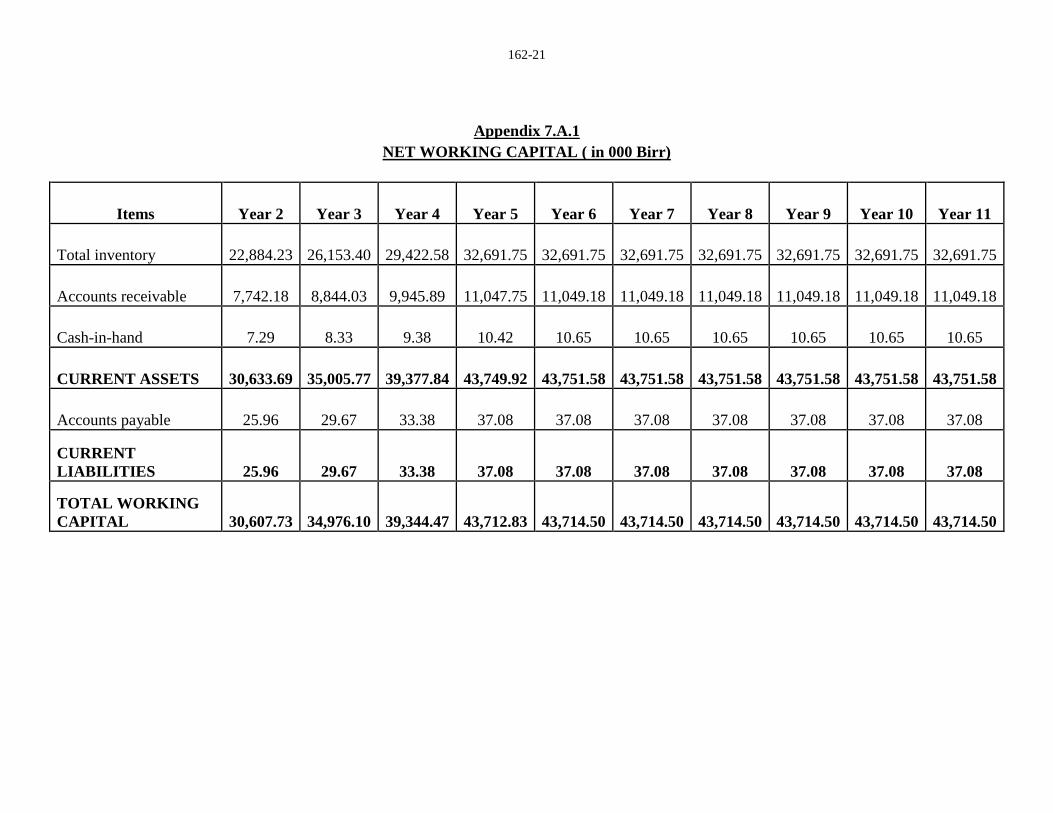
** The total working capital required at full capacity operation is Birr 43.71 million. However,
only the initial working capital of Birr 30.60 million during the first year of production is
assumed to be funded through external sources. During the remaining years the working
capital requirement will be financed by funds to be generated internally (for detail working
capital requirement see Appendix 7.A.1).
B. PRODUCTION COST
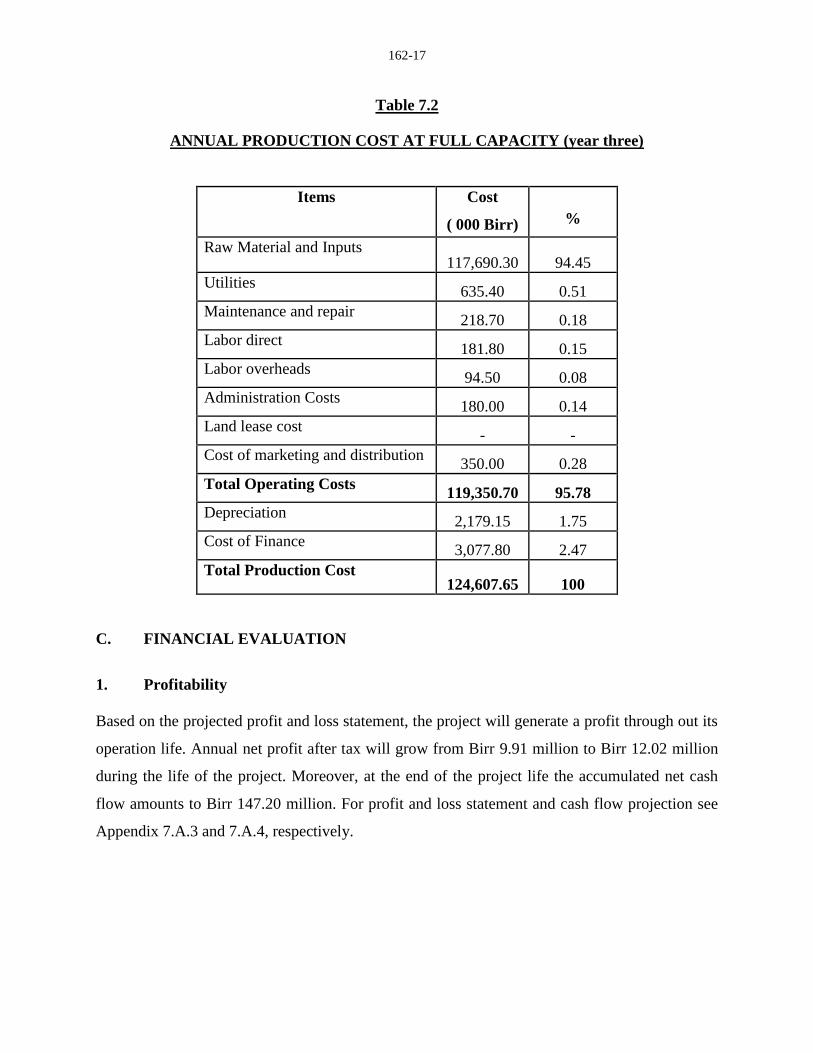
The annual production cost at full operation capacity is estimated at Birr 124.60 million (see
Table 7.2). The cost of raw material account for 94.45% of the production cost. The other major
components of the production cost are financial cost, depreciation and utility, which account for
2.47%, 1.75% and 0.51%, respectively. The remaining 0.82% is the share of repair and
maintenance, direct labor, labor overhead, cost of marketing and distribution and administration
cost. For detail production cost see Appendix 7.A.2.
162-17
Table 7.2
ANNUAL PRODUCTION COST AT FULL CAPACITY (year three)
Items Cost
( 000 Birr) %
Raw Material and Inputs 117,690.30 94.45
Utilities 635.40 0.51
Maintenance and repair 218.70 0.18
Labor direct 181.80 0.15
Labor overheads 94.50 0.08
Administration Costs 180.00 0.14
Land lease cost - -
Cost of marketing and distribution 350.00 0.28
Total Operating Costs 119,350.70 95.78
Depreciation 2,179.15 1.75
Cost of Finance 3,077.80 2.47
Total Production Cost 124,607.65 100
C. FINANCIAL EVALUATION
1. Profitability
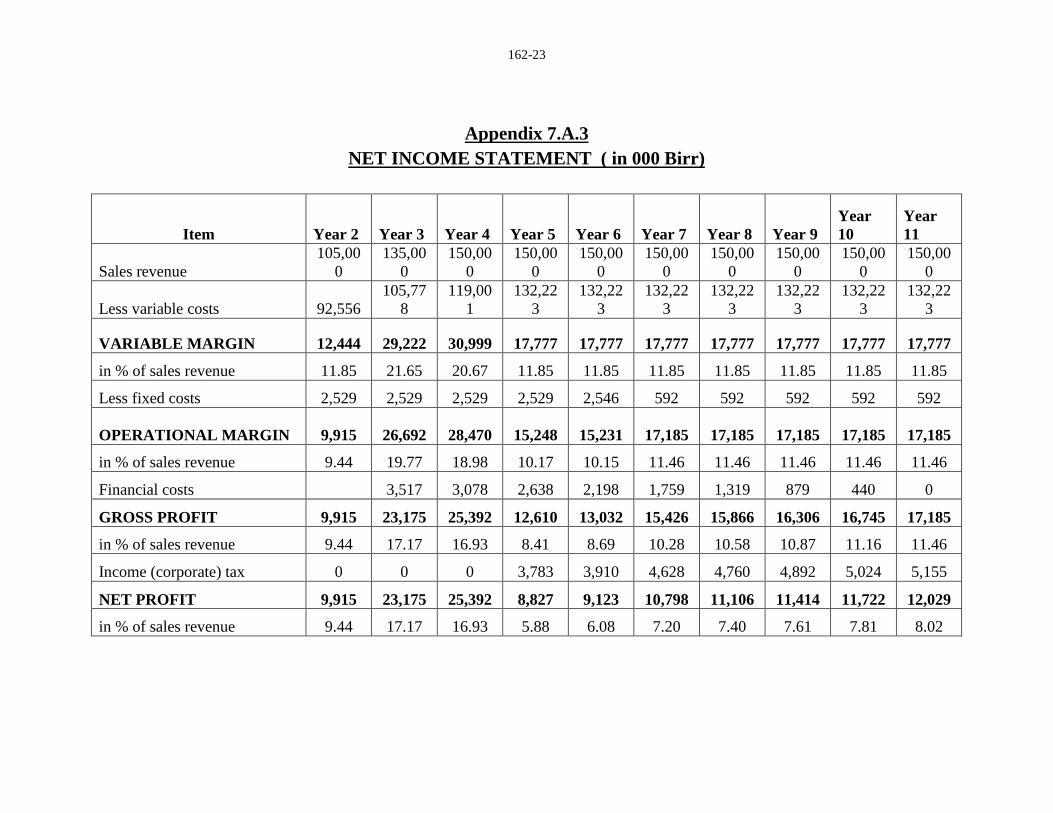
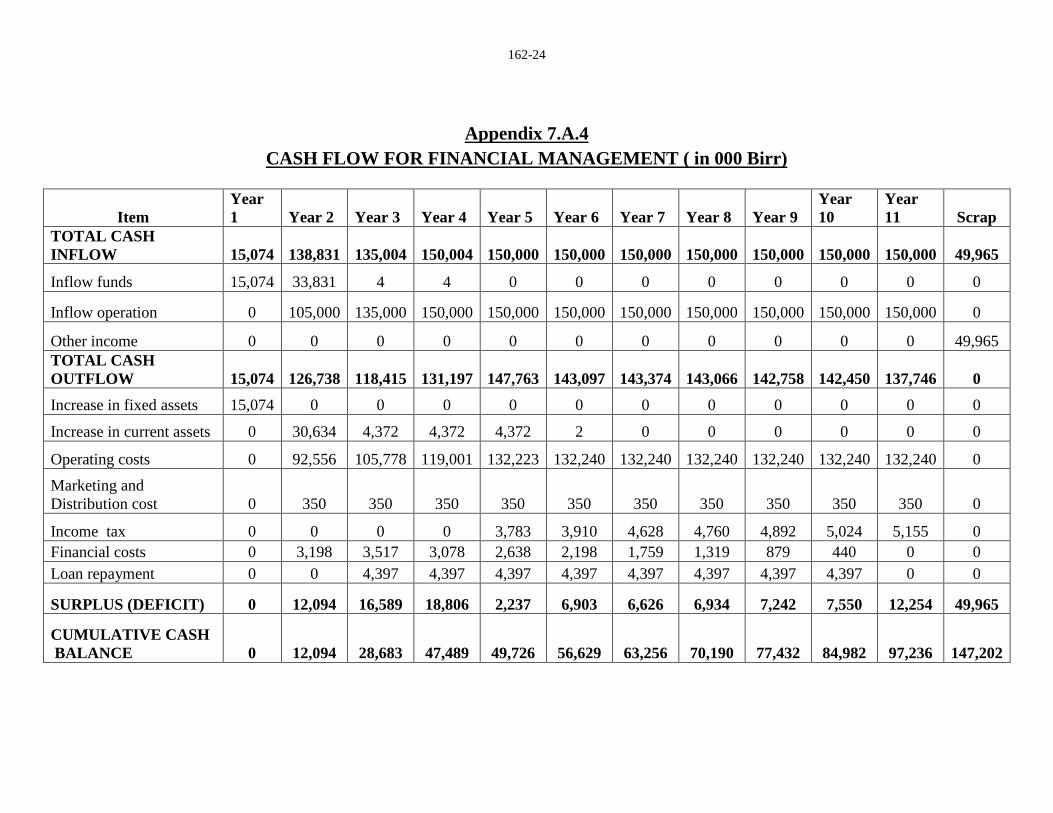
Based on the projected profit and loss statement, the project will generate a profit through out its
operation life. Annual net profit after tax will grow from Birr 9.91 million to Birr 12.02 million
during the life of the project. Moreover, at the end of the project life the accumulated net cash
flow amounts to Birr 147.20 million. For profit and loss statement and cash flow projection see
Appendix 7.A.3 and 7.A.4, respectively.

162-18
2. Ratios
In financial analysis, financial ratios and efficiency ratios are used as an index or yardstick for
evaluating the financial position of a firm. It is also an indicator for the strength and weakness of
the firm or a project. Using the year-end balance sheet figures and other relevant data, the most
important ratios such as return on sales which is computed by dividing net income by revenue,
return on assets (operating income divided by assets), return on equity (net profit divided by
equity) and return on total investment (net profit plus interest divided by total investment) has
been carried out over the period of the project life and all the results are found to be satisfactory.
3. Break-even Analysis
The break-even analysis establishes a relationship between operation costs and revenues. It
indicates the level at which costs and revenue are in equilibrium. To this end, the break-even
point for capacity utilization and sales value estimated by using income statement projection are
computed as followed.
Break Even Sales Value = Fixed Cost + Financial Cost = Birr 21,340,637
Variable Margin ratio (%)
Break Even Capacity utilization = Break even Sales Value X 100 = 14%
Sales revenue
4. Pay-back Period
The pay-back period, also called pay-off period is defined as the period required for recovering
the original investment outlay through the accumulated net cash flows earned by the project.
Accordingly, based on the projected cash flow it is estimated that the project’s initial investment
will be fully recovered within 2 years.
162-19
5. Internal Rate of Return
The internal rate of return (IRR) is the annualized effective compounded return rate that can be
earned on the invested capital, i.e., the yield on the investment. Put another way, the internal rate
of return for an investment is the discount rate that makes the net present value of the
investment's income stream total to zero. It is an indicator of the efficiency or quality of an
investment. A project is a good investment proposition if its IRR is greater than the rate of return
that could be earned by alternate investments or putting the money in a bank account.
Accordingly, the IRR of this project is computed to be 34.48%indicating the viability of the
project.
6. Net Present Value
Net present value (NPV) is defined as the total present (discounted) value of a time series of cash
flows. NPV aggregates cash flows that occur during different periods of time during the life of a
project in to a common measuring unit i.e. present value. It is a standard method for using the
time value of money to appraise long-term projects. NPV is an indicator of how much value an
investment or project adds to the capital invested. In principle, a project is accepted if the NPV is
non-negative.
Accordingly, the net present value of the project at 10% discount rate is found to be Birr 67.82
million which is acceptable. For detail discounted cash flow see Appendix 7.A.5.
D. ECONOMIC AND SOCIAL BENEFITS
The project can create employment for 28 persons. The project will generate Birr 32.15 million
in terms of tax revenue. The establishment of such factory will have a foreign exchange saving
effect to the country by substituting the current imports. The project will also create forward
linkage with the construction sub sector and also generates other income for the Government.

162-20
Appendix 7.A
FINANCIAL ANALYSES SUPPORTING TABLES
162-21
Appendix 7.A.1
NET WORKING CAPITAL ( in 000 Birr)
Items Year 2 Year 3 Year 4 Year 5 Year 6 Year 7 Year 8 Year 9 Year 10 Year 11
Total inventory 22,884.23 26,153.40 29,422.58 32,691.75 32,691.75 32,691.75 32,691.75 32,691.75 32,691.75 32,691.75
Accounts receivable 7,742.18 8,844.03 9,945.89 11,047.75 11,049.18 11,049.18 11,049.18 11,049.18 11,049.18 11,049.18
Cash-in-hand 7.29 8.33 9.38 10.42 10.65 10.65 10.65 10.65 10.65 10.65
CURRENT ASSETS 30,633.69 35,005.77 39,377.84 43,749.92 43,751.58 43,751.58 43,751.58 43,751.58 43,751.58 43,751.58
Accounts payable 25.96 29.67 33.38 37.08 37.08 37.08 37.08 37.08 37.08 37.08
CURRENT
LIABILITIES 25.96 29.67 33.38 37.08 37.08 37.08 37.08 37.08 37.08 37.08
TOTAL WORKING
CAPITAL 30,607.73 34,976.10 39,344.47 43,712.83 43,714.50 43,714.50 43,714.50 43,714.50 43,714.50 43,714.50

162-22
Appendix 7.A.2
PRODUCTION COST ( in 000 Birr)
Item
Year
2 Year 3 Year 4 Year 5 Year 6 Year 7 Year 8 Year 9 Year 10 Year 11
Raw Material and Inputs 91,537 104,614 117,690 130,767 130,767 130,767 130,767 130,767 130,767 130,767
Utilities 494 565 635 706 706 706 706 706 706 706
Maintenance and repair 170 194 219 243 243 243 243 243 243 243
Labour direct 141 162 182 202 202 202 202 202 202 202
Labour overheads 74 84 95 105 105 105 105 105 105 105
Administration Costs 140 160 180 200 200 200 200 200 200 200
Land lease cost 0 0 0 0 17 17 17 17 17 17
Cost of marketing
and distribution 350 350 350 350 350 350 350 350 350 350
Total Operating Costs 92,906 106,128 119,351 132,573 132,590 132,590 132,590 132,590 132,590 132,590
Depreciation 2,179 2,179 2,179 2,179 2,179 225 225 225 225 225
Cost of Finance 0 3,517 3,078 2,638 2,198 1,759 1,319 879 440 0
Total Production Cost 95,085 111,825 124,608 137,390 136,968 134,574 134,134 133,694 133,255 132,815
162-23
Appendix 7.A.3
NET INCOME STATEMENT ( in 000 Birr)
Item Year 2 Year 3 Year 4 Year 5 Year 6 Year 7 Year 8 Year 9
Year
10
Year
11
Sales revenue
105,00
0
135,00
0
150,00
0
150,00
0
150,00
0
150,00
0
150,00
0
150,00
0
150,00
0
150,00
0
Less variable costs 92,556
105,77
8
119,00
1
132,22
3
132,22
3
132,22
3
132,22
3
132,22
3
132,22
3
132,22
3
VARIABLE MARGIN 12,444 29,222 30,999 17,777 17,777 17,777 17,777 17,777 17,777 17,777
in % of sales revenue 11.85 21.65 20.67 11.85 11.85 11.85 11.85 11.85 11.85 11.85
Less fixed costs 2,529 2,529 2,529 2,529 2,546 592 592 592 592 592
OPERATIONAL MARGIN 9,915 26,692 28,470 15,248 15,231 17,185 17,185 17,185 17,185 17,185
in % of sales revenue 9.44 19.77 18.98 10.17 10.15 11.46 11.46 11.46 11.46 11.46
Financial costs 3,517 3,078 2,638 2,198 1,759 1,319 879 440 0
GROSS PROFIT 9,915 23,175 25,392 12,610 13,032 15,426 15,866 16,306 16,745 17,185
in % of sales revenue 9.44 17.17 16.93 8.41 8.69 10.28 10.58 10.87 11.16 11.46
Income (corporate) tax 0 0 0 3,783 3,910 4,628 4,760 4,892 5,024 5,155
NET PROFIT 9,915 23,175 25,392 8,827 9,123 10,798 11,106 11,414 11,722 12,029
in % of sales revenue 9.44 17.17 16.93 5.88 6.08 7.20 7.40 7.61 7.81 8.02
162-24
Appendix 7.A.4
CASH FLOW FOR FINANCIAL MANAGEMENT ( in 000 Birr)
Item
Year
1 Year 2 Year 3 Year 4 Year 5 Year 6 Year 7 Year 8 Year 9
Year
10
Year
11 Scrap
TOTAL CASH
INFLOW 15,074 138,831 135,004 150,004 150,000 150,000 150,000 150,000 150,000 150,000 150,000 49,965
Inflow funds 15,074 33,831 4 4 0 0 0 0 0 0 0 0
Inflow operation 0 105,000 135,000 150,000 150,000 150,000 150,000 150,000 150,000 150,000 150,000 0
Other income 0 0 0 0 0 0 0 0 0 0 0 49,965
TOTAL CASH
OUTFLOW 15,074 126,738 118,415 131,197 147,763 143,097 143,374 143,066 142,758 142,450 137,746 0
Increase in fixed assets 15,074 0 0 0 0 0 0 0 0 0 0 0
Increase in current assets 0 30,634 4,372 4,372 4,372 2 0 0 0 0 0 0
Operating costs 0 92,556 105,778 119,001 132,223 132,240 132,240 132,240 132,240 132,240 132,240 0
Marketing and
Distribution cost 0 350 350 350 350 350 350 350 350 350 350 0
Income tax 0 0 0 0 3,783 3,910 4,628 4,760 4,892 5,024 5,155 0
Financial costs 0 3,198 3,517 3,078 2,638 2,198 1,759 1,319 879 440 0 0
Loan repayment 0 0 4,397 4,397 4,397 4,397 4,397 4,397 4,397 4,397 0 0
SURPLUS (DEFICIT) 0 12,094 16,589 18,806 2,237 6,903 6,626 6,934 7,242 7,550 12,254 49,965
CUMULATIVE CASH
BALANCE 0 12,094 28,683 47,489 49,726 56,629 63,256 70,190 77,432 84,982 97,236 147,202

162-25
Appendix 7.A.5
DISCOUNTED CASH FLOW ( in 000 Birr)
Item Year 1 Year 2 Year 3 Year 4 Year 5 Year 6 Year 7 Year 8 Year 9
Year
10 Year 11 Scrap
TOTAL CASH INFLOW 0 105,000 135,000 150,000 150,000 150,000 150,000 150,000 150,000 150,000 150,000 49,965
Inflow operation 0 105,000 135,000 150,000 150,000 150,000 150,000 150,000 150,000 150,000 150,000 0
Other income 0 0 0 0 0 0 0 0 0 0 0 49,965
TOTAL CASH OUTFLOW 45,682 97,274 110,497 123,719 136,358 136,500 137,218 137,350 137,482 137,614 137,746 0
Increase in fixed assets 15,074 0 0 0 0 0 0 0 0 0 0 0
Increase in net working capital 30,608 4,368 4,368 4,368 2 0 0 0 0 0 0 0
Operating costs 0 92,556 105,778 119,001 132,223 132,240 132,240 132,240 132,240 132,240 132,240 0
Marketing and Distribution cost 0 350 350 350 350 350 350 350 350 350 350 0
Income (corporate) tax 0 0 0 3,783 3,910 4,628 4,760 4,892 5,024 5,155 0
NET CASH FLOW -45,682 7,726 24,503 26,281 13,642 13,500 12,782 12,650 12,518 12,386 12,254 49,965
CUMULATIVE NET CASH FLOW -45,682 -37,956 -13,453 12,828 26,470 39,971 52,753 65,403 77,921 90,307 102,562 152,527
Net present value -45,682 7,023 20,251 19,745 9,318 8,383 7,215 6,492 5,840 5,253 4,725 19,264
Cumulative net present value -45,682 -38,658 -18,408 1,337 10,655 19,038 26,253 32,745 38,584 43,837 48,562 67,826
NET PRESENT VALUE 67,826
INTERNAL RATE OF RETURN 34.48%
NORMAL PAYBACK 2 years


![Corrugated Iron[1]](https://img.dokumen.tips/doc/110x75/577d24431a28ab4e1e9c05b1/corrugated-iron1.jpg)