Embed Size (px)
DESCRIPTION
Media concentration in the Netherlands Inge Brakman Commissioner of the Netherlands Media Authority. 14th European Television and Film Forum, Barcelona, October 11th, 2002 The Netherlands Media Authority PO Box 1426 1200 BK Hilversum The Netherlands phone: +31 35 7737700 - PowerPoint PPT Presentation
Citation preview
Media concentration in the Netherlands
Inge BrakmanCommissioner of the Netherlands Media Authority
14th European Television and Film Forum,
Barcelona, October 11th, 2002
The Netherlands Media Authority
PO Box 1426
1200 BK Hilversum
The Netherlands
phone: +31 35 7737700
Website: www.cvdm.nl

Media Concentration Monitor
Objective
• Supply information• Provide insight• Make statements

Media value chain
‘Content Creation’(journalist, producer)
Source
‘Content Delivery’(distribution)
‘Content Packaging’(publisher,broadcaster)
Media consumer

Information carriers
• Written media
• Broadcasting
• Electronic media

Concentration
• Ownership
• Editorial
• Horizontal, vertical and diagonal

Heterogeneity
• Diversity
• Plurality

Independence
• Editorial statute
• Originality
Autonomy• Own chief editor
• The use of external source

Accessibility
• Distribution
• Available
• Affordable
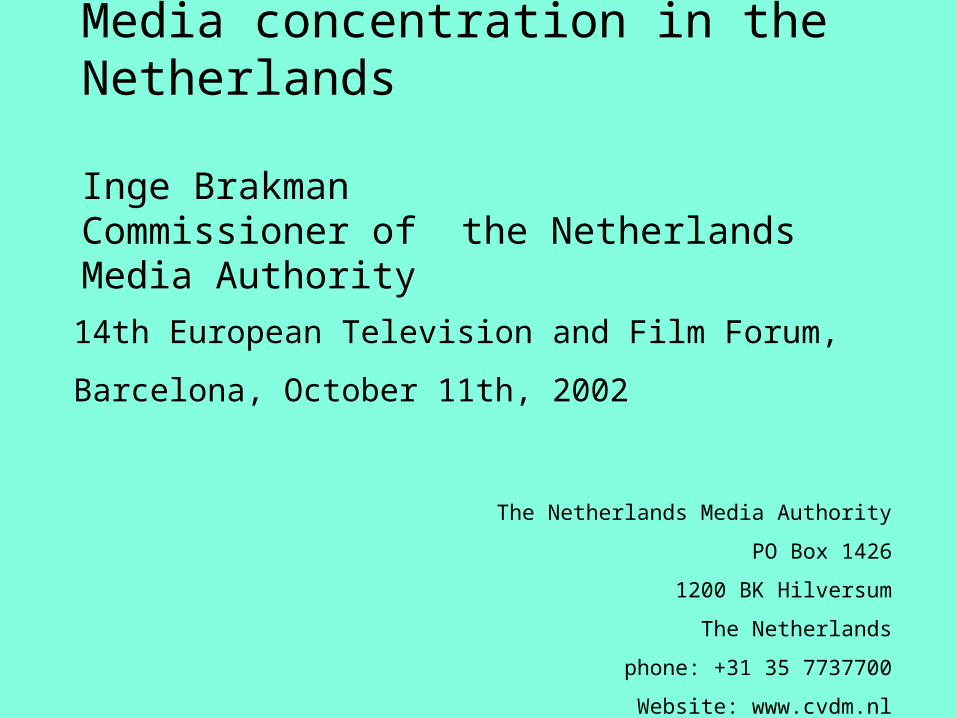
Number of newspaper publishers
0
5
10
15
20
25
Newspaper publishers(total)
National newspaperpublishers
Local newpaperpublishers
Special interestnewspaper publishers
1990 2001

Market shares of five biggest newspaper publishers
0
5
10
15
20
25
30
35
PCM uitgevers Telegraaf Holding Wegener NoordelijkeDagbladcombinatie
ReformatorischDagblad
mar
kets
har
e (i
n %
)
1990 2001

Plurality in newspaper market
0
5
10
15
20
25
30
35
40
45
50
1990 2001 2002


Ownership concentration in television
0
10
20
30
40
50
60
70
80
90
100
1990 2001
Mar
kets
har
es (
in %
)
Public broadcasters HMG SBS Other suppliers Video

0
5
10
15
20
25
30
35
1990 1995 2000 2001
Nu
mb
er o
f in
dep
end
ent
tele
visi
on
ch
ann
els
Plurality in television
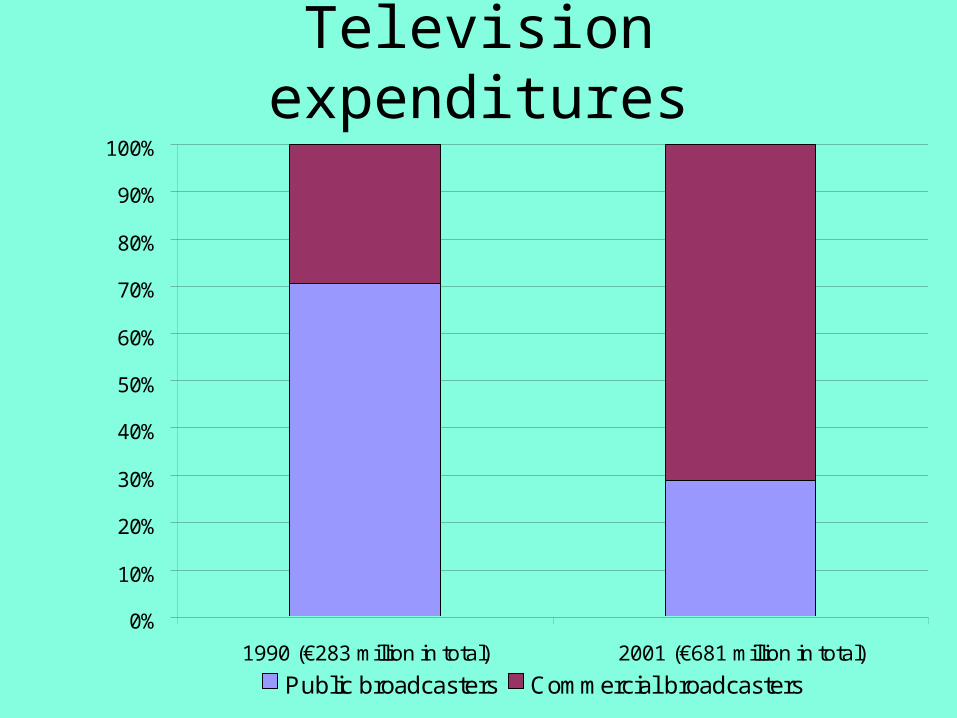
Television expenditures
0%
10%
20%
30%
40%
50%
60%
70%
80%
90%
100%
1990 (€283 million in total) 2001 (€681 million in total)
Public broadcasters Commercial broadcasters

Ownership concentration in radio in 2001
public broadcasters
31%
public regional broadcasters
15%
commercial broadcasters
54%
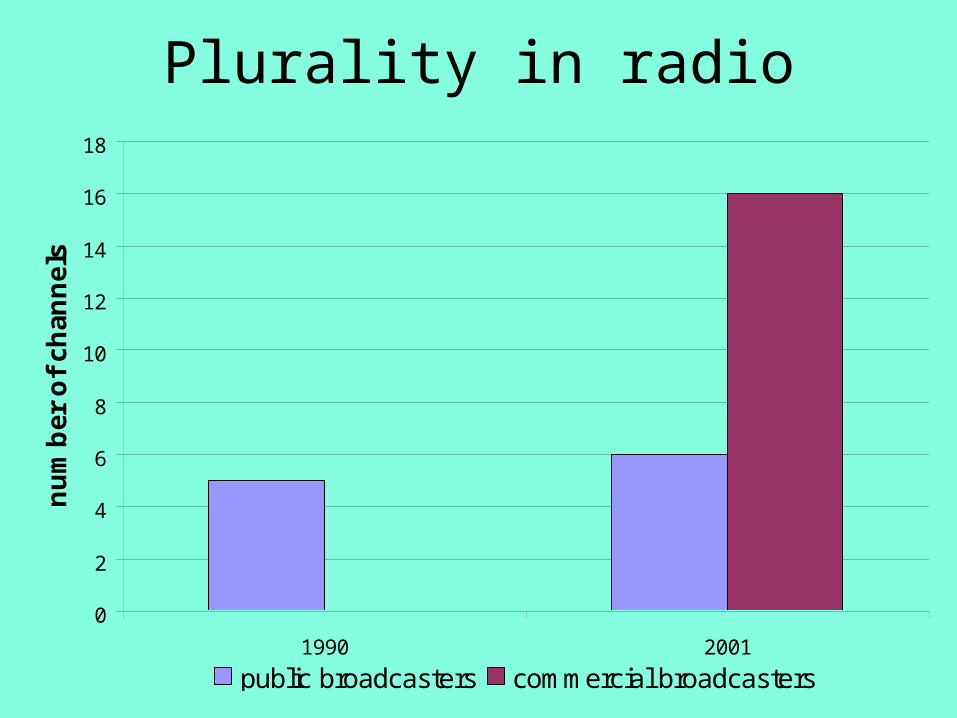
Plurality in radio
0
2
4
6
8
10
12
14
16
18
1990 2001
nu
mb
er o
f ch
ann
els
public broadcasters commercial broadcasters

Market shares of infrastructures in 2001
Satellite6%
Airwave3%
Cable91%
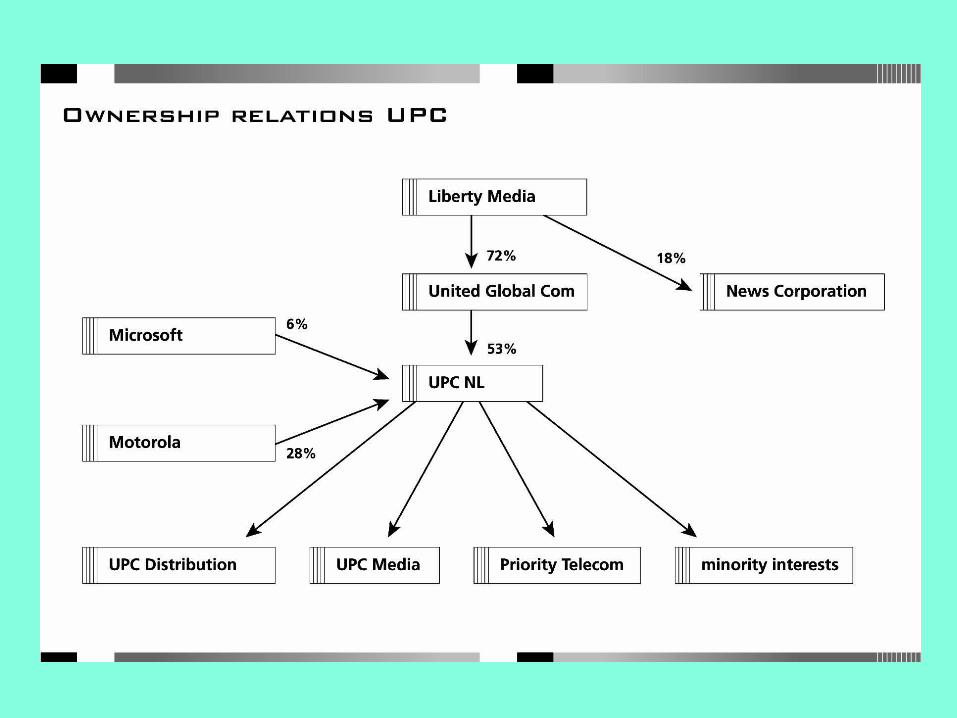

Market shares of cable companies in 2001
UPC39%
Essent29%
Casema23%
Multikabel6%
Zekatel3%

Recommendations • Continue monitoring• Apply market share thresholds• Monitor effects of ownership changes on diversity
and independence• Stimulate introduction of editorial statutes and
rules for proper distinction between commercials and content
• Guarantee independence of political influences• Stimulate diversity