Embed Size (px)
Citation preview

1326 IEEE SENSORS JOURNAL, VOL. 12, NO. 5, MAY 2012
Sensor Network Based Oilwell HealthMonitoring and Intelligent Control
Donglin Wang, Member, IEEE, Renlun He, Jiangqiu Han, Michel Fattouche, andFadhel M. Ghannouchi, Fellow, IEEE
Abstract—Most oil pumping units (OPUs) have been usingmanual control in the oilfield. This existing oil-pumping system,a high power-consuming process, has the incapability of OPU’sstructural health monitoring. In this paper, a sensor networkbased intelligent control is proposed for power economy andefficient oilwell health monitoring. The proposed sensor networkconsists of three-level sensors: 1) several types of basic sensors,such as load sensor, angular sensor, voltage sensor, current sensorand oil pressure sensor, which are the first level sensors (FLS), areused for oilwell data sensing; 2) our developed intelligent sensors(IS), which belong to the second level sensor, are designed mainlyfor an oilwell’s data elementary processing, main fault alarm/indi-cation, typical data storage/indication, data/status transmission upto the third level sensor (TLS), data/status transmission betweenIS, and command transmission down to the OPU motor; and3) our developed software-defined (SD) control centers with anembedded database, i.e., the TLS, are designed for hundreds ofoilwells data storage/management, data processing, malfunctiondetection, malfunction alarm/indication, stroke-adjustment com-mand transmission down to a specific IS for power economy andthe malfunction report to the maintenance staff via global systemfor mobile communications (GSM) short message service (SMS).Experiment results at the Chinese Petroleum’s Changqing Oilfielddemonstrate our proposed sensor network based system.
Index Terms—Health monitoring, intelligent control, intelligentsensor, power economy, sensor network.
I. INTRODUCTION
I N the last few years, sensor networks have drawn muchattention for their broad practical applications [1]–[19].
[1]–[3] investigate specific sensors and sensor networks for air-craft structural health and performance monitoring. A highwaybridge assessment using an adaptive real-time wireless sensor
Manuscript received September 20, 2010; revised August 10, 2011; ac-cepted September 21, 2011. Date of publication October 14, 2011; date ofcurrent version April 11, 2012. This work was supported in part by ChinesePetroleum’s Changqing Oilfield, the Alberta Informatics Circle of ResearchExcellence (iCORE), the Natural Sciences and Engineering Research Councilof Canada (NSERC), the Canada Research Chair (CRC) Program, TRLabs,and the Cell-Loc Location Technologies Inc., Canada. The associate editorcoordinating the review of this manuscript and approving it for publication wasDr. Larry Nagahara.
D. Wang, M. Fattouch, and F. M. Ghannouchi are with the iRadio Lab, Elec-trical and Computer Engineering Department, University of University, Calgary,AB T2N 1N4, Canada (e-mail: [email protected]; [email protected];[email protected]).
R. He and J. Han are with the School of Electronics and InformationEngineering, Xi’an Jiaotong University, 710049 Xi’an, China (e-mail:[email protected]; [email protected]).
Color versions of one or more of the figures in this paper are available onlineat http://ieeexplore.ieee.org.
Digital Object Identifier 10.1109/JSEN.2011.2170411
network is proposed in [4]. A real-time radiological areamonitoring sensor network is developed in [5] for emergencyresponse. A congestion-aware, loss-resilient biomonitoringsensor network is reported in [6] for mobile health applicationsin the medical field. A novel interstitial fluid sensor network isprovided in [7], [8] for remote continuous alcohol monitoring.A spatiotemporal field monitoring application prototypingframework is given in [9]. [10] uses an energy-efficient wirelesssensor network for localization based structural health mon-itoring. A low-cost, low-data-rate rapid structural assessmentnetwork is shown in [11] for civil structural health monitoring.[12] validates the horizontal dilution of precision (HDOP) mea-sure for impact detection in sensor network-based structuralhealth monitoring. [13] employs a fault-tolerant wireless sensornetwork for hierarchical aggregation and intelligent monitoringand control. An intelligent sensor network is designed in[14] for fire detection. [15]–[17] propose various algorithmsand structures for sensor networks. [18] and [19] use sensornetworks to monitor cultural assets and aquatic environments,respectively.
In this paper, a sensor network based intelligent system isproposed and applied for remote oilwell health monitoring andautomatic oil-pumping control. The motivation of developingthis system is that 1) due to the special nature of oil explorationand oil drilling, the majority of oil pumping units (OPU1) [20]are spread over barren hills, mountains and deserts, and 2) theexisting oil-pumping systems still adopt manual control. Ex-isting manual control systems have three evident drawbacks: 1)The OPU administrators have to frequently go to the oilfieldto check the OPU status and collect its health analysis data.For the sake of the harsh oilfield environment, especially in thewinter when it is chilly and snowing overspreading the wholeoilfield, it is quite difficult to effectively manage and maintain allOPU manually. 2) Power consumption for OPU is huge duringthe oil-pumping process. Especially in barren oilwells, powerwastage is extremely high because each oil-pumping is not filledunder such condition and thus oil production greatly drops eventhough the OPU pumping stroke remains high. And 3), sincean administrator has to take charge of a number of oilwells, anOPU malfunction is difficult to locate and repair in a reasonabletime, which causes an oil production drop.
To overcome these three disadvantages of the existingmanual control system, a sensor network based automaticcontrol system is proposed for OPU management and oilwellhealth monitoring. This proposed system consists of three-levelsensors: the fist level sensors (FLS), the intelligent sensors (IS)
1One OPU is installed on one oilwell for oil pumping.
1530-437X/$26.00 © 2011 IEEE

WANG et al.: SENSOR NETWORK BASED OILWELL HEALTH MONITORING AND INTELLIGENT CONTROL 1327
and the third level sensors (TLS). A set of FLS, i.e., five sen-sors, are commonly used for an oilwell’s data sensing, whichincludes a load sensor, an angular sensor, a voltage sensor,a current sensor and an oil pressure sensor for one oilwell.The IS is developed mainly for an oilwell’s data elementaryprocessing, main fault alarm/indication, typical data storage/in-dication, data/status transmission up to the TLS, data/statustransmission between IS, and command transmission down tothe OPU motor. The software-defined (SD) TLS is designedfor hundreds of oilwells’s data storage/management, data pro-cessing, malfunction diagnosis, malfunction alarm/indication,oil pumping stroke-adjustment command transmission down toa specific IS for power economy and the malfunction report tothe maintenance staff via global system for mobile communi-cations (GSM) short message service (SMS).
The remaining paper is organized as follows. Section II in-troduces the whole network topology and system description.The development of IS is given in Section III. And, the devel-opment of the SD TLS is provided in Section IV. Section Vdepicts the whole system assembly in the Chinese Petroleum’sChangqing Oilfield and reports the elementary experiment re-sults with respect to remote pumping stroke adjustment and au-tomatic oilwell malfunction diagnosis, followed by Conclusionin Section VI.
II. NETWORK TOPOLOGY AND SYSTEM DESCRIPTION
Fig. 1 shows the proposed network topology for oilwell healthmonitoring and OPU intelligent control. The proposed systemis comprised of our developed SD TLS, each of which wire-lessly communicates with hundreds of IS. Each IS is designedwith the capability of data transferability with a set of FLS, itsadjacent IS and its corresponding TLS as well as the capabilityof command transmission down to its OPU motor. Each groupof FLS, including a load sensor, an angular sensor, a voltagesensor, a current sensor and an oil pressure sensor, are utilizedfor data sensing from an OPU, which convert all measurementsinto electrical signals and then transport them into its corre-sponding IS. To summarize, the developed IS has the followingfeatures:
• Setting of oilwell static parameters: manual input, editionand interface indication;
• Reception, storage and indication of sensing data fromFLS;
• Elementary processing of sensing data, such as calculatingthe maximum value, the minimum value and the averagevalue, etc., or such as calculating the active power, the reac-tive power and system efficiency of the current OPU, etc.;
• Query of static parameters and sensing data for the pastone2 week;
• Significant malfunction detection and indication/alarmbased on the elementary processing of data, such as shortcircuit, missing phase and overcurrent;
• Relay protection: the power will be cut off when the phaseis missing or overcurrent occurs;
• Balance adjustment suggestion for OPU, where a balanceblock is added to the OPU for pumping efficiency;
2Only one week data is stored in each IS due to its memory limitation.
• Wirelessly transmitting OPU static parameters (At the ini-tial stage), significant malfunction reports (if necessary),sensing data and elementary processing data to other spe-cific sensors using a developed communication protocol;
• Relay data/status transmission from another IS to FLSwhen there is a communication failure between another ISand FLS;
• Receiving TLS command and transmitting it to OPU motorfor stroke adjustment and power efficiency.
On the other hand, the capability of the developed SD TLScan be summarized as follows:
• Setting of oilwell static parameters: OPU addition, pa-rameter manual input, update, deletion and interfaceindication;
• Conducting a regular data request on all its IS every eighthours via a developed wireless communication protocol,where all IS, one after another, transmit their data to TLS;
• Conducting a data request on a specific IS whenever it isrequired by staff;
• Storage (using database) and indication of data from all IS,where data commonly consists of OPU static parameters,significant malfunction reports, sensing data and elemen-tary processing data;
• Further data processing for oilwell malfunction diagnosisby measuring OPU’s load-position diagram (LPD) using abackpropagation (BP) neural network;
• Further data processing for recommending/transmittingthe optimal pumping stroke to the IS for power economyas well as more oil production;
• Query of oilwell static parameters;• Query of sensing data, elementary processing data and
OPU status for the past six month;• Query of LPD and pump diagram for the past six month;• False alarm and false indication once any malfunction has
been found out;• Sending the detected oilwell malfunction out to the main-
tenance staff using GSM SMS.
III. DEVELOPMENT OF IS
A. System Description of IS
This subsection aims at clarifying the logic connection be-tween the shown oilwell in Fig. 1 and the developed IS. Asshown in Fig. 2, a group of FLS in our proposed system consistsof a load sensor, an angular sensor, a voltage sensor, a currentsensor and an oil pressure sensor while the IS mainly containstwo components: the designed control board and the frequencyconverter. Five kinds of sensing data from FLS are imported toits IS. The IS usually transmits oilwell static parameters (At theinitial stage), significant malfunction reports (if necessary), dy-namic sensing data and elementary processing data directly tothe TLS. As a special case, when the wireless communicationbetween the IS and the TLS fails, the IS sends data to its adja-cent IS for relay transmission up to the TLS.
On the other hand, when acquiring a pumping stroke adjust-ment command from the TLS, the control board executes thiscommand by transporting the corresponding control logic downto the frequency converter [21], [22], which has the capability

1328 IEEE SENSORS JOURNAL, VOL. 12, NO. 5, MAY 2012
Fig. 1. System topology for OPU health monitoring and intelligent control.
Fig. 2. Information communication between FLSs and IS.
of changing power frequency as well as the OPU’s pumpingstroke.
B. Design Diagram of IS
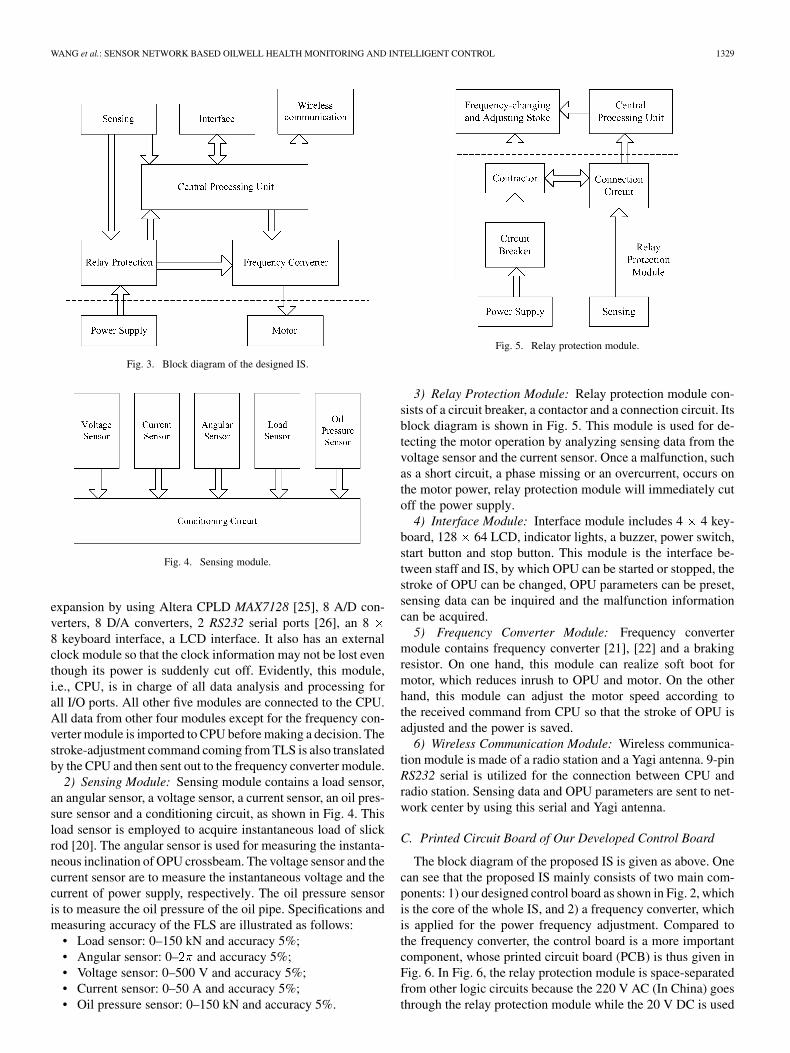
Fig. 3 shows the block diagram of our proposed IS. One cansee that, the IS consists of the following six modules: a central
processing unit(CPU) module, a sensing module, a relay protec-tion module, a frequency converter module, a wireless commu-nication module and a user interface module, which are given adetailed introduction in the following paragraph.
1) CPU Module: The CPU in our system is the Motoro-laDSP56F807 [23], [24]. The CPU has 20 Inputs/Outputs (I/O)
WANG et al.: SENSOR NETWORK BASED OILWELL HEALTH MONITORING AND INTELLIGENT CONTROL 1329
Fig. 3. Block diagram of the designed IS.
Fig. 4. Sensing module.
expansion by using Altera CPLD MAX7128 [25], 8 A/D con-verters, 8 D/A converters, 2 RS232 serial ports [26], an 88 keyboard interface, a LCD interface. It also has an externalclock module so that the clock information may not be lost eventhough its power is suddenly cut off. Evidently, this module,i.e., CPU, is in charge of all data analysis and processing forall I/O ports. All other five modules are connected to the CPU.All data from other four modules except for the frequency con-verter module is imported to CPU before making a decision. Thestroke-adjustment command coming from TLS is also translatedby the CPU and then sent out to the frequency converter module.
2) Sensing Module: Sensing module contains a load sensor,an angular sensor, a voltage sensor, a current sensor, an oil pres-sure sensor and a conditioning circuit, as shown in Fig. 4. Thisload sensor is employed to acquire instantaneous load of slickrod [20]. The angular sensor is used for measuring the instanta-neous inclination of OPU crossbeam. The voltage sensor and thecurrent sensor are to measure the instantaneous voltage and thecurrent of power supply, respectively. The oil pressure sensoris to measure the oil pressure of the oil pipe. Specifications andmeasuring accuracy of the FLS are illustrated as follows:
• Load sensor: 0–150 kN and accuracy 5%;• Angular sensor: 0– and accuracy 5%;• Voltage sensor: 0–500 V and accuracy 5%;• Current sensor: 0–50 A and accuracy 5%;• Oil pressure sensor: 0–150 kN and accuracy 5%.
Fig. 5. Relay protection module.
3) Relay Protection Module: Relay protection module con-sists of a circuit breaker, a contactor and a connection circuit. Itsblock diagram is shown in Fig. 5. This module is used for de-tecting the motor operation by analyzing sensing data from thevoltage sensor and the current sensor. Once a malfunction, suchas a short circuit, a phase missing or an overcurrent, occurs onthe motor power, relay protection module will immediately cutoff the power supply.
4) Interface Module: Interface module includes 4 4 key-board, 128 64 LCD, indicator lights, a buzzer, power switch,start button and stop button. This module is the interface be-tween staff and IS, by which OPU can be started or stopped, thestroke of OPU can be changed, OPU parameters can be preset,sensing data can be inquired and the malfunction informationcan be acquired.
5) Frequency Converter Module: Frequency convertermodule contains frequency converter [21], [22] and a brakingresistor. On one hand, this module can realize soft boot formotor, which reduces inrush to OPU and motor. On the otherhand, this module can adjust the motor speed according tothe received command from CPU so that the stroke of OPU isadjusted and the power is saved.
6) Wireless Communication Module: Wireless communica-tion module is made of a radio station and a Yagi antenna. 9-pinRS232 serial is utilized for the connection between CPU andradio station. Sensing data and OPU parameters are sent to net-work center by using this serial and Yagi antenna.
C. Printed Circuit Board of Our Developed Control Board
The block diagram of the proposed IS is given as above. Onecan see that the proposed IS mainly consists of two main com-ponents: 1) our designed control board as shown in Fig. 2, whichis the core of the whole IS, and 2) a frequency converter, whichis applied for the power frequency adjustment. Compared tothe frequency converter, the control board is a more importantcomponent, whose printed circuit board (PCB) is thus given inFig. 6. In Fig. 6, the relay protection module is space-separatedfrom other logic circuits because the 220 V AC (In China) goesthrough the relay protection module while the 20 V DC is used

1330 IEEE SENSORS JOURNAL, VOL. 12, NO. 5, MAY 2012
Fig. 6. PCB of our designed control board.
for other logic circuits. Space separation between the relay pro-tection module and others avoids interferences.
D. Embedded Software Development of IS
The operation system (OS) [27]–[29], a pre-emptive real-time multi-tasking OS, is utilized as a platformfor the IS embedded development. As shown in Fig. 7(a),once the CPU chip powers up, both the hardware initializationand the software initialization are executed. After OS systeminitialization, the kernal dispatches tasks to beimplemented.
In our proposed IS, embedded software development for theCPU contains 4 tasks and 4 interruptions as shown in Fig. 7(b)and Fig. 7(c). 4 tasks consist of sensing data collection fromFLS, data elementary processing, significant malfunction scanand user interface response. Sensing data collection indicatescollecting dynamic sensing data and automatically storing thesedata in the IS. Data elementary processing means to process theraw sensing data to acquire the required typical data, such as themaximal/minimal/average value, the active/reactive power andthe system efficiency, etc.. Significant malfunction scan is to de-tect the severe malfunctions, such as short circuit, missing phaseand overcurrent, and report them. Also, the user interface is incharge of the external input, the menu display, the oilwell staticparameter storage and the static parameter update. Fig. 7(b) il-lustrates the priority of the 4 tasks, where sensing data collectionhas the highest priority, the next is data elementary processing,followed by significant malfunction scan and the last is the userinterface response. Furthermore, Fig. 7 lists all 4 interruptions,including timer interruption, A/D interruption, communicationinterruption and keyboard interruption. Timer interruption is toprecisely control sampling rate. A/D interruption guarantees thesampling process. Communication interruption is used for datawireless transmission to other sensors and for data/commandreception from other sensors. Keyboard interruption guaranteesthat the external input can be responded to in time.
Fig. 7. (a) CPU power-up process, (b) priority of 4 tasks, and(c) 4 interruptions.
IV. DEVELOPMENT OF TLS
A. System Description of TLS
This subsection aims at clarifying the connection between theTLS and its radio station, i.e., GD230V-8, as well as its GSMmodule, i.e., GSM Wireless Module TC35i [38]. As shown inFig. 8, the TLS includes three components: 1) a user interfacefor interaction; 2) some embedded algorithms for wireless com-munication between the TLS and the IS, a regular data requeston all managed IS, a malfunction diagnosis, a pumping strokeadjustment and GSM SMS; and 3) a database for data storage.
The wireless data, usually including dynamic sensing dataand significant malfunction reports for one specific OPU, is ac-quired via the communication protocol and is then stored in itsdatabase. The TLS is developed using Borland Delphi [30], [31]and its database is designed using Microsoft SQL server 2005[32], [33]. After a thorough malfunction detection in the TLS,once a malfunction is identified, it is immediately sent to themaintenance staff via a GSM AT command [34], which gener-ates a corresponding short message transmission. Furthermore,after a thorough data processing, if one OPU needs a differentpumping stroke to improve power efficiency or increase oil pro-duction, a pumping stroke adjustment command will be sentdown to its IS, by which the corresponding OPU’s pumpingstroke can be changed. For instance, in barren oilfield, with a

WANG et al.: SENSOR NETWORK BASED OILWELL HEALTH MONITORING AND INTELLIGENT CONTROL 1331
Fig. 8. System description of the TLS.
high pumping stroke for a couple of hours, the oil level goesdown and the oil production thus decreases too even with thesame pumping stroke. At this time, a lower pumping strokeshould be used for power efficiency. Therefore, the commandto decrease its OPU pumping stroke is transmitted down to itsIS. As mentioned above, this command is executed via the fre-quency converter.
B. Design of User Interface
The user interface of the TLS has several sub-pages: 1) Dy-namic indication of per OPU current typical data, current LPD,current pump diagram and current malfunction-diagnosis re-sults; 2) Query of per OPU historical data, historical typicaldata, historical LPD, historical pump diagram and historicalmalfunction-diagnosis reports; 3) Forms for reporting statistics;4) OPU’s pumping stroke adjustment; and 5) Data communi-cation (Data transmission request on a typical OPU) and GSMSMS. This interface is directly developed using Borland Delphi.The various data-processing algorithms and data transmission/reception protocols behind this interface are introduced in detailas follows.
C. Protocol of Wireless Communication Between TLS and IS
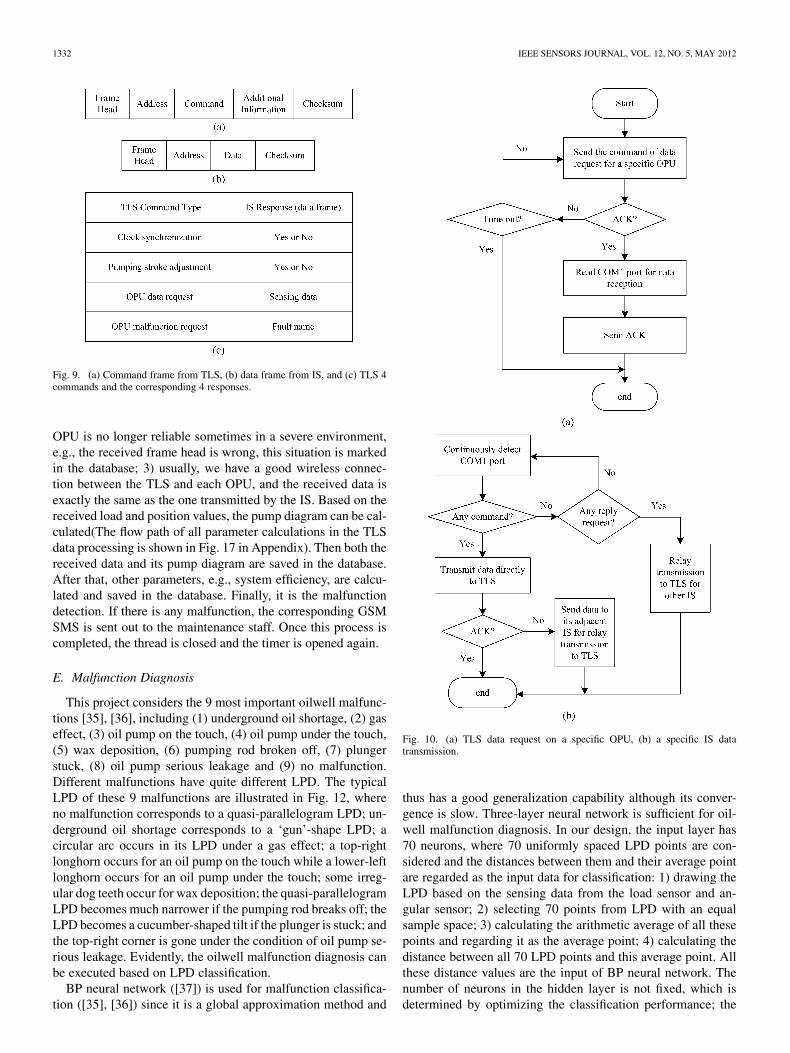
1) Communication Frame Types: In the wireless commu-nication between the TLS and the IS, there are two types offrames: the command frame from the TLS to the IS and thedata frame from the IS to the TLS/IS. As shown in Fig. 9(a),the command frame from the TLS contains five parts: framehead, address, command, additional information and checksum,where the frame head is used as a sign of TLS command arrival;the address is a unique number for per OPU, i.e., the oilwellnumber; the command possibly indicates 1) clock synchroniza-tion, 2) pumping stroke adjustment, 3) OPU data request or 4)OPU significant malfunction request, as shown in Fig. 9(c); theadditional information means the command content (if neces-sary) and the checksum is used for checking the transmissionintegrity.
On the other hand, as shown in Fig. 9(b), the data frame fromthe IS to the TLS/IS contains four parts: frame head, address,
data and checksum, where the frame head is used as a sign ofthe IS data arrival; the address denotes a unique number forthe TLS or for another OPU; the data indicates the responsefor each command frame, as shown in Fig. 9(c): 1) Yes or Nofor clock synchronization command and pumping stroke ad-justment command, 2) sensing data for data-request command,and 3) fault name for TLS significant-malfunction request com-mand; and the checksum is once again used for checking thetransmission integrity.
2) Data Communication Between TLS and IS: The data com-munication process between TLS and IS is given in Fig. 10.Fig. 10(a) illustrates the process of TLS data request on a spe-cific OPU. TLS continuously sends the command of data requestfor a specific OPU within the allotted time if it does not acquirethe corresponding IS ACK signal. Once the prescribed time isout, the data request process fails. Usually, within the allottedtime, TLS can get an IS ACK signal, then read its COM1 port3
for data reception and send an ACK signal to this IS.On the other hand, as shown in Fig. 10(b), each IS continu-
ously detects its COM1 port to see any TLS command or any ISrelay request. Once acquiring a TLS data request, the IS firstlysends sensing data directly to the TLS and then awaits for a TLSACK. Usually, it gets a TLS ACK and completes the data trans-mission process. In some special cases, a TLS ACK is not ac-quired and then it sends sensing data to its adjacent IS for relaytransmission to the TLS. Alternatively, once acquiring a relayrequest, this IS will directly transmit the received data to theTLS and complete the data transmission process.
D. Regular Data Request on All Managed OPU
An inner timer in Borland Delphi is used for a thread opening,where the OPU data reception is accomplished one OPU afteranother. As mentioned above, this kind of data reception is reg-ularly processed every eight hours for the whole data manage-ment and OPU health monitoring. The flow chart of this regularOPU data request is illustrated in Fig. 11, where one can seethat 1) the regular data request is processed one OPU by one; 2)if the wireless communication between the TLS and one of its
3Assume that wireless communication is implemented via COM1 port.
1332 IEEE SENSORS JOURNAL, VOL. 12, NO. 5, MAY 2012
Fig. 9. (a) Command frame from TLS, (b) data frame from IS, and (c) TLS 4commands and the corresponding 4 responses.
OPU is no longer reliable sometimes in a severe environment,e.g., the received frame head is wrong, this situation is markedin the database; 3) usually, we have a good wireless connec-tion between the TLS and each OPU, and the received data isexactly the same as the one transmitted by the IS. Based on thereceived load and position values, the pump diagram can be cal-culated(The flow path of all parameter calculations in the TLSdata processing is shown in Fig. 17 in Appendix). Then both thereceived data and its pump diagram are saved in the database.After that, other parameters, e.g., system efficiency, are calcu-lated and saved in the database. Finally, it is the malfunctiondetection. If there is any malfunction, the corresponding GSMSMS is sent out to the maintenance staff. Once this process iscompleted, the thread is closed and the timer is opened again.
E. Malfunction Diagnosis
This project considers the 9 most important oilwell malfunc-tions [35], [36], including (1) underground oil shortage, (2) gaseffect, (3) oil pump on the touch, (4) oil pump under the touch,(5) wax deposition, (6) pumping rod broken off, (7) plungerstuck, (8) oil pump serious leakage and (9) no malfunction.Different malfunctions have quite different LPD. The typicalLPD of these 9 malfunctions are illustrated in Fig. 12, whereno malfunction corresponds to a quasi-parallelogram LPD; un-derground oil shortage corresponds to a ‘gun’-shape LPD; acircular arc occurs in its LPD under a gas effect; a top-rightlonghorn occurs for an oil pump on the touch while a lower-leftlonghorn occurs for an oil pump under the touch; some irreg-ular dog teeth occur for wax deposition; the quasi-parallelogramLPD becomes much narrower if the pumping rod breaks off; theLPD becomes a cucumber-shaped tilt if the plunger is stuck; andthe top-right corner is gone under the condition of oil pump se-rious leakage. Evidently, the oilwell malfunction diagnosis canbe executed based on LPD classification.
BP neural network ([37]) is used for malfunction classifica-tion ([35], [36]) since it is a global approximation method and
Fig. 10. (a) TLS data request on a specific OPU, (b) a specific IS datatransmission.
thus has a good generalization capability although its conver-gence is slow. Three-layer neural network is sufficient for oil-well malfunction diagnosis. In our design, the input layer has70 neurons, where 70 uniformly spaced LPD points are con-sidered and the distances between them and their average pointare regarded as the input data for classification: 1) drawing theLPD based on the sensing data from the load sensor and an-gular sensor; 2) selecting 70 points from LPD with an equalsample space; 3) calculating the arithmetic average of all thesepoints and regarding it as the average point; 4) calculating thedistance between all 70 LPD points and this average point. Allthese distance values are the input of BP neural network. Thenumber of neurons in the hidden layer is not fixed, which isdetermined by optimizing the classification performance; the

WANG et al.: SENSOR NETWORK BASED OILWELL HEALTH MONITORING AND INTELLIGENT CONTROL 1333
Fig. 11. Flow chart of regular data request on all managed OPU, where� is assumed to be the total number of all managed OPU.
Fig. 12. Illustration of load-position diagrams corresponding to 9 consideredmalfunctions.
output layer has 9 neurons, which correspond to 9 consideredmalfunctions, respectively. Table I illustrates 9 considered mal-functions and their corresponding neural network training-dataoutput. The ideal case is that, once a malfunction occurs, its cor-responding neuron output should be equal to 1 while other neu-rons all output a 0. The threshold value for convergence is set at
TABLE ITHE CORRESPONDING NEURAL NETWORK OUTPUT OF
9 CONSIDERED MALFUNCTIONS
. By setting this threshold value, the obtained classificationrate is acceptable for our application. This neural network aftertraining can be used for malfunction classification. For testingdata, the neural network output is not binary (0 or 1) any morebut a decimal fraction, where the malfunction corresponding tothe maximal output value is regarded as the true malfunction.
F. Pumping Stroke Adjustment
Pumping stroke adjustment is another significant feature theproposed sensor network based automatic control system canoffer. This is especially true in a barren oilfield where automaticpumping stroke adjustment guarantees both oil production andpower efficiency. As we know, the OPU is a huge power-con-suming device and automatic pumping stroke adjustment maysave a considerable power.
Due to the constraint of the motor belt, the OPU’s pumpingstroke availably ranges from 2 to 10. The recommended

1334 IEEE SENSORS JOURNAL, VOL. 12, NO. 5, MAY 2012
Fig. 13. Flow chart of remote pumping stroke adjustment for all managed OPU.
pumping stroke always leads to an optimal performance fora given situation, i.e., maximal oil production with optimalpower efficiency. Therefore, the optimal pumping stroke isobtained by maximizing the oil production or the system effi-ciency. Fig. 13 shows the flow chart of remote pumping strokeadjustment for all managed OPU.
G. GSM SMS
1) Short Message Transmission Using AT Commands: Thereare two modes for short message transmission of the SiemensGSM module TC35i [38]: TEXT mode and PDU mode. TEXTmode is for English SMS while PDU mode has capability ofboth English SMS and Chinese SMS. Both modes utilize theAT commands for short message communication. As shown inFig. 14(a), the PDU mode is selected for our application. The en-tire short message transmission consists of four steps: 1) settingthe telephone/cell phone number of the short message centerusing the command: , 2) changing to the PDUmode using the command: , 3) encoding the short
Fig. 14. (a) GSM short message transmission using �� commands, (b) in-forming malfunctions to the related maintenance staff using GSM SMS, where� is assumed to be the number of the related maintenance staff.
message to PDU code; and 4) sending the whole PDU codeusing the command: .
2) Malfunction Transmission Via GSM SMS: The mal-function transmission to the related maintenance staff isaccomplished using GSM SMS. The flow chart of this process

WANG et al.: SENSOR NETWORK BASED OILWELL HEALTH MONITORING AND INTELLIGENT CONTROL 1335
Fig. 15. Tables in our designed database for data storage.
is shown in Fig. 14(b), which calls the subfunction of GSMshort message transmission using commands given inFig. 14(a). Once the OPU malfunction is identified, the COM1port is then continuously checked4 until it is idle. Furthermore,calling the subfunction of GSM short message transmissionsends the OPU malfunction name to all maintenance staffs oneby one.
3) TLS Database: Our designed TLS database consists of24 tables as shown in Fig. 15, where 8 tables are for OPU staticparameter storage, 7 tables are for OPU dynamic sending datastorage and other 9 tables are for neural network based malfunc-tion detection/classification.
Specifically, 8 static-parameter tables contain a master listof oilwell static parameters, OPU parameters, pumping rod pa-rameters, oil pump parameters, light pole parameters, oil pipeparameters, pumping tube parameters and motor parameters.7 dynamic-parameter tables consist of master list of dynamicdata, oilwell number and order number mapping table, sensingdata, maintenance staff cellphone number, oilwell stop records,malfunction name and encoding, and GSM SMS selected mal-functions. And, 9 tables for neural network based malfunctiondetection include neural network basic information, e.g., thenumber of layers and the number of neurons in each layer, inputtraining data, output training data, testing data, training outputresults, weights from the input layer to the hidden layer, weightsfrom the hidden layer to the output layer, threshold value for the
4The COM1 port is probably busy because it may be occupied by wirelesscommunication between TLS and IS.
hidden layer and threshold value for the output layer. The cre-ation, maintenance, access and indication of this database arebased on four operations of ‘add’, ‘update’, ‘delete’ and ‘search’on these tables.
V. SYSTEM ASSEMBLY AND EXPERIMENT RESULTS
A. System Assembly in the Oilfield
For practical experiments, our proposed sensor networkbased system is installed in the Chinese Petroleum’s Changqingoilfield in Gansu Province Fig. 16(a) shows the connectionof the FLS, the developed IS and an oilwell belonging tothe Changqing oilfield. In our proposed system, one OPU isconnected to one IS and a set of FLS: a load sensor, an angularsensor, a voltage sensor, a current sensor and an oil pressuresensor as shown in Fig. 16(a), where the load sensor and theangular sensor are visible while other three sensors are insidethe box and thus not visible in this figure. Specifically, each FLSis installed at a proper spot for sensing the oilwell’s data, whichis connected to the developed IS by a cable. Additionally, the ISis also connected to a radio station (connected to an antenna),to the OPU’s motor and to the power supply.
B. Assembly of TLS
The SD TLS, shown in Fig. 16(b), is under an on-site com-missioning in the Changqing Oilfield. As shown, the SD TLShas been installed in the laptop and is connected to a radio sta-tion via COM1 port, where the radio station is connected to its

1336 IEEE SENSORS JOURNAL, VOL. 12, NO. 5, MAY 2012
Fig. 16. (a) Assembly of our developed IS in the oilwell in Changqing oilfieldand (b) connection of TLS (In the laptop) to the radio station (Antenna is outsidethe office).
antenna (outside the office) via a cable. This antenna wirelesslycommunicates with the 25 IS using our proposed communica-tion protocols. Moreover, the SD TLS is connected to a Siemenswireless GSM module TC35i via COM2 port for the identifiedoilwell malfunction report to the maintenance staff.
C. Automatic Pumping Stroke Adjustment
In this section, we conduct a 12-hour practical experiment ofthe automatic pumping stroke adjustment for a specific oilwell,HUACHI-38-122, by using the flow chart in Fig. 13. In this ex-periment, the SD TLS regularly adjusts its pumping stroke every30 minutes in order to achieve the maximal oil production . Itis noticed that two turning points in this process occur at threehours and five hours after the oilwell powers up. Within threehours, the pumping stroke is stably set as 6 times per minutefor our considered oilwell HUACHI-38-122. After three hours,its pumping stroke increases to 10 times per minute until fivehours after powering up. Finally, after five hours, its pumpingstroke goes down to 7 times per minute until the completion
TABLE IIEXPERIMENT OF AUTOMATIC PUMPING STROKE ADJUSTMENT AT OILWELL
HUACHI-38-122: EQUIVALENT OIL PRODUCTIONS AT PER ITS PUMPING
STROKE AFTER ONE HOUR, THREE HOURS AND FIVE HOURS, RESPECTIVELY
TABLE. IIICLASSIFICATION ACCURACY OF PER MALFUNCTION
USING OUR PROPOSED NEURAL NETWORK
of our experiment. These two turning points and their corre-sponding oil productions at per its pumping stroke are all illus-trated in Table II, where the one-hour-later oil productions at perits pumping stroke are also given for the comparison purpose.One point to be noted is that in Table II is not a real oil pro-duction but an equivalent oil production used in the SD TLS.
The described phenomena above that the pumping stroke ofthe oilwell HUACHI-38-122 automatically increases to 10 timesper minute from 6 times per minute after three-hour running andthen drops to 7 times per minute after five-hour running is as aresult of two facts: 1) in the considered oilwell HUACHI-38-122, where the water is continuously being poured in, its watercapacity is relatively high, and 2) its corresponding OPU hasstopped working for a long while and the oil level of its oil pipekeeps low. In this case, according to the expert experience, whenour experiment starts, it is not suitable for the OPU to stronglypump with a high stroke. The resulting pumping stroke, 6 timesper minute, using our proposed system, is consistent with the ex-pert suggestion. After three-hour continuous oil pumping, theoil level in its oil pipe comes up, so its pumping stroke alsocomes up to 10 times per minute in order for more oil produc-tion. However, five hours later, the oil pressure at its pump’s en-trance greatly decreases and thus its every pumping is not filledany more. Under this condition, its pumping stroke is not suit-able to be high any more in order for power economy as wellas oil production. The resulting pumping stroke goes down to7 times per minute, under which each pumping is filled andthe power consumption is much less than that under the highpumping stroke, i.e., 10 times per minute. To sum up, the wholeexperiment result of automatic pumping stroke adjustment is

WANG et al.: SENSOR NETWORK BASED OILWELL HEALTH MONITORING AND INTELLIGENT CONTROL 1337
Fig. 17. TLS data processing: flow path of all parameter calculations.
consistent with the variation of oilwell under, so it makes sensein general.
D. Oilwell Malfunction Diagnosis
Automatic oilwell malfunction diagnosis is one of the mainfeatures of our proposed system. In this section, we conducta practical experiment of the malfunction diagnosis on 25HUACHI oilwells. However, as these oilwells all belong tothree catalogues: Class 9—no malfunction, Class 1—under-ground oil shortage and Class 2—gas effect, plenty of oilwell’shistorical LPD record of the whole Changqing Oilfield are alsoutilized for testing our BP neural network based malfunctionclassification. By considering both current data and historicalLPD records, there are more than 40,000 oilwell LPDs usedfor malfunction classification, where about 26,600 records,two thirds of the dataset, are used as training data for ourproposed neural network while other 13,300 records, one thirdof the dataset, are used as testing data. In this application, thethree-layer BP neural network consists of 70 input neurons, 12hidden neurons and 9 output neurons.
Even though the corresponding training output is binaryas shown in Table I, the testing output is actually a decimalfraction not exactly 0 or 1, where the catalogue correspondingto the maximal output is regarded as the true one. Accordingto this principle, an overall 90.3% classification accuracy isachieved for testing-data malfunction diagnosis using our pro-posed neural network. Table III illustrates the correspondingclassification accuracy for each malfunction for testing data. Itis noticed that there are several malfunctions that are difficultto classify, such as Class 3, Class 4 and Class 5, so that theyhave a relatively lower classification accuracy compared toother classes. This result is intuitive when you examine their
corresponding LPD in Fig. 12 because their LPD are more orless similarity difficult to be classified. Another observation topoint out is that the classification error mainly comes from 1)the confusion between Class 1 and Class 2, 2) the confusionbetween Class 3, Class 4 and Class 5, and 3) the confusionbetween Class 8 and Class 9. Another essential point is themalclassification of Class 9—no malfunction. Since the mostfrequent status of an oilwell is no malfunction, its misclassi-fication may result in a large amount of inconveniences. Seenfrom the classification performance given in Table III, to avoidthis misclassification: Class 9—no malfunction is misclassifiedto Class 8—Oil pump leakage, some mild leakage cases arethus ignored and only severe oil pump leakage is reported as amalfunction to be fixed.
VI. CONCLUSIONS
In this paper, a sensor network based oilwell remote healthmonitoring and intelligent control system was proposed forOPU management in the oilfield. This proposed system con-sists of three-level sensors: the FLS, the IS and the TLS. TheFLS have been used for an oilwell’s data sensing, includinga load sensor, an angular sensor, a voltage sensor, a currentsensor and an oil pressure sensor for each oilwell. The IS wasdesigned mainly for an oilwell’s data elementary processing,main fault alarm/indication, typical data storage/indication,data/status transmission up to the TLS, data/status transmissionbetween IS, command transmission down to the OPU motor.And the SD TLS was designed for hundreds of oilwells’ datastorage/management, data processing malfunction detection,malfunction alarm/indication, stroke-adjustment commandtransmission down to a specific IS for power economy andmalfunction reporting to maintenance staff via GSM SMS. The

1338 IEEE SENSORS JOURNAL, VOL. 12, NO. 5, MAY 2012
design of the IS and the TLS was given in details. The on-sitepractical experiments at the Chinese Petroleum’s ChangqingOilfield have demonstrate that our proposed IS and TLS worksmoothly. Two significant goals: remote pumping stroke ad-justment and automatic oilwell malfunction diagnosis, havealso been justified. The pumping stroke adjustment was shownto be consistent with the expert experience and the oilwellmalfunction classification acquired an average 90.3% accuracy.Furthermore, the remote OPU management in our proposedsystem was demonstrated to be much more convenient than theexisting manual control system.
APPENDIX
TLS DATA PROCESSING
TLS data processing is shown in Fig. 17. The flow path of allparameter calculations is provided as follows:
• Using load sensor and angular sensor, the most importantparameter, i.e., LPD, is obtained. Next, based on LPD, boththe pumping diagram and oilwell malfunction diagnosiscan be achieved.
• Using current sensor and voltage sensor, the motor inputpower is acquired. Based on this parameter as well asLPD, ground efficiency and balance adjustment can becalculated.
• Using oil pressure sensor and sound wave generator, theunderground efficiency is obtained. Based on undergroundefficiency and ground efficiency, the system efficiency canbe calculated.
• Using the parameters of pumping diagram, oil level andpumping stroke, the oil production can be obtained.
REFERENCES
[1] T. Becker, M. Kluge, J. Schalk, K. Tiplady, C. Paget, U. Hillering-mann, and T. Otterpohl, “Autonomous sensor nodes for aircraft struc-tural healt monitoring,” IEEE Sensors J., vol. 9, no. 11, pp. 1589–1595,Nov. 2009.
[2] D. G. Senesky, B. Jamshidi, K. Cheng, and A. P. Pisano, “Harsh envi-ronment silicon carbide sensors for health and performance monitoringof aerospace systems: A review,” IEEE Sensors J., vol. 9, no. 11, pp.1472–1478, Nov. 2009.
[3] K. Sampigethaya, R. Poovendran, L. Bushnell, M. Li, R. Robinson,and S. Lintelman, “Secure wireless collection and distribution of com-mercia airplane health data,” IEEE Aerosp. Electron. Syst. Mag., vol.24, no. 7, pp. 14–20, Jul. 2009.
[4] M. J. Whelan, M. V. Gangone, and K. D. Janoyan, “Highway bridgeassessment using an adaptive real-time wireless sensor network,” IEEESensors J., vol. 9, no. 11, pp. 1405–1413, Nov. 2009.
[5] N. A. Bertoldo, S. L. Hunter, R. A. Fertig, G. W. Laguna, and D. H.MacQueen, “Development of a real-time radiological area monitoringnetwork for emergency response at Lawrence Livermore National Lab-oratory,” IEEE Sensors J., vol. 5, no. 4, pp. 565–573, Apr. 2005.
[6] F. Hu, Y. Xiao, and Q. Hao, “Congestion-aware, loss-resilient biomon-itoring sensor networking for mobile health applications,” IEEE J. Sel.Areas Commun., vol. 27, no. 4, pp. 450–465, Apr. 2009.
[7] M. Venugopal, K. E. Feuvrel, D. Mongin, S. Bambot, M. Faupel, A.Panangadan, A. Talukder, and R. Pidva, “Clinical evaluation of novelinterstitial fluid sensor system for remote continuous alcohol moni-toring,” IEEE Sensors J., vol. 8, no. 1, pp. 71–80, Jan. 2008.
[8] R. Kumar, R. R. Das, V. N. Mishra, and R. Dwivedi, “A neuro-fuzzyclassifier-cum-quantifier for analysis of alcohols and alcoholic bever-ages using responses of thick-film tin oxide gas sensor array,” IEEESensors J., vol. 10, no. 9, pp. 1461–1468, Sep. 2010.
[9] J. Brusey, E. I. Gaura, D. Goldsmith, and J. Shuttleworth, “FieldMAP:A spatiotemporal field monitoring application prototyping framework,”IEEE Sensors J., vol. 9, no. 11, pp. 1378–1390, Nov. 2009.
[10] Q. Ling, Z. Tian, Y. Yin, and Y. Li, “Localized structural health mon-itoring using energy-efficient wireless sensor networks,” IEEE SensorJ., vol. 9, no. 11, pp. 1596–1604, Nov. 2009.
[11] J. Chin, J. M. Rautenberg, C. Y. T. Ma, S. Pujol, and D. K. Y. Yau,“An experimental low-cost, low-data-rate rapid structural assessmentnetwork,” IEEE Sensors J., vol. 9, no. 11, pp. 1361–1369, Nov. 2009.
[12] D. Akopian, A. Melkonyan, and C. L. P. Chen, “Validation of HDOPmeasure for impact detection in sensor network-based structural healthmonitoring,” IEEE Sensors J., vol. 9, no. 9, pp. 1098–1102, Sep. 2009.
[13] P. Sridhar, A. M. Madni, and M. Jamshidi, “Hierarchical aggregationand intelligent monitoring and control in fault-tolerant wireless sensornetworks,” IEEE Sensors J., vol. 1, no. 1, pp. 38–54, Jan. 2009.
[14] B. C. Arrue, A. Ollero, and J. R. Matinez de Dios, “An intelligentsystem for false alarm reduction in infrared forest-fire detection,” IEEEIntell. Syst., vol. 15, no. 3, pp. 64–73, Mar. 2000.
[15] R. Luo, C. Yih, and K. Su, “Multisensor fusion and integration: Ap-proaches, applications, and future research directions,” IEEE SensorsJ., vol. 2, no. 2, pp. 107–119, Aug. 2002.
[16] C. Cheng, C. Tse, and F. Lau, “A delay-aware data collection networkstructure for wireless sensor networks,” IEEE Sensors J., vol. 11, no.1, Apr. 2011.
[17] C. Cheng, C. Tse, and F. Lau, “A clustering algorithm for wirelesssensor networks based on social insect colonies,” IEEE Sensors J., vol.11, no. 1, Apr. 2011.
[18] M. C. Rodriguez-Sanchez, S. Borromeo, and J. Hernandez-Tamames,“Wireless sensor network for conservation and monitoring cultural as-sets,” IEEE Sensors J., vol. 11, no. 1, Apr. 2011.
[19] C. Alippi, R. Camplani, C. Galperti, and M. Roveri, “A Robust, adap-tive, solar-powered WSN framework for aquatic environmental moni-toring,” IEEE Sensors J., vol. 11, no. 1, pp. 45–55, Apr. 2011.
[20] Y. Wang, Oil Pumping Units (In Chinese). Beijing, China: PetroleumIndustry, 1994.
[21] D. Li, AC Frequency Converter Control System. Beijing, China: Chi-nese Electronic Industry, 2003.
[22] A. Han, General-Purpose Frequency Converter and Applica-tion. Beijing, China: Chinese Machinery Industry, 2000.
[23] “DSP56F807EVMUM 56F807 Evaluation Module Hardware User’sManual,” Motorola Semiconductor Products Inc., May 2003, Phoenix,AZ.
[24] “DSP56F801-7UM DSP56F801-7UM 16-Bit Digital Signal ProcessorUsers Manual,” Motorola Semiconductor Products Inc., May 2004,Phoenix, AZ.
[25] “MAX7000 Programmable Logic Device Family Data Sheet,” AL-TERA Corporation, Aug. 2000, San Jose, CA.
[26] “DSP56F80X High-Speed RS-232 Interface,” Motorola Semicon-ductor Products Inc., 2000, Phoenix, AZ.
[27] J. J. Labrosse, MicroC/OS-II: The Real-Time Kernel. Weston, FL:Micrium Inc., 2002.
[28] J. J. Labrosse, C/OS-III: The Real-Time Kernel. Weston, FL: Mi-crium Inc., 2009.
[29] J. J. Labrosse, Uc/OS-III: The Real-Time Kernel and the RenesasSh7216. Weston, FL: Micrium Inc., 2010.
[30] S. Teixeira and X. Pacheco, Borland Delphi 6 Developer’s Guide.Philadelphia: SIAM, 2002.
[31] M. Cantu, Mastering Delphi 6. Alameda, CA: SYBEX Inc., 2001.[32] B. Hamilton, Programming SQL Server 2005. Sebastopol, CA:
O’Reilla Media Inc., 2006.[33] D. Petkovic, Microsoft SQL Server 2005: A Beginner’s Guide. New
York: McGraw-Hill/Osborne, 2005.[34] K. G. Vijay and E. W. Joseph, Principles and Applications of GSM.
Upper Saddle River, NJ: Prentice-Hall PTR, 1999.[35] Z. Pan, J. Ge, and Q. Zhang, “Artifical neural networks for identifica-
tion of beam pump dynamometer cards,” J. Univ. of Petroleum, China,vol. 20, no. 2, pp. 40–43, Apr. 1996.
[36] Z. Wang, G. Xue, Z. Jin, and J. Wang, “Identification of load-positiodiagram using BP nerual network,” Petroluem Drilling Tech., vol. 29,no. 2, pp. 56–57, Apr. 2001.
[37] C. Yves and E. R. David, Backpropagation: Theory, Architectures, andApplications. Hillsdale, NJ: Lawrence Erlbaum Assoc. Inc., 1995.
[38] Siemens [Online]. Available: http://www.warburtech.com/gsm/tc35i.terminal/.

WANG et al.: SENSOR NETWORK BASED OILWELL HEALTH MONITORING AND INTELLIGENT CONTROL 1339
Donglin Wang (S’09–M’10) received the B.E.and M.S. degrees in electronics and informationengineering from Xián Jiaotong University, Xián,China, in 2003 and 2006, respectively, and the Ph.D.degree in electrical engineering from the Universityof Calgary, Calgary, AB, Canada, in 2010.
He is currently a Postdoctoral Research Fellowin electrical engineering with the University ofCalgary. His research interests consist of GNSS andground-based wireless location, OFDM/multicarrierbased ranging and positioning, wireless commu-
nication and signal processing, and sensor networks. He has authored andcoauthored one book and more than 30 referred journal/conference papers inhis research area.
Renlun He received the B.E. degree in electrical engineering and M.S. degreein electronics and information engineering from Xián Jiaotong University, Xián,China, in 2003 and 2006, respectively.
Since then, he has been a DSP Engineer with the 29 Research Institute, Groupof Chinese Electronic Science and Technology. His research interests includedigital signal processing and embedded system design.
Jiuqiang Han received the degree in automatic control from Xián Jiaotong Uni-versity, Xián, China.
He is now a Professor and the Director of the Automatic Control Institute,Xi’an Jiaotong University. His research interests include automatic control, in-telligent detection, instrumentation and measurement, and image processing.His long-term research has generated six books and 200 refereed publications.
Michel Fattouche received the B.Sc. degree inelectrical engineering from Cairo University, Cairo,Egypt, in 1979, the B.Sc. degree in applied math-ematics from Ain Shams University in 1981, andthe M.S. and Ph.D. degrees from the University ofToronto, Toronto, ON, Canada, in 1982 and 1986,respectively.
He joined the Department of Electrical and Com-puter Engineering, University of Calgary, Calgary,AB, Canada, as an Assistant Professor in 1986,where he is currently a Professor. He is also an
Adjunct Professor with the Calgary-based Wireless Division of TRLabs, aresearch consortium of telecommunications companies. He has five patentsissued and four patents pending in the field of wireless communications. Hecofounded Wi-LAN, Inc., in 1997. From 1993 to 1997, he was VP of Researchof Wi-LAN, Inc., where he is currently VP of Engineering. From 1996 to1997, he was the President of Cell-Loc, Inc., where he is currently ChiefTechnical Officer. He is on the Board of Directors for Wi-LAN, Inc., Cell-Loc,Inc., Wireless, Inc., and the University of Calgary Engineering EndowmentFoundation.
Fadhel M. Ghannouchi (S’84–M’88–SM’93–F’07)is currently a Professor, iCORE/Canada ResearchChair and Director of the iRadio Laboratory(www.iradio.ucalgary.ca) in the Department ofElectrical and Computer Engineering at the Uni-versity of Calgary, Alberta. He was with EcolePolytechnique de Montreal until 2005, where hetaught microwave theory and techniques and RFcommunications systems since 1984. He has heldseveral invited positions at several academic andresearch institutions in Europe, North America
and Japan. He has provided consulting services to a number of microwaveand wireless communications companies. His research interests are in theareas of RF and wireless communications, nonlinear modeling of microwavedevices and communications systems, design of power-and spectrum-efficientmicrowave amplification systems and design of SDR systems for wireless andsatellite communications applications. His research has led to over 500 refereedpublications, seven U.S. patents, and seven patent applications.
Dr. Ghannouchi is a Fellow of the IET, the Engineering Institute of Canada(EIC), and The Canadian Academy of Engineering (CAE).