Embed Size (px)
Citation preview

Die Expeditionen ANTARKTIS XVI 1 3 - 4 des Forschungsschiffes ,,POLARSTERNu 1999
The Expeditions ANTARKTIS XVI 1 3 - 4 of the Research Vessel ,,POLARSTERNu in 1999
Hrausgegeben von I Edited by Ulrich Bathmann, Victor Smetacek, Manfred Reinke unter Mitarbeit der Fahrtteilnehmer I with contributions or the participants
Ber. Polarforsch. 364 (2000) ISSN 0176 - 5027


ANTARKTIS XVIl3 - 4
18 MARZ 1999 - 08 JUNI 1999
KOORDINATOFUCOORDINATOR
Heinrich Miller
ANT XVIl3: Cape Town - Cape Town
FAHRTLEITER/CHIEF SCIENTIST
Victor Smetacek
ANT XVIl4: Cape Town - Bremerhaven
FAHRTLEITEFUCHIEF SCIENTIST
Manfred Reinke

ANT XVIl3
2. Weather 12
3. Physical Control of Primary Production and of biogeochemical fluxes at the antarctic polar front 3. l Underway Measuremets of Hydrographie and Biological Variables with the Towed Undulating
Vehiclc 'Scanfish' 3.2 CTD Stations and Water Bottle Sampling 3.3 Underway Measurements of Currents with the Vessel-Mounted
Acoustic Doppler Current Profiler 3.4 Measurements with Moored Instruments 3.5 Measurements of Acoustic Backscatter by Vessel-Mounted and Moored ADCPs as Proxies of
Zooplankton Abundance
4. Distribution of nutrients (AWI)
5. determination of the stable C and N isotopes in the particulate organic matter (AWI
6. Field Distribution of Iron in a Section of the Antarctic Polar Frontal Zone
7. Phytoplankton
8. Surface chlorophyll measurements
9. Biophysical measurements
10. Study of the mechanisms controlling phytoplankton growth in late summer-early autumn in the Southern Ocean with special attention to iron and silicate physiology
11. Fluorescence of Marine Phytoplankton
12. Phytoplankton dynamics in austral autumn in the Southern Ocean
13. Responses to iron limitation of natural phytoplankton assemblages collected around the Polar Front and single species cultures of Antarctic diatoms.
14. Light adaptation by natural phytoplankton populations, and its control by iron limitation.
15. Krill Biology and Krill Physiology 15.1 General outline 15.2. Examining overwintering strategies of Antarctic krill (Euphausia superba)
16. Zooplankton at the Antarctic Polar Front
17. Biomass Production, Substrate Dynamics and Community Structure of the Heterotrophie Picoplankton at the Polar Front and the Weddell Sea in Fall
18. Census of Marine Birds and Mammals
19. Source regions and transport paths of iron in the Antarctic Circumpolar Current 19.1 Objectives 19.2 Sampling strategy, sample processing and first on board analyses
20. Export production measured through the 234Thf238U disequilibrium in surface water.
21. Real-Time Satellite Information 21.1 SeaWiFS for Mapping Chlorophyll-a 21.2 DMSP Special Sensor Microwave/Imager 21.3 NOAA Weather Satellites 21.4 Sea Ice Information
22. Participants / Fahrtteilnehmer ANT XVI/3
23. Participanting Institutes I Beteiligte Institute
24. Ship's Crew I Schiffsbesatzung ANT XVU3

ANT XVIi4
A. Fahrtroute ANT XVIl4
B. Itinerary ANT XVU4
C. PODEV Nachfolge
D. The Scientific Computimg Network on RV "Polarstern"
E. Nahrungsökologi und Energetik des antarktischen Krill
F. Trophodynamics and energetics of the Antarctic krill
G. Source regions and transport paths of iron in the Antarctic Circumpolar Current
H. Biooptik und Bio-chemie von Eisalgen und Phytoplankton
I. Bio-optics and bio-chemistry of ice algae and phytoplankton
K. Participants I Fahrtteilnehmer ANT XVIl4
L. Participanting Institutes / Beteiligte Institute
M. Ship's Crew 1 Schiffsbesatzung ANT XVI

FAHRTABSCHNITT ANT XVIl3 KAPSTADT - KAPSTADT (18.3.99 - 10.5.99)
1. INTRODUCTIONIEINLEITUNG U. Bathmann und V. Smetacek (AWI)
Wissenschaftlicher Bericht der Polarstern-Expedition ANT XVIl3: Frontendynamik und Biologie ll
Polarstern verlieà planmäß am 18.3. Abends Kapstadt in Richtung Süden Die erste wissenschaftliche Arbeit der Expedition ANT XI13 war das Ausbringen einer ozeanographischen Verankerung, die gemeinsam vom Institut fü Meereskunde Kiel und dem Hydrographischen Institut der Univ. Kapstadt vorbereitet wurde und hydroakustische Meßverfahre zur Strömungsermittlun verfolgt. Nach Erreichen des Meßgebeite an der Polarfont wurden deren hydrographische Charakteristika mittels eines Schleppsystems (s. Kapitel 3.) aufgenommen. Eine Raute von 5 Verankerungsystemen wurde nördlich in und südlic der Polarfrontzone ausge- bracht (s. Kapitel 3.4) um die Strömungsdynami und die Partikelsedimentation hochfrequent in mehreren Tiefenintervallen bis nahe zum Meeresboden übe 6 Wochen zu vermessen.
Die Expedition verfolgte zwei wissenschaftliche Zielsetzungen, die jeweils in IGBP Kernprojekte eingebunden sind:
A. Erfassung der mesoskaligen Hydrographie in Beziehung zur Biologie und Geochemie an der Polar Front (Southern Ocean Joint Global Ocean Flux Study, SO JGOFS)
B. Ernährungsstrategie vom antarktischen Krill Euphausia superba im Herbst (Southern Ocean Global Ocean Ecosystem Dynamics, SO GLOBEC),
Die Untersuchungen zum Thema A werden von einem interdisziplinäre Team, zusammengesetzt aus Mitgliedern von 3 AWI-Fachbereichen sowie Institutionen in den Niederlanden (12 Wissenschaftler) und UK (3) durchgeführt Letztere sind Partner in den EU-Projekten MERLIM und CARUSO. Die meisten niederiän dischen Teilnehmer stammen aus dem NIOZ und sind im Rahmen des Nieder- ländisch-Bremische Abkommens (NEBROC) an der Fahrt beteiligt. Ziel der miteinander verzahnten Projekte ist die Ermittlung der Faktoren: mesoskalige Frontendynamik, Eisen- und Siliziumverfügbarkei sowie Wegfraà bei dem Aufbau und Absinken von Diatomeenblüte an der Polar Front. Diese Fahrt ist die Dritte einer Reihe, die die Rolle des Südpolarmeere als Quelle oder Senke vom atmosphärische C02 untersucht. Bei der ersten Fahrt (ANT Xl6) stellten sich die überragende Rollen der Eisenverfügbarkei sowie der mesoskaligen Hydrographie an Fronten bei der Erzeugung von Diatomeenblüte und der gekoppelten Aufnahme von C02. Bei der zweiten Fahrt (ANT Xllll2) wurde ein Grid an der Polar Front sehr genau vermessen und die Beziehungen zwischen der Frontendynamik, der Eisenverfügbarkei und den relevanten biologischen Prozessen währen des Sommers ermittelt. Der Aufbau dick- schaliger Diatomeenpopulationen konnte auf den Wegfraà der weniger ge- schützte Arten zurückgefüh werden. Die Schalen solcher dickschaligen Arten akkumulieren im Sediment, weshalb die Region unterhalb des Zirkumpolarstroms mit Abstand die größ Siliziumsenke im Weltmeer darstellt. Die jetzige Fahrt nimmt die Situation an der Polarfront im Herbst auf.
Zu Beginn der Reise wurde ScanFish - ein zwischen Oberfläch und 250m Tiefe undulierendes Instrument, das Temperatur, Salzgehalt, Chlorophyllfluoreszenz und Druck miß - zwischen 46' und 52OS entlang des 20 E Meridians geschleppt, um

die Lage der Frontensysteme zu erkunden. Danach wurden 5 Verankerungen mit Strommessern (davon 3 mit Sedimentfallen) im Kreuz übe die Polarfront ausgebracht und ein Grid von Ca. 140 X 140 km mit 15km Intervallen mit dem ScanFish vermessen. Anschließen wurde ein Transekt mit 7 Stationen durch das Meßgebie gelegt. Die Ergebnisse zeigen, da wir einen südliche Meander der Polarfront angeschnitten hatten: Warmes, silikat- und planktonarmes Oberflächenwasse war dabei, die Wassermasse südlic der Front zu Überschichten Im südliche Wasser waren die Planktongehalte fü die Jahreszeit überraschen hoch und dominiert durch eine Population der Diatomee Fragilariopsis kerguelensis, deren Schalen den Hauptanteil des am Boden akkumulierenden Diatomeenschlamms ausmacht. Detaillierte Untersuchungen des Zustands dieser Art quer zur Front zeigen, da verschiedene Stadien des Lebenszyklus sich vom Norden nach Süde abwechselten. Das Maximum der Population befand sich zwischen 60 und 100m Tiefe, weil die südlich Oberflächenschicht in der die Blüt herangewachsen war, zum Zeitpunkt der Messungen subduziert wurde, Laborexperimente werden zur Klärun der Autökologi dieser enigmatischen Art beitragen. Die Eisengehalte im Meßgebie waren sehr fleckenhaft und deuteten auf einen Eintrag durch Niederschläg hin.
Das Untersuchungsgebiet fü die zweite Zielsetzung (B) dieser Fahrt wurde aus gegebenem Anlaà von der Lazarew See (20' E) in das Schelfgebiet vor Neumayer (8' W) verlegt.
Die Biologie des Antarktischen Krills zur Zeit der sich ausbreitenden Meereisdecke ist kaum bekannt. Integrierte Untersuchungen werden im Rahmen von SO- GLOBEC im internationalen Verbund durchgeführt um die Mechanismen und Prozesse zu untersuchen, die dem Krillerlauben, seine grossen Beständ übe das Jahr aufrechtzuerhalten. Folgende Uberwinterungsstrategien des Krill werden diskutiert: Fraà von Eisalgen undloder Zooplanktern vor allem Copepoden, Hungern unter Reduktion des Grundumsatzes oder Verzehrung der eigenen Körpersubstan sowie Lipidreserven. Studien, die alle Aspekte gleichzeitig berücksichtigen fehlen bisher. Diese Fragestellung wird auf zwei Forschungsfahrten mit FS Polarstern bearbeitet, wobei die jetzige Expedition die Situation im östliche Weddellmeer verfolgt. Die zweite Fahrt wird Mai 2001 zusammen mit anderen Forschungseisbrechern durchgeführt beide Fahrten sind Bestandteil eines BMBF-Verbundprojekts.
Auf dem Weg ins Untersuchungsgebiet wurde im eisfreien Ozean bei Maud Rise kein Krill angetroffen, stattdessen dominierten Salpen (gelatinös Zooplankter) die planktonarme Wasserkörpe bevorzugen. Dagegen wurden Krillschwärm sehr unterschiedlicher Ausdehnung und Individueendichte im Gebiet des sich ausdehnenden Meereises am Kontinentalhang vor Neumayer nachts in 50 bis 150 m Wasssertiefe angetroffen und beprobt. Die Profile des schiffsgebundenen Acoustic- Doppler -Current-Profilers (ADCP) lassen vermuten, da sich diese Krillschwärm am Tage in übe 500 m Wassertiefe zurückziehen Unmittelbar unter den flachen Eisschollen wurde kein Krill gefunden.
Die physiologischen Leistungen der mit Vertikalhols schonend gefangenen Individuen (Adulte und Furcilien) werden zur Zeit in Experimenten bestimmt (Freßverhalten Respiration, Exkretion), das Nahrungsspektrum der Tiere im Herbst ermittelt (Mikroskopie, delta15N und delta13C Isotope, Lipidklassen und Fettsäurezusamme,nsetzung freie Aminosäuren Darmfluoreszenz, Karotinoide und Chlorophylle) und Uberwinterungsmechanismen (Wachstum, Hungerfähigkeit CIN-Gehalt, Trockengewicht, Gesamtlipide, Verdauungsenzyme, Chitinasen sowie Proteine) untersucht. Die Freßversuch von Krill an Bord ergaben, dass die Nahrungsaufnahme der Tiere deutlich gegenübe der im Sommer gemessenen Raten reduziert ist. Auch die Respiration und Exkretion dieser Tiere ist fast eine Größenordnu geringer als im Sommer, selbst wenn den Tieren ausreichend

frisches Futter unterschiedlicher Qualitä angeboten wird. Sollten sich diese Ergebnisse durch die weiteren Analysen bestätigen bedeutet dies, da Krill bereits im Herbst seine physiologischen Aktivitäte reduziert. Ob bei einer Verbesserung der Nahrungsressourcen nach Heranwachsen der Algen in der Untereisschicht der Metabolismus der Tiere entsprechend angepasst wird, bleibt noch zu klären
Nach Rückkeh zur Polarfront konnte aus Zeitmangel das Grid nur sehr grob wiederholt werden. Alle Verankerungen wurden anschließen geborgen und wir sind jetzt dabein den Stationstransekt bei 20° zu wiederholen. Die Ergebnisse zeigen deutliche Veränderunge gegenübe der ersten Vermessung. Es bleibt noch zu klären ob unsere Befunde regionalen Charakter haben, oder fü den gesamten Lauf des ACC gülti sind. Die vom Satelliten SeaWifs erzeugten Chlorophyllverteilungen sind fü den ACC wegen der dichten Bewölkun sowie der relativ geringen Oberflächenkonzentratione antarktischer Blüte schwer zu interpretieren. Unsere Daten erlauben nun eine Kalibrierung der fleckenhaften Information von SeaWifs, um Nettoflüss der biogenen Elemente Kohlenstoff und Silizium zu rekonstruieren und modellieren.
Diese Fahrt wurde auf den Intemetseiten der Süddeutsche Zeitung mit aktuellen Beiträge und Bildern begleitet.
Polarstern lief planmä§ am 10.5, in Kapstadt ein.

Cruise leg ANT XVIl3 Cape Town - Cape Town Report of the RV Polarstern cruise leg ANT XVIl3: Frontal dynamics and Biology ll
Introduction U. Bathmann and V. Smetacek
RV Polarstern left Cape Town as planned on the evening of 18"' March with 48 scientific personnel and 43 Crew members on board. After deploying an oceanographic mooring carrying hydroacoustic instruments for estimating currents which is part of a joint project of the Institut fü Meereskunde, Kiel with the University of Cape Town, Polarstern steamed south to the first of the study sites. The cruise had two scientific aims both of which were part of IGBP core projects:
A Elucidating the relationship between mesoscale hydrography and biology and biogeochemistry of the Polar Front (Southern Ocean Joint Global Ocean Flux Study, SO JGOFS) B Nutrition strategies of Antarctic Krill (Euphausia superba) in autumn (Southem Ocean Global Ocean Ecosystem Dynamics, SO GLOBEC)
The JGOFS related work was carried out by an interdisciplinary team from the physical, geological and biological divisions of the AWI together with scientists from the Netherlands (12 scientists) and the UK (3 scientists). Most non-German scientists participated in the framework of the Netherlands Bremen cooperation Programme (NEBROC) as well as 2 EU projects MERL1M and CARUSO. This cruise is the third of a series studying the role of the Southem Ocean as source or sink of atmospheric C02, The first cruise (ANT X16) showed the overarching effect of iron availability in relation to mesoscale physics on the build-up of diatom blooms along the Polar Front and the resultant draw-down of CO, from the surface layer. The relationship between physics, trace metal availability and phytoplankton was studied in more detail during ANT Xllll2 by mapping a 3-dimensional grid with a towed, undulating instrument package. The data indicated that the accumulation of thick-shelled diatoms in the study region during the cruise was a result of heavy grazing pressure on the remaining phytoplankton. The shells of the heavily silicified species sink out of the surface layer and accumulate in the sediments which is probably the reason why the region underlying the southern Antarctic Circumpolar Current (ACC) is the major silica burial site in the ocean. The Polar Front is a prominent feature of the ACC and divides it into 2 branches most easily distinguished by their silicate content: Silica is never depleted south of the Polar Front and phytoplankton blooms were upto now observed only north of it. The previous cruises were carried out in spring and summer respectively; ANT XVIl3 addressed the autumn situation.
The 20° meridian was selected as the study site primarily because bottom topography was smoother than further to the West. The location of the fronts and their hydrographical features were recorded by towing an undulating instrument package (SeaScan, See Chapter 4) along a transect between 46' S and 52OS following which the study site was fixed. Three moorings with current meters and sediment traps were deployed along the 20° transect and two moorings without traps equidistant from the others along 49'20 S, the approximate position of the Polar Frontal Jet. A grid of 140 X 140 km and with 15 km transect space in the centre of the diamond configuration of the traps was mapped with SeaScan. The 3-dimensional continuous mapping was accompanied by measurements of various chemical and biological properties of the surface water. The results indicated that the grid was located on a southward protruding meander of the Polar Front. Warmer water with lower silica and phytoplankton concentrations was subducting colder denser southern ACC water. A band of fairly high phytoplankton biomass was located at about 80m depth.

The situation encountered contrasted with eariier cruises where higher phytoplankton biomass was found north of the frontal jet and subducted silica-rich but phytoplankton-poor water to the south. Following mapping of the grid, a transect with 7 stations was carried out through its centre for sampling the water column. These results indicated that phytoplankton biomass was dominated by the thick-shelled pennate species Fragilariopsis kerguelensis that contributes the bulk of the silica ooze underlying the southern ACC. Detailed examination of the population across the front showed distinct differences in cell size and chain length that probably represented different life cycle stages. The subducted population at depth seemed to be in good condition. Laboratory experiments were carried out to assess the autecology of this enigmatic species. The iron concentrations in surface water of the grid were very patchy and interpreted as representing recent rainfall events.
Due to an emergency that arose at the station, the study site for the second research aim of the cruise was shifted from the continental shelf at 20' E to the shelf adjacent to the Neumayer station (8' W).
The biology of Krill in autumn, when the sea-ice cover starts expanding, is poorly known. Integrated studies have been initiated by SO GLOBEC in order to ascertain the mechanisms and processes that enable krill to maintain its population of long-lived individuals over the whole year. The following ovefwintering strategies are being debated: Krill either feed On ice algae andlor copepods, or starve and use body reserves including lipid. They are known to shrink On starvation and have survived many months in the laboratoty without food. During ANT XVIl3 research necessary to find out the life history stratedy of this pivotal organism was carried out along the eastem Weddell shelf. A subsequent cruise will study the situation along the westem Antarctic Peninsula in 2001 together with ice- breaking vessels of other nations.
No krill was encountered in the ice-free waters around the Maud Rise on the way to the study area. Instead, salps dominated the plankton-impoverished water masses. Krill swarms of varying size and density were encountered and sampled during the nights between 50 and 150 m depth along the shelf break at the edge of the expanding ice cover. The profiles of the ship's ADCP suggest that the krill swarms retreated during the day to depths exceeding 500 m. No krill was found immediately under the sea-ice cover.
The physiological properties of individuals (adults and furcilia) gently caught by vertical nets is being studied in experiments (feeding behaviour, respiration, excretion), the food spectrum of the autumn-caught individuals estimated (microscopy, delta 13C and delta 15N isotopes, lipid classes and fatty acid composition, free amino acids, gut fluorescence, carotinoids and chlorophylls) and overwintering mechanisms (growth and shrinking rates, starvation ability, CIN ratio, dry weight, total lipids, digestive enzymes, chitinases and proteases) studied. The feeding experiments carried out on board showed that the ingestion rates were greatly reduced compared to summer rates. Respiration and excretion rates were also lower by an order of rnagnitude than in summer, even when the animals were offered sufficient amounts of food of vatying composition. Should these results be confirmed by subsequent analyses, they will indicate that krill reduces its metabolism by autumn independent of food availability. It is unclear how long such a seasonal adjustment takes place and whether the ki l l start feeding at normal rates when the ice algae start proliferating, remains to be ascertained.

After returning to the Polar Front, time constraints forced repetition of grid mapping at a coarser scale. All the moorings were successfully recovered after that and the transect along 20° was repeated at the end. The results showed distinct changes in comparison to the earlier study. It remains to be Seen whether our results are of regional relevance or applicable to the entire ACC. Because of cloud coverage over the ACC, remotely sensed information (by SeaWifs) on chlorophyll distribution is patchy and incomplete and phytoplankton blooms diffiult to assess because of their low concentrations (compensated by the depth to which they extend). Our data now enable calibration of the patchy information from SeaWifs in order to reconstruct and model net fluxes of carbon and silica.
The cruise was accompanied by regaular reports and photographs in the web site of the Süddeutsch Zeitung.
RV Polarstern reached Cape Town as planned on the 10th May 1999
2. WEATHER K. Flechsenhar (DWD)
Cruise, Courses, weather and ice
RV Polarstem left the port of Cape Town on Thursday, March 18th at 20.00 hrs and steamed under fair weather conditions southward. The 40th latitude south, was crossed on the 20th and the ship came under the influence of several low pressure systems, which move generally eastward between 50' and 65' S, giving this part of the ocean the historical names "Roaring Forties" and "Howling Fifties". So westerly winds between 6 and 8 Bft occured on 20th and 21st, with the seas about 3 m. Neveriheless moorings belonging to the Kiel Institut Kir Meereskunde, could be Set out regularly.
The wind decreased on the 22nd, but on the 23rd, the first snowfall was observed at 48OS, Wind SW 8 to 9 Bft , sea 3.5 m , temperature about 2OC. The ship dwelt until April 6th in the area around 50° 20°E operating intensive station work, tracking profiles with the ScanFish and putting 5 moorings in a Square of about 30 Nm side length. The weather was partly fair, partly stormy with Bft 8 to 9, gusts up to Bft 11 from NW to SW. As the ScanFish could be operated under bad weather conditions - only bringing the ScanFish in and out needs a rather calm ship - and other station work had been done under good weather conditions, almost no time had been lost and the program continued as planned.
On April 6th RV Polarstem headed to Neumayer Station on a SW course. The next moming the course was changed to S, as the ship's meteorological station warned of an approaching storm and advised this deviation. Upon doing this, the ship found itself on April 9th in the rather calm Center of a depression at 60° 18.5OE, where intensive station work could be carried out. Until April 12th we proceeded now W to SW. This located the ship south of the depressions moving east between the latitudes 60' and 65O S, and the dominating strong easterly wind could be used in our favour and the ship made good speed.
The first iceberg was sighted on April 6th at 50.4OS, temperature of air and water 3OC. In the evening of April 12th the edge of the sea-ice was reached at 6g0S, 6OW, temperature of air -1 2OC, of water -1.7OC. The weather was calm and clear when Polarstem broke through the new ice, which became thicker and thicker. In the morning of April 13th we went alongside of the shelf ice edge, about 18 km north of the Neumayer Station.
Here the weather was cold and clear at first, and the planned joumeys to Neumayer and back could be done without a nsk. As on this cruise Polarstem had no helicopter On board, the trips had to be done over land (ice) by Pistenbully. So about 4 hours had to be calculated for one trip there and back. At the day's end a light Snow drift Set in, which increased until the late evening to a heavy Snow storm, so that "Polarstern" had to Cast off the shelf ice edge. The easterly storm increased to Bft 8 to 9 on 14th and reached Bft 1 lduring the 15th, before it decreased in the evening. During this storm situation the ship lay calm and was protected in the ice. An intended walk and sampling on the sea ice had to be given up, because of the bad weather.
Until the evening of April 20th the ship maneuvered under good weather conditions - except some Snow fall on the 16th - in the sea ice, operated stations, taking samples and doing measurements on the ice. On April 21st the ship was back in Open water at 68's 1.5OW. The sea was calm and we headed now to the position 54OS 20°E which was reached on April 25th. During this long northeasterly transect, Polarstem was placed between a ridge of high pressure n

the West and a depression in the east, which moved synchronous with the ship eastward and created a streng but favourable southwest wind.
During the night of the 24th and early moming of the 25th, northwest wind Bft 8 was reported, but decreased during the day, so that the intended station work could b e done. After that the ship steered north on the meridian 20Â E towing the ScanFish. The last iceberg was sighted on the 26th near 52O S . In the moming of April 27th we arrived at 49.8O S 19.8O E under the influence of a high-pressure system, and the first of the five moorings could be recovered, afier a fog patch had moved away. However the plan, to pick up a second mooring in the aftemoon, had to b e cancelled because of poor visibility and the end of daylight.
As the visibility did not improve and the sea became rough, profile tracks with the ScanFish were camed out until the moming of April 29th, before the second mooring was taken on board in the aftemoon. This was soon followed by the recovery of moorings three and four on April 30th, these operations beeing carried out under rough, but sufficient weather conditions.
Finally mooring five was recovered in the morning of May Ist under the influence of a calm high pressure System. After the end of a further station the ship steamed southward to 52's 20°E where on May 2nd, more intensive station wo& was done. Here again a northerly to northwesterly storm, which occurred during the night from May 1 st to May 2nd, had a favourable effect. The station work itself however could be done under better weather conditions during the day. From now, the ship sailed northward exactly on the meridian 20' east, operating station works about every 30 Nm. Doing this, Polarstem came into the cold side of a storm Center, which developed in this area and caused windforce Bft 10 with severe Snow squalls from SW during the noon of May 3rd. Therefore one station, planned at 50.5OS, had to be skipped.
On May 4th and 5th the sea was rough and frequent Snow showers occured, nevertheless the operations continued as planned. On May 6th the sea calmed down and the temperature reached up to 9' C. Finally the last station work was done in the evening of May 7th under calm weather conditions, caused by a large and stable high, which accompanied Polarstem on her way to Cape Town , which was reached in the morning of May 10th.

Fig. 2.1 : Distribution of wind directions in area between 480S/20° and 520S/20° for period 23.03.-07.04.99
Meieorological Office Polarstern Distribution of wind directions
Wind directions 23.03.-07.04.1999
Fig. 2.2: Distribution of wind forces1Bft. in area between 480S/20° and 520S/20° for period 23.03.- 07.04.99
Meteorological Office Polarstern Distribution of wind forces/Beaufort
I1 Wind forces/Bft. 23.03.-07.04.1999

Fig. 2.3: Distribution of wind directions in area 48°S/200 and 52°S/200 for period 26.04,-05.05.99
Meteorological Ofiice Polarstern Distribution oi wind direciions
Fig. 2.4: Distribution of wind forcesIBfi. in area 48°S/200 and 52°S/200 for period 26.04.-05.05.99
Meteorolog~cal Oiilce Polarstern Disribut on of hina forces'Beaufoti

3. PHYSICAL CONTROL OF PRIMARY PRODUCTION AND OF BIOGEOCHEMICAL FLUXES AT THE ANTARCTIC POLAR FRONT
V. Strass (AWI), H.Leach (LW)
Physical processes relevant to manne primaty production play a central role in the climate system as a feedback mechanism between possible climate changes, which may result from alterations of the CO2 concentration in the atmosphere, and the drawdown of carbon to the deep ocean and sediment by way of the biological pump. Within the global ocean, the Southern Ocean has an exceptionally high potential of influencing global climate by viriue of the biological pump, due to the excess of macro nutrients which are recently not consumed by primaty production. Whereas most parts of the Open Southern Ocean are rather low in phytoplankton biomass despite the high concentration of major nutrients, typifying the Southern Ocean as a HNLC (High Nutrient Low Chlorophyll) region, enhanced phytoplankton abundances are frequently reported from the circumpolar fronts. Which physical processes, however, make the fronts distinct in tems of primaty production is not yet fully understood.
The physics of fronts can influence primaty production by horizontal advection, or by the frontal dynamics which force vertical motion and the associated vanation of stratification during frontal fotmation and decay. Veriical motion can resupply the photic Zone with nutrients (macro and micro nutrients, e.g. iron) in the one place and cany phytoplankton down to aphotic depths and force sedimentation in the other place. The cross-front circulation associated with the vertical motions is able to modify the depth of the mixed layer within which the densest blooms favourably occur. The relevant horizontal scales, however, may be quite small (few tens of kilometres) and the time scales rather short (some days), posing considerable demands On the measuring system being used.
A previous survey, ANT-Xllll2, performed using an appropriate measuring technique in austral Summer 199511 996, revealed a close correlation of primaty production, phytoplankton biomass and zooplankton abundance with frontal features such as meanders and eddies at the Antarctic Polar Front. Mesoscale cross-front circulation related to baroclinic instability was identified as a process of potential influence On mixed layer depth and thus On availability of light for photosynthesis within the mixed layer. However, the effect of cross-front circulation On shallowing of the mixed layer depth was masked by the seasonal stratification n high austral Summer. Moreover, no substantial vertical export of biogenic material to greater depth was observed during ANT-Xllll2. An immediate outcome of ANT-XI1112 hence was the need to assess the influence of mesoscale dynamics On primaty production and sedimentation at other times of the year, particularly dunng the cooling season of austral autumn.
The primaty physical measurements during this autumn cruise, ANT-XVll3, were made by use of an insttument package combining a towed undulating vehicle (Scanfish) and a vessel-mounted acoustic Doppler current profiler (VM-ADCP) which allowed the mesoscale density and velocity structures of a front being mapped simultaneously with other physical and biological variables down to 250 m depth at high horizontal resolution in quasi-synoptic manner. To complement the quasi-synoptic maps, temporal variations of the cun-ent field in the suwey area were recorded with an array of five moorings (Fig.3.0) equipped with acoustic and rotor current meters; three of the moorings also camed sediment traps. The hydrographic sttucture at greater depth was meassured with a CTD (Conductivity Temperature Depth) sonde lowered at a number of stations; the bottle sampler connected to the CTD allowed the collection of water from depth for analysis of dissolved constituents and suspended matter.

The different measurements are described in more detail in separate sections below. The Scanfish measurements are presented in section 3.1. Section 3.2 deals with CTD station wok and water bottle sampling. The measurements of currents made undeiway by use of the VM-ADCP are presented in section 3.3, while section 3.4 contains a description of the moorings. Finally, section 3.5 deals with the measurements of acoustic backscatier by the vessel-mounted and moored ADCPs, respectively, as proxies of zooplankton abundance.

FS POLARSTERN ANTXVU3
Fig.3.0: Cruise track from March 22 to April 2, 1999, during deployment of the five moorings, VPFl - VPF5, and the subsequent ScanfishIVM-ADCP frontal survey.
3.1 Underway Measuremets of Hydrographic and Biological Variables with the Towed Undulating Vehicle 'Scanfish' V. Strass, H. Leach, S. Gonzales, P, Roth, C. Dieterich, A. Macrander and M Velthuis
The Scanfish (GM1 Scanfish MK 11) is a streamlined, wing-shaped body towed behind the steaming ship. By electrically tumable flaps at its rear end the Scanfish can be made to undulate vertically throught the upper water column according to the Parameter setiings entered at the control unif On deck. The depth range was enhanced by use of an active winch (Type Cormac 1500 assembled b y Svendborg Skibshydraulik WS) holding 2500 metres of 8.3 mm thiik unfaired COAX towing cable, cable which was paid out during dive of the Scanfish and retrieved during climb. A depth range from 5 to 250 m was achieved at optimal towing speeds, between 5.5 and 7.5 knots. Those towing speeds, combined with a divelclimb rate of 0.4 mls of the fish, resulted in a nominal horizontal resolution (half wavelength) of 2.6 to 3.6 km along-track. Scanfish attitude while being towed, as well as the scientific data, were monitored and recorded in real-time On deck.
The scientific payload of the Scanfish consisted of a CTD (Sea-Bird Electronics SBE 911plus) and a fluorometer (Chelsea Instruments). From the CTD measurements the hydrographic variables of state, pressure (depth), temperature, salinity and density were determined, while the fluorometer readings were used to derive chlorophyll concentration as an indicator of phytoplankton biomass. The CTD temperature measurements are assumed accurate to 0.001 'C according to the manufacturers specifications. Salinity was calibrated by relating the data from the upper Scanfish tuming points to concurrent readings from the hull-mounted thermosalinograph (POLDAT-TSK), which themselves were calibrated against salinity samples analysed using a salinometer (Guildline Autosal 8400A) n reference to I.A.P.S.O. Standard Seawater. The accuracy of the calibrated Scanfish salinities was estimated by the rms (root mean sqared) deviation as 0,005 (salinity units according to the Practical Salinity Scale PSS-78). The Scanfish fluorometer readings (Fl) were converted into concentrations of chlorophyll a (Chl) using a model in which the yield (Y = FllChl) changes with ambient light. This enables to remove the quenching effect. The light dependency with depth was determined from undetwater light profiles measured by Bernd Kroon. Horizontal changes of yield were taken into account by comparison with Chl determined by an accurately calibrated Tumer Designs flow-through fluorometer linked to the ship's sea water SUPP~Y
Measurements with the Scanfish were made during two meridional sections along 20' E (Runs 01 and 11) and during two mesoscale surveys (Runs 04 and 12), as indicated in Table 3.1. The mesoscale surveys encompass an area of 126 km * 122 km in the latitudinal and longitudinal directions, respectively, with the longitudinal direction resolved by I 0 parallel meridional legs during the first survey and by 5 legs during the second survey. Altogether, Scanfish was towed with success for a total distance of 2786 km.

Tab. 3.1: Scanfish Runs
Fig.3.1a,b:Vertical distributions of potential temperature (a) and chlorophyll (b) concentration between 48' 46' S and 49' 54' S along 20' E, the central section of the first Scanfish front survey, Run04. The temperature section reveals a temperature minimum layer (Tmin layer, characteristic of a water mass termed Winter Water) that is centered at the depth range 180 to 200 m. The northem terminus of the Tmin layer, coinciding with the descent of the 2 'C isotherm, per definition marks the Antarctic Polar Front (APF). The sharp thermocline on top of the Tmin layer identifies the seasonal pycnocline. The seasonal pycnocline, obviously, is not identical with the depth of the mixed layer. The mixed layer is much shallower, shallower than 50 m, resulting from a surface layer of slightly warmer water and apparently of more northerly origin. The chlorophyll section shows a deep Chl maximum centered between 60 and 70 m which extends from the southern end to roughly the position of the APF. The highest concentrations within the deep Chl maximum m u r above the lowest temperatures within the Tmin layer. Apparently, the deep Chl maximum is formed by subduction, caused b y overlayering of warm, and yet chlorophyll-poor, water at the surface which crossed the APF from the north.
S t a r t
Run
01
0 4
1 1
1 2
Fig. 3.1c,d: Horizontal distributions of temperature at 180 m, roughly the depth of the Tmin layer (top panel) and chlorophyll concentration at 70 m, roughly the depth of the deep Chl maximum, during the first mesoscale Scanfish survey, Run 04. The 2 OC isotherm shown in the temperature map approximately marks the Course of the Antarctic Polar Front (compare with the horizontal current field shown in Fig. 3.3.2); a slight meander of the APF, a southward displacement around the central longitude, is evident. As revealed by comparison with the Chl map, the APF is associated with a horizontal gradiert of the chlorophyll concentration; the highest chlorophyll concentrations, exceeding 0.6 mg m-3, are found at the southwestern and southeastem comers of the survey area, correlated with the lowest temperatures.
End
Date Time Lat. S Lon. E
22-03-99 06:42 46°00.61 20°00.79
29-03-99 08:lO 49O52.20' 20°47.04
26-04-99 00:39 53°06.00 19'59.94'
27-04-99 14:58 49'22.00' 20°34.00
Date Time Lat. OS Lon. 'E
24-03-99 21 :11 51'59.58' 19°59.30
02-04-99 08:38 49'54.46' 19'02.83'
27-04-99 06:03 49'52.70' 1 g"48.56'
29-04-99 05:22 49O39.40' 19'25.68'

run04 Pot. Temp. Leg 5 (20E)
deg. C
N Y km s
,7 run04 Chl Leg 5 (20E)

3.2 CTD Stations and Water Bottle Sampling V. Strass, A. Macrander, C. Dieterich, P. Roth, S. Gonzales and H. Leach
The CTD used for conventional deployments at hydrographic stations was also type Sea-Bird Electronics SBE 911p1us. The CTD was supplemented by a transmissometer (Wet Labs, 660 nm wavelength) and a chlorophyll-sensitive fluorometer (Dr. Haardt BackScat). The CTD and peripheral instruments were attached to a multi-bottle water sampler type Sea-Bird SBE 32 Carousel holding 24 12-liter bottles. The performance of the CTD was controlled by use of S lS reversing thermometers and pressure gauges attached to 8 of the water bottles. Salinity derived from the CTD measurements was calibrated to a final accuracy of better than 0.003 by comparison to salinity samples, taken from the water bottles, which were analysed by use of the Guildline-Autosal-8400A salinometer.
The main purpose of the CTD station deployments (Fig.3.2.1) was to reveal the hydrographic structures also at depths (Fig. 3.2) below the Scanfish range. Many of the overall 78 CTD casts (see Table 3.2), however, were performed to supply the water sample volume needed by other groups for chemical and biological research.

Scale- 1 :5500000 81 LatItude 0'
Soum: GEBCO. (a)
Source: GEBCO
Scale: 1:9600000 at Laiihrde 90'
SourCe. GEBCO.
Fig.3.2.1: Maps of CTD station positions; stations performed before April 7 (a), stations done between April 7 and 26 (b), and stations performed after April 26, 1999 (C). The position of the northernmost station of the cruise, Station 207 (Tab. 3.2) is not shown.

Fig. 3.2.2: Vertical distributions of potential temperature (a) and salinity (b) along 20Â E, based on CTD stations; CTD station numbers are indicated on top. (continuation On next page)

Fig. 3.2.2, continued
Fig. 3.2.2: Vertical distributions of potential temperature (a), salinity (b), uncalibrated fluorescence (C) and light transmission (d) along 20 OE, based on CTD stations; CTD station numbers are indicated on top. The temperature section (a) reveals the northern terminus of the temperature minimum layer. the position of the APF, between stations 164 and 165, i.e. between 49' 06' and 49O 20' S (Tab. 3.2). The northward subduction of the low-salinity surface water between stations 151 and 162 (b) is characteristic of the Subantarctic Front (SAF); the salinity increase southward of station 168 is related to a front termed Southerly Polar Front. The fluorescence section (C) shows a deep maximum, between 50 and 100 m depth, at stations 165, 166 and 167 (49' 20' - 49O 50 ' S), coinciding with the deep chlorophyll maximum revealed by the Scanfish survey done before; this deep maximum appears separated from the even higher values further south which are approximately uniform in the layer above 100 m. The section of light transmission (d) shows a less distinct deep transmission minimum, but a more continuous decrease to the south. The light transmission section also reveals a band of decreased values (increased turbidity) which extends to 1000 m or even deeper around the centre latitude of the section, below the subducted deep Chl (fluorescence) maximum between 50 and 100 m depth. Fluorescence itself is not significantly increased where transmission is lowered at depths greater 150 m, suggesting that chlorophyll pigments are already degraded in the material causing the lowering of light transmission at depth. A high sedimentation rate of biogenic material is also indicated by the sediment trap (see contribution by U. Bathmann) attached to mooring VPF2 (position of CTD station 167, where low transmission extends deepest).


Fig. 3.2.3: Veriical profiles of potential temperature (left column), fluorescence (middle column) and light transmission (right column) at CTD stations 197/01 (top row), 198101 (middle row) and 199101 (bottom row); station positions as indicated in Fig. 3.2.1. The profiles are drawn at full vertical resolution. The small-scale noise and the spikes, sharp maxima or minima in the profiles of fluorescence and transmission, respectively, reflect the pariiculate nature of the fluorescent or attenuating substance. The most numerous and most pronounced spikes are found at station 198101, That station, located in the Southerly Polar Front, exhibits a distinct two-layer structure above the core depth (200 m) of the Tmin water: a relatively shallow (50 m) and moderately wann mixed layer with maximum fluorescence and minimum transmission values; below, between 80 and 180 m, an intermediate layer with temperature, fluorescence and transmission values very similar to surface values at station 197101 to the south, suggesting that the intermediate layer was formed by subduction of surface water of more southerly origin.

ANT-XVIl3 Station 197101
p0t.T 1 deg C fluorescence I rel. units transrnission I %
ANT-XVIl3 Station 198101
p0t.T 1 deg C fluorescence 1 rel. units transrnission 1 %
ANT-XVIl3 Station 199101
500 " 0 2 4
fluorescence I rel. units transrnission I %

Tab. 3.2: List of CTD Stations


203105 204101 204104 - 205101 206101 207101 207105
05.05.1999 05.05.1 999 05.05.1 999 05.05.1 999 05.05.1999 06.05.1 999 0705.1 999
0:30 4:31
10:53 14:43 19:03 23:06 12:19
-- 48'32.15's 47'59.98's 48'00.80's 47'29.89's 47'00.26's 44OK99'S 44°0678'
2O002.93'E 2Oo00.09'E 2Oo02.33'E 1go55.77'E 2Oo00.04'E 1 g033.49'E-- 1 9°50.25'
48'32.28's 48'00.45'S
.48'-'00.79'S 47'30.28'S19'59.87'E 47'00.29's 44'02.42's 44°07.12'
2Oo03.43'E 20°00.66' 2Oo02.50'E -
20°00.67' -1 g035.76'E 4576 4626 19'51.62'E 4603 300
4293 4626
. 471 8 41 09 5056
300 1002
- 300 1001 1001
--...P--.-
MN, Bongo GoFlo, MN, Bongo, 20° section
-- , 20° section GoFlo, MN, ISP, 20° section

3.3 Underway Measurements of Currents with the Vessel-Mounted Acoustic Doppler Current Profiler V. Strass and J. Langreder
Vertical profiles of ocean currents down to roughly 300 m depth were continuously measured with a Vessel Mounted Acoustic Doppler Current Profiler (VM-ADCP; manufacture of RDI, 150 kHz nominal frequency), installed at the ship's hull behind an acoustically transparent plastic window for ice protection. The ADCP has four transducer heads, arranged in a Square formation, which point diagonally outwards at an angle of 30' relative to the vertical. The transducer heads simultaneously emit a sound pulse approximately every second, and record echoes retumed from particles in suspension in the water. The echoes are range-gated into a series of vertical bins and analysed for their Doppler frequency shift which is related to the water velocity. Determination of the velocity components in geographical coordinates, however, requires that the attitude of the ADCP transducer head, its tilt, heading and motion is also known. Attitude variables of the VM-ADCP were taken from the ship's navigation System.
The Instrument settings were chosen to give a vertical resolution of current measurements of 4 m in 80 depth bins, and a temporal resolution of 2 min after ensemble averaging. Calibration data for the ADCP velocity measurements were obtained during the cruise, but have yet not completely been evaluated; therefore, the VM-ADCP current measurements shown in Figs. 3.3.1 and 3.3.2 have to b e considered as preliminary. Processing of the VM-ADCP data was done using the CODAS software package (developed by E. Firing and colleagues, SOEST, Hawaii),

Fig. 3.3.1 : Horizontal currents in the depth range 152 - 186 m measured with the VM-ADCP along 20 OE between latitudes 45 OS and 52 OS. The band of strong eastward currents in the latitude range 46 OS to 47 OS is related to the Subantarctic Front, the band of enhanced eastward currents centered at 49 OS marks the Antarctic Polar Front, and the strong currents around 51.5 OS are associated with a front termed the Southerly Polar Front.
VM - ADCP POLARSTERN ANTXVIJ3 30 rnin mittel 1999103121 08:39:48 to 1999103123 22:31:48
- 0 50
Speed (cmls)
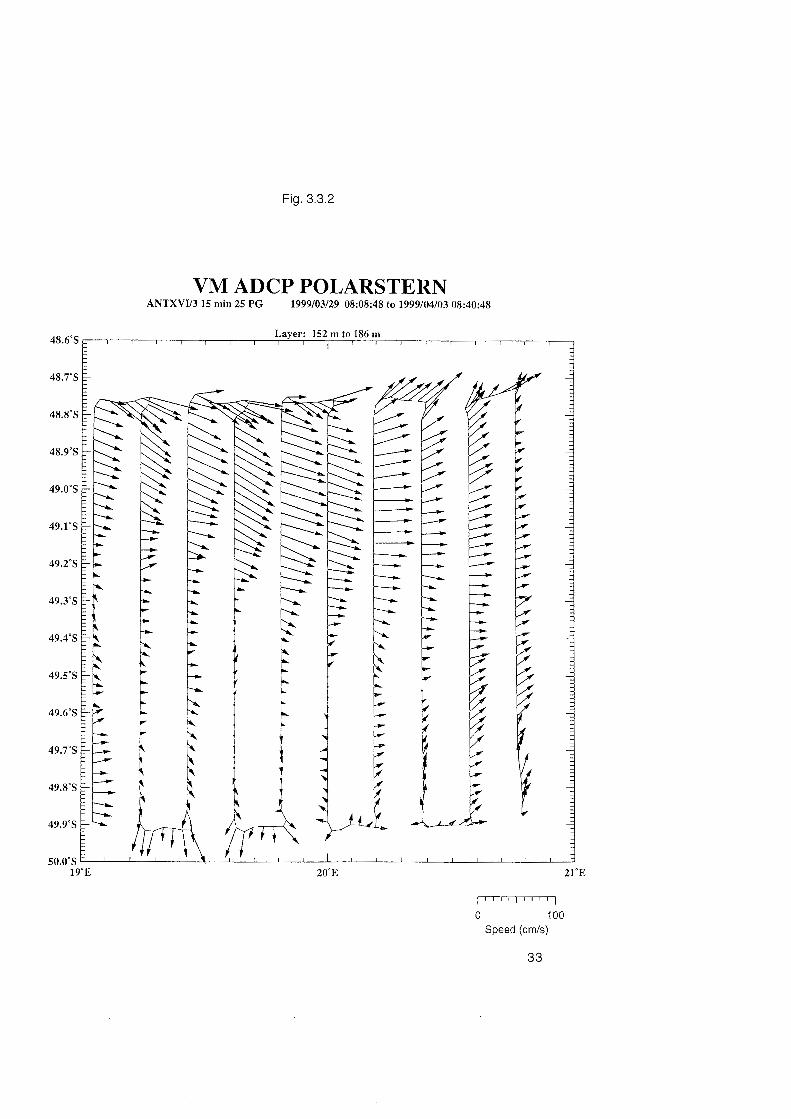
Fig. 3.3.2
VM ADCP POLARSTERN ANTXVV3 15 rnin 25 PR 1999103129 08:08:48 to 1999104103 08:40:48
4 8 . 6 3 Layer: 152 m to 186 m
1 1 1 1 1 1 1 1 1 I 1 1 1 1 1 1 , I
21-E
m 0 100
Speed (crnls)
33

3.4 Measurements with Moored Instruments V. Strass, M. Monsees, J. Langreder and U. Bathmann
Temporal variations of currents, hydrographic properties, and sedimentation in the frontal survey area were monitored by five moorings arranged in a diamond- shaped array (Fig.3.0). The moorings were deployed at the begin of the cruise and recovered at its end, for a duration of almost 5 weeks. To each of the five moorings were attached five Aanderaa rotor current meters, in part equipped with pressure, temperature and conductivity Sensors. While the rotor current meters were distributed over the deeper part between the sea floor and a few hundreds of meters depth, upward looking self-contained (SC-) ADCPs were placed at the top of each mooring; one of the SC-ADCPs (all manufactured by RDI) was type 150 kHz Narrow-Band, two were type 150 kHz Broad-Band, and two were type 75 kHz Workhorse Long-Ranger. All SC-ADCPs and all rotor current meters, except of a failure in heading measurements by one of the Aanderaa's and a rotor loss by another one, worked properly throughout the deployment period during which data were taken at intervals of half an hour or less. Three of the moorings, those distributed along the meridional line (Fig.3.0) also included sediment traps (manufactured by Howaldt Deutsche Werft), of which two worked properly and revealed a striking difference in sedimentation between the southem and northern side of the Polar Front. In addition, the most southern mooring held a CO2 recorder (from the Plymouth Marine Laboratory, R. Bellerby) on its top position. The Set-up of that latter mooring is shown in Fig.3.4 as an example.
Fig. 3.4: Schematic drawing of mooring VPF-2, layed for the duration March 26 to April 27, 1999, at a position just south of the Antarctic Polar Front. From top to bottom, the mooring carried one COa recorder (from the Plymouth Marine Laboratory, R. Bellerby), one RDI 150 kHz Broad-Band ADCP, one Aanderaa RCM8 rotor current meter, one sediment trap (HDW-SF), and four further RCM8 current meters. Connection between mooring line and anchor weight was through a pair of releases (one Mors and one EG&G; other moorings also included Benthos releases).

Fig. 3.4.
V o o r i n g I D V P F 2 P o s i t i o n 4 9 5 0 4 0 3 1 9 5 4 2 9 E
P r o j e c t A N T X V I / 3 D e p l o y e d 0 8 1 3 26 0 3 1 9 9 9
W a t e r d e p t h 3 9 5 0 m R e l e a s e d 0 7 2 0 , 2 7 0 4 1 9 9 9
A n k e r z u l e t z t 1
Â¥Oep~h-Ois Segments T i m - i n Time-out
I F l o a t
5 0 rn
2 F l o a t s
36 1-3589
40 rn
100 rn
500 rn
4 F l o a t s
1007-2943
500 rn
500 rn
4 F l o a t s
2013-1937
500 rn
500 rn
2 F l o a t s
3019- 931
2 2 0 0 r n
2 * 2 0 0 r n
5 0 rn
6 F l o a t s
rn K e i t e
5 0 m
2m K e t t e
-- - - L - - - RW8 VTC P1000 SN 9201
XT 6000 SN 58116

3.5 Measurements of Acoustic Backscatter by Vessel-Mounted and Moored ADCPs as Proxies of Zooplankton Abundance V. Strass and J. Langreder
All acoustic Doppler current profilers, the ship's VM-ADCP as well as the moored SC-ADCPs have, routinely, also taken measurements of the backscattered echo amplitude. The amplitude of the received echo depends On the amount of scatterers, and their target strength, contained within the ensonified volume of water. It also depends, due to spreading of the sound beams and the absorption of sound energy by seawater, on the slant range between the transducer and the water volume.
The most effective scatterers are expected to have sizes in the order of the acoustic wavelengths, i.e. 1 or 2 Cm, as implied by the ADCP frequencies of either 150 or 75 kHz, respectively. This is approximately the size of larger zooplankton. During the cruise advantage was taken of this relationship by using the backscatter signal of the VM-ADCP to decide on the deployment of nets for catching krill. Patterns of diurnal migration observed quite regularly in the VM-ADCP measurements (e.g. Fig.3.5) also indicate the influence of zooplankton on the backscatter signal.
Calibration of backscatter amplitude, yet to be done, has to take place in two distinct steps. First, calibration to give absolute Mean Volume Backscatter Strength (MVBS) in dB consists of correction for sound attenuation due to beam spreading and energy absorption, and of correction for differences of transfer efficiencies of the individual transducers and background noise levels. The background noise level effecting the VM-ADCP was determined at sea during the cruise. When the physical calibration has been performed an attempt shall be made to correlate MVBS with zooplankton abundance derived from net catches. That correlation, however, will be influenced by the presence of different zooplankton species with different compositions of soft tissue, hard shells and gaseous inclusions, for instance.
Fig.3.5: Vertical section of uncalibrated backscatter amplitude (agc) recorded with the VM-ADCP during one day (day 90 of year 1999, time of day referenced to UTC) while performing the front survey; the geographic position is indicated in the two lowest panels. The vertical dimension (Y-axis) of the top two panels is scaled by bin number; bin Zero is centered at 15 m depth, and the bin width is 4 m. While the top panel is based on raw profiles of agc, in the second top panel the agc decrease along the vertical due to sound attenuation is removed by presenting agc deviation from its daily mean within depth bins. The shown Pattern is composed of a mixture of regional and temporal changes; however, similarities with other days of surveying in and adjacent to the front region suggest that at least the overall decrease during daylight hours (local noon is around day 90.45) results from vertical migration of zooplankton. Several scattering layers, with different diumal vertical movements, can be distinguished.

Fig. 3.5.
agc
-80' - - - - -- - -- - I 90.1 90.2 90.3 90.4 90.5 90.6 90.7 90.8 90.9
agc deviation from mean
dec. days of 99

4. DISTRIBUTION OF NUTRIENTS C. Hartmann, G. Kattner, A. Ratje (AWI)
The distribution and dynamics of nutrients in the Southem Ocean were investigated especially in the Polar Front during the two Scanfish grids by underway sampling with high spatial resolution and during CTD transects. Furthermore on the way to the German Neumayer base and back to the Polar Front until about 43ON underway surface sampling was conducted. The investigation of the interactions between nutrients and phytoplanktion are one of the major topic as well as the relation of nutrients to the hydrography. The data will be compared with those from the ANT XI1112 expedition in 1996197 to get information about seasonal changes by comparing the autumnal situation now with that from summer of the former cruise.
Sampling and methods
Nutrients were determined from underway samples, CTD bottles and Goflo bottles. Underway samples were taken from about 8 m depth by means of the membrane pump installed on board Polarstern. The sampling intervals were 10 min during the Scanfish grids and 20 min on the way south to the Neumayer base and back north to the Polar Front. The determination of silicate, phosphate, nitrate, nitrite and ammonium essentially followed the routinely used methods for seawater analysis and was performed with a Technicon Autoanalyser II System.
Preliminary data and results
Nutrients are closely related to the frontal systems. Their concentrations are generally high and are not limiting phytoplankton growth. Only north of the Polar Front silicate is low probably limiting the growth of diatoms. In contrast, nitrate and phosphate concentrations were always high in this area. In the Polar Front region surface silicate values were sightly increasing whereas towards the south the concentrations drastically rose reaching values of up to 70 pM. Nitrate concentrations already increased at the Subtropical Convergence to more than 10 pM and further increased towards the Polar Front to about 20 pM reaching highest surface value of 29 pM in the south. Surface phosphate concentrations (data not shown in the Figures) ranged between 1.3 and 1.6 pM in the Scanfish grid area and were highest with 2.2 pM in the south around 68OS in accordance with enhanced silicate and nitrate values.
The nutrient concentrations during the first Scanfish survey clearly showed the Polar Front. Silicate increased from about 3 pM north of the Front to about 6 pM in the south. Whereas in the middle area of the grid concentrations showed only slightly increasing gradients, they increased up to 16 pM and 14 pM in the westem and eastern bounderies, respectively. This distribution revealed a meander-like structure in the survey area.

Nitrate
Latitude
Silicate
Latitude

Fig. 4.2a 2. Scanfish grid. silicate
Fig. 4.2b 2. Scanfish grid. nitrate
Silicate
19.2 19.4 19.6 19.8 20.0 20.2 20.4
Longitude
Nitrate
19.2 19.4 19.6 19.8 20.0 20.2 20.4
Longitude
4 0
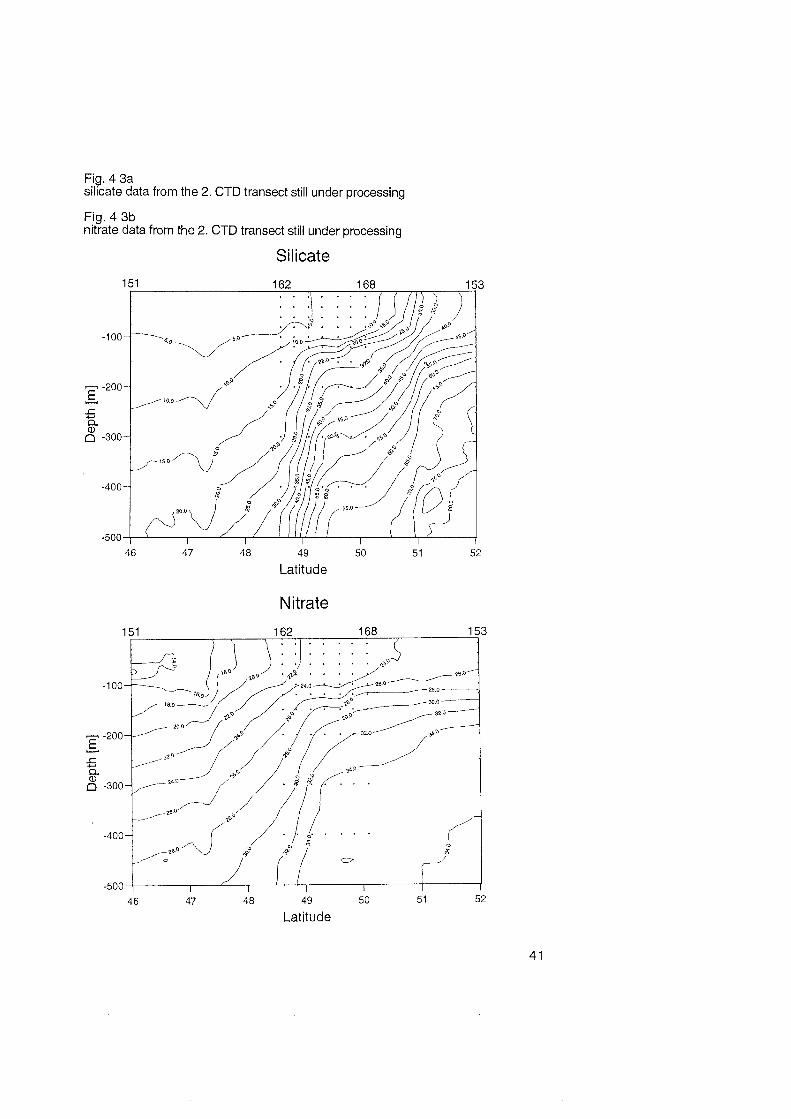
Fig. 4 3a silicate data from the 2. CTD transect still under processing
Fig. 4 3b nitrate data from the 2. CTD transect still under processing
Silicate
Latitude
Nitrate
46 47 48 49 50 51 52
Latitude

Nitrate concentrations north of the Polar Front were about 20 pM. In the Front they increased to 22.5 pM. In comparison to the silicate distribution nitrate only increased slightly to 24 pM in the eastern part of the grid. Due to the generally high concentrations nitrate reflected less clearly the meandering structure than silicate.
The surface silicate concentrations measured from north of the Scanfish grid towards the Neumayer base strongly increased south of the Polar Front reaching values of more than 60 pM, slightly decreasing further to the south. Until64OS values were around 50 pM with small variations. Further south silicate peaks with up to 70 FM, staying contantly higher with some variations and then dropped very sharply in the Antarctic coastal current to about 60 pM.
The surface nitrate concentrations slightly increased in the Polar Frontal region to values of about 23 pM in the southerly Polar Front and in paralell with silicate to values of about 27 pM further south which than dereased to values of again 23 pM around 60°S Highest values of up to 29 pM were found further south which also decreased again close to the Antarctic continent.
5. DETERMINATION OF THE STABLE C AND N ISOTOPES IN THE PARTICULATE ORGANIC MATTER A. Dauelsberg, K.-U. Richter (AWI)
Work On board
In total 67 positions were sampled for the measurement of the distribution of the stable C- and N Isotopes in the total POM-Pool. This sampling consisted in 5 to 9 l filtrations out of the seawater supply from the ships membranepump on GFIF and MK360 quarzfiberfilters and should allow a characterisation of the isotopic distribution pattern in the suspended particles at the surface during the cruise.
To investigate the distribution in the different sizefractions of the total POM pool at 20 CTD-stations 80 l seawater from the mixed layer were further processed to split up the sample into the following POM-sizefractions: >I00 um, 100-20 um, 20-8 um, 8-3 um, 3-1 um and 1-0.4 um. To get enough material for the isotopic measurements in each sizefraction, the particles out of these large volume samples were enriched by a cascade of sreen and membrane filters in special magnetic stirred filter housings.
This filtation procedure results in an enrichment of the marine particles in a volume of 1 L for the >I00 um and the 100-20 um sizefraction. For the membrane fitration steps the final volume was reduced to 200 ml . Out of these enriched subsamples 20 ml for microscopic investigation of the composition of the organic matter were sampled and fixed. The residual volume was filtered over quarzfiberfilters and stored for isotopic measurement by isotope-ratio-mass-spectrometry.
Additional to the sizefractionated isotopic POM-samples, subsamples for the measurement of DOC, DIC and nutrients were taken. To compare the samples enriched from a large volume with the original plankton composition a subsample of 250 ml volume was taken directly from the niskin bottle of each sampled CTD Cast.
The sampling for the investigation of the isotopic composition of the different sizefractions focused on the phytoplankton composition at the Polar Frontal Zone as well as the bloomconditions found at 52's and should allow a comparison with the Summer conditions during the previous JGOFS cruise ANT Xlll12,
To characterise the isotopic POM-composition in the second investigation area in the ice covered coastal current region a few CTD casts were sampled additionally.

6. FIELD DISTRIBUTION OF IRON IN A SECTION OF THE ANTARCTIC POLAR FRONTAL ZONE P.L. Croot, J.T.M. de Jong (NIOZ)
Introduction
It is now well established that iron can play a role as a (co)limiting nutrient for phytoplankton in High Nutrient Low Chlorophyll (HNLC) regions of the ocean (e.g. de Baar, 1994 and de Baar et al., 1995), such as the waters of the Southem Ocean. However many questions remain about the biogeochemistry of iron in these regions. In particular, little is known about the sources of iron to the Southem Ocean, and the chemical nature of these inputs. This present work seeks to examine the contributions of the possible iron sources to the study region. These sources include the following: precipitation (drylwet), advection of coastal water- masses from South America, iceberg melt-water, upwelling of iron rich deep water and hydrothermal sources.
The concentration of iron in deep waters is of particular interest, as little data is available for the Southern Ocean at present, and there is currently much debate (Johnson et al., 1997; Boyle, 1997; Luther and Wu, 1997) about the residence time and distribution of iron in the deep throughout the world's oceans. Typically in the old deep waters of the North Pacific, dissolved iron concentrations are approximately 0.6 nM, Johnson et al. (1 997) proposed that this deep water value was found throughout the global ocean. Their hypothesis was however based on few points from younger deep waters, and would require that there was no fractionation between the Pacific and the Atlantic for iron. This result is somewhat in opposition to what is Seen for other elements which show a biologically recycled profile and chemistry similar to iron (e.g. Zn, Th), as they are found at higher concentrations in the older Pacific deep waters than in the younger Atlantic deep waters. Thus in the present work we seek to investigate the deep water distribution of iron in Circumpolar Deep Water (CDW), Antarctic Bottom Water (ABW), North Atlantic Deep Water (NADW) and Antarctic Intermediate Water (AAIW). This work will also enable us to better model the cycling of iron in deep waters and place more realistic constraints on our estimates of iron supplied by upwelling waters.
To further assess the exact role of iron in phytoplankton bloom development, and the sources and sinks of iron in the Southem Ocean, it is important that accurate chemical analyses of iron are performed in combination with in situ measurements of several other sensitive physical, chemical and biological Parameters. This multidisciplinary approach to studying the Antarctic Paradox has already been previously carried out successfully during previous cruises, onboard the Polarstern. This work has included EPOS 1988189 in the Weddell and Scotia Seas, ANT XI6 in the Polar Frontal Zone at 6O W (1992), ANT XI114 (1 995) in the Antarctic sector of the South-East Pacific and ANT Xllll2 in the Polar Frontal Zone at 1 O0 E.
Methods
During cruise ANT XVIl3 the structure of a sector of the Polar Front Zone was studied. The work was characterized by high density sampling and profiling of a small area of the frontal System, mainly focused on the ScanFish transect grids.
Spatial distribution of iron:
A total of 16 vertical profiles were measured, (see table I ) , with 4 deep (> 1000 m) stations being occupied. The majority of these stations were situated in the PFR. A number of stations were also occupied between the primary research area and the German base "Georg von Neeumayer" to gather data on iron
concentrations in the Antarctic Circumpolar Current (ACC), the Weddell Sea and the Antarctic Coastal Current.
During the ScanFish transects, surface water was sampled. Most of the grid was sampled at one hour intervals, however during the 2"d major survey this was increased to half hour frequency. Samples were taken using a peristaltic pump connected to a polyurethane coated 'ironfish' (towed fish, torpedo style - 1m length and weighing 50kg in air), by acid cleaned polyethylene tubing. The 'ironfish' was towed alongside the ship at a distance of several meters from the hull at a maximum speed of 10 knots (ScanFish absent), when the ScanFish was towed simultaneously; speed was reduced to 6 knots. A water sample was delivered to and filtered inline (0.2 pm Sartorious filier) in the clean container every hour. The samples collected from the underway System were analyzed for dissolved iron onboard ship, analysis of the Same samples for AI and other metals will be performed back in the home laboratory.
While in the sea-ice, the opportunity was taken to obtain some 'clean' Snow and ice samples from the surrounding ice floes. The iron content of these samples will provide us with an indicator of the contribution of melting or freezing sea ice to the iron content of the coastal current and the seasonal ice Zone.
Specimens of salps were collected and frozen, where possible, to examine the iron content of these 'vacuum cleaners' of the sea. Salps can filter several tens of litres of seawater per day (Dubischar and Bathmann, 1997), making them an effective remover of particulate material in the Southem Ocean. High grazing pressure by salps, may have a strong influence on the ratio between particulate and dissolved phases of iron.
Measurement of iron
To prevent sample contamination, trace metal clean techniques were applied. Samples were taken at predetermined depths using trace metal clean, TeflonTM- coated General Oceanics GoFlo samplers with a volume of 10.8 I. These boitles were attached to a Kevlar hydrowire and tripped using Teflon messengers. On retrieval, the bottles were mounted on a specially designed bottle rack inside the anteroom of the NIOZ Class-100 clean air container. The GoFlo's were pressurized to 0.2 bar with clean dry N gas, and connected inline to a Sartorious filter cartridge (0.2 [im) to obtain clean filtered samples. Samples were first taken for macronutrients, then dissolved metals (including samples for speciation work), finally unfiltered samples were taken. All samples for total metal analysis were acidified to pH < 2 with ultraclean quartz distilled concentrated nitric acid. Total dissolvable (unfiltered) and total dissolved iron (0.2 pm) were measured on- board using a flow injection technique with in-line pre-concentration on a chelating resin followed by chemiluminescence detection (FIA-CL) ( de Jong et al., 1998; Obata et al., 1993; Landing et al., 1986). Iron from an acidified sample is buffered on line and preconcentrated onto a column of immobilizied 8-hydroxyquinoline. After a loading time of 4 minutes, the column is washed with deionised water and the iron is eluted with dilute hydrochloric acid. The iron mixes with luminol, hydrogen peroxide and ammonium hydroxide to produce chemiluminescence in the flow cell of a photomultiplier tube connected to a photon counter. The chemiluminescence occurs as a result of the iron catalyzed oxidation of luminol (3-aminophtalhydrazide) by hydrogen peroxide, producing blue light (424 nm). The accuracy of the method was checked and confirmed using NASS-4 reference sea water. Throughout the cruise, the blank and detection limit (3x standard deviation of blank) remained constant at 0.032 and 0.01 nM respectively. Reproducibility was typically 2% at the 0.3 nM concentration and better than 10% at the 0.06 nM level.

The other trace metals (Mn, AI, Cd, Ni, Cu, Se, Zn and Co) will be analyzed in the home laboratory using a variety of well established techniques (includes FIA-CL, and both anodic and cathodic stripping voltammetry).
Preliminary results and discussion
Surface dissolved iron concentrations in the Polar Frontal Zone were found to vary considerable during both surveys. However for the second survey, iron concentrations were significantly lower (0.04 - 0.6 nM, average 0.16 nM) than during the initial survey of the ScanFish box (0.12 - 3 nM, average 0.56 nM). For the first survey (see figure I ) , there was a trend towards higher iron levels in the southern Part of the grid , and also a possible correlation with rain events during the survey work. It is hoped to later make back trajectory calculations of the air masses involved, to perhaps determine if these clouds could have contained significant continental aerosol dust.
Vertical profiles of dissolved iron from the Polar Frontal Region typically showed surface enrichment with a minimum at approximately the chlorophyll maximum. Often these profiles also exhibited higher iron concentrations just on or below the pycnocline, which may be evidence for regeneration of dissolved iron by zooplankton grazing. Samples from the coastal current (Station 182) showed high levels of both dissolved and total iron in the deep surface mixed layer (figure 2), much of this iron may have been supplied from iceberg melt in the summer or from coastal runoff from under the continental ice shelf. These high iron levels may help explain why this region is so productive during the spring and summer.
Data from the deep stations showed fairly uniform profiles for dissolved iron, all exhibiting a nutrient (regeneration) profile (see figure 3). Deep concentrations were typically around 0.3 - 0.4 nM, significantly below the Johnson et al. (1997) 0.6 nM. Later analysis will concentrate On looking at the iron concentrations of the individual water masses to try and understand the distribution of iron in the deep ocean.
In conclusion, iron concentrations in the Southem Ocean were found to be very low throughout much of the area surveyed, but higher concentrations were again found in the Polar Front as has been shown before on previous cruises (ANT X16 and ANT Xllll2). However for this cruise the correlation between chlorophyll and iron was not so strong, as it has been for previous cruises carried out during the Summer, and this may reflect the lower light levels (light limitation) found during the autumnal period. Additional measurements and data analysis are needed however to clarify the observed distribution and behaviour of iron in the Southern Ocean water samples at this time.
References
de Baar, H. J. W. (1994). von Liebeg's Law of the Minimum and Plankton Ecology (1 899-1 991). Progress in Oceanography, 33, 347-386.
de Baar, H.J.W., J.T.M. de Jong, D.C.E. Bakker, B.M. Löscher C. Veth, U. Bathmann and V. Smetacek. (1 995). Importance of iron for plankton blooms and carbon dioxide drawdown in the Southern Ocean. Nature, 373, 412-41 5.
Boyle, E. (1997). What controls dissolved iron concentrations in the world ocean? - a comment. Marine Chemistry, 57, 163-1 67.
Dubischar, C.D. and U.V. Bathmann. (1997) Grazing impact of copepods and salps On phytoplankton in the Atlantic sector of the Southern Ocean. Deep-Sea Research I / , 44, 41 5-433.
de Jong, J.T.M., J. den Das, U. Bathmann, M.H.C. Stoll, G. Kattner, R.F. Nolting and H.J.W. de Baar. (1998) Dissolved iron at subnanomolar levels in the Southern Ocean as determined by ship-board analysis. Analytica Chimica Acta, 377, 113-124.
Johnson, K. S., R. M. Gordon and K.H. Coale. (1997). What controls dissolved iron concentrations in the world ocean? Marine Chemistty, 57, 137-1 61.
Landing, W.M., Haraldsson, C. and Paxeus, N. (1986). Vinyl polymer agglomerate based transition metal cation chelating ion-exchange resin containing the 8- hydroxyquinoline functional group. Analytical Chemistty, 58, 3031 -3035.
Luther III, G. W. and J. Wu (1997). What controls dissolved iron concentrations in the world ocean? - a comment. Marine Chemistty, 57, 173-179.
Obata, H., Karatani, H. and Nakayama, E. (1993). Automated determination of iron in seawater by chelating resin concentration and chemiluminescence detection. Ana1,ytical Chemistty, 65, 1524-1 528.

Table 6.1 : Stations occupied during ANTXVIl3, sample depths and samples taken.
Station # Sample Depths Samples Taken
161 20, 40, 60, 80, 100, 150, 200, 400, 600, 1000rn Filtered and Unfiltered 163 20, 40, 60, 80, 100, 150, 250, 500, 750, 1000rn Filtered only 165 20, 40, 60, 80, 100, 150, 250, 500, 750, 1000rn Filtered only 167 20, 40, 80, 100, 150, 250, 500, 750, 1000m Filtered only 169 20, 40, 60, 80, 100, 150, 300, 400, 700, 1000, Filtered and Unfiltered
2000, 2500, 3000, 3500, 4000, 4500m 174 50 rn Filtered and Unfiltered 182 20, 40, 60, 100, 150, 200, 300, 800, 1100rn Filtered and Unfiltered 185 25, 50, 100, 250, 500, 1000, 1500, 2500, 3500, Filtered and Unfiltered
4500rn 190 20, 40, 60, 80, 100, 130, 250, 400, 700, 1000m Filtered and Unfiltered 194 25, 50, 100, 150, 250, 500, 1000, 2000, 3000, Filtered and Unfiltered
4000m 197 20, 40, 60, 80, 120, 200, 300, 400, 700, 1000m Filtered and Unfiltered 200 20, 40, 60, 80, 200, 300, 400, 700, 1000m Filtered and Unfiltered 202 20, 40, 60, 80, 120, 200, 400, 600, 800, 1000m Filtered and Unfiltered 204 20, 40, 60, 80, 120, 200, 400, 600, 800, 1000m Filtered and Unfiltered 206 20, 40, 60, 80, 130, 200, 300, 500, 700, 1000rn Filtered and Unfiltered 207 25, 50, 120, 410, 500, 1000, 1500, 2000, 2750, Filtered and Unfiltered
3500rn
Surface dissolved Fe (nM) Polar Frontal Region - Mar 99 [Fe] nM
1.40
1.30
1.20
1.10
1.00
0.90
0.80
0.70
0 -60
0.50
0.40
0.30
0.20
0.10
Longilude E Figure 6.1: Surface dissolved iron during the first ScanFish grid box survey of the Polar Frontal Region.

+ DFe
"TFe
Fig. 6.2: Dissolved (0.2 pm) and total iron in the coastal current around Antarctica, at Station 182 (70' 13.8' S, 6' 7.77 W ) .

0
1000
E-
I!! 3000
4000
5000
Fig. 6.3: Dissolved iron in the water column from some of the deep stations occupied during the Course of ANTXVIl3.

7. PHYTOPLANKTON The Fragilariopsis kerguelensis project U. Freier, P. Assmy, V. Smetacek (AWI)
Diatoms play a key-role in nutrient, silica and C02 flux in southern Antarctic ocean. While high macronutrient levels do not limit algal growth, only low phytoplankton biomasses are reported in southern oceans. Along the polar front algal communities are dominated by key-species such as Fragilariopsis kerguelensis, Thalassiosira lenfiginosa and Thalassiofhrix spp. which form in particular thick silicified frustules. Selective grazing pressure and /or reduced mortality can lead to community selection and former accumulation. High sinking rates of these species, uptake, transportation and accumulation into sea-floor sediments have important influence of worids nitrogen, silica and carbon-cycle.
Objectives - Isolation of single strains of Fragilariopsis kerguelensis for unialgal
cultivation - Isolation of total DNA of unialgal F. kerguelensis strains for later
molecular analysis - Sampling of phenotypic information about population-polymorphism's - Quantification and qualification of biomass-dominance and
phytoplankton composition along the polar front - Determination of growth-patterns in different euphotic depths in relation
to macronutrient distribution
Work at Sea Phytoplankton was sampled at all stations along the polar front with a hand- net (20pm mesh) from 20m depth to the surface. Samples were also taken from the inner-ship sea-water pipe by continuos 20pm mesh net-concen- tration. Along two transects at the polar front, intensive CTD- sampling from 20m, 40m, (60), 80m and 120m water-depths was done by using the Same experimental approach.
Microscowic work at sea contains: Photographic documentation of polar front phytoplankton with a Zeiss Axiovert 135 microscope. Counting of F, kerguelensis cells and evaluation of cell state in correlation to : - cell autofluorescens - cell size - chain length - grazing pressure - lipid content - cell-dividing activity
Phytoplankton species composition of polar frontal samples were taken for Utermöhl-counting
Microscopic Isolation of unialgal strains of F. kerguelensis by microprepa- ration: In total 106 unialgal strains of Fragilariopsis kerguelensis could be isolated from geographic distinct seawater-samples. Three weeks later 46 of them show sufficient cell-accumulation in unialgal cultures. Total DNA of so far 4 strains could be isolated On board by varied CTAB procedure.

Preliminary results, Microscopic observations Direct observation of fresh plankton CTD-samples from station 162 to station 168 show distinct growth-patterns between cell size and chain length :
Fig. 12.1 : Relation of average chain-length (No. of cells) and cell-size (um) (total counts:11.802 cells)
Fragiiariopsis kerguebnsis
<2 0 20-35 35- 50 >50
cel Isi ze 1
Four didtinct chain forming groups of F. kerguelensis can be characterised in the first polar frontal transect by cell-size observation. Small cells up to 20 pm cell-sizd and largest cells with larger than 50pm form shorter chains with an averagd of 5.3 cells, respective 9.2 cellslchain. Cells between 20pm to 50pm show lohger chain-formation with an average of 12.9 to 15.1 cells/chain. In this range single chains occur with a cell content up to 80-120 cellslchain, where- as longer chains >18 cellslchain were never found for the former small-size groups. Precautional interpretation indicates that F. kerguelensis form phenotypic divergence in growth-patterns. Mainly cells between 20pm-50pm seem to cause dominant biomass building.
Analysis of these data with correlation to sampling-depths, cell-dividing activity, lipid-content, mortality-rate and other ANT XVI-3 data like macro- nutrient-levels, fluoreszens etc. will bring a clearer view of population- dynamics and growth-pattern.
Total DNA preparation and analysis from further unialgal cultures by various molecular methods will show how phenotypic divergence is based in genetic differences. Isolation and sequencing of genes which are involved in intra- cellular silica-processes shall bring new insights in cell-silica-cycle. Analysis of operon structure, Promotor regulation and gene expression will lead to the molecular regulation of thick or thin silicified frustules in respect to ecological behaviour and importance in worlds cilica-cycle.
8. SURFACE CHLOROPHYLL MEASUREMENTS B. Kroon
Introduction
As a measure for the relative presence of phytoplankton, chlorophyll-a (Chl-a) measurements were carried out during the duration of the cruise. Chl-a has two different functions in phytoplankton. A minor portion of cellular Chl-a is located at the very core of the two photosystems, and carry out the actual photochemical reaction in which solar energy, already trapped inside the large pigment-antennae Systems, is converted into stable chemical energy. In the order of a million of these reaction center are available for a typical phyto- plankton cell; variations in the abundance of these Chl-a molecules exist within and between species, however, they do not significantly change the ratio between Chl-a and biomass concentration defined as cellular carbon. The major portion of Chl-a is located in the core and peripheral antennae systems, at a stoichiometric ratio of 80 to 1200 per reaction center, depending On speciation or environmental conditions. Due to the potentially large vari- ations in accessory Chl-a relative to biomass concentrations, the observed Chl-a levels should be considered as a very proxy measure for phytoplankton biomass levels.
Chl-a was measured by fluorescence using a flow-through system on exci- tation with blue light. The absorbed light energy can dissipate through only five pathways, the major three being: photochemistry, heat, or fluorescence. Since these pathways are occurring in parallel, and hence directly competing, any change in one of the pathways will influence the fluxes through the other pathways. During a single day, rates of photosynthesis will vary greatly from sunset to sunrise. As a consequence, redox states and electrochemical gradients vary strongly within the photosynthetic machinery, which in its turn leads to changes in the observed fluorescence levels. In order to estimate Chl- a from fluorescence, one needs to carefully correct for these so called 'light quenching' effects. Even during night time, but then as a consequence of interference between metabolic processes in the cytoplasm and the redox state of chloroplastic components, quenching can be observed as well.
During ihis cruise, Chl-a was measured over a large spatial and temporal domain. Sudden changes in observed Chl-a levels definitely indicate a change in the total phytoplankton community in response to triggers imposed by chemical or physical driving forces. However, Chl-a levels exclusively do not allow to Interpret whether the changes took place as a result of changes in biomass levels, relative species abundance, or both. Future correlation with parameters describing cell abundance and size classes might well be used to confine the Interpretation of Chl-a levels to biogeochemically more relevant biomass concentrations,
Sampling and Methods
Fluorescence was measured on water samples continuously taken from 8 meter depth by means of a Turner Design fluorometer at 10 seconds interval averaged and stored at 5 minutes intervals on the ships data logging System. Every 3 to 4 hours duplicated of 1 liter of seawater were filtered onto Whatman
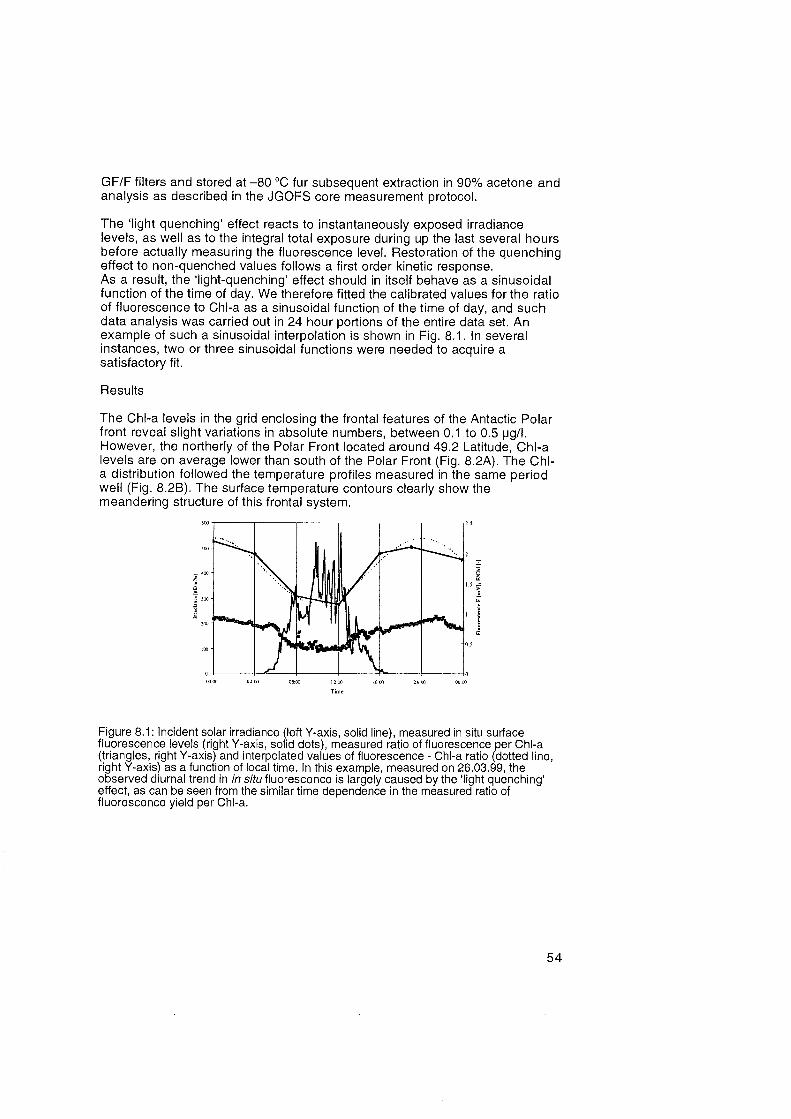
GFIF filters and stored at -80 'C fur subsequent extraction in 90% acetone and analysis as described in the JGOFS core measurement protocol.
The 'light quenching' effect reacts to instantaneously exposed irradiance levels, as well as to the integral total exposure during up the last several hours before actually measuring the fluorescence level. Restoration of the quenching effect to non-quenched values follows a first order kinetic response. As a result, the 'light-quenching' effect should in itself behave as a sinusoidal function of the time of day. We therefore fitted the calibrated values for the ratio of fluorescence to Chl-a as a sinusoidal function of the time of day, and such data analysis was carried out in 24 hour portions of the entire data Set. An example of such a sinusoidal interpolation is shown in Fig. 8.1. In several instances, two or three sinusoidal functions were needed to acquire a satisfactory fit.
Results
The Chl-a levels in the grid enclosing the frontal features of the Antactic Polar front reveal slight variations in absolute numbers, between 0.1 to 0.5 pgll. However, the northerly of the Polar Front located around 49.2 Latitude, Chl-a levels are on average lower than south of the Polar Front (Fig. 8.2A). The Chl- a distribution followed the temperature profiles measured in the Same period well (Fig. 8.2B). The surface temperature contours clearly show the meandering structure of this frontal System.
Figure 8.1: Incident solar irradiance (left Y-axis, solid line), measured in situ surface fluorescence levels (right Y-axis, solid dots), measured ratio of fluorescence per Chl-a (triangles, right Y-axis) and interpolated values of fluorescence - Chl-a ratio (dotted line, right Y-axis) as a function of local time. In this example, measured on 26.03.99, the observed diurnal trend in in sffufluorescence is largely caused by the 'light quenching' effect, as can be Seen from the similar time dependence in the measured ratio of fluorescence yield per Chl-a.

Figure 8.2: Chl-a (8.2A, Top panel) and surface temperature (8.2B, bottom panel) contour plots around the Polar Front. Note that the left side of the X-axis corresponds to the North, and the origin of the Y-axis to the East.
We did not have the opportunity to accurately document the temporal dynamics of the Chl-a distribution in the Polar front. However, the Chl-a distribution that we observed during the South - North travel between April 22 and May 6 (Figs. 8.3A and B) does indicate that the composite picture shown in Fig. 8.2 is subject to short-term changes. Between 22.04.99 and 29.04.99 (Fig. 8.3A) we clearly detected a Chl-a maximum around 51's 1 20°E which was even higher than the Chl-a maximum that was associated with the Polar Front at 49's 1 20' E. As we shortly cruised southward on 29.04.99 from 49's to 52's (Fig. 8.36), we again passed both regions were we observed the Chl- a maxima just a few days before. This time however, the Chl-a bloom associated with the Polar Front was higher than the Chl-a maximum at 52's at the Same longitude. In addition, both maxima were slightly shifted southward.
Between 26.03.99 and 05.05.99 34 CTD casts were samples and analyzed for Chl-a, silicate, POC and carbonate (data not shown). Except for Chl-a, all samples await further analysis at the home Institute. The Chl-a depth profiles showed that the mixing layer mostly extended to about 100 meters, while mixing depths were limited to about 50 meters on some locations.

On 6 positions, we characterized the underwater light climate in 13 different spectral bands ranging from 360 nm to 720 nm (data under analysis). Due to the low Chl-a levels, the 1 % light depths occurred at 100 to 120 meters. In combination with biophysical measurements (see section Biophysical Measurements) the data indicate that even at the 1% light level, sufficient was available to Support positive growth rates.
Acknowledgements: Angus Atkinson, Dorothea, Katrien, Philipp, Thomas, Ullie Freier, Klaus-Uwe, Anke, Ruth, Bettina for carrying collecting & filtering the samples. Philipp for analyzing the major portion of the samples.

Laftude
47 49 51 53 55 57 59 6 1 63
Latiude
Figure 8.3: Transects of Chl-a concentrations measured between 22.04.99 to 20.04.99 (8.3A, top panel) and between 29.04.99 to 06.05.99 (8.3B, bottom panel).Fat lines indicate the longitudinal positions, thin lines Chl-a concentrations. Note that the Y-axes differ in both figures.
9. BIOPHYSICAL MEASUREMENTS B. Kroon, T. Mock (AWI)
Introduction
Primary production of phytoplankton results from the physical and chemical environment in which the phytoplankton lives, and from the cellular structures that carry out the photochemical processes. If we assume that the physical environment can influence primary production, we might then argue that bio- physical / biochemical structures will reflect the different physical characteris- tics in which the phytoplankton lives. In other words, the environment offers resources that can be used for photochemical processes, but those organisms having a cellular make up that best use the resources do have a competitive advantage over other organisms. In order to evaluate the strength of phyto- plankton species to use the environmental resources we developed a novel theoretical framework, based on the fact that a phototrophic organism requires a particular number of electrons to reduce elements (C, H, 0 and N) and incorporate elements into new biomass. The number of electrons required to synthesize one C-mole of any phytoplankton species is called yx, the general degree of reduction of biomass, which can be calculated from knowledge On the elemental composition of biomass. The rate at which electrons are generated, R e depends on the rate constants for the photochemical reactions and the dynamics of light energy available to fuel the photochemical reactions. The ratio of Re and yx defines the growth rate of phytoplankton.
Our primary goal of ANTXVIl3 was to collect the dominant phytoplankton species and transfer them to our home laboratory in order to cultivate axenic cultures. These cultures can then be used to measure all Parameters required to determine yx, and all necessary rate constants to calculate Re as a function of the physical conditions that we encountered in the various water masses during the cruise.
Results
Batch and continuous cultures of phytoplankton (ice algae as well as 'open water' species) were maintained during ANTXVIl3 and 14. The samples were successfully transferred to the home laboratory. At the moment of this writing, Isolation procedures are successfully carried out to yield axenic cultures of: Fragilariopsis cylindrus, F. kurta, F. kerguelensis, Thallasiosira antarctica, Chaetoceros sp., Pseudonitschia seriate, Corytrhon cryoplyllum, and ßhozisoleni sp. Due to unstable power supply on board of the Polar Stern, we were only able to carry out a few biophysical measurements during the cruise. An example of such a measurement and its analysis is shown in Figs. 9.1 and 9.2. Ongoing work at the laboratory is carried out on all available cultures.

Figure 9.1 : Example of a fluorescence induction analysis on a sample from 90 meters depth at Station 168. The sample was dark adapted for 4 hours prior to the measurement The raw data (open symbols, Fo normalized data, average of 5 measurements) were fitted with a model on energy flows in Photosystem II (solid line). The error between model and data (closed symbols) lies well within +I- 2% (r- = 0.989, n=5). The model output yields biophysical rate constants that characterize the following processes: energy trapping in the reaction Center, energy losses in closed reactions centres, heat and fluorescence losses in the antenna pigments, energy transfer between different photosystem II complexes. The quantum yield for photochemistry is calculated from the rate constants. These rate constants are needed as input Parameters to a larger model to predict rates of photochemistry, Re.
1 67 168
Station J
Figure 9.2: Quantum yield of photosystem II (PSII) of samples taken from Station 167 and 168 (South of the Polar Front), analyzed as described in the legend of Fig. 9.1. The samples taken from 90 m both had higher quantum efficiencies, which was primarily caused by a higher rate constant for energy trapping in PSII. Since the samples were dark adapted for at least 4 hours, we ascribe the observed differences to real structural differences, and not as a consequence of previously (in situ) experienced light levels.

10. STUDY OF THE MECHANISMS CONTROLLING PHYTOPLANKTON GROWTH IN LATE SUMMER-EARLY AUTUMN IN THE SOUTHERN OCEAN WITH SPECIAL ATTENTION T 0 IRON AND SILICATE PHYSIOLOGY V. Schoemann (ULB)
Introduction
Recent literature reveals the complex interplay of silicate and iron limitation in regulating diatom blooms and related biogeochemical cycles in the Southern Ocean (de Baar et al. 1998, Takeda, 1998, Hutchins and Bruland 1998). In particular, it has been shown that iron limitation sustains highly silicified diatoms characterized by a higher sinking rate compared to diatoms growing under replete Fe (Takeda, 1998, Hutchins and Bruland 1998). The effect of iron limitation on the carbon metabolism and the diatom silification level was addressed by running shipboard experiments and using radiotracer techniques under different iron concentrations.
Objectives
The general aim of this project was to determine the kinetics of the biological processes controlling the organic carbon production of late summer-early fall Antarctic phytoplankton. In particular, we studied: * the phytoplankton photosynthesis, growth and respiration Parameters; * the diatoms silica metabolism; * the total and intracellular uptake of iron by phytoplankton.
Work at Sea
All the material used for sampling and during the experiments was treated according to the recommended ultraclean methods to avoid trace metal contamination.
Sampling Natural phytoplankton assemblages were collected at 5 stations in the Southern Atlantic Sector between 49OS and 70°S Sampling was carried out, using either Go-Flo bottles mounted on the Teflon coated rosette frame from NIOZ or with Go-Flo's attached to a kevlar cable. The Go-Flo's were emptied and the samples further treated in a trace metal clean cooled container (NIOZ) or in class 100 laminar flow bench. Sub-samples were taken for running the radiotracer incubation experiments as weil as for measuring the following associated parameters (some of the analyses being supported by other cruise's participants): @ dissolved iron by flow injection analyses (J. de Jong, NIOZ)
silicate, phosphate, nitrate and ammonium (G. Kattner, C. Hartmann, A. Ratje) Biogenic silica POCIPON (M. van Leeuwe)
* phytoplankton (<2pm) countings and cells vitality by flow cytometry (M. Veldhuis, F. Brocken)
species composition, cell density and biovolumes of large phytoplankton in lugol samples under an inverted microscope
Chlorophyll a Pigment composition by HPLC (M. van Leeuwe)

* fluorescence by fast repetion rate fluorimetry (M. Davey) N - ~ i t r a t e and ammonium uptakes (K, Timmermans)
Photosynthesis In order to determine the photosynthetic parameters -the photosynthetic efficiency, a; the index of photoinhibition, ß the maximal specific rate of photosynthesis, Kmax and the light adaptation parameter, Ik- PIE curves were established using the C methodology. Short-term incubations (2-3 h) of 1 ml- seawater samples spiked with 5 pCi of ~ ^ C ~ ~ w e r e run at in situ temperature and under different light intensities (0-600 umol.m^.s'l). After incubation, the excess inorganic ^C was degassed for 24 h after addition of 6N HCI. Radioactivity was determined by liquid scintillation (scintillation cocktail Ecolume) with a Packard (tri-carb 160 CA) analyzer.
Phytoplankton growth, respiration and the Fe and Si metabolism A serie of process-level experiments were conducted to improve the knowledge of light and nutrient (Fe and Si) control of phytoplankton growth in the Southern Ocean. In particular:
the effect of iron limitation On silicon and carbon assimilation; the carbon, iron and silicate phytoplankton stoichiometry and its regulation by
ambient Fe; the quantitative determination of key phytoplankton parameters: maximal
specific rate of photosynthesis, maximal specific rate of protein synthesis, half saturation constant for Fe total and intracellular uptake, VmaxSi, VmaxFe. The experimental procedure was as follows:
Parallel long-term ^C, ^ ~ e (e.g. Fig. 10.1) and ^ ~ i incubations were conducted at 100 pmol m 2 s at in situ temperature and mimicking the light- dark cycle. These experiments were performed with natural phytoplankton assemblage; Fe-enriched (addition of 0.25, 0.5, 1 .O and 2.5 nM of FeC13 during 2 days); and Fe-enriched culture of Chaetoceros dichaeta.
At each inculation time, 250-450 ml were filtered using Whatman GFIF or 14 Nuclepore membranes according to the radiotracer. C-Whatman GFIF were
acidified (HCI 0.1 N) to eliminate excess inorganic carbon and then frozen at - 20°C The ^C filters will be later speciated as described in Lancelot and Mathot (1985) in order to distinguish between carbon assimilated into 4 pools of cellular constituents: small metabolites, lipids, polysaccharides and proteins. Phytoplankton growth and respiration will be estimated by mathematical fitting of the data relative to kinetics assimilation of ^C into proteins and Storage products according to the equations described in Lancelot et al. (1991).
~ i - ~ u c l e ~ o r e membranes were soaked with 1 ml HF (2.9N) to hydrolyse the particulate silica and scintillation cocktail (UltimaGold-XR) was added before radioactivity was measured by liquid scintillation.
Two 55 Fe-filtrations were processed at each incubation time to distinguish between total Fe uptake (adsorption + intracellular) and intracellular Fe uptake (e.g. Fig. 10.2). The latter was isolated by applying, during the filtration, the eaching method of Hudson and More1 (1989) based on the use of Ti

complexed with citrate and EDTA. The radioactivity on the filters was determined by liquid scintillation after the addition of scintillation cocktail (Ready Safe).
All the results obtained on phytoplankton physiology will be synthesized for their incorporation in the SWAMCO model of Lancelot et al. (1997), further developed for its application at the scale of the Southern Ocean and over seasonal cycles in the scope of the Belgium BELCANTO and the EC CARUSO projects.
References
Baar, de, H.J.W., de Jong, J.T.M., Nolting, R.F., van Leeuwe, M.A., Timmermans, K.R., Bathmann, U., Rutgers van der Loeff, M. & J Sildam. 1998. Low dissolved Fe and the absence of diatom blooms in remote Pacific waters of the Southern Ocean. Mar. Chem. Submitted.
Hutchins, D.A., & K.W. Bruland. 1998. Iron-limited diatom growth and Si:N uptake ratios in a coastal upwelling regime. Nature, 393, 561-564.
Lancelot, C. & S. Mathot. 1985. Biochemical fractionation of primary production by phytoplankton in Belgian coastal waters during short- and long-term incubations with ^C-bicarbonate. II. Phaeocvstis ~ouchetii colonial ~o~u la t ion . Marine , . U .
Biology, 86, 227-232. Lancelot, C.. Becauevort. S.. Menon. P. & J.-M. Dandois. 1997. Ecoloaical modellina of
the planktonic microbial food-web. In : Belgian Scientific ~esearch programmeÖ the Antarctic. Scientiific results of Phase III (1992-1 996), S. Caschetto, ed., Federal office for scientific, technical and cultural affairs. Brussels. 1-78.
Mathot, S., Lancelot, C . & J.-M. Dandois. 1992. ~ r o s s and net primary production in the Scotia Weddel sector of the Southern Ocean during spring 1988. Polar Biol., 12, 321 -332.
Takeda, S. 1998. Influence of iron availability on nutrient consumption ratio of diatoms in oceanic waters. Nature, 393, 774-777.

0 5 1 0 1 5 2 0 25 Incubation Time (h)
Fig. 10. 1 : Preliminary results of the physiological Fe uptake of a natural phytoplankton assemblage in relationship to the incubation time.
0 1 2 3 Dissolved Fe (nM)
Fig. 10.2 : Preliminary results of the total ( 0 ) and physiological Fe uptake ( 0 )
after the incubation of a natural phytoplankton assemblage at different dissolved Fe concentrations.

11. FLUORESCENCE OF MARINE PHYTOPLANKTON M. Davey (MBA)
Objectives
Characterisation of photosynthetic activity of phytoplankton in the surface layer and nutritional Status of the population with respect to iron availability.
Work included two main components: 1. Measurement of horizontal variation in the abundance and potential
photosynthetic activity of phytoplankton in the surface water during transects using Fast Repetition Rate Eluorometry, (FRRF).
2. Assessment of the photosynthetic parameters of discrete samples from nutrient manipulated On board experiments using field samples and laboratory cultures
The FRRF, like other fluorometers, measures the fluorescence signal emitted from chlorophyll within a body of water. Fluorescence emission can be regarded, in a simplified way, as a means by which the photosynthetic apparatus can dissipate excess energy captured by the light harvesting apparatus in algal cells. Under physiological conditions, fluorescence is emitted from chlorophyll in only one part of the photosynthetic apparatus referred to as photosystem II, (PSII). It is, therefore, the light saturation kinetics of the reaction centre and the efficiency of the light harvesting apparatus of PSII, which is examined by FRRF. The fluorometer delivers a flash sequence comprising two parts, the "saturation" sequence, a series of short sub-saturating actinic flashes, (typically 100 flashes of 1 ps duration at I ps intervals), followed by the "relaxation" sequence, (typically 20 flashes of 1ps with 20ps intewals). These flash sequences are generated, (and the emission signal measured), in two similar chambers. One chamber is Open and measures fluorescence under ambient light; the other is shielded from light and measures fluorescence emitted by cells immediately after transfer to darkness. The measurements from the two chambers can be used independently, or in combination, to provide values of biophysical parameters, which are derived from the fluorescence emission, (saturation profile) associated with the light stimulus of the flash sequence. The flashes gradually saturate the photosystems of the algal cells in the water body. As the photosystems become saturated the excess energy is increasingly dissipated as fluorescence and it is the changing fluorescence emissior~ throughout the flash sequences which provides information about the light harvesting efficiency and initial reaction kinetics of PSII. The theory of fast repetition rate fluorescence is outlined in Kolber et al1998.
The measurements of interest during the flow through measurements, made during this cruise, were the values of minimum fluorescence, (Fo) and the maximum fluorescence (Fm). Fo is fluorescence emitted at the beginning of the flash sequences, Fm is the fluorescence emitted once all the reaction centres are closed or saturated by the light of the flash sequence. The difference between these two values is termed the variable fluorescence (Fv). Fm is an index of the total chlorophyll concentration and Fv provides an index of the concentration of functional reaction centres. The ratio of the variable to maximal fluorescence is an indication of the efficiency of PS II. The theoretical maximum value for this ratio is 0.65, values of FJFm between 0.6 - 0.65 are indicative of efficient, nutrient-replete cells, values of less than 0.3 in surface waters suggest cells are subject to considerable nutritional limitation.
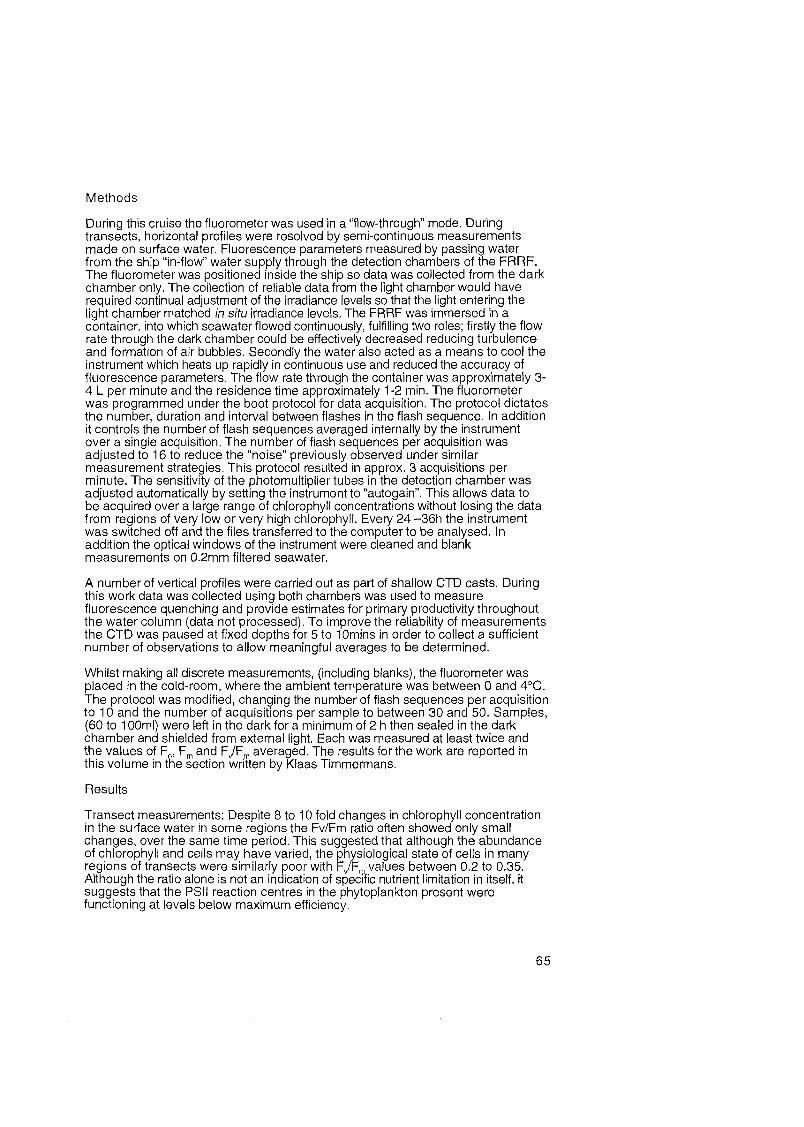
Methods
During this cruise the fluorometer was used in a "flow-through mode. During transects, horizontal profiles were resolved by semi-continuous measurements made on surface water. Fluorescence parameters measured by passing water from the ship "in-flow" water supply through the detection chambers of the FRRF. The fluorometer was positioned inside the ship so data was collected from the dark chamber only. The collection of reliable data from the light chamber would have required continual adjustment of the irradiance levels so that the light entering the light chamber matched (h situ irradiance levels. The FRRF was immersed in a container, into which seawater flowed continuously, fulfilling two rotes; firstly the flow rate through the dark chamber could be effectively decreased reducing turbulente and formation of air bubbles. Secondly the water also acted as a means to cool the instrument which heats up rapidly in continuous use and reduced the accuracy of fluorescence parameters. The flow rate through the container was approximately 3- 4 L per minute and the residence time approximately 1-2 min. The fluorometer was programmed under the boot protocol for data acquisition. The protocol dictates the number, duration and interval between flashes in the flash sequence. In addition it controls the number of flash sequences averaged internally by the instrument over a single acquisition. The number of flash sequences per acquisition was adjusted to 16 to reduce the "noise" previously observed under similar measurement strategies. This protocol resulted in approx. 3 acquisitions per minute. The sensitivity of the photomultiplier tubes in the detection chamber was adjusted automatically by setting the instrument to "autogain". This allows data to be acquired over a large range of chlorophyll concentrations without losing the data from regions of very low or very high chlorophyll. Every 24 -36h the instrument was switched off and the fites transferred to the computer to be analysed. In addition the optical windows of the instrument were cleaned and blank measurements on 0.2mm filtered seawater.
A number of veriical profiles were carried out as Part of shallow CTD casts. During this work data was collected using both chambers was used to measure fluorescence quenching and provide estimates for primary productivity throughout the water column (data not processed), To improve the reliability of measurements the CTD was paused at fixed depths for 5 to 1 Omins in order to collect a sufficient number of obsewations to allow meaningful averages to be determined.
Whilst making all discrete measurements, (including blanks), the fluorometer was placed in the cold-room, where the ambient temperature was between 0 and 4OC. The protocol was modified, changing the number of flash sequences per acquisition to 10 and the number of acquisitions per sample to between 30 and 50. Samples, (60 to 100ml) were left in the dark for a minimum of 2 h then sealed in the dark chamber and shielded from external light. Each was measured at least twice and the values of F , Fm and F ./Fm averaged. The results for the work are reported in this volume in the section written by Klaas Timmermans.
Results
Transect measurements: Despite 8 to 10 fold changes in chlorophyll concentration in the surface water in some regions the FvIFm ratio often showed only small changes, over the Same time period. This suggested that although the abundance of chlorophyll and cells may have varied, the physiological state of cells in many regions of transects were similarly poor with FJFQ values between 0.2 to 0.35. Although the ratio alone is not an indication of specific nutrient limitation in itself, it suggests that the PSI1 reaction centres in the phytoplankton present were functioning at levels below maximum efficiency.

In the first "Scanfish" box, a general trend in FJFm ratio was apparent. Slightly higher values for Fv/Fm (and for Fm), were observed in the northern parts of the box, from 0.3 - 0.4, (+I- 10%), in contrast to the values in the southern area of the box, values in the region of 0.2.
The most striking changes in FJFm throughout a single transect occurred as the ship approached the Neumayer station during Run 8. Although cells numbers and chlorophyll concentrations were some of the lowest recorded throughout the cruise, as the ship proceeded south into the ice and over the continental shelf significant increases in FJF were observed. Except for three peaks on the Fm value, which corresponded wit% increases in cell numbers, (flow cytometry results of Marcel Veldhuis), chlorophyll concentration remained consistently low, See Figurel .a Ei b.
Concluding remarks
The preliminary results of this work indicated than on the whole the surface waters of the cruise appeared to contain algae, which were under moderate nutritional stress. Using the Index of F J F as an indication of photosynthetic activity or potential the algae encountered in the ice fields appeared to be the most robust. The traditional use of chlorophyll concentrations to indicate phytoplankton productivity can be used only.
Measuring field populations naturally involves looking at mixed populations of prokaryotic and eukaryotic algae. Whilst the field conditions maybe favourable for some algal species it maybe not be the case other parts of the algal population. The fluorescence signals measured by the FRRF are from the whole population, and represent at best an average value. If the population is dominated by a particular species which is undergoing physiological changes in response to environmental changes then the measurements may be biased. During a bloom situation a high FJFm may accurately describe the condition of the photosynthetic physiology of the dominant population. However values between 0.2 and 0.4 could indicate generally nutrient depleted algae or may describe a mixture of sub- populations, some of which are nutrient limited others which under the Same condition are nutritionally replete.
Additional problems in measuring any fluorescence parameters include the influence of light on fluorescence activity, die1 variations in fluorescence caused by exposure of cells to light and light or photochemical quenching of fluorescence. During the hours of darkness there was a marked decrease in the signal "noise" which was probably due to more accurate measurements of F . The measurement of F requires all the reaction centres to be Open. When algae were exposed to daylight it appeared to take minutes to hours for the reaction centres to become fully re-opened. For this reason increasing the Residence time of algae in the dark chamber of the instrument would possibly have resulted in greater precision of F- and therefore FJFm measurement.

Figures 11 a & b. Variation of fluorescence Parameters throughout the transect from 64' to 70°S 11 a : Variation of variable fluorescence throughout run 8. 11 b : Variation of Fm, throughout run 8.
Reference:
Kolber, Z. S., Prasil, O., Falkowski, P. G. (1998). Measurement of variable chlorophyll fluorescence using fast repetition rate techniques: defining methodology and experimental protocols. Biochim. et Biophys. Acta 1367: 88-1 06.

12. PHYTOPLANKTON DYNAMICS IN AUSTRAL AUTUMN IN THE SOUTHERN OCEAN M.J.W. Veldhuis, F. Broken (NIOZ)
General objective
The main objective of this cruise was to investigate the phytoplankton abun- dance, distribution and physiology in detail in the Polar Front (48-50's) and down to the Antarctic continent (70's) during austral autumn (March to May 1999). For this purpose discrete samples were taken and analysed applying flow-cytometry allowing detailed analysis of cellular bio-optical properties (size, scatter and chlorophyll fluorescence) of single cells. Next, different biochemical properties like total DNA content and lipids were assessed applying fluorescent probes. The general physiological status (viability) of the phytoplankton cells was derived from the status of the plasma membrane using a green fluorescent DNA-specific dye which is non-permeable in healthy cells.
In addition, subsamples were analysed of field populations and cultures of phytoplankton subjected to a variety of treatments targeted to study the role of iron in the algal physiology. For detailed Information we refer to Timmermans and Van der Wagt, Van Leeuwe and Van Oijen and Schoemann (also presented in this cruise report).
Finally, a first attempt was made to analyse on-line bacteria Using a green flu0resc:ent nuclear-stain.
The general objective can be separated in the following topics:
1) Determination of the phytoplankton abundance, cell size, chlorophyll fluorescence and biochemical composition of samples taken in a grid across the Polar Front (48s - 52s). Investigate the relationship with general physical and chemical structure of the water-masses encountered.
2) Effect of (deep) vertical mixing properties On the general physiological status (photopigment adaptation and viability) of different phytoplankton communities.
3) Effect of nutrient limitation (silicate and iron) On phytoplankton composition and growth.
Ad 1) Spatial abundance was mainly based on surface sampling, using the on-line plankton pump. Transects sampled were from Cape Town towards the grid of the Polar Front and from the grid towards the Antarctic continent (station Neumayer). Each transect was sampled twice. Samples were taken at a 1 h interval which equals a 3 to 12 nm distance between the sampling points depending on ships speed. These data provided a general Impression of numerical abundance and size class distribution of area between 40° and 70° (ranging from 20° at the north to 8OW at the continent).
In the Polar Front additional samples were taken of the upper 200 m of the water-column. For this purpose subsamples were taken from the CTD-rosette, equipped with Niskin bottles. Since sampling was focussed on a grid (48.7 OS

- 49.9 O S and 19 OE- 21Â E) a 3D (latitudinal, longitudinal and depth) distribution can be given of phytoplankton properties (numerical abundance, size and chlorophyll fluorescence). Data will be compared with physical parameters (temperature, salinity, density, fluorescence) of the CTD as well as those obtained with the towed undulating platform (Scanfish).
Samples were taken for cellular DNA analysis of phytoplankton and bacteria. In case of phytoplankton cellular DNA content can be used in combination with HPLC-analysis of plant-pigments for species determination (e.g. Phaeocystis sp,) Same data can also be used to calculate total phytoplankton biomass based On the following empirical relationship:
C = carbon content per cell [pg Clcell] DNA,,.,-, = DNA content of phytoplankton relative to signal of internal standard (Prochlorococcus sp) PronNÃ = DNA relative DNA content of Prochlorococcus sp. (0.0155 rel. units)
After Veldhuis, Cucci and Sieracki (1997)
Additional samples were taken for analysis for other biomarkers (neutral lipids a storage product particularly present in diatoms using the dye Nile Red). These samples will be analysed at NIOZ. The relative amount of neutral lipids can be determined On the level of individual groups.
Ad2) The physiological Status (viability) of the separate algal groupslspecies was examined by testing the integrity of the plasma membrane. This method has recently been proven to be a rapid and reliable method to test first signs of autolysis of the plankton cells. In general healthy, growing cells will not stain upon addition of a DNA membrane-impermeable dye whereas cells in stressed conditions show partly or totally comprised plasma membrane. The dye will easily pass the plasma membrane and as a result, the genome of these cells will be stained showing a bright greenlyellow fluorescent signal. The great advantage of this method is that it detects an early Stage of autolysis, when phytoplankton cells still possess their pigments and full DNA content. During the cruise samples of the upper part of the water column were examined for their viability. Different groups will be compared with depth and along a gradient over the Polar Front and adjacent water masses. In addition subsamples were kept in the dark for several days to test the ability of polar phytoplankton to deal with prolonged dark conditions. These conditions may occur when phytoplankton cells are exported out of the euphotic Zone due to deep mixing or sinking.
Ad3) Effects of different environmental Stress factors (silicate, iron and light) were tested by various colleagues in a variety of short or long-term incubation experiments. Our contribution was restricted to the analysis of above- mentioned aspects of the phytoplankton community.
Material and Methods
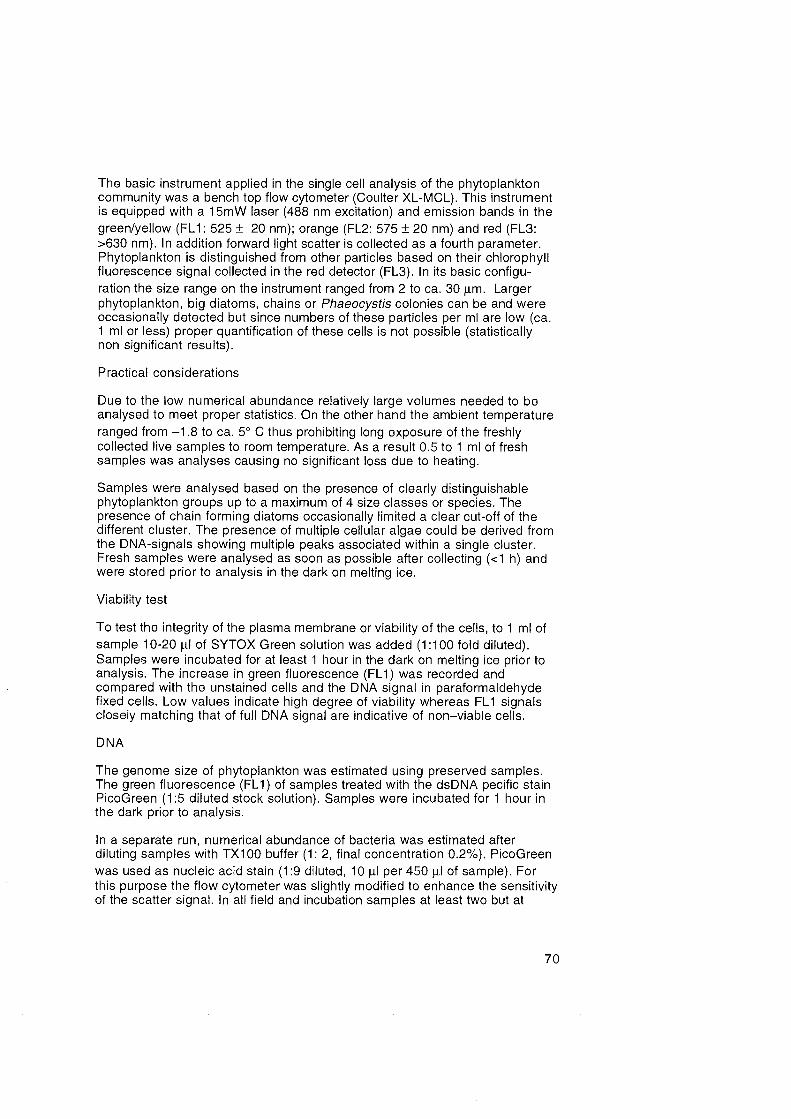
The basic instrument applied in the single cell analysis of the phytoplankton community was a bench top flow cytometer (Coulter XL-MCL). This instrument is equipped with a 15mW laser (488 nm excitation) and emission bands in the greenlyellow (FL1: 525 Â 20 nm); orange (FL2: 575 Â 20 nm) and red (FL3: >630 nm). In addition forward light scatter is collected as a fourth parameter. Phytoplankton is distinguished from other particles based on their chlorophyll fluorescence signal collected in the red detector (FL3). In its basic configu- ration the size range on the instrument ranged from 2 to ca. 30 Pm. Larger phytoplankton, big diatoms, chains or Phaeocysfis colonies can be and were occasionally detected but since numbers of these particles per ml are low (ca. 1 ml or less) proper quantification of these cells is not possible (statistically non significant results).
Practical considerations
Due to the low numerical abundance relatively large volumes needed to be analysed to meet proper statistics. On the other hand the ambient temperature ranged from -1.8 to ca. 5' C thus prohibiting long exposure of the freshly collected live samples to room temperature. As a result 0.5 to 1 ml of fresh samples was analyses causing no significant loss due to heating.
Samples were analysed based On the presence of clearly distinguishable phytoplankton groups up to a maximum of 4 size classes or species. The presence of chain forming diatoms occasionally limited a clear cut-off of the different duster. The presence of multiple cellular algae could be derived from the DNA-signals showing multiple peaks associated within a single cluster. Fresh samples were analysed as soon as possible after collecting (<I h) and were stored prior to analysis in the dark on melting ice.
Viability test
To lest the integrity of the plasma membrane or viability of the cells, to 1 ml of sample 10-20 pl of SYTOX Green solution was added (1:100 fold diluted). Samples were incubated for at least 1 hour in the dark on melting ice prior to analysis. The increase in green fluorescence (FL1) was recorded and compared with the unstained cells and the DNA signal in paraformaldehyde fixed cells. Low values indicate high degree of viability whereas FL1 signals closely matching that of full DNA signal are indicative of non-viable cells.
DNA
The genome size of phytoplankton was estimated using preserved samples. The green fluorescence (FL1) of samples treated with the dsDNA pecific stain PicoGreen (1 :5 diluted stock solution). Samples were incubated for 1 hour in the dark prior to analysis.
In a separate run, numerical abundance of bacteria was estimated after diluting samples with TX100 buffer (1 : 2, final concentration 0.2%). PicoGreen was used as nucleic acid stain (1 :9 diluted, 10 pl per 450 pl of sample). For this purpose the flow cytometer was slightly modified to enhance the sensitivity of the scatter signal. In all field and incubation samples at least two but at

some stations and in older cultures often three bacterial population could be distinguished based On their DNA content.
Results
In total over 5000 samples were analysed and most of the data has been processed On board. Therefore the number of post-cruise samples to be analysed remains limited to several hundreds of lipid tests of field samples.
In general phytoplankton numbers were low (<2500 cellslml), in some cases close to the Antarctic shelf extremely low (<I00 cellslml) in the surface waters. For comparison in the temperate Zone (44OS) numbers were still in the order of 40,000 cells per ml. For comparison autumn values are 2 to 5 fold lower than previous measurements made applying flow cytometry in the spring condition across the Polar front down to the ice shelf (Jochem et al,1997). As in most oceanic waters examined flow-cytometric data showed a covariance of size and fluorescent properties of the phytoplankton (Figl). Yet, due to presence of chain forming diatoms larger algal groups could not always clearly be separated and are certainly not exactly quantified.
Picophytoplankton was present only north of 48's with numbers ranging from 1,000 to 5,000 per ml. Phycoerythrin containing Synechococcus were only found north of 45's.
Chlorophyll fluorescence 1 Irel. unitsl 1
Figure 12.1 isometric projection of size versus chlorophyll fluorescence signals.
Typical example showing covariance of size and chlorophyll signals and decrease in numerical abundance with increasing cell size
The vertical profiles of phytoplankton distribution showed a uniform Pattern of a nearly equal numerical distribution over the (wind) mixed layer of the water column. Due to this constant mixing process relative size and chlorophyll

fluorescence of the cells remained also fairly constant. A moderate increase in chlorophyll fluorescence was measured only below the mixing layer. Nevertheless, the increase in chlorophyll fluorescence, hence pigmentation, was only minor and never exceeded a factor 3.
cell number [#/ml] chlorophyll fluorescence [rel units/cell]
0 500 1000 1500 2000 2500 3000 3500 0 70 140 210 280 350 420 490 560 630 703
Figure 12.2 Typical example of vertical distribution of major algal size classes (left); relative chlorophyll fluorescence per cell of each algal group (right).
A completely different vertical distribution profile existed at the Antarctic shelf edge. At this area a sharp peak in cell numbers was found at a depth of 250 m. Since all size classes showed a peak at the depth it is unlikely that this elevated phytoplankton biomass is caused by rapid sinking of the larger material from the upper water column. This is confirmed by the fact that chlorophyll signals also showed little changes even below the 1 % light depth Zone (ca. 120 m).

cell number [#/ml] chlorophyll fluorescence [rel unitslcell]
0 400 800 1200 ifinn ?rinn 0 60 120 180 240 300 360 420 480 540 600
i station 182
Fig. 12.3 Vertical profile of cell numbers and chlorophyll distribution of station 182, close to the Arltarctic shelf edge.
Viability The viability tests showed considerable changes with respect to the dominant species both in time and space. In general viability of larger phytoplankton, most likely diatoms (5 ->I0 pm), in the silicate-deprived waters of the northern part of the Polar Front was low, i.e. green fluorescence signals of these cells closely matched that of DNA signal in preserved samples (Fig. 12.4 left duster). In other species a more gradual signal was observed indication considerable interspecific variation. Further data processing is needed to match this type of measurement with nutrient concentrations and prevailing light and physical conditions (mixing regime) of the water column. Since cruise covered a time Span over 7 weeks and several regions were visited more frequently an indication can be given of the general phytoplankton physiology during the austral autumn of the Polar Front.
\ green iiuorescence/ceE
- rel size
Figure 12.4 Bivariate plots of relative size and chlorophyll distribution show two clusters of phytoplankton. Frequency distribution of green fluorescence signal of these population at three conditions: control, live stained with SYTOX Green and preserved cells (showing maximum staining of the DNA).

DNA
DNA measurements of field samples often showed multiple peaks within a single phytoplankton population. Detailed analysis of the DNA signal of this group using the peak versus integrated mode revealed multiple DNA peak associated with a single particle. In like manner chlorophyll fluorescence of these clusters showed also a much larger variation than normal found for a single population. Microscopic observations confirmed the presence of small chain forming diatoms (1 to 4 cells).
In two c:ases the growth rate of a single population was measured using the DNA-cell-cycle method which is based On the frequency of cells synthesising DNA. This was done for a field ~ o ~ u l a t i o n during the survey of the grid and on . . a sample containing ice-algae.
Figure 12.5 Frequency distribution histogram of relative DNA content of bacterial population
The number of bacteria counted using PicoGreen as a green fluorescent dye ranged from 3 - 6 *106 per ml rapidly in the surface waters. The general trend was towards lower numbers south of the Polar Front. Bacterial numbers also declining down the euphotic Zone in general CO-varying the phytoplankton biomass. Bacterial DNA measurements showed clearly the presence of two groups of bacteria distinctly differing in DNA content (ca. 4-6 fold, Fig. 12.5). Although this separation in two DNA-groups is commonly observed in most oceanic Systems it is only in the Southern Ocean that they are so distinctly separated.

RESPONSES T 0 IRON LIMITATION OF NATURAL PHYTO- PLANKTON ASSEMBLAGES COLLECTED AROUND THE POLAR FRONT AND SINGLE SPECIES CULTURES OF ANTARCTIC DIATOMS. K. R. Timmermans' B. van der Wagt, M. J.W. Veldhuis(NIOZ), M.Davey (PML)
During the ANT XVIl3 with R.V. Polarstern, the responses to iron limitation of natural phytoplankton assemblages collected around the Polar Front, as well as the responses to iron limitation of single species cultures of Antarctic diatoms were investigated in the Southern Ocean. Both approaches were used to shed light on the effect of iron limitation On phytoplankton physiology, and more generally, to investigate the role of iron in biological forcing of the oceanic carbon cycle.
The natural phytoplankton assemblages were incubated for a short time (1- 6 days) in order to prevent major changes in species composition. The experiments with the Antarctic diatoms brought from the home laboratory lasted longer up to several weeks. Main tools to investigate the effects were the flowcytometer (FCM) and the Fast Rate Repetition Fluorometer (FRRF). The FCM was used to determine the cell numbers (and thereby the growth rate), as well as the size distribution and chlorophyll a fluorescence of the phytoplankton. Parameters available for assessing photosystem II (PSII) are maximum fluorescence yield (Fm) and the variable fluorescence yield (Fv). Whilst Fm provides an Index of chlorophyll concentrations, Fv can be used to indicate the abundance of functional PSII reaction centres. The ratio of variable to maximum fluorescence is indicative of PSI1 efficiency, which itself is dependent upon the nutritional status of the phytoplankton cells. In the experiments, the FRRF was used to determine FvIFm, and hence the iron status of the phytoplankton.
The results from the field experiments tend to suggest iron stress in the natural phytoplankton assemblage. In some cases, phytoplankton incubated with iron showed, within 24 - 48 hours, slightly elevated values of Fv/Fm compared with the controls (Fig. 13.1). When desferal (a natural iron complexing agent) was added to the natural phytoplankton, a strenger response was sometimes obtained. So, it seems to be that the natural phytoplankton was occasiona'ly iron stressed, but certc,inly not severely iron limited.
The experiments with the single species cultures of diatoms confirmed the results from the field studies. C. brevis, a species with typically low iron requirements, could not be grown into iron limitation without addition of desferal, a natuaral iron binding compound. In a gradient of increasing desferal concentrations, growth rates were increasingly limited, After transfer of a iron limited (desferal) culture of C. brevis to low light conditions, the cells were not capable to synthesize extra chlorophyll.
C. dichaeta, a chain forming diatom with higher iron requirements than C. brevis, could be grown into Fe limitation readily. A good dose-response relationship between iron and growth rates was established. Not only the growth rates but also the chain length (cells per chain) proved to be a good indicator of the iron status of the cells (Fig. 13. 2). Light also was an important factor determining growth rate: irrespective of the iron concentrations offered, C. dichaeta did not grow under a 12:12 hours 1ight:dark regime, growth was only possible under a typical long day light regime.

Figure 13.1. FvIFm in control (con) and Fe enriched (Fe) ~, natural phytoplankton (experiment 7), 24 hours after addition of the iron spike.
con Fe
Fig. 13.2. Percentage of chains of C. dichaeta with 1, 2, 3, 4, or 5 or more cells per chain in control and 2 nM iron addition incubations (note the differences in scales).
Finally, during the cruise first attempts were made to study intracellular markers of iron limitation in C. brevis. Using the FCM, diurnal dynamics in DNA and fatty acids were monitored in relation to iron concentrations in the seawater. Upon addition of iron to a iron limited culture of C. brevis it was found that enhanced DNA synthesis took place, whereas no changes in fatty acid composition were observed.
In conclusion, during ANTXVIl3 some signs of iron Stress in phytoplankton were found in the Southern Ocean. However, it is highly unlikely that the true oceanic phytoplankton species, with low iron requirements are iron limited under these conditions. Species with higher iron requirements might be iron stressed under the conditions encountered in the field. The FCM and especially the FRRF turned out to be powerful tools to make an assessment of the immediate effects of iron on phytoplankton.

14. LIGHT ADAPTATION BY NATURAL PHYTOPLANKTON POPULATIONS, AND ITS CONTROL BY IRON LIMITATION. M.A. van Leeuwe, T. van Oijen (RUG)
Introduction
The Southern Ocean is a turbulent area, with deep wind mixed layers. The Open ocean area is furthermore characterized by low concentrations of trace metals. The low biomass of phytoplankton, generally encountered in these regions, is hypothesized to be under control of the variable light climate and low iron concentrations (Chisholm et al. 1991). Iron is essential in photosynthesis, as it forms a structural component of the photosystems. An interaction of iron and light limitation can be envisioned, if iron-deplete cells are unable to use the available light. Previous experiments have shown that photosysthesis is indeed limited by iron limitation (van Leeuwe et al.1998). It was also found, however, that the pigment composition was not affected by iron limitation. This was confirmed in lab experiments, where it was found that the light utilization efficiency was target of iron limitation, whereas the absorption capacity of the cells was not affected (van Leeuwe & de Baar subm.), This led to the hypothesis that whereas on the long term photoadaptation by phytoplankton is not limited by iron limitation, short term adaptation may well be inhibited. Two aspects of photoadaptation were studied On this cruise.
Photoadaptation on a short time scale requires flexibility of the photosynthetic membranes (Kroon et al. 1994), and involves changes in cell metabolism. The integrity of the membranes is affected by iron limitation. Therefore, a quick re- sponse by the algae to changes in light conditions may be inhibited. To study the response in photosynthesis, fluorescence was measured. In addition, chlorophyll was analyzed. During periods of reduced photosynthetic activity, cells may use a storage pool of polysaccharides, to support a basic metabolism. Iron limitation results in a reduction in this pool, and thus affects the vitality of the cell under light Stress. Various cell metabolites, including carbohydrates, are studied to gain insight in the way cell metabolism is affected by iron limitation.
Material & Methods
1. Deck incubations
Deck incubations were performed to study the photosynthetic response of algae under natural conditions. At dawn, surface water was sampled using buckets, at several sites in the Polar Frontal region (Table 1). The plankton was incubated in 20L polycarbonate bottles (Nalgene) in a deck incubator, at 4 different light intensities (100, 60, 40, 20% of incedent irradiance). After 5 hrs of daylight samples were taken for fluorescence measurements and pigment composition. In addition, cellular fluorescence and cell size were recorded using flow cytometry. At sunset, and after 5 hours of darkness, samples were taken for carbohydrates, POC/PON, chlorophyll and flow cytonietry.

2. Iron-enrichment experiments.
a. Short term incubations
Sea water was enriched with iron, to study physiological responses of the phytoplankton community. Samples were taken with clean Go-Flo's attached to a teflon coated rosette frame (Table 1). Upon retrieval on deck, the Go-Flo's were mounted to the wall of a clean cooled container. The Go-Flo's were sampled through teflon tubing, which was led through the container wall. The clean sea water was incubated in acid-cleaned 20L polycarbonate bottles (Nalgene), at 80-100 pmol photons m" s" at a 12:12h light dark regime, at 2OC. Samples were taken in the late evening, early morning. After 24 and 36 hours, samples were taken for POC, chla, cell metabolites, and samples were taken for subexperiments.
The sarnples were spiked with ^C, and placed at 20 pmol and 100 pmol photons m'* s". At regular time intewals, samples were filtered. fractionation analysis at home will be performed to record the development of the storage pool of polysaccharides over the day. In addition, at t=24h and t=36 hours, samples were taken for POC/PON, ch1.a and carbohydrates.
Samples were placed at 20 and 100 p o l photons m" s". After 5 hours, fluorescence was recorded with a dual amplitude modulated fluorometer (PSI). After 36 hours samples were taken for ch1.a. In addition, at t=24h and t=36 hours, samples were taken for POC/PON, ch1.a and pigment composition.
b. Long term incubations.
A remaining questions is, whether or not iron limitation affects the C-N ratio of the cells. Light conditions may hereby play a crucial role (Stefels & van Leeuwe 1998). Sea water was sampled with the Go-Flo's either mounted on the rosette frame, or attached to a kevlar wire, and by sampling from the iron fish (see de Jong et al). The plankton was incubated in the clean cool container, in 2.5L polycarbonate bottles (Nalgene), at three different The plankton was incubated in the clean cool container, in 2.5L polycarbonate bottles (Naigene), at three different light intensities (ca. 100, 50 and 25 pmol photons m"2 s"). Growth and nutrient consumption was followed over several days (6-8). The time was given to allow any possible changes in cell metabolism, related to iron limitation, to become expressed in carbon and nitrogen content. At the end of the experiment, samples were taken for POC, PON and ch1.a.
Preliminary results.
1. Deck incubations.
The most prominent feature in the deck incubations, is the increase in cell size with increasing light intensities (Fig. 14.1). The changes in cellular fluorescence are less pronounced. A slight decrease in fluorescence with decreasing light intensities seems apparent On sunny days, On cloudy days cellular fluorescence seems to increase. The flow cytometer data have to be treated with care, especially since the delay between sampling time and measurement varied between samples, which did influence the considered Parameters. It can be concluded however, that cells do respond to changes in irradiance by varying their absorption capacity, on a relative short time scale. Changes in chlorophyll content have yet to be analyzed.

2. Iron-enrichment exweriments.
Data on the short term experiments are too preliminar to make any statements about. Considering the development of cell numbers on a short time scale, growth rates of the phytoplankton population were too low to distinguish any effect of iron iimitation (Fig. 14.2). Over a longer time Span, it is clear that growth is most optimal at the 50% light intensity, meaning ca. 40-50 pmol photons m" s". Notably, the non-enriched cells showed a faster increase in cell number than the iron-enriched cells (Fig. 14.2). The fluorescence pattems were similar for both the non-enriched and the iron-enriched cells (Fig. 14.3). Cellular fluoresence increases with decreasing light intensity. The cell size appeared smaller for iron-deplete than for iron-replete cells. Nutrient consumption shows a different Pattern (Fig. 14.4). Especially the phosphate data indicate that growth in the iron-enriched bottles picks up only after 4 days. At day 6, the iron-enriched cells clearly consumed more nutrients than the non-enriched cells.
It can be hypothesised that, when provided iron, the cells need some days to adjust to the new conditions, and to consume the iron. In the meantime growth appears arrested. Only when saturated with iron, growth starts again. Additional data On carbon and iron uptake might shed more led light On the processes controlling growth of the phytoplankton population at the Polar Front.
This work was supported by J. de Jong (analyses of iron concentrations) V. Schoemann (isotope experiments) G. Kattner, C. Hartmann, A. Ratje (nutrient analyses) M. Veldhuis & F. Brocken (flow cytometry) K. Timmermans & B. vd. Wagt (general assistance).

Table 1. Overview of the experiments performed during ANT XVIl3
experiment date location station comments sample
1. Deck incubations 1 26 March 2 27 March 4 31 March 5 1 April
2. short term iron enrichments 6 3 April 7 6 April 9 9 April 11 19 April 13 21 April 15 25 April 17 27 April 18 29 April 19 4 May
3, long term iron enrichments 3 29 March 8 7 April 10 16 April 16 27 April
Polar front Polar front Polar front Polar front
Polar Front Polar Front
Polar Front Polar Front Polar Front
Polar Front
bucket bucket bucket bucket
Go-Flo GO-FIo GO-FIo
Go-Flo de Jong GO-FIo GO-Flo Go-Flo Go-Flo GO-F10
iron fish Go-Flo exp.7
Go-Flo de Jong iron fish
20 5 100 60 20
% incident light
B size i fluorescence -- -- -
Fig. 14.1. Cell size and cellular fluorescence as determined by flow cytometry for experiment 4. Samples were measured at t=0, t=6.5 and t=12 hours. Large cells are excluded by the flow cytometer.

0 1 2 3 4 5 6 7
--- - -- - -- - time (days) -
Fig. 14.2. Cell growth of natural phytoplankton populations over the Course of six days, for iron enriched (open symbols) and non enriched bottles (filled symbols) of experiment 3. Plankton populations were incubated at three different light intensities.
I00 50 25 100 50 % 100 50 25 100 5.0 25 100 50 25 100 50 25
control 2 nmol Fe control 2 nmol Fe controi 2 nmol Fe 4
% irradiance -- - - - - -- - - - - -- -- - -- -- -- -
Fig. 14.3. Cell size and cellular fluorescence as determined by flow cytometry for experiment 3. Samples were measured at t=2, 4 and 6 days. Plankton populations were incubated at three different light intensities.

0 2 4 6
time (days)
0 2 4 6 8
time (days)
Y C o n t r ~ ~ , i o o % ' m - control, 50% -&- control, 25% 1 4- 2 nM Fe, 100% n 2 nM Fe, 50% -A- 2 nM Fe, 25% L--
0 2 4 6 8
time (days)
Fig. 14.4. Concentrations of nitrate, phosphate and silicate in the incubation bottles of experiment 3, for iron-enriched (open symbols) and non-enriched bottles (filled symbols).
Table 2: Samples for pigment distribution and for particulate carbohydrate were taken at the following stations:
pigrnent distribution 151 (10, 30, 50, 75rn depth) 153 (20, 60m) 154 (20,60m) 156 (10, 20, 40, 60, 80, 100rn) 157 (as 156) 161 (as 156) 1 62 (as 156) 1 63 (as 156) 164 (as 156) 165 (as 156) 1 66 (as 156) 167 (as 156) 168 (as 156) 181 (20, 40 60, 300m) 190 (as 156) 197 (as 156) 198 (as 156) 199 (as 156) 200 (as 156) 202 (as 156) 203 (as 156) 204 (as 156) 205 (as 156) 207 (as 156)
particulate carbohydrate 153 (20, 60m) 154 (20,60m) 156 (10, 20, 40, 60, 80, 100m) 1 62 (as 156) 1 63 (as 156) 1 64 (as 156) 165 (as 156) 166 (as 156) 167 (20,40,60,80,1 00rn) 168 (as 156) 181 (20, 40 60,300m) 1 90 (as 156) 1 97 (as 156) 1 98 (as 156) 199 (as 156) 200 (as 156) 202 (as 156) 203 (as 156) 204 (as 156) 205 (as 156)

In addition, several surface waters samples for pigment distribution were taken from the ship's sea water supply, covering the box (04.1-04.10), and on transect towards the continent. After filtration over GFIF Whatmann filters, samples were quick-frozen using liquid nitrogen, and thereupon stored at -80°C At the home laboratory, the samples will be analyzed using HPLC, according to Gieskes & Kraay (1 992).
For particulate carbohydrate, several surface waters samples were taken from the ship's sea water supply, covering the box (04.1 -04.10). Samples were filtered over GFIF filters Whatmann and stored at -20 OC. At the home laboratoty, the samples will be analyzed using GC.
References
Chisholm, S.W. & Morel, F.M.M. (1991) Limnol. & Oceanogr. 36: 1851-1864 Kraay et al. 1992 J. Phycol.28:708-712 Kroon, B.M.A. ( 1 994) J. Phycol. 30: 841 -852 Stefels, J. & van Leeuwe, M.A. (1998) J. Phycol. 34: 486-495 van Leeuwe, M.A. Timmermans, Witte, H.J., Kraay, G.W., Veldhuis, M.J.W. & H.J.W.
de Baar 1998 MEPS 166:43-52 van Leeuwe, M.A. & H.J.W. de Baar subm. Eur. J. Phycol.

15. KRILL BIOLOGY AND KRILL PHYSIOLOGY A. Atkinson (BAS), U. Bathmann (AWI), B. Meyer-Harms (AWI), K. Schmidt (IOW), D Stübin (Uni. B)
15.1 General outline
The biology of Antarctic krill Euphausia superba during sea-ice formation is rarely known. Integrated research on international level is organised by the IGBP Programme Southern Ocean GLOBEC (Global Ocean Ecosystem Dynamics) to study mechanisms and processes which allow the sustainability of the standing stocks of the Antarctic krill throughout an annual cycle. A crucial time period is autumn and winter as food during this time period of about 6 to 8 months in the pelagic environment gets very sparse. The following overwintering strategies are discussed in the scientific literature: utilisation of ice algae andlor zooplankton (mainly copepods), starvation in conceri with reduced metabolisms or with utilisation of body proteins, lipid reserves. Investigations of all these aspects simultaneously are missing so far and, thus, were conducted here. The investigations will be carried out during two expeditions with RV POLARSTERN, the first being ANT XVI/3, and field studies at ROTHERA Antarctis Station, all sponsered by a BMBF project.
The main objectives of the current project were to establish: 6. if, when and what feed larvae and adult krill during the overwintering period, and 7. to determine available food sources for krill, and 8. to quantify specific ingestion and assimilation rates for single developmental
Stages of E. superba.
These objectives are essential for better understanding of the reproduction success and therefor for krill stock assessments.
Field observation and sampling
In the Open ocean in the vicinity of Maud Rise, no krill swarms were found. Instead salps, jelly pelagic tunicates dominated the mesozooplankton of the otherwise plankton poor water column. In contrast, krill swarms were recorded on intensive search cruise tracks in the ice covered area of the Antarctic Coastal Current and the shelf slope (Fig. 15.1).
The swarms appeared to be patchily distributed and apparently concentrated in the front between the Coastal Current and Weddell Gyre. Vertical profiles of the ship mounted Acoustic-Doppler-Current-Profilers (ADCP) indicate that during night time swarms migrated up the water column to 50 to 150 m while during day they decend well below 400 m water depth (Fig. 15.2).
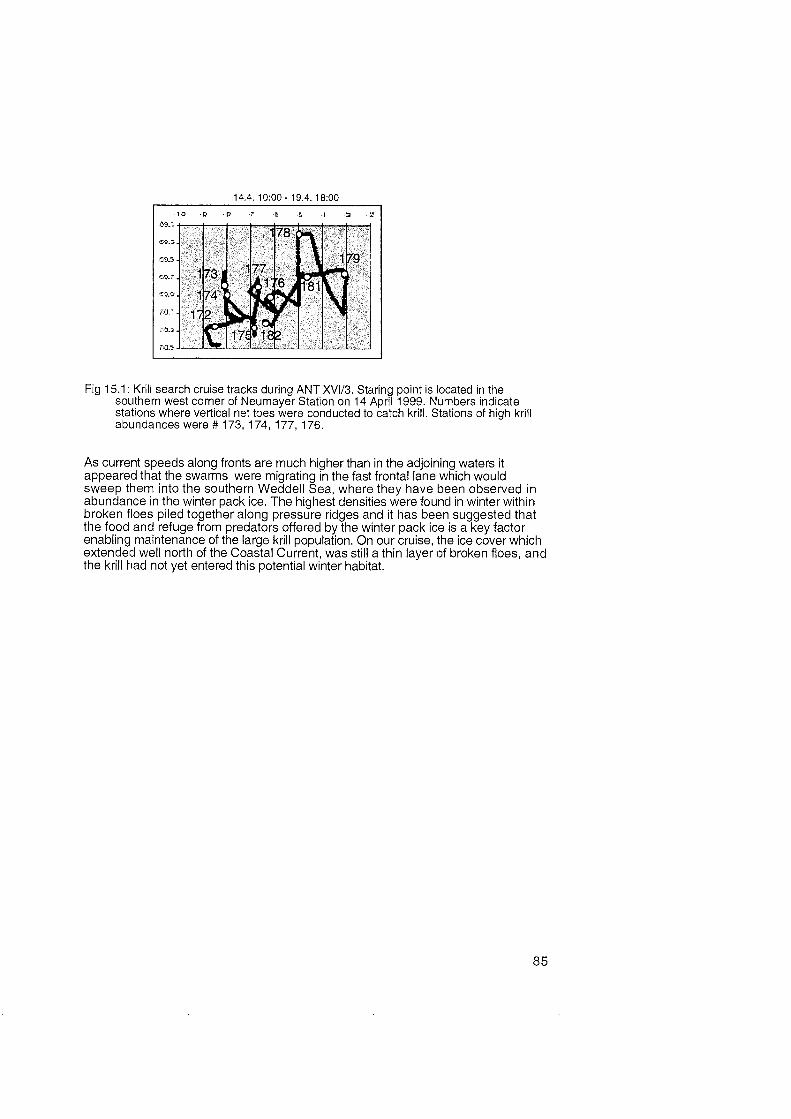
Fig 15.1: Krill search cruise tracks during ANT XVIl3. Staring point is located in the southern West Corner of Neumayer Station on 14 April 1999. Numbers indicate stations where vertical net toes were conducted to catch krill. Stations of high krill abundances were # 173, 174, 177, 176.
As current speeds along fronts are much higher than in the adjoining waters it appeared that the swarms were migrating in the fast frontal lane which would sweep them into the southern Weddell Sea, where they have been observed in abundance in the winter pack ice. The highest densities were found in winter within broken floes piled together along pressure ridges and it has been suggested that the food and refuge from predators offered by the winter pack ice is a key factor enabling maintenance of the large krill population. On our cruise, the ice Cover which extended well north of the Coastal Current, was still a thin layer of broken floes, and the krill had not yet entered this potential winter habitat.

Fig. 15.2: Back scatter (AGC) and corrected back scattering Signals (b) by migrating zooplankton and krill detected from the downward looking, ship mounted ADCP during the 24 hrs of 18 April 1999 of the upper 250 m water column. Latitude (C) and longitude (d) of ships position is also given versus time on day 105 of the year 1999. Courtesy by Jens Langredder.

15.2. Examining overwintering strategies of Antarctic krill (Euphausia superba)
During Summer krill are considered to be mainly herbivorous, feeding On phytoplankton, but the scarcity of algae during autumn and winter has raised questions On how krill survive this long dark season of ice Cover. Suggested overwintering strategies include: 1) reduction in metabolic rate, 2) utilisation of lipid stores, 3) body shrinkage, 4) feeding on ice algae and 5) switching to camivorous feeding. Our aim was to examine these strategies simultaneously at the onset of winter, comparing the responses of adult krill, juveniles and furcilia larvae.
The first component of the project was to catch various maturity stages of krill and freeze them immediately, for later laboratory analysis. This will include determination of elemental composition, nitrogen isotope ratios, lipid Store and analysis of stomach content to determine both whether they were feeding and the major dietary items. Approximately 200 adults and juvenile krill and numerous furcilia were frozen from 2 main locations at the shelf break (locations See above). Examination of juveniles and adult krill showed that they were indeed feeding at the time of capture, but probably at low rates as very little food was Seen in their guts. Alongside the netting for krill, potential food sources were characterised by vertical (0 to 200 m depth) tows with a Bongo net for zooplankton food sources and water bottle profiles for microplankton food sources. There were substantial numbers of copepods (chiefly Metridia gerlachei and Calanus propinquus in the vicinity of the krill swarms we fished, although water column fluorescence was at the lower detection units of our fluorometer. We did not observe krill in the immediate vicinity of the ice, and the aggregations we sucessfully caught krill from were Seen On the ADCP at mainly in > 50 m depth. However, ice algae were a potential food source, as evident by localised brown discoloration of the ice. Ice algae were collected, analysed and used as food for krill, although a high degree of patchiness precluded its biomass quantification on an areal basis.
The second part of the study was to complete a series of laboratory experiments to determine feeding, respiration and excretion rates of furcilia, juvenile and adult krill. Values for freshly caught individuals were compared with those acclimated to a variety of feeding regimes; namely filtered seawater (i.e. starvation), natural sawater, natural sawater plus ice community and, for juveniles and adults, natural seawater plus ice community and copepods. Because of patchiness it is not possible to determine precisely the concentrations of that foraging krill may encounter, so we gave them this varierty of food types and concentrations to estimate their physiological response to both type and quantity of food. The method was to maintain batches of krill for 10 day periods, during which they were allowed to feed On one of the above food regimes for 24 hours to monitor diet and feeding rate. Then they were switched to filtered seawater for 24 hours to measure their respiration and ammonium excretion rate, after which the cycle was repeated, retuming the krill to their given food regime. Container sizes were as large as possible to allow free swimming of the krill while rates were measured. For adults and juveniles 50 - 60 L containers were used for feeding and 12 L for respiration and excretion while for the 7 to 8 mm long furcilia, 2.5 L containers were used.

Table 15.1 : Preliminary results of juvenile and adultkrill feeding rates On Metridia gerlachei and Calanus propinquus .
Table 15.2: Ammonium excretion, respiration rates and oxygen (0) and nitrogen (N) ratios of freshly caught animals (FCA), starving adults and furcilia (SK) and animals feeding On natural seawater (NSW), natural seawater plus ice community (NSW + IC) and On natural seawater plus ice community plus copepods (NSW+IC+C) prior to incubation.
Date
20.4.99 22.4.99
Provisional clearance rate on Metridia gerlachei and Calanus propinquus (ml mg DM h")
g excretion rates (pg NH4 mg UM h")
Feeding rates of krill obtained in the laboratory are partly dependent on the method used (e.g container volume, etc.) but our initial impression is that, while krill were indeed feeding both in the laboratory and in the wild, within the 10 day timescale of our experiments, they did not fully utilise the high food concentrations offered. For instance, using a similar experimental settup at South Georgia during summer, clearance and ingestion rates on copepods were about 5 to 10 times higher than found On this cruise. Preliminary results of juveniles and adult feeding rates On Metridia gerlachei and Calanus propinquus are are shown in Table 15.1.
juvenile krill ca. 40 mg DM)
1.4 2.4
I-CA l l l l + C
Excretion and respiration rates show a more varied picture (Table 15.2). For adults and juveniles ammonium excretion rates were 30% of representative Summer values, although respiration rates were within the wide range of summer values. Mass specific respiration and exretion rates for furcilia were 5 to 9 times greater than for adult krill, probably reflectingtheir ca. 1000 X smaller size than adults.
adult knll (ca. 190 mg DM)
1.1 0.9
SK I NSW l NSW+IC I NSW + IC
0,015 0.012 respiration rates (pg 0, mg DM h")
0.01 0
1 0.51 5
0.01 7 1 0.018
n/N ratin 0.886 0.885 1 0.834

16. Zooplankton at the Antarctic Polar Front R. Alheit, A. Atkinson, U .Bathmann, B. Meyer-Harms
In previous cruises to the Polar Front at the Atlantic Sector of the Southem Ocean during spring and summer, zooplankton of the upper 200m water column was dominated by small calanoid and cyclopoid copepods. In 1992, south of the Front, salps dominated the othetwise poor plankton communities of the southern ACC. Grazing rates of medium to large sized copepods norih of the front were calculated to be less than 3 percent of daily primary production, and, thus, negligible for top down control of primary producers. In contrast, the grazing rates of the small sized zooplankton below 1 mm body length might be high enough to reasonably control phytoplankton biomass.
Our aim of the study was to test ...
i) if the high standing stocks of small sized copepods prolong during austral autumn in the vicinity of the Polar front and
ii) if the grazing of this community might be sufficient to control phytoplankton standing stocks, we performed our sampling Programme and laboratory experiments during the study of physics and biology at the Polar Front in autumn 1999.
Sampling Programme
The sampling of the zooplankton of the upper 1000 m water column was per- formed by means of an multinet equipped with 5 (small version) and 9 (large version) nets of 55 or 100 um mesh size. Vertical hols were located between ths standard depths of 1000, 500, 200, 100, 50 an 0 m, respectively. Samples were prepared for further analysis of species and developmental stages in buffered formalin, or for genetic analysis and determination of lipid content by freezing individuals.
Feeding experiments with Oithona
On some stations Apstein nets were pulled by hand in the upper 30 m water column to retrieve living Oithona species. 200 of adult femals were sorted under the dissection microscope directly after capture and transfered into filtered sea water of ambient temperature.
Six feeding experiments were done on Oithona spp. (< 90% 0. similis) in the vicinity of the Polar Front, four during the first visit (27, 28, 30 March and 5, 9 April) and one during the second visit (5 May). Individuals were collected gently with a 55 micron hand net and incubated in mixed layer seawater enriched with large diatoms. Both the rates and selectivity of feeding On natural particulate material will be determined by a combination of microscopic and HPLC analysis.
Preliminary analysis On the 3 rd and 5 th experiments showed that the large diatom taxa (e.g. Corethron penatum, ßhizosoleni spp, Thalassiothrix spp. were cleared at high rates (about 1000 ml per mg dry mass per day), while clearance rates on the characteristic Polar Front diatom Fragilariopsis kerguelensis were negligible.

Likewise the smaller diatoms, Pseudonitzschia spp. and Chaetoceros spp. were avoided. Methodological problems precluded offering the copepods ambient (i.e. average') food concentrations, but at enriched concentrations, estimated carbon rations exceeded 50% of body carbon per day.
These provisional results suggest that Oithona similis can eat the large, bloom forrning diatoms which are of similar lengths to themselves. The abundances of Oithona spp. obtained with the multinet will be combined with their clearance rates to estimate their potential impact on the standing stocks of specific microplankton taxa.

17. BIOMASS PRODUCTION, SUBSTRATE DYNAMICS AND COMMUNITY STRUCTURE OF THE HETEROTROPHIC PICOPLANKTON AT THE POLAR FRONT AND THE WEDDELL SEA IN FALL M.Simon (Uni O), B. Rosenstock, W. Zwisler LIUK)
Introduction
The Polar Front of the Southern Ocean is one of the major global regions for the export of organic carbon out of the oceanic surface layer and thus of key importance for the global carbon cycle (Falkowski et al. 1998). The rate of export and sinking through the mesopelagic Zone is controlled by various factors such as nutrient depletion, senescence of diatoms, and zooplankton grazing but also to a great extent by the consumption of organic matter and its oxidation to COn by the heterotrophic picoplankton (HPP). Yet, still little work has been done to study and understand the seasonal variation of the plankton dynamics and the role of the HPP at the Polar Front. Even less is known about the structural composition of the HPP and its dominant components in the Southem Ocean (Massana et al. 1998, Murray et al. 1998, Simon et al. 1999). During the cruise ANT XVIl3 with RV Polarstern from 18 March to 10 May 1999 we carried out studies in this context and asked the following questions:
What are the rates of biomass production and tumover of labile and refractory dissolved organic matter (DOMlab, DOMã,, by HPP during the austral fall?
In which respect does UV-B irradiation affect the turnover and availability of DOMmb and DOMref and the biomass production of HPP?
How is the community of the HPP composed at the Polar Front and the Weddell Gyre and how does it relate to dynamics of DOM,,,, and DOMFe,?
We performed three consecutive studies on a transect at the 20 OE meridian from 48.30 to 54 O S between 25 March and 4 May 1999 at a total of 15 stations (Nr. 153, 154, 156, 157, 163, 165, 166, 167, 190, 197, 198,200,201,202,203) and compared them to the Weddell Gyre (stations 169, 185) and the Antarctic coastal current under the pack ice (stations 174, 182).
Methods
Numbers of HPP were counted by standard epifluorescence microscopy after DAPI staining. Their biomass production was measured by the leucine method using ̂ C-leucine at a final concentration of 10 nM (saturating concentration) and assuming a 2-fold intracellular isotope dilution (Simon & Azam 1989). Turnover rates of H-amino acids, 3H-glucose and ̂ C-protein were determined by adding 0.1 nM and 5 nM (protein) of the label to water samples and measuring the fraction of label taken up per hour. We also took samples for the analysis of dissolved free and combined amino acids and carbohydrates and dissolved organic carbon (DOC) which were kept at -25 'C and will be analyzed later in the home lab. So we will be able to determine uptake rate of free amino acids and carbohydrates and relate them to the carbon demand of the HPP.
The consumption of various fractions of DOM by HPP was determined in dilution cultures growing at ambient temperatures on isolated humic and non-humic DOM of low and high molecular weight (LMW, HMW) separated by ultrafiltration of 3000 Da (filtrate and retentate). The humic fractions were separated on XAD-2 raisins and re-added to the dilution cultures at approximate in situ concentrations.

The effects of UV-irradiation on DOM and the growth and substrate utilization by HPP were investigated by on deck-incubations at in situ temperature for 3 to 5 days of 0.8 um (HPP) and 0.2 um filtered (DOM) samples in quartz bottles and relative to a dark control. UV-B and UV-A were excluded with MylarD and polyethylene foil, respectively. To examine photochemical effects on DOM and its availability to consumption by HPP concentrates of HPP (from the particle-free water) were kept in the dark at in situ temperature and added again to the DOC after incubation for one day. Responses to the various treatments by HPP and DOM were measured by HPP abundance, production and uptake of 'H-amino acids and 'H-glucose, the consumption of the humic and non-humic fractions of DOC, dissolved amino acids and carbohydrates.
The community structure of the HPP is being assessed by fluorescent in situ hybridization with rRNA-targeted oligonucleotide probes (FISH, Amann et al. 1995) and by the analysis of PCR-amplified fragments of the 16s rDNA by denaturing gradient gel electrophoresis (DGGE; Muyzer et al. 1993). On various profiles and during the Course of the experiments On the consumption of LMW- and HMW-DOM and UV-effects samples for DGGE and FISH were filtered onto 0.2 um Nuclepore filters and the latter fixed with paraformaldehyde (4% in PBS buffer, pH 7.2). They will be further processed in the lab at home. Previous work showed that the FISH method is well suitable for such studies (Simon et al. 1999).

Results and discussion
At the Polar Front, numbers of HPP between 20 and 200 m ranged from 1.5 to 5.8x10⁸ 1" with highest numbers in the upper 100 m which covered the depth of the mixed surface layer. Typical pattems of the vertical distribution are given in Fig. 17.1. The highest numbers, but not biomass production, of a single profile occurred at the end of the survey north of the Polar Front at station 203. Biomass production rates of HPP in the upper 200 m ranged between <2 and 29 ng C I" h"' and most values in the upper 100 m between 10 and 25 ng C I" h"(Fig. 1). Numbers and biomass production often did not covary but showed inverse relationships, i.e. at peaks of production relatively low numbers occurred. Turnover times of dissolved free amino acids and protein in the upper 100 m varied between ca. 5 and 30 days and increased with depth. Usually they were shorter than that of glucose but the latter often was relatively shorter in the upper mesopelagic Zone (Fig. 17.1).
Integrated values of the biomass production of HPP in the upper 200 m ranged between 30 and 78 mg C m" d" with the highest value at 52 OS at the beginning of the study (Fig. 17.2). Values in the region of the Polar Front, i.e. between 49 and 50 OS, and at two bloom situations at 52 and 54 OS in late March and early May were enhanced as compared to other stations. Even though some variations occurred at the Polar Front it was surprising how close integrated values remained at single locations but measured one to six weeks apart. Production rates integrated for the water column below the mixed layer, from 125 to 1000 m, ranged from 20 to 66 mg C m" d" with a pronounced and persistent maximum at the Polar Front (Fig. 17.3). The organic matter available to consumption by HPP below the euphotic Zone and the mixed layer predominantly is provided by sinking particulate organic matter or carbon (POM, POC) originating from the phytoplankton in the mixed layer and being decomposed and partly dissolved by particle-associated microbes (Smith et al. 1992). Thus, the consumption of organic matter by HPP below the mixed layer provides a minimum estimate of the POM export flux from the mixed layer (Cho & Azam 1988). Assuming a gross growth efficiency of the HPP as 30%, a typical value found in many aquatic environments (Smdergaard & Middelboe 1995), total consumption of organic carbon by HPP below the mixed layer amounts to 60 to 200 mg C m" d" and mean values of 105 to 130 mg C m" d" at the Polar Front. These numbers should be equivalent to the minimum export flux of POC.

0 CD 0 0)
.P M
(&l)qiija& 8 0 CD. CD
Fig. 17.1: Depth distribution of numbers and production (BPP-C, left panel) and of turnover times of free amino acids (DFAA), protein and glucose of heterotrophic picoplankton (right panel) at stations 201 (49O 30.0' S, 20 'E) and 203 (48' 30.0' S, 20 OE) on 3 May 1999 at the Polar Front .

Fig. 17.2: Production rates of the heterotrophic picoplankton integrated from 0 to 200 m
along 3 transects at 20 'E across the Polar Front in the austral fall 1999.
Latitude S
7 0 - ,
Fig. 17. 3: Production rates of the heterotrophic picoplankton integrated from 125 to 1000 m along 2 transects at 20 'E across the Polar Front in the Austral fall 1999.
: -
50
40 30 L 1
20 :
10 -
2-4 May 25-27 March P i
/ /
A\ / /
I+// / ^ 156 157 154 153
. 0 -
T-
4 8 ' 4 ' 9 * m 5'0 61 52 53 34
203 201 200 198 197 190
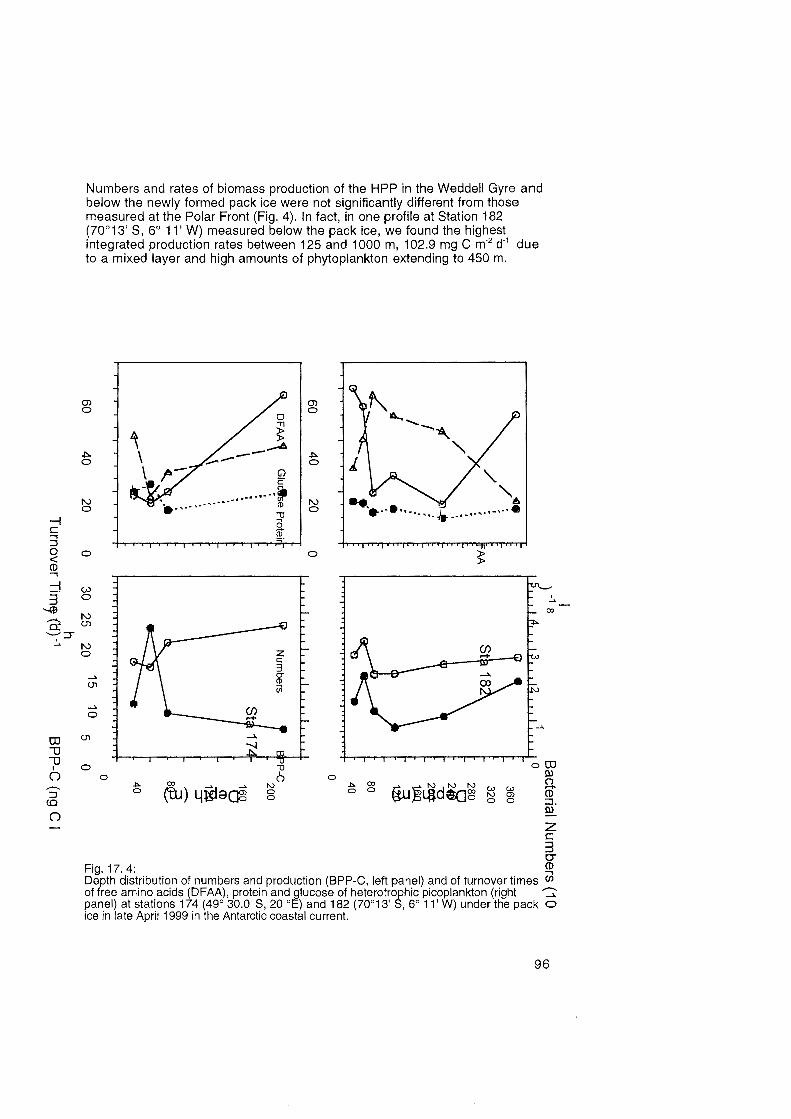
Numbers and rates of biomass production of the HPP in the Weddell Gyre and below the newly formed pack ice were not significantly different from those measured at the Polar Front (Fig, 4). In fact, in one profile at Station 182 (70°13 S, 6O 11' W) measured below the pack ice, we found the highest integrated production rates between 125 and 1000 m, 102.9 mg C m" d"' due to a mixed layer and high amounts of phytoplankton extending to 450 m.
(D. 1 8 ~ ~ l - ~ . l ~ ~ ~ ~ ~ ~ . - - l ~ i
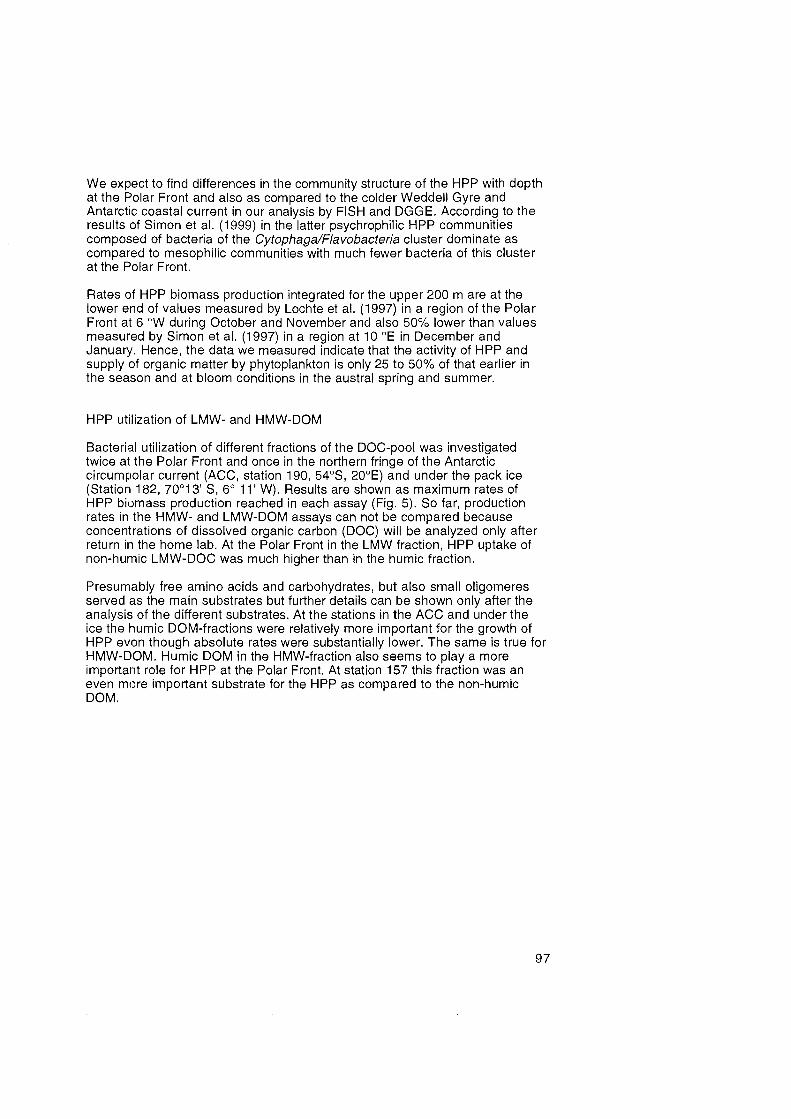
We expect to find differences in the community structure of the HPP with depth at the Polar Front and also as compared to the colder Weddell Gyre and Antarctic coastal current in our analysis by FISH and DGGE. According to the results of Simon et al. (1999) in the latter psychrophilic HPP communities composed of bacteria of the Cytophaga/Flavobacteria cluster dominate as compared to mesophilic communities with much fewer bacteria of this cluster at the Polar Front.
Rates of HPP biomass production integrated for the upper 200 m are at the lower end of values measured by Lochte et al. (1997) in a region of the Polar Front at 6 'W during October and November and also 50% lower than values measured by Simon et al. (1997) in a region at 10 OE in December and January. Hence, the data we measured indicate that the activity of HPP and supply of organic matter by phytoplankton is only 25 to 50% of that earlier in the season and at bloom conditions in the austral spring and summer.
HPP utilization of LMW- and HMW-DOM
Bacterial utilization of different fractions of the DOC-pool was investigated twice at the Polar Front and once in the northern fringe of the Antarctic circumpolar current (ACC, station 190, 54OS, 20°E and under the pack ice (Station 182, 70°13 S, 6' 11' W). Results are shown as maximum rates of HPP biomass production reached in each assay (Fig. 5). So far, production rates in the HMW- and LMW-DOM assays can not be compared because concentrations of dissolved organic carbon (DOC) will be analyzed only after return in the home lab. At the Polar Front in the LMW fraction, HPP uptake of non-hurnic LMW-DOC was much higher than in the humic fraction.
Presumably free amino acids and carbohydrates, but also stnall oligomeres served as the main substrates but further details can be shown only after the analysis of the different substrates. At the stations in the ACC and under the ice the humic DOM-fractions were relatively more important for the growth of HPP even though absolute rates were substantially lower. The Same is true for HMW-DOM. Humic DOM in the HMW-fraction also seems to play a more important role for HPP at the Polar Front. At station 157 this fraction was an even more important substrate for the HPP as compared to the non-humic DOM.

Polarfront 49,3S 20,OE 40m (St157)
Polarfront 49,6S 20,OE 60m (St 166)
ACC 54,OS 20,OE 40m (St 190)
Under lce 70,2S 6, lE 40m (St 182)
Production of HPP (ng C I-' h-') on
Low Molecular DOM < 3000 Dalton
non-Hurnic Hurnic
High Molecular DOM > 3000 Dalton
non-Hurnic Hurnic
Fig. 17. 5: Utilization of humic and non-humic DOM of low- and high- molecular weight by HPP at four locations in the Southern Ocean.

The effect of UV-irradiation on HPP and DOM was investigated at three different locations in the Southern Ocean. The activity of HPP decreased with the wavelength from the dark control over PAR to UV-A and UV-B, indicating a detrimental effect On the HPP of short-wave irradiation. On the other hand, HPP activity and growth rates increased when they utilized the sunlight- exposed DOM relative to a control with non-exposed DOM. Hence, the lability of the DOM was enhanced after exposure to sunlight. When the HPP of various depths was exposed to full light conditions (PAR, UV-A, UV-B) the responses differed substantially (Fig. 6). With increasing depth there was a remarkable increase in the growth and substrate uptake relative to the dark control, indicating that the HPP at greater depths was less susceptible to short- wave irradiation and that in the upper water layers HPP seeni to be more sensitive to UV-radiation.
Abundance Heterotrophic Picoplankton Production DFAA-uptake Glucose uptake
Effect o f UV-radiation (% dark control)
Fig. 17.6: Effects of full-light (PAR, UV-A, UV-B) on the abundance, production, and uptake of amino acids and glucose of HPP of various depths from three stations relative to a dark control.

REFERENCES
Amann, R. l., Ludwig, W., Schleifer, K.H. 1995. Phylogenetic identification and in situ detection of individual microbial cells without cultivation. Microbiol. Rev. 59: 143-169.
Cho, B.C., Azam, F. 1988. Major role of bacteria in biogeochemical fluxes in the ocean's interior. Nature 332: 441 -443.
Lochte, K., Bjernsen, P.K., Giesenhagen, H., Weber, A. 1997. Bacterial standing stock and production and their relation to phytoplankton in the Southern Ocean. Deep Sea Res. 44: 321 -340.
Massana, R., Taylor, L.T., Murray, A.E., Wu, K.Y., Jeffrey, W.H., DeLong, E.F. 1998. Vertical distribution and temporal variation of marine plankton archaea in the Gerlache Strait, Antarctica, during early spring. Limnol. Oceanogr. 43: 607-616.
Murray, A.E., Preston, C.M., Massana, R., Taylor, L.T., Blakis, A., Wu, K.Y., DeLong, E.F. 1998. Seasonal and spatial variability of bacterial and archaeal assemblages in the coastal waters near Anvers Island, Antarctica. Appl. Environ. Microbiol. 64: 2585- 2595.
Muyzer, G., De Waal, E.C., Uitterlinden, A.G. 1993. Profiling of complex microbial populations by denaturing gradient gel electrophoretic analysis of polymerase chain reaction-amplified genes coding for 16s rRNA. Appl. Environ. Microbiol. 59: 695-700.
Simon, M., Azam, F. 1989. Protein content and protein synthesis rates of planktonic marine bacteria. Mar. Ecol. Prog. Ser. 51 : 201 -21 3.
Simon, M., Rosenstock, B., Hennes, K. 1997. Bacteria, viruses and marine Snow. Fahrtbericht der Expedition ANT XII112. Berichte z. Polarforschung 221 : 107-1 12.
Simon, M., Glöckner F.O., Amann, R. 1999. Different community structure and temperature optima of heterotrophic picoplankton in various regions of the Southern Ocean. Aquat. Microb. Ecol., in press.
Smith, D.C., Simon, M., Alldredge, A.L., Azam, F. 1992. Intense hydrolytic enzyme activity on marine aggregates and implications for rapid particle dissolution. Nature 359~139-142.
Sendergaard, M., Middelboe, M. 1995. A cross-system analysis of labile dissolved organic carbon. Mar. Ecol. Prog. Ser. 11 8: 283-294.
Acknowledgments
We are most grateful to the excellent support by the Crew of the RV Polarstern under the leadershlp of captain U. Pahl. This work was supported by a grant from the Deutsche Forschungsgemeinschaft awarded to MS (Si 36011 1-1).

18. CENSUSES OF MARINE BIRDS AND MAMMALS J.A. van Franeker (IBN-DLO)
INTRODUCTION
The interdisciplinary approach in Polarstern's JGOFS and GLOBEC studies in the Southern Ocean offers an excellent framework for gaining knowledge of the pelagic ecology of marine top predators, as their numbers and distribution can be viewed in the ligth of physico-chemical and biological conditions in their environment. The obtained information can assist in the compilation of population estimates for Antarctic species and in the identification of particular environments or geographical areas on which they depend (van Franeker 1996, van Franeker et al. 1999). Such information is needed in issues of management of the Antarctic environment, for example in the framework of the Convention on the Conservation of Antarctic Marine Living Resources (CCAMLR). The links between top predator populations and their main prey such as krill are a major objective in SO-GLOBEC studies.
Although previous study showed that Antarctic top predators play a minor role in terms of direct carbon consumption (van Franeker et al. 1997) , they may be a forcing power in the ecosystem structure. Moreover, their species composition, abundance and distributional Patterns may assist in revealing trophic structure and abundance of lower ecosystem levels not easily studied directly (van Franeker et al. subm.). Top predators thus can contribute significantly to the understanding and quantification of carbon fluxes in marine Systems.
METHODE
Observations of seabirds, seals and whales were made from an outdoor observation post installed on top of the bridge of Polarstern. The unobstructed clear view to all sides is required for quantitative observations. Only from this position it is reasonably possible to identify which birds are associated with the ship and have to be omitted from quantitative density counts. Bird observations are based on the snapshot method (Tasker et al. 1984) which has an advantage over the BIOMASS (1 984) method in that it accounts for bias by bird movement. Quantitative differences between snapshot and BIOMASS methods have been evaluated in van Franeker (1 994). As far as possible, additional bird data during ANTXVI-3 were collected to continue the calibration between methods, not only to BIOMASS, but also the vector method of Spear et al. (1 992) which offers an alternative way to avoid bias from movement.
Birds as well as seals are counted in a band transect in time blocks of ten minutes from the moving ship. Ship speed and transect width can be used to convert observed numbers of animals to densities per unit of surface area for each ten- minute period. The width of the transect band for seals and birds usually was 300m, taken as 150m to each side of the ship. Depending on viewing conditions such as seastate, light level and glare, the transect width was adapted to allow optimal quantitative observations. For seals and whales, line transect methods (Hiby and Hammond 1989) were used simultaneous with the band transect methods. Although band-transect methods were the standard method for seal censuses (Laws 1980), the Antarctic Pack Ice Seal Program (APIS) now recommends line-transect methods where possible (SCAR Group of Specialists on Seals 1994; Anonymous 1995). Dedicated whale surveys use line-transect methods as a standard (Hiby and Hammond 1989), but these are not always possible in studies like this one due to the low number of animals observed.

In this report 'effective transect widths' for different whale groups were estimated to make calculations. Preliminary results in this paper are thus all based on the band- transect System. Methods to convert top predator densities to their daily food- or carbon requirements are based On published literature of field metabolic rates and were described in detail in Van Franeker (1 992) and Van Franeker et al (1997). Data for seals were adjusted for diumal changes (Erickson et al. 1989) using personal data on haul-out behaviour of the Crabeater Seal.
In addition to the quantitative counts, qualitative information was collected on the occurrence of species outside transect bands or during oceanographical stations.
Ten-minute records of ice conditions were made in assodation with the top p redator study . These p rovide small-scale details that add to the ice ob servations according to the SO-JGOFS p rotocol (Gamty, this issue). The 10-minute b ird and ice obsetvations are induded in the 'ANTXVI-3 surface-database' which combines the whole m g e of continuous measurements from the surface layer, For information on ice obsetvations in assodation with top predatorcounts, See Van den Brink& van Franeker (1 997).
RESULTS AND DISCUSSION
From Cape Town ANTXVI-3 cruised southwards to the Antarctic Polar Front (APF) near the 20°Eas meridian to conduct a detailed grid in the frontal area. Bird obsetvations were started well north of the APF. From there we made a long transect southwest to Neumayer for krill and ice studies in the seasonal ice Zone. Long transect and APF grid were repeated during the northward voyage. For details on transects See elsewhere in this issue.
In total 1096 ten-minute top predator observations were conducted during the ANTXVI-3 cruise during transects south of 40's. Most of these, 1034 counts were systematic density counts, the remainder being initial trials or non-systematic counts during very poor weather conditions. A large number of counts was conducted in the APF area between 49' and 50' South (337 counts), but the remainder was fairly evenly distributed among all latitudes south into the seasonal ice Zone and the shelf edge near Neumayer. A full list of all species of marine birds and mammals observed during transects south of 40° is given in Appendix 1 with three indicators of abundance. 'Nr seen' refers to the total number recorded, including ship associated birds. By comparing this figure to 'avg dens' the average density (n/km2) during the whole cruise, it is possible to obtain an Impression of the level of ship-attraction in the different species. Finally, the 'max dens' column provides information on the maximum density recorded in any of the 10 minute counts. Relative species composition, distribution and abundance differed from those observed during the earlier studies in this area (van Franeker et al. 1997; van Franeker & van den Brink 1997) showing seasonal influences and changes in phytoplankton bloom areas and sea ice distribution.
Quantitative data on toppi-edators and associated ice observations (cover, floesize, floedevelopment and bergs), have been included in the SO-JGOFS Surface Registration Database which is available to participants. Top predator data inserted into this database are, for each available 10 min period, density (individuals/km2), biomass (kg/km2), and carbon consumption rates (mgC/m2/day) of the combined top predator community, viz. birds, seals and whales.
A Summary of data in the surface database is given in Fig. 18.1 and 2 as the averages of density, biomass and carbon consumption per degree of latitude.

Comparison of the graphs illustrates that, at least in ecosystem studies over larger areas, data On abundance (density) and biomass of top predators (Fig.l) are poor descriptors of their role in the system. The highly variable proportions of tubenosed seabirds, penguins, seals and whales in the community are the reason for this, and emphasize that only a common denominator like food consumption (expressed as carbon consumption rates in Fig. 18.2) is a correct approach in system studies. Although this seems obvious, density or biomass comparisons within or between biological compartments are regularly made. Fig. 18.2. also supplies fluorescence in the surface layer as a very preliminaty indicator of phytoplankton abundance andlor productivity (but suffers similar and other restrictions as discussed for animal density and biomass above).
The large scale Pattern of top predator distribution is similar to that observed in the earlier JGOFS cruises in the area. In and near the sea-ice Zone, biomass and food- consumption rates of top predators exceed those elsewhere by order(s) of magnitude because of the relative abundance of large birds (penguins), seals and whales. Data for the ice Zone are shown 'off-scale' in Fig. 18.1 and 2 to be able to illustrate patterns in Open waters further north. Clear patterns in density, biomass and carbonconsumption are visible in a wide area around the APF. Mismatches between various peaks in the graphs are again caused by variable proportions of differently sized bird groups (e.g. prions versus penguins) andlor the presence of mammals (e.g. fur seals) in particular zones. Data suggest rapid responses by top predators to prey types associated with developmental stages andlor depth distribution of phytoplankton-blooms. Further analyses will attempt to focus On this issue. The detailed data in the APF grid may assist in this.
Top predator observations in the initial grid transect over the APF could only Cover patt of the area, mainly the south, due to relatively Iong periods of darkness. Nevertheless, patterns in toppredator species composition and abundance were evident. These strongly differed from those in a similar study in the APF in summer199511997 (van Franeker et al, subm). Small zooplankton surface feeding birds, abundant over midsummer phytoplankton blooms had been replaced in the early winter situation by a community of larger birds and deep diving species (penguins, fur seals). Fig. 18.3 illustrates that carbon consumptidn by this community was highest at the lower end of the grid area, south of the oceanographical APF, Other studies On board suggest gradual subduction of northward flowing water with an older phytoplankton bloom towards the APF. Top predator distributions suggest that this water is associated with higher trophic levels suitable as prey for (diving) predators. Gradual deepening of the water towards the APF could then mean that efficient exploitation of prey was still possible in the south, but that subduction became to deep when coming closer to the APF.
In conclusion, top predator studies during ANT XVI-3 on the one hand confirmed major phenomena Seen in earlier studies, but on the other hand supplied strong 'Information on seasonal change and small scale variations important in the overall understanding of ecosystem processes in the Southern Ocean.
References
Anonymous 1995. Report of the 1995 APIS Program planning meeting. APIS Report No.1. National Marine Mammal Laboratory, Seattle. 26pp.
BIOMASS Working Party on Bird Ecology. 1984. Recording observations of birds at sea (revised edition). BIOMASS Handb. 18: 1-20.
Erickson, A.W., Bledsoe L.J., and Hanson M.B. 1989. Bootstrap correction for diurnal activity cycle in census data for Antarctic seals. Mar. Mammal Sci. 5: 29-56.
Hiby A.R. and Hammond P.S. 1989. Survey techniques for estimating cetaceans. In: Donovan G.P.(ed). The comprehensive assessment of whale stocks: the early years. Rep.Int.Whal.Comn (Special Issue I\). Cambridge. pp 47-80.

Laws, R.M. (ed) 1980. Estimation of population sizes of seals. BIOMASS Handbook No. 2: 21 pp. SCAR, Cambridge.
SCAR Group of Specialists on Seals 1994. Antarctic Pack Ice Seals: indicators of environmental change and contributors to carbon flux. APIS Program, draft implementation plan, Aug. 1994. SCAR Group of Specialists on Seals, Seattle.7 pp.
Spear, L., Nur, N., Ainley, D.G. 1992. Estimating absolute densities of flying seabirds using analysis of relative movement. Auk 109: 385-389.
Tasker M.L., Hope Jones P, Dixon T, and Blake B.F. 1984. Counting seabirds at sea from ships: a review of methods employed and a suggestion fro a standardized approach. Auk 101 :567-577.
Van den Brink, N.W., & van Franeker, J.A. 1997. Sea ice observations and icebergs. pp 12-17 in: U.Bathmann, M.Lucas & VSmetacek (eds). The Expeditions ANTARKTIS Xlll/l-2 of the Research Vessel "POLARSTERN" in 1995/96. Berichte zur Polarforschung Nr.221
van Franeker, J.A. 1992. Top predators as indicators for ecosystem events in the confluence zone and marginal ice zone of the Weddell and Scotia seas, Antarctica, November 1988 to January 1989 (EPOS Leg 2). Polar Biol. 12:93-102.
Van Franeker, J.A. 1994. A comparison of methods for counting seabirds at sea in the Southern Ocean. J. Field Ornithol. 65(1): 96-108
Van Franeker, J.A. 1996. Pelagic distribution and numbers of the Antarctic Petrel Thalassoica antarctica in the Weddell Sea during spring. Polar Biology 16: 565-572.
Van Franeker, J.A., Bathmann, U.V., & Mathot, S. 1997. Carbon fluxes to Antarctic top predators. Deep Sea Research II 44(1/2): 435-455.
van Franeker, J.A., & van den Brink, N.W. 1997. Censuses of marine birds and mammals. pp 116-121 in: U.Bathmann, M.Lucas & V.Smetacek (eds). The Expeditions ANTARKTIS Xlll/l-2 of the Research Vessel "POLARSTERN" in 1995/96. Berichte zur Polarforschung Nr.221.
Van Franeker, J.A., Gavrilo, M., Mehlum, F., Veit, R.R., & Woehler, E.J. 1999. Distribution and abundance of the Antarctic Petrel. Colonial Waterbirds 22(1): ...... (in press)
Van Franeker, J A , Van den Brink, N.W., Bathmann, U.V., Pollard, R.T. & de Baar, H.J.W. (subm). Responses of seabirds, in particular prions (Pachyptila-sp.), to small scale processes in the Antarctic Polar Front. Deep Sea Research submitted

43 45 4 7 49 51 53 55 57 59 61 63 65 6 7 69 71
latitude South
+ density -*- biomass L- - -L
Fig. 18.1 :Density and b iomass of top p redators (b inds, seals and whales) during ANTIXVI-3. Avetages perdegree of latitude, all tmsects combined (n = 1034 ten minute counts).

43 46 47 49 S I S3 55 57 S9 B1 63 65 67 69 71
latitude South
1 - carbon consumption - - - - - - fluorescence 1
Fig. 18.2: Daily caibon consumption of top p redators (b irds, seals and whales) during ANTJXVI-3. Averages perdegtee of latitude, all transects combined (n = 1034 ten minute counts).
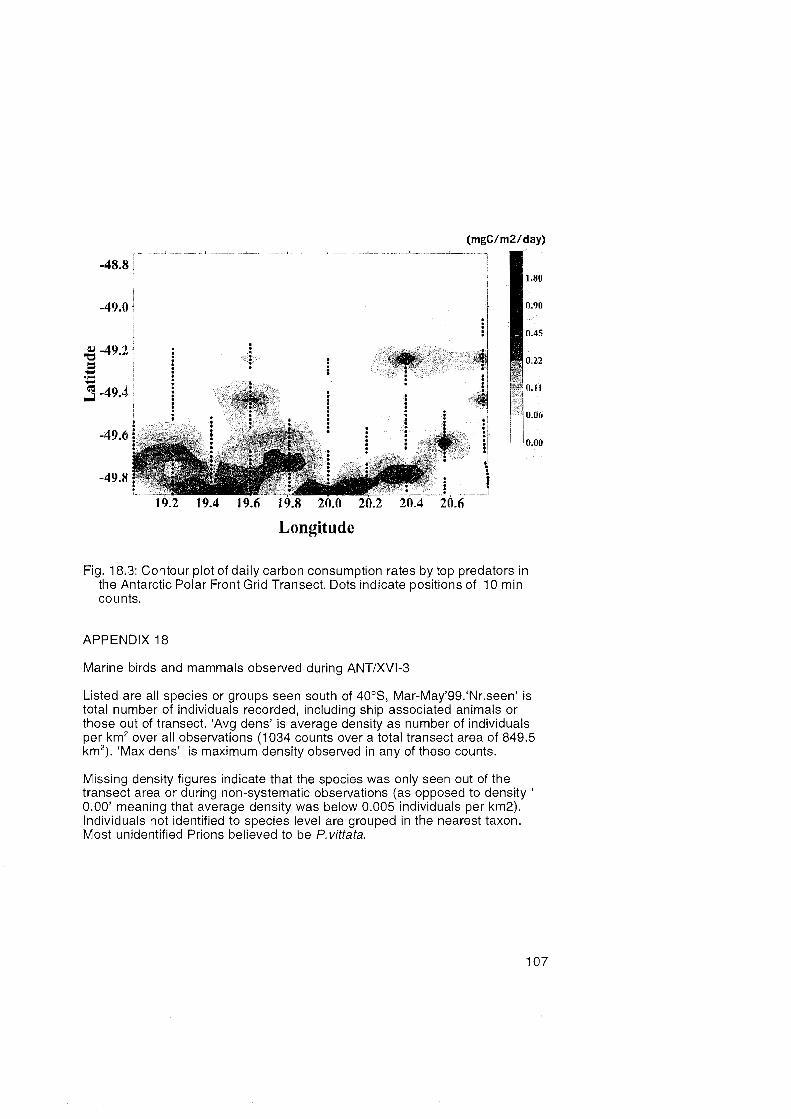
Longitude
Fig. 18.3: Contour plot of daily carbon consumption rates by top predators in the Antarctic Polar Front Grid Transect. Dots indicate positions of 10 min counts.
APPENDIX 18
Marine birds and mammals observed during ANTIXVI-3
Listed are all species or groups Seen south of 40°S Mar-May'gg.'Nr.seen' is total number of individuals recorded, including ship associated animals or those out of transect. 'Avg dens' is average density as number of individuals per km2 over all observations (1 034 counts over a total transect area of 849.5 km2). 'Max dens' is maximum density observed in any of these counts.
Missing density figures indicate that the species was only Seen out of the transect area or during non-systematic observations (as opposed to density ' 0.00' meaning that average density was below 0.005 individuals per km2). Individuals not identified to species level are grouped in the nearest taxon. Most unidentified Prions believed to be P.vittata.

PENGUINS nr Seen avg max dens dens
O I H ~ I , I
nr Seen avg max TUBENOSES dens dens
[ Southem Fulmar 1 456 1 0.05 1 5 Fulmarus qlacialoides 1 1 Antarctic Petrel
1 , I I - 1 5 0 1 9 1 0.17 I 18 I /halassoicaantarctica 1 I l I I
Cape Petrel ('Pintado PetreU
376 0.02 4 Ÿapfio capense

deis dens IArtIAnVKer Tern 1 27 1 0.03 1 5 Sterna sp medium 1 , I I
unidentified small tem 1 3 1 0.00 1 1 Sterna sp small MAMMALS nr seen avq max
der% dens 1 Seal (Phocid) sp 1 12 1 0.01 1 2 Phocidae sp 1 Crabeater Seal Leopard Seal Weddell Seal ROSS Seal
ntarctic I-ur Seal Ant. Fur Seal male uni entified medium whale uni entified small whale E
1-b Hight Whale 1 acutorostrata 1 1 tubalaena australis
EJW:;I~ 7h I
L I I I I - other observations nr seen avg max
151 1 3 1
14 5 2
2
dens dens -s%iGz? d I 27 I 0.03 I 5
1 8
origin)
0.00
0.00
0.15 0.00
0.00 0.01 0.01 0.00
0.00 0.00
I
3 2 1
1 3 3 0
I
Lobodon carcmophagus Hydrurga leptonyx
Leptonychotes weddellii Ommatophoca rossii
Arctocephalus gazella Arctocephalus gazella
Cetacean medium
cetacean srnall o 1 Balaenoptera
19. SOURCE REGIONS AND TRANSPORT PATHS OF IRON IN THE ANTARCTIC CIRCUMPOLAR CURRENT C. Hanfland, M. Rutgers van der Loeff, H.-J. Walter, U. Westernstroeer (AWI)
19.1 Objectives
Whereas the distribution and growth controlling effects of iron are studied in other programs (chapters 13, 14), our aim is to identify the sources and transport mechanisms of the iron into the Atlantic Sector of the Southem Ocean. This study is part of the EU-project CARUSO, and of a parallel DFG project. Principle iron sources are: aeolian inputs from southem South America and the Antarctic Peninsula, advective inputs from their respective continental shelves, and upwelling of deep water.
Release of iron from the continental shelves can be traced by ̂ %a. It is a daughter product of ^Th, which is common in terrigenous sediment but nearly absent in seawater due to its particle reactive behaviour. In contrast, radium is soluble in water and can accumulate to high activities over fine-grained sediment (Rutgers van der Loeff 1994). According to its half-life of 5,8 years, the activity of %a will decrease with distance from the source and is extremely low in the Open ocean. In the fast eastward moving Antarctic Circum olar Current, however, the half-life of ''*Ra P should be long enough for a high ' 'Ra signal to be traced from the Patagonian or Antarctic shelves to the eastem South Atlantic. First indications for the significance of this pathway come from the enhanced activity of ^Th, the daughter product of '''Ra measured in surface waters at 53's on the transect Cape Town-Neumayer (Geibert et al. 1998).
Aeolian input of iron into SE-Atlantic surface waters can be identified ~ i t h ' ~ ~ T h and AI from the various continental source regions. Both elements have residence times in surface waters of less than 1 year, thus excluding large scale horizontal advection. A strong signal of ^Th and AI in surface waters therefore reflects a high input of dust particles into this region (e.g. Helmers & Rutgers van der Loeff 1993). The neodymium (Nd) isotope signal of suspended matter enables us to elucidate the source(s) of the dusts. Juvenile terrigenous material derived from the subduction related rnagmatism of southem S-America, the Antarctic Peninsula and oceanic islands (2.g. the South Sandwich Islands) carries a high 143Nd/14'iNd isotope ratio, compared to terrigenous material from old continental crust (East Antarctica, S- Africa) which has a very low ^Nd/IMNd ratio.

Fig. 1: Sarnple locations of surface water Fig. 2: Sarnple locations of surface water Fig. 3: Sarnple locations of deep water sarnples for the anatysis of dissoived sarnples for suspended pariiculate matter for stations for the analysis of dissolved radiurn radiurn. Open circles represent stationary the analysis of Nd isotopes and other trace and pariiculate Nd Isotopes. Every Station sarnpling; closed circles stand for sarnpling rnetafs. All sarnples have been taken during also has a surface water sarnple. during stearning of the ship and CePreSent stearning of the ship and represent integrated values. integrated values.
19.2 Sampling strategy, sample processing and first on board analyses
The sarnpling for the regional distribution of dissolved AI in surface waters was done in conjunction with the sampling of Fe by the NIOZ Group. The sampling for dissolved ^Ra and for the ^Nd/^Nd isotope signature of suspended particulate matter was run parallel in most places, albeit at a much lower regional resolution than for AI and Fe (Fig. 19.1, 2). This is because filtration of large volumes of seawater (usually several thousand litres) is required for analysis. In order to obtain a two-dimensional distribution of dissolved ^Ra and of particulate ^Nd/^Nd, eight deep casts, each going down to depths between 1000 m and 1800 m, were deployed in coordination with the sampling for Fe and AI by the NIOZ group on a N-S transect through the ACC into the Eastern Weddell Sea (Fig. 19.3). These large volume samples have been collected by time-programmed in situ-pumps, filtering water for about 2 hours at specific depths.
It was the first time that gamma spectroscopy has been used on board POLARSTERN, providing the possibility of screening a lot of samples for various radionuclides. Furthermore, T h (half-life of 24 days) could be meausured directly with a satisfying precision to be used as a yield tracer, thereby (in combination with on board beta counting) giving the possibility of processing the samples for dissolved radium by the ""Th-ingrowth method without adding any spike.
Samples measured by gamma spectroscopy during ANT XVIl3 included material from sediment traps, suspended particles from surface waters taken by a continuous flow centrifuge and ashed cartridges for dissolved radionuclides (see sections below).

19.2.1 Dissolved radium
Large volumes of water (between 1000 and 9000 litres) from the ship's seawater supply were passed through two Mn02-coated polypropylene cartridges put in series. An uncoated cartridge served as a prefilter to separate the particulate and dissolved (< 1 p) fractions. If taken during steaming time the samples represent a mixed value over a sampling distance of up to 70 nautical miles. The cartridges with the particulate fraction were sealed in plastic bags and frozen for further analyses, e.g. Th and Pa isotopes. The coated filters were rinsed to remove all salt, dried at 50° and ashed in a muffle furnace at 400°C Further processing comprised the dissolution of the ash and removal of all initial ̂ Th (the daughter product of ^Ra) by ion exchange chromatography to obtain a pure radium-fraction. After about a year of storage, this fraction will be analyzed for the ingrown ̂ Th to calculate back on the original ̂ Ra values. Ultimately, this so-called qh-ingrowth method will yield the activity ratio ̂ RdERa. Preliminary gamma counting results of the cartridge ash yield measurable '''Th off South Africa, on the Antarctic continental shelf and in the Polar Front region around 50°S The ̂ Th-ingrowth method will show if these peaks can be related to increased ̂ Ra values.
For the quantitative determination of ^Ra, discrete samples of 20 litres of seawater were taken parallel to the large volume sampling. Under continuous stirring, a solution of BaCI was added drop by drop to precipitate radium as BaSO.,. The precipitate was then concentrated by centrifugation and stored in plastic tubes to be measured at home. The ^Ra-content of each of the samples can then be calculated from the ^RdZRa values from the cartridge sample and the absolute ^6Ra-concentration from the subsample.
Five in situ-pumps, each loaded with two Mn0 -coated cartridges, have been deployed on the deep stations (fig. 3) and will be processed in our laboratory at the AWI as described for the surface samples.
19.2.2 Collection of suspended particles for Nd isotope analysis and other trace elements
Suspended particulate matter in surface waters was collected by underway sampling with a continuous flow centrifuge (flow rate 700-1 000 litres of sea- waterlhour). Sample volumes ranged from 2000 to 7000 litres. Concentrations of particulate matter were highest in the Antarctic Zone of the ACC, decreasing to the north and south, with extremely low concentrations in the Eastern Weddell Sea. After collection the material was freeze-dried and homogenized. Further treatment consists of gamma counting for ^Th and 7Be, the latter being a cosmogenic radionuclide with a relatively short half-life of 53 days and representing an indicator for recent wet and dry deposition. First results of on board gamma counting from samples collected in the first grid survey point to higher concentrations of 7Be in surface waters south of the Polar Front than north of it, similar to the concetrations of iron measured in the grid across front gradients (NIOZ group, chapter 6). 'Be was also observed in the first sample collected during the grid survey by the sediment trap at the southern mooring (VPF2), whereas it was below detection limit in subsequent collection periods and in the northem trap. The apparent relationship between 7Be and Fe is probably an indication for an enhanced atmospheric deposition of iron and supports similar indications from the relationship between Fe and rainfall as measured on the ship (chapter 6). The analysis of AI (NIOZ group) will show whether there are indeed indications for enhanced fluxes of aeolian material south of the Polar Front which have led to the development of the plankton bloom there.

The Nd isotope measurements will be carried out on selected samples with high Fe, AI and 'Be concentrations at the University of Toulouse by TIMS. Deep suspended particles were collected with three in-situ pumps deployed in the upper 1000m (fig. 3). Filtering was performed through a 0.65 micron 293mm-filter. Filtered volumes ranged from 500 to 1200 litres of seawater. Filters were dried and stored at -1 8 O C. Further treatment will follow in the laboratory in Toulouse.
References
Geibert, W., Walter, H.J., Hanfland, C. & Rutgers van der Loeff, M.M. (1998): Surface concentrations of ^qh, ""Th and ̂ 'Pa in the Atlantic Sector of the Southern Ocean - the effects on palaeoenvironmental applications. - V.M. Goldschmidt Conference, Toulouse 1998, Mineralogical Magazine 62A, 51 1-512.
Helmers, E. & Rutgers van der Loeff, M.M. (1 993): Lead and aluminium in Atlantic surface waters (50° to 50's) reflecting anthropogenic and natural sources in the eolian transport. - J. Geophys. Res., 98 20261-20273.
Rutgers van der Loeff, M.M. (1994): " ' ~ a and ̂ Th in the Weddell Sea. - In: Johannessen, O.M., Muench, R.D. & Overland, J.E. (eds): The polar oceans and their roie in shaping the global environment: the Nansen centennial volume, Geophysical Monograph 85, 177-186.

20. EXPORT PRODUCTION MEASURED THROUGH THâ 234THl238U DISEQUILIBRIUM IN SURFACE WATER. M.M. Rutgers van der Loeff & U. Westernstroer
Introduction
The radioisotope Th-234 is produced at a well-known rate from decay of uranium in seawater. As thorium is a highly particle-reactive element, the downward flux of particles through the water column causes a depletion of Th-234 in surface waters relative to its parent U-238. This depletion can be used to quantify the export flux on a timescale of the half-life of Th-234 (24 days).
We have measured Th-234 in surface waters on N-S transects as a means to map the latitudinal distribution of export production. Moreover we have detemined the activity in profiles sampled with the Rosette in order to quantify the cumulative depletion and estimate the export flux. Comparison of this flux with the flux intercepted by the sediment traps deployed at 350m depth yielded an estimate of the collection efficiency of the traps.
Method
The method used for Th-234 followed Rutgers van der Loeff and Moore (1999). This method requires a sample volume of approximately 20 L. During the expedition an alternative procedure was developed allowing the quantification of total Th-234 on 5-L samples with appreciably less manipulation.
Procedure: To 5 L of seawater are added 125 pl of a KMn04 solution (6 g/L) and 2 drops of ammonia. After mixing, 200 pL of MnCI2 solution are added (40 g MnCl2.4 HpO/L). The sample is mixed and allowed to stand for at least one hour. The sample is then passed by pressure filtration (50 kPa) over a 25-mm graded glass fibre filter (1 um Pore size). The volume of the filtrate is determined by weighing. The filter is rinsed with demineralized water, dried and beta counted. Deep water samples (>500m depth; >500m above seafloor) are used for calibration, assuming equilibrium with U-238. Counting efficiency is 60% and the precision is estimated at 2-3%.
Results
1- Geographical distribution of Th-234 depletion:
The latitudinal distribution of particulate and total Th-234, expressed as activity ratio to the parent U-238, shows distinct export signals which appear to be linked to the position of the ACC fronts, and large areas with little export (Fig. ja). Highest depletion was observed around 42's near the subtropical front, around 46's near the subantarctic front, just south of the Polar Front around 50°S and in a wider Zone around 55's which may correspond to the ACCNeddel Gyre boundary. The Polar Front Zone (PFZ) had a relatively low depletion, showing that this Zone had not given rise to appreciable expori production in the preceeding few (1 -2) months. The bloom that was observed from the chlorophyll distribution on the way south (transect 7) at 52's was reflected in elevated levels of particulate Th (Fig.la), but the low depletion of total Th shows that in early April this bloom was very fresh and had not yet caused significant export. The Weddell Gyre was characterized by extremely low particle contents, reflected in low particulate Th-234 activities. Nevertheless a depletion of about 15 % in total Th-234 was observed throughout the Gyre. Only close to the Antarctic continent, in the ice-covered coastal current, Th-234 activities reached equilibrium with U-238.

2- Vertical distribution of Th-234: signals of export and regeneration
Calculation of the export flux of Th-234 requires depth profiles down to the depth where Th-234 is in equilibrium with U-238.We have studied the depletion of Th- 234 in surface waters around the Antarctic Polar Front on two previous expeditions to the area. In spring (ANT Xl6, Bathmann et al., 1994), we had observed the transition from a near-equilibrium distribution to a strong depletion (up to 38%) indicating an export event (Rutgers van der Loeff et al, 1997), whereas in summer (ANT Xllll2, Bathmann et al., 1997), we had obsewed a consistent depletion of 17% in the surface water and extending to a depth of 150-200m. In both situations, Th-234 was in equilibrium with U-238 below 200m.
In the present expedition the situation was far less homogeneous in the study area around the Polar Front (cf Fig. 20.1a). In the southern part, the cumulative depletion in the upper 100-150m was 2 to 3 times higher than in the north (Fig. 20.1b). Some stations were visited 3 times over a period of 5 weeks. At the southern station (VPF2, 4g050'S), the depth distribution changed somewhat towards a lower depletion at the surface and a higher depletion at 100m depth, but the integrated depletion remained the Same. This can be explained by the deepening of the mixed layer (see section 3 On Physical Oceanography, Strass).
Given the time development of the vertical distribution of Th-234 , the export flux could be calculated according to the non steady state model of ßuessele et al. (1992). However, as the cumulative depletion at the mooring positions VPF2 and VPF3 remained constant in time we may assume here steady state. The corresponding estimate of export fluxes at all stations (Fig. 20.1 b) shows a strong gradient across the polar front to high fluxes just south of it, negligible fluxes in the Weddell Gyre, and again an appreciable flux in the coastal current.
A remarkable result of many profiles is a significant Th-234 excess below the pycnoclilie, which has been reported only in very few occasions (Coale and Bruland, 1987). In the Weddell Gyre, the depletion of approx. 15% in the surface water is limited to a shallow layer of just about 100m. The integrated excess in the depth Zone 100-250m is similar (Fig. 20.2), indicating very little export to deeper layers (Fig. 20.1 b). Although it is conceivable that this distribution is a remnant of an earlier bloom (i.e. a few months before), it is more likely that it is caused by a steady transport of fine material through the pynocline and mineralization below. We do not know what process is responsible for this transport at the extremely low suspended particle loads, and can only speculate On the possible role of vertically migrating zooplankton.
In the ice-covered coastal current one station (1 82, Fig. 20.2) showed a small depletion over the entire depth range until 400m. At this station, ice forrnation had caused a very deep overturn of the water column, mixing chlorophyll to great depths. This explains the very low depletion in the surface water although the depth-integrated depletion implies a significant export to the shelf sediment.

3- Th-234 export and comparison with the flux as measured with the sediment traps
The Th-234 flux intercepted at 350m depth by the sediment traps at moorings VPF2 and VPF3 was quantified with gamma spectroscopy. At VPF2, the flux decreased from 340 dpm m-2 d-1 at the Start of the deployment to 200 dprn m-2 d-I three weeks later. This flux is a factor of 6 lower than the flux estimated from the Th-234 profiles (Fig. 1 b). At mooring VPF3 the Th-234 was not measurable (<I 00 dpm m-2 d-1) which is again far below the predicted flux. The strong currents ( up to 60 cmls at VPF3, 10-1 5 cmls at VPF2, See section on Physical Oceanography, Strass, Page xx) must be responsible for this significant undertrapping.

STF SAF
1,o
0,8
0 .- .- 2 0,6 3 Co n
2 0,4
$ m CU particulate 234Th
0,2
0,o 40 45 50 55 60 65 70
latitude S
latitude S
Fig. 1 a Particulate (open symbols) and total (particulate + dissolved, closed symbols) Th-234, expressed as ratio to its parent U-238, as function of latitude On the North to South transects, showing strongest depletion near the Subtropical (STF), Subantarcttic (SAF) and south of the Polar Front (PF), and very low particulate levels in the Weddell Gyre.
Fig. 1 b Steady-state export flux of Th-234 from the upper 300m, based on depth- integrated depletion relative to U-238, versus latitude, showing the strong gradient across the Polar Front towards the highest fluxes just south of it. The two mooring sites VPF2 and VPF3 clearly represent the high- and low-flux regimes.

234Thl238U ratio 0 0 0 .b m 00
Station 169 60° 180301E
Station 185 67's OOE
Station 182 70°13' 60111W
Fig. 2 Depth profiles of total Th-234lU-238 activity ratio, showing mineralization maxima below the pycnocline in the central Weddell Sea (stations 169 and 185), and deep depletion in the coastal current (station 182).

21. REAL-TIME SATELLITE INFORMATION Garen Garrity
21.1 SeaWiFS for Mapping Chlorophyll_a
In November 1998, the satellite receiving station on the RV ,,Polarstern" was programmed to receive the Orbview-2 SeaWiFS satellite data in real-time by SeaSpace Corporation installed by Microwave Group-Ottawa River, Inc.. An additional ship-borne TeraScan System for processing was Set-up in Cape Town, prior to the departure to the Antarctic. The reception of real-time data can occur if the proper key-code is known, bi-weekly. The RV ,,Polarsternu real-time receiving station (HAWI) is due to the requirements based on a Principal Investigator (PI) proposal being accepted by NASA and Orbimage from the AWI. The PI at the AWI is Dr. Gerhard Dieckmann. The aim for my work, as a visiting scientist at the AWI, was to establish the capability: a) for receiving SeaWiFS in real-time as well as two other polar orbiting satellites, the NOAA and DMSP (F-series), and b) the opportunity to provide chlorophyll-a maps from satellite orbital data in support of strategic scientific station planning. It was previously known that cloud cover and lack of daylight hours for the SeaWiFS coverage would hinder the acquisition of data in the areas of interest such as the Polar Front near 50° and 20°E
The best orbits occurred between 0900-1300 UTC, totaling on average three per day, with about five during the darkness. From March 18 to May 6, a total of 108 SeaWiFS images where archived on tape for further processing. About 60% of these were during the optimal time period. Processing of the SeaWiFS data to a chlorophyll-a product used the most recent calibration table provided by SeaSpace, Orbimage and NASA as well as the mean climatology data. It was not feasible to send the large meteorological and ozone files to the ship on a daily basis due to the large data volume. The cloud free areas could not be predicted, thus a request for these files would not be in real-time. Therefore, the chlorophyll-a products should be reprocessed using the daily meteorological and ozone input for a more accurate product.
One of the goals of the scientists was to locate chlorophyll-a blooms in the vicinity of the Polar Front. The Polar Front did show areas of elevated chlorophyll-a, as compared to the low background values of 0.01 mg/mA3. Using SeaWiFS data in combination with the mean climatology data, instead of the recommended meteorological and ozone data, values as high as 0.3-0.8 mg/mA3 were reached during the second visit to the Polar Front (late April - Early May), with lower values ranging from 0.06-0.2 mg/mA3 during the first survey (latter March). The lowest values, beyond the background, was near the ice edge (0.1 mg/mA3). The Pattern of a bloom could not be determined from the daily orbits due to patchy cloud cover. The weekly averaged chlorophyll-a picture obtained from NASA showed as well large data gaps in the area of our interest. We received considerable direct support during the cruise with the SeaWiFS chlorophyll-a products from NASA (Dr. Gene Feldmann and Brian Schieb) which is here thankfully acknowledged. It soon became clear, that there was too much cloud cover to map chlorophyll-a in real time to make a serious impact on the planning of station work.
As mentioned before the scientists desired the real-time chlorophyll-a concentrations for planning purposes, thus the weekly average maps where not useful. The data gaps in real-time images, due to cloud cover, provided a non- operational product, however, the cloud-free areas covered degrees of latitude in some cases, providing data for a calibration/validation project. The Scan Fish was able to map the vertical profiles of chlorophyll-a, with no data gaps, thus became the favourite instrument for scientific planning at the Polar Front.
There are SeaWiFS images of chlorophyll-a that correspond to the in-situ measurements made my Bernd Kroon (personal communication). Using the in-situ data, as well as archived profiles from the past, a calibration/validation (CalNal) project for SeaWiFS at the Polar Front could be promising. Addition of the Scan Fish chlorophyll-a mapping to the CalNal project will provide a better chance for overlaying SeaWiFS data with this in-situ data. The Scan Fish continuous profiles mapped fluorescence that was calibrated to a chlorophyll_a concentration. Gernerally data from the Scan Fish was from depths of 250 m, for a distance of 4 km on the surface. The daily meteorological and ozone information should be used in the processing of SeaWiFS chlorophyll-a values, instead of an average climatology file for a CalNal experiment. The influence of wind-speed on the calculated chlorophyll-a values is not know at the present, and could be part of the CalNal effort, and of interest to the SeaWiFS program office at NASA.
21.2 DMSP Special Sensor Microwave/lmager
The Special Sensor Microwavellmager (SSMII), located on the Defense Meteorological Satellite Program (DMSP) platforms provides geophysical Parameters regardless of cloud cover and darkness. For non-U.S. Military platforms, it provides the following products, South of 60s: (1) sea ice concentration, (2) sea ice type according to WMO (World Meteorological Organization) when the Snow cover is dry, (3) wind-speed at the ocean surface, (4) total liquid water and (5) vapour in the atmosphere as (6) rain rate (mmlhr).
The wind-speed maps are of interest to the SeaWiFS CalNal, as well as the onboard meteorological office. The iron research group has requested rain rate maps, in order to examine a possible iron input from rain. The bird and mammal scientist fequested the sea ice edge position. Sea ice concentration was of importance for navigation in order to aid planning of time between station stops within the sea ice cover extent. The program dictated the ship stay in an area of new and young ice, thus difficult working conditions for On ice work.
In addition to the SSMII Sensors there is the DMSP Optical Linescan System (OLS) that provides 0.5 km resolution in the visible and near-infrared channels. For the Antarctic the OLS provides high-resolution imagery of sea ice conditions under clear skies.
From March 18 to May 6 a total of 250 SSMII orbits have been archived for post research. The data can only be processed using the NASA algorithms as part of the TeraScan SeaSpace Corporation Software soon to be located at the AWI, University of Bremen and Hanse Institute for Advanced Study, Delmenhorst.
21.3 NOAA Weather Satellites
The NOAA weather satellites are used to map the sea surface temperature for cloud free areas, as well as the traditional cloud motion, and wind-fields in the atmosphere. The High Resolution Picture Transmission (HRPT) is 1 . I km .
21.3.1 Weather
It has been apparent since 1997, and again during this cruise, that the weather office would benefit by using the TeraScan system since there are always new satellites added to the software to be received thus, provides more real-time weather satellite images. Beyond the infrared weather images, there are various satellite products evident in this report that would benefit their interests and requirements. As compared to the present day Met office, the resolution of the images are near an order of magnitude better using the 1.2 m TeraScan antenna,

where the frequency range to capture satellites is large, with a strong signal strength. As an example, there was electrical interference in the receiving of NOAA satellite by the Met office for time periods, which was not the case for the Same satellite received by the TeraScan system. As an Appendix 1 to this cruise report, a recommendation has been summarized which involves the BSH and the Seewetteramt, Hamburg in combination with the AWI. The initiation ashore came from Klaus Strübin (Head of Eisdienst, BSH) and Dr. Rene 0 . Ramseier (Microwave Group-Ottawa River, Inc.) at an introduction level that was received well by the Seewetteramt (May 1999).
During this cruise, the Meteorologist (Kurt Flechsenhar) had a short demonstration on the type of products the TeraScan system can produce in order to provide more information about weather, sea state and even sea ice conditions. The Met Techniclan (Hartmut Sonnabend) had a short training session on the steps required to captui'e and produce an infrared satellite image.
There were a total of 203 NOAA satellite orbits archived on tape from March 18 to May 6.
21.3.2 Sea Surface Temperature
Using the NOAA AVHRR (Advanced Very High Resolution Radiometer) data, sea surface temperature is calculated using different algorithms depending On darkness. However, the algorithms work for cloud-free areas only. These algorithms are provided with the TeraScan software and documentation is available as help window files (SeaSpace Corporation). The sea surface temperature products were an aid in determining the meandering Polar Front, thus guidance for planning oceanographic stations.
21.3.3 Mooring Location
An additional feature of the NOAA satellites is the similar transmitting frequency as from an argos equipped buoy located as an example on a mooring. Thus, if a mooring was lost from sight, and the argos buoy with its transmitter positioned to the surface of the water when the mooring was released, the mooring could be located nsing the TeraScan system. Since some of the moorings had the transmitter located under the ACP (Automatie Current Profiler), they were not located with the TeraScan system. This did not Pose a problem hince all five moorings were kept in sight visually, and retrieved successfully.
Using the TeraScan system to locate moorings is free of charge, thus no cost to the AWI for this information, which is not the case at the present time since the AWI uses another method. Peter Roth was trained on the system for locating argos transmitters and he translated the lesson into German. This translation aided the training of the Met technologist, who was trained in a similar manner for making NOAA AVHRR weather images.

21.4 Sea Ice Information
21.4.1 Sea Ice Edge
Using the SSMII data and the NASA Team algorithm, the sea ice edge defined as the 10 % ice concentration for a 25x25 km grid spacing with an accuracy of +I- 6% is shown in Table 1. The following table shows the sea ice edge at the various longitudes near the ship during the cruise.
Table 1 : Sea Ice Edge at Locations of Interest During this Cruise for Bird and Mammal Research
21.4.2 Sea Ice Visual Observations
The visual sea ice observation program is not complete due to darkness, and the fact that the ship tended to move during the night, with station stops in the day. This varied however, thus observations were made providing a record of major changes in sea ice conditions as the ship progressed through the ice. Visual observations are difficult due to viewing the sea ice as one would view the cloud Cover. The closer to the horizon one looks, one tends to overestimate the sea ice concentrations. Thus, the observations are descriptive more than quantitative. Satellite derived concentrations are quantitative for first year, old ice and total ice, and were provided to the public (Messe 11), the Captain and transferred electronically to the senior scientist as a colour image on a regular basis during the time spent in the sea ice. Products were distributed to those requesting a copy. These Images would be too expensive to include in the cruise report, thus individuals who require quantitative sea ice inforrnation should contact the e-mail address: [email protected]. The NASA Team algorithm would be used, thus a 25x25 km averaged sea ice concentration area, however, a 12.5x12.5 km can be obtained, but with more effort due to interpretation requirements.
The sea ice conditions presented below shows typical variability of a sea ice edge from a young ice regime, to first year ice, with old ice (fresh ice) small floes intervening from the ice berg graveyard near Neumayer (AtkaBay). The most appropriate way to present these general sea ice conditions is to be descriptive. Satellite information can augment this description by quantifying the sea ice information as a percent of ice covering the ocean surface. Only the visual observations can estimate the amount of new versus young sea ice, which was the dominant case at this time of ice formation.

Note that general observations such as air temperature, wind speed etc can be obtained from the ship's data (Poldat), thus can augment the sea ice environment if necessary by the User.
April 12 68 49s 5W Dusk to Dark (1 600.. .UTC)
On route to Neumayer, with off shore winds at 8 knots and -30C at the station. A typical sea ice edge was encountered as a pancake ice regime, increasing in concentration southward to 69 10' 6W. Pancake ice concentration varied between 0-1 00% in bands, thus the SSMII NASA Team satellite algorithm missed the 10% sea ice edge, due to the 25x25 km resolution at this position. The 12.5x12.5 km resolution could be used to define an ice edge more accurately, under most circumstances, but not all. There was 62 nm (1 16 km) of sea ice from the ice edge at 8W to the shelf ice at Neumayer.
April 14 70 27s 8 18W Visibility < (less than) 1 km (0800 UTC)
High winds at 21.1 mls, direction 83 degrees (deg) caused ice pressure to build up. The easterly winds caused little pressure for navigation purposes since the sea ice was only 50 cm thick, 100% concentration, 50% rafting and 50% ridging. This could be a potential situation for krill to hide. The ship waited for the storm to pass.
April 14 70 14s 8 20W Dark (1 900-2000 UTC)
Evidence in the sea ice structure showed that it had been under pressure recently. Ice type was grey to grey-white, a maximum thickness of 30cm. Concentration was1 OWo with 10 cm of Snow and 0-60% ridging (i.e. variable). Winds remained high, 19 mls form 92 deg. The tide removed pressure from the ice, counteracting andlor stronger effect than the wind. For the SSMII satellite foot print (grid spacing of 25x25 km) the ice concentration was 75%.
April 15 70 10s 7 22 W Visibility 2 km (0800-0900 UTC)
Winds increased to 22.5 mls from 99 deg . The ice concentration and ice types varied considerably as compared to previous observations: Open water 10%, white nilas 5%, grey to grey-white ice 1574, and first year 70%. April 15 70 10s 7 27W Stopped (1000 UTC)
The ship stopped due to high winds and incompatible tides for the day. First year ice was prominent at 100%.
April 16 69 59s 7 48W (0800-0900 UTC)
The floe size became recognizable at 1-3 m (minimum) with a grey-white sea ice concentration of 75% and 5 cm of Snow cover. Beginning of the first year ice pack. April 16 70 9 s 6 54W Visibility 4 km with low winds, 3.2 mls.
The ice floes were <I m in size being 40% grey ice, 5% dark nilas and 5% Open water. The remainder was brash ice.
April 16 70 13s 6 52W (1 130-1230 UTC)
There was a station at 1300 UTC, where the sea ice concentration was typically 15% grey ice and 85% brash with none of the floe sizes > (greater than) 1 m. The SSMII showed 95% ice cover (recall, the concentration if for a larger area than the eye can observe).

April 17 69 58s 6 18W Excellent visibility - Day long ice station
The sea ice was relatively thin for an ice station where the tides tend to put pressure On the ice by the late afternoon, early evening. Grey-white ice (maximum 30 cm, no ridging or rafting included) with a concentration of 95% the remainder being 5% Open water. Floe size generally 100-1 000 m.
April 18 69 48s 3 47W (0800-0900 UTC)
Floe size near 3 m on average. Dark nilas at 10% with the remaining 90% grey and grey-white ice.
April 18 69 54s 3 36W (0900-1 000 UTC)
The pancake ice was well developed and frozen together with a low concentration of 10%. Dark nilas at 25% and greylgrey-white ice at 65% concentration. The grey- white floe size did not change from the above.
April 18 70 3 s 3 14W (1000-1 100 UTC)
Floe sizk had increased to 10 m with 90% grey-white ice, 5% white nilas and 5% dark nilas.
April 18 69 51 S 3 4W (1 100-1 130 UTC)
There was a trace of dark nilas, with evidence of past pressured young ice. The floe size of 100% greylgrey-white ice was 25% rafted and floe size averaging 3 m.
April 18 69 51 S 3 4W (1 130-1200 UTC)
There were many (relative to other areas during this cruise) seals and whales observed at this position with brown ice occupying 5% of the sea ice. The floe size was < 1 m at least 30 cm thick (greylgrey-white) (50%) and pancake ice (5O0/0), well established, thus frozen together into an ice sheet. The first year ice type was rafted 25%, thus providing a thickness > 30 cm. The rafting may provide an area for krill to live in harmony, and predators enjoy the idea of a good feast.
April 18 69 39s 3 8W (1200-1330 UTC)
Typical ice edge with swell overtaking the sea ice. The pancake ice was variable, again typical of an ice edge, with 80-1 00% ice concentration. Thus, the floe size was < 1 m. The SSMII showed 80-90% ice Cover.
April 19 70 13s 6 13W (0800-0900 UTC)
An ice station with a variable polynya (small) with time covered with 5% grease and slush ice, 5% water and later in the day 5% dark nilas. There was 5% white nilas at the edges of the 3O0I0 grey ice and grey-white ice areas.
April 20 69 52s 6 W (0800-1200 UTC)
The floe size was decreasing with time with a trace of old fresh ice. Typical compact ice edge with 25% brash ice and 75% greylgrey-white ice 25% rafted.

April 20 69 7.5s 4 1 W (1600 position) (1200-1600 UTC)
There was a sudden decrease in sea ice conditions at 1500 UTC where bands became more apparent. There was 85% pancake ice and 15% Open water before the bands were more prominent at the ice edge. The ice floe size decreased considerably at the 1500 UTC change over of ice conditions. The floes were C 1 m. The SSMII shoed 7O0I0 ice cover.
The SSMII ice cover calculated using the NASA Team algorithm showed different ice concentrations than from visual observations due to: 1) human error in estimated sea ice concentrations from a ship, and 2) the orbit time did not necessarily occur at the time of the visual observation which was averaged over various time periods.
There were a total of 561 good satellite overpasses archived in TeraScan forrnat during this cruise.

APPENDIX 1
MICROWAVE GROUP-OTTAWA RIVER, INC.
3954 Armitage Ave., RR#1 Dunrobin, Ontario KOA 1TO Canada e-mail: icedoctors@ igs.net
Satellite Receiving Station on RV ,,Polarsternc': ANT XVI-3, March-May 1999
A Recommendation to the AWI, BSH & Seewetteramt, Hamburg
A satellite receiving and processing system located near the Meteorologist Office on the RV ,,Polarsternu can provide assistance to the Met Office requirements in Support of weather and sea ice information. The SeaSpace Corporation TeraScan system belongs to the Alfred Wegener Institute and remains on the ship for all cruises. This system operates on Sun Workstations (Unix based) and offers more NOAA satellites than the present day RV ,,PolarsternG weather office system. The addition of NOAA 10 and 11 to the NOAA 12,14 plus 15 provides more satellite images on the TeraScan system for weather forecasting. The resolution is 1.1 km, since it is a HRPT receiver as compared to the APT (near an order of magnitude less resolution).
In addition to receiving the NOAA weather satellites, the system is capable of receiving the F-series Sensor data from the U.S. Defense Meteorological Satellite Program (DMSP), thus providing additional information based on passive microwave algorithms. The F- satellite data is accessible and free of charge in the Antarctic, south of 60 latitude. The information gained from the passive microwave data is of benefit to ocean going vessels in the Polar Regions where the cloud cover, and sometimes darkness is generally prominent. The microwaves can work with the cloud cover, thus parameters such as: wind-speed at the ocean surface, sea ice coverage, sea ice typelthickness as per WMO definitions only in the winter, rain rate, total liquid water and vapour in the atmosphere are provided as an Image similar to the coverage as the NOAA satellites. As with the NOAA satellites, information is in real-time, due to the reception of the raw data directly from the satellite to the ship where it is easily processed.
The software is advanced, thus window oriented for easy viewing and manipulating by the User. The TeraScan system has been on the Polarstern since the early 1 990Js, and has been continuously updated with the addition of new satellites and products. There are other products that can be generated, for example, chlorophyll-a on the ocean surface, only as an example from another satellite (Orbview-2, SeaWiFS). Scientists use the TeraScan system On some cruises, however there is always the situation where the weather office can connect to the data.
The TeraScan system can be used as a backup system, but more importantly it should be used as the main system due to the versatility and exceptional satellite reception capabilities. The Alfred Wegener Institute (AWI) generally pays for support from SeaSpace Corporation, thus there is an on-going exchange of ideas from the User that can be implemented in the software upgrades received by the AWI.

It is advisable to be trained on the system in order to leam the capabilities of remote sensing, as weil as the general theory to assist in the Interpretation of the data, to fully take advantage of the facility. Once the knowledge of products is introduced, the TeraScan system can be Set-up more automatically with the aims of the knowledgeable user's requirements. The ideal training is in real-time at sea, plus in the sea ice in the Antarctic. The NOAA satellites are not operational for mapping sea ice due to the blinding by cloud and darkness. Only the F-series satellites can provide real-time geophysical Parameters under all weather and daylight conditions, to date. The F-series satellites may be received in the Arctic in the future, but there is a need for requests indicating the urgency for this data north of 60s.
There are numerous TeraScan specialists, but few with experience on ships, and in sea ice. One example would be Dr. Caren Garrity from the Microwave Group- Ottawa River, Inc. where she did her Doctorate using the F-series passive microwave data for mapping sea ice conditions. Dr. Garrity has trained others on the use of the TeraScan system and has been successful in providing the basics for exploration by the user.
Experience has shown that training should not be geared to just knowing the commands to provide a product, but rather why the steps are necessary. It is not recommended to expect a system manager of a ship to know the TeraScan system, since it is the User that will need to follow the changes and updates in technology of interest to the ,,setviceN.
The TeraScan system is as powerfui as the user. It is beneficial to the Meteorologists with access to the TeraScan system, to use it for weather AVHRR (NOAA) infrared maps to the other extreme of mapping: winds at different levels in the atmosphere, sea surface temperature, wind speed at the ocean surface, sea ice concentration, ice edge position etc.. . A ship like the RV ,,Polarsternfi, that operates about 90% in Polar Regions, should included sea ice mapping as part of the weather setvice. It will not be the first time (USCGC Polar Star, USCGC Polar Sea, CCG Louis S. St-Laurent, MV Lance .... ).
It is sfrongly recommended that the Meteorological Office on the RV,,PolarsternU link-up fo fhe resources of the TeraScan remofe sensing system located jusf around the comer.
Dr. Caren Garrity President

22. PARTICIPANTS I FAHRTTEILNEHMER ANT XVIl3
Alheit, Ruth Assmy, Philip Atkinson, Angus Bathmann, Ulrich Bellerby, Richard Boye, Marie Brink, Nico van den Brocken, Fenneke Croot, Peter Dauelsberg, Anke Davey, Margaret Dieterich, Christian Flechsenhar, Kurt Franeker, Jan Andries van Freier, Ulrich Garitty, Caren Gonzalez, Santiago Hanfland, Claudia Hartmann, Carrnen Jong, Jeroen de Kattner, Gerhard Kroon, Bernd Langreder, Jens Leach, Harry Leeuwe, Maria van Macrander, Andreas Meyer-Harms, Bettina Mock, Thomas Monsees, Mathias Oijen, Tim van Ratje, Andreas Richter, Klaus-Uwe Rosenstock, Bernd Roth, Peter Ruttgers V. d, Loeff, Michiel Schmidt, Katrin Schoemann, Veronique Simon, Meinhard Smetacek, Victor Sonnabend, Hartmut Strass, Volker Stübing Dorothea Timmermans, Klaas van der Wagt, Bas Veldhuis, Marcel Visser, Ronald Walter, Hans Jürge Westernstroeer, Ulrike Zwisler, Walter

23. PARTICIPANTING INSTITUTES 1 BETEILIGTE INSTITUTE
Germany
AWI
DWD
ICBM
IFM Kiel
IOW
Belaium
ULB
Netherlar&
IBN-DLO
NI OZ
RuG
Enqland
BAS
DOUL
PML
Alfred-Wegener-Institut fü Polar- und Meeresforschung Columbusstrasse 27515 Bremerhaven
Deutscher Wetterdienst Geschäftsfel Seeschiffahrt Bernhard-Nocht-Str. 76 20359 Hamburg
Inst. f. Chemie und Biol. des Meeres Universitä Oldenburg Carl-V.-Ossietzky-Str. 9-1 1 261 11 Oldenburg
Istitut fü Meereskunde Düsternborrke Weg 20 2341 4 Kiel
Institut fü Ostseeforschung Warnemünd Postfach 30 11 61, 181 12 Rostock
Groupe de Microbiologie des Milieux Aquatiques Universite Libre de Bruxelles ULB Campus de la Plaine, CP 221 B-1 050 Brussels
Institute for Forestrv & Nature Research Postbox 167 NL-1790 AD Den Burg (Texel)
Nederlands Instituut voor Onderzoek der Zee Postbox 59 NL-1790 AB Den BurgITexel
University of Groningen Department of Marine Biology P.O. Box 14 9750 AA Haren (Gn)
British Antarctic Survey (BAS) High Cross, Madingley Road Cambridge CB3 OET, UK
Dept. of Oceanogr. The University Liverpool, L69 3BX
Plymouth Marine Laboratory Citadel Hill Plymouth PLI 2PB

24. SHIP'S CREW I SCHIFFSBESATZUNG ANT XVll3
Dienstgrad Name
Kapitä ............................................ Pahl, Uwe 1. Naut. Offizier .............................. Schwarze, Stefan 1, Naut. Offizier .............................. Rodewald, Martin 2. Naut. Offizier .............................. Fallei, Holger 2. Naut. Offizier .............................. Spielke, Steffen Arzt ................................................. .N N Ltd. Ingenieur ................................. Behnes, Stefan 2. Ingenieur ..................................... Erreth, Mon. Gyula 2. Ingenieur ..................................... Ziemann, Olaf 2. Ingenieur ..................................... Fleischer, Martin
Elektriker .......................................... Muhle, Heiko Elektroniker ..................................... Dimmler, Werner Elektroniker ..................................... Muhle, Helmut Elektroniker ..................................... Greitemann-Hackl, A. Elektroniker ..................................... Roschinsky, Jör Funkoff izier. ..................................... Koch, Georg
Maschinsnwart ............................... lpsen, Michael Maschinenwari ............................... Voy, Bernd Maschinenwart ............................... Grafe, Jens Maschinenwart ............................... Hartmann, Emst-Uwe Maschinenwart ............................... Preußner Jör
Zimmermann .................................. Reise, Lutz Lagerhalter ...................................... Müller Klaus Bootsmann ..................................... Clasen, Burkhard Matrose .......................................... Gil lglesias, Luis Matrose .......................................... Pousada Martinez, S. Matrose .......................................... Kreis, Reinhard Matrose .......................................... Winkler, Michael Matrose .......................................... Schulz, Ottomar Matrose .......................................... Burzan, G.-Ekkehard Matrose .......................................... Bäcker Andreas Matrose .......................................... Pulss, Horst
Koch ................................................ Haubold, Wolfgang Kochsmaat ...................................... Völske Thomas Kochsmaat .................................... ..Martens, Michael I . Stewardless .............................. Jürgens Monika StewardesslKrankenschwester.~..N N 2. Stewardless .............................. Czyborra, Bärbe 2. Stewardless .............................. Deuß Stefanie 2. Stewardless .............................. Neves, Alexandre 2. Steward ...................................... Tu, Jian Min 2. Steward ...................................... Mui, Kee Fung Wäsche ......................................... Yu, Chung Leung

FAHRTABSCHNITT ANT XVli4 KAPSTADT - BREMERHAVEN (1 1.5.99 - 4.6.99)
A. Fahrtroute ANT XVli4 M. Reinke (AWI)
"Polarstern" verlieà Kapstadt in Richtung Bremerhaven am 11 .Mai 1999 gegen 19 Uhr. Erstes Ziel war die Verankerung V3lKlO des Instituts fü Meereskunde in Kiel auf 30° und 5OE. Sie wurde vor 2 Jahren von FS Polarstern im Rahmen des KAPEX ("Kap der Guten Hoffnung Experiment") ausgebracht. Sie verfügt eine Schall- quelle, die zusammen mit 2 weiteren Verankerungen zur Unterwasser-navigation von freitreibenden Schwebekörper (RAFOS-Floats) verwandt werden. In KAPEX wird der Zwischenwasser-Austausch im Tiefenhorizont von knapp 1 OOOm vor dem südliche Afrika untersucht. Dieser interozeanische Austausch zwischen lndik und Atlantik ist Teil der globalen ozeanischen Zirkulation, welche in den Kon- vektionsgebieten des Nordatlantiks angetrieben wird, und der Auswirkungen bis zum Pazifik hat. Inzwischen hatten alle Floats ihre Missionen beendet und nach ihrem Auftauchen die gesammelten Daten übe eine Satellitenfunkverbindung nach Kiel abgesetzt. Die aufgenommene Schallquelle hatte somit ihre Aufgabe erfolg- reich erfüllt Die verbleibenden zwei Schallquellen aus Kiel sollen im kommenden Jahr von FS Meteor bzw. Polarstern geborgen werden.
Die weitere Fahrt der Polarstern füht? nach Norden in Richtung der Kapverdischen lnseln. Nach Durchquerung des SE Passats erreichte sie die Zone der inner- tropischen Konvergenz (ITC). In der Nacht von Donnerstag auf Freitag, den 21.5.1 999 iberquerte sie gegen 0 Uhr UTC den Aquator bei 18 Grad West, Abgesehen von wenigen nicht sonderlich ergiebigen Schauern und Weiter- leuchten am Morgen des 22.05.1999 wurde die ITC ohne weitere nennenswerte Wetterereignisse durchfahren. Am Montag den 24.5.1 999 lief Polarstern bei mäßig Sicht und Wind aus NNE mit 5 Bft durch die lnselgruppe der Kapverden mit neuem Kurs Richtung Kanarische Inseln. Am 28.05.1999 wurden gegen 10 Uhr auf der Reede von Las Palmas zwei weitere Mitreisende an Bord genommen. Ab dem 29.05.1999 führt der Kurs durch den Einflußbereich eines Tiefs nahe 44N und 15W, das mit einer anfangs nordwestlichen, späte südwestliche Strömun kühler Luftmassen heranführte Der Starkwindbereich auf der Rückseit des Tiefs brachte kurzzeitig eine aus Nordwest heranlaufende, bis zu 3 m hohe Dünung Auf dem letzten Abschnitt der Reise sorgte eine Azorenhoch mit einem nach Schott- land gerichteten Keil fü Überwiegen ruhiges Wetter.
Die drei Arbeitsgruppen, die Experimente der letzten Expedition (ANT XVll3) fortführten beschäftigte sich mit Teilaspekten des marinen Kohlenstoffkreislaufs und der Biologie des antarktischen Krills. Der Kohlenstoffkreislauf wurde im Rahmen des internationalen Programms "Joint Global Ocean Flux Study" (JGOFS) und die Krillbiologie im Rahmen von "Global Ocean Ecosystem Dynamics" (GLOBEC) erforscht
lm wissenschaftlich-technischen Bereich wurden auf diesem Fahrtabschnitt die Grundlagen fü die Erneuerung und Erweiterung des wissenschaftlichen Bord- rechnersystems erarbeitet. Diese Arbeiten wurden im Rahmen der Uberholungs- maßnahme des Schiffes in den Jahren 1998 bis 2000 durchgeführ und sollen die hohe Leistungsfähigkei von Polarstern als wissenschaftliche Plattfotm und als schwimmendes Observatorium fü die nächste Jahre sichern.
Am 3. Juni 1999 abends erreichte Polarstern planmäß ihren Heimathafen Bremerhaven.

B. ltinerary ANT XVll4 M. Reinke
On Mai 1 1, 1999 RV "Polarstern" left Capetown as planned at 19:00, with 10 scientists and 41 Crew members On board.
Two days later it reached the sound source mooring V3lKlO of the "Institut fü Meereskunde", Kiel at 30° and 5OW, which was deployed two years ago by RV "Polarstern" within the framework of KAPEX. KAPEX (Cape of Good Hope Experiments) is an oceanographic research project, which focuses On the spreading and inter-ocean exchange of subsurface water around Southem Africa. Between April 1997 and June 1998, a total of 6 cruises were carried out to establish a sound source array and to launch the RAFOS floats. These floats performed underwater navigation using acoustics signals, which were transmitied by the moored sound sources. They transmitied their collected data via satellite, which are evaluated and analysed by the laboratories involved. The mooring was quickly detected and brought up.
RV "Polarstern" headed for the Cape Verde lslands and crossed the equator On Mai 21, 1999. On Mai 28, 1999 at the Canary lslands two technicians arrived On board. On June 3, 1999 RV "Polarstern" reached Bremerhaven.
Three biological and geo chemical working groups conducted experiments On material which was collected during the last leg (ANT XVll3) of RV "Polarstern". This work was focused On the biology of krill Euphausia superba and On the marine carbon cyc!e in the framework of the programs "Global Ocean Ecosystem Dynamics" (GLOBEC) and "Joint Global Ocean Flux Study" (JGOFS)
A technical working group developed the basic structures of a new scientific information technology network On RV r'Polarstem'', which will be implemented within the next year.

C. PODEV Nachfolge M. Reinke, J. Hofmann, P.Gerchow
Währen ANT XVll4 wurden von der Gruppe des AWI-Rechenzentrums drei Themen verfolgt. - Erstellung einer Spezifikation fü das Nachfolgesystem des jetzigen PODEV-
Systems, das im Jahr 2000 ersetzt werden soll. - Dokumentation und Aufnahme der Verkabelung des wissenschaftlichen
Datennetzwerkes als vorbereitende Arbeit der Erneuerung des Netzwerkes im Herbst 1999,
- Tests mit dem Echtzeit-Datenbanksystem DAVIS der Fa. WERUM (Lüneburg)
Fü die Nachfolge des bestehenden Bordrechnersystems wurde ein Betriebskonzept erarbeitet, welches den Rahmen fü die detaillierte Spezifikation der neuen wissenschaftlichen Dateneriassung bildet. Kernpunkte dieses - Konzeptes sind: - Verkabelung aller Funktions- und Wohnräum des Schiffes auf Glasfaserbasis mit
eiiem zentralen Knotenpunkt im Bordrechnerraum. - Aufteilung des physikalischen Netzwerkes in mehrere logische Teilnetze
(Subnets), nach Funktionalitä und Sicherheitsrelevanz. - Einsatz eines UNIX- und eines Windows-NT-Servers fü zentrale Dienste.
Darauf aufbauend wurde ein Lastenhefi erstellt, welches die Erfahrungen mit dem bisherigen PODEV-System auswertet und die Grundanforderungen an das neue System definiert. Das Lastenheft wurde mit einem Mitarbeiter der Fa. WERUM (Lünebcrg) der in Las Palmas an Bord kam, ausführlic diskutiet-t, wobei dessen Erfahrungen bei der Realisierung und Installation der wissenschaftlichen Datenerfassungssysteme auf den Forschungsschiffen "Meteor" und "Sonne" einflossen.
Die Aufnahme und die Dokumentation aller Übertragungssystem (Ethernet- Netzwerk und serielle Datenübertragungssysteme in allen Funktionsräume des Schiffes wurde in Zusammenarbeit mit den Bordelektronikern. Als Ergebnis steht jetzt eine Datenbank im MS-Access-Format zur Verfügung die Auskunft übe die installierten Systeme gibt. Desweiteren wurden die Hardwareanforderungen fü das neue Datennetzwerk formuliert. Dabei wurde besonderer Wert auf Flexibilitä und Zukunftssicherheit der Investition gelegt. Die zukünftige Anschlußort wurden festgelegt und die Konzepte fü die Strukturierung der Verkabelung erarbeitet.
Die Tests mit dem Echtzeit-Datenbanksystem waren eine Fortsetzung der Arbeiten, die auf ANT XVll begonnen wurden. Währen es damals um grundsätzlich Fragen der Eignung des Systems als Grundlage fü Obser- vatoriums-Datenedasungssysteme ging, wurden diesmal an einem laufenden System mit realen Daten aus der Bordwettewarte gearbeitet. Ziel war die Optimierung von Systemkonfiguration, -performance und -stabilität
Auch hier konnten am laufenden System verschiedene Fragen direkt mit dem Mitarbeiter von der Herstellerfirma WERUM geklär werden. Außerde wurde eine Datenbasis geschaffen, die Grundlage weiterer Tests im Institut sein wird.

D. The Scientific Computimg Network On RV "Polarstern" M. Reinke, J. Hofmann, P. Gerchow
The scientic computing network provides the basis for scientific work On board of RV '~Polarstem". Besides ist scientific infra-structure function, it is used to collect, archive and distribute ship and environmental parameters. The system PODEV, which was implemented in 1993, has to be replaced due to technical considerations. During this leg new specifications have been developed concerning the new physical fiber network, connecting all rooms and laboratories of the ship, the partitioning of the physical network into logical subnets and the use of a UNIX and Windows NT-Server for central services. As a prerequisite the existing network, which has evolved over 15 years, was analysed and documented into a database. The new data acquisition and distribution system will be based On a real-time database management system (RTDBMS). lt is already used On the German RV "Meteot' and "Sonne". During this leg a test data set was produced in order to evaluate stability and performance of the RTDBMS system. Further testing and development of the system will be carried out in Bremerhaven.
E. Nahrungsokologie und Energetik des antarktischen Krill D. Stübin
Die Diskussion übe die Übetwinterungsmechanisme des antarktischen Krill Euphausia superba ist noch immer in vollem Schwunge. Derzeit werden fün Strategien kontrovers diskutiert: Reduktion der Stoffwechselaktivität Nutzung von Speicherstoffen (Lipide, Proteine), Reduktion der Körpergröà Fraà von Eisalgen, Ubergang zu einer carnivoren Ernährungsweise
Kondition und Ernahrungssituation der beprobten Krillpopulationen sollen zum kritischen Zeitpunkt des Ubergangs zum Winter anhand von lipidbiochemischen und lsotopenanalysen, die in den lnstitutslaboren durchgeführ werden sollen, charakterisiert werden. Lipidgehalt und Lipidklassenzusammensetzung geben Aufschluà übe Menge und Art der Energiereserven und werden getrennt fü die jeweiligen ontogenetischen Stadien bestimmt. Die Fettsäurezusammensetzun laß ebenso wie die Anreicherung der stabilen Isotope des Kohlenstoffs und des Stickstoffs auf die Nahrungsgewohnheiten der Tiere währen der vergangenen Wochen rückschließe
Die Probennahme fand währen ANT XVll3 statt; ein Teil der Tiere wurde direkt eingefroren und bildet die Datengrundlage fü das Feldmaterial. Ein weiterer Teil wurde fü 4-7 Wochen unter verschiedenen Bedingungen gehaltert. Auf diesem Fahrtabschnitt wurden die Langzeitexperimente weitergeführt Furcilien, Juvenile und Adulte wurden mit Eisalgen, Phytoplankton bzw. Copepoden gefüttert um möglich Nahrungspräferenze festzustellen und zu ermitteln, ob sich Lipidmuster bzw. lsotopensignal der Nahrungsorganismen im Krill abbilden. Somit dienen die Experimente zugleich als interpretationshilfen fü die Felddaten. In Hungerex~,erimenten soll die vorzugsweise Nutzung bestimmter Energiereserven sowie die Anderung im lsotopensignal verfolgt werden.

F. Trophodynamics and energetics of the Antarctic krill D. Stübin
Conflicting hypotheses prevail On the ovetwintering mechanisms of the Antarctic krill Euphausia superba. Currently, five different strategies are being controversially discussed: reduction of metabolic activity, utilisation of Storage products (lipids, protein), shrinkage feeding On ice algae, carnivory.
This study aimed at characterising physiological condition and feeding behaviour of krill prior to the critical over-wintering period by means of lipid and stable isotope analyses that will be carried out in the home laboratories. Lipid content and lipid class composition indicate the amount and kind of energy reserves and will be measured separately for each ontogenetic stage. The fatty acid composition as well as the enrichment of stable carbon and nitrogen isotopes reflect the animals' feeding histories integrated over several weeks.
Sampling was carried out during ANT XVIl3, part of the animals were directly frozen to provide Information on field krill. The rest was kept alive for 4-7 weeks in aquaria under different conditions. During this leg, long term experiments were continued. Furciliae, juveniles and adults were fed with ice algae, phytoplankton, or copepods, to unravel possible food preferences and to prove whether the lipid Patterns and isotopic signals of the food organisms are reflected in the krill specimens. Thus, the experiments also help interpret the field data. Starving experiments were conducted to reveal preferential use of specific energy reserves as well as to document changes in the isotopic signal.
G. Source regions and transport paths of iron in the Antarctic Circumpolar Current C. Hanfland
During ANT XVIl3, our aim had been to identify the sources and transport mechanisms of the iron into the Atlantic Sector of the Southern Ocean. Principle iron sources are: aeolian inputs from southern South America and the Antarctic Peninsula, advective in uts from their respective continental shelves, and upwelling of deep water. We use " ' ~ a as a tracer for input frorn the continental shelves and ^Th, AI and Nd for aeolian input.
The aim of ANT XVIl4 was mainly to continue and finish sample processing and measuring of samples from the previous cruise. Samples taken during ANT XVIl3 for the analysis of dissolved radium were processed by the '''Th ingrowth method. For detailed objectives, sampling strategy and sample processing See chapter 19.
As a completion of the surface water sampling of suspended particles during ANT XVI/3 to estimate today's role of aeolian input into the S-Atlantic Ocean (described in detail in chapter 19), six additional samples of particulate matter from surface waters have been taken off Namibia and off the Sahara. Aeolian material deposited in these regions should carry a strong fingerprint from the old African craton. Its Nd isotopic composition should therefore be much less radiogenic than expected for the aeolian component of particulate material taken in the Southern Ocean, where the influence of a young volcanic component (high ̂ /^Nd) should be dominant. Analyses of the suspended particles will show whether it is indeed possible to elucidate the origin of their aeolian component from their Nd isotope signature.

particles will show whether it is indeed possible to elucidate the origin of their aeolian component from their Nd isotope signature.
Fig. 1 : Surface water sample locations of particulate matter for the analysis of the Nd isotopic composition. Samples have been taken bv a continuous flow centrifuae.

H. Bio-optik und Bio-chemie von Eisalgen und Phytoplankton T. Mock , U. Westernstroer
Die währen des dritten Fahrtabschnittes der Expedition ANT XVI angefangenen Chemostat- Experimente mit planktonischen Algen (Chaetoceros spp., Thalassiosira spp.) und Eisalgen (Fragilariopsis spp., Pseudonitzschia spp.) wurden währen des vierten Fahrtabschnittes erfolgreich beendet. Die Bestim- mung von biophysikalischen und biochemischen Unterschieden zwischen beiden Algengruppen war Ziel dieser Untersuchung. Durch die Laborexperimente an nährsalzgesättigt und nitratlimitierten Kulturen wurde der Effekt unterschiedlicher Lichtintensitäte (3 pmol Photonen m"2 s" und 20 pmol Photonen m'2 s") auf die Photosynthese und die biochemische Zusammensetzung untersucht. Zudem wurden fü beide Algengruppen Nitrataufnahmekinetiken durchgeführt Alle Ver- suche fanden in einem Kühlcontaine bei - 1 OC statt.
Erste Ergebnisse aus den Fluoreszenz-lnduktionskurven und den P (photo- synthesis) / 1 (irradiance) - Kurven, die mit Hilfe eines puls-amplituden-modulierten Fluorometers durchgeführ wurden, deuten darauf hin, da die Eisalgen photo- physiologisch dynamischer reagieren können als die planktonischen Algen, ob- wohl die Eisalgen in einem stabileren Habitat leben, Im Meereis findet eine ver- tikale Durchmischung so gut wie niemals statt. Z.B. war der Quanten-Yield der Eisalgen unter optimaler Nährstoffversorgun sowohl bei 3 pmol Photonen m" s"' als auch bei 20 pmol Photonen m'2 s" größe als der der planktonischen Algen. Währen der Wachstumslimitation durch Nitratmangel wurde allerdings sichtbar, da die planktonischen Algen unter beiden Lichtintensitäte höher Quanten- Yield's aufwiesen. Das Reoxidationsverhalten von QA scheint bei beiden Algen- gruppen und unter den verschiedenen experimtellen Bedingungen sehr konstant zu bleiben. Eine weitere Besonderheit der Eisalgen, die ausschließlic unter aus- reichender Nährstoffversorgun beobachtet wurde, ist das Auftreten der Chloro- respiration nach längere Zeit (4 Stunden) im Dunkeln. Ein Nachweis hierfü konnte fü die pelagischen Algen nicht gefunden werden. Desweiteren deuten die Nitrat- aufnahmekinetiken der Eisalgen auf einen sehr effizienten und schnellen Aufnahme- mechanismus durch die Zellwand hin. Die Aufnahmeraten sind sehr ähnlic zu denen von Algen aus temperierten Regionen. Die Aufnahmeraten der plank- tonischen Algen liegen etwas unter denen der Eisalgen. Inwieweit sich die bio- chemische Zusammensetzung der beiden Algengruppen unter den genannten experimentellen Bedingungen unterscheidet, kann erst nach der Analyse der ge- wonnenen Proben im Institut gesagt werden,

I. Bio-optics and bio-chemistry of ice algae and phytoplankton T. Mock , U. Westernströe
Chemostat experiments with antarctic phytoplankton (Chaetoceros spp., Thalassiosira spp.) and ice algae (Fragilariopsis spp., Pseudonitzschia spp.)which were established during ANT XVI/3 were successfully completed during the fourth leg of the cruise ANT XVII4. The aim of this study was to determine biophysical and biochemical differences between both groups of algae with regard to the different environmental conditions. The effects of different light intensities On bio- physical processes at photosystem II and the biochemical composition of the algae were investigated during nitrate limited growth. Additional experiments On nitrate uptake kinetics were conducted for both algal groups. All the experiments were carried out in a culture container at - 1 'C.
First results from fluorescence induction curves indicated that the ice algae had a higher photophysiologically action spectrum than the planktonic algae despite the fact that they live in a more stable environment were there is no mixing. At 3 pmol photons m" s" and 20 pmol photons m'* s" for instance, the quantum yield under replete nutrient concentrations was higher for ice algae. However, under nitrat limited growth the planktonic algae had a higher quantum yield under both light intensities. The reoxidation of Qi seems to be very similar and stable for both algal groups and for all applied experimental conditions. Another peculiarity of the ice algae is the onset of chlororespiration after 4 h darkness. The nitrat uptake of the ice algae is very efficient and similar to that in algae living in more temperate regions. Chemical analyses of the biochemical compositions and pigments as well as the activity of the carboxylation enzymes will be conducted in the home laboratory.
K. Participants / Fahrtteilnehmer ANT XVI/4
1. Buldt, Klaus 2. Gerchow, Peter 3. Hofmann, Jör 4. Köhler Herbert 5. Lanning, Giesela 6. Reich, Michael 7. Reinke, Manfred
(DWD) (AWI) (AWI) (DWD) (AWI) (IFM) Kiel (AWI)
L. Participanting Institutes / Beteiligte Institute
AWI Alfred-Wegener-Institut fü Polar- und Meeresforschung Columbusstrasse 2751 5 Bremerhaven
DWD Deutscher Wetterdienst Geschäftsfel Seeschiffahrt Bernhard-Nocht-Str. 76 20359 Hamburg
IFM Kiel Istitut fü Meereskunde Dusternborrker Weg 20 2341 4 Kiel

M. Ship's Crew 1 Schiffsbesatzung ANT XVI
Dienstgrad Name
Kapitä ............................................ Pahl, Uwe .............................. 1. Naut. Offizier Schwarze, Stefan
2. Naut. Offizier .............................. Peine, Lutz .............................. 2 . Naut. Offizier Spielke, Steffen
Arzt .................................................. Schulz, Rudiger
................................. Ltd. Ingenieur Behnes, Stefan ..................................... 2. Ingenieur Erreth, Mon. Gyula ..................................... 2. Ingenieur Ziemann, Olaf ..................................... 2. Ingenieur Fleischer, Martin
Elektriker .......................................... Muhle, Heiko ..................................... Elektroniker Bretfeld, Holger ..................................... Elektroniker Muhle, Helmut ..................................... Elektroniker Greitemann-HackI, A.
Elektroniker ..................................... Roschinsky, Jör
Funkoff izier.. .................................... Koch, Georg
Maschinenwart .............................. .Ipsen, Michael Maschinenwart ............................... Voy, Bernd Maschinenwart ............................... Grate, Jens
............................... Maschinenwart Hartmann, Ernst-Uwe Maschinenwart ............................... Elsner, Klaus
Zimmermann .................................. Reise, Lutz Lagerhalter ...................................... Preußner Jör
..................................... Bootsmann Clasen, Burkhard Matrose .......................................... Gil Iglesias, Luis Matrose .......................................... Pousada Martinez, S. Matrose .......................................... Kreis, Reinhard Matrose .......................................... Schulz, Ottomar Matrose .......................................... Burzan, G.-Ekkehard
.......................................... Matrose Bastigkeit, Kai
Koch ................................................ Haubold, Wolfgang Kochsmaat.. .................................... Völske Thomas Kochsmaat ...................................... Martens, Michael
.............................. 1 . Stewardless Jurgens, Monika
.............................. 2. Stewardless Czyborra, Bärbe
.............................. 2. Stewardiess Deuß Stefanie
.............................. 2. Stewardless Neves, Alexandre ...................................... 2. Steward Tu, Jian Min ...................................... 2. Steward Mui, Kee Fung
......................................... Wäsche Yu, Chung Leung

Folgende Hefte der Reihe ,,Berichte zur Polarforschung" sind bisher erschienen:
Sonderheft Nr. 111981 - ãDi Antarktis und ihr Lebensraum" Eine Einführun fü Besucher - Herausgegeben im Auftrag von SCAR Heft Nr. 111982 -,,Die Fiichner-Schelfeis-Expedition 1980181" zusammengestellt von Heinz Kohnen Heft Nr. 21982 -*Deutsche Antarktis-Expedition 1980181 mit FS ,,Meteor" First International BIOMASS Experiment (FiBEX) - Liste der Zooplankton- und Mikronektonnetzfange zusammengestellt von Norbert Klages Heft Nr. 311982 - -Digitale und analoge Krill-Echolot-Rohdateneriassung an Bord des Forschungs- schiffes ,Meteor'" (im Rahmen von FIBEX 1980181, Fahrtabschnitt ANT III), von Bodo Morgenstern Heft Nr. 411982 - ,,Filchner-Schelfeis-Expedition 1980181" Liste der Planktonfäng und Lichtstärkemessunge zusammengestellt von Gerd Hubold und H. Eberhard Drescher Heft Nr. 511982 -"Joint Biological Expedition On RRS 'John Biscoe', February 1982 by G. Hem'~el and R. B. Heywood Heft Nr. 61 1982 - ,,Antarktis-Expedition 1981182 (Unternehmen ,Eiswarte')' zusammengestellt von Gode Gravenhorst Heft Nr. 71' 982 - ãMarin-Biologische Begleitprogramm zur Standorterkundung 1979180 mit MS .Polar- sirkel' (Pre-Site Survey)" - Stationslisten der Mikronekton- und Zooplanktonfange sowie der Bodenfischerei zusammen gestellt von R. Schneppenheim Heft Nr. 811 983 - "The Post-Fibex Data Interpretation Workshop" by D. L. Crem and J.-C. Freytag with the collaboration of J. W. Schmidt, M. Mall, R. Kresse,T. Schwinghammer Heft Nr. 911983 -"Distribution 01 some groups of zooplankton in the inner Weddell Sea in sumnier 1979180" by I. Hempcl, G. Hubold, B. Kaczmaruk, R. Keller, R. Weigmann-Haass Heft Nr. 10,1983 --Fluor im antarktischen Ökosystem - DFG-Symposium November 1982 zusammentiestellt von Dieter Adeluno . ~
Heft Nr. 1111983 -"Joint Biological Expedition on RRS 'John Biscoe', February 1982 (11)" Data of micfonecton and zooplankton hauls, by Uwe Piatkowski Heft Nr. 1211983 - ãDa biologische Programm der ANTARKTIS-I-Expedition 1983 mit FS ,Polarstern'" Stationsliste n der Plankton-, Benthos- und Grundschleppnetzfange und Liste der Probennahme an Robben und Vogeln, von H. E. Drescher, G. Hubold, U. Piatkowski, J. Plotz und J. Voà Heft Nr. 1311983 - ãDi Antarktis-Expedition von MS ,Polarbjörn 1982183" (Sommerkampagne zur Atka-Bucht und zu den Kraul-Bergen), zusammengestellt von Heinz Kohnen Sonderheft Nr. 21983 - =Die erste Antarktis-Expedition von FS ,Polarstern' (Kapstadt, 20. Januai 1983 - Rio de Janeiro, 25. Mär 1983)", Bericht des Fahrtleiters Prof. Dr. Gotlhill Hernpel Sonderheft Nr. 311983 -Sicherheit und überlebe bei Polarexpeditionen" zusammengestellt von Heinz Kohnen Heft Nr. 1411983 -,,Die erste Antarktis-Expedition (ANTARKTIS I) von FS ,Polarstern' 1982183" herausgegeben von Gotthilf Hempel Sonderheft Nr. 411983 -"On the Biology of Krill Euphausia superbae'- Proceedings 01 the Seminar and Report of the Krill Ecology Group, Bremerhaven 12. - 16. May 1983, edited by S. B. Schnack Heft Nr. 1511983 - "German Antarctic Expedition 1980181 with FRV 'Walther Herwig' and RV'Mete0r'"- First International BIOMASS Experiment (FIBEX) - Data 01 micronekton and zooplankton hauls by Uwe Piatkowski and Norbert Klages Sonderheft Nr. 511984 - "The observatories of the Georg von Neumayer Station", by Ernst Augstein Heft Nr. 1611984 - "FiBEX cruise zooplankton data" by U. Piatkowski, I. Hernpel and S. Rakusa-Suszczewski
' Heft Nr. 1711984 - Fahrtbericht (cruise report) der ,Polarstern'-Reise ARKTIS I, 1983" von E. Augstein, G. Hempel und J. Thiede Heft Nr. 1811984 - ,,Die Expedition ANTARKTIS II mit FS ,Polarstern' 1983/84", Bericht von den Fahrtabschnitten 1 ,2 und 3, herausgegeben von D. Füttere Heft Nr. 1911984 - ãDi Expedition ANTARKTIS II mit FS ,Polarstern' 1983184", Bericht vom Fahrtabschnitt 4, Punta Arenas-Kapstadt (Ant-lll4), herausgegeben von H. Kohnen Heft Nr. 2011984 - ãDi Expedition ARKTIS II des FS ,Polarstern' 1984. mit Beiträge des FS ,Valdivia' und des Forschungsflugzeuges ,Falcon 20'zum Marginal Ice Zone Experiment 1984 (MIZEX)' von E. Augstein, G. Hempel, J. Schwarz, J.Thiede und W. Weigel Heft Nr. 2111985 -"Euphausiid larvae in plankton from the vicinity 01 the Antarctic Penisula, February 1982" by Sigrid Marschal and Elke Mizdalski Heft Nr. 221985 - "Maps of the geographical distribution of macrozooplankton in the Atlantic sector of the Southern Ocean" by Uwe Piatkowski Heft Nr. 2311985 - JJntersuchungen zur Funktionsmorphologie und Nahrungsaufnahme der Larven des Antarktischen Krills Euphausia superba Dana" von Hans-Peter Marschall

Heft Nr. 2411985 - ãUntersuchunge zum Periglazial auf der König-Georg-Inse Sudshetlandinselnl Antarktika. Deutsche physiogeographische Forschungen in der Antarktis. - Bericht übe die Kampagne 1983184" von Dietrich Barsch, Wolf-Dieter Blumet, Woltgang Flügel Roland Mäusbacher Gerhard Stäblein Wolfgang Zick
* Heft Nr. 2511985 - Jie Expedition ANTARKTIS III mit FS ,Polarstern' 198411985" herausgegeben von Gotthilf Hempel. Heft Nr. 2611985 - "The Southern Ocean"; A survey of oceanographic and marine meteorological research work by Hellmer et al.
* Heft Nr. 2711986 - ,,Spätpleistoz$m Sedimentationsprozesse am antarktischen Kontinentathang vor Kapp Norvegia, ostliche Weddell-See" von Hannes Grobe Heft Nr. 2811986 -,,Die Expedition ARKTIS 111 mit ,Polarstern' 1985 mit Beiträge der Fahrtteilnehmer, herausgegeben von Rainer Gersonde Heft Nr. 2911986 - 5 Jahre Schwerp~nktprogramm ,An1ar~Iisforschung' der Deiiischen Forscni.nasoemeisnchatt ' R~ckb l~ck una A ~ s b l t c ~ Zusammengestellt von ~Ötth i l Hempel, Sprecher des Schwerpunktprogramms Heft Nr. 3011986 - T h e Meteorological Data of the Georg-von-Neumayer-Station for 1981 and 1982" by Marianne Gube and Friedrich Obleitner
" Heft Nr. 3111986 - ,Zur Biologie der Jugendstadien der Notothenioidei (Pisces) an der Antarktischen Halbinsel" von A. Kellermann
* Heft Nr. 3211986 - ãDi Expedition ANTARKTIS IV mit FS ,Polarstern' 1985186 mit Beitragen der Fahrtteilnehmer, herausgegeben von Dieter Futterer Heft Nr. 33'1987 - $ie Expedition ANTARKTIS-IV mit FS ,Polarstern' 1985186 - Bericht zu den Fahrtabschnitten ANT-IVl3-4" von Dieter Karl Futterer Heft Nr. 34/1987 - ,,Zoogeographische Untersuchungen und Gemeinschaftsanalysen an antarktischen Makroplankton" von U. Piatkowski Heft Nr. 3511987 - ãZu Verbreitung des Meso- und Makrozooplanktons in Oberflächenwasse der Weddell See (Antarktis)" von E. Boysen-Ennen Heft Nr. 3611987 - ãZu Nahrungs- und Bewegungsphysiologie von Salpa thompsoni und Salpa lusiformisf' von M. Reinke Heft Nr. 3711987 - "The Eastern Weddell Sea Drifting Buoy Data Set of the Winter Weddell Sea Project (WWSP)" 1986 by Heinrich Hoeber und Marianne Gube-Lehnhardt Heft Nr. 3811987 - 'The Meteorological Data of the Georg von Neumayer Station for 1983 and 1984" by M. Gube-Lenhardt Heft Nr. 3911987 -,,Die Winter-Expedition mit FS ,Polarstern' in die Antarktis (ANTVI1-3)' herausgegeben von Sigrid Schnack-Schiel Heft Nr. 4011987 - "Weather and Synoptic Situation during Winter Weddell Sea Project 1986 (ANT V/2) July 16 - September 10, 1986" by Werner Rabe Heft Nr. 4111988 --Zur Verbreitung und Ökologi der Seegurken im Weddellmeer (Antarktis)" von Julian Gutt Heft Nr. 4211988 -"The zooplankton community in the deep bathyal and abyssal zones of the eastetn North Atlantic" by Werner Beckmann
' Heft Nr 4311988 --Sc entitic cru.se report of Arctc Expeo t on ARK IVl3 W ssenschalt icher Fahrtoer~chl der A r ~ t s-Expedit on ARK IV 3 comp .ed bv Jorn Thiede Heft Nr. 4411988 - "Data Report for FV '~olarstern' Cruise ARK IV/1, 1987 to the Arctic and Polar Fronts" by Hans-Jurgen Hirche Heft Nr. 4511988 - ,,Zoogeographie und Gemeinschaftsanalyse des Makrozoobenthos des Weddellmeeres (Antarktis)" von Joachim Voi? Heft Nr. 4611988 - "Meteorological and Oceanographic Data of the Winter-Weddell-Sea Project 1986 (ANT V13)" by Eberhard Fahrbach Heft Nr. 4711988 - *Verteilung und Herkunft glazial-mariner Geröll am Antarktischen Kontinentalrand des östliche Weddellmeeres" von Wolfgang Oskierski Heft Nr. 4811988 - ,,Variationen des Erdmagnetfeldes an der GvN-Station" von Arnold Brodscholl Heft Nr. 4911988 -,,Zur Bedeutung der Lipide im antarktischen Zooplankton" von Wilhetm Hagen Heft Nr. 5011988 - D i e gezeitenbedingle Dynamik des Ekström-Schelfeises Antarktis" von Wolfgang Kobarg Heft Nr. 5111988 - ,,Ökomorphologi nototheniider Fische aus dem Weddellmeer, Antarktis" von Werner Ekau Heft Nr. 5211988 - ãZusammensetzun der Bodenfauna in der westlichen Fram-Straße von Dieter Piepenburg Heft Nr. 5311988 - ,,Untersuchungen zur Ökologi des Phytoplanktons im südöstlich Weddellmeer (Antarktis) im Jan./Febr. 1985" von Eva-Maria Nöthi Heft Nr. 5411988 -,,Die Fischfauna des ostlichen und südliche Weddellmeeres: geographische Verbreitung, Nahrung und trophische Stellung der Fischarten" von Wiebke Schwarzbach Heft Nr. 5511988 - "Weight and length data of zooplankton in the Weddell Sea in austral spring 1986 (Ant. VI3)" by Elke Mizdalski Heft Nr. 5611989 - "Scientific cruise report of Arctic expeditions ARK IV11, 2 & 3" by G. Krause, J. Meinke und J. Thiede

Heft Nr. 5711989 - ãDi Expedition ANTARKTIS V mit FS ,Polarstern' 1986187" Bericht von den Fahrtabschnitten ANT Vl4-5 von H. Miller und H. Oerter Heft Nr. 5811989 - ãDi Expedition ANTARKTIS VI mit FS ,Polarstern' 1987188" von D. K. Füttere Heft Nr. 5911989 -,,Die Expedition ARKTIS Vlla, 1b und 2 mit FS ,Polarstern' 1988" von M. Spindler Heft Nr. 6011989 - ãEi zweidimensionales Modell zur thermohalinen Zirkulation unter dem Schelfeis" von H. H. Helimer Heft Nr. 6111989 -"Die Vulkanite im westlichen und mittleren Neuschwabenland, Vestfjella und Ahlmannryggen, Antarktika" von M. Peters Heft Nr. 6211989 - 'The Expedition ANTARKTIS Vll l l and 2 (EPOS I) of RV 'Polarstern' in 1988189, by i. Hempel Heft Nr. 6311989 - -Die Eisalgenflora des Weddellmeeres (Antarktis): Artenzusammenselzung und Biomasse sowie Okophysiologie ausgewählte Arten" von Annette Bartsch Heft Nr. 6411989 - "Meteorological Data of the G.-V.-Neumayer-Station (Antarctica)" by L. Helmes Heft Nr. 65/1989 -"Exoedition AntarktisVlll3 in 1988189" by 1. Hempel, P. H. Schalk, V. Smetacek Heft Nr. 6611989 - ,,Geomorpno og sch g aziolog scne Detai kariterJng des arid-hcchpo aren ßorgmas vet, Ne~scnwaoenland, Aniarkitka von Karsten Brunk Heft Nr. 6711990 - "Identification key and catalogue of larval Antarctic fishes", edited by Adolf Kellermann Heft Nr. 6811990 - "The Expedition Antarktis Vlll4 (Epos leg 3) and Vlil5 of RV 'Polarstern' in 1983, edited by W. Arntz, W. Ernst, I. Hempei Heft Nr. 6911990 -*Abhängigkeite elastischer und rheologischer Eigenschaften des Meereises vom Eisaefüae" von Harald Hellmann - .
" Heft Nr. 7011990 - ,,Die beschallen benthischen Mollusken (Gastropoda und Bivalvia) des Weddellmeeres, Antarktis", von Stefan Hain Heft Nr. 7111990 - ,,Sedimentologie und Paiäomagneti an Sedimenten der Maudkuppe (Nordöstliche Weddellmeiirl". von Dieter Cordes , . Heft Nr. 7211990 -"Distribution and abundance of planktonic copepods (Crustacea) in the Weddell Sea in summer ~980181-, by F. Kurbjeweit and S. Ali-Khan Heft Nr. 7311990 - ,,Zur Fruhdiagenese von organischem Kohlenstoff und Opal in Sedimenten des sudlichen und östliche Weddellmeeres" von M. Schluter Heft Nr. 7411990 - ãExpeditione ANTARKTIS-VIIIl3 und Vlill4 mit FS ,Polarstern7 1 9 8 9 von Rainer Gersonde und Goiihilf Hempel Heft Nr. 7511991 -,,Quartär Sedimentationsprozesse am Kontinentalhang des Süd-Orkey-Plateau im nordwestlichen Weddellmeer (Antarktis)", von Sigrun Grunig Heft Nr. 7611990 - *Ergebnisse der faunistischen Arbeiten im Benthal von King George island (Sudshetlandinseln, Antarktis)", von Martin Rauschert Heft Nr. 7711990 - ,,Verteilung von Mikropiankton-Organismen nordwestlich der Antarktischen Halbinsel unter dem Einfluà sich ändernde Umweltbedingungen im Herbst", von Heinz Klöse Heft Nr. 7811991 - ,,Hochauflösend Magnetostratigraphie spätquartär Sedimente arktischer Meeresaebiete". von Norbert R. Nowaczvk Heft Nr 7911991 - Okopnys o!ogiscne Untersucn~ngen z-ir Sa1.n iats ~ n d Temperai~rioleranz antarkiiscner Grunalgen Jnler besonderer Berucksichtigung des b-Dimetnylsulfon~~mprop onat iDMSP1 Sioffwechseis von Ull Karsten . ,
Heft Nr. 8011991 --Die Expedition ARKTIS Vll l l mit FS ,Polarstern' 1990, herausgegeben von Jör Thiede und Gotthilf Hempel Heft Nr. 8111 991 - ,,Paläoglaziologi und Paläozeanographi im Spätquartà arn Kontinentalrand des sudlichen Weddelmeeres, Antarktis", von Martin Melles Heft Nr. 8211991 - ,Qãanii zierJng von Meereseigenschafien A~iomatische Bi danaiyse don D~nnscnniiten ̂nd Paramet i~~er~nq von Ch oropny.1. Jna Salzqenaitsverteiiunqen', von H a o E cKen . .
Heft Nr. 8311991 -,,Das Fließe von Schelfeisen - numerische Simulationen mit der Metholde der finiten Differenzen", von Jurgen Determann Heft Nr. 8411991 -,,Die Expedition ANTARKTIS-Viiill-2, 1989 mit der Winter Weddell Gyre Study der Forschungsschiffe .Polarstern' und ,Akademik Fedorov'", von Ernst Augstein, Nikolai Bagriantsev und Hans Werner Schenke Heft Nr. 8511991 -,Zur Enisienung von ^nterwassere s ~ n d aas Wachstum und d e Energieoilanz des Meere Ses in oer Ai<a B-icht. Anlarki s , von Josef Kiplst~hl Heft Nr. 8611991 - ãDi Expedition ANTARKTIS-VIII mit FS ,Polarstern' 1989190. Bericht vom Fahrtabschnitt ANTVIil15", von Heinz Miiler und Hans Oerter Heft Nr. 8711991 - "Scientific cruise reports of Arclic expeditions ARK Vl l l -4 of RV 'Polarstern' in 1989", edited by G. Krause, J. Meincke & H. J. Schwarz Heft Nr. 8811991 --Zur Lebensgeschichte dominanter Copepodenarten (Calanus finrnarchicus, C. glacialis, C. hyperboreus, Metridia longa) in der Framstraße" von Sabine Diel

Heft Nr. 8911991 -,,Detaillierte seismische Untersuchungen am östliche Kontinentalrand des Weddeli-Meeres vor Kapp Nowegia, Antarktis", von Norbert E. Kaul Heft Nr. 9011991 - ãDi Expedition ANTARKTIS-VIII mit FS ,Polarstern' 1989190. Bericht von den Fahrtabschnitten ANT-Vllil6-i", herausgegeben von Dieter Karl Füttere und Otto Schrems Heft Nr. 9111991 - "Blood physiology and ecological consequences in Weddell Sea fishes (Antarctica)", by Andreas Kunzmann Heft Nr. 92/1991 - -Zur sommerlichen Verteilung des Mesozooplanktons im Nansen-Becken, Nordpolarmeer", von Nicolai Mumm Heft Nr. 9311991 - ãDi Expedition ARKTIS VII mit FS ,Polarstern1, 1990. Bericht vom Fahrtabschnitt ARK VllI2". herausoeoeben von Gunther Krause Heft Nr 9411991 - ,D e Entw c k l ~ n g des pnyto; i n ~ l o n s m ost ichen Weode lmeer (Aniar<iis, oeim Ubcroana vom Sflatw nler Z J ~ Fruhianr von Renale Scharek Heft Nr. 95/1961 - ,,~~dioisoto~enstrat i~ra~hie, Sedimentologie und Geochemie jungquartäre Sedimente des ostlichen Arktischen Ozeans", von Horst Bohrmann Heft Nr. 9611991 -,,Holozän Sedimentationsentwicklung im Scoresby Sund, Ost-Grönland" von Peter Marienfeld Heft Nr. 9711991 - ãStrukturell Entwicklung und Abkühlungsgeschicht von Heimefrontfjella (Westliches Dronning Maud LandIAntarktika)", von Joachim Jacobs Heft Nr. 9811991 - ãZu Besiedlungsgeschichte des antarktischen Schelfes am Beispiel der lsopoda (Crustacea, Malacostraca)", von Angelika Brandt Heft Nr. 9911992 - 'The Antarctic ice sheet and environmental Change: a three-dimensional modelling study", by Philippe Huybrechts
' Heft Nr. 70011992 -,,Die Expeditionen ANTARKTIS IX/1-4 des Forschungsschiffes ,Polarstern' 1990191" herausgegeben von Ulrich Bathmann, Meinhard Schulz-Baldes, Eberhard Fahrbach. Victor Smetacek und Hans-Wolfoana Hubberten Heft Nr. 10111992 - ãWechselbeziehunge zwischen-~chwermetallkonzentrationen (Cd, Cu, Pb, Zn) im Meerwasser und in Zooplanktonorganismen (Copepoda) der Arktis und des Atlantiks", von Christa Pohl Heft Nr 102/1992 - ,Physiologe und Ultrastru~tdr aer anlar~t.schen Grunalge Prasiola cr iwa ssp antarclica Lnter osniot.schem Streà Jna A~strocr<nuno von Andreas Jacoo
* Heft Nr. 10311992 - Jur Ökologi der Fische im Weddellmeer", von ~ e r i ~ u b o l d Heft Nr. 10411992 - ,,Mehrkanalige adaptive Filter fü die Unterdrückun von multiplen Reflexionen in Verbindung mit der freien Oberfläch in marinen Seismogrammen", von Andreas Rosenberger Heft Nr. 10511992 - "Radiation and Eddy Flux Experiment 1991 (REFLEX /T. von Jör Hartmann, Christo~h Kottmeier und Christian Wamser Heft Nr lob11 992 - Ostracooeri n i Ep pe agiai vor der Anlarkt scnen Haib nscl - ein Be trag zJr Svslcmattfi ?o-i'.ic zur Vororeiiuna und Po~i t lanonsstr~Kt~r unler Borlicksichl oJna der Sa sonalitai - von Rüdige Kock Heft Nr. 10711992 - ,,ARCTIC'91: Die Expedition ARK-VIIIl3 mit FS ,Polarstern' 1991", von Dieter K. Füttere Heft Nr. 10811992 - ,,Dehnungsbeben an einer Storungszone im Ekström-Schelfei nördlic der Georg-von-Neumayer-Station, Antarktis. - Eine Untersuchung mit seismologischen und geodätische Methoden", von Uwe Nixdori. Heft Nr. 10911992 - ,,Spätquartä Sedimentation am Kontinentalrand des südöstlich Weddellmeeres, Antarktis", von Michael Weber. Heft Nr. 11011992 - ,,Sedimentfazies und Bodenwasserstrom am Kontinentalhang des norwestlichen Weddellmeeres", von Isa Brehme. Heft Nr. 11 111992 - ãDi Lebensbedingungen in den Solekanälche des antarktischen Meereises", von Jürge Weissenberger. Heft Nr. 112/1992 - ,,Zur Taxonomie von rezenten benthischen Foraminiferen aus dem Nansen Becken, Arktischer Ozean", von Jutta Wollenburg. Heft Nr. 11311992 - ãDi Expedition ARKTIS Vl l l l l mit FS ,Polarstern' 19914', herausgegeben von Gerhard Kattner. Heft Nr. 11411992 - ,,Die Grundungsphase deutscher Polariorschung, 1865 - 1875, von Reinhard A. Krause. Heft Nr. 11511992 -"Scientific Cruise Report of the 1991 Arctic Expedition ARK Vllll2 of RV 'Polarstern' (EPOS II)", by Eike Rachor. Heft Nr. 11611992 - "The Meteorological Data of the Georg-von-Neumayer-Station (Antarctica) for 1988, 1989, 1990 and 1991", by Gert König-Langlo Heft Nr. 11711992 - ,,Petrogenese des metamorphen Grundgebirges der zentralen Heimefrontfjella (westliches Dronning Maud Land I Antarktis)", von Peter Schulze. Heft Nr. 11811993 - -Die mafischen Gäng der Shackleton Range IAntarktika: Petrographie, Geochemie, Isotopengeochemie und Paläomagnetik" von Rüdige Holten. Heft Nr. 11911993 - ,,Gefrierschutz bei Fischen der Polarmeere", von Andreas P. A. Wöhrmann
* Heft Nr. 72011993 - "East Siberian Arclic Region Expedition '92: The Laptev Sea - its Significance for Arctic Sea-Ice Formation and Transpolar Sediment Flux", by D. Dethleff, D. Nürnberg E. Reimnitz, M. Saarso and Y. P. Sacchenko. - "Expedition to Novaja Zemlja and Franz Josef Land with RV. 'Dalnie Zelentsy"', by D. Nürnber and E. Groth.

Heft Nr. 12111993 - ãDi Expedition ANTARKTIS Xi3 mit FS ,Polarstern' 1992". herausgegeben von Michael Spindler, Gerhard Dieckmann und David Thomas Heft Nr. 12211993 -*Die Beschreibung der Korngestait mit Hilfe der Fourier-Analyse: Parametrisierung der morphologischen Eigenschaften von Sedimenlpartikeln", von Michael Diepenbroek. Heft Nr. 12311993 - ,,Zerstörungsfrei hochauflösend Dichteuntersuchungen mariner Sedimente", von Sebastian Gerland. Heft Nr. 12411993 -*Umsatz und Verteilung von Lipiden in arktischen marinen Organismen unter besonderer Berücksichtigun unterer trophischer Stufen", von Martin Graeve. Heft Nr. 12511993 - ,,Okologie und Respiration ausgewählte arktischer Bodenfischarten", von Christian F. von Dorrien. Heft Nr. 12611993 - Q~anii iai ive Best mmung von Pa ao~mweltparametern des AntarKt sehen Obert achenwassers m Soaia~ariier dnhand von Transferi~nkt onen mit Diatomeen von Uir4cn Z e inski Heft Nr. 12711993 - ,,~edime"ttrans~ort durch das arktische Meereis: Die rezente lithogene und biogene Materialfrachi", von Ingo Wollenburg. Heft Nr. 128/1993 - "Cruise ANTARKTIS W3 of RV 'Polarstern': CTD-Repori", von Marek Zwierz Heft Nr. 12911993 - ,,Reproduktion und Lebenszyklen dominanter Copepodenarten aus dem Weddellmeer, Antarktis", von Frank Kurbieweit Heft Nr. 13011993 - ,Unicrsuch~ngen zu Tcmpcrati-rreg rne i.no Mas~enlia~shalt des Fr cliner-Hor~rie-Schelf2ises. Aniarkt s. Jnier ocsonoerer Ber~cksicnt~o~nf l von Anfr er- Uno " Abschmelzprozessen", von Klaus Grosfeld Heft Nr. 13117993 - Jie Expedition ANTARKTIS W5 mit FS ,Polarstern* i992", herausgegeben von Rainer Gersonde Heft Nr. 132/1993 -,,Bildung und Abgabe kurzkettiger halogenierter Kohlenwasserstoffe durch Makroalgen der Polarregionen-, von Frank Laturnus Heft Nr. 13311994 -"Radiation and Eddy Flux Experiment 1993 (REFLEXIIf, by Christoph Kottmeier, Jör Hartmann, Christian Wamser, Axel Bochert, Christof Lüpkes Dietrnar Freese and Wolfgang Cohrs
* Heft Nr. 13411994 -"The Expedition ARKTIS-IHl", edited by Hajo Eicken and Jens Meincke Heft Nr. 13511994 -=Die Expeditionen ANTARKTIS H6-E", herausgegeben von Ulrich Bathmann, Victor Smetacek, Hein de Baar, Eberhard Fahrbach und Gunter Krause Heft Nr. 13611994 - ãUntersuchunge zur Ernährungsökolog von Kaiserpinguinen (Aptenodytes forsten) und Königspinguine (Aptenodytes patagonicusf, von Klemens Püt Heft Nr. 13711994 - Jie känozoisch Vereisungsgeschichte der Antarktis", von Werner U. Ehrmann Heft Nr. I3811994 - JJntersuchungen stratosphärische Aerosole vulkanischen Ursprungs und polarer stratospharischer Wolken mit einem Mehrwellenlängen-Lida auf Spitzbergen (79O N, 12" Ef von Georg Beyerle Heft Nr. 13911994 - &harakterisierung der Isopodenfauna (Crustacea, Malacostraca) des Scotia-Bogens aus biogeographischer Sicht: Ein multivariater Ansatz", von Holger Winkler. Heft Nr. 14011994 - ãDi Expedition ANTARKTIS Xi4 mit FS ,Polarstern' 1992, herausgegeben von Peter Lemke Heft Nr. 14111994 - ,,Satellitenaltimetrie übe Eis - Anwendung des GEOSAT-Altimeters übe dem Ekströmisen Antarktis", von Clemens Heidland Heft Nr. 14211994 - "The 1993 Northeast Water Expedition. Scientific cruise report of RV 'Polartstern' Arctic cruises ARK I H 2 and 3, USCG 'Polar Bear'cruise NEWP and the NEWLand expedition", edited by Hans-Jürge Hirche and Gerhard Kattner Heft Nr. 14311994 - ãDetailliert refraktionsseismische Untersuchungen im inneren Scoresby Sund Ost-Grönland von Notker Fechner Heft Nr. 14411994 - "Russian-German Cooperation in the Siberian Shelf Seas: Geo-System Laptev Sea", edited by Heidemarie Kassens, Hans-Wolfgang Hubberten, Sergey M. Pryamikov and Rüdige Stein Heft Nr. 14511994 -"The 1993 Northeast Water Expedition. Data Report of RV ,Polarstern' Arctic Cruises lW2 and Y , edited by Gerhard Kattner and Hans-Jürge Hirche. Heft Nr. 14611994 -"Radiation Measurements at the German Antarctic Station Neumayer 1982 - 1992', by Torsten Schmidt and Gerd König-Langlo Heft Nr. 14711994 - ,,Krustenstrukturen und Verlauf des Kontinentalrandes im Weddell-Meer 1 Antarktis", von Christian Hübscher
* Heft Nr. 148/1994 - "The expeditions NORILSWAYMYR 1993 and BUNGER OASIS 1993194 of the AWI Research Unit Potsdam", edited by Martin Melles.
" Heft Nr. 14911994 - "Die Expedition ARCTIC '93. Der Fahrtabschnitt ARK-1x14 mit FS ,Polarstern' 199Y, herausgegeben von Dieter K. Fütterer Heft Nr. 15011994 - ,,Der Energiebedarf der Pygoscelis-Pinguine: eine Synopse", von Boris M. Culik. Heft Nr. 15111994 - "Russian-German Cooperation: The Transdrift l Expedition to the Laptev Sea", edited by Heidemarie Kassens and Valeriy Y. Karpiy, Heft Nr. 15211994 --Die Exoedition ANTARKTIS-X mit FS .Polarsternc 1992. Bericht von den Fahriaoschn~tien 1 ANT-X l'a und 2', hera~sgegeben von He nz Miller Heft Nr. 15311994 - .Aminosauren uno Huminsloffe im Stickstoff~reislauf oolarer Meere". von Ulrike ~ubberten. Heft Nr. 15411994 - "Regional and seasonal variability in the vertical distribution of mesozooplankton in the Greenland Sea", by Claudio Richter.

Heft Nr. 15511995 - ,,Benthos in polaren Gewässern" herausgegeben von Christian Wiencke und Wolf Arntz. Heft Nr. 15611995 -"An adjoint model for the determination of the mean oceanic circulation, air-sea fluxes and mixing coefficients*', by Reiner Schlitzer. Heft Nr. 15711995 - ,,Biochemische Untersuchungen zum Lipidstofiwechsel antarktischer Copepoden", von Kirsten Fahl.
* Hefi Nr. 15811995 -..Die Deutsche Polarforschuna seit der Jahrhundertwende und der Einfluà Erich von Drvoalskis" ,- . von Cornelia ~üdeck' i
+ Heft Nr. 15911995 -"The distribution of 9"0 in the Arctic Ocean: Implications for the freshwater balance of the halocline and the sources of deep and bottom waters", by Dorothea Bauch, Heft Nr 16011995 - Rekonsir~ki on der spatquartaren T i e f e n v . a s s e r ~ ~ r ~ ~ ~ a l ~ o n Jno Proouhl v.tat im osttchen Suoal atiitrv (Inhdno von oentnfsctlen Foram niferenvergose Ischall~nqen , '.On Gerharo Scnm eol Heft Nr. 16111995 - ãDe Einfluà von Salinitä und ~ichtintensitä aufdie Osmolytkonzentrationen, die Zellvolumina und die Wachstumsraten der antarktischen Eisdiatomeen Chaetoceros sp. und Navicula sp. unter besonderer Berücksichtigun der Aminosäur Prolin", von Jürge Nothnagel. Heft Nr. 162/1995 - ,,Meereistransportiertes lithogenes Feinmaterial in spatquartäre Tiefseesedimenten des zentralen östliche Arktischen Ozeans und der Framstraße" von Thomas Letzig. Heft Nr. 16311995 - Jie Expedition ANTARKTIS-XI12 mit FS ,Polarstern' 1993194, herausgegeben von Rainer Gersonde. Heft Nr. 16411995 - ãRegional und altersabhängig Variation gesteinsmagnetischer Parameter in marinen Sedimenten der Arktis", von Thomas Frederichs. Heft Nr. 16511995 - ãVorkommen Verteilung und Umsatz biogener organischer Spurenstoffe: Sterole in antarktischen Gewässern" von Georg Hanke. Heft Nr. 16611995 - ,,Vergleichende Untersuchungen eines optimierten dynamisch-thermodynamischen Meereismodells mit Beobachtunaen im Weddellmeer", von Holaer Fischer. Heft Nr. 16711965 - , Rekonslr~kl~onen von ~a lao-~mne l l~aramete rn annano kon stao ien ISolopen .nd Faunen-Voroeso ,sChaftJnoen oiani<tischer Forarniniforsn m S ~ d a i antik . von Hans-Stefan Nieoler Heft Nr. 168/1995 - ãDi Expedition ANTARKTIS XI1 mit FS ,Polarstern' 1993194, Bericht von den Fahrtabschnitten ANT Xl l l l und 2 , herausgegeben von Gerhard Kattner und Dieter Karl Füttere Heft Nr. I6911995 - ãMedizinisch Untersuchung zur Circadianrhythmik und zum Verhalten bei Uberwinterern auf einer antarktischen Forschungsstation", von Hans Wortmann Heft-Nr, 17011995 - DFG-Kolloquium: Terrestrische Geowissenschaften - Geologie und Geophysik der Antarktis. Heft Nr. 17111995 - ,,Strukturentwicklung und Petrogenese des metamorphen Grundgebirges der nördliche Heimfrontfjella (westliches Dronning Maud LandlAntarktika)", von Wilfried Bauer. Heft Nr. 172/1995 - *Die Struktur der Erdkruste im Bereich des Scoresby Sund, Ostgrönland Ergebnisse refraktionsseismischer und gravimetrischer Untersuchungen", von Holger Mandler. Heft Nr. 17311995 - ãPaläozoisc Akkretion am paläopazifische Kontinentalrand der Antarktis in Nordvictorialand - P-T-D-Geschichte und Deformationsmechanismen im Bowers Terrane", von Stefan Matzer. Heft Nr. 17411995 - "The Expedition ARKTIS-W2 of RV 'Polarstern' in 1994, edited by Hans-W. Hubberten Heft Nr. 17511995 - "Russian-German Cooperation: The Expedition TAYMYR 1994", edited by Christine Sieger! and Gmitry Bolshiyanov, Heft Nr. 17611995 -"Russian-German Cooperation: Laptev Sea System", edited by Heidemarie Kassens, Dieter Piepenburg, Jör Thiede, Leonid Timokhov, Hans-Wolfgang Hubberten and Sergey M. Priamikov. Heft Nr. 17711995 --Organischer Kohlenstoff in spätquartär Sedimenten des Arktischen Ozeans: Terrigener Eintrag und marine Produktivität" von Carsten J. Schubert Heft Nr. 178/1995 - -Cruise ANTARKTIS Xlll4 of RV'Polarstern' in 1995: CTD-Repori", by Juri Sildam. Heft Nr. 17911995 - ,,Benthische Foraminiferenfaunen als Wasserrnassen-, Produktions- und Eisdriftanzeiger im Arkti- schen Ozean", von Jutta Wollenburg. Heft Nr. 18011995 - ,,Biogenopal und biogenes Barium als Indikatoren fü spätquartä Produktivitätsanderunge am antarktischen Kontinentalhang, atlantischer Sektor", von Wolfgang J. Bonn. Heft Nr. 18111995 - ãDi Expedition ARKTIS W1 des Forschungsschiffes ,Polarstern' 1994, herausgegeben von Eberhard Fahrbach. Heft Nr. 182/1995 -"Laptev Sea System: Expeditions in 1994, edited by Heidemarie Kassens. Heft Nr. 18311996 - ã~nl'erpretation'digitale ~arasound Echoiotaufzeichnungen im östliche Arktischen Ozean auf der Grundlaae physikalischer Sedimenteiaenschaften". von Uwe Beramann. Heft ~r.-184/1996 - "Distribution anddynamics of inorganic nitrogen compounds in the troposphere of continental, coastal, marine and Arctic areas", by Maria Dolores Andres Hernandez. Hefi Nr. 18511996 -",,Verbreitung und Lebensweise der Aphroditen und Polynoiden (Polychaeta) im östliche Weddell- meer und im Lazarevmeer (Antarktis)", von Michael Stiller. Heft Nr. 18611996 - "Reconstruction of Late Quaternary environmental conditions applying the natural radionuclides "Th, "Be, "'Pa and zBU: A study of deep-sea sediments from the eastern sector of the Antarctic Circumpolar Current Svstem". bv Martin Frank. , , ,
Heft Nr. 18711996 - "The Meteorological Data of the Neumayer Station (Antarctica) for 1992, 1993 and 1994, by Gert König-Lang1 and Andreas Herber. Heft Nr. 18811996 - ãDi Expedition ANTARKTIS-XI13 mit FS ,Polarstern' 1994, herausgegeben von Heinz Miller und Hannes Grobe. Hefi Nr. 18911996 - ãDi Expedition ARKTIS-V1113 mit FS ,Polarstern' 1990", herausgegeben von Heinz Miller und Hannes Grobe

Heft Nr. 19011996 -"Cruise report of the Joint Chilean-German-ltalian Magellan ,Victor Hensen' Campaign in 1994¡ edited by Wolf Arntz and Matthias Gorny. Heft Nr. 19111996 - ,,Leitfähigkeits und Dichtemessung an Eisbohrkernen", von Frank Wilhelms, Heft Nr. 192/1996 - ,,PhotosynIhese-Charakteristika und Lebensstrategie antarktischer Makroalgen", von Gabriele Weykam. Heft Nr. 19311996 - %Heterogene Reaktionen von N205 und Hbr und ihr Einfluà auf den Ozonabbau in der polaren Stratosphäre" von Sabine Seisel. Heft Nr. 19411996 - ãOkologi und Populationsdynamik antarktischer Ophiuroiden (Echinodermata)", von Corinna Dahm. Heft Nr. 19511996 -,,Die planktische Foraminifere Neogloboquadn'na pachyderma (Ehrenberg) im Weddellmeer, Antarklis", von Doris Berberich. Heft Nr. 19611996 -,,Untersuchungen zum Beitrag chemischer und dynamischer Prozesse zur Variabilitat des stratosphärische Ozons übe der Arktis", von Birgit Heese Heft Nr. 19711996 - "The Expedition ARKTIS-XI12 of 'Polarstern'in 1995, edited by Gunther Krause. Heft Nr. 198/1996 - -Geodynamik des Westantarktischen Riftsystems basierend auf Apatit-Spaltspuranalysen", von Frank Lisker. Heft Nr. 19911996 -"The 1993 Northeast Water Expedition. Data Report On CTD Measurements of RV 'Polarstern' Cruises ARKTIS 1x12 and 3" by Gerion Budeus and Wolfgang Schneider. Heft Nr. 200/1996 - "Stability of the Thermohaline Circulation in analytical and numerical models", by Gerrit Lohmann. Heft Nr. 20111996 -,,Trophische Beziehungen zwischen Makroalgen und Herbivoren in der Potter Cove (King George-Insel, Antarktis)", von Katrin Iken. Heft Nr. 202/1996 - ãZu Verbreitung und Respiration ökologisc wichtiger Bodentiere in den Gewässer um Svalbard (Arktis)", von Michael K. Schmid.
' Heft Nr. 20311996 - ãDynamik Rauhigkeit und Alter des Meereises in der Arktis - Numerische Untersuchungen mit einem großskalige Modell", von Markus Harder. Heft Nr. 20411996 - ãZu Parametrisierung der stabilen atmosphärische Grenzschicht übe einem antarktischen Scheffels", von Dörlh Handorf. Heft Nr. 20511996 - "Textures and fabrics in the GRIP ice core, in relation to climate history and ice deformation", by Thorsteinn Thorsteinsson. Heft Nr. 20611996 - Der Ozean als Tei des gekoppelten Klimasysiems Versucn der Rekonstr~rdion der g az alen Zirkuldiion m t berscn eden 6omp exen Atmos~harenkom~onenten von &erst n F ea Heft Nr. 20711996 - ,,Lebensstrategien dominanter antarktischer Oithonidae (Cyclopoida, Copepoda) und Oncaeidae (Poecilostomatoida, Copepoda) im Bellingshausenmeef', von Cornelia Metz. Heft Nr. 20811996 - ,,Atmosphäreneinflu bei der Fernerkundung von Meereis mit passiven Mikroweilenradiometern", von Christoph Oelke. Heft Nr. 20911996 - ,,Klassifikation von Radarsatellitendaten zur Meereiserkennung mit Hilfe von Llne-Scanner-Messun- gen", von Axel Bochert. Heft Nr. 210/1996 --Die mit ausgewählte Schwämme (Hexactinellida und Demospongiae) aus dem Weddellmeer, Antarktis, vergesellschaftete Fauna", von Kathrin Kunzmann. Heft Nr. 21111996 -"Russian-German Cooperation: The Expedition TAYMYR 1995 and the Expedition KOLYMA 1995, by Dima Yu. Bolshiyanov and Hans-W. Hubberten. Heft Nr. 21211996 - "Surface-sediment composition and sedimentary processes in the central Arctic Ocean and along the Eurasian Continental Margin", by Ruediger Stein, Gennadij I. Ivanov, Michael A, Levitan, and Kirsten Fahl. Heft Nr. 21311996 - ,,Gonadenentwicklung und Eiproduktion dreier Calanus-Arten (Copepoda): Freilandbeobachtungen, Histologie und Experimente", von Barbara Niehoff Heft Nr. 21411996 - ãNumerisch Modellierung der Übergangszon zwischen Eisschild und Eisschelf", von Christoph Mayer. Heft Nr. 21511996 -=Arbeiten der AWI-Forschungsstelle Potsdam in Antarktika, 1994195 herausgegeben von Ulrich Wand. Heft Nr. 21611996 - ,,Rekonstruktion quartäre Klimaknderungen im atlantischen Sektor des Südpolarmeere anhand von Radiolarien", von Uta Brathauer. Heft Nr. 21711996 - ,,Adaptive Semi-Lagrange-Finite-Elemente-Methode zur Lösun der Flachwassergleichungen: Imolemenlieruno und Parallelisieruno". von Jör Behrens. Heft Nr 218/1997 - Fladanon and Eody F JX Experiment 1995 ( R E F I X 111) , by Jorg hartmann, Axel Bochert D elmar Freese Cnr8slopn Koiimcicr, Daqmar Naqel an0 Afiareas Re-lcr Heft Nr. 21911997 - ãDi Expedition ANT~KTIS-XII mit FS ,Polarstern' 1995. Bericht vom Fahrtabschnitt ANT-XIIl3, herausgegeben von Wilfried Jokat und Hans Oerter. Heft Nr. 22011997 - ãEi Beitrag zum Schwerefeld im Bereich des Weddellmeeres, Antarktis. Nutzung von Altimetermessungen des GEOSAT und ERS-l", von Tilo Schöne Heft Nr. 22111997 - ãDi Expeditionen ANTARKTIS-XIII/l-2 des Forschungsschiffes ,Polarsternp 1995/96", herausgegeben von Ulrich Bathmann, Mike Lukas und Victor Smetacek. Heft Nr. 222/1997 - "Tectonic Structures and Glaciomarine Sedimentation in the South-Eastern Weddell Sea from Seismic Reflection Data", by Ldszlo Oszko.

Heft Nr. 22311997 - ãBestimmun der Meereisdicke mit seismischen und elektromagnetisch-induktiven Verfahren", von Christian Haas. Heft Nr. 22411997 - ,,Tropospharische Ozonvariationen in Polarregionen", von Silke Wessel. Heft Nr. 22511997 - ,,Biologische und ökologisch Untersuchungen zur kryopelagischen Amphipodenfauna des arktischen Meereises: von Michael Poltermann. Heft Nr. 22611997 - "Scientific Cruise Report of the Arctic Expedition ARK-XI11 of RV 'Polarstern' in 1995", edited bv Eike Rachor. Heft Nr. 22711997 - Der Emfliià kompalioler S ~ ~ s i a n z e n und Krioproiekioren a ~ l d.e Enzyme Ma atdenydrogenasc ihlDri, Jnu G-~.cose-6-phospnai-Deh)arogenase (G6P-DHj a JS Acrosiphonia arcla (Chiorophvtaj der Ar6i.s , von Katharina Kuck. Heft Nr. 22811997 -,,Die Verbreitung epibenthischer Mollusken im chilenischen Beagle-Kanal", von Katrin Linse. Heti Nr. 22911997 - ,Das Mesozoop.an6ton im -apievmeer ~ n d 081 chen Nansen-Becken - Verioi Jng ~ n d Gcmeinscnaftssir~riti.ren im Spatsommer , von h nr cn nanssen. Heft Nr. 23011997 - ãModel eines adaptierbaren, rechnergestützten wissenschaftlichen Arbeitsplatzes am Alfred-Wegener-Institut fü Polar- und Meeresfoischung", von Lutz-Peter Kurdelski Heft Nr. 23111997 - ãZu Ökologi arktischer und antarktischer Fische: Aktivität Sinnesleistungen und Verhallen", von Christopher Zimmermann Heft Nr. 23Z1997 - ,,Persistente chlororganische Verbindungen in hochantarktischen Fischen", von Stephan Zimmermann Heft Nr. 23311997 - , Z L ~ Okoloq'e des D.metnyIs~lfon umprop onai (DMSPj-Gehaiios temper erier ~ n d polarer Phvtop ankionaeme.nscnafien im Veraleicn mit Labori\~luren der Cocco.ilho~horioe Eniiliania h~xlev. Jna oer aniar<li- sehen ~ ia tomee Nitzschla lecointei', von Doris Meyerdierks. Heft Nr. 23411997 --Die Expedition ARCTIC '96 des FS ,Polarstern' (ARK XIII) mit der Arctic Climate System Study (ACSYS)", von Ernst Augstein und den Fahrtteilnehmern. Heft Nr. 23511997 - ãPolonium-21 und Blei-219 im Südpolarmeer Natürlich Tracer fü biologische und hydrographische Prozesse im Oberflächenwasse des Antarktischen Zirkumpolarstroms und des Weddellmeeres", von Jana Friedrich Heft Nr. 23611997 -"Determination of atmospheric trace gas amounts and corresponding natural isotopic ratios by means of ground-based FTIR spectroscopy in the high Arctic", by Arndt Meier. Heft Nr. 23711997 - "Russian-German Cooperation: The Expedition TAYMYRISEVERNAYA ZEMLYA 1996, edited by Martin Melles, Birgit Hagedorn and Dmitri Yu. Bolshiyanov Heft Nr. 23811997 - "Life strategy and ecophysiology of Antarctic macroalgae", by Ivan M. Gbmez. Heft Nr. 23911997 - Jie Expedition ANTARKTIS Xllll4-5 des Forschungsschiffes ,Polarstern' 1996, herausgegeben von Eberhard Fahrbach und Dieter Gerdes. Heft Nr. 24011997 - JJntersuchungen zur Chrom-Speziation in Meerwasser, Meereis und Schnee aus ausgewählte Gebieten der Arktis". von Heide Giese. Heft Ni. 24111997 - Laie Qi-aternarj glacia. n Story an0 pa eoceanographic rcconstri-ciions a ong the East Gfeenfand conl.nontal marg n Ev dence from n.gn-reso~iion records 01 stable isotopes an0 ice-raftea deDr 8,. bv Seuna-ll Nam . - Heft Nr. 2 4 ~ 1 9 9 7 -"Thermal, hydroiogical and geochemical dynamics i f the active layer at a continuous permafrost site, Taymyr Peninsula, Siberia", by Julia Boike. Heft Nr. 24311997 - Jur Pal&oozeanographie hoher Breiten: Stellvertreterdaten aus Foraminiferen", von Andreas Mackensen. Heft Nr. 24411997 - "The Geophysical Observatory at Neumayer Station, Antarctica, Geomagnetic and seismological observations in 1995 and 1996", by Alfons Eckstaller, Thomas Schmidt, Viola Graw, Christian Mülle and Johannes Rogenhagen. Heft Nr. 24511997 - ,,Temperaturbedarf und Biogeographie mariner Makroalgen - Anpassung mariner Makroalgen an tiefe Temperaturen, von Bettina Bischoff-Bäsmann Heft Nr. 24611997 - ,,Ökologisch Untersuchungen zur Fauna des arktischen Meereises", von Christine Friedrich. Heft Nr. 24711997 -,,Entstehung und Modifizierung von marinen gelöste organischen Substanzen", von Berit Kirchhoff. Heft Nr. 24811997 -"Laplev Sea System: Expeditions in 1995, edited by Heidemarie Kassens. Heft Nr. 24911997 -"The Expedition ANTARKTIS Xllll3 (EASIZ I) of RV 'Polarstern'to the eastern Weddell Sea in 1996", edited by Wolf Arntz and Julian Gutt. Heft Nr. 25011997 - -Vergleichende Untersuchungen zur Okologie und Biodiversitat des Mega-Epibenthos der Arktis und Antarktis", von Adreas Starmans. Heft Nr. 25111997 - ,Zen ehe uno r a ~ m l che Veitei ~ n g \on t A nera tcrgesel scha l~~ngen n spatq-artaren Seo menten oes Arkl s:nen Ozeans ~ n d nre Nuizl.chkc t a s Kl rna noikatoren nahrend oor G .-iz al nlerqtaz al-Wecnse ', von Christoph Vogt. Heft Nr. 25Z1997 - ,,Solitär Ascidien in der Potter Cove (King George Island, Antarktis). Ihre ökologisch Bedeutung und Populationsdynamik, von Stephan Kühne Heft Nr. 25311997 -"Distribution and role of rnicroprotozoa in the Southern Ocean", by Christine Klaas. Heft Nr. 25411997 --Die spatquartär Klima- und Umweltgeschichte der Bunger-Oase, Ostantarktis", von Thomas Kulbe

Heft Nr. 25511997 -"Scientific Cruise Report of the Arctic Expedition ARK-XI1112 of RV'Polarstern' in 1997, edited by Ruediger Stein and Kirsten Fahl. Heft Nr. 25611998 -,,Das Radionuklid Tritium im Ozean: Meßverfahre und Verteilung von Tritium im Südatlanti und im Weddellmeer". von Jürae Sültenfuà Heft Nr. 25711998 - ãUntersuchunge der Saisonalitä von atmosphärische Dimethylsulfid in der Arktis und Antarktis", von Christoph Kleefeld. Heft Nr. 25811998 - ,,Beliingshausen- und Amundsenmeer: Entwicklung eines Sedimentationsmodells", von Frank-Oliver Nitsche. Heft Nr. 25911998 - "The Expedition ANTARKTIS-XIVl4 of RV 'Polarstern' in 1997" by Dieter K. Fütterer Heft Nr. 26011998 - ãDi Diatomeen der Laptevsee (Arktischer Ozean): Taxonomie und biogeographische Verbreitung", von Holger Cremer Heft Nr. 26111998 - ãDi Krustenstruktur und Sedimentdecke des Eurasischen Beckens. Arktischer Ozean: Resultate aus seismischen und gravimetrischen Untersuchungen", von Estella Weigelt. Heft Nr. 262i1998 - "The Expedition ARKTIS-XIIIl3 of RV 'Polarstern' in 1997" by Gunther Krause. Heft Nr. 26311998 - ,,Thermo-tektonische Entwicklung von Oates Land und der Shackieton Range (Antarktis) basierend auf Spaltspuranalysen", von Thorsten Schäfer Heft Nr. 26411998 - ãMessunge der stratosphärische Spurengase CIO, HCI, 03, N20, HpO und OH mittels flugzeugge- tragener Submillimetenvellen-Radiometrie", von Joachim Urban. Heft Nr. 26511998 -,,Untersuchungen zu Massenhaushalt und Dynamik des Ronne Ice Shelfs, Antarktis", von Astrid lambrecht. Heft Nr. 26Hl1998 - "Scientific Cruise Report of the Kara Sea Expedition of RV 'Akademie Boris Petrov' in 1997, edited by Je!ns Matthiessen and Oleg Stepanets. Heft Nr. 26711998 - ãDi Expedition ANTARKTIS-XiV mit FS ,Polarstern' 1997. Bericht vom Fahrtabschnitt ANTXIV/3", herausgegeben von Wiifried Jokat und Hans Oerter. Heft Nr. 26f111998 -=Numerische Modeliierung der Wechselwirkung zwischen Atmosphär und Meereis in der arktischen E!israndzone". von Gerit Birnbaum. Heft Nr. 26911998 - "Katabatic wind and Boundary Layer Front Experiment around Greenland (KABEG '97)", by Günthe Heinemann. Heft Nr. 27011998 - "Architecture and evolution of the continental crust of East Greenland from integrated geophysical studies", by Vera Schlindwein. Heft Nr. 27117998 -"Winter Expedition to the Soulhwestern Kara Sea - Investigations on Formation and Transport of Turbid Sea-Ice", by Dirk Dethleff, Per Loewe, Dominik Weiel, Hartmut Nies, Gesa Kuhlmann, Christian Bahe and Gennao'y Tarasov. Heft Nr. 27Z1998 - ,,FTIR-Emissionsspektroskopische Untersuchungen der arktischen Atmosphäre" von Edo Becker. Heft Nr. 27311998 - ,,Sedimentation und Tektonik irn Gebiet des Agulhas Ruckens und des Agulhas Plateaus (,SETA- RAP')", von Gabrieie Uenzelmann-Neben. Heft Nr. 27411998 - "The Expedition ANTARKTIS XIVl2", by Gerhard Kattner. Heft Nr. 27511998 -*Die Auswirkung der 'N0rthEastWater'-Polynya auf die Sedimentation von NO-Grönlan und Untersuchungen zur Paläo-Ozeanographi seit dem Mittelweichsel", von Hanne Notholt. Heft Nr. 27611998 - Jnterpretation und Analyse von Potentialfelddaten im Weddellmeer, Antarktis: der Zerfall des Suoerkontinents Gondwana". von Michael Studinoer. Heft Nr. 27711998 - ,Koora n erles Programm Antdrntisi~rscn~nq Bor c h t s ~ ~ l l o q - Jm im Rahmen des Koordinierten Programms Antarkt sforbctiunq ni t i'ergieichenocn Unlers~chunqen n ar~lischen Eisgeb eten' herausoeoeben von Hubert Miier. *
Heft Nr. 27811 998 - ,Messung sifdlospnariscner Sp~rengase -her hy-A esuno Spilzoergen, miI HI ie e nes bodengeo~ndenon Mikrobvellen-Rao~orncters , von U#.e Ra t ta ls~~ Heft Ni. 27911998 - "Arctic Paleo-River Discharge (APARD). A New Research Programme of the Arctic Ocean Science Board (AOSB)", edited by Ruediger Stein. Heft Nr. 28011998 - ,,Fernerkundungs- und GIS-Studien in Nordostgrönland von Friedrich Jung-Rothenhäusler Heft Nr. 28111998 - ãRekonstruktio der Oberflächenwassermasse der östliche Laptevsee im Holozä anhand von aquatischen Palynomorphen", von Martina Kunz-Pirrung. Heft Nr. 28211998 -"Scavenging of "'Pa and '"Th in the South Atlantic: Implications for the use of the z3'PafaTh ratio as a paleoproductivity proxy", by Hans-Jürge Walter. Heft Nr. 28311998 -=Sedimente im arktischen Meereis - Eintrag, Charakterisierung und Quantifizierung", von Frank Lindemann. Heft Nr. 28411998 - ,,Langzeitanalyse der antarktischen Meereisbedeckung aus passiven Mikroweliendaten", von Christian H. Thomas, Heft Nr. 28511998 - ,,Mechanismen und Grenzen der Temperaturanpassung beim Pierwurm Arenicoia rnarina (L.)", von Angela Sommer. Heft Nr. 28611998 - ,,Energieumsätz benthischer Filtrierer der Potter Cove (King George Island, Antarktis)", von Jens Kowalke, Heft Nr. 28711998 -"Scientific Cooperation in the Russian Arctic: Research from the Barents Sea up to the Laptev Sea", edited by Eike Rachor.
Heft Nr. 28811998 - -Alfred Wegener. Kommentiertes Verzeichnis der schriftlichen Dokumente seines Lebens und Wirkens", von Ulrich Wutzke. Heft Nr. 28911998 - "Retrieval of Atmospheric Water Vapor Content in Polar Regions Using Spaceborne Microwave Radiometry", by Jungang Miao. Heft Nr. 29011998 - ãStrukturell Entwicklung und Petrogenese des nördliche Kristallingürtel der Shackleton Range, Antarktis: Proterozoische und Ross-orogene Krustendynamik am Rand des Ostantarktischen Kratons", von Axel Brommer. Heft Nr. 29111998 - Jynamik des arktischen Meereises - Validierung verschiedener Rheologieansätz fü die Anwendung in Klimamodellen", von Martin Kreyscher. Heft Nr. 292/1998 -,,Anthropogene organische Spurenstoffe im Arktischen Ozean, Untersuchungen chlorierter Bi- phenyle und Pestizide in der Laptevsee, technische und methodische Entwicklungen zur Probenahme in der Arktis und zur SpurenstoHanalyse", von Sven Utschakowski. Heft Nr. 29311998 - ãRekonstruktio der spätquartare Klima- und Umweltgeschichte der Schirmacher Oase und des Wohlthat Massivs (Ostantarktika)", von Markus Julius Schwab. Heft Nr. 29411998 - ,,Besiedlungsmuster der benthischen Makrofauna auf dem ostgrönländisch Kontinentalhang", von Klaus Schnack. Heft Nr. 29511998 - ,,Gehauseuntersuchungen an planktischen Foraminiferen hoher Breiten: Hinweise auf Umweltveränderunge währen der letzten 140.000 Jahre", von Harald Hommers. Heft Nr. 29611998 - "Scientific Cruise Report 01 the Arctic Expedition ARK-XIIIII of RV 'Polarstern' in 1997, edited by Michael Spindler. Wilhelm Hagen and Dorothea Stübing Heft Nr. 29711998 - ,,Radiometrische Messungen im arktischen Ozean -Vergleich von Theorie und Experiment", von Klaus-Peter Johnsen. Heft Nr. 298111998 -"Patterns and Controls of COo Fluxes in Wet Tundra Types of the Taimyr Peninsula, Siberia - the Contribution of Soils and Mosses" by Martin Sommerkorn. Heft Nr. 29911998 - "The Potter Cove coastal ecosystem, Antarctica. Synopsis of research performed within the frame of the Argentinean-German Cooperation at the Dallmann Laboratory and Jubany Station (Kind George Island, Antarctica, 1991 - 1997)", by Christian Wiencke, Gustavo Ferreyra, Wolf Arntz & Carlos Rinaldi. Heft Nr. 30011999 - "The Kara Sea Expedition of RV 'Akademik Boris Petrov' 1997: First Results of a Joint Russian- German Pilot Study", edited by Jens Matthiessen, Oleg V. Stepanets, Ruediger Stein, Dieter K. Fütterer and Eric M. Galimov. Heft Nr. 30111999 -"The Expedition ANTARKTIS XVl3 (EASIZ II)", edited by Wolf E. Arntz and Julian Gutt. Heft Nr. 302/1999 - ,,Sterole im herbstlichen Weddellmeer (Antarktis): Großräumi Verteilung, Vorkommen und Um- satz", von Anneke Mühlebach Heft Nr. 30311999 --Polare stratosphärisch Wolken: Lidar-Beobachtungen, Charakterisierung von Entstehung und Entwicklunc", von Jens Biele. Heft Nr. 304/1999 - ,,Spätquartä Palaoumweltbedingungen am nördliche Kontinentalrand der Barents- und Kara- See. Eine Multi-Parameter-Analyse", von Jochen Knies. Heft Nr. 30511999 - "Arctic Radiation and Turbulence Interaction Study (ARTIST)", by Jör Hartmann, Frank Albers, Stefania Argentini, Axel Bochert, Ubaldo Bonafe, Wolfgang Cohrs, Alessandro Conidi, Dietmar Freese, Teodoro Geor- giadis, Alessandro Ippoliti, Lars Kaleschke, Christof Lüpkes Uwe Maixner, Giangiuseppe Mastrantonio, Fabrizio Raveg- nani, Andreas Reuter, Giuliano Trivellone and Angelo Viola. Heft Nr. 30611 999 - "German-Russian Cooperation: Biogeographic and biostratigraphic investigations On selected sediment cores from the Eurasian continental margin and marginal seas to analyze the Late Quaternary climatic variability", edited by Robert R. Spielhagen, Max S. Barash, Gennady I. Ivanov, and Jör Thiede. Heft Nr. 30711999 - 3truktur und Kohlenstoffbedarl des Makrobenthos am Kontinentalhang Ostgrönlands" von Dan Seiler. Heft Nr. 30811999 - "ARCTIC '98: The Expedition ARK-XIVlia of RV 'Polarstern' in 1998", edited by Wilfried Jokat. Heft Nr 30911999 - Vrir ao ilai der arht scnen Ozonscr~ cnt Ana yse ~ n d Interprelat on ooaengeo~rldenet Mil imeterwe cnmessanqen von ß~or Mari ri Sinnh~oer Heft Nr. 31011999 - ãRekonstruktio von Meereisdrift und terrigenem Sedimenteintrag im Spätquartä Schwermineral- assoziationen in Sedimenten des Laptev-See-Kontinentalrandes und des zentralen Arktischen Ozeans", von Marion Behrends. Heft Nr. 31 111999 - ,,Parameterisierung atmosphärische Grenzschichtprozesse in einem regionalen Klimamodell der Arktis", von Christoph Abegg. Heft Nr. 312/1999 - ãSolar und terrestrische Strahlungswechselwirkung zwischen arktischen Eisfläche und Wolken", von Dietmar Freese. Heft Nr. 31311999 -"Snow accumulation on Ekströmisen Antarctica", by Elisabeth Schlosser, Hans Oerter and Woltgang Graf. Heft Nr. 31411999 - ,,Die Expedition ANTARKTIS XVl4 des Forschungsschiffes ,Polarstern3 1998, herausgegeben von Eberhard Fahrbach. Heft Nr. 37511999 -"Expeditions in Siberia in 1998", edited by Volker Rachold. Heft Nr. 31611999 - ,Die postgla? eile Seo men~at.onsgeschi~tiie Ÿe ,3ptov\sec schwermineralogische Uno sea.mentpetroqrapn~scne Unters-chunuen , von ßernhar Percaov cn - . Heft-Nr. 31711999 - ãAdaptio an niedrige Temperaturen: Lipide in Eisdiatomeen", von Heidi Lehmal. Heft-Nr. 31811999 - ãEffizient parallele Losungsverfahren fü elliptische partielle Differentialgleichungen in der numerischen Ozeanmodellierung", von Natalja Rakowsky.

Heft-Nr. 31911999 - ,,The Ecology of Arctic Deep-Sea Copepods (Euchaetidae and Aetideidae). Aspects of their Distribution, Trophodynamics and Effect on the Carbon Flux", by Holger Auel. Heft-Nr. 32011999 - ,,Modellstudien zur arktischen stratosphärische Chemie im Vergleich mit Meßdaten" von Veronika Eyring. Heft-Nr. 32111999 - ãAnalys der optischen Eigenschaften des arktischen Aerosols", von Dagmar Nagel. Heft-Nr. 322/1999 - #Messungen des arktischen stratosphärische Ozons: Vergleich der Ozonmessungen in Ny-Alesund, Spitzbergen, 1997 und 1998, von Jens Langer Heft-Nr. 32311999 - ãUntersuchun struktureller Elemente des südöstlich Weddellmeeres 1 Antarktis auf der Basis mariner Potentialfelddaten", von Uwe F. Meyer, Heft-Nr 32411999 - Geocnemische Verwilterungstrenos eines basallischen Ausgangsgesieins nach oem spalp eislozanen, G elscnerr~ckz~a auf der Taimirhaloinsel (Zenirals bir~eni Rekonstr~kt on an e ner sed menlaren Aololae des -ama Sees von Stefanie K. Harwart. '
Heft-Nr. 32511999 - ãUntersuchunge zur Hydrologie des arktischen Meereises - Konsequenzen fü den kleinskaligen Stofftransport", von Johannes Freitag. Heft-Nr. 32611999 - D i e Expedition ANTARKTIS XIVl2 des Forschungsschiffes 'Polarstern' 1998, herausgegeben von Eberhard Fahrbach. Heft-Nr. 32711999 - ,,Gemeinschaftsanalytische Untersuchungen der Harpacticoidenfauna der Magellanregion, sowie erste similaritälsanalvtisch Veroleiche mit Assoziationen aus der Antarktis". von Kai Horst Georae. , -~
Heft-Nr. 32811999 - ,Rekons t r~~ t on oer Palao-Jmwellbeoingungen am Laptev-See-Kont nentalrand v~anreno der beiden letzten Gtai a Interqlazia -Zyklen anhano seoimeniologiscner und mineralogischer Unlers~cn~ngen' , von Claudia Müller. Heft-Nr. 32911999 - ãRäumlic und zeitliche Variationen atmosphärische Spurengase aus bodengebundenen Messungen mit Hilfe eines Michelson Interferometers", von Justus Notholt. Heft-Nr. 33011999 - ,,The 1998 Danish-German Excursion to Disko Island, West Greenland", edited by Angelika Brandt, Helge A. Thomsen, Henning Heide-Jorgensen, Reinhardt M. Kristensen and Hilke Ruhberg. Heft-Nr. 33111999 - ãPoseidon Cruise No. 243 (Reykjavik - Greenland - Reykjavik, 24 August - 11 September 1998): Climate change and the Viking-age fjord enviroment of the Eastern Settlement, sw Greenland", by Gerd Hoffmann, Antoon Kuijpers, and Jör Thiede. Heft-Nr. 33211999 - ,,Modeling of marine biogeochemical cycles with an emphasis on vertical particle fluxes", by Regina Usbeck. Heft-Nr. 33311999 - Jie Tanaidaceenfauna des Beagle-Kanals und ihre Beziehungen zur Fauna des antarktischen Festlandsockels", von Anja Schmidt. Heft-Nr. 33411999 - ãD-Aminosäur als Tracer fü biogeochemische Prozesse im Fluß-Schelf-Ozean-Syste der Arktis". von Hans Peter Fitznar. Heft-Nr. 33511999 - ,,Ökophysiologisch Ursachen der limitierten Verbreitung reptanter decapoder Krebse in der Antarktis", von Markus Frederich. Heft-Nr. 33611999 - Ergeonisse der Unlersdcn~ng des gron anoiscnen in anoeises mit dem elektromagneltscnen Rellexionsv~rfdhren ,n der Umqebunq von hGRIP von Fioan Goktas - - Heft-Nr. 337/1999 - ,,Paleozoic and rnesozoic tectono-thermal history of central Dronning Maud Land, East Antarctica, - evidence from fission-track thermochronology", by Stefanie Meier. Heft-Nr. 33811999 - ãProblem hoher Stoffwechselraten bei Cephalopoden aus verschiedenen geographischen Breiten". von Susanne Zielinski. Heft-Nr. 33911999 - ,,The Expedition ARKTIS XVIl", edited by Gunther Krause. Heft-Nr. 34011999 - ,,Microbial Properties and Habitats of Permafrost Soils on Tairnyr Peninsula, Central Siberia", by Nicole Schmidt. Heft-Nr. 34111999 - ,,Photoacclimation of phytoplanklon in different biogeochemical provinces of the Southern Ocean and its significance for estimating prirnary production", by Astrid Bracher. Heft-Nr. 342/1999 - ?Modern and Late Quaternary Depositional Environment of the St. Anna Trough Area, Northern Kara Sea", edited by Ruediger Stein, Kirsten Fahl, Gennadij I. Ivanov, Michael A. Levitan, and Gennady Tarasov. Heft-Nr. 34311999 - ,,ESF-IMPACT Workshop/Oceanic impacts: rnechanisms and environmental perturbations, 15 - 17 April 1999 in Bremerhaven", edited by Rainer Gersonde and Alexander Deutsch. Heft-Nr. 34411999 - Die Kl magescti chte der hohen norolichen Breiten seit dem mdlleren M ozan H n w s e aus sed rnento oo schen lonmineraloa schen Analvsen fOPD Lea 151 zentrale Framsiraße , von Ame ie W nkler . ,
Heft-Nr. 34511999 -,,Kurzfristige Klimaschwankungen im Scotiameer und Ergebnisse zur Kalbungsgeschichte der Antarktis währen der letzten 200000 Jahre", von Annette Hofmann. Heft-Nr. 34612000 - ,,Glazialmarine Sedimenlationsentwicklung arn westantarktischen Kontinentalrand im Amundsen- und Bellingshausenmeer - Hinweise auf Paläumweltveränderung währen der quartäre Klimazyklen", von Claus-Dieter Hillenbrand Heft-Nr. 34712000 - ,,Zur Ökologi des Phytoplanktons im arktischen Laptevmeer - ein jahreszeitlicher Vergleich, von Kirsten Tuschling. Heft-Nr. 34812000 - ãUntersuchunge zum Feltstoffwechsel des Südliche See-Elefanten (Mirounga leonina L.) in der Antarktis", von Sven Ramdohr. Heft-Nr. 34912000 - ,,Licht- und Temperatureinfluà auf den enzymatischen Oxidationsschulz der antarktischen Eisdiatornee Entornoneis kufferathii Manguin", von Raimund Schriek.

Heft-Nr. 35012000 - D i e Expedition ARKTIS XVl3 des Forschungsschiffes 'Polarstern' 1999 herausgegeben von Ursula Schauer. Heft-Nr. 35112000 - ,,Dissolution kinetics of biogenic sdica in marine environments", by Dirk Rickert.
Heft-Nr. 352/2000 - ãGeometri und Kinematik des tertiäre Deckenbaus im West Spitzbergen Falten- und Uberschiebungsgürtel Br@ggerhalv@ya, Svalbard, von Kerstin Saalmann.
Heft-Nr. 35312000 - ãZu Okologie der Benthos-Foraminiferen der Potter Cove (King George Island, Antarktis)" von Michaela Mayer.
Heft-Nr. 35412000 -,,Expeditions in Siberia in 1999, edited by Volker Rachold.
Heft-Nr. 35512000 - ,,Temperaturrekonstruktion im Tropischen Atlantik fü das Letzte Glaziale Maximum: CLIMAP neu betrachtet.", von Carsten Porthun.
Heft-Nr, 35612000 - ãNiederfrequent Variabilitä großräumig atmosphärische Zirkulationsstrukturen in spektralen Modellen niederer Ordnung", von Antje Weisheimer.
Heft-Nr. 35712000 - ,,Late Quaternary paleoclimatic reconstructions along the Eurasian continental margin", by Hans Peter Kleiber. Heft-Nr. 35812000 - ,,Holocene environmental history of East Greenland - evidence from lake sediments", by Bernd Wagner. Heft-Nr. 35912000 - ,,Scientific Cooperation in the Russian Arctic: Ecology of the White Sea with Kmphasis on its Deep Basir~", edited by Eike Rachor. Heft-Nr. 36bl2000 - ,,Scientific Cruise Report of the Joint Russian-German Kara-Sea Expedition of RV'Akademik Boris Petrov' in 1999", edited by Ruediger Stein and Oleg Stepanets. Heft-Nr. 36112000 - ,,Planktic foraminifer ecology and stable isotope geochemistry in the Arctic Ocean: implications from water colunin and Sediment surface studies for quantitative reconstructions of oceanic parameters" by Renate Volkrnann. Heft-Nr. 36^/2000 - ,,Eisbohrkernunlersuchungen zur räumliche und zeitlichen Variabilitä von Temperatur und Niederschlaasrate im Soätholoza in Nordarönland" von Matthias Schwaaer. Heft-Nr. 36 i2000 - ,,B:nthische ~eracarida (Crustacea, Malacostraca) des arktischen Mellemfjordes, West-Grönland" von Anne-Nina Lorz. Heft-Nr. 36412000 - Die Expeditionen ANTARKTIS XVI 13-4 des Forschungsschiffes ãPOLARSTERN 1999, herausgegeben von Ulrich Bathmann, Victor Srnetacek und Manfred Reinke.