Embed Size (px)
DESCRIPTION
5.000 0.000 1.000 2.000 3.000 4.000 7.000 8.000 1.793 2.346 7.168 1 6 23 (17) (73.91%) 2 26 (24) (92.31%) 0 29 (29) (100.00%) Month 2010 2009 Variance % TOTAL 115 201 (86) (42.79%) No. of Approved Projects MAR K E Y P E R F O R M A N C E I N D I C A T O R S AUG NOV OCT DEC MAY APR JUN FEB SEP JAN JUL 2 150 100 200 250 201 115 50 3 0
Citation preview

1
2010 Key Performance Indicators
K E Y P E R F O R M A N C E I N D I C A T O R S
Cumulative Investments
(in US$ Billion)
1.793
2.346
7.168
0.000
1.000
2.000
3.000
4.000
5.000
6.000
7.000
8.000
1998 2005 2010

2
2010 Key Performance Indicators
K E Y P E R F O R M A N C E I N D I C A T O R S
No. of Approved Projects
Month 2010 2009 Variance %
JAN 12 15 (3) (20.00%)
FEB 14 8 6 75.00%
MAR 6 12 (6) (50.00%)
APR 12 8 4 50.00%
MAY 12 16 (4) (25.00%)
JUN 12 21 (9) (42.86%)
JUL 10 18 (8) (44.44%)
AUG 2 26 (24) (92.31%)
SEP 6 23 (17) (73.91%)
OCT 12 12 0 0.00%
NOV 0 29 (29) (100.00%)
DEC 17 13 4 30.77%
TOTAL 115 201 (86) (42.79%)

3
2010 Key Performance Indicators
201
115
0
50
100
150
200
250
2009 2010
K E Y P E R F O R M A N C E I N D I C A T O R S
No. of Approved Projects

4
2010 Key Performance Indicators
K E Y P E R F O R M A N C E I N D I C A T O R S
Committed Investments from New Projects
Month 2010 2009 Variance %
JAN 19,892,468.67 26,989,545.27 (7,097,076.60) (26.30%)
FEB 53,111,619.10 2,850,343.77 50,261,275.33 1,763.34%
MAR 557,751.64 4,375,566.26 (3,817,814.62) (87.25%)
APR 81,218,267.49 4,684,679.05 76,533,588.44 1,633.70%
MAY 1,031,093,752.83 55,816,955.09 975,276,797.74 1,747.28%
JUN 10,372,317.04 4,794,770.95 5,577,546.09 116.33%
JUL 5,726,588.02 18,274,358.17 (12,547,770.15) (68.66%)
AUG 1,029,000.00 16,725,381.42 (15,696,381.42) (93.85%)
SEP 629,741.19 3,364,687.59 (2,734,946.40) (81.28%)
OCT 2,525,208.08 55,210,028.53 (52,684,820.45) (95.43%)
NOV 0.00 8,884,840.66 (8,884,840.66) (100.00%)
DEC 3,713,252.20 4,494,565.17 (781,312.97) (17.38%)
TOTAL US$ 1,209,869,966.26 US$ 206,465,721.93 US$ 1,003,404,244.33 485.99%

5
2010 Key Performance Indicators
206.47
1,209.87
$0.00
$200.00
$400.00
$600.00
$800.00
$1,000.00
$1,200.00
$1,400.00
2009 2010
K E Y P E R F O R M A N C E I N D I C A T O R S
Committed Investments from New Projects
(in US$ Million)

6
2010 Key Performance Indicators
Rank CompanyCommitted
Investments (US$)
Country of
Origin
1 MCastle Philippines 1,000,000,000.00 KOREA
2 Sunnew-Subic Investments Ltd. 75,000,000.00 CHINA
3 Subic Bay Town Center Inc. 36,425,969.57 PHILIPPINES
4
Alubat Aviation Composites Philippines 15,000,000.00 GERMANY / UK
Vapco International Corporation 15,000,000.00 JORDAN /
PHILIPPINES
5 Sands of Triboa Resorts 14,379,363.79 PHILIPPINES
6Subic Bay Brands & Lifestyles Retails
Concept, Inc.5,946,291.56 PHILIPPINES
7 Fertuna Holdings Corp. 5,356,760.23 PHILIPPINES
8 Holy Land Subic Foundation, Inc. 5,339,598.46 PHILIPPINES
9Udenna Management & Resources
Corp.3,220,000.00 PHILIPPINES
10San Bernardino Shores Beach Resort
Corp.2,210,480.91 PHILIPPINES
TOTAL $ 1,177,878,464.53
K E Y P E R F O R M A N C E I N D I C A T O R S
Over-All Top 10 New Investments

7
2010 Key Performance Indicators
K E Y P E R F O R M A N C E I N D I C A T O R S
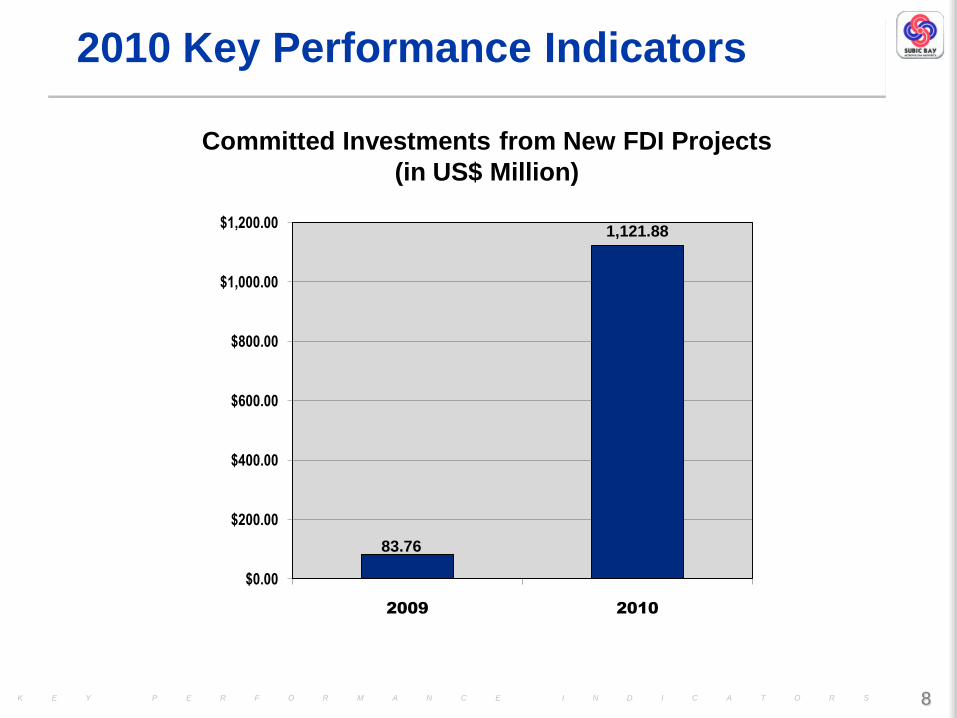
Committed Investments from New FDI Projects
Month 2010 2009 Variance %
JAN 16,493,644.00 1,018,130.93 15,475,513.07 (1,519.99%)
FEB 3,799,273.86 941,732.07 2,857,541.79 303.43%
MAR 482,751.64 1,620,483.41 (1,137,731.77) (70.21%)
APR 78,070,906.15 4,233,026.49 73,837,879.66 1,744.33%
MAY 1,015,735,546.98 53,733,771.63 962,001,775.35 1,790.31%
JUN 2,728,963.98 1,536,566.09 1,192,397.89 77.60%
JUL 668,348.98 7,771,444.20 (7,103,095.22) (91.40%)
AUG 1,029,000.00 1,685,402.75 (656,402.75) (38.95%)
SEP 277,100.42 1,156,411.82 359,726.05 (76.04%)
OCT 1,860,311.67 1,500,585.62 (879,311.40) 23.97%
NOV 0.00 4,887,632.13 (4,887,632.13) (100.00%)
DEC 732,440.26 3,678,330.55 (2,945,890.29) (80.09%)
TOTAL US$ 1,121,878,287.94 US$ 83,763,517.69 US$ 1,038,114,770.25 1,239.34%
8
2010 Key Performance Indicators
83.76
1,121.88
$0.00
$200.00
$400.00
$600.00
$800.00
$1,000.00
$1,200.00
2009 2010
K E Y P E R F O R M A N C E I N D I C A T O R S
Committed Investments from New FDI Projects
(in US$ Million)

9
2010 Key Performance Indicators
Rank CompanyCommitted
Investments (US$)
Country of
Origin
1 MCastle Philippines 1,000,000,000.00 KOREA
2 Sunnew-Subic Investments Ltd. 75,000,000.00 CHINA
3Alubat Aviation Composites Philippines 15,000,000.00 GERMANY/ UK
Vapco International Corporation 15,000,000.00 JORDAN /
PHILIPPINES
4 Safehull Marine Technologies, Inc. 2,131,287.30 TAIWAN /
PHILIPPINES
5 Advance Suubic Screw Inc. 1,500,000.00 TAIWAN
6 Chinmei Metal Mfg. Inc. 1,450,000.00 TAIWAN
7 Aviation Concepts Holdings 1,100,000.00 USA / CANADA
8Misung Subic, Inc. 1,000,000.00
CHINA 60% /
CANADA 20% /
PHILIPPINES 20%
International Armoring Corp. Asia 1,000,000.00 USA
9 Nova Freeport Resources, Inc. 879,101.30 KOREA
10 MCom Subic Corporation 867,000.00 TAIWAN
TOTAL US$ 1,114,927,388.60
K E Y P E R F O R M A N C E I N D I C A T O R S
Over-All Top 10 New FDI Projects

10
2010 Key Performance Indicators
K E Y P E R F O R M A N C E I N D I C A T O R S
Committed Investments from New Local Projects
Month 2010 2009 Variance %
JAN 3,398,824.67 25,971,414.43 (22,572,589.67) (1,519.99%)
FEB 49,312,345.24 1,908,611.70 47,403,733.54 303.43%
MAR 75,000.00 2,755,082.85 (2,680,082.85) (70.21%)
APR 3,147,361.34 451,652.56 2,695,708.78 1,744.33%
MAY 15,358,205.85 2,083,183.46 13,275,022.39 1,790.31%
JUN 7,643,353.06 3,258,204.86 4,385,148.20 77.60%
JUL 5,058,239.04 10,502,913.97 (5,444,674.93) (91.40%)
AUG 0.00 15,039,978.67 (15,039,978.67) (38.95%)
SEP 352,640.77 2,208,275.77 (1,855,635.00) (76.04%)
OCT 664,896.41 53,709,442.91 (53,044,546.50) (23.97%)
NOV 0.00 3,997,208.53 (3,997,208.53) (100.00%)
DEC 2,980,811.94 816,234.62 2,164,577.32 80.09%
TOTAL US$ 87,991,678.32 US$ 122,702,204.24 (US$ 34,710,525.92) (28.29%)

11
2010 Key Performance Indicators
122.70
87.99
$0.00
$20.00
$40.00
$60.00
$80.00
$100.00
$120.00
$140.00
2009 2010
K E Y P E R F O R M A N C E I N D I C A T O R S
Committed Investments from New Local Projects
(in US$ Million)

12
2010 Key Performance Indicators
Rank No. of Projects Country of OriginCommitted
Investment (US$)% Share
1 19 KOREA 1,003,420,080.38 82.936%
2 91 PHILIPPINES 98,532,054.64 8.144%
3 5 CHINA 75,747,391.30 6.261%
4 4 UK 7,686,444.32 0.635%
5 2 GERMANY 7,576,960.00 0.626%
6 1 JORDAN 7,500,000.00 0.620%
7 6 TAIWAN 5,237,962.79 0.433%
8 7 USA 1,869,670.38 0.155%
9 4 CANADA 946,750.00 0.078%
10 1 SINGAPORE 400,000.00 0.033%
11 1 NORWAY 259,721.40 0.021%
12 4 JAPAN 235,454.84 0.019%
13 1 AUSTRALIA 150,000.00 0.012%
14 1 SWEDEN 86,573.80 0.007%
15 1 BELGIUM 84,617.96 0.007%
16 1 FRANCE 84,617.96 0.007%
17 1 ITALY 51,666.50 0.004%
TOTAL US$ 1,209,869,966.27
K E Y P E R F O R M A N C E I N D I C A T O R S
Approved Projects by Origin of Equity

13
2010 Key Performance Indicators
K E Y P E R F O R M A N C E I N D I C A T O R S
Projected Employment from Approved Projects
Month 2010 2009 Variance %
JAN 351 224 127 56.70%
FEB 5,782 136 5,646 4,151.47%
MAR 84 225 (139) (61.78%)
APR 229 47 182 387.23%
MAY 525 2167 (1,642) (75.77%)
JUN 522 581 (59) (10.15%)
JUL 154 123 31 25.20%
AUG 36 501 (465) (92.81%)
SEP 45 264 (219) (82.95%)
OCT 115 1,633 (1,518) (92.96%)
NOV 0 439 (439) (100.00%)
DEC 205 862 (657) (76.22%)
TOTAL 8,050 7,202 848 11.77%

14
2010 Key Performance Indicators
7,202
8,050
6,600
6,800
7,000
7,200
7,400
7,600
7,800
8,000
8,200
2009 2010
K E Y P E R F O R M A N C E I N D I C A T O R S
Projected Employment from Approved Projects

15
2010 Key Performance Indicators
K E Y P E R F O R M A N C E I N D I C A T O R S
Active Workforce
Month 2010 2009 Variance %
JAN 87,612 84,528 3,084 3.65%
FEB 87,689 84,852 2,837 3.34%
MAR 88,041 85,267 2,774 3.25%
APR 88,268 85,191 3,077 3.61%
MAY 88,444 85,324 3,120 3.66%
JUN 89,271 85,815 3,456 4.03%
JUL 88,725 85,950 2,775 3.23%
AUG 88,252 85,927 2,325 2.71%
SEP 88,187 86,229 1,958 2.27%
OCT 88,054 86,631 1,423 1.64%
NOV 88,313 87,098 1,215 1.39%
DEC 88,450 87,226 1,224 1.40%

16
2010 Key Performance Indicators
87,226
88,450
86,600
86,800
87,000
87,200
87,400
87,600
87,800
88,000
88,200
88,400
88,600
2009 2010
K E Y P E R F O R M A N C E I N D I C A T O R S
Active Workforce

17
2010 Key Performance Indicators
No. Sectors No. of Workers %
1 Manufacturing 15,037 17.00%
2 Services 40,308 45.57%
3 Shipbuilding / Marine-Related Services 25,722 29.08%
4 Construction 6,837 7.73%
5 Domestic Helpers / Caretakers 546 1%
TOTAL 88,450 100.00%
K E Y P E R F O R M A N C E I N D I C A T O R S
Active Workforce by Sector

18
2010 Key Performance Indicators
No. Province No. of Workers %
1 Olongapo 35,611 40.26%
2 Bataan 10,983 12.42%
3 Zambales 18,274 20.66%
4 Pampanga 2,826 3.20%
5 NCR 4,047 4.58%
3 Tarlac 2,254 2.55%
7 Others 14,410 16.29%
8 No Address 45 0.05%
TOTAL 88,450 100.00%
K E Y P E R F O R M A N C E I N D I C A T O R S
Active Workforce by Province

19
2010 Key Performance Indicators
Rank Company No. of Workers % Share
1 Greenbeach Powertech, Inc. (KCTech, Inc.) 2,954 3.34%
2 Nidec Subic Phils. Corp. 2,279 2.58%
3 Sanyo Denki Philippines, Inc. 2,252 2.55%
4 Metrobay Corporation 1,603 1.81%
5 Freeport I-Tech Corporation 1,567 1.77%
6 Binictican I-Tech Corporation 1,517 1.72%
7 Subic Shipbuilder Corporation 1,494 1.69%
8 Redondo I-Tech Corporation 1,485 1.68%
9 Kalayaan I-Tech Corporation 1,454 1.64%
10 Redondo Baytech Corporation 1,296 1.47%
TOTAL 17,901 20.24%
K E Y P E R F O R M A N C E I N D I C A T O R S
Over-All Top 10 Employers

20
2010 Key Performance Indicators
K E Y P E R F O R M A N C E I N D I C A T O R S
Export FOB Value
Month 2010 2009 Variance %
JAN 181,343,669.72 127,833,722.64 53,509,947.08 41.86%
FEB 230,283,503.10 58,352,438.24 171,931,064.86 294.64%
MAR 119,476,323.41 173,597,758.32 (54,121,434.91) (31.18%)
APR 60,574,192.01 51,019,226.72 9,554,965.29 18.73%
MAY 54,651,692.85 33,424,694.20 21,226,998.65 63.51%
JUN 66,820,620.33 88,661,723.33 (21,841,103.00) (24.63%)
JUL 57,730,667.77 106,301,968.45 (48,571,300.68) (45.69%)
AUG 188,231,685.54 43,348,358.38 114,883,327.16 334.23%
SEP 112,215,514.40 118,441,286.70 (6,225,772.30) (5.26%)
OCT 109,916,320.71 119,584,332.64 (9,668,011.93) (8.08%)
NOV 41,858,678.48 112,428,986.67 (70,570,308.19) (62.77%)
DEC 121,725,173.22 46,199,716.33 75,525,456.89 163.48%
TOTAL US$ 1,344,828,041.54 US$ 1,079,194,212.62 US$ 265,633,828.92 24.61%

21
2010 Key Performance Indicators
1,079.19
1,344.83
$0.00
$300.00
$600.00
$900.00
$1,200.00
$1,500.00
2009 2010
K E Y P E R F O R M A N C E I N D I C A T O R S
Export FOB Value
(in US$ Million)

22
2010 Key Performance Indicators
Rank ExportersWeight
(KGS)
FOB Value
(US$)
1 HHIC-Phil 566,387,811.60 725,835,150.24
2 Sanyo Denki 4,312,392.56 103,201,977.72
3 Wistron Infocomm (Phils.) 1,010,355.56 75,321,518.40
4 Hitachi Terminals Mech.Phils.Corp. 1,136,938.68 57,703,481.04
5 Tong Lung (Phils.) Metal Industry 10,682,638.32 53,079,492.70
6 Juken Sangyo Phils. 37,957,234.85 53,020,334.27
7 Tapu Corporation 5,613,484.12 27,757,940.24
8 Nicera Philippines, Inc. 72,630.61 22,217,042.05
9 Cano Subic Corp. 5,372,185.38 20,845,931.17
10 Nidec Subic Philippines Corporation 221,846.62 18,077,718.94
TOTAL 632,767,518.30 1,157,060,586.77
K E Y P E R F O R M A N C E I N D I C A T O R S
Over-All Top 10 Exporters

23
2010 Key Performance Indicators
K E Y P E R F O R M A N C E I N D I C A T O R S
Import FOB Value
Month 2010 2009 Variance %
JAN 246,153,845.09 189,409,647.40 56,744,197.69 29.96%
FEB 203,019,941.36 110,353,261.99 92,666,679.37 83.97%
MAR 261,234,653.11 170,221,322.85 91,013,330.26 53.47%
APR 367,943,789.43 229,979,633.71 137,964,155.72 59.99%
MAY 256,620,067.84 211,576,127.12 45,043,940.72 21.29%
JUN 308,364,120.85 192,266,105.53 116,098,105.32 60.38%
JUL 257,719,424.55 182,852,395.41 74,867,029.14 40.94%
AUG 263,230,375.68 136,118,695.45 127,111,680.23 93.38%
SEP 343,435,694.80 200,561,979.56 142,873,715.24 71.24%
OCT 334,618,057.56 236,220,445.58 98,397,611.98 41.65%
NOV 318,047,421.26 213,814,338.98 104,233,082.28 48.75%
DEC 322,038,376.64 169,243,883.37 152,794,493.27 90.48%
TOTAL US$ 3,482,425,768.17 US$ 2,242,617,836.95 US$ 1,239,807,931.22 55.28%

24
2010 Key Performance Indicators
2,242.62
3,482.42
$0.00
$500.00
$1,000.00
$1,500.00
$2,000.00
$2,500.00
$3,000.00
$3,500.00
$4,000.00
2009 2010
K E Y P E R F O R M A N C E I N D I C A T O R S
Import FOB Value
(in US$ Million)

25
2010 Key Performance Indicators
Rank ImportersWeight
(KGS)
FOB Value
(US$)
1 Sanyo Denki Philippines, Inc. 2,797,874.18 606,479,796.92
2 PTT Philippines Trading Corporation 85,603,520.34 424,554,637.60
3 HHIC-Phil., Inc. 620,517,108.71 381,383,155.57
4 Koryo Subic, Inc. 509,575.12 368,841,159.19
5 Nicera Phils., Inc. 165,381.51 240,847,884.37
6 Nidec Subic Philippines Corporation 2,756,937.37 224,247,107.35
7 Koushin Mfg. Phils., Inc. 15,898.50 183,333,375.84
8 Wistron Inforcom ((Phils.) Corp. 1,612,097.76 156,956,668.63
9 Micro Dragon Petroleum,Inc. 225,051,537.63 138,230,251.00
10 Challenger Aero Air Corporation 35,560.03 67,618,350.92
TOTAL 940,065,471.15 2,792,492,387.39
K E Y P E R F O R M A N C E I N D I C A T O R S
Over-All Top 10 Importers

26
2010 Key Performance Indicators
K E Y P E R F O R M A N C E I N D I C A T O R S
Seaport Revenue
Month 2010 2009 Variance %
JAN 45,282,918.50 37,620,152.99 7,662,765.51 20.37%
FEB 29,867,394.78 41,577,328.09 (11,709,933.31) (28.16%)
MAR 43,200,611.14 51,024,711.42 (7,824,100.28) (15.33%)
APR 37,295,949.27 44,496,024.57 (7,200,075.30) (16.18%)
MAY 32,861,060.98 40,989,968.90 (8,128,907.92) (19.83%)
JUN 29,897,625.35 60,631,177.15 (30,733,551.80) (50.69%)
JUL 33,021,748.83 47,395,086.94 (14,373,338.11) (30.33%)
AUG 33,677,756.76 32,300,131.25 1,377,625.51 4.27%
SEP 33,256,937.19 31,598,860.08 1,658,077.11 5.25%
OCT 36,699,352.80 29,831,324.33 6,868,028.47 23.02%
NOV 29,710,026.65 31,615,265.73 (1,905,239.08) (6.03%)
DEC 29,766,750.74 23,775,586.82 5,991,163.92 25.20%
TOTAL PhP 414,538,132.99 PhP 472,855,618.27 PhP 58,317,485.28 (12.33%)

27
2010 Key Performance Indicators
K E Y P E R F O R M A N C E I N D I C A T O R S
Seaport Revenue & Forecast
Month Revenue Forecast Variance %
JAN 45,282,918.50 35,946,612.86 9,336,305.64 25.97%
FEB 29,867,394.78 37,933,979.75 (8,066,584.97) (21.26%)
MAR 43,200,611.14 45,877,306.28 (2,676,695.14) (5.83%)
APR 37,295,949.27 39,497,343.10 (2,201,393.83) (5.57%)
MAY 32,861,060.98 41,028,020.19 (8,166,959.21) (19.91%)
JUN 29,897,625.35 44,106,769.95 (14,209,144.60) (32.22%)
JUL 33,021,748.83 44,545,079.17 (11,523,330.34) (25.87%)
AUG 33,677,756.76 28,635,976.42 5,041,780.34 17.61%
SEP 33,256,937.19 33,424,335.67 (167,398.48) (0.50%)
OCT 36,699,352.80 35,191,956.71 1,507,396.09 4.28%
NOV 29,710,026.65 30,295,764.05 (585,737.40) (1.93%)
DEC 29,766,750.74 52,799,085.33 (23,032,334.59) (43.62%)
TOTAL PhP 414,538,132.99 PhP 469,282,229.49 PhP 54,744,096.50 (11.67%)

28
2010 Key Performance Indicators
472.86
414.54
469.28
Php0.00
Php100.00
Php200.00
Php300.00
Php400.00
Php500.00
2009 REVENUE 2010 REVENUE 2010 FORECAST
K E Y P E R F O R M A N C E I N D I C A T O R S
Seaport Revenue & Forecast
(in PhP Million)

29
2010 Key Performance Indicators
K E Y P E R F O R M A N C E I N D I C A T O R S
Over–all Visitor Arrivals
Month 2010 2009 Variance %
JAN 418,587 127,318 291,269 228.77%
FEB 409,486 128,291 281,195 219.19%
MAR 442,794 399,870 42,924 10.73%
APR 558,779 511,915 46,864 9.15%
MAY 518,596 493,647 24,949 5.05%
JUN 786,738 341,727 445,011 130.22%
JUL 375,451 261,748 113,703 43.44%
AUG 379,020 271,584 107,436 39.56%
SEP 325,201 368,503 (43,302) (11.75%)
OCT 399,139 355,042 44,097 12.42%
NOV 394,819 401,551 (6,732) (1.68%)
DEC 464,525 439,112 25,413 5.79%
TOTAL 5,473,135 4,100,308 1,372,827 33.48%

30
2010 Key Performance Indicators
4,100,308
5,473,135
0
1,000,000
2,000,000
3,000,000
4,000,000
5,000,000
6,000,000
2009 2010
K E Y P E R F O R M A N C E I N D I C A T O R S
Over–all Visitor Arrivals

31
2010 Key Performance Indicators
K E Y P E R F O R M A N C E I N D I C A T O R S
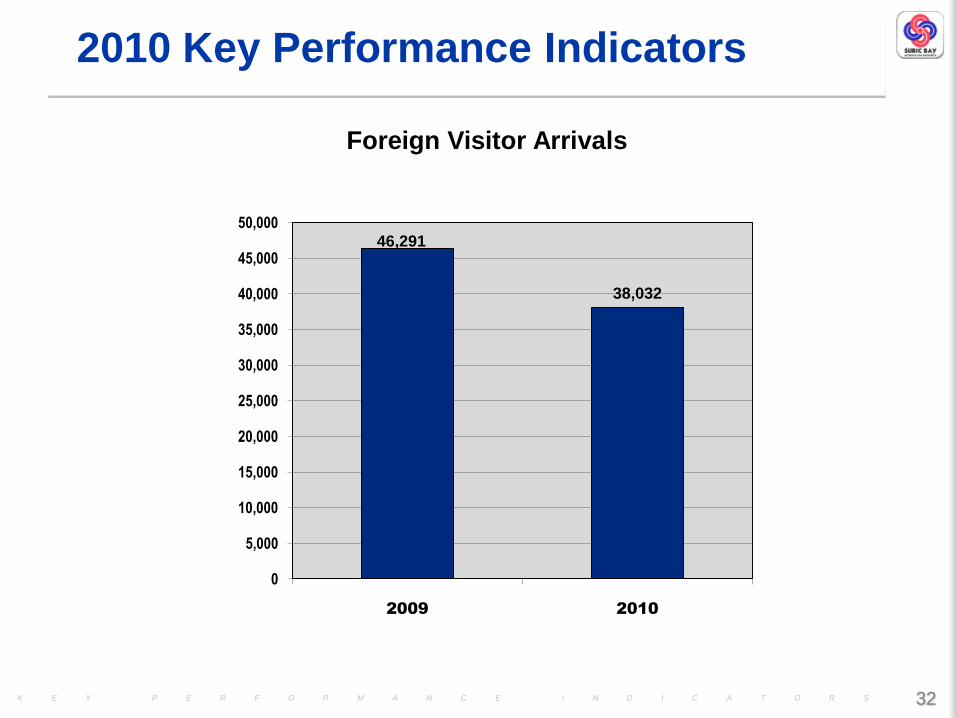
Foreign Visitor Arrivals
Month 2010 2009 Variance %
JAN 3,752 7,172 (3,420) (47.69%)
FEB 5,240 5,332 (92) (1.73%)
MAR 3,301 2,465 836 33.91%
APR 4,430 6,971 (2,541) (36.45%)
MAY 3,915 3,121 794 25.44%
JUN 2,575 3,485 (910) (26.11%)
JUL 4,950 3,056 1,794 58.70%
AUG 3,183 3,136 47 1.50%
SEP 1,771 1,564 207 13.24%
OCT 2,299 3,568 (1,269) (35.57%)
NOV 1,302 3,938 (2,636) (66.94%)
DEC 1,212 2,483 (1,069) (43.05%)
TOTAL 38,032 46,291 (8,259) (17.84%)
32
2010 Key Performance Indicators
46,291
38,032
0
5,000
10,000
15,000
20,000
25,000
30,000
35,000
40,000
45,000
50,000
2009 2010
K E Y P E R F O R M A N C E I N D I C A T O R S
Foreign Visitor Arrivals

33
2010 Key Performance Indicators
K E Y P E R F O R M A N C E I N D I C A T O R S
Local Visitor Arrivals
Month 2010 2009 Variance %
JAN 414,835 120,146 294,689 245.28%
FEB 404,246 122,959 281,287 228.76%
MAR 439,493 397,405 42,088 10.59%
APR 554,349 504,944 49,405 9.78%
MAY 514,681 490,526 24,155 4.92%
JUN 784,163 338,242 445,921 131.83%
JUL 370,601 258,692 111,909 43.26%
AUG 375,837 268,448 107,389 40.00%
SEP 323,430 366,939 -43,509 (11.86%)
OCT 396,840 351,474 45,366 12.91%
NOV 393,517 397,613 -4,096 (1.03%)
DEC 463,111 436,629 26,482 6.07%
TOTAL 5,435,103 4,054,017 1,381,086 34.07%

34
2010 Key Performance Indicators
4,054,017
5,435,103
0
1,000,000
2,000,000
3,000,000
4,000,000
5,000,000
6,000,000
2009 2010
K E Y P E R F O R M A N C E I N D I C A T O R S
Local Visitor Arrivals

35
2010 Key Performance Indicators
Month 2010 2009 Variance %
JAN 429,291,108.86 500,200,975.92 (70,909,867.06) (14.18%)
FEB 522,065,960.96 368,011,510.98 154,054,449.98 41.86%
MAR 522,199,718.79 430,367,900.82 91,831,817.97 21.34%
APR 556,987,784.15 620,522,999.28 (63,535,215.13) (10.24%)
MAY 621,140,659.24 506,024,459.27 115,116,199.97 22.75%
JUN 833,158,144.10 487,586,681.52 345,571,462.58 70.87%
JUL 559,923,792.94 470,590,113.88 89,333,679.06 18.98%
AUG 451,607,827.05 470,759,474.02 (19,151,646.97) (4.07%)
SEP 546,559,719.32 395,323,435.31 151,236,284.01 38.26%
OCT 469,431,520.57 389,575,498.46 79,856,022.11 20.50%
NOV 626,640,496.24 446,926,859.80 179,713,636.44 40.21%
DEC 541,075,747.36 515,749,074.74 25,326,672.62 4.91%
TOTAL PhP 6,680,082,479.58 PhP 5,601,640,984.00 PhP 1,078,441,495.58 19.25%
K E Y P E R F O R M A N C E I N D I C A T O R S
Combined BIR & BOC Cash Revenue Collections

Combined Cash Revenue Collections
(in PhP Million)
36
2010 Key Performance Indicators
5,601.64
6,680.08
PHP 0.00
PHP 1,500.00
PHP 3,000.00
PHP 4,500.00
PHP 6,000.00
PHP 7,500.00
2009 2010
K E Y P E R F O R M A N C E I N D I C A T O R S

37
2010 Key Performance Indicators
K E Y P E R F O R M A N C E I N D I C A T O R S
BOC Cash Revenue Collection
Month 2010 2009 Variance %
JAN 352,913,351.27 391,832,529.72 (38,919,178.45) (9.93%)
FEB 446,039,470.70 296,085,483.08 149,953,987.62 50.65%
MAR 441,743,881.98 355,932,161.45 85,811,720.53 24.11%
APR 356,753,166.75 396,978,641.17 (40,225,474.42) (10.13%)
MAY 436,583,334.34 376,343,365.50 60,239,968.84 16.01%
JUN 477,084,342.35 389,159,198.43 87,925,143.92 22.59%
JUL 438,846,620.15 368,744,294.23 70,102,325.92 19.01%
AUG 311,559,425.98 344,494,825.17 (32,935,399.19) (9.56%)
SEP 454,275,973.00 295,527,882.20 158,748,090.80 53.72%
OCT 299,808,008.00 302,892,582.76 (3,084,574.76) (1.02%)
NOV 501,594,169.00 328,450,034.18 173,144,134.82 52.72%
DEC 456,592,100.92 442,133,670.06 14,458,430.86 3.27%
TOTAL PhP 4,973,793,844.44 PhP 4,288,574,667.95 PhP 685,219,176.49 15.98%

38
2010 Key Performance Indicators
4,288.57
4,973.79
PHP 0.00
PHP 1,000.00
PHP 2,000.00
PHP 3,000.00
PHP 4,000.00
PHP 5,000.00
2009 2010
K E Y P E R F O R M A N C E I N D I C A T O R S
BOC Cash Revenue Collection
(in PhP Million)

39
2010 Key Performance Indicators
K E Y P E R F O R M A N C E I N D I C A T O R S
BIR Cash Revenue Collection
Month 2010 2009 Variance %
JAN 76,377,757.59 108,368,446.20 (31,990,688.61) (29.52%)
FEB 76,026,490.26 71,926,027.90 4,100,462.36 5.7%
MAR 80,455,836.81 74,435,739.37 6,020,097.44 8.09%
APR 200,234,617.40 223,544,358.11 (23,309,740.71) (10.43%)
MAY 184,557,324.90 129,681,093.77 54,876,231.13 42.32%
JUN 356,073,801.75 98,427,483.09 257,646,318.66 261.76%
JUL 121,077,172.79 101,845,819.65 19,231,353.14 18.88%
AUG 140,048,401.07 126,264,648.85 13,783,752.22 10.92%
SEP 92,283,746.32 99,797,553.11 (7,513,806.79) (7.53%)
OCT 169,623,512.57 86,682,915.70 82,940,596.87 95.68%
NOV 125,046,327.24 118,476,825.62 6,569,501.62 5.54%
DEC 84,483,646.44 73,615,404.68 10,868,241.76 14.76%
TOTAL PhP 1,706,288,635.14 PhP 1,313,066,316.05 PhP 393,222,319.09 29.95%

40
2010 Key Performance Indicators
1,313.07
1,706.29
PHP 0.00
PHP 500.00
PHP 1,000.00
PHP 1,500.00
PHP 2,000.00
2009 2010
K E Y P E R F O R M A N C E I N D I C A T O R S
BIR Cash Revenue Collection
(in PhP Million)


![REGLAMENTO_ORGANICO _FEBRERO _2010[1]](https://img.dokumen.tips/doc/110x75/577d29af1a28ab4e1ea783aa/reglamentoorganico-febrero-20101.jpg)