Embed Size (px)
Citation preview

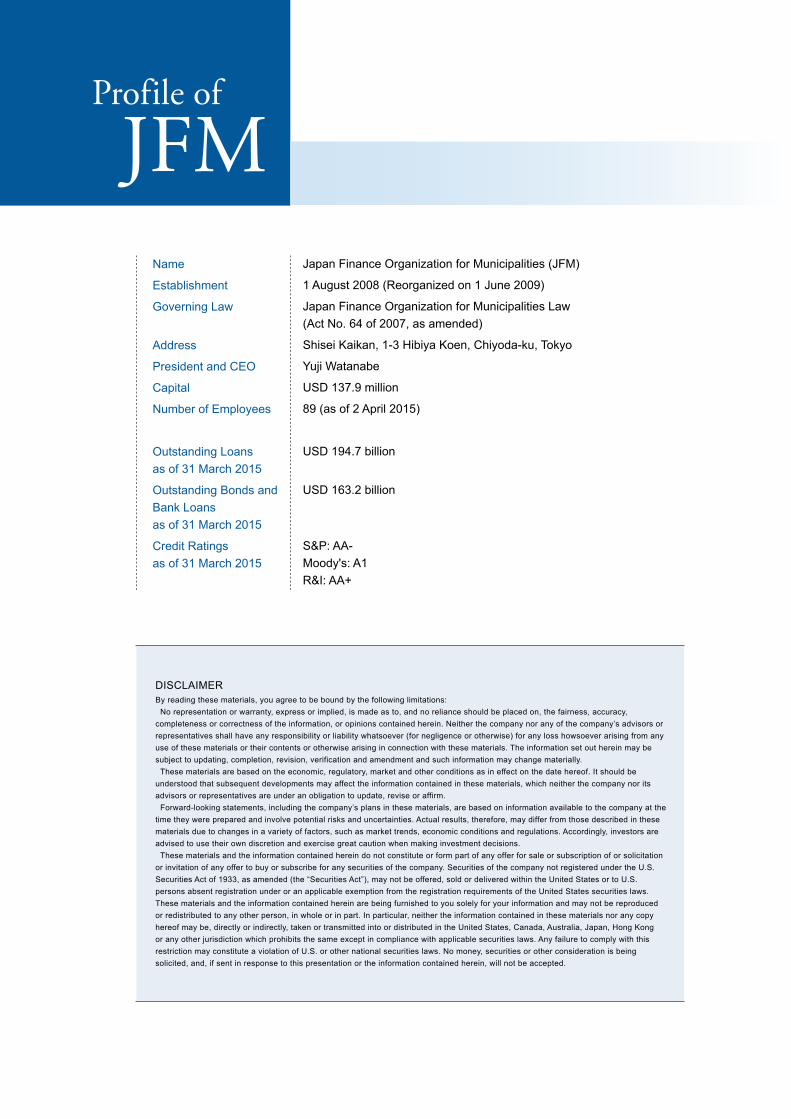
Name
Establishment
Governing Law
Address
President and CEO
Capital
Number of Employees
Outstanding Loansas of 31 March 2015
Outstanding Bonds andBank Loansas of 31 March 2015
Credit Ratings as of 31 March 2015
Japan Finance Organization for Municipalities (JFM)
1 August 2008 (Reorganized on 1 June 2009)
Japan Finance Organization for Municipalities Law(Act No. 64 of 2007, as amended)
Shisei Kaikan, 1-3 Hibiya Koen, Chiyoda-ku, Tokyo
Yuji Watanabe
USD 137.9 million
89 (as of 2 April 2015)
USD 194.7 billion
USD 163.2 billion
S&P: AA-Moody's: A1R&I: AA+
DISCLAIMER By reading these materials, you agree to be bound by the following limitations: No representation or warranty, express or implied, is made as to, and no reliance should be placed on, the fairness, accuracy, completeness or correctness of the information, or opinions contained herein. Neither the company nor any of the company’s advisors or representatives shall have any responsibility or liability whatsoever (for negligence or otherwise) for any loss howsoever arising from any use of these materials or their contents or otherwise arising in connection with these materials. The information set out herein may be subject to updating, completion, revision, verification and amendment and such information may change materially. These materials are based on the economic, regulatory, market and other conditions as in effect on the date hereof. It should be understood that subsequent developments may affect the information contained in these materials, which neither the company nor its advisors or representatives are under an obligation to update, revise or affirm. Forward-looking statements, including the company’s plans in these materials, are based on information available to the company at the time they were prepared and involve potential risks and uncertainties. Actual results, therefore, may differ from those described in these materials due to changes in a variety of factors, such as market trends, economic conditions and regulations. Accordingly, investors are advised to use their own discretion and exercise great caution when making investment decisions. These materials and the information contained herein do not constitute or form part of any offer for sale or subscription of or solicitation or invitation of any offer to buy or subscribe for any securities of the company. Securities of the company not registered under the U.S. Securities Act of 1933, as amended (the “Securities Act”), may not be offered, sold or delivered within the United States or to U.S. persons absent registration under or an applicable exemption from the registration requirements of the United States securities laws. These materials and the information contained herein are being furnished to you solely for your information and may not be reproduced or redistributed to any other person, in whole or in part. In particular, neither the information contained in these materials nor any copy hereof may be, directly or indirectly, taken or transmitted into or distributed in the United States, Canada, Australia, Japan, Hong Kong or any other jurisdiction which prohibits the same except in compliance with applicable securities laws. Any failure to comply with this restriction may constitute a violation of U.S. or other national securities laws. No money, securities or other consideration is being solicited, and, if sent in response to this presentation or the information contained herein, will not be accepted.
Prof ile of
JFM
Message from the President and CEO --------------- 02Management Philosophy --------------------------------- 03JFM at a Glance -------------------------------------------- 04Outline of JFM Operations ------------------------------- 06Capital --------------------------------------------------------- 07
Review and PlanReview of Operations for Fiscal 2014 ---------------- 10
1. Lending Operations ---------------------------------- 102. Funding Operations --------------------------------- 123. Financial Review -------------------------------------- 14
Management Plan for Fiscal 2015 --------------------- 161. Lending Operations ---------------------------------- 162. Funding Operations ---------------------------------- 163. Scheduled Payment to the National Treasury ------------------------------- 17
OperationsLending Operations ---------------------------------------- 20
1. Outline --------------------------------------------------- 202. Loan Interest Rates --------------------------------- 223. Credit Check System -------------------------------- 244. Trends in Lending Operations--------------------- 245. Lending Operations by Business ----------------- 27
Funding Operations ---------------------------------------- 301. Issue Type ---------------------------------------------- 302. Basic Funding Policy -------------------------------- 313. Features of JFM Bonds ----------------------------- 324. Trends in Funding Operations -------------------- 33
Management StructureCorporate Governance ------------------------------------ 36
1. Corporate Governance ------------------------------ 362. Internal Control over Financial Reporting ------ 383. Internal Audit ------------------------------------------- 38
General Account and Management Account ------- 39Risk Management ------------------------------------------ 41Compliance --------------------------------------------------- 46Disclosure----------------------------------------------------- 47
JFM’s Role in LocalGovernment Finance
1. Japanese Local Government System ----------- 482. Local Government Finance Program ------------ 493. Local Allocation Tax --------------------------------- 504. Local Government Borrowings -------------------- 505. Security of Local Government Borrowings ---- 506. Local Government Borrowing Program --------- 517. JFM Funds in Local Government Borrowing
Program ------------------------------------------------- 52
Financial SectionFinancial Statements -------------------------------------- 54Independent Auditor’s Report --------------------------- 94
Appendix / JFM DataAppendix ------------------------------------------------------ 96JFM Data --------------------------------------------------- 107
Organization History ----------------------------------- 107Organization Chart ------------------------------------- 108Directors and Corporate Auditors/ Contact Information ------------------------------------ 109
Note to Financial StatementsThe translation of the Japanese yen amounts into U.S. dollars is included solely for the convenience of readers outside Japan, using the prevailing exchange rate as of 31 March 2015, the final day of the fiscal year, which was JPY 120.37 to USD 1. This translation should not be construed as a representation that all amounts shown could be converted into U.S. dollars at such rate.
JFM Annual Report 2015 CONTENTS Review
and
Plan
Op
eration
sM
anagem
ent S
tructu
reJF
M’s R
ole in
L
ocal G
overnm
ent F
inan
ceF
inan
cial Sectio
nA
pp
end
ix / JFM
Data

Review of Fiscal 2014 In fiscal 2014, Japanese economy suffered slump in the first half mainly due to a decline of household spending after the national consumption tax rise in April 2014, but some positive outcomes were observed in the second half such as improved corporate earnings contributed by exporters and hike in stock prices. In terms of lending activities, JFM continued to be responsible for providing long-term funding at low-interest rate to the needs of the regions and disbursed a total of JPY 1.93 trillion (USD 16.0 billion) loans including social infrastructure projects and disas-ter management and mitigation projects. On the funding front, we continued diversification of our funding sources and raised a total of JPY 2.08 trillion (USD 17.5 billion) during the fiscal year. We focused more on flexible funding operations which are highlighted by issuing super long tenors bonds subject to domestic market conditions and investor demands. In addition to our domestic funding activities, we successfully completed our inaugural non-government guaranteed Euro denominated bonds with EUR 1 billion size, which marked the largest EUR denomi-nated bonds by a Japanese government related issuer. We believe that high profile of JFM name among the international investors supported the strong outcome.
Initiative for Fiscal 2015 For fiscal 2015, the lending volume is planned to be JPY 1.83 trillion (USD 15.2 billion) based on the Local Government Borrowing Program prepared by the national government. In response to funding needs by municipal enterprises for longer tenor projects such as water supply and sewage, JFM resolved that the maxi-mum term to loans for these projects would be increased to 40 years from fiscal 2015. In order to implement this lending plan, we believe that more flexible funding approaches are required under the volatile market conditions. We will continue to focus on ensuring stable and low-cost funding by further expanding funding options as well as respond-ing to market needs. Furthermore, in light of JFM’s solid business opera-tions, a portion of JFM’s reserves will be transferred to the national treasury over a period of three years from fiscal 2015 through fiscal 2017, with the aim of transfer-ring up to JPY 600 billion (USD 5.0 billion). JFM plans to pay JPY 300 billion (USD 2.5 billion) to the national treasury during fiscal 2015. All of our payment will be a part of local allocation tax and contribute to the local governments for regional revitalization.
JFM for Local Governments JFM's objective is to contribute to the sound opera-tion of local government financing by providing long-term funding at low interest rates, improving the welfare of local residents. JFM will continue to be committed to fulfill this mission with concerted efforts by our manage-ment and employees. Thank you for your understanding and continued support for our endeavors.
JFM Annual Report 2015 | 02
Message from the President and CEOYuji Watanabe President and CEO, Japan Finance Organization for Municipalities June 2015
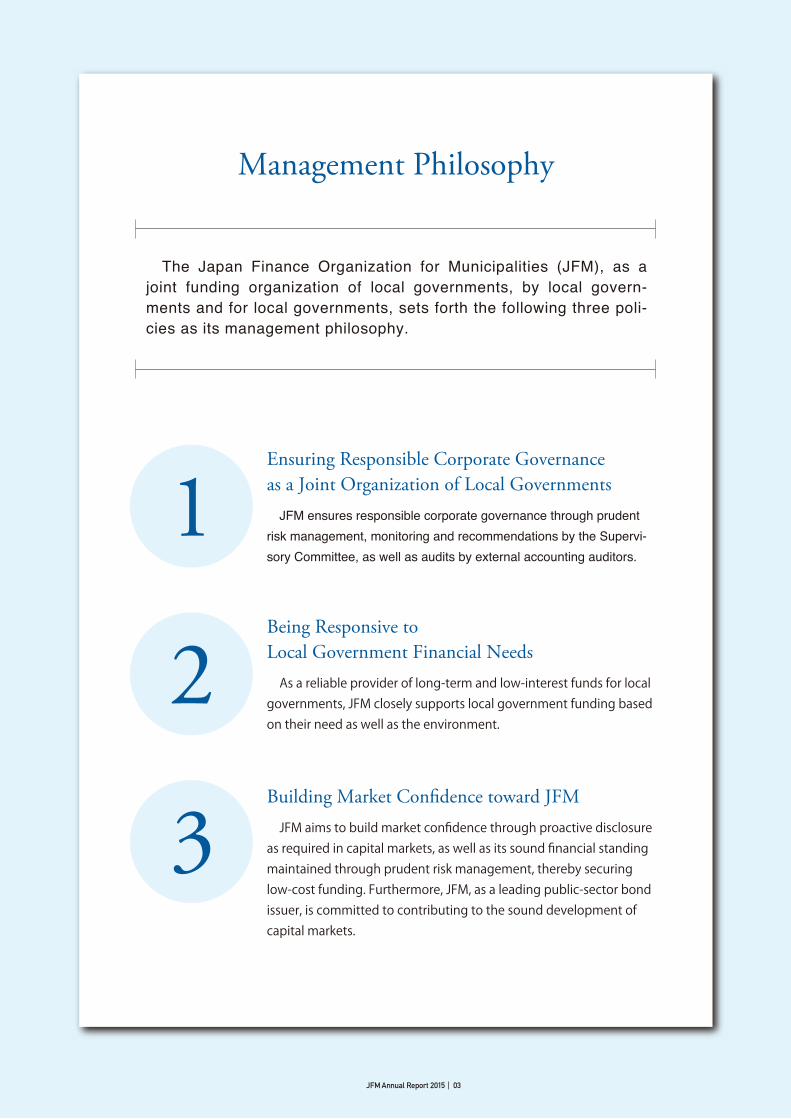
Management Philosophy
The Japan Finance Organization for Municipalities (JFM), as a joint funding organization of local governments, by local govern-ments and for local governments, sets forth the following three poli-cies as its management philosophy.
JFM Annual Report 2015 | 03
Ensuring Responsible Corporate Governance as a Joint Organization of Local Governments JFM ensures responsible corporate governance through prudent risk management, monitoring and recommendations by the Supervi-sory Committee, as well as audits by external accounting auditors.
1Being Responsive to Local Government Financial Needs As a reliable provider of long-term and low-interest funds for local governments, JFM closely supports local government funding based on their need as well as the environment.
2Building Market Con�dence toward JFM JFM aims to build market confidence through proactive disclosure as required in capital markets, as well as its sound financial standing maintained through prudent risk management, thereby securing low-cost funding. Furthermore, JFM, as a leading public-sector bond issuer, is committed to contributing to the sound development of capital markets.
3

■ Wholly owned by Japanese local governments, with the capital contribution from 1,789*1 local governments*2
■ Operates as a non-profit organization with the objec-tive to provide long-term and low-interest rate loansexclusively to Japanese local governments
■ Originally established in 1957 as a governmentfinancial institution. In 2008, as part of a policy-based financial reform conducted by the Japanese national government, the new JFM was established under the special law by succeeding to substantially all rightsand obligations of the predecessor
■ Japanese local governments include 47 prefectures and a total of 1,741 cities and special wards of Tokyo, government-designated cities, as well as towns and villages
■ Revenue sources for the local governments are secured by the national government ● The national government allocates a part of national
tax revenue to the local governments, in order to adjust the imbalance of revenue sources among the local governments
● The national government also prepares the Local Government Borrowing Program each fiscal year, which specifies the amount of local government funding as well as funding sources
● In the case of each local government funding, consent or approval must, in principle, be obtained from the relevant authorities
● Financial conditions of the local governments are monitored under the legal framework for early warning and reconstruction of fiscal soundness
■ Thus, none of the local governments has defaulted■ BIS 0% risk weight for Japanese local governments*3
at a Glance
The Joint Funding Organization for All Japanese Local Governments
Japanese Local Governments
Capital Contribution*1
(1) Excludes government-designated cities.(2) Government-designated cities: Cities with populations of 500,000 or more designated in accordance with Paragraph 1, Article 252-19 of the Local Autonomy Act. Such government-designated cities are allowed to administer certain matters such as social welfare, food safety, urban planning and so on, for which prefectures are responsible in principle.
Contributed by 1,789 Japanese local governments
Financial Highlights
Ordinary Income
Total Assets
Loans
Total Liabilities
Bonds
Reserves under Special Laws
Capital
YoY(USD bn)(USD bn)YoY
(JPY mm)(JPY mm)
Financial Highlights FY2014*1
24,524,279
23,437,630
24,350,790
19,542,864
3,608,067
16,602
180,499
+422,948
+354,654
+392,234
+119,121
+149,440
0
-7,552
204
195
202
162
30
0.1
1.5
+3.5
+2.9
+3.3
+1.0
+1.2
0
-0.1
20
16
18
12
14
8
10
4
6
2
02009 2010 2011 2012 2013 2014 2015(e)*FY
Annual Lending Volume(USD bn)
*Planned amount; subject to change depending on marketconditions and other factors.
JFM Annual Report 2015 | 04
USD137.9 mm
USD 8.6 mm
6.3%
Towns, villagesand local
governmentassociations
USD 23.9 mm
17.3%
Government-designated
cities(2)
PrefecturesUSD 52.9 mm
38.4%
USD 52.5 mm
38.1%
Cities(1) andspecial wardsof Tokyo
Notes: 1. As of 31 March 2015. 2. Local governments comprise all of the prefectures, cities and special wards, government-designated cities, towns and villages, as well as some local government associations. 3. Value for investors in Japan. For overseas bonds, the value is determined by respective authorities in each country.
Note : A rating is not a recommendation to buy, sell or hold securities and may be subject to suspension, reduction or withdrawal at any time by the assigning rating agencies.
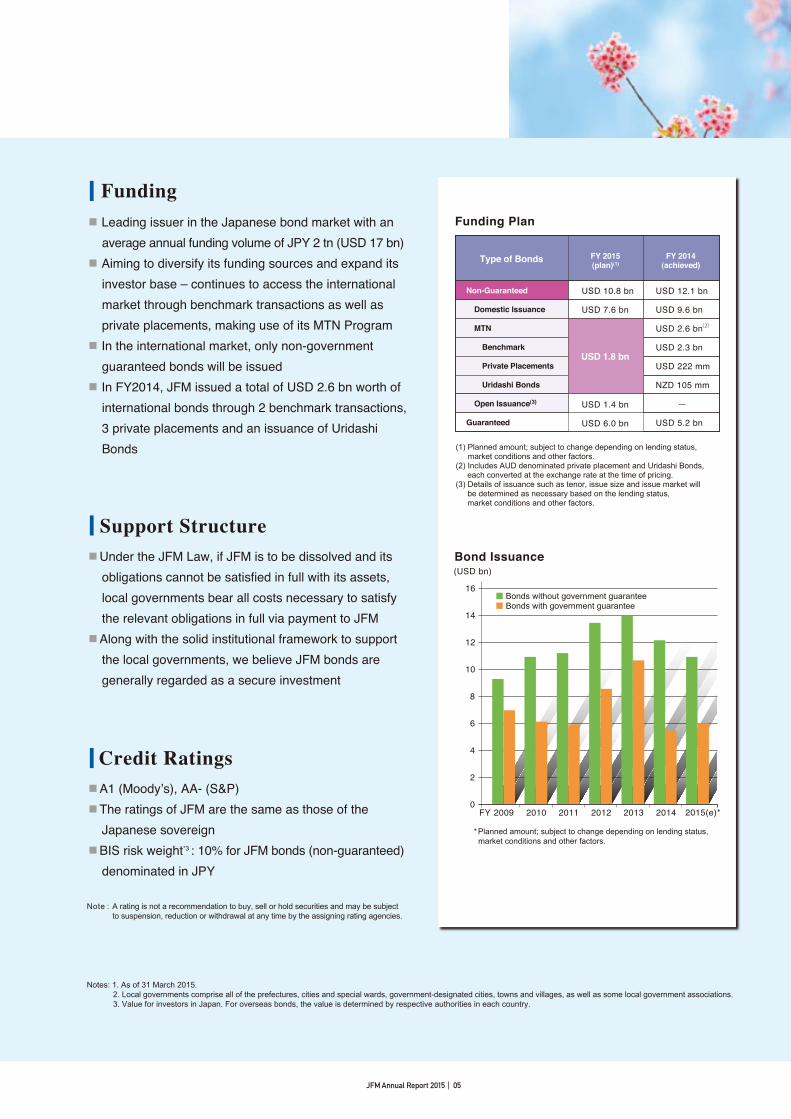
■ Leading issuer in the Japanese bond market with an average annual funding volume of JPY 2 tn (USD 17 bn)
■ Aiming to diversify its funding sources and expand its investor base – continues to access the international market through benchmark transactions as well as private placements, making use of its MTN Program
■ In the international market, only non-governmentguaranteed bonds will be issued
■ In FY2014, JFM issued a total of USD 2.6 bn worth of international bonds through 2 benchmark transactions, 3 private placements and an issuance of UridashiBonds
■ Under the JFM Law, if JFM is to be dissolved and its obligations cannot be satisfied in full with its assets,local governments bear all costs necessary to satisfythe relevant obligations in full via payment to JFM
■ Along with the solid institutional framework to supportthe local governments, we believe JFM bonds are generally regarded as a secure investment
Funding
Support Structure
■ A1 (Moody’s), AA- (S&P)■ The ratings of JFM are the same as those of the
Japanese sovereign■ BIS risk weight*3 : 10% for JFM bonds (non-guaranteed)
denominated in JPY
Credit Ratings
(1) Planned amount; subject to change depending on lending status, market conditions and other factors. (2) Includes AUD denominated private placement and Uridashi Bonds, each converted at the exchange rate at the time of pricing.(3) Details of issuance such as tenor, issue size and issue market will be determined as necessary based on the lending status, market conditions and other factors.
Funding Plan
Bond Issuance(USD bn)
*Planned amount; subject to change depending on lending status, market conditions and other factors.
16
14
12
10
8
6
4
2
02009 2010 2011 2012 20142013 2015(e)
Bonds without government guaranteeBonds with government guarantee
FY
USD 12.1 bn
USD 9.6 bn
USD 2.6 bn(2)
USD 2.3 bn
USD 222 mm
NZD 105 mm
USD 5.2 bn
USD 10.8 bn
USD 7.6 bn
USD 1.8 bn
Type of Bonds FY 2015(plan)(1)
FY 2014 (achieved)
Non-Guaranteed
Domestic Issuance
MTN
Benchmark
Private Placements
Uridashi Bonds
Open Issuance(3)
Guaranteed
USD 1.4 bn
USD 6.0 bn
JFM Annual Report 2015 | 05

JFM Annual Report 2015 | 06
Outline of JFM Operations
JFM is a joint funding organization for all local governments, wholly owned by Japanese local governments under the Japan Finance Organization for Municipalities Law (Act No. 64 of 2007, as amended; the “JFM Law”). JFM loans are provided exclusively to local governments, and local governments must receive the consent or approval of the Minister for Internal Affairs and Communications or their respective prefectural governors when they borrow from JFM. Within this structure, JFM has never had a default since its establishment.
Public Institution Wholly Owned by Japanese Local Governments
* A portion of the earnings from municipally operated racing (horse, bicycle, motorcycle and speedboat).
JFM contributes to the sound financial operation of local governments and improves the welfare of local residents with the aim of efficiently and effectively complementing local government fund-raising byproviding long-term funding at low-interest rates to local governments. For social infrastructure improvements to be implemented by local governments, long-term funding is usually desirable given that it takes a long time to recoup such capital expenditures, and also the cost
Joint Funding Organization for All Local Governments
Loca
l Gov
ernm
ents
Lending(Long-term/lowinterest rates)
Outstanding Loans
JPY 23.4 tn(USD 195 bn)
Japan Finance Organization for
Municipalities(JFM)
Reserve for Interest Rate Volatility, etc.
JPY 3.6 tn(USD 30 bn)
Funding(JFM Bonds)
Outstanding Bonds
JPY 19.6 tn(USD 163 bn)
Proceeds from Public Races*
Fund for Lending Rate
ReductionJPY 0.9 tn(USD 8 bn)
Reduction of Lending RatesFi
nanc
ial M
arke
ts
(As of 31 March 2015)

JFM Annual Report 2015 | 07
Capital
Notes:
JFM primarily issues 10-year bonds to raise funds and extends long-term(from fiscal 2015, maximum maturity is extended from 30 years to 40 years) loans to local governments, which creates a duration gap between lending and funding. To cope with the interest rate risk associated with bond refinancing (a negative margin caused by the interest payable exceeding the interest receivable), JFM maintains reserves for interest rate volatility.
Solid Financial Foundation
JFM receives a portion of the earnings from various racing events (horse, bicycle, motorcycle and speedboat) operated by local governments, which is directed to the Fund for Lending Rate Reduction. The investment gains from the fund are used to lower interest rates on JFM loans.
Reduction of Lending Rates by Utilizing the Fund for Lending Rate Reduction
As of 31 March 2015, JFM's capital was USD 137.9 million contributed by 1,789 Japanese local governments, i.e., all of the prefectures, cities, special wards of Tokyo, government-designated cities, towns and villages, as well as some local government associations. The amount of capital contribution from each local government is decided based on 1) outstand-ing JFM loans to each local government, and 2) the amount of revenue of each local government (mainly comprised of local taxes, local allocation taxes and temporary financial countermeasures funding).
burden should be shared across generations. However, local governments generally raise funds in capital markets for terms of 10 years or less. In response to this situation, JFM issues bonds in capital markets with a wide variety of maturities ranging from medium-term to super long-term to provide stable and low-interest funds to local governments. Under the JFM Law (Article 52, Paragraph 1), local governments have an obligation to bear the cost necessary to satisfy all JFM obligations in the event JFM is to be dissolved and its obligations remain unpaid.
Capital Contribution by Local Government Group
1. Excludes government-designated cities.2. Government-designated cities: Cities with populations of 500,000 or more designated in accordance with Paragraph 1, Article 252-19 of the Local Autonomy Act. Such government-designated cities are allowed to administer certain matters such as social welfare, food safety, urban planning and so on, for which prefectures are responsible in principle.
USD137.9 mm
USD 8.6 mm
6.3%
Towns, villagesand local
governmentassociations
USD 23.9 mm
17.3%
Government-designated
cities*2
PrefecturesUSD 52.9 mm
38.4%
USD 52.5 mm
38.1%
Cities*1 andspecial wardsof Tokyo
(As of 31 March 2015)

Review of Operations for Fiscal 2014
1. Lending Operations 10
2. Funding Operations 12
3. Financial Review 14
Management Plan for Fiscal 2015
1. Lending Operations 16
2. Funding Operations 16
3. Scheduled Payment to the National Treasury 17
Review and Plan


Review
and P
lan
ReviewandPlan Review of Operations for Fiscal 2014
Note: Totals may not add up due to rounding.
BusinessNumber of
Loans Made
Loan Amount (USD in millions)
% of total
General Account-related Loans
Public Projects, etc. 560 801 5.0
Public Housing 178 152 1.0
Disaster Management and Mitigation (Previous) 283 546 3.4
National Disaster Prevention 284 317 2.0
Educational Facilities Development 173 110 0.7
Social Welfare Facilities Development 140 109 0.7
General Waste Dispoal 4 2 0.0
General Projects 71 31 0.2
Regional Revitalization 155 74 0.5
Disaster Prevention 237 183 1.1
Local Road Development 329 254 1.6
Special Municipal Mergers 634 1,219 7.6
Disaster Management and Mitigation 940 749 4.7
Subtotal 3,988 4,546 28.4
Municipal Enterprise–related Loans
Water Supply 1,146 1,176 7.3
Industrial Water Supply 91 80 0.5
Transportation 44 273 1.7
Electricity and Gas Supply 62 106 0.7
Port Facilities 39 27 0.2
Hospitals and Elderly Care Services 376 714 4.5
Markets and Slaughterhouses 57 98 0.6
Sewerage 2,047 2,903 18.1
Tourism and Others 16 9 0.1
Subtotal 3,878 5,384 33.7
Refinancing Loans for Facilities Affected by Earthquake 6 2 0.1
Temporary Financial Countermeasures Funding 758 6,061 37.9
Total 8,630 15,994 100.0
1 Lending Operations
In fiscal 2014, JFM provided loans totaling USD 16.0 billion, which exceeded the initial plan by USD 1.0 billion, mainly as a result of actual lending surpassing plan by USD 0.3 billion in public projects, by USD 0.2 billion in national disaster prevention, by USD 0.2 billion in disaster management and mitigation, and by USD 0.3 billion in temporary financial countermeasures funding*. General account-related loans totaled USD 4.5 billion, or 28% of the total lending volume, mainly represented by the special municipal mergers. Loans for temporary financial countermeasures funding were USD 6.1 billion (38%), followed by municipal enterprise-related loans in the amount of USD 5.4 billion (34%), of which sewerage and water supply businesses were the main contributors.
Note: Represents local government funding to cover shortfalls in local government revenue sources pursuant to the provisions of the Local Government Finance Law (Act No. 109 of 1948, as amended).
Lending Operations by Business in Fiscal 2014
JFM Annual Report 2015 | 10

Review
and
Plan
Op
erationsM
anagem
ent Structure
JFM’s R
ole in Local G
overnment Finance
Financial Section
Ap
pend
ix / JFM D
ata
FY2014 Loans Extended by Business
Total
USD 16.0 bn Special Municipal Mergers
8% (USD 1.2 bn)
Public Projects, etc.
5% (USD 0.8 bn)
Disaster Management and Mitigation
5% (USD 0.7 bn)
Others
11% (USD 1.8 bn)Sewerage
18% (USD 2.9 bn)
Water Supply
7% (USD 1.2 bn)
Hospitals and Elderly Care Services
5% (USD 0.7 bn)
Transportation
2% (USD 0.3 bn)
Others
2% (USD 0.3 bn)
Refinancing Loans forFacilities Affected by Earthquake
0.1% (USD 0.01 bn)
Municipal Enterprise-related Loans
34% (USD 5.4 bn)
General Account-related Loans
28% (USD 4.5 bn)
Temporary Financial Countermeasures Funding
38% (USD 6.1 bn)
Total
USD 16.0 bn
Towns and Villages
7% (USD 1.1 bn)
Local Government Associations
3% (USD 0.4 bn)
Prefectures
22% (USD 3.6 bn)
Government-designated Cities
11% (USD 1.8 bn)Cities and Special Wards of Tokyo
57% (USD 9.1 bn)
FY2014 Loans Extended by Borrower
Note: Totals may not add up due to rounding.
JFM Annual Report 2015 | 11

Review
and P
lan
ReviewandPlan
2 Funding Operations
1. Overview*1
In fiscal 2014, JFM raised a total of USD 17.5 billion including USD 12.1 billion in JFM bonds (non-guaranteed), and USD 5.2 billion in government-guaranteed bonds for the repayment of existing bonds issued by Japan Finance Corporation for Municipal Enterprises (the “Predecessor”). With regard to JFM bonds, a total of USD 9.6 billion was raised by the regular issuance of 5-year, 10-year and 20-year domestic bonds, as well as opportunistic issuances through JFM’s Flexible Issuance Program (“FLIP”) and the MTN Program. The amount raised by JFM bonds exceeded from the initial funding plan (USD 9.1 billion) mainly due to the growth in the lending volume. As for domestic public offerings, a total of USD 7.1 billion was issued in the year. In order to cope with highly volatile market condition through the year, JFM reduced 10-year bond issuance from the initial plan while increasing opportunistic issuance. In overseas offerings, JFM issued its inaugural Euro denominated benchmark bonds in 7-year tenor (EUR 1 billion) in September 2014, followed by another first 10-year issuance (USD 1 billion) in February 2015. In addition to these successful benchmark transactions, JFM issued a total of USD 222 million through three private placements denominated in multiple currencies and also an offering of NZD 105 million Uridashi Bonds targeting Japanese retail investors. Through these activities, the total volume of international bonds issued amounted to USD 2.6 billion*2. The private placements of 10-year bonds with the Pension Fund Association for Local Government Officials were USD 2.5 billion. Furthermore, JFM also utilized bank loans as a complementary means of funding, financing USD 0.1 billion through long-term loans. As a result, as of the end of fiscal 2014, JFM’s outstanding bonds were USD 162.5 billion, including the Predecessor’s bonds to which JFM succeeded. Outstanding long-term bank loans totaled USD 0.7 billion.
Notes: 1. Issued amounts are calculated based on issue prices. 2. Includes an offering of EUR denominated benchmark bonds, two AUD denominated private placements, and an offering of
NZD denominated Uridashi Bonds, each converted at the exchange rate at the time of pricing.
Flexible Issuance Program (“FLIP”)FLIP is JFM’s own framework for domestic bond issuance. Bond maturities range from 3 years to 30 years (except for 5-year, 10-year and 20-year fixed rate bullet bonds) with minimum and maximum issue sizes of JPY 3 billion (USD 25 million) and JPY 20 billion (USD 166 million), respectively.
Review of Operations for Fiscal 2014
Funding in Fiscal 2014
1. JFM bonds (non-guaranteed)
(1) Domestic and overseas offeringsType of Bonds Plan (Initial) Achieved
Domestic Public Offerings USD 6.1 bn USD 7.1 bn
10-year USD 3.0 bn USD 2.9 bn
20-year USD 1.0 bn USD 1.1 bn
5-year USD 0.2 bn USD 0.2 bn
Opportunistic Issuance USD 1.8 bn USD 2.7 bn
Overseas Offerings - MTN USD 1.8 bn USD 2.6 bn
Open Issuance*3 USD 1.2 bn -
Total USD 9.1 bn USD 9.6 bn
Notes: 1. Figures in Plan (Initial) column show initially planned amounts. In December 2014, the above plan was revised to a total of USD 9.6 billion.
2. In addition to the total achieved figure above, USD 0.1 billion was raised through long-term bank loans.
(2) Private placements with Pension Fund Association for Local Government OfficialsType of Bonds Plan Achieved
10-year USD 2.5 bn USD 2.5 bn
2. Government-guaranteed domestic bonds
Type of Bonds Plan Achieved
10-year USD 3.6 bn USD 3.6 bn
6-year USD 1.7 bn USD 1.7 bn
Total USD 5.2 bn USD 5.2 bn
3. Details of issuance such as tenor, issue size and issue market will be determined as necessary based on the lending status, market conditions and other factors.
JFM Annual Report 2015 | 12
Review
and
Plan
Op
erationsM
anagem
ent Structure
JFM’s R
ole in Local G
overnment Finance
Financial Section
Ap
pend
ix / JFM D
ata
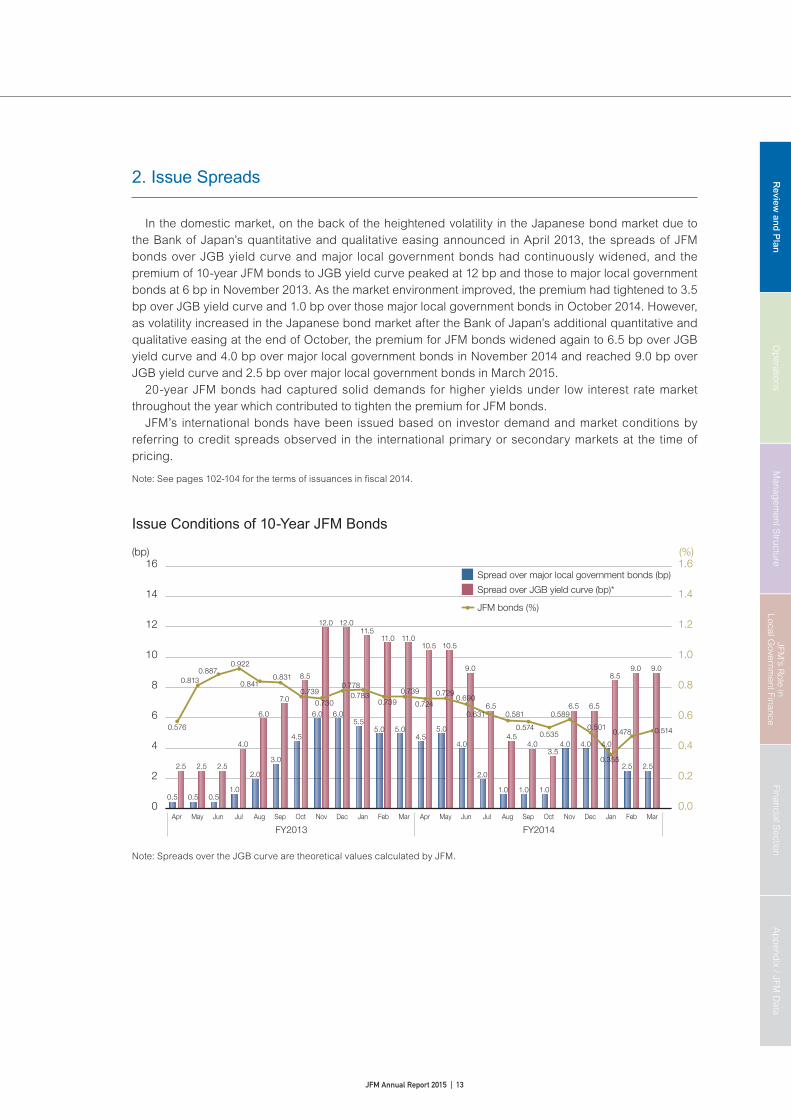
2. Issue Spreads
In the domestic market, on the back of the heightened volatility in the Japanese bond market due to the Bank of Japan’s quantitative and qualitative easing announced in April 2013, the spreads of JFM bonds over JGB yield curve and major local government bonds had continuously widened, and the premium of 10-year JFM bonds to JGB yield curve peaked at 12 bp and those to major local government bonds at 6 bp in November 2013. As the market environment improved, the premium had tightened to 3.5 bp over JGB yield curve and 1.0 bp over those major local government bonds in October 2014. However, as volatility increased in the Japanese bond market after the Bank of Japan’s additional quantitative and qualitative easing at the end of October, the premium for JFM bonds widened again to 6.5 bp over JGB yield curve and 4.0 bp over major local government bonds in November 2014 and reached 9.0 bp over JGB yield curve and 2.5 bp over major local government bonds in March 2015. 20-year JFM bonds had captured solid demands for higher yields under low interest rate market throughout the year which contributed to tighten the premium for JFM bonds. JFM’s international bonds have been issued based on investor demand and market conditions by referring to credit spreads observed in the international primary or secondary markets at the time of pricing.
Note: See pages 102-104 for the terms of issuances in fi scal 2014.
Issue Conditions of 10-Year JFM Bonds
(bp) (%)
0
2
4
6
8
10
12
14
16
0.0
0.2
0.4
0.6
0.8
1.0
1.2
1.4
1.6
FY2013 FY2014
Spread over major local government bonds (bp)
Spread over JGB yield curve (bp)*
JFM bonds (%)
Apr May Jun Jul Aug Sep Oct Nov Dec Jan Feb Mar Apr May Jun Jul Aug Sep Oct Nov Dec Jan Feb Mar
0.813
0.576
0.8870.922
0.8410.831
0.739
0.730
0.7780.783
0.7390.739
0.724
0.7290.690
0.631 0.581
0.5740.535
0.589
0.501
0.355
0.478 0.514
2.5 2.5 2.5
4.0
6.0
7.0
8.5
12.0 12.011.5
11.0 11.010.5 10.5
9.0
6.5
4.54.0
3.5
6.5 6.5
8.59.0 9.0
0.5 0.5 0.5
4.5
6.0 6.05.5
5.0 5.0
3.0
1.0
2.0
4.5 5.0
4.0
2.0
1.0 1.0 1.0
4.0 4.0 4.0
2.5 2.5
Note: Spreads over the JGB curve are theoretical values calculated by JFM.
JFM Annual Report 2015 | 13

Review
and P
lan
ReviewandPlan
3 Financial Review
1. Income Statement
In fiscal 2014, JFM’s income was USD 3.6 billion, a decrease of USD 0.2 billion from the previous year. This is mainly due to a downward trend in long-term interest rates in Japan, which led to lower interest income from loans. Expenses experienced a similar trend, decreasing USD 0.1 billion to USD 2.1 billion, on the back of reduced interest expenses with respect to bonds. Ordinary income was thus down USD 0.1 billion to USD 1.5 billion, though still maintaining JFM’s income stability. Pursuant to the relevant laws, a portion of the revenue generated by the refinancing of bonds and borrowed money of JFM* is to be directed into reserves for interest rate volatility. As a result of such provisions as well as other factors, net income amounted to USD 0.3 billion, up USD 0.03 billion.
*This revenue is calculated based on the difference between JFM’s funding rates at the time the loans were made and the current
refinancing rates.
2. Balance Sheet
As of 31 March 2015, JFM’s total assets amounted to USD 203.7 billion, up USD 3.5 billion from the previous year. This mainly resulted from an increase in loans by USD 2.9 billion due to the amount of new loans for local governments exceeding that of loans repaid. Total liabilities were up USD 3.3 billion to USD 202.3 billion. This increase primarily reflected an increase of USD 1.0 billion in outstanding bonds as a result of the issue amount exceeding the redemption amount as well as an increase of USD 1.2 billion in cash collateral received for financial instruments. Total net assets were USD 1.4 billion, up USD 0.3 billion. This reflected net income of USD 0.3 billion in the general account being recorded as the general account surplus reserve. Financial highlights since fiscal 2012 are as follows.
Review of Operations for Fiscal 2014
JFM Annual Report 2015 | 14

Review
and
Plan
Op
erationsM
anagem
ent Structure
JFM’s R
ole in Local G
overnment Finance
Financial Section
Ap
pend
ix / JFM D
ata
Financial Highlights
1. Income Statement (USD Millions)
FY2012 FY2013 FY2014YoY
Income 4,047 3,808 3,610 -198
Expenses 2,277 2,246 2,111 -135
Ordinary Income 1,770 1,562 1,500 -63
Net Income 173 220 257 37
0
2,000
4,000
6,000
2013 2014FY2012
(USD mm)
Income
Expenses
Ordinary Income
2. Balance Sheet (USD Millions)
End of FY2012 End of FY2013 End of FY2014YoY
Total Assets 196,934 200,227 203,741 3,514
Loans 188,325 191,767 194,713 2,946
Others 8,609 8,460 9,028 567
Total Liabilities 195,991 199,041 202,299 3,259
Bonds 155,158 161,367 162,357 990
Cash collateral received for financial instruments
- 362 1,514 1,152
Fund for lending rate reduction 7,664 7,664 7,645 -19
Reserves under special laws 32,791 28,733 29,975 1,242
Reserve for interest rate volatility
9,138 10,966 12,794 1,828
Management account reserve for interest rate volatility
23,022 17,221 16,711 -510
Reserve for interest rate reduction
630 546 470 -76
Others 377 915 809 -106
Total Net assets 943 1,186 1,441 255
2013 2014FY2012
(USD mm)
Total Assets
Total Liabilities
190,000
200,000
210,000
Note: Totals may not add up due to rounding.
JFM Annual Report 2015 | 15
Review
and P
lan
ReviewandPlan
1 Lending Operations
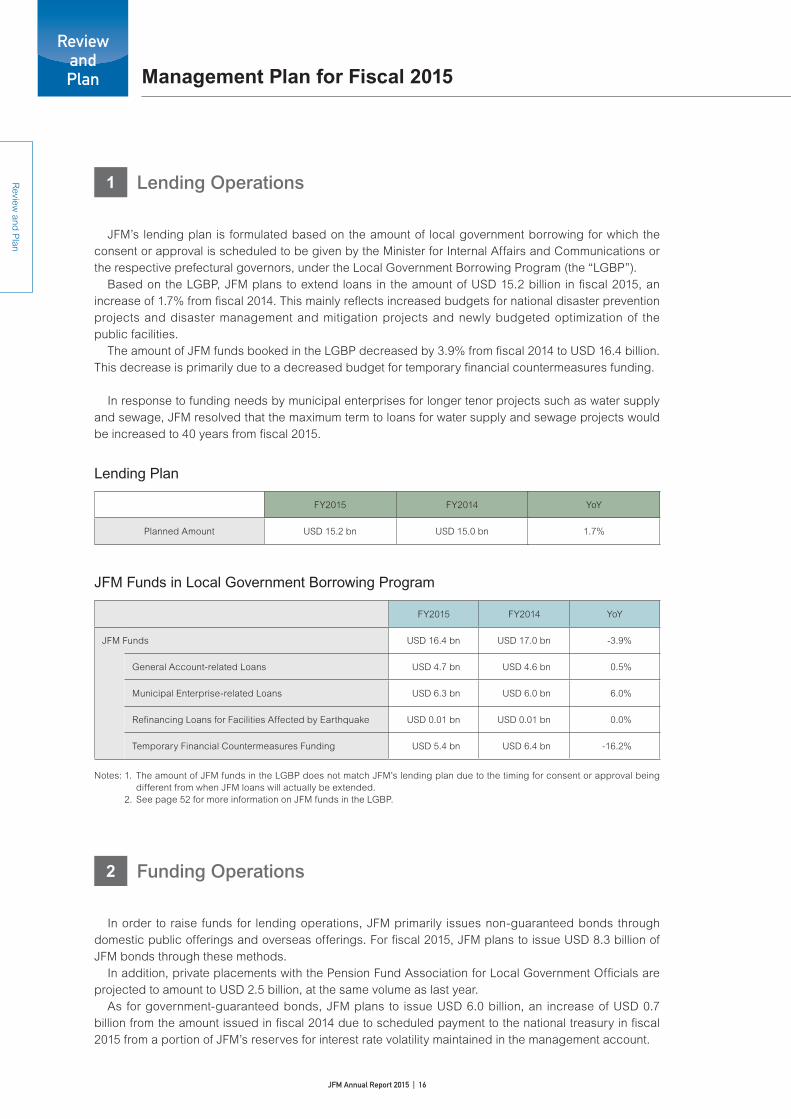
JFM’s lending plan is formulated based on the amount of local government borrowing for which the consent or approval is scheduled to be given by the Minister for Internal Affairs and Communications or the respective prefectural governors, under the Local Government Borrowing Program (the “LGBP”). Based on the LGBP, JFM plans to extend loans in the amount of USD 15.2 billion in fiscal 2015, an increase of 1.7% from fiscal 2014. This mainly reflects increased budgets for national disaster prevention projects and disaster management and mitigation projects and newly budgeted optimization of the public facilities. The amount of JFM funds booked in the LGBP decreased by 3.9% from fiscal 2014 to USD 16.4 billion. This decrease is primarily due to a decreased budget for temporary financial countermeasures funding.
In response to funding needs by municipal enterprises for longer tenor projects such as water supply and sewage, JFM resolved that the maximum term to loans for water supply and sewage projects would be increased to 40 years from fiscal 2015.
Lending Plan
FY2015 FY2014 YoY
Planned Amount USD 15.2 bn USD 15.0 bn 1.7%
JFM Funds in Local Government Borrowing Program
2 Funding Operations
In order to raise funds for lending operations, JFM primarily issues non-guaranteed bonds through domestic public offerings and overseas offerings. For fiscal 2015, JFM plans to issue USD 8.3 billion of JFM bonds through these methods. In addition, private placements with the Pension Fund Association for Local Government Officials are projected to amount to USD 2.5 billion, at the same volume as last year. As for government-guaranteed bonds, JFM plans to issue USD 6.0 billion, an increase of USD 0.7 billion from the amount issued in fiscal 2014 due to scheduled payment to the national treasury in fiscal 2015 from a portion of JFM’s reserves for interest rate volatility maintained in the management account.
Management Plan for Fiscal 2015
FY2015 FY2014 YoY
JFM Funds USD 16.4 bn USD 17.0 bn -3.9%
General Account-related Loans USD 4.7 bn USD 4.6 bn 0.5%
Municipal Enterprise-related Loans USD 6.3 bn USD 6.0 bn 6.0%
Refinancing Loans for Facilities Affected by Earthquake USD 0.01 bn USD 0.01 bn 0.0%
Temporary Financial Countermeasures Funding USD 5.4 bn USD 6.4 bn -16.2%
Notes: 1. The amount of JFM funds in the LGBP does not match JFM’s lending plan due to the timing for consent or approval being different from when JFM loans will actually be extended.
2. See page 52 for more information on JFM funds in the LGBP.
JFM Annual Report 2015 | 16

Review
and
Plan
Op
erationsM
anagem
ent Structure
JFM’s R
ole in Local G
overnment Finance
Financial Section
Ap
pend
ix / JFM D
ata
Funding Plan for FY2015
1. JFM bonds (non-guaranteed)
(1) Domestic and overseas offerings
Type of Bonds FY 2015 (Plan) FY2014 (Achieved)
Domestic Public Offerings USD 5.1 bn USD 7.1 bn
10-year USD 2.2 bn USD 2.9 bn
20-year USD 0.8 bn USD 1.1 bn
5-year USD 0.2 bn USD 0.2 bn
Opportunistic Issuance USD 1.8 bn USD 2.7 bn
Overseas Offerings - MTN USD 1.8 bn USD 2.6 bn
Open Issuance USD 1.4 bn –
Total USD 8.3 bn USD 9.6 bn
Notes: 1. Subject to change depending on lending status, market conditions and other factors. 2. For Open Issuance, details of issuance such as tenor, issue size and issue market will be determined as necessary based
on the lending status, market conditions and other factors. 3. In addition to the above FY2014 fi gures, USD 0.1 billion was raised through long-term bank loans.
(2) Private placements with Pension Fund Association for Local Government Offi cials
Type of Bonds FY 2015 (Plan) FY2014 (Achieved)
USD 2.5 bn USD 2.5 bn
2. Government-guaranteed domestic bonds
Type of Bonds FY 2015 (Plan) FY2014 (Achieved)
10-year USD 4.2 bn USD 3.6 bn
8-year USD 0.8 bn –
6-year USD 1.0 bn USD 1.7 bn
Total USD 6.0 bn USD 5.2 bn
3 Scheduled Payment to the National Treasury
In accordance with Article 14 of Supplementary Provisions of the JFM law, it was decided that USD 5.0 billion in total of JFM’s reserves for interest rate volatility in the management account would be transferred to the national treasury over three-year period from fi scal 2015 through fi scal 2017. In fi scal 2015, USD 2.5 billion shall be transferred to the national treasury to secure fi nancial resources of the local allocation tax for regional revitalization.
JFM Annual Report 2015 | 17

Lending Operations
1. Outline 20
2. Loan Interest Rates 22
3. Credit Check System 24
4. Trends in Lending Operations 24
5. Lending Operations by Business 27
Funding Operations
1. Issue Type 30
2. Basic Funding Policy 31
3. Features of JFM Bonds 32
4. Trends in Funding Operations 33
Operations

Op
erations
OperationsLending Operations
JFM’s primary objective is to contribute to the sound operation of the local
government financing and to improve the welfare of local residents by providing long-
term funding at low interest rates to local governments.
1 Outline
As public funds included in the LGBP, JFM loans are offered to local governments which have the consent or approval of the Minister for Internal Affairs and Communications or the respective prefectural governors.
1. Eligible Borrowers
JFM provides loans exclusively to local governments.
2. Types of Loans
JFM classifies general loans into the following three categories depending on the term.
• Long-Term Loans Loans provided to local governments that have the consent or approval, and mature in or
after the second fiscal year.
• Pre-Consent or Pre-Approval Loans Bridge loans to cover the period up to the disbursement of Long-Term Loans for projects for
which the consent or approval is assured.
• Short-Term Loans Loans to be repaid with revenues in the same fiscal year.
JFM Annual Report 2015 | 20

Review
and P
lanO
peratio
ns
Manag
ement S
tructureJFM
’s Role in
Local Governm
ent FinanceFinancial S
ectionA
pp
endix / JFM
Data
3. Lending Scopes and Maturities of Loans
JFM lends mainly to the following local government businesses with respective loan maturities.
Notes: 1. Adjustable lending rates are reviewed depending on the maturity of the loan every 5 years, every 10 years or every 15 years or 20th, or 30th anniversary of the initial disbursement. Lending rates for Temporary Financial Countermeasures Fundings are reviewed every 5 years or 10 years.
2. Maturities for the national disaster prevention business are determined based on the business category to which actual facilities planned for construction belongs.
Business Type
Loans for Fiscal 2015
Fixed Lending Rate Adjustable Lending Rate*1
MaturityGrace Period for Principal Repayment
MaturityGrace Period for Principal Repayment
Ge
ne
ral A
cc
ou
nt-r
ela
ted
Lo
an
s
Public Projects, etc.Within (Years)
20Within (Years)
5Within (Years)
20Within (Years)
5
Public Housing 25 5 25 5
National Disaster Prevention*2
Educational and Social Welfare Facilities Projects
Educational Facilities Development 25 3 25 3
Social Welfare Facilities Development 20 3 20 3
General Waste Disposal 15 3 15 3
Unsubsidized Projects
General Projects 20 5 20 5
Regional Revitalization 30 5 30 5
Disaster Prevention 30 5 30 5
Local Road Development 20 5 20 5
Special Municipal Mergers 30 5 30 5
Disaster Management and Mitigation 30 5 30 5
Public Facilities Optimization 30 5 30 5
Municipal Enterprise-related Loans
Water Supply 30 5 40 5
Industrial Water Supply 30 5 40 5
Transportation 30 5 40 5
Electricity Supply 30 5 30 5
Gas Supply 25 5 25 5
Port Facilities 30 5 40 5
Hospitals 30 5 30 5
Markets 30 5 40 5
Slaughterhouses 30 5 30 5
Sewerage 30 5 40 5
Temporary Financial Countermeasures Funding
Prefectures and Government-Designated Cities
– – 30 3
Cities, Towns and Villages – – 20 3
JFM Annual Report 2015 | 21
Op
erations
OperationsLending Operations
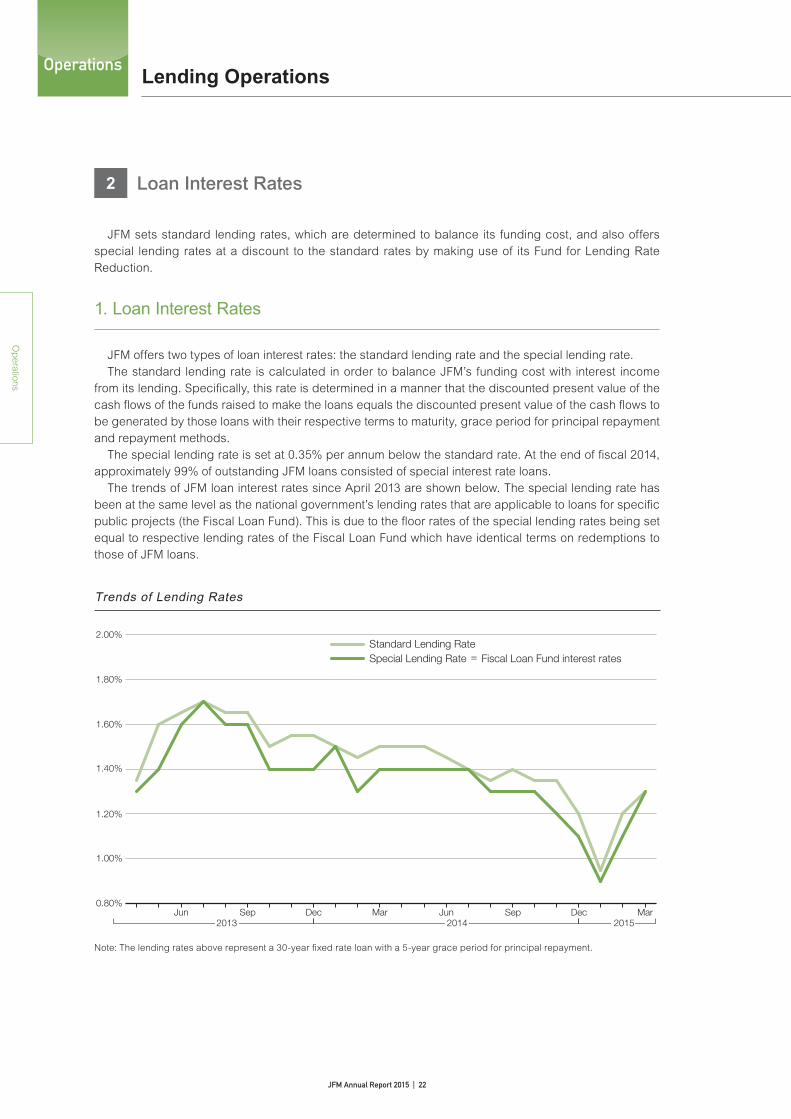
2 Loan Interest Rates
JFM sets standard lending rates, which are determined to balance its funding cost, and also offers special lending rates at a discount to the standard rates by making use of its Fund for Lending Rate Reduction.
1. Loan Interest Rates
JFM offers two types of loan interest rates: the standard lending rate and the special lending rate. The standard lending rate is calculated in order to balance JFM’s funding cost with interest income from its lending. Specifically, this rate is determined in a manner that the discounted present value of the cash flows of the funds raised to make the loans equals the discounted present value of the cash flows to be generated by those loans with their respective terms to maturity, grace period for principal repayment and repayment methods. The special lending rate is set at 0.35% per annum below the standard rate. At the end of fiscal 2014, approximately 99% of outstanding JFM loans consisted of special interest rate loans. The trends of JFM loan interest rates since April 2013 are shown below. The special lending rate has been at the same level as the national government’s lending rates that are applicable to loans for specific public projects (the Fiscal Loan Fund). This is due to the floor rates of the special lending rates being set equal to respective lending rates of the Fiscal Loan Fund which have identical terms on redemptions to those of JFM loans.
Note: The lending rates above represent a 30-year fixed rate loan with a 5-year grace period for principal repayment.
0.80%
1.00%
1.20%
1.40%
1.60%
1.80%
2.00%Standard Lending RateSpecial Lending Rate = Fiscal Loan Fund interest rates
Trends of Lending Rates
2014 20152013Jun Sep Dec Mar Jun Sep Dec Mar
JFM Annual Report 2015 | 22

Review
and P
lanO
peratio
ns
Manag
ement S
tructureJFM
’s Role in
Local Governm
ent FinanceFinancial S
ectionA
pp
endix / JFM
Data
2. Lending Rate Reduction
The interest rate differentials between the special lending rates and the standard lending rates are covered by investment gains in the Fund for Lending Rate Reduction*, which consists of contributions from local governments of a portion of the earnings from municipally operated racing, and also JFM’s own funds.
* From the viewpoint of equal revenue sharing among all local governments, local governments that operate horse, bicycle, motorcycle and speedboat racing contribute a portion of their earnings from the races to the Fund.
Standard Lending Rate
(funding costs)
Reduction 0.35%
Special Lending Rate
0.20%0.15%
0.20%0.15% Reduction using investment gains
Reduction using JFM’s own funds
General Account-related Loans • Public housingMunicipal Enterprise-related Loans• Industrial water supply • Gas supply• Elderly care services • Markets• Slaughterhouses • Parking facilities
General Account-related Loans (excluding public housing)Temporary Financial Countermeasures FundingMunicipal Enterprise-related Loans• Water supply • Transportation • Hospitals • Sewerage • Electricity supply
Notes: 1. The minimum interest rates for JFM loans are set at the same level as the interest rates of the Fiscal Loan Fund. 2. The discount rates using the investment gains (0.15% or 0.20%) applicable to each business category are determined by
the Minister for Internal Affairs and Communications, pursuant to the Ministerial Ordinance on Finance and Accounting of the Japan Finance Organization for Municipalities (Ordinance No. 87 of the Ministry of Internal Affairs and Communications, 2008).
JFM Annual Report 2015 | 23
Op
erations
OperationsLending Operations
3 Credit Check System
JFM conducts the following credit check process for all loans on the assumption that the details and legality of each project as well as assurance of loan repayment have been confirmed during the consultation and checking process to obtain the consent or approval for loans.
1) JFM checks the financial and operational status of local governments and municipal enterprises to which it plans to lend, in light of the fiscal indicators as stipulated in the Law Relating to the Financial Soundness of Local Governments of Japan (Act No. 94 of 2007). This credit check process may include an interview of the staff of prefectures, cities, towns, and villages.
2) JFM reviews loan applications submitted by local governments to determine if conditions are met. The conditions include the consent or approval, any required resolution by the local government assembly and budget appropriation for loans.
3) After a loan is disbursed, JFM conducts an onsite review to verify the use of funds and to check the operational status of the project and the financial and operational status of the borrower.
Disbursementof loans
1 Check of local governments/municipalenterprises applying for loans
•Check financial and operational status•Conduct interviews
2 Verification at the time of lendingCheck of the loan application documents
•Verify the consent or approval for the loan amount•Check the loan application documents
3 Subsequent reviewOnsitecredit review
•Check the status of loans and projects•Check financial and operational status
4 Trends in Lending Operations
1. Overview
JFM’s annual lending volume has risen since fiscal 2009 as a result of the expansion of its lending scope to overall general account-related loans, the introduction of the Great East Japan Earthquake-related loans, and so on. In fiscal 2014, the lending volume amounted to USD 16.0 billion. At year-end, outstanding loans were USD 194.7 billion.
Annual Lending Volume Outstanding Loans
2010 2011FY2009 2012 2013 2014 2010 2011FY2009 2012 2013 20140
5
10
15
20
25
170
180
190
200
210(USD bn) (USD bn)
10.7
15.2 15.015.7
17.716.0
183.0184.7 186.0
188.3
191.8194.7
0
JFM Annual Report 2015 | 24

Review
and P
lanO
peratio
ns
Manag
ement S
tructureJFM
’s Role in
Local Governm
ent FinanceFinancial S
ectionA
pp
endix / JFM
Data
2. Annual Lending Volume by Business and Borrower
In fi scal 2009, JFM has become eligible to extend loans for general account related businesses and temporary fi nancial countermeasures funding. As a result, the proportion of the annual lending amount by business types has changed signifi cantly. In fi scal 2014, loans for temporary fi nancial countermeasures funding were USD 6.1 billion, accounting for the largest share of lending, at 38% of the total. Ranked next were USD 2.9 billion in the sewerage business, representing 18% of the total, and USD 1.2 billion in the special municipal mergers, for 8% of the total. Amount of JFM loans extended to local governments during fi scal 2014 totaled USD 16.0 billion. Cities and special wards of Tokyo represented the highest share at 57% of the total, followed by prefectures at 22% and government-designated cities at 11%.
FYTotal
(USD bn)
Long-Term Loans Extended by Business
2010 15.2
2011 15.0
2012 15.7
2013 17.7
2014 16.0
4%20% 42%20%8% 3% 3%
427 37177 3 5
633 33167 1 4
228 38187 2 5
Transportation 622 41188 2 3
OthersGeneral Account-related LoansHospitalsWater Supply Sewerage
Temporary Financial Countermeasures Funding
Notes: 1. Pre-consent or pre-approval loans are accounted for in the year when they are converted into long-term loans. 2. “Others” includes refinancing loans for municipal enterprise-related projects, and refinancing loans for facilities and
specifi ed local governments affected by earthquake. 3. Totals may not add up due to rounding.
FY2014 Loans Extended by Borrower
Total
USD 16.0 bn
Towns and Villages
7% (USD 1.1 bn)
Local Government Associations
3% (USD 0.4 bn)
Prefectures
22% (USD 3.6 bn)
Government-designated Cities
11% (USD 1.8 bn)
Cities and Special Wards of Tokyo
57% (USD 9.1 bn)
Note: Totals may not add up due to rounding.
JFM Annual Report 2015 | 25

Op
erations
OperationsLending Operations
3. Outstanding Loans by Business and Borrower
At the end of fiscal 2014, the outstanding loans were USD 194.7 billion, of which the sewerage business accounted for the largest share at 35%, followed by temporary financial countermeasures funding at 17% and water supply at 16%. There were a total of 2,146 local governments with outstanding loans from JFM, including all prefectures. Cities and special wards of Tokyo accounted for the largest portion at 52% of the total, followed by prefectures at 20% and government-designated cities at 18%. Towns, villages as well as local government associations and corporations represented the remaining 10.3%.
Temporary Financial Countermeasures Funding
17% (USD 33.0 bn)
Others
6% (USD 11.7 bn)
Water Supply
16% (USD 30.4 bn)
Public Housing
2% (USD 3.2 bn)
Hospitals
3% (USD 6.3 bn)
Sewerage
35% (USD 68.3 bn)
Industrial Water Supply
1% (USD 1.7 bn)
Disaster Management and Mitigation
2% (USD 4.0 bn)
Transportation
5% (USD 10.1 bn)
Special Municipal Mergers
4% (USD 7.0 bn)
Outstanding Loans by Business (as of 31 March 2015)
Total
USD 194.7 bn
Local Road Development (Previous)
10% (USD 19.1 bn)
Local Government Corporations
0.3% (USD 0.6 bn)[24]
Outstanding Loans by Borrower (as of 31 March 2015)
Total
USD 194.7 bn[2,146]
Prefectures
20% (USD 38.3 bn) [47]
Government-designated Cities
18% (USD 35.0 bn)[20]
Cities and Special Wards of Tokyo
52% (USD 101.2 bn)[791]
Towns and Villages
7% (USD 14.4 bn)[925]
Local Government Associations
3% (USD 5.3 bn)[339]
*Figures in square brackets represent the number of borrowers.
Note: Totals may not add up due to rounding.
JFM Annual Report 2015 | 26

Review
and P
lanO
peratio
ns
Manag
ement S
tructureJFM
’s Role in
Local Governm
ent FinanceFinancial S
ectionA
pp
endix / JFM
Data
5 Lending Operations by Business
JFM provides loans to local government businesses specified in the LGBP that the national government formulates each fi scal year. The major JFM-funded businesses are as follows.
Sewerage Business
At the end of fi scal 2013, the sewerage system covered 75.6% of people in cities, towns and villages with a population of less than 50,000, or 88.9% of the nation’s total population. There were 3,640 projects involved, with a total annual sewerage processing capacity (combined storm water and sewerage treatment, excluding river basin sewerage) of around 14.9 billion cubic meters serving areas with a population of 102.4 million people. In fi scal 2014, loans extended to the sewerage business totaled USD 2.9 billion.
Water Supply Business
At the end of fi scal 2012, the water supply coverage was 97.7% of the population. The water supply business (including small-scale water supply) operated by local governments totaled 2,112 projects and provided about 18.4 billion cubic meters of water annually for approximately 124.49 million people. In fi scal 2014, loans extended to the water supply business amounted to USD 1.2 billion.
Loan Amount
0
0.5
1.0
1.5
2.0
0
500
1,000
1,500
2,000
Number of Loans
(USD bn) (Number of loans)
11 12 13 14FY2010
Shiramizu Raw Water Reservoir (Ishigaki City, Okinawa Prefecture)
Loan Amount
0
1.0
2.0
3.0
4.0
5.0
0
5,000
4,000
3,000
2,000
1,000
11 12 13 14FY2010
(USD bn) (Number of loans)
Number of Loans
Loan Amount
Sewage Sludge Gasifi cation System in Kiyose Water Reclamation Center (Tokyo)
JFM Annual Report 2015 | 27

Op
erations
OperationsLending Operations
Hospitals Business
At the end of fiscal 2013, hospital projects managed by local governments totaled 643 with 839 hospitals, which included 806 general hospitals, one tuberculosis hospital and 32 mental hospitals. In fiscal 2014, loans extended to the hospitals business (including those run by local independent administrative institutions) totaled USD 0.7 billion.
Transportation Business
At the end of fiscal 2013, the transportation projects managed by local governments totaled 91 projects, which were operated by 74 entities, and public transportation is used by approximately 4.1 billion people annually (11.22 million people on an average daily basis). In fi scal 2014, loans extended to the transportation business amounted to USD 0.3 billion.
Sendai City Subway Tozai Line (Sendai City, Miyagi Prefecture)
Loan Amount
0
0.1
0.2
0.3
0.4
0.5
0
20
60
80
100
40
11 12 13 14FY2010
(Number of loans)(USD bn)
Number of Loans
Uwajima City Hospital (Ehime Prefecture)
0
0.2
0.4
0.6
0.8
1.0
(Number of loans)
0
100
200
300
400
500
(USD bn)
Loan AmountNumber of Loans
11 12 13 14FY2010
JFM Annual Report 2015 | 28

Review
and P
lanO
peratio
ns
Manag
ement S
tructureJFM
’s Role in
Local Governm
ent FinanceFinancial S
ectionA
pp
endix / JFM
Data
Temporary Financial Countermeasures Funding
Temporary financial countermeasures funding represents the funding for local governments in order to cover general resource shortfalls pursuant to the provisions of the Local Government Finance Law. In order to secure the payments of the principal and interest of funds borrowed by local governments under temporary financial countermeasures funding, the national government includes the entire amount of such payments in the total amount of local allocation tax grants, which are to be allocated to local governments in subsequent years. In f iscal 2014, loans ex tended for temporar y f inancial countermeasures funding amounted to USD 6.1 billion.
Loan Amount
0
2.0
4.0
6.0
8.0
(Number of loans)
400
600
800
1,000
1,200
(USD bn)
Number of Loans
11 12 13 14FY2010
JFM Annual Report 2015 | 29
Op
erations
OperationsFunding Operations
As a joint funding organization for local governments, JFM raises funds in a
consistent manner to provide local governments with long-term and low-interest funds,
while endeavoring to reduce its funding costs.
1 Issue Type
JFM primarily issues non-guaranteed bonds (i.e., JFM bonds) through public offerings in order to raise funds for its lending operations. Private placements with the Pension Fund Association for Local Government Officials are also taken as a means of fund-raising. JFM issues government-guaranteed bonds only for refinancing the existing government-guaranteed bonds of the Predecessor in order to manage the Predecessor’s assets to which JFM has succeeded.
JFM Bonds
Government-Guaranteed Bonds
To be issued by JFM without government guarantees. Under Article 40,
Paragraph 2 of the JFM Law, all holders of JFM bonds have a preferential
right to be paid prior to other unsecured indebtedness.Domestic Bonds
International Bonds
Public
Offerings
Private Placements with Pension Fund Association
for Local Government Officials
•Regular issuance of 5-year, 10-year and 20-year bonds
•Opportunistic bond issuance (maturities except for 5-year, 10-year and 20-year)
Bonds issued in international markets through the MTN Program
To be issued only for the purpose of refinancing existing government-
guaranteed bonds of the Predecessor.
JFM Annual Report 2015 | 30

Review
and P
lanO
peratio
ns
Manag
ement S
tructureJFM
’s Role in
Local Governm
ent FinanceFinancial S
ectionA
pp
endix / JFM
Data
2 Basic Funding Policy
To secure stable and low-cost funding, JFM pursues diversified funding options and strives to build confidence in capital markets by proactively disclosing information and thoroughly fulfilling responsibilities. JFM also endeavors to seek more fl exible funding operations than ever in response to current low interest rate environment and movement of investor demands.
1. Diversifi cation of Funding Methods
From the viewpoint of stable funding, JFM endeavors to issue bonds with various maturities and structures, including medium-term and super-long-term bonds in response to the market environment and market needs, in order to broaden its investor base, while also considering funding costs and risk management. JFM’s basic means of funding is the issuance of bonds. JFM accesses the domestic market through the regular issuance of 5-year, 10-year and 20-year bonds, and also continues to take advantage of its Flexible Issuance Program (FLIP) for opportunistic funding as well as bank loans. JFM also utilizes the MTN Program, being committed to the regular issuance of benchmark bonds to the international investors and Uridashi Bonds to Japanese retail investors.
2. Proactive Disclosure and Investor Relations
JFM proactively discloses information on its operations, financial conditions and risk management status in order to support investment decisions by investors. In this context, JFM announces its annual funding plan prior to the start of the new fi scal year and its second half-year funding plan in September. In addition, JFM performs investor relations activities, including presentation meetings and/or one-on-one meetings with investors in both domestic and international markets. JFM thereby helps investors correctly understand JFM’s management and bonds as well as strengthens market confi dence toward JFM.
3. Contribution to the Sound Development of Capital Markets
While capturing funding opportunities in response to the needs of capital markets, JFM will further strengthen its role as a leading public-sector bond issuer and be committed to contributing to the sound development of capital markets.
JFM Annual Report 2015 | 31

Op
erations
OperationsFunding Operations
3 Features of JFM Bonds
JFM bonds are generally recognized as having high credit standing with the following features.
• JFM’s assets can be deemed to be highly stable based on the fact that JFM lends exclusively to local governments, and no local governments have ever defaulted.
• JFM has a solid financial foundation, backed by its reserve for interest rate volatility and the Fund for Lending Rate Reduction prescribed in the JFM Law.
• JFM is a joint funding organization established with a capital contribution from Japanese local governments encompassing all prefectures, cities, special wards of Tokyo, government-designated cities, towns and villages, as well as some local government associations.
• Under the JFM Law, local governments have an obligation to bear the costs necessary to satisfy all JFM obligations in the event JFM is to be dissolved and its obligations remain unpaid.
JFM has received the highest credit rating among the Japanese public-sector bond issuers from Standard and Poor’s (S&P), Moody’s Investors Service (Moody’s) and Rating and Investment Information, Inc. (R&I). The BIS risk weighting is 10% for JFM bonds denominated in yen. In addition to JGBs and local government bonds, interest received by foreign investors (non-residents, foreign corporations, etc.) on JFM’s domestic bonds in book-entry form as well as JFM’s international bonds (both of which include government-guaranteed bonds) shall be exempted from Japanese income tax, subject to certain procedural requirements.
JFM bonds:
10%
For reference:
Japanese Government Bonds: 0%
Japanese Government-Guaranteed Bonds: 0%
Local Government Bonds: 0%
Issuer Credit Rating
BIS Risk Weighting(denominated in yen)
Preferential Rights for JFM Bonds
S&P: AA-
Moody's: A1
R&I: AA+
All holders of JFM bonds (as well as JFM’s government-guaranteed bonds) have a
preferential right to be paid prior to other unsecured indebtedness, and such preferential
right shall rank immediately after the general preferential rights as provided for in the
Civil Code of Japan (Law No. 89 of 1896, as amended). (Article 40, Paragraph 2 and
Paragraph 3 of the JFM Law)
(as of 31 March 2015)
Note: The risk weights are values for investors in Japan. For oversea bonds, the values are determined by respective authorities in each country (as of 31 March 2015).
JFM Annual Report 2015 | 32

Review
and P
lanO
peratio
ns
Manag
ement S
tructureJFM
’s Role in
Local Governm
ent FinanceFinancial S
ectionA
pp
endix / JFM
Data
4 Trends in Funding Operations
JFM issues JFM bonds (non-guaranteed bonds to be issued through domestic public offerings or under the MTN Program, or private placements with the Pension Fund Association for Local Government Officials) and government-guaranteed bonds for the purpose of refinancing existing government-guaranteed bonds of the Predecessor. Historically, the Predecessor had issued government-guaranteed bonds and private placement bonds subscribed by the Pension Fund Association for Local Government Offi cials and, for the period from fi scal 2001 to fi scal 2008, non-guaranteed FILP agency bonds*. Then, since JFM commenced its operations in fi scal 2008, JFM has issued JFM bonds. In recent years, the issuance of JFM bonds has been increasing, and this trend is expected to continue for the future. On the other hand, aside from an increase over the last two years due to the scheduled payment to the national treasury, the issuance of guaranteed bonds will gradually decrease. In fi scal 2014, JFM raised a total of USD 17.5 billion, a decrease of USD 7.6 billion from the previous year. This decrease was mainly due to completion of the scheduled payment to the national treasury, which JFM funded USD 5.4 billion through government guaranteed bonds in fiscal 2013, and also a decrease in the annual lending volume. At year-end, outstanding bonds were USD 162.5 billion. Outstanding bank loans totaled USD 0.7 billion. The total amount of outstanding bonds and bank loans was USD 163.2 billion, which was comprised of USD 70.4 billion in the general account and USD 92.8 billion in the management account. While the outstanding bonds and bank loans in the general account have been increasing, the management account has been decreasing. JFM expects the amount of the management account to gradually decrease as no new bonds have been issued since October 2008 and will be issued going forward for new loan except for refi nancing outstanding Predecessor’s bonds.
Note: FILP stands for Fiscal Investment and Loan Program, which is prepared by the national government and determines the allocation of funds and extent of government guarantees available for certain institutions. FILP agency bonds are non-guaranteed bonds issued under the FILP.
0
50
100
150
200
0
5
10
15
20
25
30
Funding Volume Outstanding Bonds and Bank Loans
General Account
Management Account
(USD bn)
2011 2012 2013FY2010
16.9
21.8
25.1
2014 2011 2012 2013FY2010 2014
17.517.3
(USD bn)
152.4 155.5162.2 163.2
151.4
Government-guaranteed international bonds
Government-guaranteed domestic bonds
Long-term bank loans
Private placements with Pension Fund Association for Local Government OfficialsJFM bonds (international bonds)
JFM bonds (domestic bonds)
5.4
0.7
3.3
7.5
8.6
2.7
2.5
8.1
10.6
2.50.4
3.2
8.4
12.4
5.2
0.12.5
2.6
7.1
0.22.5
5.9
0.8
0.9
7.8
131.0110.5
103.492.8
118.8
21.4
45.058.8
70.4
32.6
Non-guaranteed bonds
JFM Annual Report 2015 | 33

Corporate Governance
1. Corporate Governance 36
2. Internal Control over Financial Reporting 38
3. Internal Audit 38
General Account and
Management Account 39
Risk Management 41
Compliance 46
Disclosure 47
ManagementStructure

Manag
ement S
tructure
Management Structure
JFM ensures responsible corporate governance through the participation of external
experts on the Representative Board and the Supervisory Committee and audits by
external accounting auditors.
1 Corporate Governance
*Elected by the national associations of prefectural governors, mayors of cities, and mayors of towns and villages.
Corporate Governance
Corporate Governance System
Corporate Auditors
Representative Board
Members: (1) Representatives at local governments* (2) External experts*Number of Members: 6 (3 from (1) above and 3 from (2) above)Term of Of�ce: 3 years
Accounting Auditors
National Government
Supervisory Committee
Appointment of members
Appointment and dismissal of
the President and CEO
Consultation and propositions
Members: External experts Number of Members: 6 Term of Of�ce: 2 years
(Certi�ed public accountants or an audit corporation)
Budget submissions
Approval of changes to the articles of association
Demand for correction of illegal activities
Audits
Audits
Decisions on important matters, including budgets
and accounts
Appointment of Accounting Auditors
and Corporate Auditors
President and CEO, Deputy President, etc.
JFM Annual Report 2015 | 36

Review
and P
lanO
perations
Man
agemen
t Stru
cture
JFM’s R
ole in Local G
overnment Finance
Financial Section
Ap
pend
ix / JFM D
ata
1. Representative Board
As an organization autonomously managed by local governments, JFM has the Representative Board as its supreme decision-making body. To ensure independence and transparency, the Representative Board consists of one prefectural governor, one city mayor, one town/village mayor and three members from among experts in local administration, economics, fi nance, law or accounting. The Representative Board has the authority to make decisions on important matters related to the overall management of JFM, including budgets, settlement of accounts and business plans. As its supervisory function, the Board also has the authority to order the President and CEO to report on the organization’s business, assets and liabilities, and to take corrective actions with respect to any illegal or other inappropriate activities.
2. Supervisory Committee
JFM has focused on establishing highly transparent management that incorporates unbiased opinions of external parties, and responsible corporate governance. To ensure such a governing structure, JFM has the Supervisory Committee as a deliberative committee comprising external experts. The Representative Board appoints the members of the Supervisory Committee from among experts in local administration, economics, fi nance, law or accounting, and other experts in the academic world. The Supervisory Committee has the function of monitoring the operations of JFM and may offer its opinions on important matters such as JFM’s operations including budgets, settlement of accounts and business plans. The Committee may also, if necessary, request that the President and CEO report on those matters. The President and CEO must respect and report the Committee’s opinions to the Representative Board.
3. Audits by Corporate Auditors
The Corporate Auditors are responsible for auditing the accounts of JFM, and may, at their discretion, submit reports to the Representative Board, the President and CEO and the Minister for Internal Affairs and Communications.
4. Audits by External Accounting Auditors
As JFM raises funds in capital markets, the proper disclosure of information and external checks on accounting procedures are essential in order to build market confi dence toward JFM and raise funds at low cost. From this viewpoint, JFM has its fi nancial statements audited not only by corporate auditors but also by external accounting auditors (certifi ed public accountants or an audit corporation) appointed by the Representative Board.
JFM Annual Report 2015 | 37
Manag
ement S
tructure
Management Structure
2 Internal Control over Financial Reporting
Pursuant to the Ministerial Ordinance on Finance and Accounting of the Japan Finance Organization for Municipalities (Ordinance No. 87 of the Ministry of Internal Affairs and Communications, 2008; the “Ordinance”), JFM has a system of internal control over financial reporting to ensure the reliability of its financial statements, and also maintains and implements this system appropriately. In accordance with the Ordinance, JFM prepares the Internal Control Report, the base date of which is the end of the fiscal year (March 31), and it is audited by the external auditors and released together with the financial statements. In the fiscal 2014 Internal Control Report, JFM viewed its internal controls on financial reporting as effective. In the Auditors’ Report on Internal Controls, the accounting auditors gave their opinion (unqualified audit opinion pursuant to Ministerial Ordinance Article 32, Paragraph 4, Clause 1) that, in all material respects, evaluation results of JFM’s internal controls over financial reporting were in conformity with the standards of evaluation for internal controls over financial reporting generally accepted in Japan.
3 Internal Audit
An internal auditor, who is independent from other departments, divisions and offices, examines and assesses the appropriateness and effectiveness of JFM’s internal control systems, thereby helping ensure reliable financial reporting and appropriate and efficient operations. On completing this task, the internal auditor submits a report to the president and CEO. If the internal auditor identifies deficiencies, related divisions and offices must immediately take the required corrective actions. The internal auditor will then submit to the president and CEO an internal audit report that includes the progress of corrective actions. The internal auditor also performs follow-up audits and reports the results to the president and CEO as necessary.
Corporate Governance
Internal Audit System
Deputy President
DepartmentsDivisions
Senior Executive Directors
Internal Auditors
President and CEO
Internal Audits
JFM Annual Report 2015 | 38
Review
and P
lanO
perations
Man
agemen
t Stru
cture
JFM’s R
ole in Local G
overnment Finance
Financial Section
Ap
pend
ix / JFM D
ata
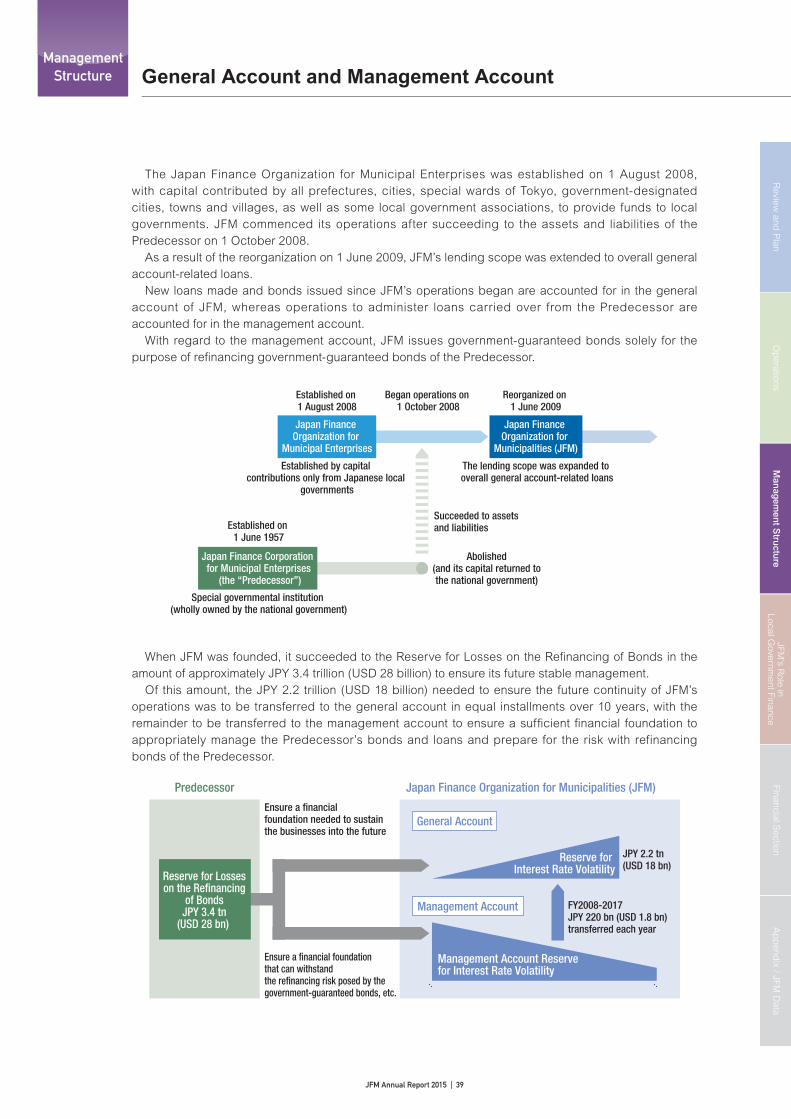
General Account and Management Account
The Japan Finance Organization for Municipal Enterprises was established on 1 August 2008, with capital contributed by all prefectures, cities, special wards of Tokyo, government-designated cities, towns and villages, as well as some local government associations, to provide funds to local governments. JFM commenced its operations after succeeding to the assets and liabilities of the Predecessor on 1 October 2008. As a result of the reorganization on 1 June 2009, JFM’s lending scope was extended to overall general account-related loans. New loans made and bonds issued since JFM’s operations began are accounted for in the general account of JFM, whereas operations to administer loans carried over from the Predecessor are accounted for in the management account. With regard to the management account, JFM issues government-guaranteed bonds solely for the purpose of refi nancing government-guaranteed bonds of the Predecessor.
Abolished (and its capital returned to
the national government)
Special governmental institution (wholly owned by the national government)
Established by capital contributions only from Japanese local
governments
Established on 1 June 1957
Established on 1 August 2008
Reorganized on 1 June 2009
Began operations on 1 October 2008
The lending scope was expanded to overall general account-related loans
Succeeded to assets and liabilities
Japan Finance Organization for
Municipal Enterprises
Japan Finance Corporation for Municipal Enterprises
(the “Predecessor”)
Japan Finance Organization for
Municipalities (JFM)
When JFM was founded, it succeeded to the Reserve for Losses on the Refi nancing of Bonds in the amount of approximately JPY 3.4 trillion (USD 28 billion) to ensure its future stable management. Of this amount, the JPY 2.2 trillion (USD 18 billion) needed to ensure the future continuity of JFM’s operations was to be transferred to the general account in equal installments over 10 years, with the remainder to be transferred to the management account to ensure a suffi cient fi nancial foundation to appropriately manage the Predecessor’s bonds and loans and prepare for the risk with refinancing bonds of the Predecessor.
Management Account
General Account
JPY 2.2 tn(USD 18 bn)
FY2008-2017JPY 220 bn (USD 1.8 bn)transferred each year
Management Account Reserve for Interest Rate Volatility
Reserve for Interest Rate Volatility
Japan Finance Organization for Municipalities (JFM)Predecessor
Ensure a �nancial foundation needed to sustain the businesses into the future
Ensure a �nancial foundation that can withstand the re�nancing risk posed by the government-guaranteed bonds, etc.
Reserve for Losses on the Re�nancing
of BondsJPY 3.4 tn
(USD 28 bn)
Management Structure
JFM Annual Report 2015 | 39

Manag
ement S
tructure
Management Structure
If any assets remain when the asset management operations of the Predecessor are completed and the management account is closed, those assets shall be returned to the national treasury. Even before the management account is closed, in the event that the businesses of JFM are determined to have been executed smoothly in light of the condition of the management of JFM, the Minister for Internal Affairs and Communications and the Minister of Finance shall, if the management account reserve for interest rate volatility and so on are determined to exceed the amount necessary for the smooth operation of the asset management operations of the Predecessor in the future, cause the amount that is determined to be in excess to belong to the national treasury (Article 14 of the Supplementary Provisions of the JFM Law). In accordance with this provision, the Ministers decided to transfer a portion of JFM’s reserve for interest rate volatility within the management account to the Japanese national government over the three-year period from fiscal 2015 to fiscal 2017, with the aim of transferring up to JPY 600 billion (USD 5.0 billion). Such portion becomes financial resources for Local Allocation Tax and is distributed to the local governments for regional revitalization. During fiscal 2012 and 2013, JFM transferred a total of JPY 1 trillion (USD 8.3 billion) to the national treasury.
General Account and Management Account
JFM Annual Report 2015 | 40
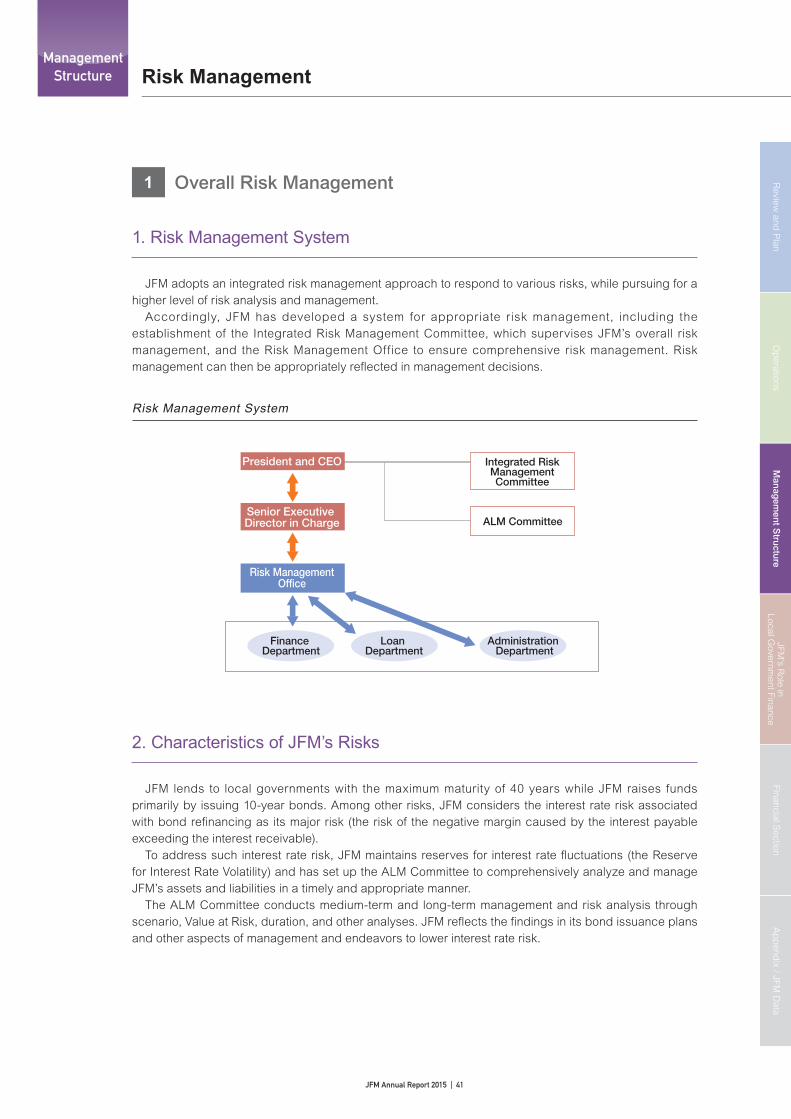
Review
and P
lanO
perations
Man
agemen
t Stru
cture
JFM’s R
ole in Local G
overnment Finance
Financial Section
Ap
pend
ix / JFM D
ata
1 Overall Risk Management
1. Risk Management System
JFM adopts an integrated risk management approach to respond to various risks, while pursuing for a higher level of risk analysis and management. Accordingly, JFM has developed a system for appropriate risk management, including the establishment of the Integrated Risk Management Committee, which supervises JFM’s overall risk management, and the Risk Management Office to ensure comprehensive risk management. Risk management can then be appropriately refl ected in management decisions.
Risk Management System
ALM Committee
President and CEO
Senior Executive Director in Charge
Finance Department
Loan Department
Administration Department
Integrated Risk Management Committee
Risk Management Of�ce
2. Characteristics of JFM’s Risks
JFM lends to local governments with the maximum maturity of 40 years while JFM raises funds primarily by issuing 10-year bonds. Among other risks, JFM considers the interest rate risk associated with bond refi nancing as its major risk (the risk of the negative margin caused by the interest payable exceeding the interest receivable). To address such interest rate risk, JFM maintains reserves for interest rate fl uctuations (the Reserve for Interest Rate Volatility) and has set up the ALM Committee to comprehensively analyze and manage JFM’s assets and liabilities in a timely and appropriate manner. The ALM Committee conducts medium-term and long-term management and risk analysis through scenario, Value at Risk, duration, and other analyses. JFM refl ects the fi ndings in its bond issuance plans and other aspects of management and endeavors to lower interest rate risk.
Risk ManagementManagement
Structure
JFM Annual Report 2015 | 41

Manag
ement S
tructure
Management Structure
2 Management of Specific Risks
1. Credit Risk
Credit risk is the risk of loss arising from deterioration in the financial condition of a borrower and other situations, which could cause an asset to lose value or become worthless. Loans and financial transactions involve credit risk.
1) Credit risk associated with loans
JFM lends exclusively to local governments. Local government bonds and loans have a zero risk weighting under the regulations of the Bank for International Settlements (as of 31 March 2015). For the reasons outlined below, JFM does not expect any default on loans made to local governments. In fact, JFM and its Predecessor have never experienced any loan losses.
2) Credit risk associated with market transactions
JFM is, however, exposed to the risk of loss arising from credit events, such as deterioration in the financial condition of a counterparty, which causes an asset to lose value or become worthless. JFM works to appropriately manage credit risk of this type by constantly monitoring counterparties’ financial standings and taking measures including suspension of new deals and cancellation of transactions with counterparties that have come to poor credit standings. Moreover, JFM limits counterparties to financial institutions that meet the credit rating and other criteria, and conducts transactions within the credit lines for each counterparty in order to diversify risks. In addition, JFM entered into the ISDA Master Agreement and the CSAs (Credit Support Annexes) with its derivatives counterparties to reduce the credit risk resulting from fluctuations in the value of derivative transactions.
2. Market Risk
Market risk is the risk of losses resulting from changes in the value of assets and liabilities due to fluctuations in risk factors such as interest rates, securities prices and foreign exchange rates, or the risk of loss resulting from changes in earnings generated from assets and liabilities. Market risk includes interest rate risk, foreign exchange risk, inflation risk and price fluctuation risk.
1) Interest rate risk
• Interest rate risk associated with bond refinancing
JFM is exposed to the interest rate risk resulting from a duration gap between lending and funding. To address such risk, JFM takes measures described on page 43.
• Interest rate risk associated with a gap in lending and funding schedules
JFM generally raises funds required to finance a loan by issuing bonds prior to the loan disbursements. Proceeds from bond issuances may not be earmarked for a particular loan. Thus, fluctuations in interest rates in the period where lending and funding schedules differ affect the profitability of loans (“pipeline” risk). In order to hedge against pipeline risk, JFM utilizes interest rate swaps.
Risk Management
JFM Annual Report 2015 | 42

Review
and P
lanO
perations
Man
agemen
t Stru
cture
JFM’s R
ole in Local G
overnment Finance
Financial Section
Ap
pend
ix / JFM D
ata
Managing interest rate risk associated with bond refi nancing
• JFM maintains reserves to prepare for interest rate risk associated with bond refi nancing. At the end of fi scal 2014, the total amount of the reserves stood at USD 29.5 billion, which consisted of USD 12.8 billion in the general account and USD 16.7 billion in the management account.
• As assets and liabilities in the general account are expected to expand as a result of an increase in loans and fund-raising, JFM carries out an ALM analysis of this account in order to further enhance the effectiveness of its interest rate risk management. Furthermore, JFM has established a medium-term management target of fi ve years from fi scal 2013, in which the duration gap is maintained below two years. In order to implement the management target, JFM takes the following measures:
(1) Controlling lending duration – Lending rates for loans for temporary f inancial countermeasures funding, which account for approximately 40% of JFM’s outstanding loans in the general account, are revised every 5 years or 10 years depending on loans, while maturities of the loans are set to be a maximum of 30 years.
(2) Extending funding duration – Utilizing its FLIP and Open Issuance scheme, JFM aims to extend the funding duration by carefully choosing maturities of bonds to be issued e.g., continuously issuing long-dated bonds with maturities over 10 years.
• At the end of fi scal 2014, the duration gap in the general account was 1.15 years, staying within the management target.
• Although JFM resolves to extend its maximum loan maturity from 30 years to 40 years will increase the duration gap, JFM’s stable operations are secured by suffi cient amount of the reserves. In addition, JFM will revise its lending rate by 30th year at the latest for its loans with maturities longer than 30 years.
• In the management account, which manages assets transferred from the Predecessor, JFM maintains USD 16.7 billion of the management account reserve for interest rate volatility as described above. As no new lending from the management account has been made since October 2008, JFM expects that the interest rate risk in the management account will decline overall as the size of the account declines over time.
• Pursuant to Article 14 of the Supplementary Provisions of the JFM Law, a portion of JFM’s management account reserve for interest rate volatility was set to be transferred to the national government over the three-year period from fi scal 2015 to fi scal 2017, with the aim of transferring up to JPY 600 billion. The amount of transfer is to be within the amount which the Minister for Internal Affairs and Communications and the Minister of Finance deem as an amount exceeding the requisite amount of reserve necessary for the smooth operation of JFM’s management account at the time of transfer and in the future, in light of JFM’s fi nancial condition. In fi scal 2015, JFM plans to transfer JPY 300 billion (USD 2.5 billion) to the national treasury. Even after these transfers, JFM does not expect the transfers to have a material effect on JFM’s business, results of operations or fi nancial condition, due primarily to suffi cient amount of the reserve for this account.
JFM Annual Report 2015 | 43

Manag
ement S
tructure
Management Structure
2) Foreign exchange and other risks
Various risks associated with bond principal and interest payments are generally hedged by swap transactions. These risks include foreign exchange risk related to foreign currency denominated bonds, interest rate risk related to floating rate bonds and the risk of fluctuations in the amounts of principal and interest of inflation-indexed bonds. JFM’s investments of surplus funds are exposed to the risk of losses on the sale of securities resulting from price declines and the risk of realized losses on foreign currency denominated deposits resulting from fluctuations in foreign exchange rates. Accordingly, in principle, JFM reduces the price fluctuation risk by holding investments until maturity and hedges foreign exchange risk by using forward foreign exchange contracts.
Risk Management
12,000
10,000
8,000
6,000
4,000
2,000
0
-2,000
-4,000
-6,000
-8,000
-10,000
-12,000
20,000
15,000
10,000
5,000
0
-5,000
-10,000
-15,000
-20,000
• Lending duration 8.98 years • Funding duration 7.83 years • Duration gap 1.15 years (YoY change: +0.08 years)
General Account
Management Account
Maturity Ladder (JFM Loans, Bonds and Bank Loans)
US
D m
mU
SD
mm
(as of 31 March 2015)
(as of 31 March 2015)
• Lending duration 6.33 years • Funding duration 4.46 years • Duration gap 1.87 years (YoY change: -0.18 years)
JFM as a whole• Lending duration 7.53 years • Funding duration 5.92 years • Duration gap 1.61 years (YoY change: -0.14 years)
Interest Receipt (Lending)
Principal Redemption (Lending)
Principal Redemption (Funding)
Interest Payment (Funding)
Gap
Interest Receipt (Lending)
Principal Redemption (Lending)
Principal Redemption (Funding)
Interest Payment (Funding)Gap
15 42 4316 17 18 19 20 21 22 23 24 25 26 27 28 29 30 31 32 33 34 35 36 37 38 39 40 41FY20
15 42 43
44
4416 17 18 19 20 21 22 23 24 25 26 27 28 29 30 31 32 33 34 35 36 37 38 39 40 41FY20
JFM Annual Report 2015 | 44

Review
and P
lanO
perations
Man
agemen
t Stru
cture
JFM’s R
ole in Local G
overnment Finance
Financial Section
Ap
pend
ix / JFM D
ata
3. Liquidity Risk
Liquidity risk is the risk that JFM would incur losses because of diffi culty in funding, or because of funding at far higher interest rates than under ordinary conditions. It also includes the risk that JFM would incur losses because of the inability to conduct market transactions or because of transactions at prices far more unfavorable than under normal conditions due to market disruption or other situations. However, JFM’s current exposure to liquidity risk is low because loans are made based on a pre-set schedule, and the daily cash and liquidity management is carried out. Moreover, JFM has entered into overdraft agreements with a wide range of fi nancial institutions to prepare for unexpected fund shortfalls, and invests surplus funds only in short-term fi nancial products. In addition, although JFM is not required to comply with the liquidity coverage ratio requirements of Basel III, as a coluntary measure, JFM has implemented a policy to maintain a certain amount of liquid assets so that, in the event of market disruption, JFM may continue to timely make its payments of interest and principal on the bonds and other dent securities.
4. Operational Risk
Operational risk is the risk of loss resulting from inadequate operation processes, inadequate activities by management and staff, and inadequate computer systems, or from external events.
1) Administrative risk
Administrative risk is the risk of loss resulting from the neglect or inadequacy of attention by management and employees to properly conduct administrative work, accidents and/or violation of laws caused by them in the course of the administrative work process. JFM endeavors to mitigate its exposure to administrative risk by preparing operational manuals, holding educational seminars and training sessions, and reducing operational workload through systematization.
2) Systems risk
Systems risk is the risk of the confidentiality, integrity and availability of information assets being impaired as a result of computer system inadequacies or the fraudulent use of computer systems. JFM has established and implemented the Systems Risk Management Policy and the Systems Risk Management Standard to appropriately manage systems risk and ensure smooth business operations.
5. Contingency Measures
JFM has prepared the Contingency Plan to minimize the scope of losses and the impact on operations and restore normal operations promptly and effi ciently in the event that computer systems break down or cannot be used due to unexpected incidents, disasters or malfunctions. Furthermore, in order to prepare for a contingency, JFM has a backup server outside JFM so that its business operations can be continued.
JFM Annual Report 2015 | 45
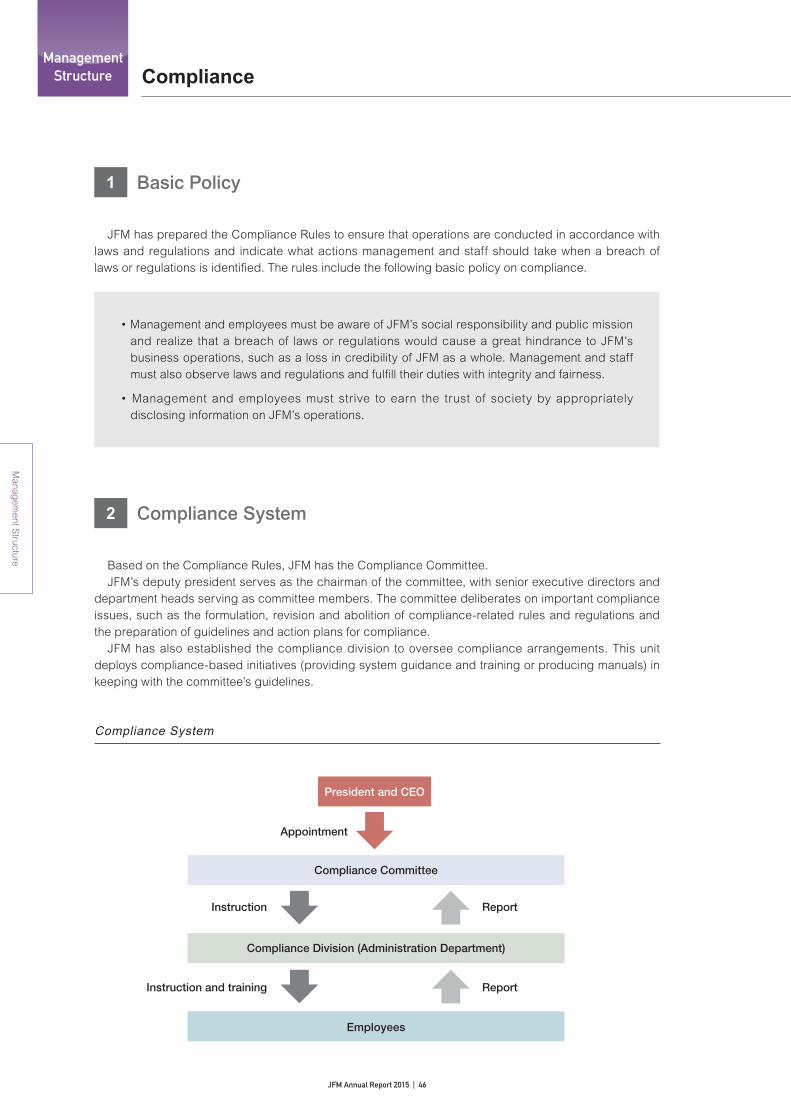
Manag
ement S
tructure
Management Structure
1 Basic Policy
JFM has prepared the Compliance Rules to ensure that operations are conducted in accordance with laws and regulations and indicate what actions management and staff should take when a breach of laws or regulations is identified. The rules include the following basic policy on compliance.
• Management and employees must be aware of JFM’s social responsibility and public mission and realize that a breach of laws or regulations would cause a great hindrance to JFM’s business operations, such as a loss in credibility of JFM as a whole. Management and staff must also observe laws and regulations and fulfill their duties with integrity and fairness.
• Management and employees must strive to earn the trust of society by appropriately disclosing information on JFM’s operations.
2 Compliance System
Based on the Compliance Rules, JFM has the Compliance Committee. JFM’s deputy president serves as the chairman of the committee, with senior executive directors and department heads serving as committee members. The committee deliberates on important compliance issues, such as the formulation, revision and abolition of compliance-related rules and regulations and the preparation of guidelines and action plans for compliance. JFM has also established the compliance division to oversee compliance arrangements. This unit deploys compliance-based initiatives (providing system guidance and training or producing manuals) in keeping with the committee’s guidelines.
Compliance
Compliance System
President and CEO
Compliance Committee
Compliance Division (Administration Department)
Employees
Appointment
Report
Report
Instruction
Instruction and training
JFM Annual Report 2015 | 46
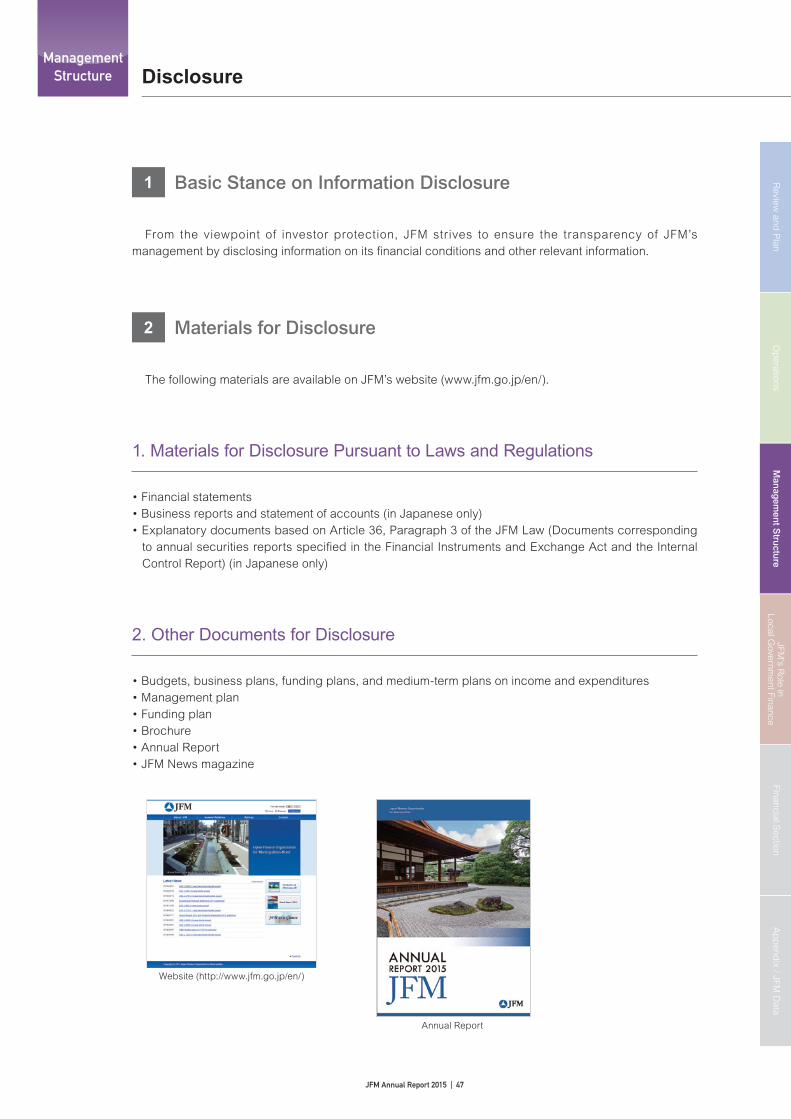
Review
and P
lanO
perations
Man
agemen
t Stru
cture
JFM’s R
ole in Local G
overnment Finance
Financial Section
Ap
pend
ix / JFM D
ata
1 Basic Stance on Information Disclosure
From the viewpoint of investor protection, JFM strives to ensure the transparency of JFM’s management by disclosing information on its fi nancial conditions and other relevant information.
2 Materials for Disclosure
The following materials are available on JFM’s website (www.jfm.go.jp/en/).
1. Materials for Disclosure Pursuant to Laws and Regulations
• Financial statements• Business reports and statement of accounts (in Japanese only)• Explanatory documents based on Article 36, Paragraph 3 of the JFM Law (Documents corresponding
to annual securities reports specifi ed in the Financial Instruments and Exchange Act and the Internal Control Report) (in Japanese only)
2. Other Documents for Disclosure
• Budgets, business plans, funding plans, and medium-term plans on income and expenditures• Management plan• Funding plan• Brochure• Annual Report• JFM News magazine
Website (http://www.jfm.go.jp/en/)
Annual Report
DisclosureManagement
Structure
JFM Annual Report 2015 | 47

JFM’s R
ole in Local G
overnment Finance
1 Japanese Local Government System
Local governments are responsible for extensive areas of public administration for the welfare of citizens. While the national government focuses on administrative affairs for the state as a member of the international community, local governments engage in administration that relates to the daily lives of citizens. Local governments are responsible for social welfare, education, fi re defense, and infrastructure such as road and waterways. Japanese local government system adopts a two-tier system with prefectures serving broader geographic areas, and cities, special wards of Tokyo, as well as government-designated cities, towns and villages providing local services.
(as of 1 April 2015)
Prefectures 47
Cities, special wards, etc. 1,741
Government-designated cities 20
Cities 770
Special wards 23
Towns 745
Villages 183
Total 1,788
Local Government
National Government
Prefectures
Cities, Towns, Villages,and Special Wards
Number of Japanese Local Governments
JFM’s Role in Local Government Finance
JFM Annual Report 2015 | 48

Review
and P
lanO
perations
Manag
ement S
tructureJF
M’s R
ole in
L
ocal G
overnm
ent F
inan
ceFinancial S
ectionA
pp
endix / JFM
Data
2 Local Government Finance Program
Each local government is unique in terms of its natural and historic situations, industrial structures, population sizes, and other attributes. As a result, each local government handles diverse administration. The term “local government fi nance” collectively refers to funding for individual local governments engaging in such administration. Just as with national fi nance, local government fi nance plays a major role in the nation’s economy and the lives of citizens. In fi scal 2015, local government finance will total JPY 87.8 trillion (USD 729.1 billion) (based on the Local Government Finance Program (the “LGFP”), while the nation’s General Account Budget for the year is JPY 96.3 trillion (USD 800.4 billion)). Because local governments engage in numerous activities that closely relate to residents, they need to provide stable public services regardless of regional dif ferences stemming from varying populations, industry densities, and/or tax revenue fl uctuations over years. Accordingly, the national government formulates the LGFP each fiscal year based on assessments of the scales of local government fi nance and forecasts of overall revenues and expenditures. In response to annual national budget plans, the national government balances the total amount of local government revenues and expenditures in the LGFP. Under this program, revenue sources for all local governments, including local allocation tax grants as well as bonds and loans to be issued or borrowed, are secured so that local governments can ensure uniform public service standards.
Local Government Finance Program (Initial Plan for FY2015)
Annual Expenditure(USD 729.1 bn)
Annual Revenue(USD 729.1 bn)
Local TaxUSD 334.4 bn
OthersUSD 169.5 bn
Local Government Bonds and Loans
USD 81.2 bn
Local Allocation TaxUSD 144.1 bn
- Social welfare- Education- Fire defense- Infrastructure, etc.
Note: The above program includes Great East Japan Earthquake related budgets.
JFM Annual Report 2015 | 49
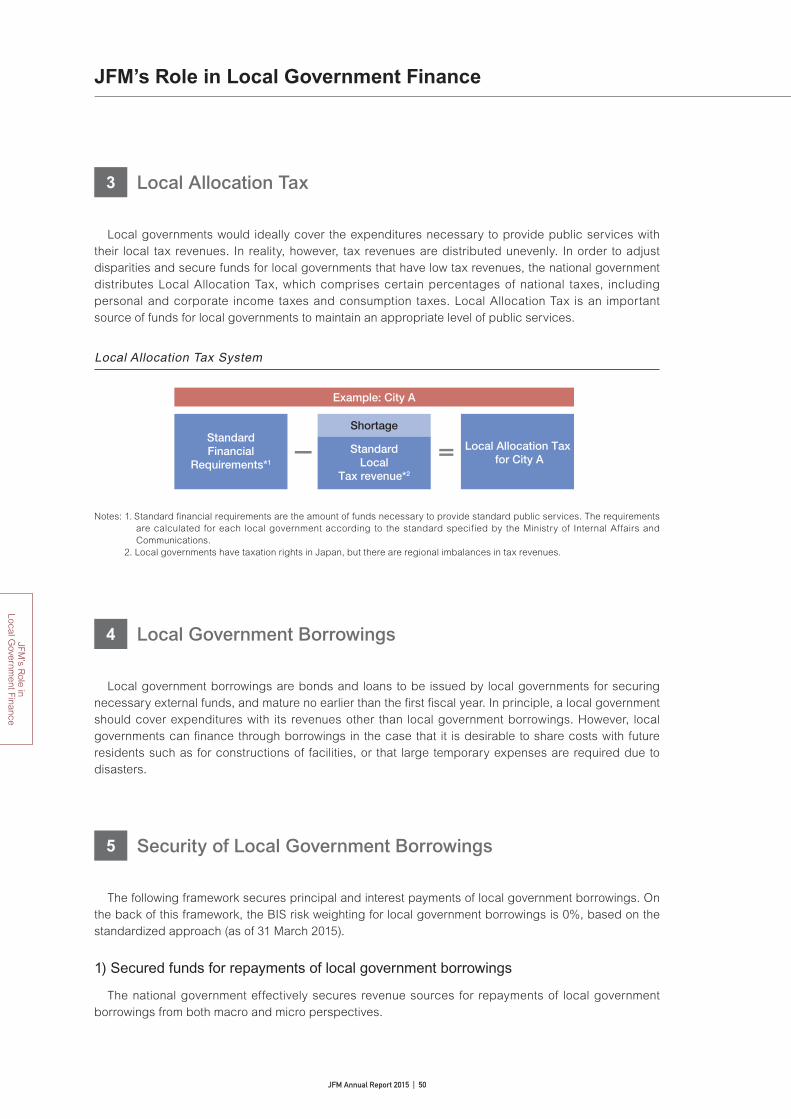
JFM’s R
ole in Local G
overnment Finance
3 Local Allocation Tax
Local governments would ideally cover the expenditures necessary to provide public services with their local tax revenues. In reality, however, tax revenues are distributed unevenly. In order to adjust disparities and secure funds for local governments that have low tax revenues, the national government distributes Local Allocation Tax, which comprises certain percentages of national taxes, including personal and corporate income taxes and consumption taxes. Local Allocation Tax is an important source of funds for local governments to maintain an appropriate level of public services.
Local Allocation Tax System
Example: City A
StandardFinancial
Requirements*1— =
Shortage
StandardLocal
Tax revenue*2
Local Allocation Tax for City A
Notes: 1. Standard financial requirements are the amount of funds necessary to provide standard public services. The requirements are calculated for each local government according to the standard specified by the Ministry of Internal Affairs and Communications.
2. Local governments have taxation rights in Japan, but there are regional imbalances in tax revenues.
4 Local Government Borrowings
Local government borrowings are bonds and loans to be issued by local governments for securing necessary external funds, and mature no earlier than the first fiscal year. In principle, a local government should cover expenditures with its revenues other than local government borrowings. However, local governments can finance through borrowings in the case that it is desirable to share costs with future residents such as for constructions of facilities, or that large temporary expenses are required due to disasters.
5 Security of Local Government Borrowings
The following framework secures principal and interest payments of local government borrowings. On the back of this framework, the BIS risk weighting for local government borrowings is 0%, based on the standardized approach (as of 31 March 2015).
1) Secured funds for repayments of local government borrowings
The national government effectively secures revenue sources for repayments of local government borrowings from both macro and micro perspectives.
JFM’s Role in Local Government Finance
JFM Annual Report 2015 | 50

Review
and P
lanO
perations
Manag
ement S
tructureJF
M’s R
ole in
L
ocal G
overnm
ent F
inan
ceFinancial S
ectionA
pp
endix / JFM
Data
(i) Local tax revenues are secured by taxation rights of local governments(ii) The national government includes repayments of local government borrowings (i.e., principal and
interest payments) in the amount of expenditures in the LGFP(iii) The total amount of Local Allocation Tax grants is set aside so that the total amount of local
government expenditures, including the principal and interest payments, is equivalent to the total amount of local government revenues in the LGFP
(iv) In the calculation of Local Allocation Tax grants to be allocated to an individual local government, a portion of the principal and interest payments are included in the Standard Financial Requirements of an individual local government
Note: In (ii), (iii) and (iv) above, only the local government borrowings to which the consent or approval has been given are covered.
2) Issuance restriction
Local governments with a real debt payment ratio 18% or higher, or those with a real deficit ratio exceeding specified levels, are restricted from additional borrowings under the Local Government Finance Law.
3) Supervision of fi nancial soundness
The Law Relating to the Financial Soundness of Local Governments of Japan, which was promulgated in June 2007, requires local governments the following measures in order to securely manage their fi scal soundness:
(i) Specifi ed fi scal indicators to be disclosed(ii) Local governments with those fi scal indicators exceeding certain early warning limits to restore
fi scal soundness through their own efforts(iii) Local governments with those fiscal indicators exceeding certain reconstruction limits to take
necessary actions under the supervision of the national government or the respective prefectural governments, in order to restore their fi scal soundness
6 Local Government Borrowing Program
The LGBP is an annual plan that the national government prepares for local government funding. The LGBP is closely linked to the LGFP and the FILP* prepared by the national government with its budget-making. The LGBP plays the following crucial roles in terms of local government fi nance.
*See page 33.
1) Consent (approval) based on LGBP
The LGBP specifi es the total scheduled amount of local government borrowings including the amount by business type. Typically, the consent or approval for local government borrowings is given based on the LGBP.
2) Secured funding sources for local government borrowings
The national government balances the amount of local government funding needs and the amount of funding sources, and specifi es funding sources for each business under the LGBP.
JFM Annual Report 2015 | 51

JFM’s R
ole in Local G
overnment Finance
JFM’s Role in Local Government Finance
7 JFM Funds in Local Government Borrowing Program
The sources for local government funding are classified into national government funds, JFM funds and private funds.
Local Government Borrowing Program
FY2014 FY2015Share
1. Private FundsPublicly Offered Bonds USD 35 bn USD 33 bn 33%
Other Private Sectors USD 27 bn USD 25 bn 24%
2. Public FundsJFM USD 17 bn USD 16 bn 16%
National Government USD 29 bn USD 27 bn 27%
Total USD 108 bn USD 101 bn 100%
Note: The figures above are the planned numbers originally published by the Ministry of Internal Affairs and Communications and not the actual numbers.
Since fiscal 2012, JFM funds have accounted for around 16% of the LGBP. JFM plays a major role in Japanese local government finance, making a substantial contribution to project implementation and financial management of local governments.
0
20
40
60
80
100
120
140
160
180
0
2
4
6
8
10
12
14
16
18
FY2011 2012 2013 2014 2015
(USD bn)
LGBP Volume by Funding Source (Initial Plan)
(%)
Publicly Offered BondsOther Private SectorsJFMNational GovernmentJFM Ratio
114 117 114108
101
32.5
34.9
15.7
31.0
29.3
36.9
18.1
32.3
28.2
36.9
18.0
30.6
26.7
35.4
17.0
28.7
24.6
33.2
16.4
27.2
16.1
13.8 15.5
15.9 15.8
Source: The Ministry of Internal Affairs and Communications
JFM Annual Report 2015 | 52
Review
and P
lanO
perations
Manag
ement S
tructureJFM
’s Role in
Local Governm
ent FinanceF
inan
cial Sectio
nA
pp
endix / JFM
Data
Financial Statements 54Balance Sheets 54Statements of Income 55Statements of Appropriation of Profi t
[General account/Management account] 56Statements of Changes in Net Assets 58Statements of Cash Flows 60Notes to Financial Statements 61
Independent Auditor’s Report 94
Financial Section
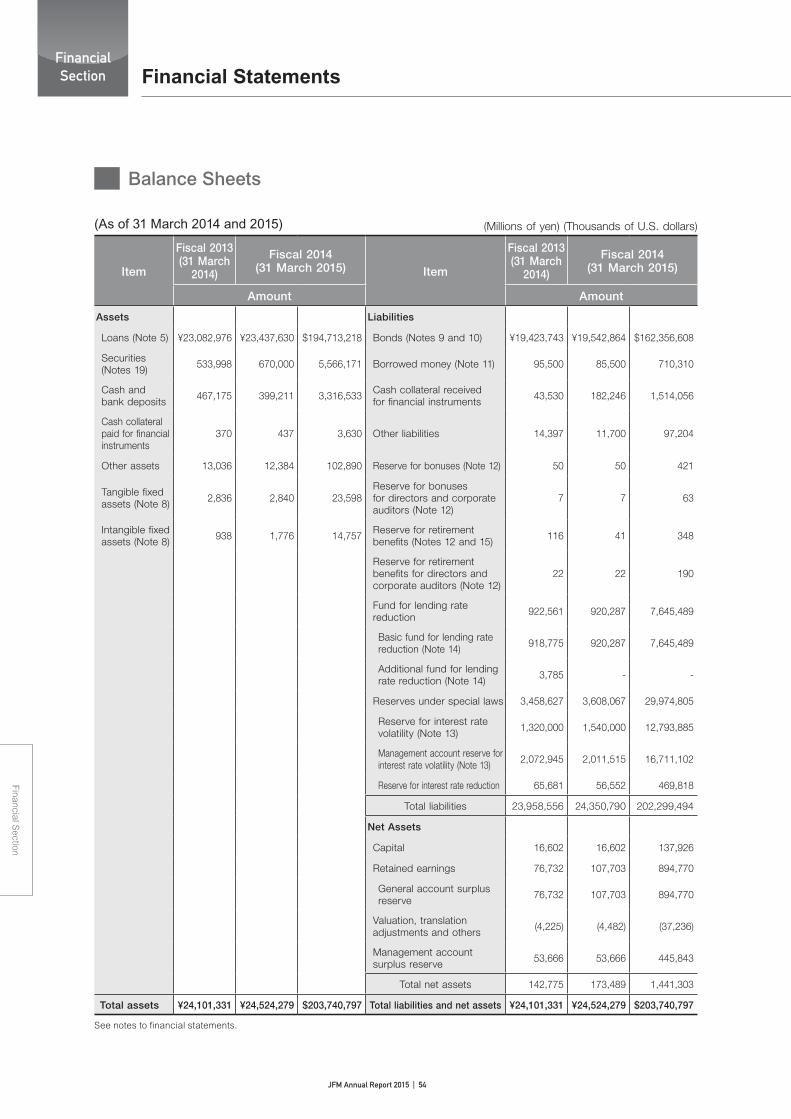
JFM Annual Report 2015 | 54
Financial Section
FinancialSection
(As of 31 March 2014 and 2015) (Millions of yen) (Thousands of U.S. dollars)
Item
Fiscal 2013(31 March
2014)
Fiscal 2014(31 March 2015) Item
Fiscal 2013(31 March
2014)
Fiscal 2014(31 March 2015)
Amount Amount
Assets Liabilities
Loans (Note 5) ¥23,082,976 ¥23,437,630 $194,713,218 Bonds (Notes 9 and 10) ¥19,423,743 ¥19,542,864 $162,356,608
Securities (Notes 19) 533,998 670,000 5,566,171 Borrowed money (Note 11) 95,500 85,500 710,310
Cash and bank deposits 467,175 399,211 3,316,533 Cash collateral received
for financial instruments 43,530 182,246 1,514,056
Cash collateral paid for financial instruments
370 437 3,630 Other liabilities 14,397 11,700 97,204
Other assets 13,036 12,384 102,890 Reserve for bonuses (Note 12) 50 50 421
Tangible fixed assets (Note 8) 2,836 2,840 23,598
Reserve for bonusesfor directors and corporate auditors (Note 12)
7 7 63
Intangible fixed assets (Note 8) 938 1,776 14,757 Reserve for retirement
benefits (Notes 12 and 15) 116 41 348
Reserve for retirement benefits for directors and corporate auditors (Note 12)
22 22 190
Fund for lending rate reduction 922,561 920,287 7,645,489
Basic fund for lending rate reduction (Note 14) 918,775 920,287 7,645,489
Additional fund for lending rate reduction (Note 14) 3,785 - -
Reserves under special laws 3,458,627 3,608,067 29,974,805
Reserve for interest rate volatility (Note 13) 1,320,000 1,540,000 12,793,885
Management account reserve for interest rate volatility (Note 13) 2,072,945 2,011,515 16,711,102
Reserve for interest rate reduction 65,681 56,552 469,818
Total liabilities 23,958,556 24,350,790 202,299,494
Net Assets
Capital 16,602 16,602 137,926
Retained earnings 76,732 107,703 894,770
General account surplus reserve 76,732 107,703 894,770
Valuation, translation adjustments and others (4,225) (4,482) (37,236)
Management account surplus reserve 53,666 53,666 445,843
Total net assets 142,775 173,489 1,441,303
Total assets ¥24,101,331 ¥24,524,279 $203,740,797 Total liabilities and net assets ¥24,101,331 ¥24,524,279 $203,740,797
See notes to financial statements.
Financial Statements
Balance Sheets

JFM Annual Report 2015 | 55
Review
and P
lanO
perations
Manag
ement S
tructureJFM
’s Role in
Local Governm
ent FinanceF
inan
cial Sectio
nA
pp
endix / JFM
Data
(For the years ended 31 March 2014 and 2015)
Item
Fiscal 2013(1 April 2013 to 31 March 2014)
Fiscal 2014(1 April 2014 to 31 March 2015)
Amount Amount
Income ¥458,388 ¥434,569 $3,610,284
Interest income 455,158 428,977 3,563,822
Fees and commissions 117 112 936
Other operating income 0 0 3
Other income 3,112 5,479 45,523
Contributions from fund for lending rate reduction (Note 14)
3,084 5,467 45,426
Others 28 11 97
Expenses 270,337 254,070 2,110,745
Interest expenses 260,947 246,060 2,044,199
Fees and commissions 281 294 2,446
Other operating expenses 6,509 4,632 38,483
General and administrative expenses 2,598 3,083 25,617
Other expenses 0 - -
Ordinary income 188,051 180,499 1,499,539
Special gains 880,203 229,129 1,903,547
Reversal of management account reserve for interest rate volatility (Notes 6 and 13)
870,000 220,000 1,827,698
Reversal of reserve for interest rate reduction 10,203 9,129 75,849
Special losses 1,041,744 378,658 3,145,787
Loss on disposal of fi xed assets - 88 732
Provision for reserve for interest rate volatility (Note 13) 220,000 220,000 1,827,698
Provision for management account reserve for interest rate volatility (Note 13)
171,744 158,570 1,317,357
Payment to national treasury (Note 6) 650,000 - -
Net income ¥26,510 ¥30,971 $257,299
See notes to fi nancial statements.
(Millions of yen) (Thousands of U.S. dollars)
Statements of Income

JFM Annual Report 2015 | 56
Financial Section
FinancialSection
(For the year ended 31 March 2014)
1 Profit available for appropriation ¥26,510
Net income ¥26,510
Accumulated deficit brought forward -
2 Profit appropriated
Surplus reserve 26,510 26,510
(Millions of yen)
(For the year ended 31 March 2015)
1 Profit available for appropriation ¥30,971
Net income ¥30,971
Accumulated deficit brought forward -
2 Profit appropriated
Surplus reserve 30,971 30,971
(Millions of yen)
Notes: 1. Profit was appropriated at the end of the fiscal year in accordance with the provisions of Article 39, Section 1 of the Japan Finance Organization for Municipalities Law (Law No. 64, 2007; hereinafter the “Law”).
2. Surplus reserve appropriated was posted as general account surplus reserve on the balance sheets.
1 Profit available for appropriation $257,299
Net income $257,299
Accumulated deficit brought forward -
2 Profit appropriated
Surplus reserve 257,299 257,299
(Thousands of U.S. dollars)
See notes to financial statements.
Financial Statements
Statements of Appropriation of Profit [General account]
Statements of Appropriation of Profit [General account]

JFM Annual Report 2015 | 57
Review
and P
lanO
perations
Manag
ement S
tructureJFM
’s Role in
Local Governm
ent FinanceF
inan
cial Sectio
nA
pp
endix / JFM
Data
(For the year ended 31 March 2014)
1 Profi t available for appropriation ¥-
Net income ¥-
Accumulated defi cit brought forward -
2 Profi t appropriated
Surplus reserve - -
(Millions of yen)
(For the year ended 31 March 2015)
1 Profi t available for appropriation ¥-
Net income ¥-
Accumulated defi cit brought forward -
2 Profi t appropriated
Surplus reserve - -
(Millions of yen)
1 Profi t available for appropriation $-
Net income $-
Accumulated defi cit brought forward -
2 Profi t appropriated
Surplus reserve - -
(Thousands of U.S. dollars)
See notes to fi nancial statements.
Statements of Appropriation of Profit [Management account]
Statements of Appropriation of Profit [Management account]

JFM Annual Report 2015 | 58
Financial Section
FinancialSection
(For the year ended 31 March 2014) (Millions of yen)
Stockholders’ equity
Valuation, translation
adjustments and others Management
account surplusreserve
Total net
assetsCapital
Retained earningsTotal
stockholders’equity
Unrealized gain/
(loss) from hedging
instruments
General accountsurplus reserve
Total retainedearnings
Balance as of 1 April 2013 ¥16,602 ¥50,221 ¥50,221 ¥66,824 ¥(6,970) ¥53,666 ¥113,520
Changes during accounting period
Net income - 26,510 26,510 26,510 - - 26,510
Net changes during accounting period in items other than stockholders’ equity
- - - - 2,744 - 2,744
Net changes during accounting period - 26,510 26,510 26,510 2,744 - 29,255
Balance as of 31 March 2014 ¥16,602 ¥76,732 ¥76,732 ¥93,334 ¥(4,225) ¥53,666 ¥142,775
Financial Statements
Statements of Changes in Net Assets

JFM Annual Report 2015 | 59
Review
and P
lanO
perations
Manag
ement S
tructureJFM
’s Role in
Local Governm
ent FinanceF
inan
cial Sectio
nA
pp
endix / JFM
Data
(For the year ended 31 March 2015) (Millions of yen)
Stockholders’ equity
Valuation, translation
adjustments and others Management
account surplusreserve
Total net
assetsCapital
Retained earningsTotal
stockholders’equity
Unrealized gain/
(loss) from hedging
instruments
General accountsurplus reserve
Total retainedearnings
Balance as of 1 April 2014 ¥16,602 ¥76,732 ¥76,732 ¥93,334 ¥(4,225) ¥53,666 ¥142,775
Changes during accounting period
Net income - 30,971 30,971 30,971 - - 30,971
Net changes during accounting period in items other than stockholders’ equity
- - - - (256) - (256)
Net changes during accounting period - 30,971 30,971 30,971 (256) - 30,714
Balance as of 31 March 2015 ¥16,602 ¥107,703 ¥107,703 ¥124,305 ¥(4,482) ¥53,666 ¥173,489
(For the year ended 31 March 2015) (Thousands of U.S. dollars)
Stockholders’ equity
Valuation, translation
adjustments and others Management
account surplusreserve
Total net
assetsCapital
Retained earningsTotal
stockholders’equity
Unrealized gain/
(loss) from hedging
instruments
General accountsurplus reserve
Total retainedearnings
Balance as of 1 April 2014 $137,926 $637,471 $637,471 $775,397 $(35,103) $445,843 $1,186,137
Changes during accounting period
Net income - 257,299 257,299 257,299 - - 257,299
Net changes during accounting period in items other than stockholders’ equity
- - - - (2,133) - (2,133)
Net changes during accounting period - 257,299 257,299 257,299 (2,133) - 255,166
Balance as of 31 March 2015 $137,926 $894,770 $894,770 $1,032,696 $(37,236) $445,843 $1,441,303
See notes to fi nancial statements.
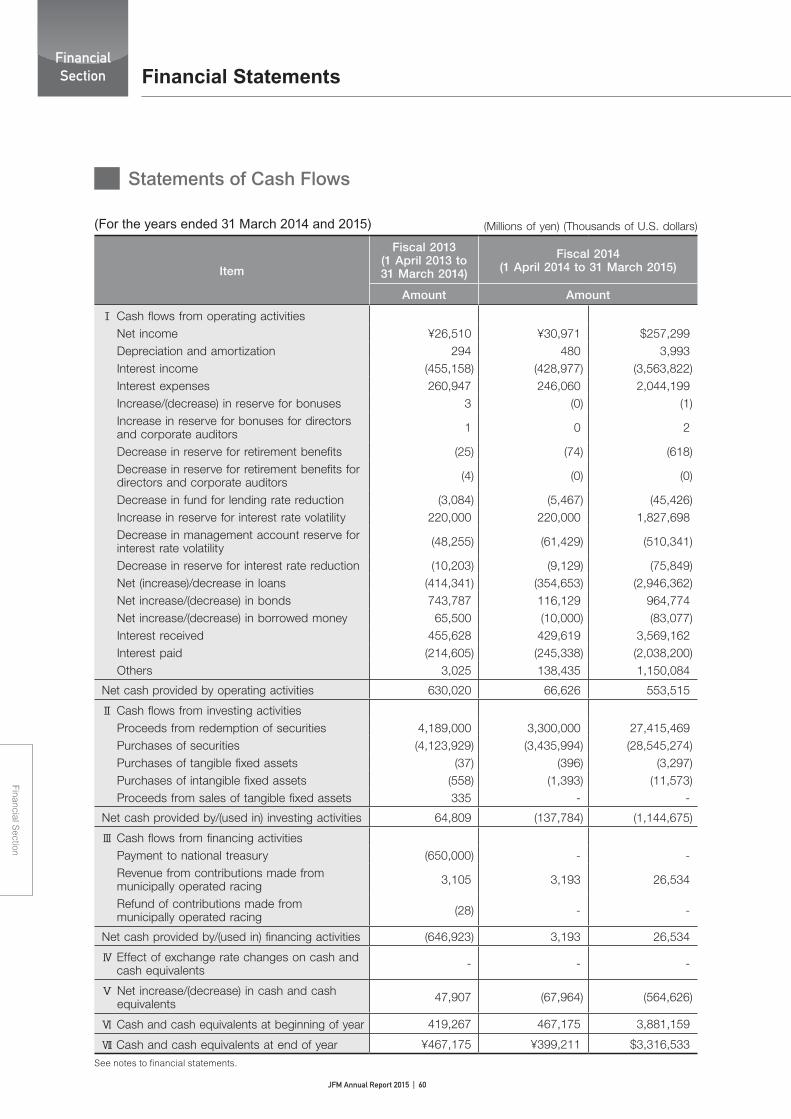
JFM Annual Report 2015 | 60
Financial Section
FinancialSection
Item
Fiscal 2013(1 April 2013 to 31 March 2014)
Fiscal 2014(1 April 2014 to 31 March 2015)
Amount Amount
Ⅰ Cash flows from operating activitiesNet income ¥26,510 ¥30,971 $257,299Depreciation and amortization 294 480 3,993 Interest income (455,158) (428,977) (3,563,822)Interest expenses 260,947 246,060 2,044,199 Increase/(decrease) in reserve for bonuses 3 (0) (1)Increase in reserve for bonuses for directors and corporate auditors 1 0 2
Decrease in reserve for retirement benefits (25) (74) (618)Decrease in reserve for retirement benefits for directors and corporate auditors (4) (0) (0)
Decrease in fund for lending rate reduction (3,084) (5,467) (45,426)Increase in reserve for interest rate volatility 220,000 220,000 1,827,698 Decrease in management account reserve for interest rate volatility (48,255) (61,429) (510,341)
Decrease in reserve for interest rate reduction (10,203) (9,129) (75,849)Net (increase)/decrease in loans (414,341) (354,653) (2,946,362)Net increase/(decrease) in bonds 743,787 116,129 964,774Net increase/(decrease) in borrowed money 65,500 (10,000) (83,077)Interest received 455,628 429,619 3,569,162Interest paid (214,605) (245,338) (2,038,200)Others 3,025 138,435 1,150,084
Net cash provided by operating activities 630,020 66,626 553,515
Ⅱ Cash flows from investing activitiesProceeds from redemption of securities 4,189,000 3,300,000 27,415,469 Purchases of securities (4,123,929) (3,435,994) (28,545,274)Purchases of tangible fixed assets (37) (396) (3,297)Purchases of intangible fixed assets (558) (1,393) (11,573)Proceeds from sales of tangible fixed assets 335 - -
Net cash provided by/(used in) investing activities 64,809 (137,784) (1,144,675)
Ⅲ Cash flows from financing activitiesPayment to national treasury (650,000) - -Revenue from contributions made from municipally operated racing 3,105 3,193 26,534
Refund of contributions made from municipally operated racing (28) - -
Net cash provided by/(used in) financing activities (646,923) 3,193 26,534
Ⅳ Effect of exchange rate changes on cash and cash equivalents - - -
Ⅴ Net increase/(decrease) in cash and cash equivalents 47,907 (67,964) (564,626)
Ⅵ Cash and cash equivalents at beginning of year 419,267 467,175 3,881,159
Ⅶ Cash and cash equivalents at end of year ¥467,175 ¥399,211 $3,316,533
See notes to financial statements.
(For the years ended 31 March 2014 and 2015) (Millions of yen) (Thousands of U.S. dollars)
Financial Statements
Statements of Cash Flows

JFM Annual Report 2015 | 61
Review
and P
lanO
perations
Manag
ement S
tructureJFM
’s Role in
Local Governm
ent FinanceF
inan
cial Sectio
nA
pp
endix / JFM
Data
1. Basis of PresentationJapan Finance Organization for Municipalities (hereinafter, “JFM”) has prepared financial statements in accordance with the Japan Finance Organization for Municipalities Law (Law No. 64, 2007; hereinafter the “Law”), the ordinances based on the Law and other regulations applicable to JFM and accounting principles generally accepted in Japan, which are different in certain respects as to the application and disclosure requirements of International Financial Reporting Standards. Since JFM does not have any subsidiaries or affi liates, it does not prepare consolidated fi nancial statements. Amounts less than 1 million yen have been omitted. As a result, the totals in Japanese yen shown in the fi nancial statements do not necessarily agree with the sum of the individual amounts. The translation of the Japanese yen amounts into U.S. dollars is included solely for the convenience of readers outside Japan, using the prevailing exchange rate as of 31 March 2015, the final day of the fiscal year, which was ¥120.37 to U.S. $1. This translation should not be construed as a representation that all amounts shown could be converted into U.S. dollars at such rate.
2. Summary of Signifi cant Accounting Policies(1) Securities
Held-to-maturity securities are carried at amortized cost (straight-line method).(2) Derivative transactions
Derivative transactions are carried at fair value with changes in unrealized gain or loss charged or credited to income, except for those which meet the criteria for hedge accounting.
(3) Depreciation and amortization (a) Tangible fi xed assets
Depreciation of tangible fixed assets is calculated by the straight-line method based on the estimated useful lives and the residual value determined by management. The estimated useful lives of major items are as follows: Buildings: 20 to 47 years Others: 2 to 19 years
(b) Intangible fi xed assetsAmortization of intangible fi xed assets is calculated by the straight-line method based on the estimated useful lives and the residual value determined by management. Software for internal use owned by JFM is amortized over 5 years.
(4) Deferred assetsBond issuance costs are expensed in full when incurred.
(5) Translation of assets and liabilities denominated in foreign currencies into Japanese yenMonetary assets and liabilities denominated in foreign currencies, for which foreign currency swaps or foreign exchange forward contracts are used to hedge the foreign currency fluctuation, are translated at the contracted rate as these swap contracts or the forward contracts qualify for deferral hedge accounting.
(6) Reserves(a) Reserve for possible loan losses
JFM has never experienced any loan losses. Accordingly, no reserve for possible loan losses has been maintained.
(b) Reserve for bonusesThe reserve for bonuses is provided for payment of bonuses to employees, in the amount of estimated bonuses, which are attributable to the fi scal year.
(c) Reserve for bonuses for directors and corporate auditorsThe reserve for bonuses for directors and corporate auditors is provided for payment of bonuses to directors and corporate auditors, in the amount of estimated bonuses, which are attributable to the fi scal year.
(d) Reserve for retirement benefi tsThe reserve for retirement benefi ts is provided for payment of retirement benefi ts to employees, in the amount deemed accrued at the fiscal year-end, based on the projected retirement benefit obligation and fair value of plan assets at the fiscal year-end. The reserve for retirement benefits and pension expenses are calculated using the simplified method, which assumes JFM’s retirement benefit obligation to be equal to the benefits payable if all eligible employees voluntarily terminated their employment at the fi scal year-end.
(e) Reserve for retirement benefi ts for directors and corporate auditorsThe reserve for retirement benefits for directors and corporate auditors is provided for payment of retirement benefits to directors and corporate auditors, in the amount deemed accrued at the fiscal year-end based on the internal policies.
Notes to Financial Statements

JFM Annual Report 2015 | 62
Financial Section
FinancialSection
(7) Hedge accounting(a) Hedge accounting method
Interest rate swaps used to hedge the risk of interest rate fluctuations that qualify for hedge accounting and meet specific matching criteria are not measured at fair value, but the differential paid or received under the swap agreements is recognized and included in interest expense or income. If swap contracts or forward contracts used to hedge the risk of foreign currency fluctuation qualify for deferral hedge accounting, the foreign currency-denominated assets and liabilities are translated at the contracted rate.
(b) Hedging instruments and hedged items(ⅰ) Hedging instruments・・・Interest rate swaps
Hedged items・・・・・・・・・Bonds and long-term borrowed money(ⅱ) Hedging instruments・・・Currency swaps
Hedged items・・・・・・・・・Foreign currency-denominated bonds(ⅲ) Hedging instruments・・・Foreign exchange forward contracts
Hedged items・・・・・・・・・Foreign currency-denominated bank deposits(c) Hedging policy
JFM uses hedging instruments as a means of hedging exposure to interest rate risk and foreign exchange risk. Hedged items are identified by each individual contract. As a means of hedging foreign exchange fluctuation risks associated with the receipt of interest and principal of foreign currency-denominated bank deposits, a foreign exchange forward contract is entered into at the time of each deposit by JFM.
(d) Assessment of hedge effectivenessJFM ensures hedging instruments and hedged items have the same major terms when entering into hedge transactions to offset market fluctuation risks associated with bonds and long-term borrowed money. Accordingly, JFM deems these to be highly effective and thus does not assess effectiveness. Moreover, a periodic assessment of hedge effectiveness for interest rate swaps and currency swaps and forward contracts that qualify for deferral hedge accounting is omitted when the exceptional accrual method is applied.
(8) Cash and cash equivalentsCash and cash equivalents in the statement of cash flows consist of “Cash and bank deposits” on the balance sheets.
(9) Fund for lending rate reductionIn accordance with the provisions of Article 46, Section 1 of the Law, JFM has established the fund for lending rate reduction to reserve contributions as stipulated in Article 32-2 of the Local Government Finance Law (Law No. 109, 1948). Also, pursuant to the provisions of Article 46, Section 5 of the Law, income arising from the investment of the fund (hereinafter, “investment income”) is used to reduce interest rates of the loans to municipalities, and if there is any surplus in the investment income after this interest rate reduction process, the surplus amount is added to the fund. Further, pursuant to the provisions of Article 46, Section 6 of the Law, if there is any shortfall after the interest rate reduction process, the shortfall is covered by withdrawal of the fund within the limits of the total of the additional portion to the fund made up to the previous fiscal year and the contributions made in the most current fiscal year.
(10) Reserve for interest rate volatility and management account reserve for interest rate volatilityThe reserve for interest rate volatility is set aside to prepare for interest rate risk associated with refinancing of JFM bonds (excluding the bonds issued by the former Japan Finance Corporation for Municipal Enterprises; hereinafter, the “Predecessor”) pursuant to the provisions of Article 38, Sections 1 and 3 of the Law, and Article 9, Sections 8 and 10 of the Supplementary Provisions of the Law, and is calculated and accounted for based on the provisions of Article 34 of the Ministerial Ordinance on Finance and Accounting of Japan Finance Organization for Municipalities (Ordinance No. 87 of the Ministry of Internal Affairs and Communications, 2008; hereinafter, “Ordinance on Finance and Accounting”) and Article 22 and 23 of the Government Ordinance on preparation of relevant government ordinances and provisional measures for the abolishment of the Japan Finance Corporation for Municipal Enterprises Law (Government Ordinance No. 226, 2008; hereinafter, “Preparation Ordinance”). The management account reserve for interest rate volatility is set aside to manage interest rate risk associated with refinancing of bonds issued by the Predecessor pursuant to the provisions of Article 9, Sections 9 and 10, and Article 13, Sections 5 and 7 of the Supplementary Provisions of the Law, and is calculated and accounted for based on the provisions of Articles 1 through 3 of the Ministerial Ordinance on the operations of the Management Account at Japan Finance Organization for Municipal Enterprises (Ordinance No. 2 of the Ministry of Internal Affairs and Communications, and the Ministry of Finance, 2008; hereinafter, “Management Account Operations Ordinance”) and Articles 3 and 5 of the Supplementary Provisions of the above ordinance.
(11) Reserve for interest rate reductionReserve for interest rate reduction is set aside to reduce interest rates on the loans made by the Predecessor to local governments pursuant to the provisions of Article 9, Section 13, and Article 13, Section 8 of the Supplementary Provisions of the Law, and Article 26, Sections 1, 3 and 4 of the Preparation Ordinance, and is calculated and accounted for based on the provisions of Article 5 of the Management Account Operations Ordinance.
Financial Statements

JFM Annual Report 2015 | 63
Review
and P
lanO
perations
Manag
ement S
tructureJFM
’s Role in
Local Governm
ent FinanceF
inan
cial Sectio
nA
pp
endix / JFM
Data
(12) Management account surplus reserveProfits generated in the management account are accounted for as the management account surplus reserve separately from retained earnings in accordance with the provisions of Article 13, Section 8 of the Supplementary Provisions of the Law and Article 26, Section 2 of the Preparation Ordinance.
(13) Consumption taxesNational and local consumption taxes are accounted for using the tax exclusion method.
3. Change in PresentationEffective fi scal 2013, JFM has adopted “Accounting Standard for Retirement Benefi ts” (Accounting Standards Board of Japan (ASBJ) Statement No. 26, issued May 17, 2012, hereinafter “Retirement Benefi ts Standard”) and “Guidance on Accounting Standard for Retirement Benefi ts” (ASBJ Guidance No. 25, issued May 17, 2012, hereinafter “Retirement Benefi ts Guidance”), excluding Clause 30 of the Retirement Benefi ts Standard and Clauses 52 to 60 of the Retirement Benefits Guidance. Due to this adoption, the presentation in the notes with regard to employee retirement benefits has been changed from fi scal 2013.
4. Additional InformationJFM obtained the approval of the Minister of Health, Labour and Welfare, dated 1 October 2014, for the transfer to the Japanese national government of the payment obligation of the substitutional portion of the Employees’ Pension Fund established under the Japanese Welfare Pension Insurance Law. The total amount of the refund (minimum policy reserve) measured in the Employees’ Pension Fund as of 31 March 2014 was 55,980 million yen. JFM estimates that its profi t and loss will not be affected in the event that Clause 46 of Retirement Benefi ts Guidance is applied.
5. LoansThere are no bankrupt loans, non-accrual loans, past due loans (three months or more), or restructured loans. Since JFM has never experienced loan losses in the past, it does not record a reserve for possible loan loss. Bankrupt loans represent loans to borrowers as defined in Article 96, Section 1, Clause 3 (a) through (e) and Clause 4 of the Enforcement Ordinance of the Corporate Income Tax Law (Government Ordinance No. 97, 1965), and on which accrued interest is not accounted in revenue as there is no expectation of collection of either principal or interest because they are past due for a considerable period of time or for other reasons (excluding loans on which bad debts are written off; hereinafter, “Non-accrual loans”). Non-accrual loans represent loans on which accrued interest is not accounted in revenue, excluding loans to bankrupt borrowers and loans with grace periods for interest payments to assist in corporate reorganization or to support business. Past due loans (three months or more) represent loans on which payment of principal or interest is in arrears for more than three months, calculated from the day following the contractual due date, excluding bankrupt loans and non-accrual loans. Restructured loans represent loans, given certain favorable terms and conditions, such as reduction or exemption of interest, grace periods for interest or principal payments, and debt waivers, to assist borrowers in corporate rehabilitation or to support business, excluding bankrupt loans, non-accrual loans and past due loans (three months or more).
6. Payment to the National Treasury of a Portion of JFM’s Management Account Reserve for Interest Rate VolatilityIn accordance with the Supplementary Provisions of the Law, a portion of JFM’s management account reserve for interest rate volatility is being attributed to the Japanese national government over a period of three years from fi scal 2012 through fi scal 2014, with the aim of transferring 1 trillion yen over this period. In fiscal 2013, 650,000 million yen was transferred to the national treasury by JFM, pursuant to Article 14 of the Supplementary Provisions of the Law for fiscal 2013 (Ordinance No. 1 of the Ministry of Internal Affairs and Communications, and the Ministry of Finance, 2013).
For the three years from fi scal 2015 through fi scal 2017, a portion of JFM’s reserve for interest rate volatility within the management account is to be attributed to the Japanese national government, with the aim of transferring up to 600 billion yen over this period. In fi scal 2015, 300 billion yen is scheduled to be transferred to the national treasury by JFM, pursuant to Article 14 of the Supplementary Provisions of the Law for fiscal 2015 (Ordinance No. 1 of the Ministry of Internal Affairs and Communications, and the Ministry of Finance, 2015).
7. Financial Instruments(1) Status of fi nancial instruments
(a) Policy for fi nancial instrumentsIn order to maintain a sound and good financial standing as well as the solid confidence of capital markets, JFM needs to appropriately manage various risks including interest rate risks. JFM adopts an integrated risk management approach to appropriately respond to various risks while endeavoring to further advance its risk analysis and management.
JFM Annual Report 2015 | 64
Financial Section
FinancialSection
Accordingly, JFM has developed a system for appropriate risk management, including the establishment of the Integrated Risk Management Committee, which supervises JFM’s overall risk management, and the Risk Management Office, which monitors the risks in each department. The content of risk management can then be appropriately reflected in management decisions.
(b) Details and risks of financial instrumentsJFM makes loans to local governments. The maximum term to maturity is 30 years (extended to 40 years from April 2015), but the majority of the funds for these loans are raised mainly through issuance of 10-year bonds. Therefore, a large duration gap is created between lending and funding, and JFM is exposed to the interest rate risk associated with bond and long-term borrowed money refinancing. JFM has set aside reserves for interest rate fluctuations (the reserve for interest rate volatility), and has set up the ALM Committee separately from the Integrated Risk Management Committee to comprehensively analyze and manage JFM’s assets and liabilities in a timely and appropriate manner. At the meeting, medium- and long-term management analysis as well as risk analysis and evaluation are conducted through scenario analysis, VaR analysis, and duration analysis, among other methods. In addition, JFM reflects the findings in its bond issuance plans and other aspects of management and endeavors to reduce interest rate risk.
(c) Risk Management for Financial Instruments(ⅰ) Credit risk
Credit risk is the risk of loss arising from a credit event, such as deterioration in the financial condition of a borrower, which causes an asset to lose value or become worthless. In addition to credit risk associated with loans, market transactions also involve credit risk.A. Credit risk on loans
JFM extends loans exclusively to local governments. Local governments have a zero Bank of International Settlements (BIS) risk weighting and JFM does not expect any default on loans made to local governments for the reasons outlined below. JFM and the Predecessor have never experienced any loan losses.• The Japanese national government includes principal and interest payments of local government
bonds and loans in the expenditure of the Local Government Finance Program, and secures the total amount of local allocation tax which balances local governments’ total expenditures including principal and interest payments, and total revenue. Thus, the national government effectively secures revenue sources for principal and interest payments by local governments. The national government also secures revenue sources for principal and interest payments by individual local governments by including a portion of such principal and interest in the Standard Financial Needs when calculating local allocation tax.
• Under the consultation system for local government bonds and loans, credit reviews must include checks on the repayment status of local governments, and tax revenue and necessary revenue sources to be secured. Additionally, under the Early Warning System, the local governments whose principal and interest payments or financial deficits exceed a certain level must apply for approval to issue bonds or obtain loans, so that the credit standing of local government bonds and loans is maintained.
• Under the Law Relating to the Financial Soundness of Local Governments, which was promulgated in June 2007 (No. 94), local governments whose fiscal indicators exceed the early warning limits must make their own efforts toward achieving fiscal soundness, and local governments whose fiscal indicators exceed the reconstruction limits must take necessary actions to restore their finances under the supervision of the national government or the respective prefectural governments with regard to redemption of local government bonds and loans, and other operations. JFM is not subject to the “Banking Law” (1981, No. 59) or the “Financial Reconstruction Law” (1998, No. 132) but performs self-assessment of loans in accordance with the “Financial Inspection Manual” of the Financial Services Agency (FSA).
B. Credit risk on transactionsJFM is exposed to the risk of loss arising from credit events, such as deterioration in the financial condition of a counterparty, which causes an asset to lose value or become worthless. However, JFM appropriately manages credit risk of this type by constantly monitoring counterparties’ financial standing, taking measures including suspension of new deals and cancellation of transactions in case of a deterioration of their credit standings. Moreover, JFM limits counterparties to financial institutions that achieve a certain credit rating and other criteria, and conducts transactions within the credit lines for each counterparty in order to diversify risks. In addition, JFM enters into ISDA (International Swaps and Derivatives Association) Master Agreements and CSA (Credit Support Annex) with all derivatives counterparties to reduce credit risk.
(ⅱ) Market riskMarket risk is the risk of loss resulting from changes in the value of assets and liabilities due to fluctuations in risk factors such as interest rates, securities prices and foreign exchange rates, or the risk of loss resulting
Financial Statements

JFM Annual Report 2015 | 65
Review
and P
lanO
perations
Manag
ement S
tructureJFM
’s Role in
Local Governm
ent FinanceF
inan
cial Sectio
nA
pp
endix / JFM
Data
from changes in earnings generated from assets and liabilities. Market risk includes interest rate risk, foreign exchange risk, infl ation risk and price change risk.A. Interest rate risk
Interest rate risk is the risk of losses incurred or a decrease in profi ts due to fl uctuations in interest rates when there is an interest rate or duration gap between assets and liabilities. The interest rate risk at JFM includes the interest rate risk associated with bond and borrowed money refi nancing and pipeline risk. - Interest rate risk associated with bond and borrowed money refi nancing
JFM makes loans to local governments. The maximum term to maturity is 30 years (extended to 40 years from April 2015), but the majority of the funds for these loans are raised mainly through issuance of 10-year bonds, which creates interest rate risk associated with bond refinancing. JFM takes the following measures to address the interest rate risk resulting from a duration gap between lending and funding.
• JFM maintains necessary reserves to cope with the interest rate risk resulting from a duration gap between lending and funding.
• As assets and liabilities in JFM’s general account will expand as a result of lending to local governments and funding, JFM carries out an ALM analysis of this account in a timely and appropriate manner to further enhance the effectiveness of its management of interest rate risk. In order to reduce exposure to interest rate risk, JFM has established a medium-term management target for fi ve years from fi scal 2013, in which the duration gap is to be maintained below approximately two years.
• To achieve its objective, JFM has taken measures to decrease the duration gap by issuing longer than 10-year bonds to extend the duration on liabilities while pursuing the best bond conditions with flexible funding operations.
• JFM’s lending for temporary financial countermeasures funding accounts for approximately 40% of the overall outstanding loans in the general account with the same maturities as loans to other businesses with a maximum maturity of 30 years. However, the interest rates for temporary fi nancial countermeasures funding are revised every 10 years, which also contributes to moderate the duration on assets (lending).
• As mentioned above, JFM resolves to extend its maximum loan maturity from 30 years to 40 years, which will increase the duration gap, but JFM’s stable operations are secured by a sufficient amount of reserves. In addition, JFM will revise its lending rate by the 30th year at the latest for its loans with maturities longer than 30 years.
• The management account, which manages assets related to loans extended by the Predecessor, is currently exposed to greater interest rate risk than the general account. To address such risk, JFM contributes to the required reserves for interest rate volatility as described above. In accordance with Article 14 of the Supplementary Provisions of the Law, a portion of JFM’s reserve for interest rate volatility within the management account is to be transferred to the Japanese national government. The transfer is scheduled to occur over a period of three years from fi scal 2015 through fi scal 2017, with the aim of transferring up to 600 billion yen.
- Pipeline risk JFM is also exposed to pipeline risk, whereby losses would be incurred or profits decreased as a result of interest rate fluctuations during the time from when JFM raises money until the point at which the money is loaned to local governments. JFM, in principle, uses swap transactions to hedge against pipeline risk.
B. Foreign exchange and other risksVarious risks associated with bond principal and interest payments are hedged by swap transactions. These risks include foreign exchange risk related to foreign currency-denominated bonds, interest rate risk related to floating rate bonds, and risk of fluctuations in the amount of principal and interest of infl ation-indexed bonds. JFM’s investments of surplus funds are exposed to the risk of losses on the sale of securities resulting from price declines and the risk of realized losses on foreign currency-denominated deposits resulting from fluctuations in foreign exchange rates. Accordingly, in principle, JFM minimizes the risk of price fluctuation by holding investments until maturity, and hedges foreign exchange risk by using foreign exchange contracts.
C. Quantitative information on market riskLoans, bonds and long-term borrowed money are primarily affected by interest rate risk, which is a major risk variable among the market risks. With respect to loans, bonds and long-term borrowed money in the general account, JFM establishes a management target for the duration gap in order to manage interest rate risk appropriately. With regard to the quantitative analysis of interest rate risk, while JFM does not have a management target for the quantitative figures, it reports the results of calculating the quantitative information, such as the “outlier ratio”, to the ALM Committee and tracks the status of the interest rate risk. The “outlier ratio” is calculated by dividing JFM’s “decline in economic value” as a result of hypothetical

JFM Annual Report 2015 | 66
Financial Section
FinancialSection
interest rate shocks by JFM’s net assets, including the reserve for interest rate volatility in the general account and the fund for lending rate reduction. The “decline in economic value” is the largest possible loss in net present market value of its loans and bonds and long-term borrowed money that JFM would suffer following a hypothetical 200 basis point increase or decrease in market interest rates. The outlier ratio is calculated based on the following conditions.• Future Cash Flows
With respect to loans, future cash flows regarding such loans are calculated based on the type of interest rate of the loans. In addition, the advanced redemption in the future is not expected by JFM. With respect to fixed-rate bonds and long-term borrowed money, future cash flows regarding such fixed-rate bonds and long-term borrowed money are calculated based on the redemption schedule. With respect to floating rate bonds hedged by interest rate swaps, that qualify for hedge accounting and meet specific matching criteria, future cash flows corresponding to such floating rate bonds are calculated in a manner similar to fixed-rate bonds.
• Indicative Interest RateFor the assessment of loans, bonds and long-term borrowed money, the corresponding interest rate of Japanese government bonds as of 31 March 2015 is used.
• Calculation of Outlier RatioBased on an assumption that risk variables, except for interest rate risk, are fixed as of 31 March 2015, the outlier ratio is calculated by dividing the change in fair value in the case where the indicative interest rate (government bonds) rises across-the-board by 200 basis points (2.00%) or the change in fair value in the case such rate falls across-the-board by 200 basis points (2.00%), whichever is greater, by net assets including the reserve for interest rate volatility and the fund for lending rate reduction. JFM calculates the outlier ratio reflecting a rise of 200 basis points of the indicative interest rate as JFM understands that the change in fair value in the case of rising interest rates would be greater than that in the case of falling interest rates. JFM monitors the movement of the outlier ratio on a regular basis, and the calculation as of 31 March 2015 is as follows. Information on the outlier ratio as of 31 March 2015 is as follows:
(Millions of yen) (Thousands of U.S. dollars)
Outlier ratio
(a)=-(b)/(e)
Change in fair value in the case of 200 basis points rise in interest rates Net assets including reserve for interest rate
volatility and the fund for lending rate reduction (e)
Total(b)=(c)+(d)
Loans(c)
Bonds and long-term borrowed money
(d)
General account
22.4%[+1.8%]
¥(578,975)[(96,937)]
$(4,809,970)[(805,333)]
¥(1,855,809)[(286,075)]
$(15,417,538)[(2,376,630)]
¥+1,276,833[+189,137]
$+10,607,568[+1,571,297]
¥2,580,111[+248,440]
$21,434,834[+2,063,969]
Note: Amounts posted in square brackets indicate the change from 31 March 2014.
With respect to loans and bonds in the management account, JFM raises funds by the issuance of bonds as necessary in order to manage existing loans until their redemption. For this reason, while JFM reports the calculation results of the quantitative information regarding the interest rate risk to the ALM Committee and confirms the status of interest rate risk as is the case in the general account, JFM does not establish a management target or use the quantitative analysis for the management account. With respect to these financial instruments in the management account, based on an assumption that the risk variables, except for interest rate risk, hold steady, for an indicative interest rate as of 31 March 2015 that is 10 basis points higher than the actual rate, it is assumed that the fair value of the net amount (assets side), after offsetting such financial instruments with the financial liabilities, would decline by 36,604 million yen (304,104 thousand U.S. dollars). On the contrary, for an indicative interest rate as of 31 March 2015 that is 10 basis points lower than the actual rate, it is assumed that the fair value of the net amount (assets side), after offsetting such financial instruments with the financial liabilities, would increase by 37,102 million yen (308,237 thousand U.S. dollars).
(ⅲ) Liquidity riskLiquidity risk is the risk that JFM would incur losses due to difficulties in securing the necessary funds or the necessity of obtaining funds at far higher interest rates than under normal conditions as a result of a mismatch between the maturities of assets and liabilities or an unexpected outflow of funds (funding liquidity risk). It also includes the risk that JFM would incur losses because it is unable to conduct market transactions or is forced to conduct transactions at far more unfavorable prices than under normal conditions due to market disruption or other difficult situations (market liquidity risk).
Financial Statements

JFM Annual Report 2015 | 67
Review
and P
lanO
perations
Manag
ement S
tructureJFM
’s Role in
Local Governm
ent FinanceF
inan
cial Sectio
nA
pp
endix / JFM
Data
JFM’s exposure to liquidity risk is extremely low because loans are made to local governments according to a pre-set schedule, and the daily cash and liquidity management is carried out based on a quarterly plan for fund management. Moreover, JFM has entered into overdraft agreements with several fi nancial institutions to prepare for the unexpected events, and invests surplus funds only in short-term fi nancial products. In addition, as new Basel III liquidity standards are being applied to Japanese financial institutions, JFM has voluntarily implemented a plan to secure liquidity support assets in advance in order to prepare for potential market disruption which may prevent JFM from securing the necessary funds for scheduled bond principal and interest payments.
(ⅳ) Supplemental remarks on fair value of fi nancial instrumentsIn addition to the amount based on the market price, the fair value of illiquid fi nancial instruments includes a value that has been rationally calculated. Since certain assumptions were made when calculating the fair value, the value may differ in the event that the assumptions change.
(2) Items related to fair value of fi nancial instrumentsThe book value, fair value and difference between them as of 31 March 2014 are as follows:
Book value Fair value Difference
(1) Loans ¥23,082,976 ¥24,608,923 ¥1,525,946
(2) Securitiesheld-to-maturity securities 533,998 533,998 (0)
(3) Cash and bank deposits 467,175 467,175 -
Total assets 24,084,150 25,610,096 1,525,945
(1) Bonds 19,423,743 20,180,752 757,009
(2) Borrowed money 95,500 96,096 596
(3) Cash collateral received for fi nancial instruments 43,530 43,530 -
Total liabilities 19,562,773 20,320,379 757,606
Derivative transactionsHedge accounting applied
- - -
Total of derivative transactions - - -
(Millions of yen)
The book value, fair value and difference between them as of 31 March 2015 are as follows:
Book value Fair value Difference
(1) Loans ¥23,437,630 ¥25,359,637 ¥1,922,007
(2) Securitiesheld-to-maturity securities 670,000 670,000 -
(3) Cash and bank deposits 399,211 399,211 -
(4) Cash collateral paid for fi nancial instruments 437 437 -
Total assets 24,507,278 26,429,285 1,922,007
(1) Bonds 19,542,864 20,453,505 910,640
(2) Borrowed money 85,500 87,373 1,873
(3) Cash collateral received for fi nancial instruments 182,246 182,246 -
Total liabilities 19,810,611 20,723,125 912,513
Derivative transactionsHedge accounting applied
- - -
Total of derivative transactions - - -
(Millions of yen)
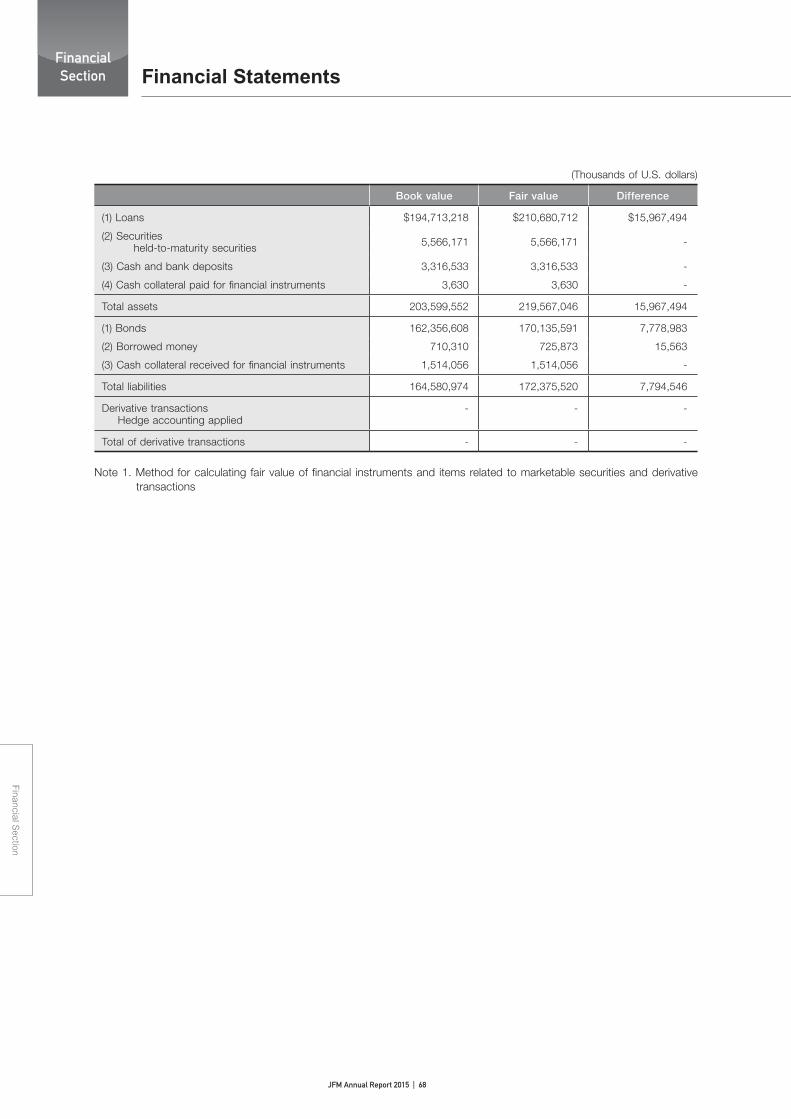
JFM Annual Report 2015 | 68
Financial Section
FinancialSection
Book value Fair value Difference
(1) Loans $194,713,218 $210,680,712 $15,967,494
(2) Securitiesheld-to-maturity securities 5,566,171 5,566,171 -
(3) Cash and bank deposits 3,316,533 3,316,533 -
(4) Cash collateral paid for financial instruments 3,630 3,630 -
Total assets 203,599,552 219,567,046 15,967,494
(1) Bonds 162,356,608 170,135,591 7,778,983
(2) Borrowed money 710,310 725,873 15,563
(3) Cash collateral received for financial instruments 1,514,056 1,514,056 -
Total liabilities 164,580,974 172,375,520 7,794,546
Derivative transactionsHedge accounting applied
- - -
Total of derivative transactions - - -
(Thousands of U.S. dollars)
Note 1. Method for calculating fair value of financial instruments and items related to marketable securities and derivative transactions
Financial Statements

JFM Annual Report 2015 | 69
Review
and P
lanO
perations
Manag
ement S
tructureJFM
’s Role in
Local Governm
ent FinanceF
inan
cial Sectio
nA
pp
endix / JFM
Data
Assets(1) Loans
The fair value of loans is calculated by discounting future cash flows assuming prepayment at the discount rate calculated using the Japanese government bond rates as of 31 March 2014 and 2015.
(2) SecuritiesAll bonds are held until maturity, and the fair value of treasury discount bills is the market price. Since all negotiable certifi cates of deposit are short-term, the fair value approximates the book value. As a result, the book value is deemed to be the fair value.
As of 31 March 2014
Type Book value Fair value Difference
Securities with fair values exceeding the balance sheet amount
- - - -
Sub total - - -
Securities with fair values that do not exceed the balance sheet amount
Treasury discount bills ¥19,998 ¥19,998 ¥(0)
Negotiable certifi cates of deposit
514,000 514,000 -
Sub total 533,998 533,998 (0)
Total ¥533,998 ¥533,998 ¥(0)
(Millions of yen)
As of 31 March 2015
Type Book value Fair value Difference
Securities with fair values exceeding the balance sheet amount
- - - -
Sub total - - -
Securities with fair values that do not exceed the balance sheet amount
Negotiable certifi cates of deposit
¥670,000 ¥670,000 -
Sub total 670,000 670,000 -
Total ¥670,000 ¥670,000 -
(Millions of yen)
Type Book value Fair value Difference
Securities with fair values exceeding the balance sheet amount
- - - -
Sub total - - -
Securities with fair values that do not exceed the balance sheet amount
Negotiable certifi cates of deposit
$5,566,171 $5,566,171 -
Sub total 5,566,171 5,566,171 -
Total $5,566,171 $5,566,171 -
(Thousands of U.S. dollars)
(3) Cash and bank depositsThe book value is used as the fair value for deposits without maturities. Since all deposits with maturities are short-term, the fair value approximates the book value. As a result, the book value is deemed to be the fair value.
(4) Cash collateral paid for fi nancial instrumentsCash collateral is associated with derivative transactions. The book value is used as the fair value of cash collateral paid for financial instruments since both values are approximately equal as a result of each deposit period being short term.

JFM Annual Report 2015 | 70
Financial Section
FinancialSection
Liabilities(1) Bonds
The fair value of bonds issued by JFM that have a market price is based on the market price. The fair value of bonds without a market price is calculated by discounting the future cash flows using the interest rate that would be applied when issuing similar bonds with the same total principal and interest and payment term. Deferral hedge accounting is used for currency swaps, and the fair value of foreign currency-denominated bonds is thus calculated using the total of the fair value of that bond and the fair value of the swap transaction. Hedge accounting is used for interest rate swaps, and the fair value of floating rate bonds is thus calculated by determining the present value using the total of the corresponding interest rate swap accounted for together with the principal and interest and discounting the future cash flows using the interest rate that would be applied when issuing a similar bond.
(2) Borrowed moneyThe fair value of long-term borrowed money is calculated by discounting the future cash flows using the interest rate that would presumably be applied when issuing bonds with the same total principal and interest and payment term. On the other hand, the book value is used as the fair value of short-term borrowed money since both values are approximately equal as a result of each loan period being short term.
(3) Cash collateral received for financial instrumentsCash collateral is associated with derivative transactions. The book value is used as the fair value of cash collateral received for financial instruments since both values are approximately equal as a result of each deposit period being short term.
Derivative transactionsTransactions for which hedge accounting is applied
For derivative transactions for which hedge accounting is applied, the contractual amount or the amount equivalent to the principal in the contract under each hedge accounting method as of 31 March 2014 is as follows:
(Millions of yen)
Hedge accounting
method
Type of derivative
transactions
Primary hedged items
Contract amount
Fair value
Method for calculating fair
valueOf which 1 year or
more
Principal accounting method
Interest rate swap transactions Receive/fixed and pay/floating
BondsLong-term borrowed money
- - -
Based on prices provided by the counterpartyfinancial institution
Hedge accounting for interest rate swaps
Interest rate swap transactions Receive/floating and pay/fixed
Bonds ¥105,000 ¥105,000 (*1)
Deferral hedge accounting for currency swaps
Currency swap transactions
Foreign currency-denominated bonds
1,097,523 1,097,523 (*2)
Deferral hedge accounting for foreign exchange contracts
Foreign exchange contracts
Foreign currency-denominated deposits
103,000 - (*2)
Total ¥1,305,523 ¥1,202,523 -
Financial Statements

JFM Annual Report 2015 | 71
Review
and P
lanO
perations
Manag
ement S
tructureJFM
’s Role in
Local Governm
ent FinanceF
inan
cial Sectio
nA
pp
endix / JFM
Data
For derivative transactions for which hedge accounting is applied, the contractual amount or the amount equivalent to the principal in the contract under each hedge accounting method as of 31 March 2015 is as follows:
(Millions of yen)
Hedge accounting
method
Type of derivative
transactions
Primary hedged items
Contract amount
Fair value
Method for calculating fair
valueOf which 1 year or
more
Principal accounting method
Interest rate swap transactions
BondsLong-term borrowed money
- - -
Based on prices provided by the counterpartyfi nancial institution
Hedge accounting for interest rate swaps
Interest rate swap transactions Receive/fl oating and pay/fi xed
Bonds ¥95,000 ¥95,000 (*1)
Deferral hedge accounting for currency swaps
Currency swap transactions
Foreign currency-denominated bonds
1,243,804 1,243,804 (*2)
Deferral hedge accounting for foreign exchange contracts
Foreign exchange contracts
Foreign currency-denominated deposits
135,000 - (*2)
Total ¥1,473,804 ¥1,338,804 -
(Thousands of U.S. dollars)
Hedge accounting
method
Type of derivative
transactions
Primary hedged items
Contract amount
Fair value
Method for calculating fair
valueOf which 1 year or
more
Principal accounting method
Interest rate swap transactions
BondsLong-term borrowed money
- - -
Based on prices provided by the counterpartyfi nancial institution
Hedge accounting for interest rate swaps
Interest rate swap transactions Receive/fl oating and pay/fi xed
Bonds $789,233 $789,233 (*1)
Deferral hedge accounting for currency swaps
Currency swap transactions
Foreign currency-denominated bonds
10,333,177 10,333,177 (*2)
Deferral hedge accounting for foreign exchange contracts
Foreign exchange contracts
Foreign currency-denominated deposits
1,121,542 - (*2)
Total $12,243,952 $11,122,410 -
(*1) Since interest rate swaps for which hedge accounting is applied are accounted for together with the bond being hedged, the fair value is presented together with the fair value of the relevant bond.
(*2) Since currency swaps and foreign exchange contracts for which deferral hedge accounting is applied are accounted for together with the foreign currency-denominated bond or foreign currency-denominated deposit being hedged, the fair value is presented together with the fair value of the relevant hedged item.

JFM Annual Report 2015 | 72
Financial Section
FinancialSection
Note 2. The repayment schedule for monetary claims and securities with maturities is as follows:
As of 31 March 2014
(Millions of yen)
Within 1 year
After 1 year
through 2 years
After 2 years through 3 years
After 3 years through 4 years
After 4 years through 5 years
After 5 years through 10 years
After 10 years through 20 years
After 20 years through 30 years
Loans ¥1,572,391 ¥1,626,590 ¥1,619,955 ¥1,571,660 ¥1,532,455 ¥6,673,031 ¥6,970,977 ¥1,515,913
Securitiesheld-to- maturitysecurities
534,000 - - - - - - -
Deposits 467,175 - - - - - - -
As of 31 March 2015
(Millions of yen)
Within 1 year
After 1 year
through 2 years
After 2 years through 3 years
After 3 years through 4 years
After 4 years through 5 years
After 5 years through 10 years
After 10 years through 20 years
After 20 years through 30 years
Loans ¥1,636,841 ¥1,653,076 ¥1,633,833 ¥1,614,776 ¥1,582,109 ¥6,722,939 ¥6,990,554 ¥1,603,497
Securitiesheld-to- maturitysecurities
670,000 - - - - - - -
Deposits 399,210 - - - - - - -
(Thousands of U.S. dollars)
Within 1 year
After 1 year
through 2 years
After 2 years through 3 years
After 3 years through 4 years
After 4 years through 5 years
After 5 years through 10 years
After 10 years through 20 years
After 20 years through 30 years
Loans $13,598,420 $13,733,296 $13,573,431 $13,415,108 $13,143,718 $55,852,281 $58,075,558 $13,321,407
Securitiesheld-to- maturitysecurities
5,566,171 - - - - - - -
Deposits 3,316,533 - - - - - - -
Financial Statements

JFM Annual Report 2015 | 73
Review
and P
lanO
perations
Manag
ement S
tructureJFM
’s Role in
Local Governm
ent FinanceF
inan
cial Sectio
nA
pp
endix / JFM
Data
Note 3. The repayment schedule for bonds and borrowed money is as follows:
As of 31 March 2014
Within 1 year
After 1 year
through 2 years
After 2 years through 3 years
After 3 years through 4 years
After 4 years through 5 years
After 5 years through 10 years
After 10 years through 20 years
After 20 years through 30 years
Bonds ¥1,952,196 ¥1,730,970 ¥1,822,228 ¥1,736,489 ¥1,804,268 ¥8,238,330 ¥1,959,780 ¥193,500
Borrowed money
20,000 - - - 30,000 45,500 - -
(Millions of yen)
As of 31 March 2015
Within 1 year
After 1 year
through 2 years
After 2 years through 3 years
After 3 years through 4 years
After 4 years through 5 years
After 5 years through 10 years
After 10 years through 20 years
After 20 years through 30 years
Bonds ¥1,730,970 ¥1,847,228 ¥1,745,824 ¥1,804,268 ¥2,055,327 ¥8,025,684 ¥2,159,110 ¥187,000
Borrowed money
- - - 30,000 10,000 45,500 - -
(Millions of yen)
Within 1 year
After 1 year
through 2 years
After 2 years through 3 years
After 3 years through 4 years
After 4 years through 5 years
After 5 years through 10 years
After 10 years through 20 years
After 20 years through 30 years
Bonds $14,380,410 $15,346,257 $14,503,821 $14,989,355 $17,075,081 $66,675,122 $17,937,277 $1,553,543
Borrowed money
- - - 249,232 83,077 378,001 - -
(Thousands of U.S. dollars)
8. Tangible and Intangible Fixed AssetsTangible and intangible fi xed assets as of 31 March 2014 consisted of the following:
(Millions of yen)
Type of assets
Balance as of 1 April
2013(Acquisition
costs)
Increaseduring
the year
Decreaseduring
the year
Balance as of 31 March
2014(Acquisition
costs)
Accumulated depreciation
and amortization
as of 31 March 2014
Depreciation and
amortization during
the year
Balance as of 31 March
2014(Net book
value)
Tangible fi xed assets
Buildings ¥1,104 ¥20 ¥29 ¥1,094 ¥244 ¥54 ¥850
Land 1,994 - 335 1,659 - - 1,659
Other tangible fi xed assets 114 282 19 377 52 18 325
Total tangible fi xed assets 3,213 302 384 3,132 296 73 2,836
Intangible fi xed assets
Software 1,351 11 725 637 444 218 193
Other intangible fi xed assets 482 262 - 744 - - 744
Total intangible fi xed assets ¥1,834 ¥273 ¥725 ¥1,382 ¥444 ¥218 ¥938
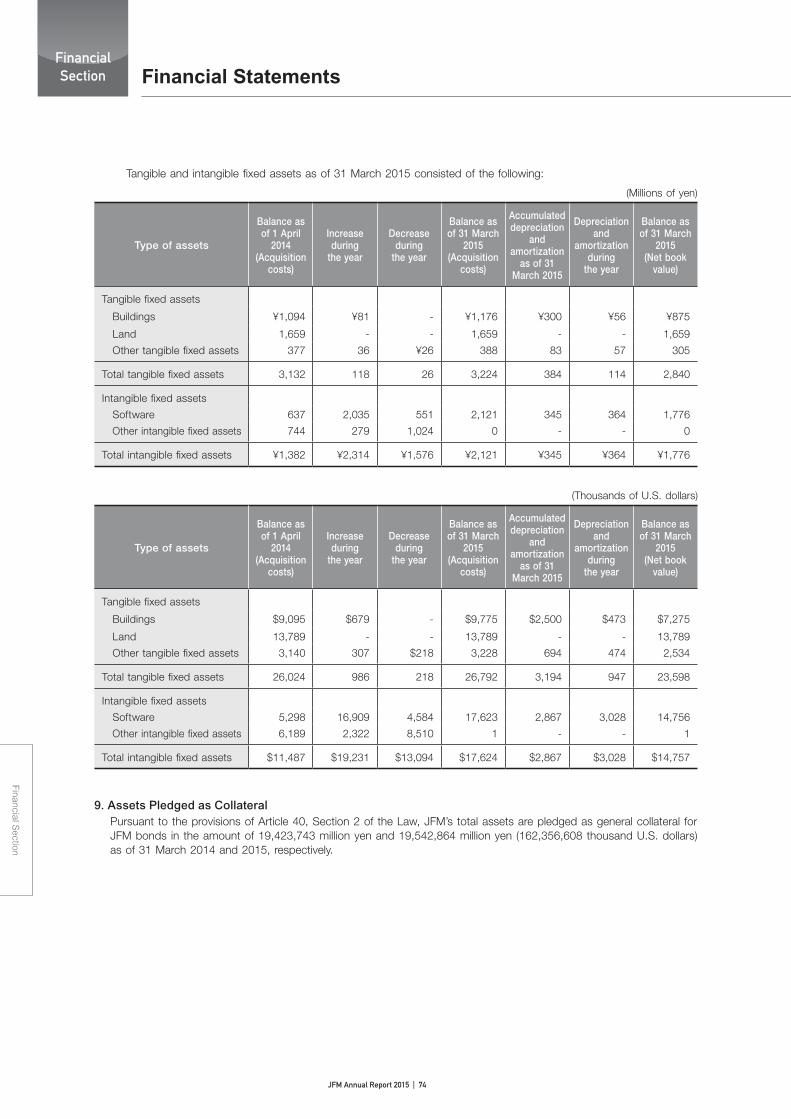
JFM Annual Report 2015 | 74
Financial Section
FinancialSection
Tangible and intangible fixed assets as of 31 March 2015 consisted of the following:
(Millions of yen)
Type of assets
Balance as of 1 April
2014(Acquisition
costs)
Increaseduring
the year
Decreaseduring
the year
Balance as of 31 March
2015(Acquisition
costs)
Accumulated depreciation
and amortization
as of 31 March 2015
Depreciation and
amortization during
the year
Balance as of 31 March
2015(Net book
value)
Tangible fixed assets
Buildings ¥1,094 ¥81 - ¥1,176 ¥300 ¥56 ¥875
Land 1,659 - - 1,659 - - 1,659
Other tangible fixed assets 377 36 ¥26 388 83 57 305
Total tangible fixed assets 3,132 118 26 3,224 384 114 2,840
Intangible fixed assets
Software 637 2,035 551 2,121 345 364 1,776
Other intangible fixed assets 744 279 1,024 0 - - 0
Total intangible fixed assets ¥1,382 ¥2,314 ¥1,576 ¥2,121 ¥345 ¥364 ¥1,776
(Thousands of U.S. dollars)
Type of assets
Balance as of 1 April
2014(Acquisition
costs)
Increaseduring
the year
Decreaseduring
the year
Balance as of 31 March
2015(Acquisition
costs)
Accumulated depreciation
and amortization
as of 31 March 2015
Depreciation and
amortization during
the year
Balance as of 31 March
2015(Net book
value)
Tangible fixed assets
Buildings $9,095 $679 - $9,775 $2,500 $473 $7,275
Land 13,789 - - 13,789 - - 13,789
Other tangible fixed assets 3,140 307 $218 3,228 694 474 2,534
Total tangible fixed assets 26,024 986 218 26,792 3,194 947 23,598
Intangible fixed assets
Software 5,298 16,909 4,584 17,623 2,867 3,028 14,756
Other intangible fixed assets 6,189 2,322 8,510 1 - - 1
Total intangible fixed assets $11,487 $19,231 $13,094 $17,624 $2,867 $3,028 $14,757
9. Assets Pledged as CollateralPursuant to the provisions of Article 40, Section 2 of the Law, JFM’s total assets are pledged as general collateral for JFM bonds in the amount of 19,423,743 million yen and 19,542,864 million yen (162,356,608 thousand U.S. dollars) as of 31 March 2014 and 2015, respectively.
Financial Statements

JFM Annual Report 2015 | 75
Review
and P
lanO
perations
Manag
ement S
tructureJFM
’s Role in
Local Governm
ent FinanceF
inan
cial Sectio
nA
pp
endix / JFM
Data
10. BondsBonds as of 31 March 2014 consisted of the following:
(Millions of yen)
Type of bond Date of issue
Balance as of 1
April 2013
Balance as of 31 March 2014
Coupon rate (%) Maturity
Government-guaranteed bonds issued by JFM (domestic) 10-year bonds (Series 1-58)
6/15/2009-3/17/2014 ¥2,332,567 ¥3,013,475 0.541
to 1.5 10Y
Government-guaranteed bonds issued by JFM (domestic) 8-year bonds (Series 1-3)
9/26/2013-2/27/2014 - 200,000 0.460
to 0.576 8Y
Government-guaranteed bonds issued by JFM (domestic) 6-year bonds (Series 1-12)
9/27/2011-3/10/2014 519,971 809,978 0.186
to 0.4 6Y
Government-guaranteed bonds issued by JFM (domestic) 4-year bonds (Series 1-6)
5/28/2012- 8/29/2013 220,000 330,000 0.093
to 0.249 4Y
Government-guaranteed bonds issued by JFM (international) Global U.S. dollar bonds (Series 1) 1/13/2011 83,170 83,170
[USD 1,000 million] 4.0 10Y
Non-guaranteed bonds issued by JFM (domestic) 2-year bonds (Series 1) 2/19/2014 - 50,000 0.135 2Y
Non-guaranteed bonds issued by JFM (domestic) 3-year bonds (Series 1) 8/19/2013 - 20,000 0.170 3Y
Non-guaranteed bonds issued by JFM (domestic) 5-year bonds (Series 1-14)
5/25/2010-10/21/2013 230,000 275,000 0.230
to 0.639 5Y
Non-guaranteed bonds issued by JFM (domestic) 7-year bonds (Series 1) 8/20/2012 20,000 20,000 0.446 7Y
Non-guaranteed bonds issued by JFM (domestic) 10-year bonds (Series 1-58)
6/18/2009-3/24/2014 1,490,000 1,905,000 0.576
to 1.648 10Y
Non-guaranteed bonds issued by JFM (domestic) 15-year bonds (Series 1-3)
1/31/2013-1/22/2014 15,000 50,000 1.161
to 1.334 15Y
Non-guaranteed bonds issued by JFM (domestic) 20-year bonds (Series 1-35)
6/25/2009-3/24/2014 670,000 795,000 1.396
to 2.266 20Y
Non-guaranteed bonds issued by JFM (domestic) FLIP bonds (Series F1-F52, F54-F210)
7/22/2009-2/4/2014 1,003,000 1,304,514
(23,000)0.185
to 2.3343Y
to 30Y
Non-guaranteed bonds issued by JFM (domestic) FLIP bonds (Floater, Series F53, F211)
2/1/2011-2/26/2014 15,000 25,000 Floating
rate9Y
to 30Y
Non-guaranteed bonds issued by JFM (international) Private placements (Series 2, 3, 7, 14-16, 19, 28, 31, 33-35, 40-42)
1/12/2012- 3/6/2014 196,197
468,212[USD 4,832 million]
[AUD 210 million]
1.375 to 4.2
5Y to 7Y
Non-guaranteed bonds issued by JFM (international) Private placements (Floater, Series 1, 4-6, 8-13, 17, 18, 20-27, 29, 30, 32, 36-39)
1/17/2012-7/22/2013 95,064
145,599[USD 1,548 million]
[NZD 40 million][AUD 120 million]
(20,526)
Floating rate
1.5Y to 7Y
Non-guaranteed bonds issued by JFM (domestic) Private placements with Pension Fund Association for Local Government Offi cials (Series A1-A50)
7/31/2009-3/24/2014 1,280,000 1,580,000 0.64
to 1.53 10Y
Bonds issued by JFM - Sub-total - 8,169,971 11,074,950(43,526) - -
Government-guaranteed bonds issued by Japan Finance Organization for Municipal Enterprises (domestic) 10-year bonds (Series 1-8)
10/16/2008-5/25/2009 560,911 561,186 1.3
to 1.6 10Y
Non-guaranteed bonds issued by Japan Finance Organization for Municipal Enterprises (domestic) 5-year bonds (Series 1)
2/24/2009 29,998 - 1.01 5Y
Non-guaranteed bonds issued by Japan Finance Organization for Municipal Enterprises (domestic) 10-year bonds (Series 1-4)
11/25/2008-5/28/2009 139,972 139,977 1.59
to 1.77 10Y

JFM Annual Report 2015 | 76
Financial Section
FinancialSection
Non-guaranteed bonds issued by Japan Finance Organization for Municipal Enterprises (domestic) 20-year bonds (Series 1, 2)
1/26/2009-4/30/2009 84,952 84,955 2.07
to 2.29 20Y
Non-guaranteed bonds issued by Japan Finance Organization for Municipal Enterprises (domestic) Private placements with Pension Fund Association for Local Government Officials (Series A1, A2)
4/30/2009-5/26/2009 120,000 120,000 1.69
to 1.73 10Y
Bonds issued by Japan Finance Organization for Municipal Enterprises - Sub-total - 935,835 906,119 - -
Government-guaranteed bonds issued by the Predecessor (domestic) 10-year bonds (Series 826-886)
4/23/2003-6/19/2008 4,912,647 3,518,536
(1,136,460)0.5
to 2.0 10Y
Government-guaranteed bonds issued by the Predecessor (domestic) 15-year bonds (Series 1-5)
6/22/2005-7/18/2007 184,704 184,726 1.6
to 2.2 15Y
Government-guaranteed bonds issued by the Predecessor (international) Euro-sterling bonds (Series 4), Global-yen bonds (Series 5), etc.
8/9/1999-6/25/2008 724,131
594,406[GBP 150 million]
[USD 2,200 million][EUR 900 million]
(122,040)
1.9 to 5.75
10Y to 20Y
Non-guaranteed bonds issued by the Predecessor (domestic) 10-year bonds (Series 7-30)
9/19/2003-6/16/2008 929,908 809,940
(220,000)1.31
to 2.07 10Y
Non-guaranteed bonds issued by the Predecessor (domestic) 20-year bonds (Series 1-25)
7/30/2002-6/16/2008 569,686 569,710 1.03
to 2.58 20Y
Non-guaranteed bonds issued by the Predecessor (domestic) 30-year bonds (Series 1-10)
1/29/2004-9/20/2006 189,867 189,873 2.39
to 2.95 30Y
Non-guaranteed bonds issued by the Predecessor (domestic) Floating rate bonds (Series 1)
10/31/2002 20,000 20,000 Floating rate 15Y
Non-guaranteed bonds issued by the Predecessor (domestic) Inflation-indexed bonds (Series 1, 2)
3/2/2005-7/19/2005 40,000 40,000
(20,000)0.45
to 0.47 10Y
Non-guaranteed bonds issued by the Predecessor (domestic) Bonds with scheduled repayment (Series 1-3)
2/14/2003-6/9/2004 39,150 36,980
(2,170)1.39
to 2.01 28Y
Non-guaranteed bonds issued by the Predecessor (domestic) CMS-linked floating rate bonds (Series 1)
9/13/2006 20,000 20,000 Floating rate 10Y
Non-guaranteed bonds issued by the Predecessor (domestic) Private placements with Pension Fund Association for Local Government Officials (Series Special No.1-5–No.1-31)
5/28/2003-7/31/2008 1,940,500 1,458,500
(408,000)0.67
to 2.18 10Y
Bonds issued by the Predecessor - Sub-total - 9,570,594 7,442,673(1,908,670) - -
Total - ¥18,676,401 ¥19,423,743(1,952,196) - -
Notes: 1. Pursuant to the provisions of Article 40, Section 2 of the Law, JFM’s total assets are pledged as general collateral for JFM bonds in the amount of 19,423,743 million yen as of 31 March 2014.
2. Amounts in square brackets under “Balance as of 31 March 2014” for “Government-guaranteed bonds issued by JFM (international)—Global U.S. dollar bonds (Series 1),” “Non-guaranteed bonds issued by JFM (international)—Private placements (Series 2, 3, 7, 14-16, 19, 28, 31, 33-35, 40-42),” “Non-guaranteed bonds issued by JFM (international)—Private placements (Floater, Series 1, 4-6, 8-13, 17, 18, 20-27, 29, 30, 32, 36-39)” and “Government-guaranteed bonds issued by the Predecessor (international)—Euro-sterling bonds (Series 4), Global-yen bonds (Series 5), etc.” are denominated in foreign currencies.
3. Amounts in parentheses under “Balance as of 31 March 2014” are to be repaid within one year.4. Annual schedule of redemption within five years after the fiscal year-end:
Financial Statements
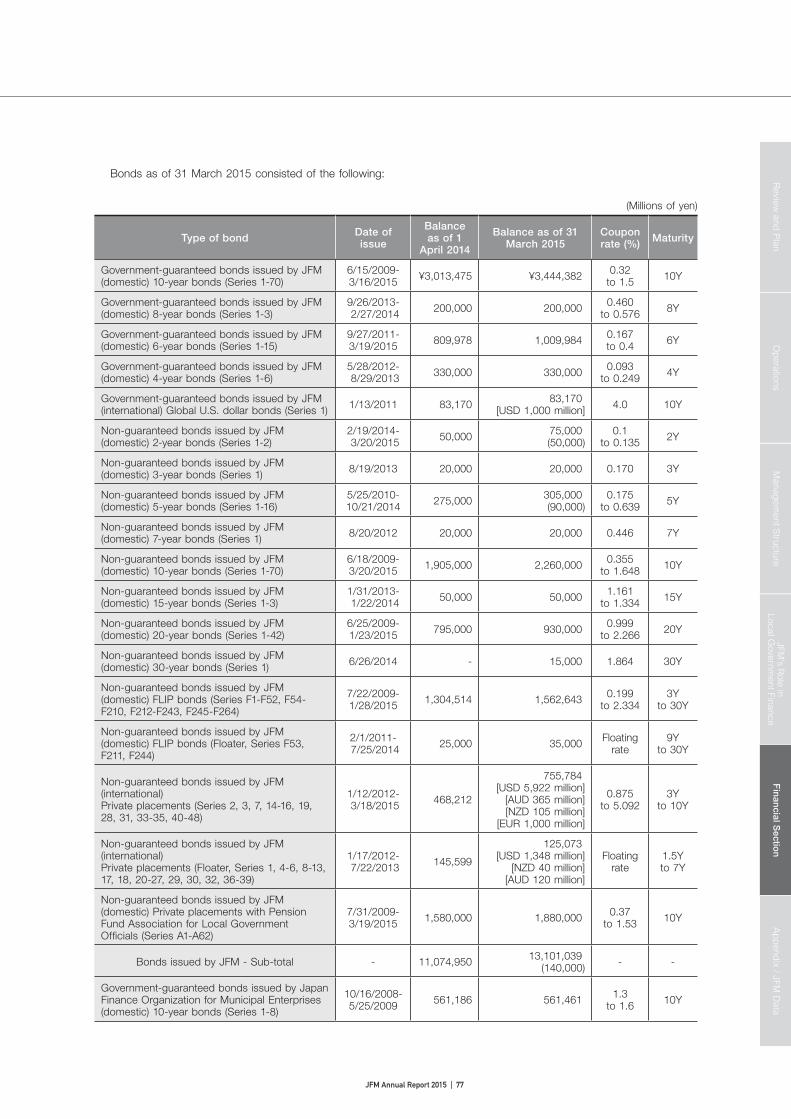
JFM Annual Report 2015 | 77
Review
and P
lanO
perations
Manag
ement S
tructureJFM
’s Role in
Local Governm
ent FinanceF
inan
cial Sectio
nA
pp
endix / JFM
Data
Bonds as of 31 March 2015 consisted of the following:
(Millions of yen)
Type of bond Date of issue
Balance as of 1
April 2014
Balance as of 31 March 2015
Coupon rate (%) Maturity
Government-guaranteed bonds issued by JFM (domestic) 10-year bonds (Series 1-70)
6/15/2009-3/16/2015 ¥3,013,475 ¥3,444,382 0.32
to 1.5 10Y
Government-guaranteed bonds issued by JFM (domestic) 8-year bonds (Series 1-3)
9/26/2013- 2/27/2014 200,000 200,000 0.460
to 0.576 8Y
Government-guaranteed bonds issued by JFM (domestic) 6-year bonds (Series 1-15)
9/27/2011-3/19/2015 809,978 1,009,984 0.167
to 0.4 6Y
Government-guaranteed bonds issued by JFM (domestic) 4-year bonds (Series 1-6)
5/28/2012- 8/29/2013 330,000 330,000 0.093
to 0.249 4Y
Government-guaranteed bonds issued by JFM (international) Global U.S. dollar bonds (Series 1) 1/13/2011 83,170 83,170
[USD 1,000 million] 4.0 10Y
Non-guaranteed bonds issued by JFM(domestic) 2-year bonds (Series 1-2)
2/19/2014- 3/20/2015 50,000 75,000
(50,000)0.1
to 0.135 2Y
Non-guaranteed bonds issued by JFM(domestic) 3-year bonds (Series 1) 8/19/2013 20,000 20,000 0.170 3Y
Non-guaranteed bonds issued by JFM(domestic) 5-year bonds (Series 1-16)
5/25/2010-10/21/2014 275,000 305,000
(90,000)0.175
to 0.639 5Y
Non-guaranteed bonds issued by JFM(domestic) 7-year bonds (Series 1) 8/20/2012 20,000 20,000 0.446 7Y
Non-guaranteed bonds issued by JFM(domestic) 10-year bonds (Series 1-70)
6/18/2009-3/20/2015 1,905,000 2,260,000 0.355
to 1.648 10Y
Non-guaranteed bonds issued by JFM(domestic) 15-year bonds (Series 1-3)
1/31/2013- 1/22/2014 50,000 50,000 1.161
to 1.334 15Y
Non-guaranteed bonds issued by JFM(domestic) 20-year bonds (Series 1-42)
6/25/2009-1/23/2015 795,000 930,000 0.999
to 2.266 20Y
Non-guaranteed bonds issued by JFM(domestic) 30-year bonds (Series 1) 6/26/2014 - 15,000 1.864 30Y
Non-guaranteed bonds issued by JFM(domestic) FLIP bonds (Series F1-F52, F54-F210, F212-F243, F245-F264)
7/22/2009-1/28/2015 1,304,514 1,562,643 0.199
to 2.3343Y
to 30Y
Non-guaranteed bonds issued by JFM(domestic) FLIP bonds (Floater, Series F53, F211, F244)
2/1/2011- 7/25/2014 25,000 35,000 Floating
rate9Y
to 30Y
Non-guaranteed bonds issued by JFM(international) Private placements (Series 2, 3, 7, 14-16, 19, 28, 31, 33-35, 40-48)
1/12/2012- 3/18/2015 468,212
755,784 [USD 5,922 million]
[AUD 365 million][NZD 105 million]
[EUR 1,000 million]
0.875to 5.092
3Yto 10Y
Non-guaranteed bonds issued by JFM(international)Private placements (Floater, Series 1, 4-6, 8-13, 17, 18, 20-27, 29, 30, 32, 36-39)
1/17/2012- 7/22/2013 145,599
125,073 [USD 1,348 million]
[NZD 40 million][AUD 120 million]
Floating rate
1.5Yto 7Y
Non-guaranteed bonds issued by JFM(domestic) Private placements with Pension Fund Association for Local Government Offi cials (Series A1-A62)
7/31/2009-3/19/2015 1,580,000 1,880,000 0.37
to 1.53 10Y
Bonds issued by JFM - Sub-total - 11,074,950 13,101,039(140,000) - -
Government-guaranteed bonds issued by Japan Finance Organization for Municipal Enterprises (domestic) 10-year bonds (Series 1-8)
10/16/2008-5/25/2009 561,186 561,461 1.3
to 1.6 10Y

JFM Annual Report 2015 | 78
Financial Section
FinancialSection
Non-guaranteed bonds issued by Japan Finance Organization for Municipal Enterprises (domestic)10-year bonds (Series 1-4)
11/25/2008-5/28/2009 139,977 139,981 1.59
to 1.77 10Y
Non-guaranteed bonds issued by Japan Finance Organization for Municipal Enterprises (domestic)20-year bonds (Series 1, 2)
1/26/2009-4/30/2009 84,955 84,958 2.07
to 2.29 20Y
Non-guaranteed bonds issued by Japan Finance Organization for Municipal Enterprises (domestic)Private placements with Pension Fund Association for Local Government Officials (Series A1, A2)
4/30/2009-5/26/2009 120,000 120,000 1.69
to 1.73 10Y
Bonds issued by Japan Finance Organization for Municipal Enterprises - Sub-total - 906,119 906,401 - -
Government-guaranteed bonds issued by the Predecessor (domestic)10-year bonds (Series 838-886)
4/26/2004-6/19/2008 3,518,536 2,383,168
(914,080)1.2
to 2.0 10Y
Government-guaranteed bonds issued by the Predecessor (domestic)15-year bonds (Series 1-5)
6/22/2005-7/18/2007 184,726 184,749 1.6
to 2.2 15Y
Government-guaranteed bonds issued by the Predecessor (international)Euro-sterling bonds (Series 4), Global-yen bonds (Series 5), etc.
8/9/1999-6/25/2008 594,406
472,614[GBP 150 million]
[USD 2,200 million](129,720)
1.9to 5.75
10Yto 20Y
Non-guaranteed bonds issued by the Predecessor (domestic)10-year bonds (Series 10-30)
6/18/2004-6/16/2008 809,940 589,966
(190,000)1.33
to 2.07 10Y
Non-guaranteed bonds issued by the Predecessor (domestic)20-year bonds (Series 1-25)
7/30/2002-6/16/2008 569,710 569,735 1.03
to 2.58 20Y
Non-guaranteed bonds issued by the Predecessor (domestic)30-year bonds (Series 1-10)
1/29/2004-9/20/2006 189,873 189,879 2.39
to 2.95 30Y
Non-guaranteed bonds issued by the Predecessor (domestic)Floating rate bonds (Series 1)
10/31/2002 20,000 20,000 Floatingrate 15Y
Non-guaranteed bonds issued by the Predecessor (domestic)Inflation-indexed bonds (Series 1, 2)
3/2/2005-7/19/2005 40,000 20,000
(20,000)0.45
to 0.47 10Y
Non-guaranteed bonds issued by the Predecessor (domestic)Bonds with scheduled repayment (Series 1-3)
2/14/2003-6/9/2004 36,980 34,810
(2,170)1.39
to 2.01 28Y
Non-guaranteed bonds issued by the Predecessor (domestic)CMS-linked floating rate bonds (Series 1)
9/13/2006 20,000 20,000 Floatingrate 10Y
Non-guaranteed bonds issued by the Predecessor (domestic)Private placements with Pension Fund Association for Local Government Officials (Series Special No.1-10–No.1-31)
6/24/2004-7/31/2008 1,458,500 1,050,500
(335,000)1.32
to 2.18 10Y
Bonds issued by the Predecessor - Sub-total - 7,442,673 5,535,423(1,590,970) - -
Total - ¥19,423,743 ¥19,542,864(1,730,970) - -
Financial Statements

JFM Annual Report 2015 | 79
Review
and P
lanO
perations
Manag
ement S
tructureJFM
’s Role in
Local Governm
ent FinanceF
inan
cial Sectio
nA
pp
endix / JFM
Data
(Thousands of U.S. dollars)
Type of bond Date of issue
Balance as of 1
April 2014
Balance as of 31 March 2015
Coupon rate (%) Maturity
Government-guaranteed bonds issued by JFM (domestic) 10-year bonds (Series 1-70)
6/15/2009-3/16/2015 $25,035,101 $28,614,959 0.32
to 1.5 10Y
Government-guaranteed bonds issued by JFM (domestic) 8-year bonds (Series 1-3)
9/26/2013- 2/27/2014 1,661,544 1,661,544 0.460
to 0.576 8Y
Government-guaranteed bonds issued by JFM (domestic) 6-year bonds (Series 1-15)
9/27/2011- 3/19/2015 6,729,071 8,390,670 0.167
to 0.4 6Y
Government-guaranteed bonds issued by JFM (domestic) 4-year bonds (Series 1-6)
5/28/2012- 8/29/2013 2,741,547 2,741,547 0.093
to 0.249 4Y
Government-guaranteed bonds issued by JFM (international) Global U.S. dollar bonds (Series 1) 1/13/2011 690,953 690,953
[USD 1,000 million] 4.0 10Y
Non-guaranteed bonds issued by JFM(domestic) 2-year bonds (Series 1-2)
2/19/2014- 3/20/2015 415,386 623,079
(415,386)0.1
to 0.135 2Y
Non-guaranteed bonds issued by JFM(domestic) 3-year bonds (Series 1) 8/19/2013 166,154 166,154 0.170 3Y
Non-guaranteed bonds issued by JFM(domestic) 5-year bonds (Series 1-16)
5/25/2010-10/21/2014 2,284,622 2,533,854
(747,695)0.175
to 0.639 5Y
Non-guaranteed bonds issued by JFM(domestic) 7-year bonds (Series 1) 8/20/2012 166,154 166,154 0.446 7Y
Non-guaranteed bonds issued by JFM(domestic) 10-year bonds (Series 1-70)
6/18/2009-3/20/2015 15,826,203 18,775,442 0.355
to 1.648 10Y
Non-guaranteed bonds issued by JFM(domestic) 15-year bonds (Series 1-3)
1/31/2013- 1/22/2014 415,386 415,386 1.161
to 1.334 15Y
Non-guaranteed bonds issued by JFM(domestic) 20-year bonds (Series 1-42)
6/25/2009-1/23/2015 6,604,636 7,726,178 0.999
to 2.266 20Y
Non-guaranteed bonds issued by JFM(domestic) 30-year bonds (Series 1) 6/26/2014 - 124,616 1.864 30Y
Non-guaranteed bonds issued by JFM (domestic) FLIP bonds (Series F1-F52, F54-F210, F212-F243, F245-F264)
7/22/2009-1/28/2015 10,837,536 12,982,000 0.199
to 2.3343Y
to 30Y
Non-guaranteed bonds issued by JFM (domestic) FLIP bonds (Floater, Series F53, F211, F244)
2/1/2011-7/25/2014 207,693 290,770 Floating
rate9Y
to 30Y
Non-guaranteed bonds issued by JFM(international) Private placements (Series 2, 3, 7, 14-16, 19, 28, 31, 33-35, 40-48)
1/12/2012-3/18/2015 3,889,780
6,278,846 [USD 5,922 million]
[AUD 365 million][NZD 105 million]
[EUR 1,000 million]
0.875to 5.092
3Yto 10Y
Non-guaranteed bonds issued by JFM(international)Private placements (Floater, Series 1, 4-6, 8-13, 17, 18, 20-27, 29, 30, 32, 36-39)
1/17/2012- 7/22/2013 1,209,603
1,039,079 [USD 1,348 million]
[NZD 40 million][AUD 120 million]
Floating rate
1.5Yto 7Y
Non-guaranteed bonds issued by JFM(domestic) Private placements with Pension Fund Association for Local Government Offi cials (Series A1-A62)
7/31/2009-3/19/2015 13,126,194 15,618,510 0.37
to 1.53 10Y
Bonds issued by JFM - Sub-total - 92,007,563 108,839,741 (1,163,081) - -
Government-guaranteed bonds issued by Japan Finance Organization for Municipal Enterprises (domestic) 10-year bonds (Series 1-8)
10/16/2008-5/25/2009 4,662,179 4,664,461 1.3
to 1.6 10Y
Non-guaranteed bonds issued by Japan Finance Organization for Municipal Enterprises (domestic)10-year bonds (Series 1-4)
11/25/2008-5/28/2009 1,162,890 1,162,931 1.59
to 1.77 10Y

JFM Annual Report 2015 | 80
Financial Section
FinancialSection
Non-guaranteed bonds issued by Japan Finance Organization for Municipal Enterprises (domestic) 20-year bonds (Series 1, 2)
1/26/2009-4/30/2009 705,788 705,813 2.07
to 2.29 20Y
Non-guaranteed bonds issued by Japan Finance Organization for Municipal Enterprises (domestic) Private placements with Pension Fund Association for Local Government Officials (Series A1, A2)
4/30/2009-5/26/2009 996,926 996,926 1.69
to 1.73 10Y
Bonds issued by Japan Finance Organization for Municipal Enterprises - Sub-total - 7,527,783 7,530,131 - -
Government-guaranteed bonds issued by the Predecessor (domestic)10-year bonds (Series 838-886)
4/26/2004-6/19/2008 29,231,007 19,798,693
(7,593,919)1.2
to 2.0 10Y
Government-guaranteed bonds issued by the Predecessor (domestic)15-year bonds (Series 1-5)
6/22/2005-7/18/2007 1,534,657 1,534,843 1.6
to 2.2 15Y
Government-guaranteed bonds issued by the Predecessor (international) Euro-sterling bonds (Series 4), Global-yen bonds (Series 5), etc.
8/9/1999-6/25/2008 4,938,158
3,926,346 [GBP 150 million]
[USD 2,200 million](1,077,677)
1.9to 5.75
10Yto 20Y
Non-guaranteed bonds issued by the Predecessor (domestic)10-year bonds (Series 10-30)
6/18/2004-6/16/2008 6,728,758 4,901,276
(1,578,466)1.33
to 2.07 10Y
Non-guaranteed bonds issued by the Predecessor (domestic)20-year bonds (Series 1-25)
7/30/2002-6/16/2008 4,732,996 4,733,202 1.03
to 2.58 20Y
Non-guaranteed bonds issued by the Predecessor (domestic)30-year bonds (Series 1-10)
1/29/2004-9/20/2006 1,577,413 1,577,464 2.39
to 2.95 30Y
Non-guaranteed bonds issued by the Predecessor (domestic)Floating rate bonds (Series 1)
10/31/2002 166,154 166,154 Floatingrate 15Y
Non-guaranteed bonds issued by the Predecessor (domestic)Inflation-indexed bonds (Series 1, 2)
3/2/2005-7/19/2005 332,309 166,154
(166,154)0.45
to 0.47 10Y
Non-guaranteed bonds issued by the Predecessor (domestic)Bonds with scheduled repayment (Series 1-3)
2/14/2003-6/9/2004 307,219 289,192
(18,028)1.39
to 2.01 28Y
Non-guaranteed bonds issued by the Predecessor (domestic)CMS-linked floating rate bonds (Series 1)
9/13/2006 166,154 166,154 Floatingrate 10Y
Non-guaranteed bonds issued by the Predecessor (domestic) Private placements with Pension Fund Association for Local Government Officials (Series Special No.1-10–No.1-31)
6/24/2004-7/31/2008 12,116,807 8,727,258
(2,783,085)1.32
to 2.18 10Y
Bonds issued by the Predecessor - Sub-total - 61,831,632 45,986,736 (13,217,329) - -
Total - $161,366,978 $162,356,608 (14,380,410) - -
Notes: 1. Pursuant to the provisions of Article 40, Section 2 of the Law, JFM’s total assets are pledged as general collateral for JFM bonds in the amount of 19,542,864 million yen (162,356,608 thousand U.S. dollars) as of 31 March 2015.
2. Amounts in square brackets under “Balance as of 31 March 2015” for “Government-guaranteed bonds issued by JFM (international)—Global U.S. dollar bonds (Series 1),” “Non-guaranteed bonds issued by JFM (international)—Private placements (Series 2, 3, 7, 14-16, 19, 28, 31, 33-35, 40-48),” “Non-guaranteed bonds issued by JFM (international)—Private placements (Floater, Series 1, 4-6, 8-13, 17, 18, 20-27, 29, 30, 32, 36-39)” and “Government-guaranteed bonds issued by the Predecessor (international)—Euro-sterling bonds (Series 4), Global-yen bonds (Series 5), etc.” are denominated in foreign currencies.
3. Amounts in parentheses under “Balance as of 31 March 2015” are to be repaid within one year.4. Annual schedule of redemption within five years after the fiscal year-end:
Financial Statements

JFM Annual Report 2015 | 81
Review
and P
lanO
perations
Manag
ement S
tructureJFM
’s Role in
Local Governm
ent FinanceF
inan
cial Sectio
nA
pp
endix / JFM
Data
As of 31 March 2014
Within 1 year After 1 year through 2 years
After 2 years through 3 years
After 3 years through 4 years
After 4 years through 5 years
Bonds ¥1,952,196 ¥1,730,970 ¥1,822,228 ¥1,736,489 ¥1,804,268
(Millions of yen)
As of 31 March 2015
Within 1 year After 1 year through 2 years
After 2 years through 3 years
After 3 years through 4 years
After 4 years through 5 years
Bonds ¥1,730,970 ¥1,847,228 ¥1,745,824 ¥1,804,268 ¥2,055,327
(Millions of yen)
Within 1 year After 1 year through 2 years
After 2 years through 3 years
After 3 years through 4 years
After 4 years through 5 years
Bonds $14,380,410 $15,346,257 $14,503,821 $14,989,355 $17,075,081
(Thousands of U.S. dollars)
11. Borrowed MoneyBorrowed money as of 31 March 2014 consisted of the following:
(Millions of yen)
Classifi cation of borrowed money Balance as of1 April 2013
Balance as of31 March 2014
Average interest rate (%)
Repayment date
Short-term borrowed money ¥- ¥20,000 0.150 -
Long-term borrowed money (repayment within 1 year) - - - -
Long-term borrowed money (excluding repayment within 1 year) 30,000 75,500 0.709 3/26/2019~
3/13/2024
Total ¥30,000 ¥95,500 - -
Borrowed money as of 31 March 2015 consisted of the following:
(Millions of yen)
Classifi cation of borrowed money Balance as of1 April 2014
Balance as of31 March 2015
Average interest rate (%)
Repayment date
Short-term borrowed money ¥20,000 - - -
Long-term borrowed money (repayment within 1 year) - - - -
Long-term borrowed money (excluding repayment within 1 year) 75,500 85,500 0.675 3/26/2019~
3/13/2024
Total ¥95,500 ¥85,500 - -
(Thousands of U.S. dollars)
Classifi cation of borrowed money Balance as of1 April 2014
Balance as of31 March 2015
Average interest rate (%)
Repayment date
Short-term borrowed money $166,154 - - -
Long-term borrowed money (repayment within 1 year) - - - -
Long-term borrowed money (excluding repayment within 1 year) 627,233 $710,310 0.675 3/26/2019~
3/13/2024
Total $793,387 $710,310 - -

JFM Annual Report 2015 | 82
Financial Section
FinancialSection
Notes: 1. Average interest rates are calculated by dividing the total amount of interest paid by the total amount of principal multiplied by repayment years.
2. Annual schedule of repayments within five years after the fiscal year-end:
As of 31 March 2014
Within 1 year After 1 year through 2 years
After 2 years through 3 years
After 3 years through 4 years
After 4 years through 5 years
Borrowed money ¥20,000 ¥- ¥- ¥- ¥30,000
(Millions of yen)
As of 31 March 2015
Within 1 year After 1 year through 2 years
After 2 years through 3 years
After 3 years through 4 years
After 4 years through 5 years
Borrowed money ¥- ¥- ¥- ¥30,000 ¥10,000
(Millions of yen)
Within 1 year After 1 year through 2 years
After 2 years through 3 years
After 3 years through 4 years
After 4 years through 5 years
Borrowed money $- $- $- $249,232 $83,077
(Thousands of U.S. dollars)
12. ReservesReserves as of 31 March 2014 consisted of the following:
(Millions of yen)
Classification of reserveBalance
as of1 April 2013
Increaseduring the
year
Decrease during the year Balance as of
31 March 2014
Intended purpose Other
Reserve for bonuses ¥47 ¥50 ¥47 ¥- ¥50
Reserve for bonuses for directors and corporate auditors 5 7 5 - 7
Reserve for retirement benefits 141 12 28 9 116
Reserve for retirement benefits for directors and corporate auditors 27 6 3 7 22
Reserves as of 31 March 2015 consisted of the following:
(Millions of yen)
Classification of reserveBalance
as of1 April 2014
Increaseduring the
year
Decrease during the year Balance as of
31 March 2015
Intended purpose Other
Reserve for bonuses ¥50 ¥50 ¥50 ¥- ¥50
Reserve for bonuses for directors and corporate auditors 7 7 7 - 7
Reserve for retirement benefits 116 1 0 75 41
Reserve for retirement benefits for directors and corporate auditors 22 6 1 4 22
Financial Statements

JFM Annual Report 2015 | 83
Review
and P
lanO
perations
Manag
ement S
tructureJFM
’s Role in
Local Governm
ent FinanceF
inan
cial Sectio
nA
pp
endix / JFM
Data
(Thousands of U.S. dollars)
Classifi cation of reserveBalance
as of1 April 2014
Increaseduring the
year
Decrease during the year Balance as of
31 March 2015
Intended purpose Other
Reserve for bonuses $422 $421 $422 $- $421
Reserve for bonuses for directors and corporate auditors 61 63 61 - 63
Reserve for retirement benefi ts 966 11 2 627 348
Reserve for retirement benefi ts for directors and corporate auditors 190 53 14 39 190
13. Reserve for Interest Rate VolatilityReserve for interest rate volatility as of 31 March 2014 consisted of the following:
(Millions of yen)
Classifi cation of reserve
Balance as of
1 April 2013
Increase during the year Decrease during the year Balance as of
31 March 2014
Amount provided
Amountwithdrawn
Reserve for interest rate volatility ¥1,100,000 ¥220,000 ¥220,000 ¥- ¥1,320,000
Management account reserve forinterest rate volatility 2,771,200 171,744 171,744 870,000 220,000 2,072,945
Total ¥3,871,200 ¥391,744 ¥391,744 ¥870,000 ¥220,000 ¥3,392,945
Reserve for interest rate volatility as of 31 March 2015 consisted of the following:
(Millions of yen)
Classifi cation of reserve
Balance as of
1 April 2014
Increase during the year Decrease during the year Balance as of
31 March 2015
Amount provided
Amountwithdrawn
Reserve for interest rate volatility ¥1,320,000 ¥220,000 ¥220,000 ¥- ¥1,540,000
Management account reserve forinterest rate volatility 2,072,945 158,570 158,570 220,000 220,000 2,011,515
Total ¥3,392,945 ¥378,570 ¥378,570 ¥220,000 ¥220,000 ¥3,551,515
(Thousands of U.S. dollars)
Classifi cation of reserve
Balance as of
1 April 2014
Increase during the year Decrease during the year Balance as of
31 March 2015
Amount provided
Amountwithdrawn
Reserve for interest rate volatility $10,966,187 $1,827,698 $1,827,698 $- $12,793,885
Management account reserve forinterest rate volatility 17,221,443 1,317,357 1,317,357 1,827,698 1,827,698 16,711,102
Total $28,187,630 $3,145,055 $3,145,055 $1,827,698 $1,827,698 $29,504,987
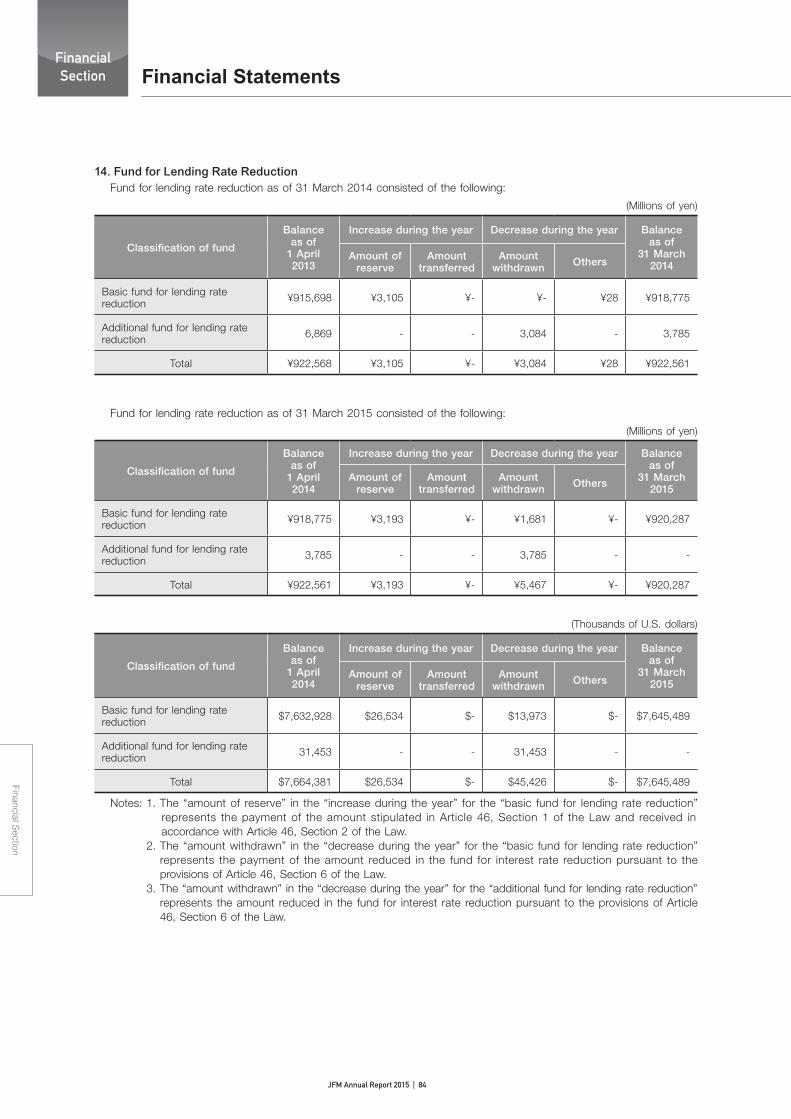
JFM Annual Report 2015 | 84
Financial Section
FinancialSection
14. Fund for Lending Rate ReductionFund for lending rate reduction as of 31 March 2014 consisted of the following:
(Millions of yen)
Classification of fund
Balance as of
1 April 2013
Increase during the year Decrease during the year Balance as of
31 March 2014
Amount of reserve
Amount transferred
Amountwithdrawn Others
Basic fund for lending rate reduction ¥915,698 ¥3,105 ¥- ¥- ¥28 ¥918,775
Additional fund for lending rate reduction 6,869 - - 3,084 - 3,785
Total ¥922,568 ¥3,105 ¥- ¥3,084 ¥28 ¥922,561
Fund for lending rate reduction as of 31 March 2015 consisted of the following:
(Millions of yen)
Classification of fund
Balance as of
1 April 2014
Increase during the year Decrease during the year Balance as of
31 March 2015
Amount of reserve
Amount transferred
Amountwithdrawn Others
Basic fund for lending rate reduction ¥918,775 ¥3,193 ¥- ¥1,681 ¥- ¥920,287
Additional fund for lending rate reduction 3,785 - - 3,785 - -
Total ¥922,561 ¥3,193 ¥- ¥5,467 ¥- ¥920,287
(Thousands of U.S. dollars)
Classification of fund
Balance as of
1 April 2014
Increase during the year Decrease during the year Balance as of
31 March 2015
Amount of reserve
Amount transferred
Amountwithdrawn Others
Basic fund for lending rate reduction $7,632,928 $26,534 $- $13,973 $- $7,645,489
Additional fund for lending rate reduction 31,453 - - 31,453 - -
Total $7,664,381 $26,534 $- $45,426 $- $7,645,489
Notes: 1. The “amount of reserve” in the “increase during the year” for the “basic fund for lending rate reduction” represents the payment of the amount stipulated in Article 46, Section 1 of the Law and received in accordance with Article 46, Section 2 of the Law.
2. The “amount withdrawn” in the “decrease during the year” for the “basic fund for lending rate reduction” represents the payment of the amount reduced in the fund for interest rate reduction pursuant to the provisions of Article 46, Section 6 of the Law.
3. The “amount withdrawn” in the “decrease during the year” for the “additional fund for lending rate reduction” represents the amount reduced in the fund for interest rate reduction pursuant to the provisions of Article 46, Section 6 of the Law.
Financial Statements

JFM Annual Report 2015 | 85
Review
and P
lanO
perations
Manag
ement S
tructureJFM
’s Role in
Local Governm
ent FinanceF
inan
cial Sectio
nA
pp
endix / JFM
Data
15. Reserve for Retirement Benefi tsAs of and for the year ended 31 March 2014(1) Outline of retirement benefi ts system
JFM has a defi ned benefi t plan that contributes to the Employees’ Pension Fund and offers lump-sum payments upon retirement of employees. The reserve for retirement benefi ts and pension expenses are calculated using the simplifi ed method.
(2) Defi ned benefi t plan(a) Reconciliation of outstanding amounts of reserve for retirement benefi ts:
Reserve for retirement benefi ts at the beginning of the fi scal year: 141 million yenPension expenses: 12 million yenEmployee retirement benefi ts paid: (28) million yenContributions to the defi ned benefi t plan: (9) million yenReserve for retirement benefi ts at the end of the fi scal year: 116 million yen
(b) Retirement benefi t obligation, plan assets, and reconciliation of retirement benefi t asset and liabilityFunded retirement benefi t obligation: 305 million yenPlan assets: (218) million yenBalance: 87 million yenUnfunded retirement benefi t obligation: 29 million yenNet liability for retirement benefi ts in the balance sheet: 116 million yenReserve for retirement benefi ts at the end of the fi scal year: 116 million yenNet liability for retirement benefi ts in the balance sheet: 116 million yen
(c) Profi t and loss associated with employee retirement benefi tsPension expenses calculated based on the simplifi ed method: 12 million yen
As of and for the year ended 31 March 2015(1) Outline of retirement benefi ts system
JFM has a defined benefit plan that contributes to the Corporate Pension Fund and offers lump-sum payments upon retirement of employees and a defined contribution plan. The reserve for retirement benefits and pension expenses are calculated using the simplifi ed method.
(2) Defi ned benefi t plan(a) Reconciliation of outstanding amounts of reserve for retirement benefi ts:
Reserve for retirement benefi ts at the beginning of the fi scal year: 116 million yen (966 thousand U.S. dollars)Pension expenses: (5) million yen ((48) thousand U.S. dollars)Employee retirement benefi ts paid: (0) million yen ((2) thousand U.S. dollars)Contributions to the defi ned benefi t plan: (68) million yen ((568) thousand U.S. dollars)Reserve for retirement benefi ts at the end of the fi scal year: 41 million yen (348 thousand U.S. dollars)
(b) Retirement benefi t obligation, plan assets, and reconciliation of retirement benefi t asset and liabilityFunded retirement benefi t obligation: 278 million yen (2,317 thousand U.S. dollars)Plan assets: (267) million yen ((2,220) thousand U.S. dollars)Balance: 11 million yen (96 thousand U.S. dollars)Unfunded retirement benefi t obligation: 30 million yen (252 thousand U.S. dollars)Net liability for retirement benefi ts in the balance sheet: 41 million yen (348 thousand U.S. dollars)Reserve for retirement benefi ts at the end of the fi scal year: 41 million yen (348 thousand U.S. dollars)Net liability for retirement benefi ts in the balance sheet: 41 million yen (348 thousand U.S. dollars)
(c) Profi t and loss associated with employee retirement benefi tsPension expenses calculated based on the simplifi ed method: (5) million yen ((48) thousand U.S. dollars)
16. Net Income by Account(For the year ended 31 March 2014)
Net income of the general account was 26,510 million yen, while there was no net income of management account.
(For the year ended 31 March 2015)Net income of the general account was 30,971 million yen (257,299 thousand U.S. dollars), while there was no net income of management account.

JFM Annual Report 2015 | 86
Financial Section
FinancialSection
17. Information by Account (Balance sheets)Balance sheets of general account and management account as of 31 March 2014 were as follows:
(Millions of yen)
Item General account
Managementaccount Offset Total
(Assets)
Loans ¥9,178,637 ¥13,904,339 ¥23,082,976
Securities 533,998 533,998
Cash and bank deposits 467,175 467,175
Cash collateral paid for financial instruments 370 370
Other assets 3,524 9,512 13,036
Tangible fixed assets 2,836 2,836
Intangible fixed assets 938 938
Due from general account 923,486 ¥(923,486)
Due to management account for fund for lending rate reduction 192,831 (192,831)
Total assets 10,380,311 14,837,337 (1,116,317) 24,101,331
(Liabilities)
Bonds 6,983,259 12,440,483 19,423,743
Borrowed money 95,500 95,500
Cash collateral received for financial instruments 43,530 43,530
Other liabilities 2,667 11,729 14,397
Reserve for bonuses 50 50
Reserve for bonuses for directors and corporate auditors 7 7
Reserve for retirement benefits 116 116
Reserve for retirement benefits for directors and corporate auditors 22 22
Fund for lending rate reduction 922,561 922,561
Basic fund for lending rate reduction 918,775 918,775
Additional fund for lending rate reduction 3,785 3,785
Due to management account 923,486 (923,486)
Due from general account for fund for lending rate reduction 192,831 (192,831)
Reserves under special laws 1,320,000 2,138,627 3,458,627
Reserve for interest rate volatility 1,320,000 1,320,000
Management account reserve for interest rate volatility 2,072,945 2,072,945
Reserve for interest rate reduction 65,681 65,681
Total liabilities 10,291,202 14,783,671 (1,116,317) 23,958,556
(Net Assets)
Capital 16,602 16,602
Retained earnings 76,732 76,732
General account surplus reserve 76,732 76,732
Valuation, translation adjustments and others (4,225) (4,225)
Management account surplus reserve 53,666 53,666
Total net assets 89,109 53,666 142,775
Total liabilities and net assets ¥10,380,311 ¥14,837,337 ¥(1,116,317) ¥24,101,331
Financial Statements

JFM Annual Report 2015 | 87
Review
and P
lanO
perations
Manag
ement S
tructureJFM
’s Role in
Local Governm
ent FinanceF
inan
cial Sectio
nA
pp
endix / JFM
Data
Balance sheets of general account and management account as of 31 March 2015 were as follows:
(Millions of yen)
Item General account
Managementaccount Offset Total
(Assets)
Loans ¥10,868,072 ¥12,569,557 ¥23,437,630
Securities 670,000 670,000
Cash and bank deposits 399,211 399,211
Cash collateral paid for fi nancial instruments 437 437
Other assets 3,935 8,449 12,384
Tangible fi xed assets 2,840 2,840
Intangible fi xed assets 1,776 1,776
Due from general account 810,328 ¥(810,328)
Due to management account for fund for lending rate reduction 92,831 (92,831)
Total assets 12,039,104 13,388,335 (903,160) 24,524,279
(Liabilities)
Bonds 8,378,442 11,164,422 19,542,864
Borrowed money 85,500 85,500
Cash collateral received for fi nancial instruments 182,246 182,246
Other liabilities 2,352 9,348 11,700
Reserve for bonuses 50 50
Reserve for bonuses for directors and corporate auditors 7 7
Reserve for retirement benefi ts 41 41
Reserve for retirement benefi ts for directors and corporate auditors 22 22
Fund for lending rate reduction 920,287 920,287
Basic fund for lending rate reduction 920,287 920,287
Due to management account 810,328 (810,328)
Due from general account for fund for lending rate reduction 92,831 (92,831)
Reserves under special laws 1,540,000 2,068,067 3,608,067
Reserve for interest rate volatility 1,540,000 1,540,000
Management account reserve for interest rate volatility 2,011,515 2,011,515
Reserve for interest rate reduction 56,552 56,552
Total liabilities 11,919,280 13,334,669 (903,160) 24,350,790
(Net Assets)
Capital 16,602 16,602
Retained earnings 107,703 107,703
General account surplus reserve 107,703 107,703
Valuation, translation adjustments and others (4,482) (4,482)
Management account surplus reserve 53,666 53,666
Total net assets 119,823 53,666 173,489
Total liabilities and net assets ¥12,039,104 ¥13,388,335 ¥(903,160) ¥24,524,279
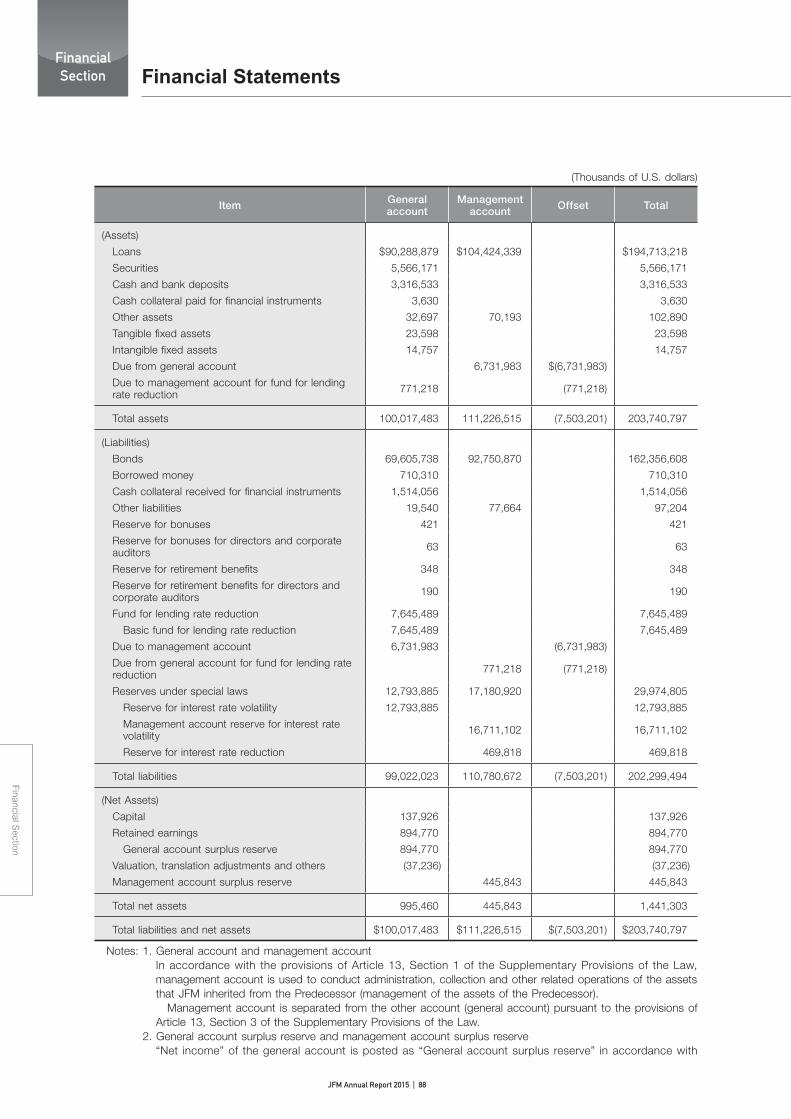
JFM Annual Report 2015 | 88
Financial Section
FinancialSection
(Thousands of U.S. dollars)
Item General account
Managementaccount Offset Total
(Assets)
Loans $90,288,879 $104,424,339 $194,713,218
Securities 5,566,171 5,566,171
Cash and bank deposits 3,316,533 3,316,533
Cash collateral paid for financial instruments 3,630 3,630
Other assets 32,697 70,193 102,890
Tangible fixed assets 23,598 23,598
Intangible fixed assets 14,757 14,757
Due from general account 6,731,983 $(6,731,983)
Due to management account for fund for lending rate reduction 771,218 (771,218)
Total assets 100,017,483 111,226,515 (7,503,201) 203,740,797
(Liabilities)
Bonds 69,605,738 92,750,870 162,356,608
Borrowed money 710,310 710,310
Cash collateral received for financial instruments 1,514,056 1,514,056
Other liabilities 19,540 77,664 97,204
Reserve for bonuses 421 421
Reserve for bonuses for directors and corporate auditors 63 63
Reserve for retirement benefits 348 348
Reserve for retirement benefits for directors and corporate auditors 190 190
Fund for lending rate reduction 7,645,489 7,645,489
Basic fund for lending rate reduction 7,645,489 7,645,489
Due to management account 6,731,983 (6,731,983)
Due from general account for fund for lending rate reduction 771,218 (771,218)
Reserves under special laws 12,793,885 17,180,920 29,974,805
Reserve for interest rate volatility 12,793,885 12,793,885
Management account reserve for interest rate volatility 16,711,102 16,711,102
Reserve for interest rate reduction 469,818 469,818
Total liabilities 99,022,023 110,780,672 (7,503,201) 202,299,494
(Net Assets)
Capital 137,926 137,926
Retained earnings 894,770 894,770
General account surplus reserve 894,770 894,770
Valuation, translation adjustments and others (37,236) (37,236)
Management account surplus reserve 445,843 445,843
Total net assets 995,460 445,843 1,441,303
Total liabilities and net assets $100,017,483 $111,226,515 $(7,503,201) $203,740,797
Notes: 1. General account and management accountIn accordance with the provisions of Article 13, Section 1 of the Supplementary Provisions of the Law, management account is used to conduct administration, collection and other related operations of the assets that JFM inherited from the Predecessor (management of the assets of the Predecessor). Management account is separated from the other account (general account) pursuant to the provisions of Article 13, Section 3 of the Supplementary Provisions of the Law.
2. General account surplus reserve and management account surplus reserve“Net income” of the general account is posted as “General account surplus reserve” in accordance with
Financial Statements

JFM Annual Report 2015 | 89
Review
and P
lanO
perations
Manag
ement S
tructureJFM
’s Role in
Local Governm
ent FinanceF
inan
cial Sectio
nA
pp
endix / JFM
Data
the provisions of Article 39, Section 1 of the Law, while “Net income” of management account is posted as “Management account surplus reserve” in accordance with the provisions of Article 13, Section 8 of the Supplementary Provisions of the Law.
3. Due from general account and due to management accountThese amounts represent funds lent between the general account and management account pursuant to the provisions of Article 13, Section 4 of the Supplementary Provisions of the Law.
4. Due from general account for fund for lending rate reduction and due to management account for fund for lending rate reductionThese amounts represent cash received for “Fund for lending rate reduction,” which was lent to management account from the general account pursuant to the provisions of Article 9, Section 12 of the Supplementary Provisions of the Law.
18. Information by Account (Statements of income) Statements of income of general account and management account from 1 April 2013 through 31 March 2014 were as follows:
(Millions of yen)
Item General account Management account Offset Total
Income ¥117,626 ¥360,076 ¥(19,313) ¥458,388
Interest income 107,355 347,803 455,158
Fees and commissions 117 117
Other operating income 0 0
Other income 3,112 3,112
Contributions from fund for lending rate reduction 3,084 3,084
Others 28 28
Administrative fee for management account 1,035 (1,035)
Interest on fund for lending rate reduction 6,004 (6,004)
Interest on due from general account 314 (314)
Transfer from general account for fund for lending rate reduction 11,958 (11,958)
Expenses 91,115 198,535 (19,313) 270,337
Interest expenses 73,289 187,658 260,947
Fees and commissions 78 202 281
Other operating expenses 3,058 3,451 6,509
General and administrative expenses 2,415 182 2,598
Other expenses 0 0
Interest on due to management account 314 (314)
Transfer to management account for fund for lending rate reduction 11,958 (11,958)
Administrative fee for management account 1,035 (1,035)
Interest on fund for lending rate reduction 6,004 (6,004)
Ordinary income 26,510 161,540 - 188,051
Special gains 220,000 880,203 (220,000) 880,203
Transfer from management account 220,000 (220,000)
Reversal of management account reserve for interest rate volatility 870,000 870,000
Reversal of reserve for interest rate reduction 10,203 10,203
Special losses 220,000 1,041,744 (220,000) 1,041,744
Provision for reserve for interest rate volatility 220,000 220,000
Provision for management account reserve for interest rate volatility 171,744 171,744
Transfer to general account 220,000 (220,000)
Payment to national treasury 650,000 650,000
Net income ¥26,510 ¥- ¥- ¥26,510

JFM Annual Report 2015 | 90
Financial Section
FinancialSection
Statements of income of general account and management account from 1 April 2014 through 31 March 2015 were as follows:
(Millions of yen)
Item General account Management account Offset Total
Income ¥133,507 ¥317,463 ¥(16,401) ¥434,569
Interest income 122,477 306,500 428,977
Fees and commissions 112 112
Other operating income 0 0
Other income 5,479 5,479
Contributions from fund for lending rate reduction 5,467 5,467
Others 11 11
Administrative fee for management account 774 (774)
Interest on fund for lending rate reduction 4,663 (4,663)
Interest on due from general account 94 (94)
Transfer from general account for fund for lending rate reduction 10,869 (10,869)
Expenses 102,448 168,023 (16,401) 254,070
Interest expenses 85,610 160,449 246,060
Fees and commissions 104 189 294
Other operating expenses 2,844 1,787 4,632
General and administrative expenses 2,925 158 3,083
Interest on due to management account 94 (94)
Transfer to management account for fund for lending rate reduction 10,869 (10,869)
Administrative fee for management account 774 (774)
Interest on fund for lending rate reduction 4,663 (4,663)
Ordinary income 31,059 149,440 - 180,499
Special gains 220,000 229,129 (220,000) 229,129
Transfer from management account 220,000 (220,000)
Reversal of management account reserve for interest rate volatility 220,000 220,000
Reversal of reserve for interest rate reduction 9,129 9,129
Special losses 220,088 378,570 (220,000) 378,658
Loss on disposal of fixed assets 88 88
Provision for reserve for interest rate volatility 220,000 220,000
Provision for management account reserve for interest rate volatility 158,570 158,570
Transfer to general account 220,000 (220,000)
Net income ¥30,971 ¥- ¥- ¥30,971
Financial Statements
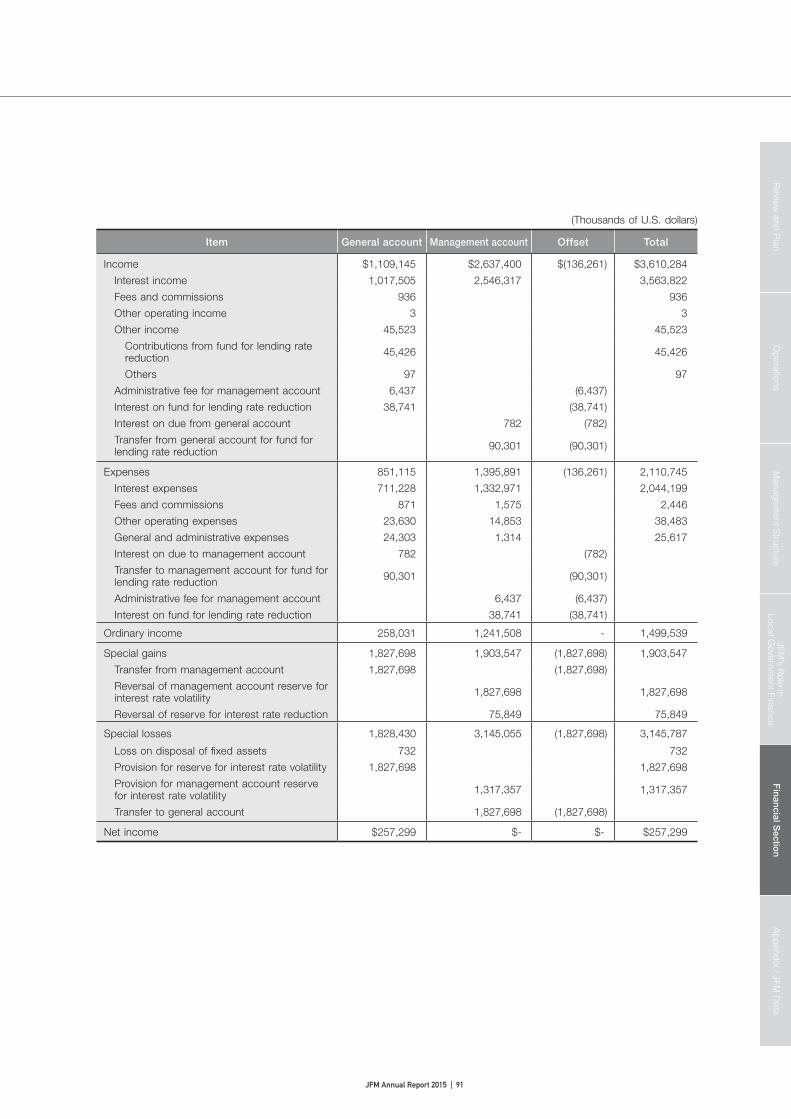
JFM Annual Report 2015 | 91
Review
and P
lanO
perations
Manag
ement S
tructureJFM
’s Role in
Local Governm
ent FinanceF
inan
cial Sectio
nA
pp
endix / JFM
Data
(Thousands of U.S. dollars)
Item General account Management account Offset Total
Income $1,109,145 $2,637,400 $(136,261) $3,610,284
Interest income 1,017,505 2,546,317 3,563,822
Fees and commissions 936 936
Other operating income 3 3
Other income 45,523 45,523
Contributions from fund for lending rate reduction 45,426 45,426
Others 97 97
Administrative fee for management account 6,437 (6,437)
Interest on fund for lending rate reduction 38,741 (38,741)
Interest on due from general account 782 (782)
Transfer from general account for fund for lending rate reduction 90,301 (90,301)
Expenses 851,115 1,395,891 (136,261) 2,110,745
Interest expenses 711,228 1,332,971 2,044,199
Fees and commissions 871 1,575 2,446
Other operating expenses 23,630 14,853 38,483
General and administrative expenses 24,303 1,314 25,617
Interest on due to management account 782 (782)
Transfer to management account for fund for lending rate reduction 90,301 (90,301)
Administrative fee for management account 6,437 (6,437)
Interest on fund for lending rate reduction 38,741 (38,741)
Ordinary income 258,031 1,241,508 - 1,499,539
Special gains 1,827,698 1,903,547 (1,827,698) 1,903,547
Transfer from management account 1,827,698 (1,827,698)
Reversal of management account reserve for interest rate volatility 1,827,698 1,827,698
Reversal of reserve for interest rate reduction 75,849 75,849
Special losses 1,828,430 3,145,055 (1,827,698) 3,145,787
Loss on disposal of fi xed assets 732 732
Provision for reserve for interest rate volatility 1,827,698 1,827,698
Provision for management account reserve for interest rate volatility 1,317,357 1,317,357
Transfer to general account 1,827,698 (1,827,698)
Net income $257,299 $- $- $257,299
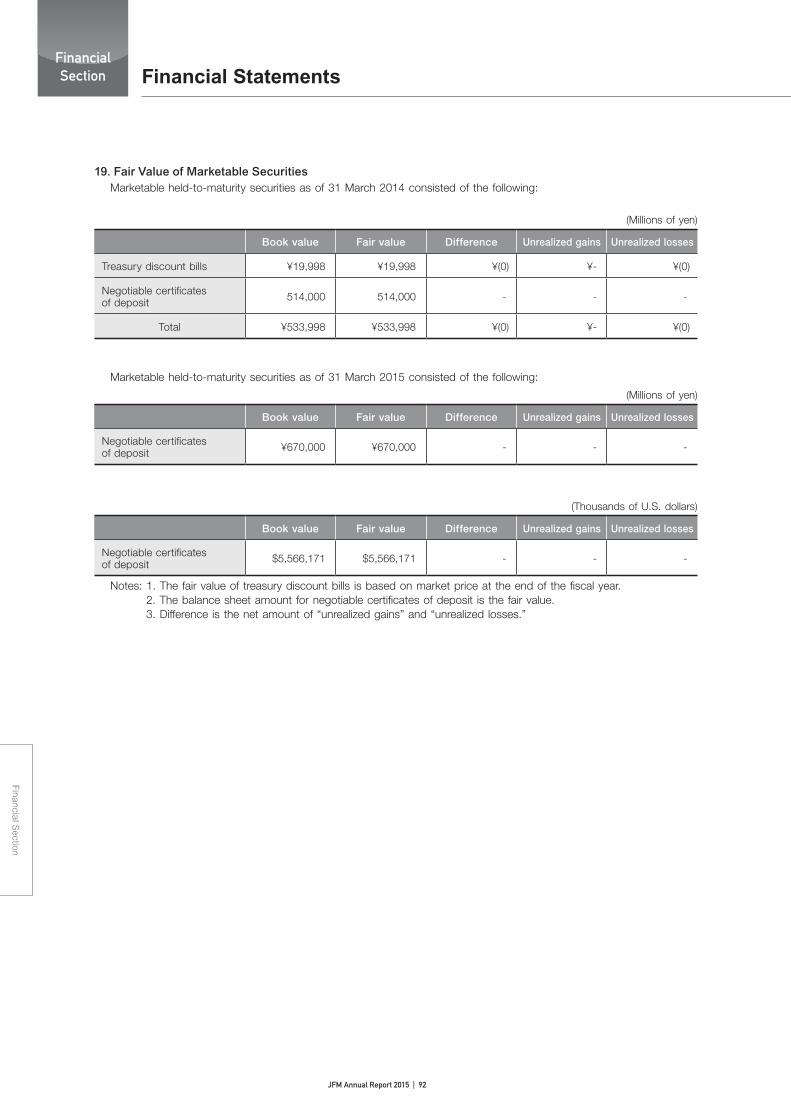
JFM Annual Report 2015 | 92
Financial Section
FinancialSection
19. Fair Value of Marketable SecuritiesMarketable held-to-maturity securities as of 31 March 2014 consisted of the following:
(Millions of yen)
Book value Fair value Difference Unrealized gains Unrealized losses
Treasury discount bills ¥19,998 ¥19,998 ¥(0) ¥- ¥(0)
Negotiable certificates of deposit 514,000 514,000 - - -
Total ¥533,998 ¥533,998 ¥(0) ¥- ¥(0)
Marketable held-to-maturity securities as of 31 March 2015 consisted of the following:
(Millions of yen)
Book value Fair value Difference Unrealized gains Unrealized losses
Negotiable certificates of deposit ¥670,000 ¥670,000 - - -
(Thousands of U.S. dollars)
Book value Fair value Difference Unrealized gains Unrealized losses
Negotiable certificates of deposit $5,566,171 $5,566,171 - - -
Notes: 1. The fair value of treasury discount bills is based on market price at the end of the fiscal year. 2. The balance sheet amount for negotiable certificates of deposit is the fair value. 3. Difference is the net amount of “unrealized gains” and “unrealized losses.”
Financial Statements

JFM Annual Report 2015 | 93
Review
and P
lanO
perations
Manag
ement S
tructureJFM
’s Role in
Local Governm
ent FinanceF
inan
cial Sectio
nA
pp
endix / JFM
Data
20. Information on Derivative Transactions(1) Types of derivative transactions
Derivative transactions entered into by JFM are interest rate swaps for interest rate related transactions, and currency swaps and foreign exchange forward contracts for currency related transactions.
(2) Policies and purposes of derivative transactionsJFM uses interest rate swaps, currency swaps and foreign exchange forward contracts as a means of hedging exposure to interest rate and foreign exchange fl uctuation risks, and does not enter into derivatives for speculative purposes. Interest rate swaps are used to hedge exposure to interest rate risk on funding activities. Currency swaps and foreign exchange forward contracts are used to hedge exposure to foreign exchange risk associated with issuance of foreign currency-denominated bonds and foreign currency-denominated deposits. Hedge accounting is applied to interest rate swaps, currency swaps and foreign exchange contracts.(a) Hedge accounting method
Interest rate swaps used to hedge the risk of interest rate fluctuations that qualify for hedge accounting and meet specific matching criteria are not measured at fair value, but the differential paid or received under the swap agreements is recognized and included in interest expense or income. If swap contracts or forward contracts used to hedge the risk of foreign currency fl uctuation qualify for deferral hedge accounting, the foreign currency-denominated assets and liabilities are translated at the contracted rate.
(b) Hedging instruments and hedged items(ⅰ) Hedging instruments: Interest rate swaps
Hedged items: Bonds and long-term borrowed money(ⅱ) Hedging instruments: Currency swaps
Hedged items: Foreign currency-denominated bonds(ⅲ) Hedging instruments: Foreign exchange forward contracts
Hedged items: Foreign currency-denominated bank deposits(c) Hedging policy
JFM uses hedging instruments as a means of hedging exposure to interest rate risk and foreign exchange risk. Hedged items are identifi ed by each individual contract. As a means of hedging foreign exchange fl uctuation risks associated with the receipt of interest and principal of foreign currency-denominated bank deposits, a foreign exchange forward contract is entered into at the time of each deposit by JFM.
(d) Assessment of hedge effectivenessJFM ensures hedging instruments and hedged items have the same major terms when entering into hedge transactions to offset market fl uctuation risks associated with bonds and long-term borrowed money. Accordingly, JFM deems these to be highly effective and thus does not assess their effectiveness. Moreover, a periodic assessment of hedge effectiveness for interest rate swaps and currency swaps and forward contracts that qualify for deferral hedge accounting is omitted when the exceptional accrual method is applied.
(3) Risks on derivative transactionsMajor risks on derivative transactions are market risk and credit risk. Market risk is the risk of future revenue fl uctuations due to market value changes. Credit risk is the risk of losses incurred when counterparties are unable to fulfi ll their contracts due to bankruptcy or other reasons. As for derivative transactions used for hedging purposes, market risk is offset by the corresponding change in the underlying hedged items. JFM enters into ISDA Master Agreements and CSA with fi nancial institutions, which are its derivative transactions counterparties, to reduce credit risk. Moreover, JFM constantly monitors restructuring costs of the transactions and the counterparties’ credit profi les, and deals with multiple counterparties.
(4) Risk management system for derivative transactionsExecution and management of derivative transactions are conducted by the Finance Department of JFM with the approval of persons in charge in accordance with the operational guidelines which specify transaction authority and limits on the transaction amount. Additionally, the total amount of derivative transactions, the status of risks, the assessed fair value, and the credit risk on counterparties are regularly reported to the Integrated Risk Management Committee.
JFM Annual Report 2015 | 94
Financial Section
FinancialSection Independent Auditor’s Report

JFM Annual Report 2015 | 95
Review
and P
lanO
perations
Manag
ement S
tructureJFM
’s Role in
Local Governm
ent FinanceFinancial S
ectionA
pp
end
ix / JFM
Data
Appendix 96Members of the Representative Board and the
Supervisory Committee 96Redemption of Loans in Fiscal 2014 96Outstanding Loans by Business 97Outstanding Loans by Borrower 98Bond Issuance in Fiscal 2014 102Outstanding International Bonds 105
JFM Data 107Organization History 107Organization Chart 108Directors and Corporate Auditors/Contact Information 109
Appendix / JFM Data
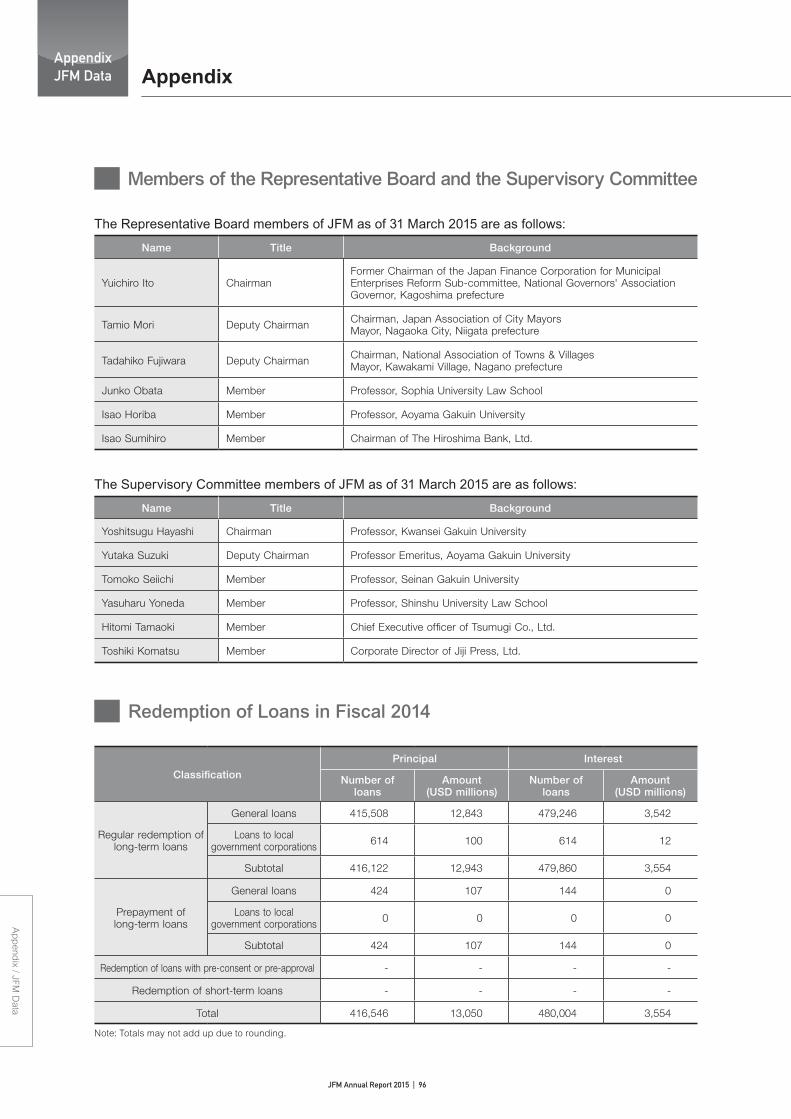
JFM Annual Report 2015 | 96
Ap
pend
ix / JFM D
ata
AppendixJFM Data Appendix
Members of the Representative Board and the Supervisory Committee
Name Title Background
Yuichiro Ito ChairmanFormer Chairman of the Japan Finance Corporation for Municipal Enterprises Reform Sub-committee, National Governors' AssociationGovernor, Kagoshima prefecture
Tamio Mori Deputy Chairman Chairman, Japan Association of City MayorsMayor, Nagaoka City, Niigata prefecture
Tadahiko Fujiwara Deputy Chairman Chairman, National Association of Towns & VillagesMayor, Kawakami Village, Nagano prefecture
Junko Obata Member Professor, Sophia University Law School
Isao Horiba Member Professor, Aoyama Gakuin University
Isao Sumihiro Member Chairman of The Hiroshima Bank, Ltd.
The Representative Board members of JFM as of 31 March 2015 are as follows:
Name Title Background
Yoshitsugu Hayashi Chairman Professor, Kwansei Gakuin University
Yutaka Suzuki Deputy Chairman Professor Emeritus, Aoyama Gakuin University
Tomoko Seiichi Member Professor, Seinan Gakuin University
Yasuharu Yoneda Member Professor, Shinshu University Law School
Hitomi Tamaoki Member Chief Executive officer of Tsumugi Co., Ltd.
Toshiki Komatsu Member Corporate Director of Jiji Press, Ltd.
The Supervisory Committee members of JFM as of 31 March 2015 are as follows:
Classification
Principal Interest
Number of loans
Amount(USD millions)
Number of loans
Amount(USD millions)
Regular redemption of long-term loans
General loans 415,508 12,843 479,246 3,542
Loans to local government corporations 614 100 614 12
Subtotal 416,122 12,943 479,860 3,554
Prepayment of long-term loans
General loans 424 107 144 0
Loans to local government corporations 0 0 0 0
Subtotal 424 107 144 0
Redemption of loans with pre-consent or pre-approval - - - -
Redemption of short-term loans - - - -
Total 416,546 13,050 480,004 3,554
Note: Totals may not add up due to rounding.
Redemption of Loans in Fiscal 2014
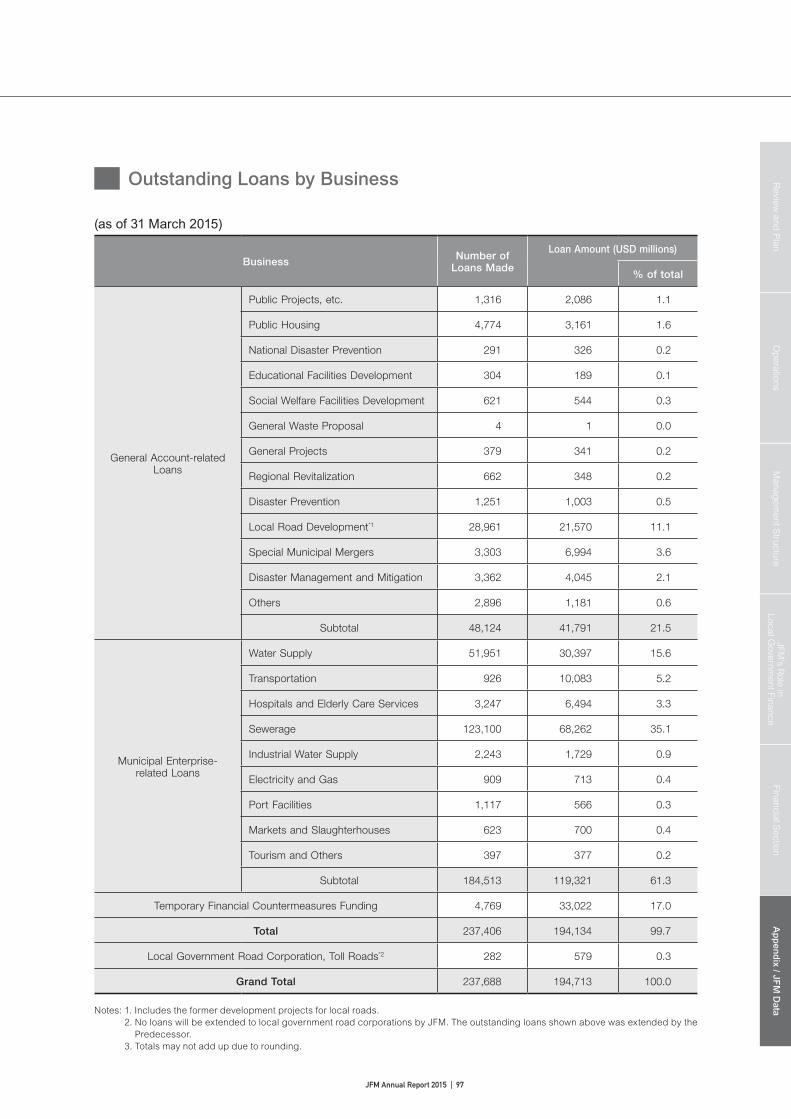
JFM Annual Report 2015 | 97
Review
and P
lanO
perations
Manag
ement S
tructureJFM
’s Role in
Local Governm
ent FinanceFinancial S
ectionA
pp
end
ix / JFM
Data
Business Number of Loans Made
Loan Amount (USD millions)
% of total
General Account-related Loans
Public Projects, etc. 1,316 2,086 1.1
Public Housing 4,774 3,161 1.6
National Disaster Prevention 291 326 0.2
Educational Facilities Development 304 189 0.1
Social Welfare Facilities Development 621 544 0.3
General Waste Proposal 4 1 0.0
General Projects 379 341 0.2
Regional Revitalization 662 348 0.2
Disaster Prevention 1,251 1,003 0.5
Local Road Development*1 28,961 21,570 11.1
Special Municipal Mergers 3,303 6,994 3.6
Disaster Management and Mitigation 3,362 4,045 2.1
Others 2,896 1,181 0.6
Subtotal 48,124 41,791 21.5
Municipal Enterprise-related Loans
Water Supply 51,951 30,397 15.6
Transportation 926 10,083 5.2
Hospitals and Elderly Care Services 3,247 6,494 3.3
Sewerage 123,100 68,262 35.1
Industrial Water Supply 2,243 1,729 0.9
Electricity and Gas 909 713 0.4
Port Facilities 1,117 566 0.3
Markets and Slaughterhouses 623 700 0.4
Tourism and Others 397 377 0.2
Subtotal 184,513 119,321 61.3
Temporary Financial Countermeasures Funding 4,769 33,022 17.0
Total 237,406 194,134 99.7
Local Government Road Corporation, Toll Roads*2 282 579 0.3
Grand Total 237,688 194,713 100.0
Notes: 1. Includes the former development projects for local roads. 2. No loans will be extended to local government road corporations by JFM. The outstanding loans shown above was extended by the
Predecessor. 3. Totals may not add up due to rounding.
Outstanding Loans by Business
(as of 31 March 2015)
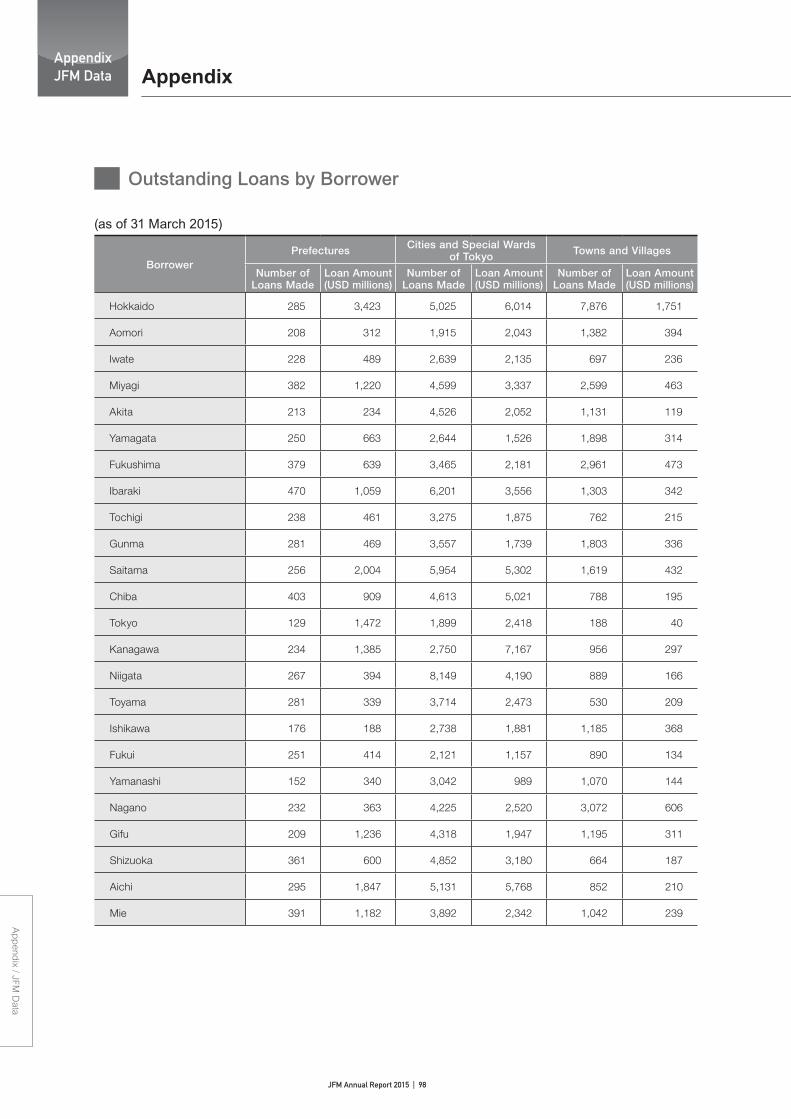
JFM Annual Report 2015 | 98
Ap
pend
ix / JFM D
ata
AppendixJFM Data
BorrowerPrefectures Cities and Special Wards
of Tokyo Towns and Villages
Number of Loans Made
Loan Amount(USD millions)
Number of Loans Made
Loan Amount(USD millions)
Number of Loans Made
Loan Amount(USD millions)
Hokkaido 285 3,423 5,025 6,014 7,876 1,751
Aomori 208 312 1,915 2,043 1,382 394
Iwate 228 489 2,639 2,135 697 236
Miyagi 382 1,220 4,599 3,337 2,599 463
Akita 213 234 4,526 2,052 1,131 119
Yamagata 250 663 2,644 1,526 1,898 314
Fukushima 379 639 3,465 2,181 2,961 473
Ibaraki 470 1,059 6,201 3,556 1,303 342
Tochigi 238 461 3,275 1,875 762 215
Gunma 281 469 3,557 1,739 1,803 336
Saitama 256 2,004 5,954 5,302 1,619 432
Chiba 403 909 4,613 5,021 788 195
Tokyo 129 1,472 1,899 2,418 188 40
Kanagawa 234 1,385 2,750 7,167 956 297
Niigata 267 394 8,149 4,190 889 166
Toyama 281 339 3,714 2,473 530 209
Ishikawa 176 188 2,738 1,881 1,185 368
Fukui 251 414 2,121 1,157 890 134
Yamanashi 152 340 3,042 989 1,070 144
Nagano 232 363 4,225 2,520 3,072 606
Gifu 209 1,236 4,318 1,947 1,195 311
Shizuoka 361 600 4,852 3,180 664 187
Aichi 295 1,847 5,131 5,768 852 210
Mie 391 1,182 3,892 2,342 1,042 239
Appendix
Outstanding Loans by Borrower
(as of 31 March 2015)

JFM Annual Report 2015 | 99
Review
and P
lanO
perations
Manag
ement S
tructureJFM
’s Role in
Local Governm
ent FinanceFinancial S
ectionA
pp
end
ix / JFM
Data
Local Government Associations
Local Government Road Corporations Total
Number of Loans Made
Loan Amount(USD millions)
Number of Loans Made
Loan Amount(USD millions)
Number of Loans Made
Loan Amount(USD millions) % of Total
298 225 - - 13,484 11,413 5.9
104 117 - - 3,609 2,866 1.5
217 142 - - 3,781 3,002 1.5
128 79 - - 7,708 5,100 2.6
7 2 - - 5,877 2,407 1.2
136 39 10 1 4,938 2,544 1.3
191 188 3 2 6,999 3,483 1.8
220 181 4 3 8,198 5,141 2.6
7 26 8 4 4,290 2,581 1.3
31 49 - - 5,672 2,594 1.3
234 141 13 7 8,076 7,885 4.0
371 388 11 16 6,186 6,529 3.4
28 146 - - 2,244 4,075 2.1
74 753 - - 4,014 9,602 4.9
139 122 - - 9,444 4,872 2.5
138 109 10 4 4,673 3,133 1.6
18 21 - - 4,117 2,457 1.3
68 32 - - 3,330 1,738 0.9
153 62 - - 4,417 1,536 0.8
159 118 10 6 7,698 3,613 1.9
7 10 - - 5,729 3,503 1.8
69 111 14 7 5,960 4,086 2.1
111 45 51 252 6,440 8,122 4.2
31 42 - - 5,356 3,805 2.0

JFM Annual Report 2015 | 100
Ap
pend
ix / JFM D
ata
AppendixJFM Data
BorrowerPrefectures Cities and Special Wards
of Tokyo Towns and Villages
Number of Loans Made
Loan Amount(USD millions)
Number of Loans Made
Loan Amount(USD millions)
Number of Loans Made
Loan Amount(USD millions)
Shiga 210 609 4,183 2,047 565 120
Kyoto 212 409 3,351 3,867 988 232
Osaka 116 580 5,012 11,599 812 254
Hyogo 314 3,494 7,425 7,827 1,825 679
Nara 265 874 2,289 1,418 1,753 456
Wakayama 112 323 1,485 1,576 1,252 443
Tottori 288 407 1,259 842 1,819 404
Shimane 233 823 2,416 1,744 293 68
Okayama 291 995 4,578 3,206 1,270 267
Hiroshima 393 1,355 4,261 4,263 904 249
Yamaguchi 414 519 4,233 2,176 544 106
Tokushima 182 405 1,313 915 764 213
Kagawa 241 238 2,078 1,034 798 172
Ehime 117 214 2,294 1,680 599 196
Kochi 141 679 1,415 1,172 636 154
Fukuoka 107 900 4,506 7,528 1,890 795
Saga 55 280 1,542 1,301 593 249
Nagasaki 145 423 2,713 2,338 623 155
Kumamoto 168 427 2,703 1,767 1,501 388
Oita 118 217 2,212 1,221 150 43
Miyazaki 164 607 2,047 1,301 701 172
Kagoshima 171 1,088 2,340 1,463 771 171
Okinawa 236 745 1,414 1,106 840 189
Total 11,264 38,251 162,313 136,203 59,243 14,354
Note: Totals may not add up due to rounding.
Appendix

JFM Annual Report 2015 | 101
Review
and P
lanO
perations
Manag
ement S
tructureJFM
’s Role in
Local Governm
ent FinanceFinancial S
ectionA
pp
end
ix / JFM
Data
Local Government Associations
Local Government Road Corporations Total
Number of Loans Made
Loan Amount(USD millions)
Number of Loans Made
Loan Amount(USD millions)
Number of Loans Made
Loan Amount(USD millions) % of Total
89 45 3 0 5,050 2,822 1.4
16 31 11 7 4,578 4,546 2.3
230 629 17 54 6,187 13,115 6.7
458 561 49 44 10,071 12,605 6.5
16 15 2 4 4,325 2,766 1.4
57 55 - - 2,906 2,396 1.2
22 21 - - 3,388 1,673 0.9
53 25 - - 2,995 2,660 1.4
102 193 - - 6,241 4,661 2.4
7 8 17 61 5,582 5,936 3.0
108 77 - - 5,299 2,878 1.5
3 1 - - 2,262 1,535 0.8
9 7 - - 3,126 1,451 0.7
11 10 - - 3,021 2,101 1.1
7 94 - - 2,199 2,098 1.1
252 202 28 101 6,783 9,526 4.9
98 105 - - 2,288 1,934 1.0
14 27 9 3 3,504 2,945 1.5
32 23 8 1 4,412 2,605 1.3
0 0 - - 2,480 1,481 0.8
9 9 - - 2,921 2,090 1.1
13 23 4 1 3,299 2,746 1.4
41 17 - - 2,531 2,056 1.1
4,586 5,326 282 580 237,688 194,714 100.0
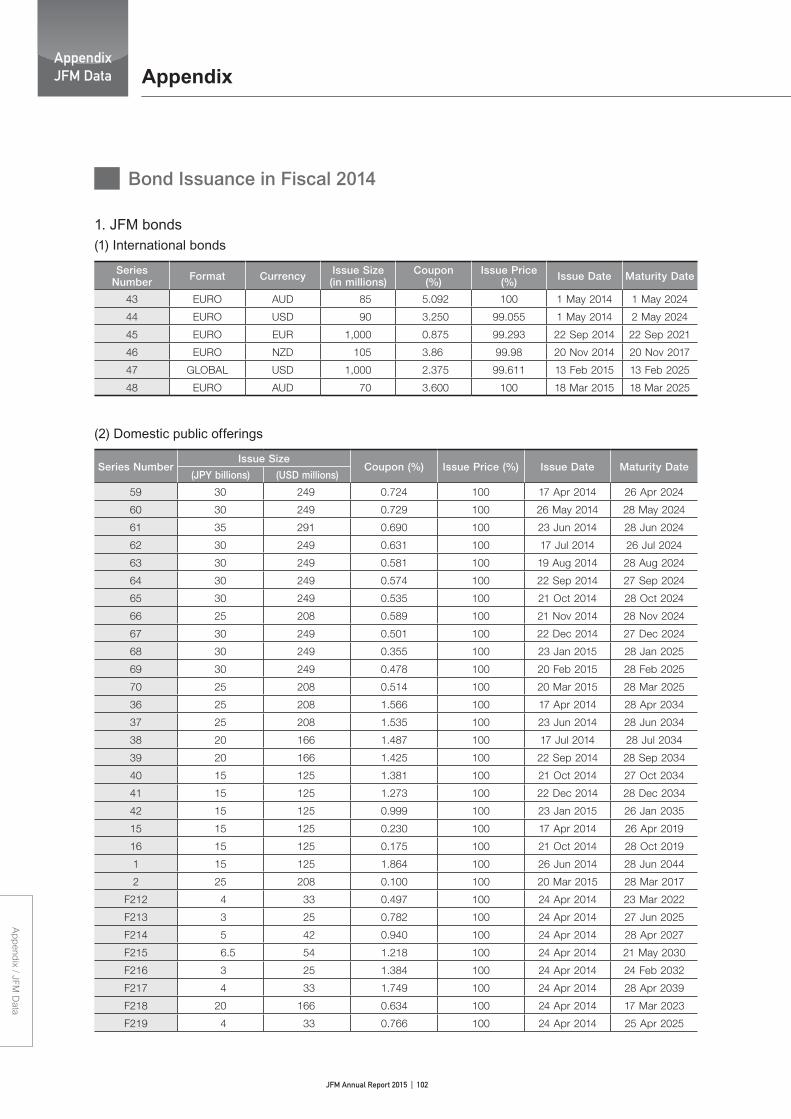
JFM Annual Report 2015 | 102
Ap
pend
ix / JFM D
ata
AppendixJFM Data
1. JFM bonds(1) International bonds
Appendix
Bond Issuance in Fiscal 2014
Series Number Format Currency Issue Size
(in millions)Coupon
(%)Issue Price
(%) Issue Date Maturity Date
43 EURO AUD 85 5.092 100 1 May 2014 1 May 2024
44 EURO USD 90 3.250 99.055 1 May 2014 2 May 2024
45 EURO EUR 1,000 0.875 99.293 22 Sep 2014 22 Sep 2021
46 EURO NZD 105 3.86 99.98 20 Nov 2014 20 Nov 2017
47 GLOBAL USD 1,000 2.375 99.611 13 Feb 2015 13 Feb 2025
48 EURO AUD 70 3.600 100 18 Mar 2015 18 Mar 2025
(2) Domestic public offerings
Series NumberIssue Size
Coupon (%) Issue Price (%) Issue Date Maturity Date(JPY billions) (USD millions)
59 30 249 0.724 100 17 Apr 2014 26 Apr 2024
60 30 249 0.729 100 26 May 2014 28 May 2024
61 35 291 0.690 100 23 Jun 2014 28 Jun 2024
62 30 249 0.631 100 17 Jul 2014 26 Jul 2024
63 30 249 0.581 100 19 Aug 2014 28 Aug 2024
64 30 249 0.574 100 22 Sep 2014 27 Sep 2024
65 30 249 0.535 100 21 Oct 2014 28 Oct 2024
66 25 208 0.589 100 21 Nov 2014 28 Nov 2024
67 30 249 0.501 100 22 Dec 2014 27 Dec 2024
68 30 249 0.355 100 23 Jan 2015 28 Jan 2025
69 30 249 0.478 100 20 Feb 2015 28 Feb 2025
70 25 208 0.514 100 20 Mar 2015 28 Mar 2025
36 25 208 1.566 100 17 Apr 2014 28 Apr 2034
37 25 208 1.535 100 23 Jun 2014 28 Jun 2034
38 20 166 1.487 100 17 Jul 2014 28 Jul 2034
39 20 166 1.425 100 22 Sep 2014 28 Sep 2034
40 15 125 1.381 100 21 Oct 2014 27 Oct 2034
41 15 125 1.273 100 22 Dec 2014 28 Dec 2034
42 15 125 0.999 100 23 Jan 2015 26 Jan 2035
15 15 125 0.230 100 17 Apr 2014 26 Apr 2019
16 15 125 0.175 100 21 Oct 2014 28 Oct 2019
1 15 125 1.864 100 26 Jun 2014 28 Jun 2044
2 25 208 0.100 100 20 Mar 2015 28 Mar 2017
F212 4 33 0.497 100 24 Apr 2014 23 Mar 2022
F213 3 25 0.782 100 24 Apr 2014 27 Jun 2025
F214 5 42 0.940 100 24 Apr 2014 28 Apr 2027
F215 6.5 54 1.218 100 24 Apr 2014 21 May 2030
F216 3 25 1.384 100 24 Apr 2014 24 Feb 2032
F217 4 33 1.749 100 24 Apr 2014 28 Apr 2039
F218 20 166 0.634 100 24 Apr 2014 17 Mar 2023
F219 4 33 0.766 100 24 Apr 2014 25 Apr 2025

JFM Annual Report 2015 | 103
Review
and P
lanO
perations
Manag
ement S
tructureJFM
’s Role in
Local Governm
ent FinanceFinancial S
ectionA
pp
end
ix / JFM
Data
Series NumberIssue Size
Coupon (%) Issue Price (%) Issue Date Maturity Date(JPY billions) (USD millions)
F220 3 25 1.106 100 24 Apr 2014 22 Mar 2029
F221 5 42 1.198 100 24 Apr 2014 26 Apr 2030
F222 3 25 1.610 100 24 Apr 2014 24 Apr 2035
F223 5.5 46 0.527 100 30 Apr 2014 27 May 2022
F224 4 33 0.862 100 30 Apr 2014 30 Apr 2026
F225 3.5 29 1.044 100 30 Apr 2014 30 Aug 2028
F226 5 42 1.096 100 30 Apr 2014 28 Feb 2029
F227 6 50 1.396 100 30 Apr 2014 28 Apr 2032
F228 4 33 1.269 100 30 Apr 2014 20 Mar 2031
F229 3 25 0.635 100 30 Apr 2014 20 Jun 2023
F230 3 25 1.111 100 30 Apr 2014 27 Apr 2029
F231 4.5 37 1.176 100 30 Apr 2014 30 Apr 2030
F232 6 50 1.293 100 30 Apr 2014 25 Apr 2031
F233 6.5 54 1.592 100 15 May 2014 28 Dec 2034
F234 5.5 46 1.605 100 30 Apr 2014 27 Apr 2035
F235 20 166 0.562 100 24 Jul 2014 20 Sep 2023
F236 4 33 1.079 100 24 Jul 2014 26 Mar 2030
F237 3 25 1.194 100 24 Jul 2014 25 Jul 2031
F238 4 33 1.574 100 24 Jul 2014 25 Jul 2036
F239 6 50 1.844 100 24 Jul 2014 26 Jul 2044
F240 10 83 1.069 100 25 Jul 2014 28 Feb 2030
F241 4.5 37 1.074 100 25 Jul 2014 26 Apr 2030
F242 3 25 1.188 100 25 Jul 2014 25 Jul 2031
F243 3.5 29 1.285 100 25 Jul 2014 21 Jul 2032
F244 10 83 *1 100 25 Jul 2014 25 Jan 2034
F245 3.5 29 1.017 100 25 Jul 2014 26 Feb 2030
F246 3 25 1.196 100 25 Jul 2014 25 Feb 2032
F247 4 33 1.309 100 25 Jul 2014 28 Jul 2033
F248 3.5 29 1.512 100 25 Jul 2014 25 Jul 2036
F249 6 50 1.605 100 25 Jul 2014 28 Jul 2039
F250 4 33 1.779 100 25 Jul 2014 26 Jul 2044
F251 20 166 0.280 100 30 Oct 2014 17 Sep 2021
F252 3 25 0.845 100 30 Oct 2014 27 Oct 2028
F253 6 50 1.119 100 30 Oct 2014 27 Feb 2032
F254 3 25 1.146 100 30 Oct 2014 26 Mar 2032
F255 3 25 1.196 100 30 Oct 2014 28 Oct 2032
F256 3 25 1.281 100 30 Oct 2014 28 Oct 2033
F257 3 25 0.335 100 30 Oct 2014 28 Sep 2022
F258 3 25 0.650 100 30 Oct 2014 30 Oct 2026
F259 3 25 1.002 100 30 Oct 2014 30 Oct 2030
F260 6 50 1.099 100 30 Oct 2014 28 Oct 2031
F261 3 25 1.061 100 30 Oct 2014 28 Mar 2031
F262 3 25 1.109 100 30 Oct 2014 30 Oct 2031
F263 3 25 1.194 100 30 Oct 2014 28 Oct 2032
F264 20 166 0.249 100 28 Jan 2015 20 Dec 2023
Note 1. 3m¥L+10bp

JFM Annual Report 2015 | 104
Ap
pend
ix / JFM D
ata
AppendixJFM Data Appendix
2. Private placements with Pension Fund Association for Local Government Officials
Series NumberIssue Size
Coupon (%) Issue Price (%) Issue Date Maturity Date(JPY billions) (USD millions)
A51 25 208 0.754 100 17 Apr 2014 17 Apr 2024
A52 25 208 0.750 100 26 May 2014 24 May 2024
A53 25 208 0.715 100 23 Jun 2014 21 Jun 2024
A54 25 208 0.651 100 17 Jul 2014 17 Jul 2024
A55 25 208 0.597 100 19 Aug 2014 19 Aug 2024
A56 25 208 0.594 100 22 Sep 2014 20 Sep 2024
A57 25 208 0.555 100 21 Oct 2014 21 Oct 2024
A58 25 208 0.629 100 25 Nov 2014 25 Nov 2024
A59 25 208 0.511 100 18 Dec 2014 18 Dec 2024
A60 25 208 0.370 100 26 Jan 2015 24 Jan 2025
A61 25 208 0.518 100 23 Feb 2015 21 Feb 2025
A62 25 208 0.583 100 19 Mar 2015 19 Mar 2025
3. Government-guaranteed domestic bonds
Series NumberIssue Size
Coupon (%) Issue Price (%) Issue Date Maturity Date(JPY billions) (USD millions)
59 55 457 0.669 100 14 Apr 2014 12 Apr 2024
60 50 415 0.660 100 21 May 2014 21 May 2024
61 55 457 0.644 100 16 Jun 2014 14 Jun 2024
62 50 415 0.601 100 16 Jul 2014 16 Jul 2024
63 50 415 0.556 100 18 Aug 2014 16 Aug 2024
64 30 249 0.544 100 16 Sep 2014 13 Sep 2024
65 30 249 0.539 100 16 Oct 2014 16 Oct 2024
66 30 249 0.495 100 18 Nov 2014 18 Nov 2024
67 20 166 0.466 100 15 Dec 2014 13 Dec 2024
68 20 166 0.320 100 20 Jan 2015 20 Jan 2025
69 20 166 0.414 100 17 Feb 2015 17 Feb 2025
70 20 166 0.450 100 16 Mar 2015 14 Mar 2025
13 80 665 0.202 100 24 Apr 2014 24 Apr 2020
14 80 665 0.199 100 18 Jun 2014 18 Jun 2020
15 40 332 0.167 100 19 Mar 2015 19 Mar 2021

JFM Annual Report 2015 | 105
Review
and P
lanO
perations
Manag
ement S
tructureJFM
’s Role in
Local Governm
ent FinanceFinancial S
ectionA
pp
end
ix / JFM
Data
1. JFM bonds
(as of 31 March 2015)
Outstanding International Bonds
Series Number Format Currency Issue Size
(in millions) Coupon Issue Price (%) Issue Date Maturity Date
1 EURO USD 105 3mL+73bp 100 17 Jan 2012 17 Jan 2017
2 EURO USD 40 2.035% 100 12 Jan 2012 12 Jan 2017
3 EURO USD 57 2.00% 100 17 Jan 2012 17 Jan 2017
4 EURO USD 35 3mL+75bp 100 17 Jan 2012 17 Jan 2017
5 EURO USD 30 3mL+75bp 100 19 Jan 2012 19 Jan 2017
6 EURO USD 51 3mL+70bp 100 18 Jan 2012 18 Jan 2017
7 EURO USD 20 2.00% 100 23 Jan 2012 23 Jan 2017
8 EURO USD 20 3mL+73bp 100 23 Jan 2012 23 Jan 2017
9 EURO USD 20 3mL+70bp 100 19 Jan 2012 19 Jan 2017
10 EURO USD 20 3mL+75bp 100 18 Jan 2012 18 Jan 2017
11 EURO NZD 40 3mNZD-BBR-FRA+113bp 100 24 Jan 2012 24 Jan 2017
12 EURO USD 20 3mL+69bp 100 26 Jan 2012 26 Jan 2017
13 EURO USD 20 3mL+70bp 100 24 Jan 2012 24 Jan 2017
14 EURO USD 25 1.84% 100 1 Mar 2012 1 Mar 2017
15 EURO USD 20 2.40% 100 1 Mar 2012 1 Mar 2019
16 EURO USD 25 1.8725% 100 1 Mar 2012 1 Mar 2017
17 EURO USD 30 3mL+70bp 100 1 Mar 2012 1 Mar 2017
18 EURO USD 25 3mL+70bp 100 1 Mar 2012 1 Mar 2017
19 EURO USD 20 1.89% 100 1 Mar 2012 1 Mar 2017
20 EURO USD 40 3mL+70bp 100 6 Mar 2012 6 Mar 2017
21 EURO USD 30 3mL+70bp 100 6 Mar 2012 6 Mar 2017
22 EURO USD 25 3mL+70bp 100 6 Mar 2012 6 Mar 2017
23 EURO USD 30 3mL+70.5bp 100 6 Mar 2012 6 Mar 2017
24 EURO USD 30 3mL+70bp 100 8 Mar 2012 8 Mar 2017
25 EURO USD 30 3mL+70bp 100 6 Mar 2012 6 Mar 2017
26 EURO AUD 20 3mBBSW+115bp 100 13 Mar 2012 13 Mar 2017
27 EURO USD 30 3mL+70bp 100 8 Mar 2012 8 Mar 2017
28 EURO USD 20 1.85% 100 13 Mar 2012 13 Mar 2017
29 EURO USD 327 3mL+65bp 100 22 May 2012 22 May 2017
30 EURO USD 130 3mL+70bp 100 6 Jun 2012 6 Jun 2019
31 EURO USD 1,000 1.500% 100 12 Sep 2012 12 Sep 2017
32 EURO USD 100 3mL+52bp 100 7 Nov 2012 7 Nov 2017
33 EURO USD 1,000 1.375% 99.544 5 Feb 2013 5 Feb 2018
34 EURO AUD 100 3.65% 99.99 25 Mar 2013 23 Mar 2018
35 EURO USD 105 1.375% 99.952 18 Apr 2013 18 Apr 2018
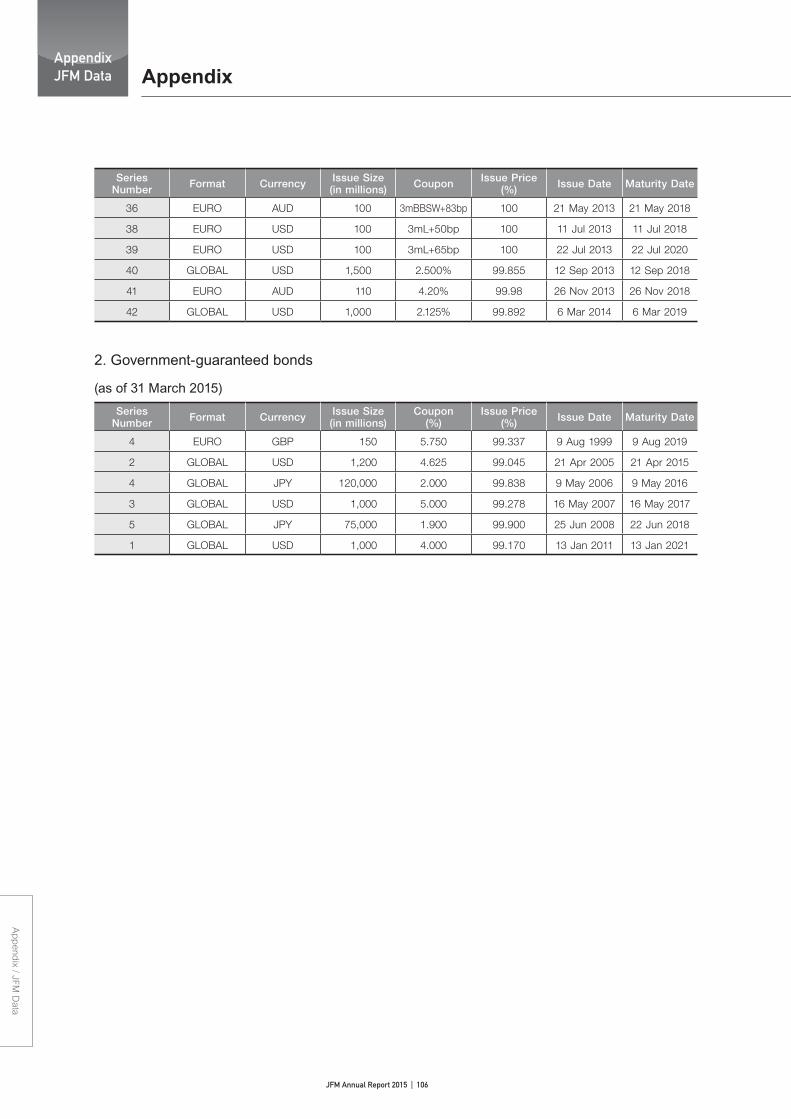
JFM Annual Report 2015 | 106
Ap
pend
ix / JFM D
ata
AppendixJFM Data
Series Number Format Currency Issue Size
(in millions)Coupon
(%)Issue Price
(%) Issue Date Maturity Date
4 EURO GBP 150 5.750 99.337 9 Aug 1999 9 Aug 2019
2 GLOBAL USD 1,200 4.625 99.045 21 Apr 2005 21 Apr 2015
4 GLOBAL JPY 120,000 2.000 99.838 9 May 2006 9 May 2016
3 GLOBAL USD 1,000 5.000 99.278 16 May 2007 16 May 2017
5 GLOBAL JPY 75,000 1.900 99.900 25 Jun 2008 22 Jun 2018
1 GLOBAL USD 1,000 4.000 99.170 13 Jan 2011 13 Jan 2021
2. Government-guaranteed bonds
(as of 31 March 2015)
Appendix
Series Number Format Currency Issue Size
(in millions) Coupon Issue Price (%) Issue Date Maturity Date
36 EURO AUD 100 3mBBSW+83bp 100 21 May 2013 21 May 2018
38 EURO USD 100 3mL+50bp 100 11 Jul 2013 11 Jul 2018
39 EURO USD 100 3mL+65bp 100 22 Jul 2013 22 Jul 2020
40 GLOBAL USD 1,500 2.500% 99.855 12 Sep 2013 12 Sep 2018
41 EURO AUD 110 4.20% 99.98 26 Nov 2013 26 Nov 2018
42 GLOBAL USD 1,000 2.125% 99.892 6 Mar 2014 6 Mar 2019

JFM Annual Report 2015 | 107
Review
and P
lanO
perations
Manag
ement S
tructureJFM
’s Role in
Local Governm
ent FinanceFinancial S
ectionA
pp
end
ix / JFM
Data
FY2008
The Japan Finance Organization for Municipal Enterprises (the Predecessor of JFM) was established pursuant to the Japan Finance Organization for Municipal Enterprises Law on 1 August 2008.Succeeded the assets and assumed the liabilities of the Predecessor and commenced operations on 1 October 2008.
2009 Reorganized as the Japan Finance Organization for Municipalities based on the partial amendment of the Japan Finance Organization for Municipal Enterprises Law (1 June 2009).
2011 Created a new special lending rate program by integrating the existing special lending rate and the extra-special lending rate programs.
History of JFM
FY1957 Established pursuant to the Japan Finance Corporation for Municipal Enterprises Law (1 June 1957).
1960 Started making loans entrusted by Agriculture, Forestry and Fisheries Finance Corporation.
1966 Started a lending program that applied special lending rates.
1967 Started receiving subsidies from the national treasury.
1970 Started a program of contributions of the earnings from municipally operated racing and established the Fund for Lending Rate Reduction.
1972 Started lending to local government road corporations and local government land development corporations.
1978 Included the three types of special projects (in the general account-related business category) in the scope of lending.
1983 Started issuing foreign currency–denominated bonds.
1989 Established the Reserve for Losses on Refi nancing of Bonds.
1990 Started a lending program that applied extra-special lending rates.
1998
Based on the policy titled “Regarding Reorganization and Rationalization of Special Public Institutions,” which was approved by the Cabinet on 24 September 1997, one part-time senior executive director was added; the Japan Finance Corporation for Municipal Enterprises Management Council was established; and JFM addressed the phased abolition of subsidies from the national treasury over a three-year period.
2001
Subsidies from the national treasury were abolished and the Reserve for Interest Rate Reduction was established.Started offering borrowers two interest rate options: fi xed rates or adjustable rates.Established the prepayment with penalty system. Started issuing FILP agency bonds.The Special Public Institutions Reform Basic Law was passed, and the Reorganizations and Rationalization Plan for Special Public Institutions was approved by the Cabinet.
2002 The policy titled the “Reform of the Four Highway-Related Public Corporations, International Hub Airports and Policy-Based Finance Institutions” was approved by the Cabinet.
2005The “Priority Policy for Administrative Reform,” which included the proposal for abolition of the Predecessor in fi scal 2008, a new structure utilizing capital markets, and transitional measures to prepare for the abolition, was approved by the Cabinet.
2006
The Administrative Reform Promotion Law was passed.The Headquarters for the Promotion of the Reform of Policy-Based Finance and the Cabinet Headquarters for the Promotion of Administrative Reform (HQPAR) set forth the plan titled “System Design Regarding the Reform of Policy-Based Finance.The six associations of local governments submitted the “Local governments’ draft proposal for designing a new system after the abolition of the Predecessor.”
2007
The Japan Finance Organization for Municipal Enterprises Law was passed. The Act on Assurance of Sound Financial Status of Municipalities was passed.Implemented prepayment without penalty and other measures in accordance with the national government’s policy on reducing local governments’ debt service burden. The program ended in fi scal 2008.
2008 Dissolved based on the Japan Finance Organization for Municipal Enterprises Law (1 October 2008).
History of the Predecessor
Organization History
JFM DataAppendixJFM Data

JFM Annual Report 2015 | 108
Ap
pend
ix / JFM D
ata
AppendixJFM Data
CorporateAuditors
Supervisory Committee
Internal audit, internal controlInternal Auditor ………………………………………
President and CEODeputy PresidentSenior Executive
Directors
Risk Management
Personnel and Secretariat
Integrated risk management, ALM operations
Secretariat, personnel, human resources development
Corporate Planning
Corporate Planning Department
…
…
…
Corporate planning, budget control, matters related to the Representative Board and the Supervisory Committee, ALM Planning, public relations, communication and coordination with other organizations
Administration Department
General Affairs
Accounting …
…General affairs including compensation and bene�ts and legal review
Budget, settlement of accounts, matters related to contributions from municipally operated racing, accounting, receipts and disburse-ments, external audit
Information SystemsManagement
…Information systems management
Local GovernmentSupport Department
Research Planning
Financial Activities Support …
…Research and planning to enhance the local government support operations, research of �nancial situation
Financial advisory services to local governments
Finance Department
Funding Administration
Finance
…
…Fund-raising planning, fund-raising operations, IR, Rating
Funding administration and management of fund investment
Loan Administration
Lending Management
Loan Department
…
…Planning and control of lending operations, calculation and setting of lending rates, lending operations (excluding operations performed by Loan Administration)
Lending operations (excluding municipal enterprises with the exception of public housing) management of loan receivables, collection of loan principal and interest, entrusted loan operations, investigations of regional �nancial conditions
………………………………………Credit Research and Analysis Credit analysis, credit management
Representative Board
As of 1 April 2015
Organization Chart
JFM Data

JFM Annual Report 2015 | 109
Review
and P
lanO
perations
Manag
ement S
tructureJFM
’s Role in
Local Governm
ent FinanceFinancial S
ectionA
pp
end
ix / JFM
Data
Directors and Corporate Auditors
President and CEO Yuji WatanabeDeputy President Kinya TakinoSenior Executive Directors Eiichi Sugimura, Yasuro Narita, Junichi Yoshitake (part-time)Corporate Auditors Aiichirou Hiraguchi, Masaharu Hamakawa (part-time)
Contact Information
Postal address: Shisei Kaikan, 1-3 Hibiya Koen, Chiyoda-ku, Tokyo 100-0012, JapanTel: +81-3-3539-2697Fax: +81-3-3539-2615E-mail: [email protected] ticker: JFM Govt
(Photo provided by The Tokyo Institute for Municipal Research)