Embed Size (px)
Citation preview

1111111111111111111inumuu~(12) United States Patent
Djorgovski et al.
(54) SYSTEMS AND METHODS FOR DATAVISUALIZATION USINGTHREE-DIMENSIONAL DISPLAYS
(71) Applicant: California Institute of Technology,Pasadena, CA (US)
(72) Inventors: Stanislav G. Djorgovski, Altadena, CA(US); Ciro Donalek, Pasadena, CA(US); Scott Davidoff, Los Angeles, CA(US); Vicente Estrada, RanchoCucamonga, CA (US)
(73) Assignee: California Institute of Technology,Pasadena, CA (US)
(*) Notice: Subject to any disclaimer, the term of thispatent is extended or adjusted under 35U.S.C. 154(b) by 0 days.
(21) Appl. No.: 15/276,742
(22) Filed: Sep. 26, 2016
(65) Prior Publication Data
US 2017/0092008 Al Mar. 30, 2017
Related U.S. Application Data
(60) Provisional application No. 62/232,119, filed on Sep.24, 2015, provisional application No. 62/365,837,filed on Jul. 22, 2016.
(51) Int. Cl.G09G 5/00 (2006.01)G06F 3/00 (2006.01)
(Continued)(52) U.S. Cl.
CPC .......... G06T 19/006 (2013.01); G06K 9/4671(2013.01); G06K 9/6267 (2013.01);
(Continued)
(58) Field of Classification SearchCPC . G06F 3/04845; G06T 19/00; G06T 2200/16;
G06T 2219/028; G06T 11/206; G06Q40/04; G06Q 40/06
See application file for complete search history.
30 D2te ̀ilcualrzalan Cornpuiin9 SycG;m
72___________________
t;etwc k InNr~aoe
.........................
I/O Interface
(io) Patent No.: US 9,665,988 B2(45) Date of Patent: May 30, 2017
(56) References Cited
U.S. PATENT DOCUMENTS
6,057,856 A 5/2000 Miyashita et al.6,154,723 A 11/2000 Cox eta].
(Continued)
FOREIGN PATENT DOCUMENTS
Wo 2014130044 Al 8/2014Wo 2014193418 Al 12/2014
OTHER PUBLICATIONS
Khairi Reda, Alessandro Febretti, Aaron Knoll, Jillian Aurisano,Jason Leigh, Andrew Johnson, Michael E. Papka and Mark Hereld,"Visualizing Large, Heterogeneous Data in Hybrid-Reality Envi-ronments", IEEE Computer Graphics and Applications, Jul./Aug.2013, p. 38-48.*
(Continued)
Primary Examiner Sing-Wai Wu
(74) Attorney, Agent, or Firm KPPB LLP
(57) ABSTRACT
Data visualization systems and methods for generating 3Dvisualizations of a multidimensional data space aredescribed. In one embodiment a 3D data visualization appli-cation directs a processing system to: load a set of multidi-mensional data points into a visualization table; createrepresentations of a set of 3D objects corresponding to theset of data points; receive mappings of data dimensions tovisualization attributes; determine the visualization attri-butes of the set of 3D objects based upon the selectedmappings of data dimensions to 3D object attributes; updatea visibility dimension in the visualization table for each ofthe plurality of 3D object to reflect the visibility of each 3Dobject based upon the selected mappings of data dimensionsto visualization attributes; and interactively render 3D datavisualizations of the 3D objects within the virtual space fromviewpoints determined based upon received user input.
30 Claims, 34 Drawing Sheets(30 of 34 Drawing Sheet(s) Filed in Color)
an,ory
li4v e`ar McLaeata Re ored li30 hAo3e~
(Optional) Viewpoin -7?2, L14 --
. -Data i~~n,e_n..i ns W-Merne Y Date
li TA Ppi"g I Strurhrres Po., Data I7=
--------- 7 6 T-8
JU M hi V. .
.nH P_ 710 _-------__~__r___ .-------__
3D Ren
zrinh__
~.Disolzy Dri~ren Ce:nara Driver.
Engina714
j724 732
___
-----------------------------------------------------------
704
https://ntrs.nasa.gov/search.jsp?R=20170004951 2018-06-08T21:36:55+00:00Z

US 9,665,988 B2Page 2
(51) Int. Cl.
G06Q 40/00 (2012.01)
G06T 19/00 (2011.01)
G06T 17/00 (2006.01)
G06T 15/00 (2011.01)
G06T 19/20 (2011.01)
G06T 7/00 (2017.01)
H04N 5/225 (2006.01)
G06K 9/62 (2006.01)
G06K 9/46 (2006.01)
G06T 13/20 (2011.01)
G06T 7/20 (2017.01)
(52) U.S. Cl.
CPC ................ G06T 7/004 (2013.01); G06T 7/20
(2013.01); G06T 13/20 (2013.01); G06T
15/005 (2013.01); G06T 17/00 (2013.01);
G06T 19/20 (2013.01); H04N 5/2256
(2013.01); G06T 2200/04 (2013.01)
(56) References Cited
U.S. PATENT DOCUMENTS
8,773,508 B2 * 7/2014 Daniel .................. G06T 7/0065348/42
2004/0041846 Al* 3/2004 Hurley ................... G06Q 40/04715/848
2005/0223337 Al* 10/2005 Wheeler ............. G06F 3/04845715/806
2006/0069635 Al* 3/2006 Ram ...................... G06Q 30/08705/37
20 10/03 162 84 Al* 12/2010 Jeong ...................... G06T 5/002382/162
2013/0097563 Al 4/2013 Pacheco Rodrigues Velho et al.2015/0205840 Al 7/2015 Yerli
OTHER PUBLICATIONS
"31) Visualization Perspective for PDI 4 Pentaho Data Mining
Pentaho Wiki", printed from http://wilci.pentaho.com/display/
DATAMINING/3D+Visualization+Perspective+for+PDI+4 on May
25, 2016, 5 pgs."Amra46p", printed from http://i.imgur.com/aMRA46p.png on May19, 2016, 1 pg."castAR Wand", printed from https:Hs3.amazonaws.com/ksr/assets/001/081A88/765f86d82ae5f37a5 d4d0a27dad4534b large.jpg?1381537591 on May 19, 2016, 1 pg."InterSense, Precision Motion Tracking Solutions, IS-900 System",printed from http://www.intersense.com/pages/20/14 on May 19,2016, 2 pgs."Magic Wand Programmable TV Remote", printed from http://www.thinkgeek.com/product/cf9b/ on May 19, 2016, 4 pgs."PPT Wand EST, Engineering Systems Technologies GmbH &Co. KG", printed from http://www.est-kl.com/es/products/motion-tracking/worldviz/ppt-wand.html on May 19, 2016, 4 pgs."Steal this idea: VR Wand", printed from https:Hforums.oculus.com/community/discussion/1620/steal-this-idea-vr-wand on May19, 2016, 21 pgs."Virtual Reality: Input devices. Technologies for the direct interac-tion", Curs 2012/2013, 86 pgs."Virtual Reality: Interface Devices", printed from http://archive.ncsa.illinois.edu/Cyberia/VETopLevels/VRInterface.html on May19, 2016, 3 pgs."VR Wand/Stylus Concept", printed from https://www.reddit.com/r/oculus/comments/22mzis/vrwandstylus concept/ on May 19,2016, 4 pgs.Alger, Mike, "Visual Design Methods for Virtual Reality", Sep.2015, 98 pgs.Brath, Richard, "31) InfoVis is Here to Stay: Deal with It", IEEEVIS International Workshop on 3DVis, 2014, 7 pgs.
Cabral, Marcio C. et al., "On the usability of gesture interfaces invirtual reality environments", CLIHC '05 Proceedings of the 2005Latin American conference on Human-computer interaction, Oct.2005, 10 pgs.Chandler, Tom et al., "Immersive Analytics", IEEE, 2015, 8 pgs.Chen, Jim X., "Data Visualization and Virtual Reality", Handbookof Statistics, vol. 24, 2005, 25 pgs.Cioc, Alex, "Immersing Yourself in Your Data: Using Virtual WorldEngines to Solve "Big" Data", printed from http://www.astrobetter.com/blog/2013/03/25/immersing-yourself-in-your-data/ on Jun. 25,2016, Mar. 25, 2013, 6 pgs.Cruz-Neira, Carolina et al., "Scientists in Wonderland: A Report onVisualization Applications in the CAVE Virtual Reality Environ-ment", IEEE, 1993, pp. 59-66.De Haan, Gerwin et al., "Towards Intuitive Exploration Tools forData Visualization in VR", VRST '02, Nov. 11-13, 2002, 8 pgs.Djorgovski, S. G. et al., "Immersive Data Visualization",Astrolnformatics 2012, Redmond, WA, Sep. 2011, 8 pgs.Djorgovski, S. G. et al., "The MICA Experiment: Astrophysics inVirtual Worlds", SLACTIONS 2012 International Research Con-ference on Virtual Worlds, eds. L. Morgado, Y. Sivan, A.M. Maia,et al., 2012, pp. 49-57.Donalek, Ciro et al., "Immersive and Collaborative Data Visualiza-tion Using Virtual Reality Platforms", IEEE, 2014, 6 pgs.Etemadpour, Ronak et al., "Choosing Visualization Techniques forMultidimensional Data Projection Tasks: A Guideline withExamples", Computer Vision, Imaging and Computer GraphicsTheory and Applications, vol. 598, Mar. 2015, 21 pgs.Gardner, M. R. et al., "The Immersive Education Laboratory:understanding affordances, structuring experiences, and creatingconstructivist, collaborative processes, in mixed-reality smart envi-ronments", EAI Endorsed Transactions on Future Intelligent Edu-cational Environments, Sep. 9, 2014, 13 pgs.Heer, Jeffrey et al., "A Tour Through the Visualization Zoo",Communications of the ACM, vol. 53, No. 6, 2010, 9 pgs.Heer, Jeffrey et al., "Animated Transitions in Statistical DataGraphics", IEEE Transactions on Visualization and ComputerGraphics, vol. 13, No. 3, Nov./Dec. 2007, pp. 1240-1247.Hollerer, Tobias et al., "Exploring MARS: Developing Indoor andOutdoor User Interfaces to a Mobile Augmented Reality System",Computers & Graphics, vol. 3, 1999, pp. 779-785.Jarocsh, Rafael et al., "Interactive exploration of immersive illu-minated 3D scatterplots ProjINF", retrieved from https://www.informatik.uni-stuttgart. de/studium/interessierte/bsc-studiengaenge/informatik/proj ekt-inf/2015-06-26/Gruppe6.pdf,Jun. 26, 2015, 6 pgs.Luo, Xun, "PACE: A Framework for Personalized Visualization andScalable Human Computer Interaction", Thesis of Xun Luo, 2008,187 pgs.Maddix, Karl, "Big Data VR Challenge Winners!", printed fromhttp://www.mastersofpie.com/big-data-vr-challenge-winners/ onJun. 21, 2016, 17 pgs.Maddix, Karl, "Big Data VR Challenge Phase 1", printed fromhttp://www.mastersofpie.com/big-data-vr-challenge/ on Jun. 21,2016, Jun. 1, 2015, 10 pgs.Maddix, Karl, "Big Data VR Challenge Phase 2 Update", printedfrom http://www.mastersofpie.com/big-data-vr-challenge-phase-2-update/ on Jun. 21, 2016, Jun. 26, 2015, 14 pgs.Mart, Bernard, "How VR Will Revolutionize Big Data Visualiza-tions", retrieved from: http://www.forbes.com/sites/bemafdmarr/2016/05/04/how-vr-will-revolutionize-big-data-visualizations/print/, May 4, 2016, 4 pgs.Milgram, Paul et al., "A Taxonomy of Mixed Reality VisualDisplays", retrieved from http://vered.rose.utoronto.ca/people/pauldir/IEICE94/ieice.html; IEICE Trans, on Info. Syst., vol.E77-D, No. 12, Dec. 12, 1994, on Oct. 16, 2003 15 pgs.Moran, Andrew et al., "Improving Big Data Visual Analytics withInteractive Virtual Reality", arXiv:1506.08754v2 [cs.HC], Oct. 6,2015, 6 pgs.Nagel, Henrik R. et al., "Methods for Visual Mining of Data inVirtual Reality", In Proceedings of the International Workshop onVisual Data Mining, in conjunction with ECML/PKDD2001, 2nd

US 9,665,988 B2Page 3
(56) References Cited
OTHER PUBLICATIONS
European Conference on Machine Learning and 5th EuropeanConference on Principles and Practice of Knowledge Discovery inDatabases, 2001, 15 pgs.Raja, Dheva et al., "Exploring the Benefits of Immersion in AbstractInformation Visualization", Virginia Tech, Department of ComputerScience, 2004, 7 pgs.St. John, Mark et al., "The Use of 2D and 3D Displays forShape-Understanding versus Relative-Position Tasks", Human Fac-tors: The Journal of the Human Factors and Ergonomics Society,2001, pp. 79-98.Takahashi, Dean, "astAR will return $1Min Kickstarter money andpostpone augmented reality glass shipments", printed from http://venturebeat.com/2015/12/16/castar-will-return-Im-in-Icickstarter-money-and-postpone-augmented-reality-glasses-shipments/ onMay 19, 2016, 7 pgs.Takahasi, Dean, "CastAR shows how it will turn your tabletop intoan animated gaming world", printed from http://venturebeat.com/2016/04/11/castars-latest-demos-show-how-it-plans-to-enable-tabletop-mixed-reality-games/ on May 19, 2016, 8 pgs.Tanriverdi, Vildan et al., "VRID: A Design Model and Methodologyfor Developing Virtual Reality Interfaces", VRST'01, Nov. 15-17,2001, 8 pgs.
The Uber Maker, "How to: Connect your Wiimote to your computervia Bluetooth", retrieved from http://www.instructables.com/id/
How-To-Connect-your-Wiimote-to-your-PC-via-Blueto/ in 2016, 6pgs.Tollerud, Erik, "An Analysis of 3D Data Visualization in NumericalModels", 2006, 24 pgs.White, Sean et al., "Visual Hints for Tangible Gestures in Aug-mented Reality", Proceedings of the Sixth IEEE and ACM Inter-national Symposium on Mixed and Augmented Reality, Nov. 13-16,2007, pp. 47-50.White Paper Intel Labs, "ScienceSim: A virtual environment forcollaborative visualization and experimentation", Intel Labs, 2009,5 pgs.Wilhelm, Parker, "Microsoft HoloLens Bluetooth Clicker is our firstglimpse at a possible controller", printed from http://www.techradar.com/us/news/wearables/microsoft-s-hololens-bluetooth-clicker-is-our-first-glimpse-at-any-controller-1315623 on Jun. 25,2016, Feb. 23, 2016, 10 pgs.International Search Report and Written Opinion for InternationalApplication No. PCT/US2 0 1 6/0 53 84 2, Search completed Jan. 11,2017, Mailed Jan. 11, 2017, 12 Pgs.
* cited by examiner

U.S. Patent May 30, 2017
FIG. 1A
FIG. 1B
FIG. lc
Sheet 1 of 34 US 9,665,988 B2

U.S. Patent May 30, 2017 Sheet 2 of 34 US 9,665,988 B2

U.S. Patent May 30, 2017 Sheet 3 of 34 US 9,665,988 B2
U.S. Patent May 30, 2017 Sheet 4 of 34 US 9,665,988 B2
.......... ...

U.S. Patent May 30, 2017 Sheet 5 of 34 US 9,665,988 B2

U.S. Patent May 30, 2017 Sheet 6 of 34 US 9,665,988 B2
CDLL

U.S. Patent May 30, 2017 Sheet 7 of 34 US 9,665,988 B2
.: ~ . t~.~
17L LL
_ ....::.
LL

U.S. Patent May 30, 2017 Sheet 8 of 34 US 9,665,988 B2
>. w
v :;;ti<iv..:En. .
riff •}:
...... EEE....E....E....EEEEE EEEEEE EEEEEE EEEEE EEE E E EEEEEErEE EE E:.\v E:E:E:E:E:E:E::E:E:iE:E:iE:::
:^Erg
•.:T::>:::::r'~ co- Y:;:::~~:~r:•`':::::
X4}•.:.4{..
''vii•}:}j: rii:4Y'ri .•̂ii4M1i•. ;.
p 44
•v~•t{~'{M1h
'8:
EF ..
Ec
r2K'
Foam

U.S. Patent May 30, 2017 Sheet 9 of 34 US 9,665,988 B2

U.S. Patent May 30, 2017 Sheet 10 of 34 US 9,665,988 B2

U.S. Patent May 30, 2017 Sheet 11 of 34 US 9,665,988 B2

U.S. Patent May 30, 2017 Sheet 12 of 34 US 9,665,988 B2

U.S. Patent May 30, 2017 Sheet 13 of 34 US 9,665,988 B2
6

U.S. Patent
IIDc--
May 30, 2017 Sheet 14 of 34 US 9,665,988 B2

U.S. Patent May 30, 2017 Sheet 15 of 34 US 9,665,988 B2

U.S. Patent May 30, 2017 Sheet 16 of 34 US 9,665,988 B2
coLO
cc

8D Data Visualization Co
mput
ing Sy
stem
Proc
esso
r
702
Netw
ork In
terf
ace 706
I/O In
terf
ace
708
Memory
l l
3D Model
l l 722
Avat
ar Met
adat
a(O
ptio
nal)734
-------------
1 - ___________~
Rend
ered
View
poin
ts726 1
--- ---
--- ---
--- ---
--- ---
--- ---
--- ---
--1
1 ?
l l
Data Dimensions
; In-Memory Data
r E
Mappings3
Stru
ctur
es
i Pose Dat
a E
7201;
718;
1 7281
L_---______
_._.__________ ____________
3D Data
Multi-dimensional IMachine Vision
Visualization
data
set
Application
Appl
icat
lorl
0 716
730
------
------
------
------
------
------
------
------
------
------
------
------
------
------
------
------
, ----
--------
--------
--------
--------
--------
---
3D Rendering
Disp
lay Dr
iver
s I
Camera Dri
vers
Engine
714
724 1
782
0S
712 704 700

U.S. Patent May 30, 2017 Sheet 18 of 34 US 9,665,988 B2
802
804
806
808
----------------------
Start800
------------------------t -------------------------
Load data points intoin-memory data
structures
Instantiate 3D objects
Determine attributes o3D objects using datadimension mappings
Determine user pose
890"~ Illuminate 3D objectsbased upon user pose
(optional)
812 Determine visibility ofinteraction primitivesbased upon user pose
(optional)
814
816
Render 3D display
complete?
FIG. Yes
-------- ---Complete
No
818
I
1_f
=" Modify data -
mappings?
Yes

U.S. Patent May 30, 2017 Sheet 19 of 34 US 9,665,988 B2
852
854
856
858
860
862
864
866
Start
Instantiate 3D objects
Determine attributes o3D objects using datadimension mappings
T................... ......create at least one
group 3D object usinggroups of visible 3D
Determine user pose
Illuminate group 3Dobjects based upon
user pose
Collision processing
Render 3D display
complete?
lies- -----------g---------- -Complete
860
No
Yes

U.S. Patent May 30, 2017 Sheet 20 of 34 US 9,665,988 B2

U.S. Patent May 30, 2017 Sheet 21 of 34 US 9,665,988 B2
ht

U.S. Patent May 30, 2017 Sheet 22 of 34 US 9,665,988 B2

U.S. Patent May 30, 2017
co
0CD
cD0
x--
It
r
N
C)CD
m
Sheet 23 of 34 US 9,665,988 B2
a
LL

U.S. Patent May 30, 2017 Sheet 24 of 34 US 9,665,988 B2

U.S. Patent May 30, 2017 Sheet 25 of 34 US 9,665,988 B2

U.S. Patent May 30, 2017 Sheet 26 of 34 US 9,665,988 B2

U.S. Patent May 30, 2017 Sheet 27 of 34 US 9,665,988 B2
~s
4.
kV
k { : •Y hrY
C6A
vtir. o;,
a• r
pp
..,.. ~ ~;:" <: {~•' `.air
p
as
axe
ii4

U.S. Patent
1302
1304
1300
May 30, 2017
Start
Sheet 28 of 34
Obtain poseinformation
Select 3D object orvertex within FOV
Determine direction ofillumination
1303 Illuminate 3D object orvertex using
directional illumination
1310
tional 3D obje-within FOV?
No
Complete
US 9,665,988 B2
1300
Yes

U.S. Patent May 30, 2017 Sheet 29 of 34 US 9,665,988 B2

U.S. Patent May 30, 2017 Sheet 30 of 34 US 9,665,988 B2
CDCD
Co

U.S. Patent May 30, 2017 Sheet 31 of 34 US 9,665,988 B2
R

U.S. Patent May 30, 2017
A
a•
R xW
tiAa
& O P •
4
y t
AT
A R
s £
Sheet 32 of 34 US 9,665,988 B2
R ~
~ xR
~ RG
;: xa
i\ A
c~Ob
ul
x a
A'A~
Ra
LL

1706
9 8®.$e
8 6/
--I
1710
1708
1'710
1708
FIG. 17
Flu'. 17E
b
1710
M
702
°C w 0 t.~0 J
1712
w w
1702
0 w

U.S. Patent May 30, 2017 Sheet 34 of 34 US 9,665,988 B2

US 9,665,988 B2
SYSTEMS AND METHODS FOR DATAVISUALIZATION USING
THREE-DIMENSIONAL DISPLAYS
CROSS-REFERENCE TO RELATED 5
APPLICATIONS
The current application claims priority under 35 U.S.C.§119(e) to U.S. Provisional Patent Application Ser. No.62/232,119 entitled "Novel Method for a Visual Exploration 10
of High-Dimensionally Data Sets Using Virtual Reality" toDjorgovski et al., filed Sep. 24, 2015 and U.S. ProvisionalPatent Application Ser. No. 62/365,837 entitled "Systemsand Methods for Data Visualization Using Three-Dimen-sional Displays" to Djorgovski et al., filed Jul. 22, 2016. The 15disclosures of U.S. Provisional Patent Application Ser. Nos.62/232,119 and 62/365,837 are hereby incorporated byreference in their entirety.
STATEMENT OF FEDERAL SUPPORT 20
This invention was made with government support underGrant No. HCC0917814 awarded by the National ScienceFoundation. The government has certain rights in the inven-tion. The invention described herein was made in the per- 25formance of work under a NASA contract NNNI2AAOIC,and is subject to the provisions of Public Law 96-517 (35USC 202) in which the Contractor has elected to retain title.
III IIIIDZ6]=IIlI11►Wa011I to] 0
The present invention relates generally to data visualiza-tion and more specifically to the visualization of complex,multidimensional data using three-dimensional display tech-nologies including (but not limited to) virtual reality (VR), 35mixed reality (MR), and augmented reality (AR) displays.
II?ITO1601.E618101K
Data visualization commonly refers to techniques utilized 40to communicate data or information by encoding it as visualobjects that can be displayed via a computer. Visualizationis an essential component of any data analysis and/or datamining process. In many instances, a graphical representa-tion of the geometry and topology of a data distribution can 45enable selection of appropriate analysis tools revealingfurther insights, and the interpretation of the results. In theera of "big data", the key bottleneck in the extraction ofactionable knowledge from high dimensionality data sets isoften a user's (in)ability to visualize patterns in more than 3 50dimensions.Computer displays typically display information in two
dimensions (21)). However, a variety of three-dimensional(3D) display technologies are emerging that simulate depththrough a number of different visual effects including Ste- 55reoscopy in which images rendered from different view-points are displayed separately to the left and right eye. Thetwo images are then combined in the brain to give theperception of 3D depth. A number of head mounted 3Ddisplay technologies are currently available. Paul Milgram 60and Fumio Kishino, in a paper entitled "A Taxonomy ofMixed Reality Visual Displays" published in IEICE Trans-actions on Information Systems, Vol. E77-D, No. 12 inDecember 1994 (the disclosure of which is incorporated byreference herein in its entirety) proposed the concept of a 65"virtuality continuum" that relates to the mixture of classesof objects presented in any particular display situation,
2where real environments constitute one end of the con-tinuum, and virtual environments constitute the opposite endof the continuum. In their paper, Milgram and Kishinoexplain the difference between virtual reality and mixedreality as follows:The conventionally held view of a Virtual Reality (VR)
environment is one in which the participant-observer istotally immersed in, and able to interact with, a completelysynthetic world. Such a world may mimic the properties ofsome real-world environments, either existing or fictional;however, it can also exceed the bounds of physical reality bycreating a world in which the physical laws ordinarilygoverning space, time, mechanics, material properties, etc.no longer hold. What may be overlooked in this view,however, is that the VR label is also frequently used inassociation with a variety of other environments, to whichtotal immersion and complete synthesis do not necessarilypertain, but which fall somewhere along a virtuality con-tinuum. In this paper we focus on a particular subclass of VRrelated technologies that involve the merging of real andvirtual worlds, which we refer to generically as MixedReality (MR)."(Milgram, Paul, and Fumio Kishino. "A taxonomy of mixed
reality visual displays." MICE TRANSACTIONS on Infor-mation and Systems 77.12 (1994), p. 1321).Within the realm of mixed reality, a further distinction can
be drawn between Augmented Reality (AR), and MixedReality (MR). Both AR and MR displays can be imple-mented using transparent display technology and/or bycapturing images of a scene and using the captured imagesto render displays combining the real world scene and thevirtual objects. The term AR is typically used to describe 3Ddisplay technologies that display virtual objects that providecontextually relevant information to a real world scene. ARis often used to refer to an experience in which real worldobjects are augmented or supplemented by computer-gen-erated sensory input. MR, sometimes referred to as hybridreality, typically involves the merging of real and virtualworlds to produce new environments and visualizationswhere real and virtual objects co-exist and interact in realtime.AR, MR, and VR displays can all have a similar goal of
immersing a user in an environment that is either partially orentirely virtual. With AR and MR, users continue to be intouch with the real world while interacting with virtualobjects around them. With VR, the user is isolated from thereal world while immersed in a world that is completelysynthesized (although may include virtual analogues to realworld objects).
SUMMARY OF THE INVENTION
Humans have a remarkable pattern recognition systemand can acquire more information through vision than all theother senses combined. Visualization provides an ability tounderstand large amounts of data by mapping abstractinformation to more easily understandable visual elements.Systems and methods in accordance with various embodi-ments of the invention create 3D data visualizations thatincrease a viewer's ability to explore an even higher dimen-sionality in data and observe complex patterns within thedata. Humans are biologically optimized to see the worldand the patterns in it in three dimensions. Therefore, pre-sentation of data via a 3D display as a multidimensional (i.e.,with the number of displayed data dimensions of 3 orgreater) data visualization enables identification of mean-ingful structures in data (e.g., clusters, correlations, outliers)

US 9,665,988 B23
that may contain an actionable knowledge and that oftenreside in higher dimensional spaces and which are notreadily observable through visualization of data via conven-tional 2D display technologies. Furthermore, immersiveAR,MR, and VR environments naturally support collaborative 5
data visualization and exploration, and are conducive toscientists interacting with their data along side of theircolleagues in shared virtual spaces.
In discussing data visualization, a distinction must bemade between the dimensionality of the graphical display iodevice, (e.g., a printed paper or a flat screen being typical 2Ddevices, while VR/AR headsets represent typical 3D displaydevices) and the dimensionality of the data, which can bethough of as the number of features/quantities/parametersassociated with each data item (e.g. a row in a spreadsheet 15could be a single data item, and the number of columnswould be its dimensionality). By way of further illustration,a data set with 3 column entries would be 3-dimensional, adata set with 20 columns would be 20-dimensional. Eitherdataset can be represented on a 3D display device. An 20additional distinction is the dimensionality of the data spacewithin which the data are being rendered or visualized. Upto 3 dimensions (axes) of such a data visualization space canbe spatial; additional dimensions may be encoded throughthe colors, transparencies, shapes and sizes of the data 25points. In this way, more than three data dimensions can bevisualized in a multidimensional data space via a 3D displaydevice. If a data set has N dimensions, a subset of k of themmay be visualized at any given time, with k_N. If k>3, upto 3 dimensions can be encoded as spatial positions (XYZ) 30in a data visualization space, with the remainder beingrepresented through characteristics of the data points such ascolors, sizes, and shapes. In a scatter plot each data item(data point) is represented as an individual geometricalobject, e.g., a dot, a square, a sphere, etc., with some spatial 35coordinates (XYZ), and other visible properties (e.g., colors,sizes, etc.) encoding the additional data dimensions. Thechallenge is in maximizing the number of simultaneouslyvisualized data dimensions k that can be readily understoodby a human. 40
In a number of embodiments, three-dimensional datavisualization systems provide can provide data visualiza-tions in a variety of display contexts. In certain embodi-ments, multidimensional data is rendered for in a 3D datavisualization space that can be viewed, navigated, and 45manipulated using a traditional 2D display device (e.g., a flatscreen). In many embodiments, an optimized rendering ofup to 10 or more data dimensions is used to generate a 3Ddata visualization of the multidimensional data space. Inseveral embodiments, the three-dimensional data visualiza- 50tion systems can provide an enhanced intuitive comprehen-sion of the multidimensional data space, when displayedusing a 3D display device (e.g., a VR/AR headset). Immer-sion in the multidimensional data space using an immersive3D display can enhance the human ability to understand the 55geometry and the relationships (clusters, correlations, out-liers, anomalies, gaps, etc.) that may be present in the dataas compared to a traditional data visualization methodologyinvolving the use of a 2D display.One embodiment of the invention includes: a display 60
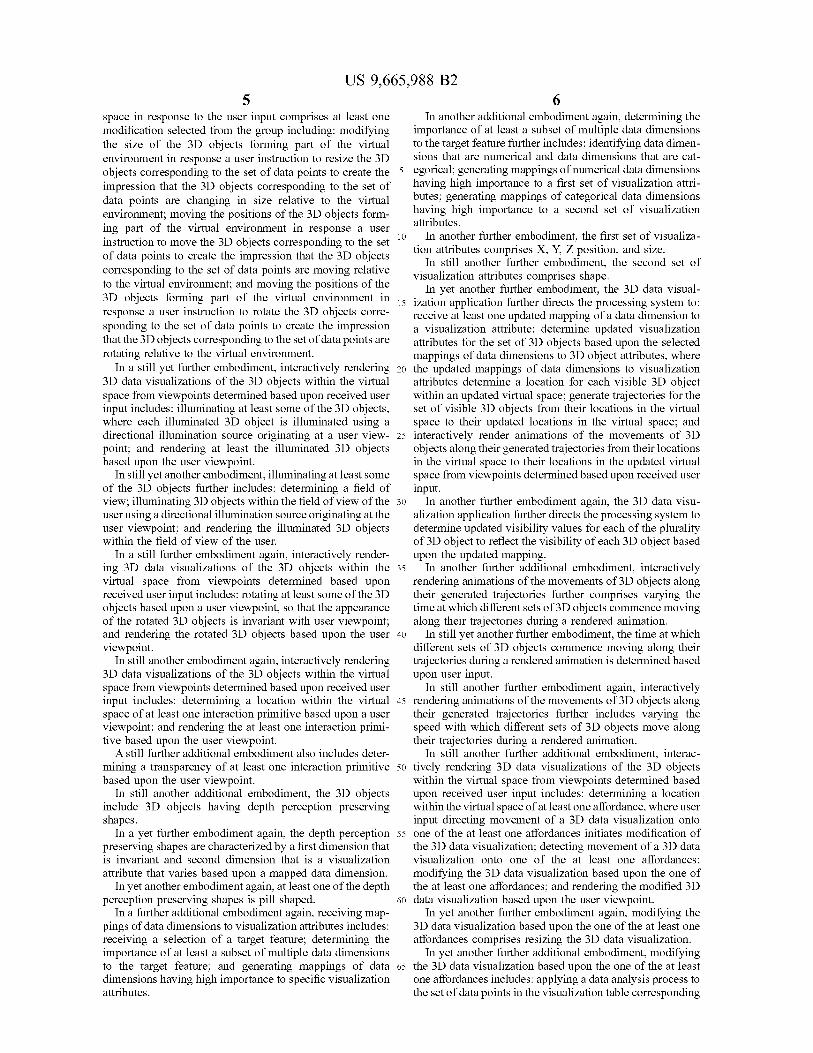
device; and a computing system, including memory con-taining a 3D data visualization application and a processingsystem. In addition, the 3D data visualization applicationdirects the processing system to: load a set of data points intoa visualization table in the memory, where each data point 65includes values in multiple data dimensions and an addi-tional visibility value is assigned to each data point in a
_►,
visibility dimension within the visualization table; createrepresentations of a set of 3D objects corresponding to theset of data points, where each 3D object has a set ofvisualization attributes that determine the manner in whichthe 3D object is rendered and the visualization attributesinclude a location of the 3D object within a virtual spacehaving three spatial dimensions; receive mappings of datadimensions to visualization attributes; determine the visu-alization attributes of the set of 3D objects based upon theselected mappings of data dimensions to 3D object attri-butes, where the selected mappings of data dimensions tovisualization attributes determine a location for each visible3D object within the virtual space; update the visibilitydimension in the visualization table for each of the pluralityof 3D object to reflect the visibility of each 3D object basedupon the selected mappings of data dimensions to visual-ization attributes; and interactively render 3D data visual-izations of the 3D objects within the virtual space fromviewpoints determined based upon received user input.In a further embodiment, the display device is a 3D
display device, and interactively rendering 3D data visual-izations of the 3D objects within the virtual space fromviewpoints determined based upon received user input com-prises rendering stereo images displayed via the 3D displaydevice.In another embodiment, the 3D data visualization appli-
cation is implemented using a 3D rendering engine.In a still further embodiment, the implementation of the
3D data visualization application further relies upon scriptsthat execute via the 3D rendering engine.In still another embodiment, the visualization attributes
include at least one attribute selected from the group of: XCoordinate, Y Coordinate, Z Coordinate, Shape, Size, ColorPalette, Color Map, Color Scale, Transparency. ID, URL,Mask, Show By, Motion of the 3D Object, Sonification,Haptic Feedback, and Vibrotactile Feedback.In a yet further embodiment receiving mappings of data
dimensions to visualization attributes further includesreceiving user selections of mappings of data dimensions tovisualization attributes.In yet another embodiment, receiving mappings of data
dimensions to visualization attributes further includesretrieving a stored set of mappings of data dimensions tovisualization attributes.In a further embodiment again, interactively rendering 3D
data visualizations of the 3D objects within the virtual spacefrom viewpoints determined based upon received user inputfurther includes: generating at least one 3D object basedupon the visualization attributes of a plurality of visible 3Dobjects; and interactively rendering 3D data visualizations ofthe at least one group 3D object within the virtual space fromviewpoints determined based upon received user input.In another embodiment again, interactively rendering 3D
data visualizations of the 3D objects within the virtual spacefrom viewpoints determined based upon received user inputfurther includes: modifying 3D objects forming part of avirtual environment within the virtual space in response tothe user input so that the 3D objects corresponding to the setof data points remain stationary within the virtual space andappear to change relative to the virtual environment in the3D data visualization due to the modification to the 3Dobjects forming part of the virtual environment; and render-ing the visible 3D objects corresponding to the set of datapoints and the 3D objects forming part of the virtual envi-ronment.
In a further additional embodiment, modifying 3D objectsforming part of a virtual environment within the virtual
US 9,665,988 B25
space in response to the user input comprises at least onemodification selected from the group including: modifyingthe size of the 3D objects forming part of the virtualenvironment in response a user instruction to resize the 3Dobjects corresponding to the set of data points to create theimpression that the 3D objects corresponding to the set ofdata points are changing in size relative to the virtualenvironment; moving the positions of the 3D objects form-ing part of the virtual environment in response a userinstruction to move the 3D objects corresponding to the setof data points to create the impression that the 3D objectscorresponding to the set of data points are moving relativeto the virtual environment; and moving the positions of the3D objects forming part of the virtual environment inresponse a user instruction to rotate the 3D objects corre-sponding to the set of data points to create the impressionthat the 3D objects corresponding to the set of data points arerotating relative to the virtual environment.
In a still yet further embodiment, interactively rendering3D data visualizations of the 3D objects within the virtualspace from viewpoints determined based upon received userinput includes: illuminating at least some of the 3D objects,where each illuminated 3D object is illuminated using adirectional illumination source originating at a user view-point; and rendering at least the illuminated 3D objectsbased upon the user viewpoint.
In still yet another embodiment, illuminating at least someof the 3D objects further includes: determining a field ofview; illuminating 3D objects within the field of view of theuser using a directional illumination source originating at theuser viewpoint; and rendering the illuminated 3D objectswithin the field of view of the user.
In a still further embodiment again, interactively render-ing 3D data visualizations of the 3D objects within thevirtual space from viewpoints determined based uponreceived user input includes: rotating at least some of the 3Dobjects based upon a user viewpoint, so that the appearanceof the rotated 3D objects is invariant with user viewpoint;and rendering the rotated 3D objects based upon the userviewpoint.
In still another embodiment again, interactively rendering3D data visualizations of the 3D objects within the virtualspace from viewpoints determined based upon received userinput includes: determining a location within the virtualspace of at least one interaction primitive based upon a userviewpoint; and rendering the at least one interaction primi-tive based upon the user viewpoint.A still further additional embodiment also includes deter-
mining a transparency of at least one interaction primitivebased upon the user viewpoint.
In still another additional embodiment, the 3D objectsinclude 3D objects having depth perception preservingshapes.
In a yet further embodiment again, the depth perceptionpreserving shapes are characterized by a first dimension thatis invariant and second dimension that is a visualizationattribute that varies based upon a mapped data dimension.
In yet another embodiment again, at least one of the depthperception preserving shapes is pill shaped.
In a further additional embodiment again, receiving map-pings of data dimensions to visualization attributes includes:receiving a selection of a target feature; determining theimportance of at least a subset of multiple data dimensionsto the target feature; and generating mappings of datadimensions having high importance to specific visualizationattributes.
6In another additional embodiment again, determining the
importance of at least a subset of multiple data dimensionsto the target feature further includes: identifying data dimen-sions that are numerical and data dimensions that are cat-
5 egorical; generating mappings of numerical data dimensionshaving high importance to a first set of visualization attri-butes; generating mappings of categorical data dimensionshaving high importance to a second set of visualizationattributes.
10 In another further embodiment, the first set of visualiza-tion attributes comprises X, Y, Z position, and size.In still another further embodiment, the second set of
visualization attributes comprises shape.In yet another further embodiment, the 3D data visual-
15 ization application further directs the processing system to:receive at least one updated mapping of a data dimension toa visualization attribute; determine updated visualizationattributes for the set of 3D objects based upon the selectedmappings of data dimensions to 3D object attributes, where
20 the updated mappings of data dimensions to visualizationattributes determine a location for each visible 3D objectwithin an updated virtual space; generate trajectories for theset of visible 3D objects from their locations in the virtualspace to their updated locations in the virtual space; and
25 interactively render animations of the movements of 3Dobjects along their generated trajectories from their locationsin the virtual space to their locations in the updated virtualspace from viewpoints determined based upon received userinput.
30 In another further embodiment again, the 3D data visu-alization application further directs the processing system todetermine updated visibility values for each of the pluralityof 3D object to reflect the visibility of each 3D object basedupon the updated mapping.
35 In another further additional embodiment, interactivelyrendering animations of the movements of 3D objects alongtheir generated trajectories further comprises varying thetime at which different sets of 3D objects commence movingalong their trajectories during a rendered animation.
40 In still yet another further embodiment, the time at whichdifferent sets of 3D objects commence moving along theirtrajectories during a rendered animation is determined basedupon user input.In still another further embodiment again, interactively
45 rendering animations of the movements of 3D objects alongtheir generated trajectories further includes varying thespeed with which different sets of 3D objects move alongtheir trajectories during a rendered animation.In still another further additional embodiment, interac-
50 tively rendering 3D data visualizations of the 3D objectswithin the virtual space from viewpoints determined basedupon received user input includes: determining a locationwithin the virtual space of at least one affordance, where userinput directing movement of a 3D data visualization onto
55 one of the at least one affordances initiates modification ofthe 3D data visualization; detecting movement of a 3D datavisualization onto one of the at least one affordances;modifying the 3D data visualization based upon the one ofthe at least one affordances; and rendering the modified 3D
6o data visualization based upon the user viewpoint.In yet another further embodiment again, modifying the
3D data visualization based upon the one of the at least oneaffordances comprises resizing the 3D data visualization.In yet another further additional embodiment, modifying
65 the 3D data visualization based upon the one of the at leastone affordances includes: applying a data analysis process tothe set of data points in the visualization table corresponding

US 9,665,988 B27
to the 3D objects visualized within the 3D visualization; andmodifying visualization attributes of the 3D objects visual-ized within the 3D visualization based upon at least oneresult of the data analysis process; and rendering a modified3D data visualization including the modified visual attri-butes of the 3D objects based upon the user viewpoint.
In another further additional embodiment again, the dataanalysis process is a clustering process.
In still yet another further embodiment again, modifyingthe 3D data visualization based upon the one of the at leastone affordances includes rendering a new 3D data visual-ization of a set of 3D objects represented by at least oneselected 3D object in the 3D data visualization moved ontoone of the at least one affordances.
Still yet another further additional embodiment, furtherincludes: an input device having an elongated handle and aninput button. In addition, the 3D data visualization applica-tion further directs the processing system to: obtain a poseinput and a button state input from the wand; modify the 3Ddata visualization based upon the pose input and the buttonstate input in a manner determined based upon a userinterface context; and render the modified 3D data visual-ization based upon the user viewpoint.
In still another further additional embodiment again,modifying the 3D data visualization based upon the poseinput and the button state input in a manner determinedbased upon a user interface context includes: determining alocation for the 3D data visualization within the virtualworld based upon the pose input and the button status inputindicating that the button is not being pressed; and rotatingthe 3D data visualization within the virtual world basedupon the pose input and the button status input indicatingthat the button is being pressed.
In a further embodiment, the memory further comprisesavatar metadata including a set of visualization attributesthat determine the manner in which an avatar is rendered andthe visualization attributes include a location of the avatarwithin the virtual space, and interactively rendering 3D datavisualizations of the 3D objects within the virtual space fromviewpoints determined based upon received user input com-prises rendering avatars within the 3D data visualizationbased upon the viewpoints and the avatar metadata.
In another embodiment, the avatar metadata further com-prises pose information, and rendering avatars within the 3Ddata visualization based upon the viewpoints and the avatarmetadata further comprises rendering the poses of avatarswithin the 3D data visualization based upon the pose infor-mation within the avatar metadata.
BRIEF DESCRIPTION OF THE DRAWINGS
The patent or application file contains at least one drawingexecuted in color. Copies of this patent or patent applicationpublication with color drawing(s) will be provided by theOflice upon request and payment of the necessary fee.FIGS. 1A-1E illustrate a set of eight clusters laid out with
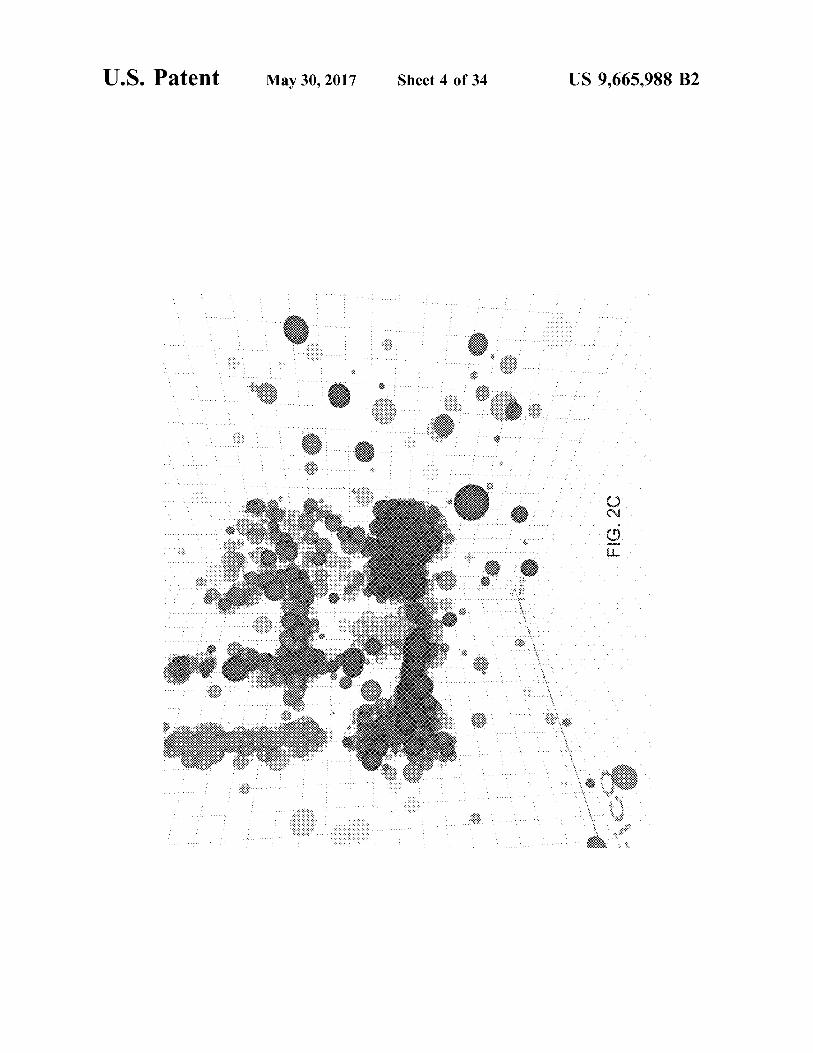
their data centers at the corners of a virtual cube.FIGS. 2A-2D illustrate the different perspective a user can
obtain by moving within a 3D visualizations of a multidi-mensional data space and the use of additional visualizationattributes to visualize additional data dimensions in accor-dance with various embodiments of the invention.FIGS. 3A-3E illustrate visualization of a 3D graph from
multiple viewpoints in which data is visualized as 3D lineplots in accordance with an embodiment of the invention.
8FIGS. 4A-4E illustrate visualization of a 3D graph from
multiple viewpoints in which data is visualized as a 3Dsurface in accordance with an embodiment of the invention.FIGS. 5A-5D conceptually illustrates rendering of a 3D
5 graph from different viewpoints of different users in accor-dance with an embodiment of the invention.FIG. 5E illustrates a 3D data visualization showing ava-
tars of multiple users within a virtual space in accordancewith an embodiment of the invention.
10 FIGS. 6A and 6B conceptually illustrate systems forgenerating 3D visualizations of a multidimensional dataspace in accordance with various embodiments of the inven-tion.
15 FIG. 7 conceptually illustrates a multidimensional datavisualization computing system implemented on a singlecomputing device in accordance with an embodiment of theinvention.
FIG. 8A is a flow chart illustrating a process for gener-20 ating a multidimensional data visualization in accordance
with an embodiment of the invention.FIG. 8B is a flow chart illustrating a process for rendering
a 3D data visualization using group 3D objects in accor-dance with an embodiment of the invention.
25 FIGS. 9A-9C illustrates a 3D visualization of a multidi-mensional data space in which data dimensions are mappedto shape and size attributes of 3D objects in accordance withvarious embodiments of the invention.FIG. 10 shows a small set of 3D object shapes that are
3o designed to be recognizable even in highly dense plots.FIG. 11A shows the variation in appearance of a 3D object
having a spherical shape under constant illumination bythree static point sources when viewed from different direc-tions.
35 FIG. 11B shows the same 3D data object from the sameviewpoints shown in FIG. 11A with the 3D object illumi-nated using a directional illumination source originating at(or near) the viewpoint of the user.
FIG. 12A-12C illustrate the similarity in appearance of40 similar 3D objects as a user moves through a virtual space,
because the illumination of the objects changes with thepose of the user, in accordance with various embodiments ofthe invention.
FIG. 13 is a flow chart showing a process for updating the45 illumination of 3D objects (or individual vertices or surfaces
of 3D objects) as the field of view of a user within a virtualspace changes in accordance with an embodiment of theinvention.
FIG. 14 conceptually illustrates Directional illumination50 of multiple 3D objects and/or vertices or surfaces of group
3D objects within a virtual space.FIG. 15A illustrates a 3D graph including interaction
primitives in the form of grids, axes, and axis labels gener-ated by a 3D data visualization system in accordance with an
55 embodiment of the invention.FIG. 15B illustrates a user interface showing recommen-
dations concerning mappings of specific data dimensions toparticular attributes of 3D objects visible in a 3D datavisualization in accordance with an embodiment of the
60 invention.FIGS. 16A-16D is a sequence of 3D data visualizations in
which the X attribute of the 3D data objects is modified froma first data dimension (i.e. "Age") to a second data dimen-sion (i.e. "YearsOn7ob") in accordance with an embodiment
65 of the invention.FIGS. 17A-17F illustrate affordances within a VR user
interface that enable a user to control the size of a 3D data

US 9,665,988 B29
visualization within the virtual world generated by a 3D datavisualization system in accordance with various embodi-ments of the invention.
DETAILED DESCRIPTION
Data visualization systems that can visualize multidimen-sional data as 3D graphs (i.e. 3D data visualization systems)and methods of generating visualizations of multidimen-sional data spaces in accordance with a number of embodi- ioments of the invention can utilize 3D display technologies toaddress many of the challenges of effective interactivevisualization of high-dimensional data. The term here 3Dgraph is used in a general sense to reference any 3D objector group of 3D objects that collectively describe a set of 15data. A distinction can be drawn between the 3D object orobjects that make up a 3D graph and other 3D objects, whichmay be utilized within a 3D visualization of multidimen-sional data to represent a virtual environment in which the3D graph is contained. Current data visualization tech- 20niques, largely ask a user to perceive an environment that isdisplayed on a flat screen effectively by looking from theoutside in. Systems and methods in accordance with severalembodiments of the invention enable the visualization ofmore complex data spaces and can extend the human ability 25to interpret additional dimensions by utilizing 3D displaytechnologies to place a user inside the visualization, andmaking the act of data visualization a first person experi-ence. This approach can activate the human senses ofproprioception (how people senses the relative position of 30their body parts) and kinesthesia (how people sense theextent of their own body in motion), which describe andexplain the human body's experience within an externalenvironment.
Presentation of highly dimensional data in a three-dimen- 35sional visualization is complex and can involve representa-tion of structure within data using subtle variations in thecharacteristics of 3D objects such as size, shape, and/ortexture. Movement and depth perception can confuse someof these visual cues and the confusion can be complicated in 40circumstances where the manner in which the 3D objects arerendered for 3D display introduces variations that are unre-lated to the underlying data dimensions (e.g. shadows thatmay alter perceived color and/or size). 3D data visualizationsystems in accordance with many embodiments of the 45invention utilize techniques including (but not limited to)shape selection and illumination models that preserve simi-larity between similar 3D objects within the field of view ofthe user and enhance a user's ability to differentiate betweenvariations in size due to variations in the size attribute of a 503D object and variations in size due to differences indistances to 3D objects. In a number of embodiments, auser's ability to perceive structure within data is furtherenhanced by utilizing animation to enable a user to observemodifications to the attributes of 3D objects corresponding 55to specific 3D data points as the 3D objects migrate from one3D visualization of a multidimensional data space to a 3Dvisualization of a different multidimensional data space.
Usability of 3D data visualization systems in accordancewith a number of embodiments of the invention is enhanced 60by providing affordances within a 3D user interface that auser can use to automatically modify the rendering of highdimensionality data in a 3D data visualization. In severalembodiments, the user can simply drag the 3D visualizationof a multidimensional data space over the affordance and a 65particular action is performed (e.g. resizing of the 3D datavisualization, or k-means clustering of the data points). We
10emphasize that whereas the data are visualized as distinctobjects (data points) in a 3D data visualization, more thanthree data dimensions are being rendered through the prop-erties of the individual data points (e.g., colors, sizes,shapes, etc.).As can readily be appreciated, the ability to visualize data
within a multidimensional data space in 3D opens up a vastarray of possibilities for the analysis of complex data, 3Ddata visualization systems in accordance with many embodi-ments of the invention enable data exploration to be per-formed in a collaborative manner. In several embodiments,multiple users who may or may not be in the same physicallocation can independently explore the same shared, virtual,multidimensional data space. In certain embodiments, asingle user can lead a "broadcast" interactive session inwhich all users view the 3D data visualization space fromthe same viewpoint controlled by a lead user. Multidimen-sional data visualization systems and processes for exploringcomplex data using multidimensional data visualizations inaccordance with various embodiments of the invention arediscussed further below.Three-Dimensional Data VisualizationsWhen dealing with complex data, two-dimensional map-
pings often fail to reveal inherent structures within data.FIGS. 1A-1E illustrate a set of eight clusters laid out withtheir data centers at the corners of a virtual cube. The simple2D projections shown in FIGS. 1A-1C do not readily revealall structures within the data. When the data is visualizedwithin three spatial dimensions as shown in FIGS. 1D and1E, cluster patterns are more readily discerned. 3D datavisualization systems in accordance with many embodi-ments of the invention provide the user with an additionalcapability to directly interact with 3D cues from motion andparallax that enable a user to more clearly discern structuresthat may not be readily apparent depending upon the view-point from which a particular 3D visualization is rendered.Stated another way, the ability for the user to readily shift theviewpoint of a 3D data visualization in real time can revealvisual cues that cause the user to explore the data space froma different viewpoint that yields additional insights into thedata. The ability to visually observe structure can be par-ticularly useful in circumstances where machine learningalgorithms trained to identify structures within data (e.g.k-means clustering) fail due to the presence of outliers thatcan be readily identified by a human user through visualinspection from one or more viewpoints.
FIGS. 2A and 2B illustrate the different perspective a usercan obtain by moving within a 3D visualizations of amultidimensional data space (as opposed to being con-strained to look at data visualized in three spatial dimensionsfrom outside the data space). As the viewpoint the usermoves from the viewpoint shown in FIG. 2A toward data ofinterest and the viewpoint shown in FIG. 213, structurewithin a particular subset of the data is visible in greaterdetail. As is discussed further below, 3D data visualizationsystems in accordance with various embodiments of theinvention can support any of a number of different inputmodalities via which a user can provide instructions con-trolling the zoom, relative position and/or orientation of the3D data visualization. The 3D data visualizations shown inFIGS. 2A and 2B are rendered by mapping data dimensionsto characteristics of 3D objects that include the visibility ofthe 3D object (some data points may not be shown basedupon filtering criterion), the location of the 3D object withina 3D data visualization, the size of the rendered 3D object,and/or the color of the 3D object. In certain embodiments,higher dimensionality visualizations again can be generated

US 9,665,988 B211
by using data dimension mappings to determine additionalcharacteristics of the 3D objects including (but not limitedto) the shape used to render the 3D object, the texture of the3D object, and/or the transparency of the 3D object. FIG. 2Cillustrates a 3D visualization of the data set shown in FIG.2B using transparency to represent an additional data dimen-sion. FIG. 2D illustrates a 3D visualization of the data setshown in FIG. 2B using both transparency and texture torepresent additional data dimensions. The representation ofadditional data dimensions through choice of different 3Dshapes, including the use of depth perception preservingshapes, in accordance with various embodiments of inven-tion is discussed further below. In other embodiments, datadimensions can be mapped to non-visual aspects of animmersive experience including (but not limited to) motion,sonification, haptic feedback, and/or vibrotactile feedback.An inherent limitation of illustrating 3D data visualiza-
tions on a 2D page is that the 3D data visualizations shownin FIGS. 2A-2D are two-dimensional projections of theunderlying 3D data visualization. 3D data visualizationsystems in accordance with many embodiments of theinvention provide interactive 3D visualizations that enableinteraction and motion parallax, which are lost when 3D datais projected in the manner utilized to generate FIGS. 2A and2D. Accordingly, a video sequence illustrating interactivedata exploration of a 3D data visualization generated by a3D data visualization system in accordance with an embodi-ment the invention is available at http://www.virtualitic-s.com/patent/Virtualiticsl.mp4 and http://www.virtualitic-s.com/patent/Virtualitics2.mp4 and a 3D video sequence ofthe same interactive session is available http://www.virtual-itics.com/patent/Virtualitics3.mp4. A comparison of the 2Dand 3D video sequences provides a sense of the benefits ofmotion parallax in interpreting the structure of the data usedto generate the 3D data visualization by the 3D data visu-alization system. The 2D and 3D video sequences found athttp://www.virtualitics.com/patent/Virtualiticsl.mp4, http://www.virtualitics.com/patentNirivalitics2.mp4 and http://www.virtualitics.com/patentNirivalitics3.mp4 are herebyincorporated by reference herein in their entirety.
While much of the discussion that follows relates togeneration of interactive multidimensional visualizationscreated by rendering 3D objects within a virtual space,systems and methods in accordance with many embodi-ments of the invention can be utilized to generate multidi-mensional data visualizations using a variety of differenttechniques for representing data. In several embodiments,3D data visualizations can include 3D line plots (see, forexample, FIGS. 3A and 313) and/or 3D surfaces (see, forexample, FIGS. 4A and 413). FIGS. 3A and 3B illustratevisualization of a 3D graph from multiple viewpoints inwhich data is visualized as a series of 3D line plots. By wayof comparison, two dimensional projections of the 3D lineplots are shown in FIGS. 3C-3E. FIGS. 4A and 4B illustratevisualization of a 3D graph from multiple viewpoints inwhich data is visualized as a 3D surface. By way ofcomparison, two dimensional projections of the 3D surfacesare shown in FIGS. 4C-4E. Accordingly, systems and meth-ods in accordance with different embodiments of the inven-tion are not limited to specific types of 3D data visualiza-tions and can be utilized to generate any of a variety of 3Ddata visualizations. Systems and methods for performing 3Ddata visualization that enable a user's cognition system tointerpret highly dimensional data and interact with highdimensional data in accordance with various embodimentsof the invention are discussed further below.
123D Data Visualization Systems3D data visualization systems in accordance with certain
embodiments of the invention can be configured for explo-ration of a 3D graph by a single user or by multiple users.
5 In several embodiments, the 3D data visualization systemincludes a 3D rendering engine that maps data dimensions tocharacteristics of 3D virtual objects that are then renderedfor visualization within a virtual space by the 3D renderingengine. A machine vision system and/or sensor system can
io be utilized to track the pose of one or more users and morespecifically track the head position of the user(s). Headpositions can be utilized to determine a viewpoint fromwhich to render a 3D display of the virtual space for eachuser that is interacting with data within the virtual space.
15 Where multiple users are collaborating within a virtualspace, head positions and/or poses of the users can beutilized to render the 3D displays presented to each user andto render the avatars of individual users within the dataspace.
20 Rendering of a 3D graph from different viewpoints ofdifferent users in accordance with an embodiment of theinvention is conceptually illustrated in FIGS. 5A -51). A 3Ddata visualization showing avatars of multiple users withina virtual space in accordance with an embodiment of the
25 invention is illustrated in FIG. 5E. In the illustrated 3D datavisualization, a 3D graph 500 is shown in which data pointsare visualized as 3D objects 502 and the viewpoints fromwhich other users are exploring the virtual space is indicatedby avatars 504, 506. As is discussed below, a user's ability
30 to orient themselves within a virtual space can be enhancedby providing intuitive interaction primitives such as gridlines 508, and 510 axes labels. In many embodimentscollaborating users can independently move through thevirtual space or a set of users can experience the same
35 visualization of the virtual space controlled by a singleuser's interactions with the virtual space. As can readily beappreciated, the specific collaborative exploration modessupported by a 3D data visualization system is largelydependent upon the requirements of a given application.
40 A multidimensional data visualization system that can beutilized to generate a visualization of multidimensional datawithin three spatial dimensions for a user and/or to facilitatecollaborative multidimensional data exploration in such a3D space by multiple users in accordance with an embodi-
45 ment of the invention is illustrated in FIG. 6A. The 3D datavisualization system 600 includes a 3D data visualizationcomputing system 602 that is configured to communicatewith a 3D display 604, which in the illustrated embodimentis a head mounted display.
50 The 3D data visualization computing system 602 can alsobe connected to a camera system 606 that is utilized tocapture image data of the user from which the pose and/orhead position of the user can be determined. The camerasystem can also be used as an input modality to detect
55 gesture based inputs. Additional and/or alternative inputmodalities can be provided including (but not limited to)user input devices, and microphones to detect speech inputs.The camera system can incorporate any of a variety ofdifferent camera systems that can capture image data from
60 which the pose of a user can be determined including (butnot limited to) conventional cameras, time of flight cameras,structured illumination cameras, and/or multiview stereocameras. The term pose can be utilized to describe anyrepresentation of both a user's position in three-dimensional
65 space and orientation. A simple representation of pose is ahead location and viewing direction. More complex poserepresentations can describe a user's body position using

US 9,665,988 B213
joint locations of an articulated skeleton. As can readily beappreciated the specific description of pose and/or camerasystem utilized within a given 3D data visualization system600 is largely dependent upon the requirements of a specificapplication.
In a number of embodiments, the 3D data visualizationcomputing system 602, the 3D display 604, and the camerasystem 606 are an integral unit. For example, the 3D datavisualization computing system 602, 3D display 604, andcamera system 606 can be implemented in a head mounteddisplay such as (but not limited to) the HoloLens distributedby Microsoft Corporation of Redmond, Wash. In otherembodiments, the 3D data visualization computing system602 and the 3D display 604 communicate via a wireless dataconnection in a manner similar to that utilized by the OculusRift 3D display distributed by Oculus VR, LLC of MenloPark, Calif. As can readily be appreciated, 3D data visual-izations can be constructed as a set of virtual objectsdisplayed within a mixed reality context using a MR headset(e.g. HoloLens) and/or displayed in a completely immersiveenvironment using a VR 3D display (e.g. Oculus).
In certain embodiments, the 3D data visualization com-puting system can leverage distributed processing. In anumber of embodiments, at least some processing associatedwith rendering a 3D data visualization is performed by aprocessor within a head mounted display. In several embodi-ments, additional processing is performed by a local com-puter system with which the head mounted display commu-nicates. In many embodiments, processing is performed bya remote computer system (e.g. computing resources withina cloud computing cluster) with which the head mounteddisplay communicates via the Internet (potentially via alocal computer system). Accordingly, 3D data visualizationcomputing systems in accordance with various embodi-ments of the invention are not limited to a single computingdevice and can encompass a single computing device, and/ora combination of a computing system within a head mounteddisplay, a local computing system, and/or a remote comput-ing system. As can readily be appreciated the specificimplementation of a 3D data visualization computing systemused within a given 3D data visualization system is largelydependent upon the requirements of a specific application.A multidimensional data visualization system in which
multiple users are able to simultaneously explore a 3Dvisualization of a multidimensional data space in accordancewith an embodiment of the invention is illustrated in FIG.6B. The 3D data visualization system 650 two local com-puter systems 652 that communicate via a server computingsystem 654 across a network 656. Each of the local com-puter systems 652 is connected to a 3D display 658 and acamera system 660 in a manner similar to that describedabove with reference to FIG. 6A.
In the illustrated embodiment, the local computer systems652 each build a 3D model of the multidimensional dataspace and render video sequences (which may be 2D or 3D)responsive to changes in the pose of the users. In a numberof embodiments, the local computer systems 652 are con-figured to enable independent data exploration by the usersand pose information can be shared between the localcomputer systems 652 via the server computing system 654.The pose information can then be utilized to render anavatar(s) within the virtual space that indicates the locationfrom which a specific user is viewing the virtual space. Inmany embodiments, the local computer systems 652 supporta broadcast mode in which one user navigates through thevirtual space and the pose of the navigating user is broadcastvia the server computing system 654 to the local computer
14systems 652 of the others users within the virtual space. Thelocal computer systems 652 that receive pose informationfrom the navigating user can use the pose information torender a multidimensional data visualization from the view-
5 point of the navigating user for display via another user's 3Ddisplay.In many embodiments, a broadcast mode is supported by
rendering a 3D video sequence and streaming the 3D videosequence to the local computer systems 652 of other users.
io In several embodiments, the server computing system 654system includes sufficient computing capacity (e.g. graphicsprocessing units) to generate 3D data visualizations for eachof the users and to stream 3D video sequences over thenetwork 656 to the local computers for display via the 3D
15 displays based upon pose information received from a localcomputer system 652.Computer Systems for 3D Visualization of Multidimen-sional DataComputer systems that can generate 3D visualizations of
20 multidimensional data can take a variety of forms includingimplementations in which all of the computing is performedby a single computing device to complex systems in whichprocessing is distributed across head mounted displays, localcomputer systems and/or cloud based server systems. The
25 specific distribution of different processes is largely depen-dent upon the number of users and the requirements of agiven application.A multidimensional data visualization computing system
implemented on a single computing device in accordance30 with an embodiment of the invention is illustrated in FIG. 7.
The multidimensional data visualization computing system700 may be a personal computer, a laptop computer, a headmounted display device and/or any other computing devicewith sufficient processing power to render 3D displays at a
35 sufficient frame rate to satisfy the interactive 3D data visu-alization requirements of a specific application.The 3D data visualization computing system 700 includes
a processor 702. The term processor 702 is used to refer toone or more devices within the computing device that can be
40 configured to perform computations via machine readableinstructions stored within the memory 704 of the 3D datavisualization computing system. The processor 702 caninclude one or more microprocessor (CPUs), one or moregraphics processing units (CPUs), and one or more digital
45 signal processors (DSPs). In addition, the processor 702 caninclude any of a variety of application specific circuitrydeveloped to accelerate the 3D data visualization computingsystem.In the illustrated embodiment, the 3D data visualization
50 computing system 700 includes a network interface 706 tocommunicate with remote computing systems (e.g. the com-puting systems of other users and/or a remote server com-puting system) and an input/output (I/O) interface 708 thatcan be utilized to communicate with a variety of devices
55 including (but not limited to) a 3D display, and/or a camerasystem. The specific communication and I/O capabilitiesrequired of a computing system used to generated 3Dvisualizations of multidimensional data is typically deter-mined based upon the demands of a given application.
60 As can readily be appreciated, a variety of softwarearchitectures can be utilized to implement a multidimen-sional data visualization computing system in accordancewith an embodiment of the invention. In the illustratedembodiment, 3D data visualizations are generated by a 3D
65 data visualization application 710 that executes within acomputing environment created by an operating system 712.The 3D data visualization application 710 leverages a 3D

US 9,665,988 B215
rendering engine 714 to generate 3D data visualizations thatcan be displayed via a 3D display. In a number of embodi-ments, the 3D data visualization application 710 loads amulti-dimensional data set 716 into in-memory data struc-tures 718 that are stored within low-latency memory of the3D data visualization computing system. The multi-dimen-sional data set 716 may be locally stored in a file and/ordatabase. In several embodiments, the multi-dimensionaldata is stored remotely (e.g. in a distributed database) andsome or all of the multi-dimensional data is loaded into thein-memory data structures 718 maintained by the 3D datavisualization application 710. In many embodiments, themulti-dimensional data is loaded into at least one visualiza-tion table. As discussed below, additional data dimensionscan be added to the multidimensional data as it is loaded intothe at least one visualization table by the 3D data visual-ization application 710. In several embodiments, a visual-ization table includes a visibility dimension and the 3D datavisualization application continuously modifies the visibilityvalue of individual items within the multi-dimensional dataset contained within the visualization table to reflect whethera 3D object corresponding to the item is visible within acurrent 3D visualization of the multi-dimensional data con-tained within the visualization table. As can readily beappreciated, any of a variety of additional dimensions can beadded to the multi-dimensional data by the 3D data visual-ization application as appropriate to the requirements of agiven application.As is discussed further below, a user can select mappings
of data dimensions to attributes of 3D objects within a 3Ddata visualization thus effectively creating a multidimen-sional data visualization. The mappings are stored as datadimension mappings 720. The 3D data visualization appli-cation 710 can use the data dimension mappings 720 toprovide attributes of 3D objects to the 3D rendering engine714. In many embodiments, the 3D rendering engine 714instantiates 3D objects within a 3D model 722 stored inmemory and can update the attributes of the 3D objects. Inseveral embodiments, 3D objects can be instantiated withinthe 3D model 722 by the 3D rendering engine 714 basedupon the number of data points loaded into the in-memorydata structures 718. In this way, the 3D rendering engine 714can generate 3D data visualizations rapidly in response toselection of data dimensions for visualization by the user,because the 3D objects are instantiated and the 3D renderingengine 714 simply needs to modify the attributes of the 3Dobjects within the 3D model 722 to generate the visualiza-tion. In other embodiments, the 3D objects are instantiatedin response to definition of the attributes of the 3D objectsby the user.The 3D rendering engine 714 can utilize the 3D model
722 to render stereo images that can be presented via a 3Ddisplay. In a number of embodiments, the 3D data visual-ization application uses a display driver 724 to display therendered viewpoints 726 via a 3D display. The specificrendered viewpoints can be determined by pose data 728received from a remote computing system (e.g. in broadcastmode) or based upon pose data 728 determined by the 3Ddata visualization computing system from image and/orother sensor data.
In the illustrated embodiment, the 3D visualization appli-cation 710 receives pose data 728 from a machine visionapplication 730 that obtains image data from a camerasystem using one or more camera drivers 732. The machinevision application 720 configures the processor 702 toextract a user's pose including (but not limited to) thelocation and orientation of the user's head from the captured
16image data. As noted above, the user's pose can be utilizedto determine viewpoints 726 from which to render imagesfrom the 3D model 722. In many embodiments, user pose isalso utilized to control elements of the 3D model including
5 (but not limited to) illumination of 3D objects, speed ofmovement through the virtual space, and/or visibility ofinteraction primitives. The specific ways in which user posecan be utilized to modify the rendering of 3D visualizationsof multi-dimensional data in accordance with various
io embodiments of the invention are discussed further below.When the multidimensional data visualization computing
system 700 is generating a 3D visualization of multidimen-sional data in which multiple users are simultaneouslyvisualizing the same virtual space, the 3D rendering engine
15 714 can also use avatar metadata 734 that includes poseinformation for each avatar and (optionally) identifyinginformation for the avatar to incorporate avatars within the3D model 722 in such a way that avatars located within thefield of view of a user are visible within viewpoints 726
20 rendered by the 3D rendering engine.In many embodiments, the 3D rendering engine 714
forms part of a 3D graphics engine or 3D game engine thatenables implementation of the 3D data visualization appli-cation 710 within the 3D graphics engine using a mechanism
25 such as (but not limited to) a scripting language. In otherembodiments, the 3D rendering engine forms part of the 3Ddata visualization application. As can readily be appreciated,the 3D data visualization application, 3D rendering engine,and/or machine vision application can be implemented inde-
30 pendently, as a single application, or within or as a plugin foranother application such as (but not limited to) a webbrowser application. The specific manner in which the 3Ddata visualization application is implemented is largelydependent upon the requirements of a given computing
35 system(s) and/or use case.Although specific multidimensional data visualization
systems and 3D data visualization computing systems aredescribed above with respect to FIGS. 6A-7, any of a varietyof computing platforms, 3D displays, and/or camera system
40 can be utilized to implement processes that enable interac-tive exploration of 3D data visualizations in accordance withvarious embodiments of the invention. Processes for inter-active exploration of 3D data in accordance with a numberof embodiments of the invention are discussed further
45 below.Generating 3D Data Visualizations
Processes for generating 3D data visualizations in accor-dance with many embodiments of the invention involveloading data into in-memory data structures and then map-
50 ping data dimensions to attributes of 3D objects to enablerendering of 3D data visualizations via 3D displays. Aprocess for generating a multidimensional data visualizationin accordance with an embodiment of the invention isillustrated in FIG. 8A. The process 800 includes loading
55 (802) data points into in-memory data structures such as (butnot limited to) a visualization table. In the illustratedembodiment, a 3D object is instantiated (804) with respectto each of the data points. As noted above, instantiating 3Dobjects prior to receiving mappings of data dimensions to
6o attributes of the 3D objects can decrease latency with whicha 3D data visualization can be rendered. In other embodi-ments, the 3D objects are not instantiated until data map-pings are defined that determine the attributes of the 3Dobjects. As can readily be appreciated, the timing of the
65 instantiation of 3D objects relative to the rendering of a 3Ddisplay is largely dependent upon the requirements of agiven application. In several embodiments, the process of

US 9,665,988 B217
loading the data points into in-memory data structuresinvolves creating an additional data dimension that describesthe visibility of a specific data point within a 3D datavisualization. The visibility data dimension for individualdata points can be updated by the process 800 to indicate thata given data point should not be part of a 3D data visual-ization. In this context, visibility is a distinct concept frombeing within the field of view of the user and instead refersto a decision made by the process 800 not to render the datapoint within the 3D graph. Reasons for excluding a datapoint can include (but are not limited to) the data pointpossessing no value or an invalid value with respect to oneof the data dimensions mapped to an attribute of a 3D object.As can readily be appreciated, any of a variety of reasons canbe utilized to determine that specific data points should notbe included within a 3D visualization as appropriate to therequirements of a given application. A visibility data dimen-sion added during data ingest provides a mechanism forreflecting the decision not to visualize an individual datapoint.The process 800 includes determining (806) attributes of
3D objects using data dimension mappings. A user interfacecan present information concerning the data dimensions thatdescribe the data points and enable a user to select thespecific data dimensions to map to attributes of 3D objects.In several embodiments, data dimension mappings deter-mine characteristics of 3D objects including (but not limitedto) the visibility of the 3D object, the location of the 3Dobject within a virtual space, the shape used to render the 3Dobject, the size of the rendered 3D object within the virtualspace, and/or the color of the 3D object. In certain embodi-ments, visualizations of more than three data dimensions canbe generated by using data dimension mappings to deter-mine additional characteristics of the 3D objects including(but not limited to) the texture of the 3D object and/or thetransparency of the 3D object. In a number of embodimentsthe list of attributes that can be defined includes (but are notlimited to): X (floating point value), Y (floating point value),Z (floating point value), Shape (floating point value, string),Size (floating point value), Color Palette (floating pointvalue, string), Color Map (floating point value, string), ColorScale (floating point value, string), and transparency (float-ing point value). As a complement to the visual attributes,data dimension mappings can also be defined with respect tometadata describing the data points represented by the 3Dobjects including (but not limited to): ID (string), URL(string), Mask (floating point value used to indicate whethera data point is selected), Show By (Float, String, used toindicate whether data point is to be displayed based uponfilters, e.g. show only data points with country value equalto "US"). Additional attributes associated with 3D objectscan include (but are not limited to) subtle motions of the 3Dobject (e.g. binning data into different rates of jitter or twist),sonification, haptic feedback, and/or vibrotactile feedback.While specific attributes are described above, any subsetand/or combination of some or all of the above attributes canbe combined with additional attributes in the visualization ofdata points. The specific attributes utilized to visualize a datapoint within a 3D graph are largely dependent upon therequirements of a given 3D data visualization system.
While the mapping of data dimensions to attributes (806)is often performed by a user, a user and/or a 3D datavisualization system may also use a previously stored 3Ddata visualization to define mappings of data dimensions toattributes. In this way, a user can load a new data set or anupdated data set (e.g. a data set to which new data pointshave been added) and utilize a previously selected set of
18mappings to visualize the data. Accordingly, the attributes of3D objects can be automatically determined 806 based uponmappings contained within a previously generated 3D datavisualization. In many embodiments, users can share 3D
5 data visualizations and the mappings within the shared 3Ddata visualizations are utilized to determine 806 the attri-butes of 3D objects. Users can share 3D data visualizationsfor independent use by others and/or as part of a broadcast3D data visualization.
10 The process 800 renders (814) a 3D display based upon aviewpoint of a user. Accordingly, the user's pose is deter-mined (808) and can be used to render a 3D display basedupon the position of the user within the virtual space and the3D objects within the field of view of the user. As is
15 discussed further below with reference to FIG. 813, addi-tional computational efficiencies can be obtained duringrendering by creating one or more meshes for 3D groupobjects based upon the meshes of a large number (or all) ofthe 3D objects. In this way, processes including (but not
20 limited to) physics processes such as collision processingcan be performed with respect to a much smaller number of3D group objects. As can readily be appreciated, the extentto which 3D objects are aggregated into 3D group objects forthe purposes of reducing the computation required to render
25 a 3D data visualization is largely dependent upon therequirements of a given application.
Effective visualizations of 3D data enhance a user'sability to perceive structure within the data and avoidintroducing variation in the appearance of 3D objects within
30 the 3D graph that are unrelated to the characteristics of thedata being visualized. In many embodiments, a variety ofaspects of the 3D data visualization are modified based uponthe pose of the user in order to enhance the ability of the userto perceive the structure of the data. In several embodiments,
35 the process of rendering a 3D display includes illuminating(810) 3D objects based upon the user pose. As is discussedbelow, illuminating each 3D object within the field of viewof the user using a directional illumination source originat-ing at the user's viewpoint or slightly offset from the user's
40 viewpoint can preserve the similarity in appearance ofsimilar 3D objects across the field of view of the user.Processes for illuminating 3D objects based upon the pose ofthe user in accordance with various embodiments of theinvention are discussed below. Where 3D objects have
45 different appearances based upon viewing direction, theorientations of the 3D objects within the field of view of theuser can be reoriented to "face" the user (although asdiscussed below facing the user may actually involve ori-enting the 3D object at a consistent angle to better accentuate
50 the characteristics of the 3D shape). In this way, no matterwhat direction a user is viewing an object, its appearancewill always be the same within the 3D graph to avoiddifferences in orientation from being confused as meaning-ful information by the user consciously or subconsciously. In
55 other embodiments, however, orientation may be fixed and/or may be used to visualize an additional data dimension(e.g. a data dimension is mapped to orientation relative to theuser viewpoint, or to a motion such as but not limited to arate of rotation).
60 In a number of embodiments, user pose is used to modifya number of other aspects of the 3D data visualizationincluding (but not limited) the transparency and/or locationof interaction primitives. For example, interaction primitivessuch as grid lines and/or navigation affordances can be
65 included within a virtual space to assist with orientation andnavigation. In many embodiments, user pose determines theextent to which any interaction primitives are occluding 3D
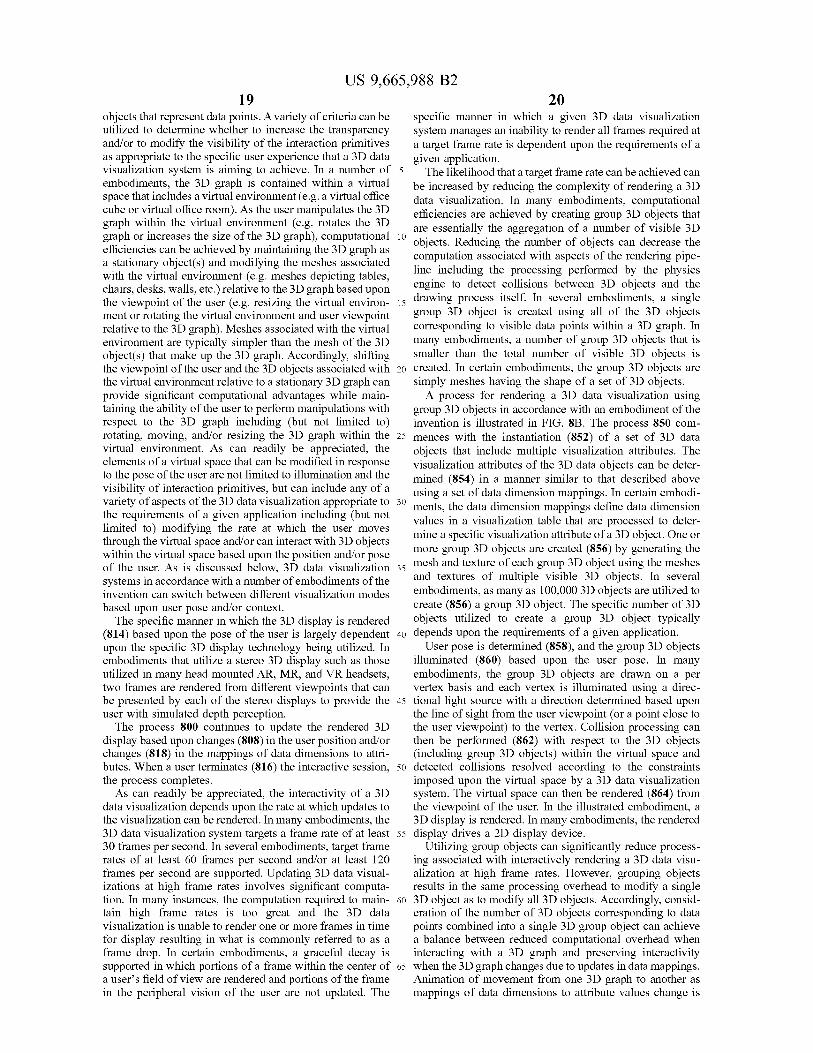
US 9,665,988 B219
objects that represent data points. A variety of criteria can beutilized to determine whether to increase the transparencyand/or to modify the visibility of the interaction primitivesas appropriate to the specific user experience that a 3D datavisualization system is aiming to achieve. In a number ofembodiments, the 3D graph is contained within a virtualspace that includes a virtual environment (e.g. a virtual officecube or virtual office room). As the user manipulates the 3Dgraph within the virtual environment (e.g. rotates the 3Dgraph or increases the size of the 3D graph), computationalefficiencies can be achieved by maintaining the 3D graph asa stationary object(s) and modifying the meshes associatedwith the virtual environment (e.g. meshes depicting tables,chairs, desks, walls, etc.) relative to the 3D graph based uponthe viewpoint of the user (e.g. resizing the virtual environ-ment or rotating the virtual environment and user viewpointrelative to the 3D graph). Meshes associated with the virtualenvironment are typically simpler than the mesh of the 3Dobject(s) that make up the 3D graph. Accordingly, shiftingthe viewpoint of the user and the 3D objects associated withthe virtual environment relative to a stationary 3D graph canprovide significant computational advantages while main-taining the ability of the user to perform manipulations withrespect to the 3D graph including (but not limited to)rotating, moving, and/or resizing the 3D graph within thevirtual environment. As can readily be appreciated, theelements of a virtual space that can be modified in responseto the pose of the user are not limited to illumination and thevisibility of interaction primitives, but can include any of avariety of aspects of the 3D data visualization appropriate tothe requirements of a given application including (but notlimited to) modifying the rate at which the user movesthrough the virtual space and/or can interact with 3D objectswithin the virtual space based upon the position and/or poseof the user. As is discussed below, 3D data visualizationsystems in accordance with a number of embodiments of theinvention can switch between different visualization modesbased upon user pose and/or context.The specific manner in which the 3D display is rendered
(814) based upon the pose of the user is largely dependentupon the specific 3D display technology being utilized. Inembodiments that utilize a stereo 3D display such as thoseutilized in many head mounted AR, MR, and VR headsets,two frames are rendered from different viewpoints that canbe presented by each of the stereo displays to provide theuser with simulated depth perception.The process 800 continues to update the rendered 3D
display based upon changes (808) in the user position and/orchanges (818) in the mappings of data dimensions to attri-butes. When a user terminates (816) the interactive session,the process completes.As can readily be appreciated, the interactivity of a 3D
data visualization depends upon the rate at which updates tothe visualization can be rendered. In many embodiments, the3D data visualization system targets a frame rate of at least30 frames per second. In several embodiments, target framerates of at least 60 frames per second and/or at least 120frames per second are supported. Updating 3D data visual-izations at high frame rates involves significant computa-tion. In many instances, the computation required to main-tain high frame rates is too great and the 3D datavisualization is unable to render one or more frames in timefor display resulting in what is commonly referred to as aframe drop. In certain embodiments, a graceful decay issupported in which portions of a frame within the center ofa user's field of view are rendered and portions of the framein the peripheral vision of the user are not updated. The
20specific manner in which a given 3D data visualizationsystem manages an inability to render all frames required ata target frame rate is dependent upon the requirements of agiven application.
5 The likelihood that a target frame rate can be achieved canbe increased by reducing the complexity of rendering a 3Ddata visualization. In many embodiments, computationalefficiencies are achieved by creating group 3D objects thatare essentially the aggregation of a number of visible 3D
to objects. Reducing the number of objects can decrease thecomputation associated with aspects of the rendering pipe-line including the processing performed by the physicsengine to detect collisions between 3D objects and the
15 drawing process itself. In several embodiments, a singlegroup 3D object is created using all of the 3D objectscorresponding to visible data points within a 3D graph. Inmany embodiments, a number of group 3D objects that issmaller than the total number of visible 3D objects is
20 created. In certain embodiments, the group 3D objects aresimply meshes having the shape of a set of 3D objects.A process for rendering a 3D data visualization using
group 3D objects in accordance with an embodiment of theinvention is illustrated in FIG. 8B. The process 850 com-
25 mences with the instantiation (852) of a set of 3D dataobjects that include multiple visualization attributes. Thevisualization attributes of the 3D data objects can be deter-mined (854) in a manner similar to that described aboveusing a set of data dimension mappings. In certain embodi-
30 ments, the data dimension mappings define data dimensionvalues in a visualization table that are processed to deter-mine a specific visualization attribute of a 3D object. One ormore group 3D objects are created (856) by generating the
35 mesh and texture of each group 3D object using the meshesand textures of multiple visible 3D objects. In severalembodiments, as many as 100,000 3D objects are utilized tocreate (856) a group 3D object. The specific number of 3Dobjects utilized to create a group 3D object typically
40 depends upon the requirements of a given application.User pose is determined (858), and the group 3D objects
illuminated (860) based upon the user pose. In manyembodiments, the group 3D objects are drawn on a pervertex basis and each vertex is illuminated using a direc-
45 tional light source with a direction determined based uponthe line of sight from the user viewpoint (or a point close tothe user viewpoint) to the vertex. Collision processing canthen be performed (862) with respect to the 3D objects(including group 3D objects) within the virtual space and
5o detected collisions resolved according to the constraintsimposed upon the virtual space by a 3D data visualizationsystem. The virtual space can then be rendered (864) fromthe viewpoint of the user. In the illustrated embodiment, a3D display is rendered. In many embodiments, the rendered
55 display drives a 2D display device.Utilizing group objects can significantly reduce process-
ing associated with interactively rendering a 3D data visu-alization at high frame rates. However, grouping objectsresults in the same processing overhead to modify a single
6o 3D object as to modify all 3D objects. Accordingly, consid-eration of the number of 3D objects corresponding to datapoints combined into a single 3D group object can achievea balance between reduced computational overhead wheninteracting with a 3D graph and preserving interactivity
65 when the 3D graph changes due to updates in data mappings.Animation of movement from one 3D graph to another asmappings of data dimensions to attribute values change is

US 9,665,988 B221
discussed below. Group 3D objects can be utilized to ani-mate groups of data points in batches and achieve highframes during animations.
Although specific processes for visualizing 3D data aredescribed above with reference to FIGS. 8A and 813, any ofa variety of processes that render a 3D data visualizationbased upon dimensions of data points and the position of auser within a virtual space can be utilized as appropriate tothe requirements of a given application. Techniques that canbe utilized to enhance the effectiveness of 3D data visual-izations to reveal structures within data to a user are dis-cussed further below.Enhancing Effectiveness of 3D Visualization of ComplexData3D data visualization systems in accordance with various
embodiments of the invention have the capacity to generatevisualizations of eight or more dimensions of data. A chal-lenge with representing highly dimensional data in 3D is thatthe 3D data visualization inherently introduces variation inthe appearance of 3D objects that is unrelated to the under-lying attributes of the 3D objects. For example, a user mayhave difficulty perceiving the relative size of 3D objectshaving different shapes that are located at different distancesfrom the user. Illumination and, more specifically, shadowscan also introduce variation in the appearance of 3D objectsthat is unrelated to the underlying attributes of the 3Dobjects. Experiments with 3D data visualizations haverevealed that the effectiveness of a 3D data visualization canbe enhanced by utilizing shapes that preserve the ability ofa user to differentiate variations in size due to depth andvariations in size as an attribute of the data, and/or illumi-nation models that illuminate 3D objects in the same wayacross the field of view of the user and do not involve castingof shadows on other 3D objects. Use of depth perceptionpreserving shapes and illumination models in the 3D visu-alization of data to increase the ability of users to perceivestructure within data in accordance with various embodi-ments of the invention are discussed further below.Depth Perception Preserving Shapes
Preserving depth perception can be important in preserv-ing the ability of a user to comprehend the dimensions of thedata being visualized. For example, when size is utilized tovisualize a data dimension, the size of a specific 3D objectsrendered within the field of view of a user will depend bothupon the size attribute of the 3D object and the distance ofthe 3D object from the user within the virtual space. Wherea data dimension is also mapped to a shape attribute of the3D objects, then the shape of the object can further confusesize comparisons (in a manner that is compounded bydifferences in depth). Experiments have shown that relativesize perception for different shapes, such as cubes, spheres,or cylinders, is affected by various factors that includedistance, alignment of the objects, color and illumination. Inmany embodiments, polyhedrons with many faces such as(but not limited to) icosahedrons that have sphere-likeappearances are utilized as the shape of 3D objects with 3Ddata visualizations. Experiments have shown that users areable to accurately perceive the relative sizes of spheres in a3D environment. However, spheres are complex shapes torender in 3D and are typically rendered as polyhedra withhundreds of faces. Accordingly, utilization of polyhedra withsmaller numbers of faces in the range of tens of faces asopposed to hundreds of faces can significantly reduce thecomputation associated with rendering a 3D graph. A 3Dvisualization of a multidimensional data space in which datadimensions are mapped to shape and size attributes of 3Dobjects is shown from several viewpoints in FIGS. 9A-9C.
22In many embodiments, data points are visualized using
depth perception preserving 3D shapes that assist a user indetermining the relative size of a 3D object given thedistance of the 3D object from the user within the virtual
5 space. FIG. 10 shows a small set of 3D object shapes that aredesigned to be recognizable even in highly dense plots. Theconstruction of these 3D object shapes was done withseveral criteria in mind: front, profile, top profile, protru-sions, and corners versus curved regions.
10 For the front profile, the initial templates were basicshapes common to 2D plots. These include circles, triangles,stars, boxes, pluses and exes. 3D shapes were derived withthese listed front profiles. Circles translate to spheres 1000and tori 1008. Triangles translate to pyramids 1006 (or
15 tetrahedral) and cones 1004. Boxes translate to cubes 1002and cylinders 1010. While exes and pluses could be madeinto 3D objects in a similar fashion, each branch of the 3Dshapes has a potential to extrude beyond an occluding objectand be confused for a different type of 3D shape or a feature
20 in a simpler 3D shape. The same difficulty can be encoun-tered with star plot based 3D shapes.
These chosen basic shapes demonstrate a variety of topand bottom profiles: circle, square, point, triangle, andellipse. So, while some glyphs do share the same front
25 profile, particularly the cylinder and cube, the number ofprotruding corners (or lack thereof) and top profiles allowthem to remain recognizable even on densely populated plotregions. Furthermore, lighting can exacerbate the visualdistinction between shapes, aiding in the ability to differen-
30 tiate between them. Similarly, the cone 1004 and pyramid1006, depending on orientation, can exhibit same frontprofiles, i.e. a triangle. Thus the cone 1004 is chosen to pointupward, while the pyramid 1006 is chosen to have onehorizontal edge 1012 at the top, while pointing outward.
35 A 3D shape designed where its faces are parallel to thefront plane, when overlapped with other 3D shapes, is likelyto create a large plane, rather than a more complex surface.Likewise, if the top and bottom profile are aligned with thefloor, when using an orthographic projection, the top and
4o bottom profile would be hidden. All 3D shapes shown inFIG. 10 are, therefore, rotated the same amount both hori-zontally and vertically. The resulting rotation is equivalent toa 30-degree rotation around an axis 30-degrees west of north(i.e. 30 degrees right of screen up vector). As can readily be
45 appreciated, the specific rotations utilized to yield non-planar renderings of large clusters of shapes is largelydependent upon the requirements of a specific 3D datavisualization system. The addition of extra features 1014 onthe sides of the 3D objects can also benefit from the
5o horizontal rotation component, in order to give more visualimportance (via proximity) to one side over the other.
While extra features are included in the 3D shapes shownin FIG. 10, the extra features need not be included in 3Dshapes utilized in accordance with various embodiments of
55 the invention. In many embodiments, depth perception ispreserved by limiting only one dimension of a 3D shape tobe a visualization attribute. For example, the visualized 3Dshapes have heights that are invariant, but widths that varybased upon the value of a mapped data dimension. In certain
60 embodiments, 3D shapes that are pill shaped (i.e. cylindricalwith rounded or hemispherical ends) are utilized. In anumber of embodiments, the widths of the pill shaped 3Dshapes (i.e. the diameters of the cylindrical portion of the pillshapes) are varied based upon the value of a mapped data
65 dimension and the heights of the pill shaped 3D shapes isinvariant with data value. In this way, the width conveysinformation and the height provides a depth cue. As can
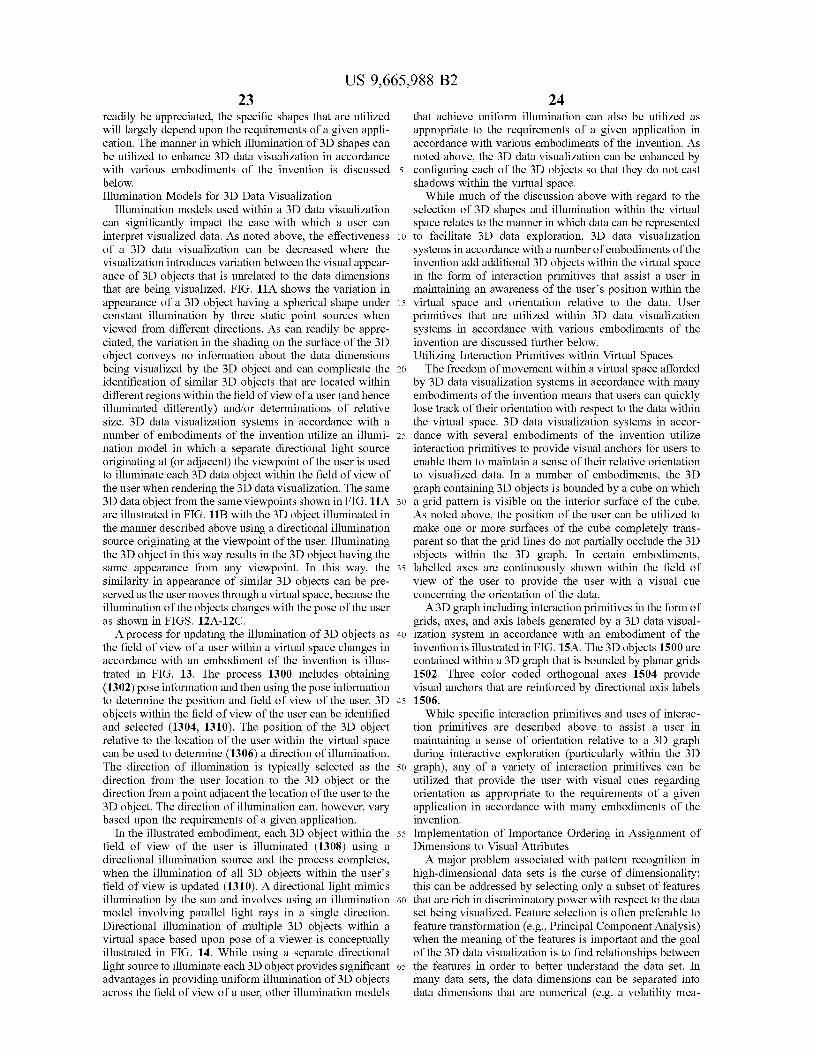
US 9,665,988 B223
readily be appreciated, the specific shapes that are utilizedwill largely depend upon the requirements of a given appli-cation. The manner in which illumination of 3D shapes canbe utilized to enhance 3D data visualization in accordancewith various embodiments of the invention is discussedbelow.Illumination Models for 3D Data Visualization
Illumination models used within a 3D data visualizationcan significantly impact the ease with which a user caninterpret visualized data. As noted above, the effectivenessof a 3D data visualization can be decreased where thevisualization introduces variation between the visual appear-ance of 3D objects that is unrelated to the data dimensionsthat are being visualized. FIG. 11A shows the variation inappearance of a 3D object having a spherical shape underconstant illumination by three static point sources whenviewed from different directions. As can readily be appre-ciated, the variation in the shading on the surface of the 3Dobject conveys no information about the data dimensionsbeing visualized by the 3D object and can complicate theidentification of similar 3D objects that are located withindifferent regions within the field of view of a user (and henceilluminated differently) and/or determinations of relativesize. 3D data visualization systems in accordance with anumber of embodiments of the invention utilize an illumi-nation model in which a separate directional light sourceoriginating at (or adjacent) the viewpoint of the user is usedto illuminate each 3D data object within the field of view ofthe user when rendering the 3D data visualization. The same3D data object from the same viewpoints shown in FIG. 11Aare illustrated in FIG. 11B with the 3D object illuminated inthe manner described above using a directional illuminationsource originating at the viewpoint of the user. Illuminatingthe 3D object in this way results in the 3D object having thesame appearance from any viewpoint. In this way, thesimilarity in appearance of similar 3D objects can be pre-served as the user moves through a virtual space, because theillumination of the objects changes with the pose of the useras shown in FIGS. 12A-12C.A process for updating the illumination of 3D objects as
the field of view of a user within a virtual space changes inaccordance with an embodiment of the invention is illus-trated in FIG. 13. The process 1300 includes obtaining(1302) pose information and then using the pose informationto determine the position and field of view of the user. 3Dobjects within the field of view of the user can be identifiedand selected (1304, 1310). The position of the 3D objectrelative to the location of the user within the virtual spacecan be used to determine (1306) a direction of illumination.The direction of illumination is typically selected as thedirection from the user location to the 3D object or thedirection from a point adjacent the location of the user to the3D object. The direction of illumination can, however, varybased upon the requirements of a given application.
In the illustrated embodiment, each 3D object within thefield of view of the user is illuminated (1308) using adirectional illumination source and the process completes,when the illumination of all 3D objects within the user'sfield of view is updated (1310). A directional light mimicsillumination by the sun and involves using an illuminationmodel involving parallel light rays in a single direction.Directional illumination of multiple 3D objects within avirtual space based upon pose of a viewer is conceptuallyillustrated in FIG. 14. While using a separate directionallight source to illuminate each 3D object provides significantadvantages in providing uniform illumination of 3D objectsacross the field of view of a user, other illumination models
24that achieve uniform illumination can also be utilized asappropriate to the requirements of a given application inaccordance with various embodiments of the invention. Asnoted above, the 3D data visualization can be enhanced by
5 configuring each of the 3D objects so that they do not castshadows within the virtual space.
While much of the discussion above with regard to theselection of 3D shapes and illumination within the virtualspace relates to the manner in which data can be represented
io to facilitate 3D data exploration, 3D data visualizationsystems in accordance with a number of embodiments of theinvention add additional 3D objects within the virtual spacein the form of interaction primitives that assist a user inmaintaining an awareness of the user's position within the
15 virtual space and orientation relative to the data. Userprimitives that are utilized within 3D data visualizationsystems in accordance with various embodiments of theinvention are discussed further below.Utilizing Interaction Primitives within Virtual Spaces
20 The freedom of movement within a virtual space affordedby 3D data visualization systems in accordance with manyembodiments of the invention means that users can quicklylose track of their orientation with respect to the data withinthe virtual space. 3D data visualization systems in accor-
25 dance with several embodiments of the invention utilizeinteraction primitives to provide visual anchors for users toenable them to maintain a sense of their relative orientationto visualized data. In a number of embodiments, the 3Dgraph containing 3D objects is bounded by a cube on which
3o a grid pattern is visible on the interior surface of the cube.As noted above, the position of the user can be utilized tomake one or more surfaces of the cube completely trans-parent so that the grid lines do not partially occlude the 3Dobjects within the 3D graph. In certain embodiments,
35 labelled axes are continuously shown within the field ofview of the user to provide the user with a visual cueconcerning the orientation of the data.A 3D graph including interaction primitives in the form of
grids, axes, and axis labels generated by a 3D data visual-40 ization system in accordance with an embodiment of the
invention is illustrated in FIG. 15A. The 3D objects 1500 arecontained within a 3D graph that is bounded by planar grids1502. Three color coded orthogonal axes 1504 providevisual anchors that are reinforced by directional axis labels
45 1506.While specific interaction primitives and uses of interac-
tion primitives are described above to assist a user inmaintaining a sense of orientation relative to a 3D graphduring interactive exploration (particularly within the 3D
50 graph), any of a variety of interaction primitives can beutilized that provide the user with visual cues regardingorientation as appropriate to the requirements of a givenapplication in accordance with many embodiments of theinvention.
55 Implementation of Importance Ordering in Assignment ofDimensions to Visual AttributesA major problem associated with pattern recognition in
high-dimensional data sets is the curse of dimensionality;this can be addressed by selecting only a subset of features
60 that are rich in discriminatory power with respect to the dataset being visualized. Feature selection is often preferable tofeature transformation (e.g., Principal Component Analysis)when the meaning of the features is important and the goalof the 3D data visualization is to find relationships between
65 the features in order to better understand the data set. Inmany data sets, the data dimensions can be separated intodata dimensions that are numerical (e.g. a volatility mea-

US 9,665,988 B2
sure) or categorical (e.g. Region). 3D data visualizationsystems in accordance with many embodiments of theinvention are configured to automatically detect whetherdata is numerical or categorical during ingest and enableusers to modify data dimension classification where incor- 5
rect (e.g. ZIP codes may be identified as numerical, but areactually categorical "91107" is not greater than "91101").
In several embodiments, 3D data visualizations performfeature selection processes to provide recommendationsconcerning specific mappings of data dimensions to visual- ioization attributes. In a number of embodiments, a userselects a feature of interest (e.g., what are the most importantvariables related to Return Low/High in a set of electroni-cally traded funds). A feature selection process can then beperformed with respect to both the numerical and categorical 15data dimensions to determine the dimensions that are mostrelevant to the feature of interest. In certain embodiments,separate feature selection processes are performed withrespect to the numerical data dimensions and with respect tothe categorical data dimensions. In many embodiments, the 20feature selection process utilizes univariate feature selection.In other embodiments, any of a variety of feature selectionprocesses can be utilized as appropriate to the requirementsof a given application. The feature selection process yieldsan ordered list of features. In several embodiments, the 3D 25data visualization system generates separate ordered lists ofnumerical and categorical data dimensions. In some embodi-ments, only a subset of data dimensions is considered informing the ordered lists.
Once an ordering of the relevance of data dimensions to 30a feature is obtained, the ordering information can beutilized to generate or recommend specific mappings of datadimensions to particular visualization attributes. In a numberof embodiments, a data visualization is generated in whichthe four most important numerical data dimensions are 35mapped to the X, Y, and Z spatial position coordinates of the3D objects and the size attributes of the 3D objects. In manyembodiments, the two most important categorical attributesare mapped to the Show By and shape visualization attri-butes. In many embodiments, a dialogue can be provided 40that makes recommendations and/or further recommenda-tions concerning data dimensions that can be assigned toadditional attributes. In certain embodiments, the feature ofinterest that was utilized to generate the importance orderingof the other data dimensions can be mapped to the color 45visualization attribute. In many embodiments, the specificrecommended mappings is determined based upon the rela-tive relevance of different numerical and categorical datadimensions. In many situations, categorical data dimensionswill be most important from a quantitative perspective 50and/or from the perspective of the user. Instead of mappingcategorical variables to the X, Y, and Z spatial positioncoordinates of the 3D objects, the 3D objects can be utilizedto generate a 3D swarm plot or other type of categoricalscatter plot with non-overlapping points. A user interface 55showing recommendations concerning mappings of specificdata dimensions to particular attributes of 3D objects visiblein a 3D data visualization in accordance with an embodi-ment of the invention is illustrated in FIG. 15B.
While specific processes for performing importance 60ordering and for recommending and/or assigning mappingsof data dimensions to visualization attributes of 3D objectsare described above, any of a variety of techniques forrecommending specific data dimensions to map to particularvisualization attributes including (but not limited to) tech- 65niques that perform importance ordering utilizing the FastRelief Algorithm, the Fisher Discriminant Ratio, Correla-
26tion-based Feature Selection, a Fast Correlation Based Fil-ter, and/or Multi Class Feature Selection can be utilized asappropriate to the requirements of specific applications inaccordance with various embodiments of the invention.Automated Color Palette Selection Based Upon Data Char-acteristicsIn a similar manner that selection of specific data dimen-
sions for 3D data visualization can be significant in high-lighting patterns within data, the manner in which a specificdata dimension is mapped to a visualization attribute canalso be important in effectively communicating information.In many embodiments, numerical data dimensions aremapped to a continuous visualization attribute such as (butnot limited to) color in a non-linear manner so that thegreatest differences in the colors of the 3D objects occurswith respect to the range of values that conveys the mostinformation regarding the relationship between the datadimensions and other data dimensions or a target feature. Inmany embodiments, when a data dimension is mapped tocolor it is mapped to a discrete number of colors to add withvisual discrimination of the color attribute. As can readily beappreciated, any of a variety of techniques can be utilized tomap values of a data dimension to specific colors as appro-priate to the requirements of a given application in accor-dance with various embodiments of the invention.Use of Animated Transitions in 3D Data Visualizations
Users that analyze high dimensional data frequentlychange the data dimensions that are visualized in order toexplore different relationships within the data. In a numberof embodiments, 3D data visualization systems use anima-tion to illustrate correspondence between specific 3D objectsrepresenting discrete data points as data mappings change.The ability to observe a point moving from a location in afirst 3D graph to a second 3D graph in which one or morethe attributes of the 3D object corresponding to the datapoint are modified can enable the user to observe relation-ships that may exist within the data that can be revealed bymapping alternative combinations of data dimensions to 3Dobject attributes. A sequence of 3D data visualizations inwhich the X attribute of the 3D data objects is modified froma first data dimension (i.e. "Age") to a second data dimen-sion (i.e. "YearsOn7ob") in accordance with an embodimentof the invention is illustrated in FIGS. 16A-16D.In several embodiments, additional insights into the data
can be provided by animating different subsets of the data atdifferent rates. For example, a clustering algorithm can beutilized to analyze the data in a first 3D graph and theanimation can involve movement of the 3D data objects inthe different clusters at different speeds. In certain embodi-ments, the user can control the animation so that sets of 3Dobjects commence movement upon receipt of user inputdirecting their movement. In this way, a user can isolate aspecific set of 3D objects and observe the way in which theymap from one 3D graph to another. In a number of embodi-ments, a user can repeat the animations in a loop and/oreverse the animation to obtain further insights.
While specific techniques for animating 3D objects aredescribed above with reference to FIGS. 16A-16D, any of avariety of animation techniques can be utilized to showchanges in the attributes of 3D objects (which may includechanges in shape, color, size, texture, etc. in addition tochanges in position) from one 3D graph to another 3D graphas data dimension mappings are changed using 3D datavisualization systems as appropriate to the requirements ofspecific applications in in accordance with various embodi-ments of the invention.

US 9,665,988 B227
Contextual Presentation of DataMany of the processes described above for enhancing 3D
data visualization focus on the manner in which the 3D datavisualization is generated. The context in which a 3D datavisualization is presented can also impact a user's ability todiscern meaningful insights from data. A user typicallyinteracts with a 3D graph in different ways depending uponthe amount of free space and freedom of movement of theuser within the real world environment in which the 3D datavisualization is being performed. When a user interacts witha 3D graph while seated at a desk, the user typically prefersthe 3D graph to be displayed in a compact manner (e.g. a onefootxone footxone foot cube). When a user is experiencingthe 3D data visualization while standing and in an environ-ment in which the user has significant freedom of move-ment, the user is more likely to scale the 3D graph to a largersize and move through the 3D graph. In many embodiments,the 3D graph is within a virtual environment. In severalembodiments, the virtual environment and/or a mixed realityenvironment can contain affordances that enable manipula-tion of data. As noted above, the appearance of the 3D graphmoving with respect to the virtual environment and affor-dances within the virtual environment can be achieved bymoving the 3D objects associated with the virtual environ-ment and the user's viewpoint within the virtual space tocreate the appearance that the 3D graph is being manipulatedrelative to the environment without moving the 3D objectsthat form the 3D graph. In addition, the manner in which theuser interacts with the 3D graph can change as the relativescale of the 3D graph change changes with respect to thevirtual environment and with the distance of the user'sviewpoint from the 3D graph within the virtual environment.
In many embodiments, a 3D data visualization systemprovides affordances within the 3D user interface displayedto the user that control the resizing of a 3D graph. In anumber of embodiments, the 3D data visualization systemcan use information concerning the real world environmentin which the 3D data visualization is being performed andcan adjust the size of the 3D visualization of the multidi-mensional data space to fit within the environment.
Affordances within a VR user interface that enable a userto control the size of a 3D data visualization within thevirtual world generated by a 3D data visualization system inaccordance with an embodiment of the invention is illus-trated in FIG. 17A. The virtual environment 1700 includesa virtual office cube with a first affordance 1702 that canresize a 3D graph to a predetermined "desktop" scale. Thevirtual environment 1700 also includes a second affordance1704 that can resize a 3D graph to a predetermined "sitdown" scale, which is larger than the "desktop" scale, and athird affordance 1706 that can resize a 3D graph to thelargest predetermined "standing" scale. When a user movesthe 3D data visualization over the affordance, the 3D datavisualization is resized. Following resizing, the user canfurther manipulate the 3D data visualization includingchanging the scaling of the 3D data visualization (e.g.shrinking a 3D graph to "desktop" scale and then expandingthe 3D graph to move through the data toward a specificcluster of interest).The manner in which a 3D data visualization can be
resized using affordances within a 3D user interface isconceptually illustrated in FIGS. 1713-17F. In FIGS. 17B and17C, a user's pose (1708) and a 3D data visualization (1710)within the virtual environment are illustrated. The affor-dance (1702) that can be utilized to resize the 3D datavisualization to "desktop" scale is visible in FIG. 17C.Movement of the 3D data visualization (1710) over the
28affordance (1702) and the resulting resized 3D data visual-ization (1712) are conceptually illustrated in FIGS. 17E and17F. As noted above, resizing does not fix the size of the 3Dgraph. Following resizing, the user can continue to modify
5 the size of the 3D data visualization and the manner in whichthe 3D data visualization system responds to user inputs maychange (e.g. the magnitude of a 3D gesture movement canbe responded to differently based upon the size of the 3Ddata visualization). The affordance simply provides a
io mechanism by which a user can move between differentcontexts and have the 3D data visualization system auto-matically modify the 3D data visualization in ways that caninclude (but are not limited to) reflecting differences in thereal world space and/or real world freedom of movement
15 available for the user to explore the data. The increased scalewith which a user can visualize the 3D data visualizationwhen the user's context shifts to a standup mode in whichthe user has freedom of movement is conceptually illustratedin FIG. 17F.
20 While the above discussion refers to three different modesor operating contexts, 3D data visualization systems cansupport any number of different modes and/or contexts asappropriate to the requirements of a given application inaccordance with various embodiments of the invention.
25 Furthermore, the affordances within the 3D user interfacethat automatically modify the 3D data visualization are notlimited to affordances that simply resize the data. In variousembodiments, a rich array of affordances are offered includ-ing (but not limited to) affordances that respond to move-
30 ment of a 3D graph over the affordance by: applying amachine learning algorithm to the data (e.g. k-means clus-tering); and/or generating a new 3D visualization of multi-dimensional data represented by a single 3D object within aninitial 3D visualization. In addition, automated actions such
35 as (but not limited to) resizing can be performed in responseto predetermined inputs that can include (but are not limitedto) gesture, inputs, speech inputs, inputs via one or moreinput devices, and/or any combination or sequence of inputs.Accordingly, 3D data visualization systems are not limited
40 to use of any specific affordances and can utilize anyaffordance, set of affordances, and/or input modalities tointeract with a 3D graph as appropriate to the requirementsof a given application.In several embodiments, the 3D data visualization system
45 determines real world context and dynamically modifies therendering a 3D data visualization to be realistically con-tained within the real world environment. For example,instead of a virtual cube, similar resizing operations can beperformed within a real cube and/or office space. In a
5o number of embodiments, a depth sensing camera system isutilized to acquire information concerning the volumes of afree space surrounding a user. In other embodiments, any ofa variety of appropriate machine vision techniques can beutilized. In several embodiments, the 3D data visualization
55 system detects changes in the volume of space related to thechange in pose and/or viewpoint of the user and can resizea 3D data visualization in a manner that is appropriate to thenew volume of free space visible from the user's viewpoint.As can readily be appreciated, a 3D data visualization
60 system will typically not place limits on the ability to whicha user can resize a 3D data visualization based upon thevolume of free space available to contain the visualization.Instead, a user can expand the 3D data visualization in a waythat enables interactive exploration of the data.
65 Input DevicesIn a number of embodiments, a variety of input modalities
are supported by 3D data visualization systems. In several

US 9,665,988 B229
embodiments, a user can interact with a 3D data visualiza-tion system using a desktop device using a conventionalWindows Icons Menus Pointers (WIMP) paradigm and/or amobile device using a touch gesture based user interface.When a user transitions to interacting with the 3D datavisualization system via an immersive 3D display, such as(but not limited to) an AR, MR, or VR headset, then userinput can be obtained using a variety of additional inputmodalities. In several embodiments, 3D gesture based inputscan be observed using a machine vision system. In manyembodiments, a user is provided with a wand-like user inputdevice having an elongated handle that communicates wire-lessly with the 3D data visualization system. In a number ofembodiments, the wand has a single button and communi-cates via a wireless communication link. The 3D datavisualization system can obtain user input by tracking thepose of the wand and the status of the button. Dependingupon the context, the button can be interpreted by the 3Ddata visualization system as conveying different informa-tion. A simple input modality involves allowing the user tomove the position of the 3D data visualization relative to theuser when the button is not being pressed, and rotate the 3Ddata visualization when the button is pressed. In otherembodiments, user gaze direction and/or a remote controlthat simply includes one or more buttons can be used as userinputs. As can readily be appreciated, any of a variety ofprocessing can be initiated based upon a combination of apose input and a button input as appropriate to a specific useinterface context and the requirements of a given applicationin accordance with various embodiments of the invention.Furthermore, any of a variety of additional input modalitiescan also be supported as appropriate to the needs of a given3D data visualization application.
Although the present invention has been described incertain specific aspects, many additional modifications andvariations would be apparent to those skilled in the art. It istherefore to be understood that the present invention may bepracticed otherwise than specifically described, includingvarious changes in the implementation other than thosedescribed herein such as (but not limited to) the use ofalternative display technologies (e.g. a cave automatic envi-ronment), without departing from the scope and spirit of thepresent invention. Thus, embodiments of the present inven-tion should be considered in all respects as illustrative andnot restrictive.
What is claimed is:1. A data visualization system for generating three-dimen-
sional (3D) visualizations of a multidimensional data space,comprising:
a display device; anda computing system, comprising:memory containing a 3D data visualization application;and
a processing system;wherein the 3D data visualization application directs
the processing system to:load a set of data points into a visualization table in
the memory, where each data point includes val-ues in multiple data dimensions and an additionalvisibility value is assigned to each data point in avisibility dimension within the visualization table;
create representations of a set of 3D objects corre-sponding to the set of data points, where each 3Dobject has a set of visualization attributes thatdetermine the manner in which the 3D object isrendered and the visualization attributes include a
30location of the 3D object within a virtual spacehaving three spatial dimensions;
receive mappings of data dimensions to visualizationattributes;
5 determine the visualization attributes of the set of 3Dobjects based upon the selected mappings of datadimensions to 3D object attributes, where theselected mappings of data dimensions to visual-ization attributes determine a location for each
10 visible 3D object within the virtual space;update the visibility dimension in the visualization
table for each of the plurality of 3D object toreflect the visibility of each 3D object based uponthe selected mappings of data dimensions to visu-
15 alization attributes; andinteractively render 3D data visualizations of the 3D
objects within the virtual space from viewpointsdetermined based upon received user input;
wherein the 3D data visualization application further20 directs the processing system to:
receive at least one updated mapping of a data dimensionto a visualization attribute;
determine updated visualization attributes for the set of3D objects based upon the selected mappings of data
25 dimensions to 3D object attributes, where the updatedmappings of data dimensions to visualization attributesdetermine a location for each visible 3D object withinan updated virtual space;
generate trajectories for the set of visible 3D objects from30 their locations in the virtual space to their updated
locations in the virtual space; andinteractively render animations of the movements of 3D
objects along their generated trajectories from theirlocations in the virtual space to their locations in the
35 updated virtual space from viewpoints determinedbased upon received user input.
2. The data visualization system of claim 1, wherein:the display device is a 3D display device; andinteractively rendering 3D data visualizations of the 3D
40 objects within the virtual space from viewpoints deter-mined based upon received user input comprises ren-dering stereo images displayed via the 3D displaydevice.
3. The data visualization system of claim 1, wherein the45 3D data visualization application is implemented using a 3D
rendering engine.4. The data visualization system of claim 3, wherein the
implementation of the 3D data visualization applicationfurther relies upon scripts that execute via the 3D rendering
50 engine.5. The data visualization system of claim 1, wherein the
visualization attributes include at least one attribute selectedfrom the group consisting of:X Coordinate,
55 Y Coordinate,Z Coordinate,Shape,Size,Color Palette,
60 Color Map,Color Scale,Transparency,ID,URL,
65 Mask,Show By,Motion of the 3D Object,

US 9,665,988 B231
Snfication,Haptic Feedback, andVibrotactile Feedback.6. The data visualization system of claim 1, wherein
receiving mappings of data dimensions to visualizationattributes further comprises receiving user selections ofmappings of data dimensions to visualization attributes.
7. The data visualization system of claim 1, whereinreceiving mappings of data dimensions to visualizationattributes further comprises retrieving a stored set of map-pings of data dimensions to visualization attributes.
8. The data visualization system of claim 1, whereininteractively rendering 3D data visualizations of the 3Dobjects within the virtual space from viewpoints determinedbased upon received user input further comprises:
generating at least one group 3D object based upon thevisualization attributes of a plurality of visible 3Dobjects; and
interactively rendering 3D data visualizations of the atleast one group 3D object within the virtual space fromviewpoints determined based upon received user input.
9. The data visualization system of claim 1, whereininteractively rendering 3D data visualizations of the 3Dobjects within the virtual space from viewpoints determinedbased upon received user input further comprises:
modifying 3D objects forming part of a virtual environ-ment within the virtual space in response to the userinput so that the 3D objects corresponding to the set ofdata points remain stationary within the virtual spaceand appear to change relative to the virtual environmentin the 3D data visualization due to the modification tothe 3D objects forming part of the virtual environment;and
rendering the visible 3D objects corresponding to the setof data points and the 3D objects forming part of thevirtual environment.
10. The data visualization system of claim 9, whereinmodifying 3D objects forming part of a virtual environmentwithin the virtual space in response to the user input com-prises at least one modification selected from the groupconsisting of:
modifying the size of the 3D objects forming part of thevirtual environment in response to a user instruction toresize the 3D objects corresponding to the set of datapoints to create an impression that the 3D objectscorresponding to the set of data points are changing insize relative to the virtual environment;
moving the positions of the 3D objects forming part of thevirtual environment in response to a user instruction tomove the 3D objects corresponding to the set of datapoints to create the impression that the 3D objectscorresponding to the set of data points are movingrelative to the virtual environment; and
moving the positions of the 3D objects forming part of thevirtual environment in response to a user instruction torotate the 3D objects corresponding to the set of datapoints to create the impression that the 3D objectscorresponding to the set of data points are rotatingrelative to the virtual environment.
11. The data visualization system of claim 1, whereininteractively rendering 3D data visualizations of the 3Dobjects within the virtual space from viewpoints determinedbased upon received user input comprises:
illuminating at least some of the 3D objects, where eachilluminated 3D object is illuminated using a directionalillumination source originating at a user viewpoint; and
32rendering at least the illuminated 3D objects based upon
the user viewpoint.12. The data visualization system of claim 11, wherein
illuminating at least some of the 3D objects further com-5 prises:
determining a field of view;illuminating 3D objects within the field of view of the user
using a directional illumination source originating atthe user viewpoint; and
10 rendering the illuminated 3D objects within the field ofview of the user.
13. The data visualization system of claim 1, whereininteractively rendering 3D data visualizations of the 3Dobjects within the virtual space from viewpoints determined
15 based upon received user input comprises:rotating at least some of the 3D objects based upon a user
viewpoint, so that the appearance of the rotated 3Dobjects is invariant with user viewpoint; and
rendering the rotated 3D objects based upon the user20 viewpoint.
14. The data visualization system of claim 1, whereininteractively rendering 3D data visualizations of the 3Dobjects within the virtual space from viewpoints determinedbased upon received user input comprises:
25 determining a location within the virtual space of at leastone interaction primitive based upon a user viewpoint;and
rendering the at least one interaction primitive based uponthe user viewpoint.
30 15. The data visualization system of claim 14, furthercomprising determining a transparency of at least one inter-action primitive based upon the user viewpoint.16. The data visualization system of claim 1, wherein the
3D objects include 3D objects having depth perception35 preserving shapes.
17. The data visualization system of claim 1, whereinreceiving mappings of data dimensions to visualizationattributes comprises:
receiving a selection of a target feature;40 determining the importance of at least a subset of multiple
data dimensions to the target feature; andgenerating mappings of data dimensions having high
importance to specific visualization attributes.18. The data visualization system of claim 17, wherein
45 determining the importance of at least a subset of multipledata dimensions to the target feature further comprises:
identifying data dimensions that are numerical and datadimensions that are categorical;
generating mappings of numerical data dimensions hav-50 ing high importance to a first set of visualization
attributes;generating mappings of categorical data dimensions hav-
ing high importance to a second set of visualizationattributes.
55 19. The data visualization system of claim 18, wherein thefirst set of visualization attributes comprises X, Y, Z posi-tion, and size.
20. The data visualization system of claim 19, wherein thesecond set of visualization attributes comprises shape.
60 21. The data visualization system of claim 1, wherein the3D data visualization application further directs the process-ing system to determine updated visibility values for each ofthe plurality of 3D object to reflect the visibility of each 3Dobject based upon the updated mapping.
65 22. The data visualization system of claim 21, whereininteractively rendering animations of the movements of 3Dobjects along their generated trajectories further comprises

US 9,665,988 B233
varying the time at which different sets of 3D objectscommence moving along their trajectories during a renderedanimation.
23. The data visualization system of claim 22, wherein thetime at which different sets of 3D objects commence movingalong their trajectories during a rendered animation is deter-mined based upon user input.
24. The data visualization system of claim 1, whereininteractively rendering animations of the movements of 3Dobjects along their generated trajectories further comprisesvarying the speed with which different sets of 3D objectsmove along their trajectories during a rendered animation.
25. The data visualization system of claim 1, whereininteractively rendering 3D data visualizations of the 3Dobjects within the virtual space from viewpoints determinedbased upon received user input comprises:
determining a location within the virtual space of at leastone affordance, where user input directing movementof a 3D data visualization onto one of the at least oneaffordances initiates modification of the 3D data visu-alization;
detecting movement of a 3D data visualization onto oneof the at least one affordances;
modifying the 3D data visualization based upon the one ofthe at least one affordances; and
rendering the modified 3D data visualization based uponthe user viewpoint.
26. The data visualization system of claim 25, whereinmodifying the 3D data visualization based upon the one ofthe at least one affordances comprises resizing the 3D datavisualization.
27. The data visualization system of claim 1, wherein:the memory further comprises avatar metadata including
a set of visualization attributes that determine themanner in which an avatar is rendered and the visual-ization attributes include a location of the avatar withinthe virtual space; and
interactively rendering 3D data visualizations of the 3Dobjects within the virtual space from viewpoints deter-mined based upon received user input comprises ren-dering avatars within the 3D data visualization basedupon the viewpoints and the avatar metadata.
28. A data visualization system for generating 3D visu-alizations of a multidimensional data space, comprising:
a display device; anda computing system, comprising:memory containing a 3D data visualization application;and
a processing system;wherein the 3D data visualization application directs
the processing system to:load a set of data points into a visualization table in
the memory, where each data point includes val-
34ues in multiple data dimensions and an additionalvisibility value is assigned to each data point in avisibility dimension within the visualization table;
create representations of a set of 3D objects corre-5 sponding to the set of data points, where each 3D
object has a set of visualization attributes thatdetermine the manner in which the 3D object isrendered and the visualization attributes include alocation of the 3D object within a virtual space
10 having three spatial dimensions;receive mappings of data dimensions to visualization
attributes;determine the visualization attributes of the set of 3D
objects based upon the selected mappings of data15 dimensions to 3D object attributes, where the
selected mappings of data dimensions to visual-ization attributes determine a location for eachvisible 3D object within the virtual space;
update the visibility dimension in the visualization20 table for each of the plurality of 3D object to
reflect the visibility of each 3D object based uponthe selected mappings of data dimensions to visu-alization attributes; andinteractively render 3D data visualizations of the
25 3D objects within the virtual space from view-points determined based upon received userinput;
wherein the memory further comprises avatar metadataincluding a set of visualization attributes that determine
30 the manner in which an avatar is rendered and thevisualization attributes include a location of the avatarwithin the virtual space; and
interactively rendering 3D data visualizations of the 3Dobjects within the virtual space from viewpoints deter-
35 mined based upon received user input comprises ren-dering avatars within the 3D data visualization basedupon the viewpoints and the avatar metadata.
29. The data visualization system of claim 28, wherein:the avatar metadata further comprises pose information;
40 andrendering avatars within the 3D data visualization based
upon the viewpoints and the avatar metadata furthercomprises rendering the poses of avatars within the 3Ddata visualization based upon the pose information
45 within the avatar metadata.30. The data visualization system of claim 28, wherein:the display device is a 3D display device; andinteractively rendering 3D data visualizations of the 3D
objects within the virtual space from viewpoints deter-
50 mined based upon received user input comprises ren-dering stereo images displayed via the 3D displaydevice.