Embed Size (px)
DESCRIPTION
Avoiding Transmission and Fossil Backup Maximizing Ratepayer Value. Craig Lewis Executive Director Clean Coalition 650-204-9768 [email protected]. 11 April 2012. Avoided Transmission in CA = $80 Billion over 20 yrs. Business as Usual Year-20 TAC (TAC 20 ) = 2.7. 2.7. - PowerPoint PPT Presentation
Citation preview
Making Clean Local Energy Accessible Now 11 April 2012
Craig LewisExecutive DirectorClean [email protected]
Avoiding Transmission and Fossil BackupMaximizing Ratepayer Value
Making Clean Local Energy Accessible Now
2
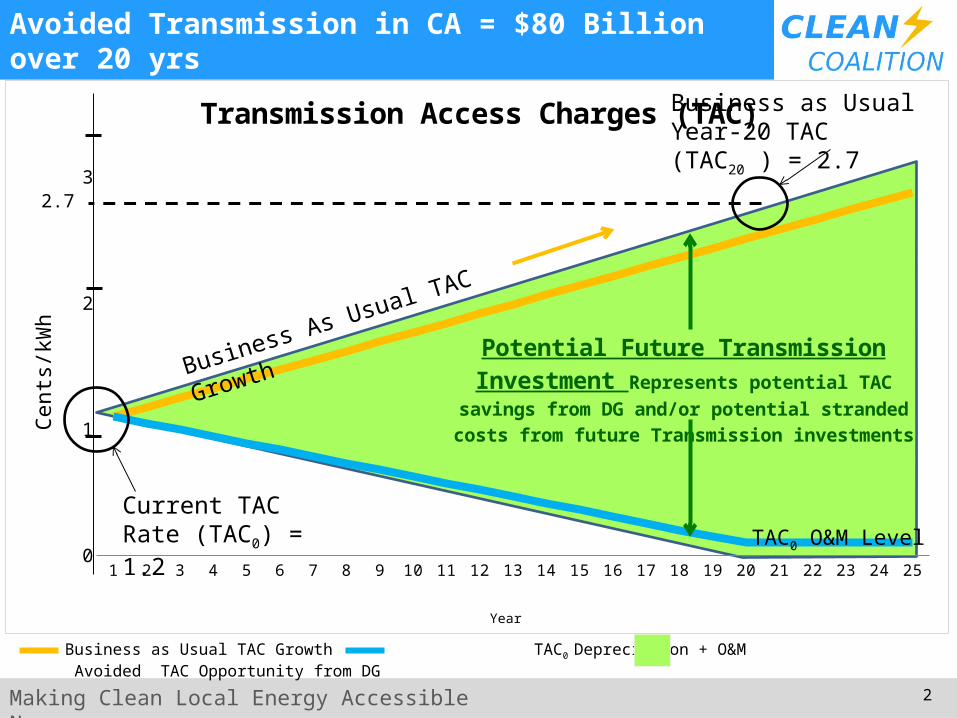
Avoided Transmission in CA = $80 Billion over 20 yrs
1 2 3 4 5 6 7 8 9 10 11 12 13 14 15 16 17 18 19 20 21 22 23 24 250
1
2
3
Transmission Access Charges (TAC)
Year
Cen
ts/k
Wh
Potential Future Transmission Investment Represents potential TAC savings from DG and/or potential stranded costs from future Transmission
investments
Business as Usual TAC Growth TAC0 Depreciation + O&M Avoided TAC Opportunity from DG
Current TACRate (TAC0) = 1.2
Business As Usual TAC Growth
Business as Usual Year-20 TAC (TAC20 ) = 2.7
2.7
TAC0 O&M Level

Making Clean Local Energy Accessible Now
3
Time of day
GW
Too Much Demand
Too Much Supply
Avoided Fossil Backup = Funds for Superior Solutions
60
50
40
30
20
10
0
12a 6a 12p6p 12a
Frequency RegulationStabilizes grid at 60 Hz.Commonly provided by natural gas powered generators, but all fossil sources are slow ramping.Energy Storage and Demand Response are nearly instantaneous while providing a multitude of additional benefits.
Making Clean Local Energy Accessible Now
4
Back-Up Slides
Back-Up Slides

Making Clean Local Energy Accessible Now
5
Clean Coalition Vision = DG+DR+ES+EV+MC2
Making Clean Local Energy Accessible Now
6
CLEAN Programs Deliver Cost-Effective Scale
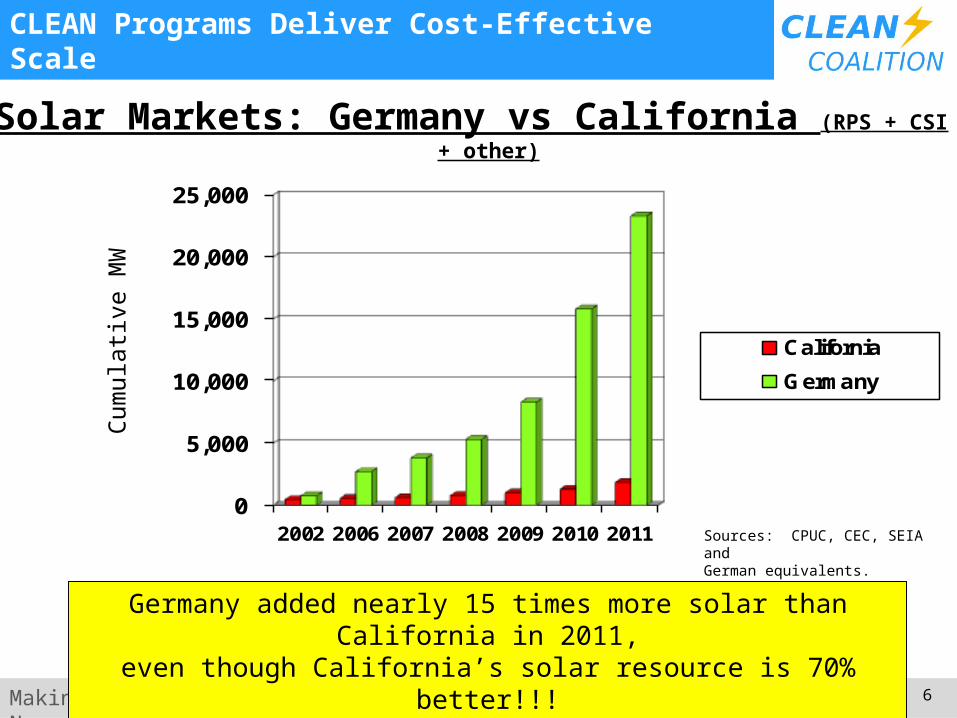
Solar Markets: Germany vs California (RPS + CSI + other)
0
5,000
10,000
15,000
20,000
25,000
2002 2006 2007 2008 2009 2010 2011
CaliforniaGermany
Germany added nearly 15 times more solar than California in 2011,even though California’s solar resource is 70% better!!!
Sources: CPUC, CEC, SEIA and German equivalents.
Cum
ulati
ve M
W
Making Clean Local Energy Accessible Now
7
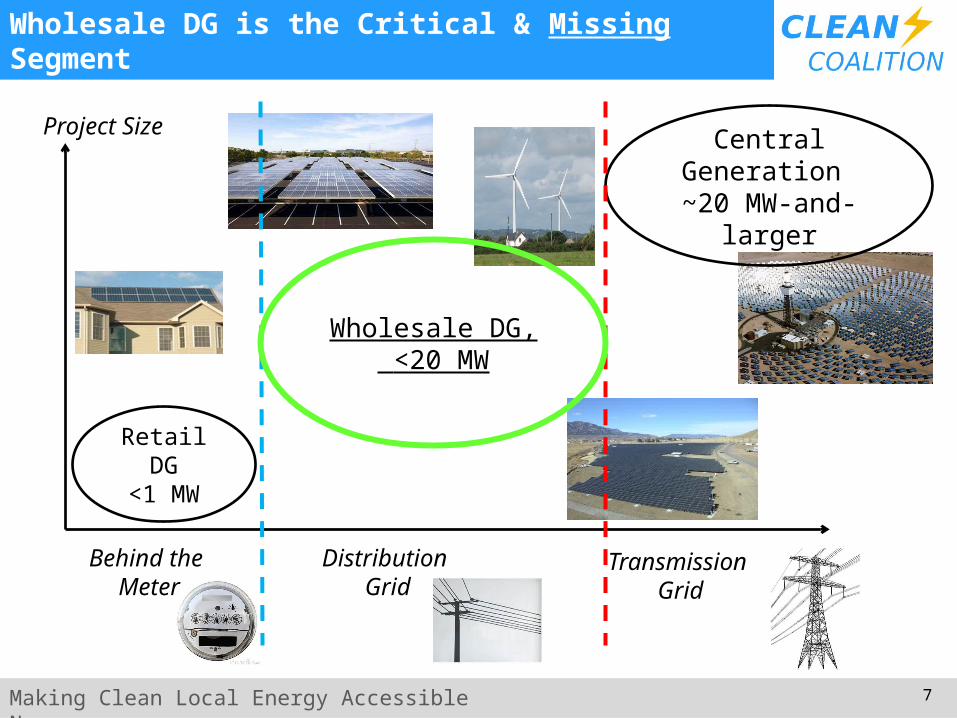
Wholesale DG is the Critical & Missing Segment
Retail DG<1 MW
Central Generation ~20 MW-and-larger
Distribution Grid
Transmission Grid
Project Size
Wholesale DG, <20 MW
Behind the Meter

Making Clean Local Energy Accessible Now
8
German Solar Capacity is Small WDG (Rooftops)
up to 10 kW 10 to 30 kW 30 to 100 kW 100 kW to 1 MW over 1 MW -
200,000
400,000
600,000
800,000
1,000,000
1,200,000
1,400,000
1,600,000
1,800,000
2,000,000
German Solar PV Capacity Installed in 2010
MW
Source: Paul Gipe, March 2011
Germany’s solar deployments are almost entirely <2 MW rooftop projects interconnected to the distribution grid (not behind-the-meter)
22.5%
26%
23.25%
9.25%
19%
Making Clean Local Energy Accessible Now
9
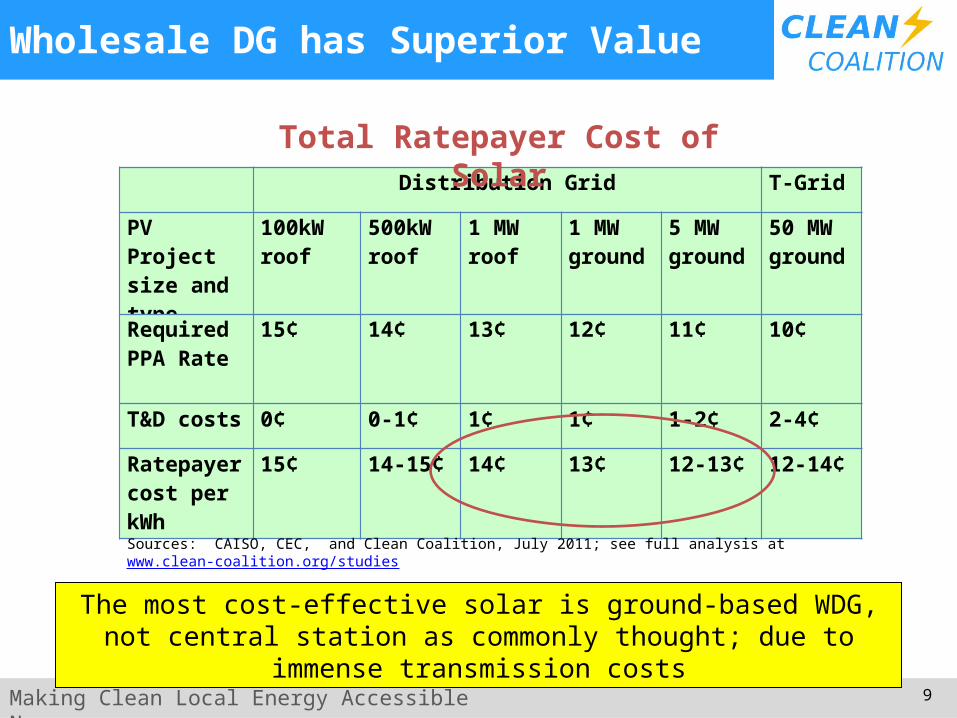
Wholesale DG has Superior Value
The most cost-effective solar is ground-based WDG, not central station as commonly thought; due to immense
transmission costs
Distribution Grid T-Grid
PV Project size and type
100kW roof
500kW roof
1 MW roof
1 MW ground
5 MW ground
50 MW ground
Required PPA Rate
15¢ 14¢ 13¢ 12¢ 11¢ 10¢
T&D costs 0¢ 0-1¢ 1¢ 1¢ 1-2¢ 2-4¢
Ratepayer cost per kWh
15¢ 14-15¢ 14¢ 13¢ 12-13¢ 12-14¢
Sources: CAISO, CEC, and Clean Coalition, July 2011; see full analysis at www.clean-coalition.org/studies
Total Ratepayer Cost of Solar
Making Clean Local Energy Accessible Now
10
75% of California IOU capital expenditures are made on the distribution grid (D-grid) and California ratepayers deserve maximized returns on their MASSIVE investments (2007 IEPR)
Investment needs to be future-proofed to allow significant penetrations of clean local energyConfidentiality rules need to change to allow proper regulatory oversight of these massive ratepayer investments
Germany and Spain are excellent proxies for assuring that California’s existing D-grid can accommodate significant penetrations of clean local energy (May 2011 CEC/KEMA report)
MPR is determined at point-of-interconnect and Wholesale Distributed Generation (WDG) and a Locational Benefits (LBs) adder is needed to compensate for extra value of WDG
Average extra LBs value of DG is in the neighborhood of 25% (Transmission Access Charges of 1.5 cents/kWh plus 10% for transmission line/congestion losses)The LBs adder should be handled just like the Time-of-Delivery (TOD) adderRatepayers currently get massive free value from WDG in the form of uncompensated LBs
Connecting-the-Dots to Reform
Making Clean Local Energy Accessible Now
11
Currently, developers are responsible for 100% of D-grid upgrade costs without any opportunity for reimbursement, EVER
This is different than transmission upgrade costs that are ALWAYS borne by the ratepayerRecommendation for the 50% of the D-grid where LBs value is above average, utilities pay for D-grid upgrades and recover through the rate-base. Ratepayers currently get massive free value from WDG in the form of uncompensated D-grid upgrade costs
Wholesale Distributed Generation (WDG) interconnections need to be far more timely and transparent
WDG interconnection processes in IOU D-grids are expected to require an average of 2 yearsWDG interconnection processes in the SMUD D-grid requires 6 months
Interconnection studies for 100 MW of WDG projects in its Feed-In Tariff program were completed in 2 months (performed by 2 guys)100 MW of WDG in SMUD territory is equivalent to 2,500 MW of WDG statewide TWO GUYS for TWO MONTHS should be an achievable benchmark for all utilities
Connecting-the-Dots to Reform (continued)