Embed Size (px)
Citation preview

A.E. Ext. 85-11
ON~lD_A-:MOHAW~~gEGION>I: III I
1:1 111= .... 111 >1111:111 -III
III = II
1984
-Ed L. LaDue
Department of Agricultural Economics New York State College of Agriculture and life Scierices
A Slotutory College of Ihe Slole University
. Cornell University, Ithaca, New York 14853

~.nM BUSINESS suMMARYDAIRY rlU~.n
Oneida-MohaWk Region
TABLE OF CONTENTS
Introduction ... . .. . . . . . . . .. . .... . . . ... . ............................... 1
Program Objectives ••••••••••••••••••••••••••••••••• .............. 1
New Developments ••••••••••••••••••••••••••••••••••••• ............ 1
Summary of The Farm Business •••••••••••••••••••••••••••••••••••••••••• 2
Business Characteristics ••••••••••••••••••••••••••••••••••••••••• 2
Inventory Accounting ••••••••••••••••••••••••••••••••••••••••••••• 3
Receipts ••••••••••••••••••••••••••••••••••••••••••••••••••••••••• 4
Expenses ••••••••••••••••••••••••••••••••••••••••••••••••••••••••• 5
Farm Business Profitability •••••••••••••••••••••••••••••••••••••• 6
Farm Family Financial Situation •••••••••••••••••••••••••••••••••• 8
Analysis of the Farm Business ••••••••••••••••••••••••••••••••••••••••• 10
10Size of Business •••••••••••••••••••••••••••••••••••••••••••••••••
Rates of Production •••••••••••••••••••••••••••••••••••••••••••••• 11
Labor Efficiency ••••••••••••••••••••••••••••••••••••••••••••••••• 12
Capital Efficiency ••••••••••••••••••••••••••••••••••••••••••••••• 13
Cost Control ..................................................... 14
Machinery, Labor and Miscellaneous Costs ••••••••••••••••••••••••• 15
Yearly Cash Flow Planning and Analysis ................................ 16 Progress of the Farm Business ......................................... 17
Management Performance of Statewide Cooperators ••••••••••••••••••••••• 18
................................... 26 Measure Your Management Performance

/
/
DAIRY FARM BUSINESS SUMMARY Oneida-Mohawk Region
INTRODUCTION
comDlnlng ana averag~ng aaLa SUDm3.l:·L~U r:fy Lll~--lU:lCC.Le.Lpa\..LlL~ ... a.... lIlc·... "'· .LX-VUC >;'0.",
region described at the bottom of this page.
Program Objectives
The primary objectives of the dairy farm business management program are to (1) assist farmers in developing and maintaining more complete farm business data for use in management decisions and (2) help farmers improve their management skills through appropriate use of farm record data and application of modern decision-making techniques. This report is prepared in workbook form for use in the systematic study of individual farm business performance.
The need for a thorough dairy farm business examination and follow-up plan is greater than ever. The years immediately ahead will bring continued economic pressures on dairy farmers. We must continue to place emphasis on cost control and improvements in operating efficiency to maintain adequate farm incomes. Projecting cash flows to determine future cash needs, and carefully planning how those needs can be met, will be required to survive the current dairy farm financial crisis.
New Developments
This year, several farm management agents and specialists are partici pating in a Dairy Farm Business Summary Pilot Program. Cooperative Extension Associations with appropriate microcomputers, have the capability to strengthen their dairy farm business analysis activities by calculating and printing the individual farm summary and analysis reports for immediate use by the agent and farmer, at any time. After the individual farm data is entered in the county office using the Micro DFBS computer program, it is sent to the Department of Agricultural Economics at Cornell University for additional review prior to transfer to a mainframe computer program for calculation of regional and state summaries.
Four dairy farmers participating in the milk diversion program are included in this report. Since this is a relatively small number, the data from these farms has not been summarized separately. A separate summary and analysis of milk diversion program farms will be included in the 1984 New York State Dairy Farm Business Summary.
This summary was prepared by Eddy L. LaDue, Department of Agricultural Economics, New York State College of Agriculture and Life Sciences, Cornell University, in cooperation with Cooperative Extension Agents David Thompson, Eric Kresse, and Teddy Aber. The Oneida-Mohawk Region is comprised of Oneida, Schoharie, Montgomery, Fulton, Herkimer, and Schenectady Counties.
1

---
------ --------
2
SUMMARY OF THE FARM BUSINESS
Business Characteristics
Assembling the right combination of resources and management strategies is an important part of farming. The tables below show important farm business characteristics, the number of farms reporting these characteristics, and the average level of resources used in production.
MANAGEMENT SYSTEMS, PRODUCTION TECHNOLOGY AND FARM SIZE 40 Oneida-Mohawk Region Dairy Farms, 1984
Type of Business Number Business Records Number Dairy Records Number Proprietorship 31 CAMIS 3 D.H.I.C. 32 Partnership 8 Account Book 13 Owner Sampler 4 Corporation 1 Agrifax 12 None 4
Agway 1 Owner 36 On-Farm Computer o Renter 4 Other 11
Barn Type Number Milking System Number Number Stanchion 29 Bucket & Carry o Herringbone 7 Freestall 7 Dumping Station 7 Other Parlor 1 Other 4 Pipeline 25
_L_a_b_o_r__ M~y~F_a_r_m A_v_e~r_a~gL-e _L_a_n~d~U~s~e___________M~y~F_a~r~m~_A_v~e~r~a~g~e~F~o_r_c_e________ __ Operator 1. mo. 11 Total acres owned 277
2. mo. 4 Total acres rented 88--.........:3. mo. 1 Tillable acres owned 164
--~ ---- Family paid mo. 3 Tillable acres rented 67 Family unpaid mo. 3 Hired mo. 7 Number of Cows My Farm Average
---.........:mo. 29Total Beginning of year (owned) 67
Age of operator(s) 1. yrs. 46 End of year (owned) 68 2. ---" yrs. 33 Avg. for year (all) 68
Capital Investment-Farm Inventory represents the market value of resources committed to the farm business at the beginning and end of the year. Increases in inventory occur with herd expansion, new machinery, building additions and appreciation of assets.
CAPITAL INVESTMENT - FARM INVENTORY 40 Oneida-Mohawk Region Dairy Farms, 1984
Item My Farm
1/1/84 1/1/85 Average
1/1/84 1/1/85
Livestock Feed & supplies Machinery & equipment Land & buildings
$ 90,970 29,558 82,021
180,212
$ 90,736 31,698 83,157
187,349
TOTAL $ $ $382,761 $392,940

----
3
Inventory Accounting
The value of the dairy herd is influenced by market prices, herd quali ty and quantity. Changes in market value caused by inflationary or deflationary price changes, are separated from changes in inventory caused by changes in herd quality and quantity.
CHANGE IN LIVESTOCK INVENTORY 40 Oneida-Mohawk Region Dairy Farms, 1984
Item My Farm Average
End of year market value $ $90,736 less end at beginning prices -93,631
Change due to price $ $-2,895 End inventory at beginning prices $ $93,631 less beginning of year inventory
Change due to quality & quantity $
-90,970
$ 2,661
Changes in machinery and real estate inventories that are not accounted for by purchases, sales or depreciation reflect price changes and result in a change in the value of assets called appreciation.
MACHINERY AND EQUIPMENT INVENTORY 40 Oneida-Mohawk Region Dairy Farms, 1984
Item My Farm Average
End of year market value Beginning market value Plus machinery purchased Less machinery sold Less depreciation
Net end investment APPRECIATION (1 minus 2)
(1)$___
$_-+
(2)$___
$_-
$83,157 $82,021 +11,268
700 -12,009
$80,580 $ 2,577
The change in real estate value is affected by market forces, building depreciation, and lost capital which is the portion of a new building investment that is not reflected in the value of the farm.
REAL ESTATE INVENTORY CALCULATIONS 40 Oneida-Mohawk Region Dairy Farms, 1984
Item My Farm Average
End of year market value Beginning market value Cost of new real estate Less lost capital Value of new added Less building depreciation Less real estate sold
Net end investment APPRECIATION (1 minus 2)
(1)$___
$_-$_-
+---
(2)$___
$_-
$187,349 $180,212
$12,181 - 1,398
+ 10,783 4,848 2,300
$183,847 $ 3,502

4
Receipts
Receipts from the business should be large enough to cover all expenses and leave a reasonable return for the operator's labor and management. Cash receipts result when farm products and livestock are sold or services are performed and payment is received during the year. Noncash receipts do not result from sales, but are due to appreciation in value or increases in physical quantities of inventories that occurred during the year. Most of these items could be readily transformed into cash.
FARM RECEIPTS 40 Oneida-Mohawk Region Dairy Farms, 1984
Item My Farm Per Farm Per Cow
CASH RECEIPTS Milk sales $ $136,937 $2,014 Crop sales 2,683 39 Dairy cattle sold 8,207 121 Calves & other livestock sales 2,022 30 Gas tax refunds 55 1 Government payments 2,451 36 Custom machine work 53 1 Other 1,422 21
Total Cash Receipts $ $153,830 $2,263
NONCASH RECEIPTS Increase in livestock inventory1 2,661 39 Increase in feed & supplies 2,140 31
TOTAL FARM RECEIPTS EXCLUDING APPRECIATION $ $158,631 $2,333
Livestock appreciation 2 2,895 43 Machinery appreciation3 2,577 38
Real estate appreciation3 3,502 52
TOTAL FARM RECEIPTS $ $161,815 $2,380
1The increase in herd market value attributed to a change in numbers and/or a definite change in herd quality.
2The increase in herd market value, caused by inflationary price increase. 3Defined on page 3.
Income Analysis provides a means of examining the annual receipt producing capability of the farm business.
INCOME ANALYSIS Oneida-Mohawk Region Dairy Farms, 1984 & 1983
40 Farms 42 Farms Item My Farm 1984 1983
Average price/cwt. milk sold $13.52 $13.47$_--Milk and cattle sales per cow $2,164 $2,149 Total cash receipts/worker $63,566 $59,187

5
Expenses
All farm expenses, cash operating and overhead, are summarized below.
FARM EXPENSES 40 Oneida-Mohawk Region Dairy Farms, 1984
Item My Farm Per Farm Per Cow
Hired Labor
Feed Dairy concentrate Hay and other
Machinery Machine hire, rent and lease Machinery repairs Auto expense (farm share) Gas and oil
Livestock Replacement livestock Breeding fees Veterinary and medicine Milk marketing Cattle lease Other livestock expense
Crops Fertilizer & lime Seeds and plants Spray, other crop expense
Real Estate Land, building, fence repair Taxes Insurance Rent and lease
Other Telephone (farm share) Electricity (farm share) Interest paid Miscellaneous
Total Cash Expenses
Expansion livestock Machinery depreciation Building depreciation Unpaid family labor @ $500/month
TOTAL FARM EXPENSES EXCLUDING INTEREST ON EQUITY CAPITAL
Interest on equity capital @ 5%
TOTAL FARM EXPENSES
$_---
$----
$----
$----
$ 10,103
31,903 1,366
1,797 6,431
447 4,686
604 2,094 2,779
10,938 30
5,585
6,682 2,255 1,467
2,305 3,565 2,423 3,832
581 3,365
16,571 1,717
$123,706
411 12,009 4,848 1,738
$142,712
12,453
$155,165
$ 149
469 20
26 95
7 69
9 31 41
161 o
82
98 33 22
34 52 36 56
9 49
246 25
$1,819
6 177
71 26
$2,099
$2,282
183

6
Farm Business Profitability
The results of management are reflected in the net return from the business. Four COmmon ways to measure the returns from a farm business are calculated.
Net cash farm income reflects the cash available from the year's operation of the business. A family may have additional cash available if they have nonfarm income. Family living has first claim on cash income followed by fixed payments on debts. Cash flow is not a good measure of farm business profits, but it is useful when planning debt repayment programs. The level of cash generated by the business in one year may not be a good indicator of cash available for future years. This is particularly true when significant changes in accounts receivable and payable balances occur during the year. For example, a business can increase the net cash farm income for one year by allowing the outstanding feed bill to rise. Guidelines for annual cash flow planning are presented on page 9.
NET CASH FARM INCOME Oneida-Mohawk Region Dairy Farms, 1984 & 1983
40 Farms 42 Farms Item My Farm 1984 1983
Cash Farm Receipts $ $153,830 $133,171
Cash Farm Expenses 123,706 101,170
NET CASH FARM INCOME $ $ 30,124 $ 32,001
Labor and management income is the return to the operator for his or her labor and management input into the business. A five percent charge for the use of the operator's equity capital in the business has been included as a farm expense. This interest charge reflects the long term average rate of return that a farmer might expect to earn in investments with comparable risk to farm businesses in an economy with little or no inflation. Labor and management income is the measure used most commonly when comparing farm businesses. Appreciation in livestock, machinery and real estate inventories is included as ownership income, not return to operator labor and management.
LABOR AND MANAGEMENT INCOME Oneida-Mohawk Region Dairy Farms, 1984 & 1983
Item My Farm 40 Farms
1984
Total farm receipts excluding appreciation
Total farm expenses $_--- $158,631
155,165
LABOR & MANAGEMENT INCOME
Full-time operator-manager equivalents
$_-- $ 3,466
1.38
LABOR & MANAGEMENT OPERATOR-MANAGER
INCOME PER $ $ 2,512
42 Farms 1983
$139,553
127,321
$ 12,232
1.31
$ 9,337
7
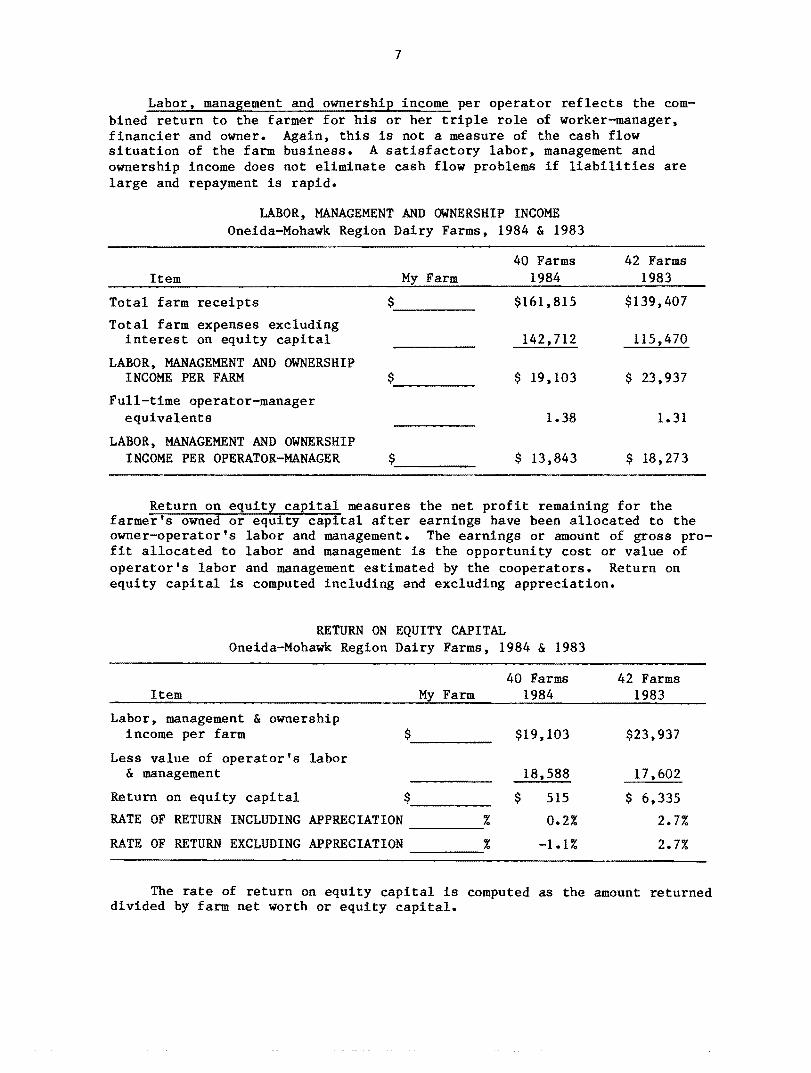
Labor. management and ownership income per operator reflects the combined return to the farmer for his or her triple role of worker-manager. financier and owner. Again. this is not a measure of the cash flow situation of the farm business. A satisfactory labor, management and ownership income does not eliminate cash flow problems if liabilities are large and repayment is rapid.
LABOR, MANAGEMENT AND OWNERSHIP INCOME Oneida-Mohawk Region Dairy Farms, 1984 & 1983
40 Farms 42 Farms Item My Farm 1984 1983
Total farm receipts $_-- $161,815 $139,407
Total farm expenses excluding interest on equity capital 142,712 115,470
LABOR, MANAGEMENT AND OWNERSHIP INCOME PER FARM $---- $ 19,103 $ 23,937
Full-time operator-manager equivalents 1.38 1.31
LABOR, MANAGEMENT AND OWNERSHIP INCOME PER OPERATOR-MANAGER $ $ 13,843 $ 18,273
Return on equity capital measures the net profit remaining for the farmer's owned or equity capital after earnings have been allocated to the owner-operator's labor and management. The earnings or amount of gross profit allocated to labor and management is the opportunity cost or value of operator's labor and management estimated by the cooperators. Return on equity capital is computed including and excluding appreciation.
RETURN ON EQUITY CAPITAL Oneida-Mohawk Region Dairy Farms, 1984 & 1983
40 Farms 42 Farms Item My Farm 1984 1983
Labor, management & ownership income per farm $ $19,103
Less value of operator's labor & management 18,588
Return on equity capital
RATE OF RETURN INCLUDING APPRECIATION
$
%
$ 515
0.2%
RATE OF RETURN EXCLUDING APPRECIATION % -1.1%
$23,937
17,602
$ 6,335
2.7%
2.7%
The rate of return on equity capital is computed as the amount returned divided by farm net worth or equity capital.

8
Farm Family Financial Situation
The financial situation is an important part of the farm business summary. It has a direct affect on current cash outflow and future capital investment decisions. Financial lease obligations are included in the balance sheet. The present value of all future payments is listed as a liabil ity since the farmer is committed to make the payments. The present values are also listed as assets, representing the future value the item has to the business.
FARM FAMILY NET WORTH 40 Oneida-Mohawk Region Dairy Farms, January 1, 1985
Item My Farm Average
Assets
Livestock Feed and supplies Machinery and equipment
(includes discounted lease payments)* Land and buildings
(includes discounted lease payments)* Co-op investments Accounts receivable Cash and checking accounts
Total Farm Assets
Savings accounts Cash value life insurance Stocks and bonds Nonfarm real estate Auto (personal share) All Other
TOTAL FARM & NONFARM ASSETS
Liabilities
Long term Intermediate Financial lease* Short term Other farm accounts
Total Farm Liabilities
Nonfarm Liabilities
$
$
(1,915)
(2,562)
$ 90,736 31,698 85,072
189,911
5,703 14,357 2,448
$419,925
$ 4,600 1,113
281 2,913 1,359 7,464
$437,655
$ 88,048 71,732 4,477 2,687 3,918
$170,862
300
TOTAL LIABILITIES
FARM NET WORTH (EQUITY CAPITAL)
FAMILY NET WORTH
$171,162
$249,063
$266,493
*Future payments were discounted at an annual rate of 13 percent.

----
9
Payment ability is the most important consideration in determining if and how proposed investments should be financed. The farm business must produce sufficient cash income to meet operating expenses, to cover family living expenses and to make payments on debts. Interest paid and income from off-farm work are added to net cash farm income because planned debt payments will include interest as well as principal. Estimate your family living expenses to calculate cash available for debt payments and capital purchases made in cash.
A cash flow coverage ratio of less than one indicates that planned cash outflows for 1985 exceed cash availability determined from 1984 records.
FARM FAMILY DEBT REPAYMENT 40 Oneida-Mohawk Region Dairy Farms, January 1, 1985
Item My Farm Average
Payment Ability Net cash farm income
Plus interest paid
Plus off-farm income
CASH AVAILABLE FOR DEBT SERVICE AND LIVING
1Less family living expenses CASH AVAILABLE FOR DEBT PAYMENTS
AND CAPITAL PURCHASES Scheduled Annual Debt Payments
Long term
Intermediate
Short term
Other farm accounts
TOTAL FARM DEBT PAYMENTS
Nonfarm debt payments
TOTAL PAYMENTS PLANNED 1985
Commitment and Measures of Debt Equity Pos! tion
Cash flow coverage ratio2
Farm debt payments planned per cow
Farm debt payments as % milk sales
Farm debt/asset ratio-long term
Farm debt/asset ratio-intermediate and short term
Farm debt per cow Percent equity (total)
$_--
$_--
$_--
$_--
$_--
$_--
$_--
--_-.-:%
$_--%
$30,124
16,751
1,335
$48,210
21,195
$27,015
$11,190
22,057
1,839
982
$36,068
41
$36,109
0.75 $523
26%
0.46
0.34
$2,476
61%
1Estimated as $10,900 per family plus four percent of cash farm receipts.
Cash available for debt payments and capital purchases divided by total payments planned.
2

10
ANALYSIS OF THE FARM BUSINESS
When analyzing a farm business, a manager must consider measures or factors that reflect the performance of specified parts of the farm business. To do this one must look at factors of size, rates of production, labor efficiency, capital efficiency and cost control. factors are detailed on the following pages.
These measures and
Size of Business
Studies have shown that, in general, larger farms are more profitable than smaller farms. Larger businesses make possible more efficient use of overhead inputs such as labor and machinery and there are more units of production on which to earn a profit. Profitable farm businesses with good management have the ability and incentive to become larger. Large farms are not necessarily more profitable however, and size increases are only profit able with good management.
MEASURES OF SIZE OF BUSINESS Oneida-Mohawk Region Dairy Farms, 1984 & 1983
Item
Number of cows
My Farm 40 Farms
1984
68
42 Farms 1983
60
Number of heifers 57 46
Pounds of milk sold
Worker equivalent
1,013,200
2.42
902,600
2.25
Total work units 764 654
Total tillable acres 231 195
In the table below, the 510 New York farms for 1983 are sorted by number of cows and the labor and management income is shown for each size group. In general, the large farms paid better, but, variability of income was significant.
FARM SIZE AND FARM INCOME MEASURES 510 New York Dairy Farms, 1983
Number Number Worker Net Cash Labor, Management & Owner-of Cows of Farms Equivalent Farm Income ship Income Per Operator
Under 40 51 1.67 $12,955 $ 2,541 40 to 54 103 2.08 19,443 6,279 55 to 69 95 2.42 32,659 14,886 70 to 84 79 2.83 33,688 11,517 85 to 99 54 3.08 43,739 19,509
100 to 149 64 3.75 50,521 21,210 150 to 199 38 4.58 62,048 7,458 200 to 249 13 6.00 100,374 43,033 250 & over 13 8.42 180,903 99,327

11
Rates of Production
Crop yields and rates of animal production are factors that have a significant impact on farm incomes. As shown in the table at the bottom of the page, production per cow is strongly related to net income. The yields and rates of production on a farm are a direct result of the quality of management.
CROP YIELDS & MILK SOLD PER COW 40 Oneida-Mohawk Region Dairy Farms, 1984
My Farm Avera e of Farms Crop Acres Yield Farms Acres
Dry hay
Hay crop silage
Total hay crops
Corn silage
Other forage
Total forage crops
Grain corn
Oats
Wheat
Other crops
Tillable pasture
Idle tillable land
Milk sold per cow
38 (combined below)
30 (combined below)
39 141 2.5 tons D.M.
35 49 13.2 tons
6 11 1.9 tons D.M.
40 182 3.0 tons D.M.
20 57 88.0 bushels
8 27 58.0 bushels
1 5 36.0 bushels
3 26
13 30
11 14
14,900 pounds
Tons of dry matter per acre from all hay and silage is a good measure of the overall rate of forage production.
MILK SOLD PER COW AND LABOR AND MANAGEMENT INCOME 510 New York Dairy Farms, 1983
Pounds of Milk Number Number Labor & Mgmt. Labor, Mgmt., & Owner-Sold Per Cow of Farms of Cows Income/OEer. ship Income/Operator
Under 11,000 26 58 $-4,275 $ -903 11,000 to 11,999 35 62 -1,323 370 12,000 to 12,999 44 71 -3,493 5,074 13,000 to 13,999 56 79 -1,391 5,411 14,000 to 14,999 85 87 4,607 13,504 15,000 to 15,999 95 101 2,804 11,607 16,000 to 16,999 80 101 13,797 28,297 17,000 to 17,999 49 96 12,335 31,231 18,000 & over 40 101 18,716 36,819

12
Labor Efficiency
Labor input is an important factor in farm production. Several measures of accomplishment per worker (labor efficiency) are shown below.
MEASURES OF LABOR EFFICIENCY Oneida-Mohawk Region Dairy Farms, 1984 & 1983
40 Farms 42 Farms Item My Farm 1984 1983
Worker equivalent 2.42 2.25
Cows per worker 28 27
Lbs. milk sold per worker 419,000 401,000
Work units per worker 316 291
Number of cows per worker is calculated by dividing the average number of cows by the worker equivalent which represents the total farm labor force. Pounds of milk sold per worker is an important measure of labor efficiency on the dairy farm. It measures the ability of the labor force to handle a large number of cows without sacrificing milk output per cow.
It is important to look at other measures of labor efficiency, such as work units per worker because all dairy farms do not have the same relationship between cows, heifers, and crops grown.
Labor efficiency depends on a number of things. Among these are the amount of mechanization, the field and building layout, the work methods, and the abilities of the workers. All of these are management items under the control of the operator.
Another factor which may influence the productivity of labor is the wage paid to employees. A productive employee will require a reasonable and competitive wage.
MILK SOLD PER WORKER AND LABOR AND MANAGEMENT INCOME 510 New York Dairy Farms, 1983
Number Number Pounds Labor &Mgmt. Labor, Mgmt., & Pounds of Milk of of Milk Income Ownership Income
Sold Per Worker Farms Cows Per Cow Per Operator Per Operator
Under 250,000 46 44 11,386 $-2,734 $ 926 250,000 to 299,999 38 48 13,298 -1,281 4,804 300,000 to 349,999 56 64 14,128 860 5,896 350,000 to 399,999 70 75 14,793 993 9,853 400,000 to 449,000 95 77 15,319 6,463 17,787 450,000 to 499,999 68 89 15,293 3,590 13,037 500,000 to 599,999 600,000 & over
81 56
104 187
15,710 16,473
5,968 26,312
19,317 48,943

13
Capital Efficiency
Capital is a key resource in dairy farm businesses and a manager must continually analyze its use in the business. The measures of capital efficiency shown in the following table include owned as well as borrowed capital. It is possible for the business to be undercapitalized, but investing too much capital per productive unit is a more common problem.
MEASURES OF CAPITAL EFFICIENCY Oneida-Mohawk Region Dairy Farms, 1984 & 1983
40 Farms 42 Farms Item My Farm 1984 1983
Farm capital per worker $_-- $162,000 $158,000
Farm capital per cow $_-- 5,695 5,740
Machinery investment per cow $_-- 1,205 1,233
Machinery per tillable acre $_-- 360 392
Land & buildings per cow $_-- 2,715 2,879
Land & buildings/tillable acre owned $_-- 1,024 1,088
Capital turnover (years) 2.4 2.6
Land and building investment per crop acre owned shows the relationship between investments in land and buildings. The farmer who owns little cropland but builds many farm buildings will have a relatively large land and building investment per crop acre owned. This could be an indication that capital use is out of balance.
Capital turnover is calculated by dividing the total farm capital (total year-end farm inventory) by the total farm receipts for the year. The factor is called capital turnover because it measures the number of years of receipts needed to equal or "turnover" farm capital. A fast rate of turnover is more desirable than a slow rate because it means capital purchases can be paid off at a faster rate. This figure also depends upon the enterprise selection of the business.
CAPITAL TURNOVER AND LABOR AND MANAGEMENT INCOME 510 New York Dairy Farms, 1983
Number Number Labor & Mgmt. Capital Turnover of of Capital Investment Income Per
Rate - Years Farms Cows Per Cow Per Worker Operator
less than 1.5 1.5 to 1.99
14 92
126 121
$3,178 4,493
$105,385 153,029
$ 34,525 15,742
2.0 to 2.49 168 97 5,246 163,826 5,682 2.5 to 2.99 113 74 6,239 170,148 3,794 3.0 to 3.49 66 63 6,364 168,003 -2,369 3.5 & over 57 60 7,601 206,061 -8,415

----------
14
Cost Control
The control of costs is a big factor in the success of modern commercial dairy operations. Feed, machinery and labor costs are major items and should be examined in detail. It is important to check all cost items both large and small. Expenses should be incurred only when the returns from the expense are expected to be greater than the cost incurred.
Feed Costs
Purchased feed is the largest single expenditure on most dairy farms. Two considerations are important in keeping the feed bill down: (1) Be careful that only nutrients required by the cow are being fed. A dairy farmer cannot afford to buy a feed mix that overfeeds energy or protein. (2) Be certain that the required nutrients are being obtained from their least expensive source. For example, is the lowest cost source of protein, urea, soybean meal or a commercial protein? Help in answering these questions can come from budgeting, from agribusiness people selling feeds, and from dairy and management extension agents. Extension is supporting computerized decision aids to assist in answering these questions including the NEWPLAN program, Least-Cost Balanced Dairy Rations, and the dairy ration analyzers.
The size and productivity of the cropping program has an important influence on the amount of the purchased feed bill. Increased production of either roughages or grains should reduce the purchased feed expense unless cow numbers are increased. Also, heifer raising practices affect feed costs. The overall feed situation must be examined and evaluated as a "system".
FEED COSTS AND RELATED MEASURES Oneida-Mohawk Region Dairy Farms, 1984 & 1983
40 Farms 42 Farms Item My Farm 1984 1983
Dairy concentrate purchased per cow $469 $501
Dairy concentrate purchased per cwt. of milk sold $ $3.15 $3.33
Percent dairy concentrate is of milk receipts % 23% 25%
Crop expense per cow $153 $117
Feed & crop expense/cwt. milk $4.31 $4.18
Forage dry matter harv./cow (tons) 7.9 7.2
Acres of forage per cow 2.7 2.5
Total tillable acres per cow 3.4 3.3
Fertilizer and lime/tillable acre $29 $22
Heifers as % of cow numbers 84% 77%--------~%

15
Machinery, Labor and Miscellaneous Costs
Labor and machinery operate as a team on a dairy farm. The challenge is to obtain an efficient combination of these two inputs that will result in a low cost per unit of output.
MACHINERY AND LABOR COSTS Oneida-Mohawk Region Dairy Farms, 1984 & 1983
40 Farms 42 Farms Item My Farm 1984 1983
Machinery: Depreciationl $_-- $12,009 $ 8,567
Interest2 4,130 3,768
Operating expense3 13,361 11,550
Total machinery $_-- $29,500 $23,975
Per cow $434 $400
Labor: 4Value of operators $_-- $11,963 $11,607
Unpaid family5 1,738 1,488
Hired 10,103 7,131
Total labor $_-- $23,804 $20,226
Per cow $350 $337 Per cwt. milk $2.35 $2.24
Labor & machinery costs per cow $784 $737
Labor & machinery costs/cwt. milk $ $5.26 $4.90
lRegular depreciation from last year's tax plus 10 percent of new purchases.
2Five percent of average machinery investment.
3Machine hire, repairs, farm share auto expense, and gas and oil.
4$750 per month.
5$500 per month.
MISCELLANEOUS COST CONTROL MEASURES Oneida-Mohawk Region Dairy Farms, 1984 & 1983
40 Farms 42 Farms Item My Farm 1984 1983
Livestock expense per cow $ $315 $265
Real estate expense per cow $ $178 $160
Total farm expense per cow $ $2,282 $2,122
Livestock expense per cow includes breeding fees, veterinary and medicine, milk marketing, dairy supplies, bedding and DHIC fees. Real estate expenses include repairs, taxes, insurance and rent.

16
YEARLY CASH FLOW PLANNING & ANALYSIS
This worksheet is a valuable tool in financial planning, expansions and for setting goals for improving the farm business.
40 Oneida-Mohawk Region Farms My Farm, Cows
Item Avg. Per Cow Per Cow Total Goal
CASH RECEIPTS Milk sales Crop sales Dairy cattle Calves & other livestock Other
Total Cash Receipts
CASH EXPENSES Hired labor Dairy concentrate Hay and other Maclline hire Machine repair & auto expense Gas & oil Replacement livestock Breeding fees Vet & medicine Milk marketing (ADA, Dues) Other livestock expo Fertilizer & lime Seeds & plants Spray & other Land, bldg. fence repair Taxes Insurance Rent Telephone & elec. (farm share) Miscellaneous
1Total Cash Expenses
Total Cash Receipts
Total Cash Expenses 1
Net Cash Flow
Cash Family Living Expense2
Amount Left for Debt Service, Capital Investment & Retained Earnings
Scheduled Farm Debt Service Available for Capital Investment
Planned Expansion Livestock Purch. Planned Equipment Purchase
Borrowed or Equity Funds Needed
$2,014 39
121 30 59
$2,263
$ 149 469
20 26
102 69
9 31 41
161 82 98 33 22 34 52 36 56 58 25
$1,573
$2,263
-1,573
$ 690
312
$ 378 523
$ -145
$_-- $_-- $_-
$_-_$_-- $,--
$,--- $,--- $_-
$_-- $_-_$,--
$_-- $_-_$_-
$_-- $_-- $_-
$_-- $_-- $_-
$ $
1 Interest paid excluded for it is contained in Scheduled Debt Service.
2 Estimated: $10,900 per family plus four percent of cash farm receipts.

17
PROGRESS OF THE FARM BUSINESS
ness Comparing checkup.
your business with that of It is equally important to
other farmers compare your
is one part of a busicurrent year's business
with that of earlier years to show the progress you are making, and to plan ahead, by setting business targets or goals. Data from 25 identical Oneida-Mohawk dairy farms is included to provide a basis for comparison.
Average of 25 Oneida-Mohawk Farms* My Farm
Item 1983 1984 1983 1984 Goal
Size of Business
Number of cows 57 59
Number of heifers 44 47
Milk sold (cwt.) 8,751 9,002
Worker equivalent 2.33 2.42
Total tillable acres 187 189
Rates of Production
Pounds milk sold per cow 15,353 15,258
Tons hay D.M. per acre 2.5 2.4
Tons corn silage per acre 12.8 13.6
Labor Efficiency
Cows per worker 24 24
Pounds milk sold/worker 376,000 372,000
Cost Control
Purch. feed as % milk sold 26% 25% % % %
Feed & crop exp./cwt. milk $4.26 $4.29 $ $ $
Labor & mach. cost/cwt. milk $4.84 $5.06 $ $ $
Capital Efficiencl
Farm capital per cow $5,685 $5,765 $ $ $
Capital turnover (years) 2.5 2.5
Price
Price per cwt. milk $13.43 $13.28 $ $ $
Financial Summary
Net cash farm income $29,538 $32,081 $ $ $
Labor & mgmt. income/oper. $8,514 $3,891 $ $ $
Farm net worth $240,350 $246,607 $ $ $ Rate of return on equity 1.0% 0.4% % % %
Percent equity 69% 69% % % %
Farm debt per cow $1,951 $1,997 $ $ $
*Average of the same 25 farms for 1983 and 1984.