Embed Size (px)
Citation preview

WP 2012-10
May 2012
Working Paper
Charles H. Dyson School of Applied Economics and Management
Cornell University, Ithaca, New York 14853-7801 USA
Consumer valuation of environmentally
friendly production practices in wines
considering asymmetric information
and sensory effects T.M. Schmit, B. Rickard, and J. Taber

It is the Policy of Cornell University actively to support equality of
educational and employment opportunity. No person shall be denied
admission to any educational program or activity or be denied
employment on the basis of any legally prohibited discrimination
involving, but not limited to, such factors as race, color, creed, religion,
national or ethnic origin, sex, age or handicap. The University is
committed to the maintenance of affirmative action programs which will
assure the continuation of such equality of opportunity.

Consumer valuation of environmentally friendly production practices in wines considering
asymmetric information and sensory effects
T.M. Schmit, B. Rickard, and J. Taber*
Abstract
Agricultural producers and food marketers are increasingly responding to environmentally
friendly cues from consumers even though privately appropriated values associated with a range
of food products commonly rank above their public-good counterparts. Wine can be considered
an ideal product to examine these issues given consumers’ highly subjective sensory preferences
towards wine, and a winegrape production process that is relatively intensive in chemical inputs
for the control of disease and infection. Semi-dry Riesling wines made from field research trials
following environmentally friendly canopy management practices were utilized in a lab
experiment to better understand preferences for environmental attributes in wines. A combined
sensory and monetary evaluation framework explicitly considered asymmetric order effects.
Empirical results revealed that sensory effects dominate extrinsic environmental attributes. Once
consumer willingness-to-pay (WTP) was conditioned on a wine’s sensory attributes, the addition
of environmentally friendly information did not affect their WTP; however, adding sensory
information significantly influenced WTP initially based only on environmental attributes. The
results confirm that promoting environmentally friendly winegrape production practices would
increase demand and lead to higher premiums for the products, but are only sustainable if
consumers’ sensory expectations are met on quality.
Key words: environmentally friendly, lab experiment, sensory, wine, willingness to pay
JEL classifications: C9, C24, M31, Q13
* Ruth and William Morgan Assistant Professor in Applied Economics and Management, Assistant Professor, and
Graduate Research Assistant, respectively, in the Charles H. Dyson School of Applied Economics and Management,
Cornell University, Ithaca, New York, USA. The authors would like to thank Justine Vanden Heuvel, Anna
Katharine Mansfield, Gavin Sacks, Wayne Wilcox, and Tim Martinson for their leadership in their assistance in
developing the winegrape production and winemaking information for the laboratory experiments. This material is
based upon work supported by USDA Cooperative State Research, Education and Extension Service funds through
the Northeast Sustainable Agriculture Research and Education grant program (NYC-123266), and the Institute for
Social Sciences 2010 Small Grant Competition at Cornell University. Although the research described in the article
has been funded in part by USDA funds, it has not been subjected to USDA review and therefore does not
necessarily reflect the views of the Agency, and no official endorsement should be inferred.

1
Consumer valuation of environmentally friendly production practices in wines considering
asymmetric information and sensory effects
1. Introduction
Food producers are responding to consumer perceptions of environmental sustainability and their
growing awareness of the use of agricultural chemicals by creating new marketing opportunities
for products grown with environmentally sound practices (Loureiro et al., 2002). The wine
industry is no exception, where consumer demands are encouraging the investigation and
adoption of alternative practices that can reduce the reliance on chemicals and promote more
environmentally friendly products (Loureiro, 2003; Bazoche et al., 2008). Still, most studies
have shown that privately appropriated values rank above public-good values for a range of food
products (Lusk and Briggerman, 2009; Constanigro et al., 2011).
Private values, such as for intrinsic sensory attributes, have been shown to importantly affect
consumers’ perception of a product (e.g., Melton et al., 1996; Cardebat and Fiquet, 2004; Yang
et al., 2009; Combris et al., 2009; Gustafson et al., 2011). However, some studies that combine
objective and subjective cues do not find sensory characteristics to be significant (e.g., Combris
et al., 1997; Lecocq and Visser, 2006), and that differential results may depend on the order
information is received by consumers. Brennan and Kuri (2002) find that preferences for organic
products are unlikely to change once first developed based on their sensory characteristics. In
contrast, for wines, Lecocq et al. (2005) find that after tasting, information about the wines’
characteristics and opinions from experts substantially affected consumers’ willingness to pay
(WTP), but that the reverse was not true; i.e., after receiving the same wine information initially,
the taste of the wines did not have any additional impact on WTP.
Both sensory and economic factors matter to consumers and both are important for the
development of informed food marketing strategies (Combris et al., 2009; Durham, 2010). We
consider these inter-related factors by combining sensory and monetary valuations in the context
of environmentally friendly wines. We use experimental auctions to elicit WTP bids from
participants and explicitly estimate consumer premiums based on sensory (i.e., taste, smell, etc.)
and objective (i.e., environmentally friendly production practices) characteristics. The data
collected provide us with a unique opportunity to study the role and timing of sensory (an
experience good attribute) and objective (a credence good attribute) information for wines that
should contribute to a better understanding of beneficial marketing strategies.
Our experimental framework builds upon wine studies developed by Bazoche et al. (2008) and
Gustafson et al. (2011) that consider multiple rounds of bidding with differences in information
presented across rounds.1 Bazoche et al. (2008) consider whether there is a consumer premium
for environmentally friendly wines among French wine consumers and how the source of
delivery of that information affects consumer values. Average WTP increased following blind
sensory evaluation when label information on the wines’ environmental characteristics was
introduced, but the value depended on who conveyed that information (e.g., a public authority or
1 Lecocq et al. (2005) estimate differential effects of taste and information by contrasting the distributions of bids
across subjects assigned to different treatment groups based on the information received; i.e., product information
only, tasting only, and product information and tasting. In all treatment groups, only one round of bidding was used
following the exposure to information.

2
a collaborating retailer). Gustafson et al. (2011) incorporate objective and sensory valuations in a
multiple (nine) round experimental setting and show that introduction of a wine’s intrinsic
sensory characteristics influences the valuation of a wine’s previously known objective
characteristics. In both studies, the order of the types of information received remained the same
across experimental sessions. We contribute to the literature by explicitly considering
asymmetric order effects of objective and subjective information.
This paper also contributes to the growing literature on consumer valuation of attributes for
reducing environmental damages that focus on eco-labeling or eco-marketing strategies (e.g.,
Teisl et al., 1999; Blend and Van Ravenswaay, 1999; Wessells et al., 1999; Loureiro et al., 2001;
Loureiro et al., 2002; Huffman et al., 2003; Costanigro et al., 2012). Eco-labels can provide
easily interpretable information and elicit increased demand among some consumers for the
products based on their perceived environmental benefits (Delmas and Grant, 2010). An
increasing trend towards the use of eco-labels suggests that consumers can be induced to
differentiate between products purely based on their production processes, even if they do not
ultimately lead to any discernible physical differences between the final products (Foster and
Mourato, 2000). However, the order and type of information received can result in asymmetric
effects on environmental attribute valuations (Costanigro et al., 2012).
Generally, studies find that eco-labels increase consumers’ WTP, but vary across types of
products, consumer characteristics, and forms of marketing practices (McCluskey et al., 2009).
For wine, Barber, et al. (2009) show that the level of a consumers’ environmental knowledge
influences their willingness to purchase more environmentally friendly products, while Molla-
Bauza et al. (2005) find consumers with more healthy life styles will pay higher prices for
organic products. In a survey of consumers in Colorado, Loureiro (2003) estimated that relative
to regular Colorado wines, environmentally friendly wines receive a small premium, between 4
and 17 cents per bottle. Delmas and Grant (2010) find that eco-labeling has a negative impact on
prices for organic California wines, although there is a price premium associated with eco-
certification. Their findings support industry sentiment that consumers stigmatize (labeled)
organic wine as an inferior product, and that eco-certification confers benefits more broadly
(e.g., reputation effects and associations for the wineries themselves) that are not directly
associated in the consumers’ decision with specific environmental practices.
Finally, we contribute to the literature by considering these effects for new wines that are not
currently commercially available. Predicting consumer demand for new food products is
arguably incomplete without incorporating both sensory and monetary valuations (Melton, et al.,
1996; Feldkamp, et al., 2005). While existing commercial wines may be more familiar to or
accepted by consumers, examining new wine products provides necessary information to
winegrape growers and vintners considering the adoption of alternative production practices and
development of related product marketing strategies. This is particularly salient when the new
products have characteristics that are multi-dimensional in nature; i.e., with inherent sensory
quality (private) and environmental (public) characteristics.
As part of a larger project, we utilize wines made from actual vineyard production trials in New
York State following alternative canopy management (CM) production treatments. The wet, cool
climate growing conditions in New York make winegrapes particularly susceptible to the

3
development of fungal diseases if not properly managed. Dense and shaded canopies often
require multiple applications of fungicides throughout the growing season to inhibit infection. As
a result, the field research is examining alternative CM practices to develop more open canopies
that improve air circulation and sun light exposure, and reduce fungal pressures and fungicide
use. The CM practices are considered more environmentally friendly relative to standard
industry practices and are expected to increase wine quality. Through the experimental design,
we are able to assess both the quality and environmental dimensions for these potentially new
wine products.
Our focus in this paper is on three principal research questions. First, we examine how perceived
differences in a wine’s sensory attributes affect consumer preferences for Riesling wines. This
more standard sensory exercise is useful in designing further field trials and in developing
marketing promotions for consumers that appeal to particular attribute qualities. Second, we
examine what WTP premia exist for new wines considering both quality (intrinsic sensory
attributes) and production (extrinsic environmental attributes) information. Our baseline analysis
provides marginal WTP estimates that do not distinguish between valuations of the wines’
objective and subjective attributes, but rather provide pooled (or average) WTP estimates of the
different production practices. Finally, we examine explicitly how the order and type of
information received influences WTP premia by estimating a nested model with group and round
interaction effects. The experimental design explicitly accounts for order effects by assigning
subjects to two different types of experimental sessions where the order of information received
varies. Given a two round bidding procedure with the varying order treatments, we exploit the
panel nature of the data and identify individual premium components, and how the addition of
new information affects initial WTP values.
We continue with a brief discussion of the study design and auction mechanism used. This is
followed by a review of the data collected and the empirical modeling approach. A discussion of
the sensory valuation results is then presented before describing the WTP model results. We
close with some summary conclusions and directions for future research.
2. Study Design
In this section, we briefly describe the vineyard field trials where the winegrapes were grown and
managed, as well as the experimental auction and sensory framework.
2.1 Field Treatments
While there is no universal definition for ‘environmentally friendly’ wine, we delineate wines
based on the underlying grape production practices followed. Specifically, we utilize four semi-
dry Riesling wines made from actual vineyard trials that followed alternative CM protocols
during the 2009 growing season. The four field treatments and, consequently, the four wines
used in the experiment are described as:
1. Control, no canopy management (CON): recommended industry practices for premium
quality grape and wine production are followed;
2. Level 1 canopy management - shoot thinning (ST): recommended industry practices for
premium quality grape and wine production are followed, along with shoot thinning early
in the growing season to five shoots per canopy foot;

4
3. Level II canopy management – leaf removal (LR) - recommended industry practices for
premium quality grape and wine production are followed, along with leaf removal in the
fruit zone late in the growing season; and
4. Level III canopy management - shoot thinning and leaf removal (STLR) - recommended
industry practices for premium quality grape and wine production are followed, along
with shoot thinning and leaf removal practices as described above.
The grapes were grown and managed by professional staff at an established private vineyard in
the Finger Lakes region of New York State, and neither the grapes nor the wines produced from
them were organic. Professional staff made the wines from the field treatments using standard
industry winemaking practices. To control for dryness, juices were adjusted to 22 Brix (sugar
level) prior to fermentation across treatments, and finished wines were back-sweetened to semi-
dry industry standards.
For grapegrowers, the primary costs associated with the CM practices are labor (manual and/or
mechanized) and lost yields. However, lost yields from thinned shoots may be partially offset by
larger sized grape clusters on the shoots that remain. Reduced photosynthesis capacity is the
primary determinant of yield losses from leaf removal. Quality improvements are expected from
the improved canopy climate and, perhaps, from lower yield pressures. The belief that low
yielding grapevines produce higher quality wines has a foothold among wine critics in the
popular press (Preszler, 2012), and grapevine yield restrictions have long been codified by law in
the quality appellations of some European countries (Johnson and Robinson 2001).
2.2 Experimental Setting
Subjects were recruited in the fall of 2010 through advertisements posted on campus and through
listserv notices maintained by experimental lab staff. Given the auctioning of alcohol and
consumption of alcoholic beverages, alcohol permits were obtained from the New York State
Liquor Authority. Participants were at least 21 years of age and self-identified as regular white
wine consumers; i.e., consume white wine at least once per month.
Subjects were randomly assigned to seats at individual computer terminals with dividers between
terminals to ensure privacy and to eliminate visual influences from other participants. Each
station also included water and crackers for cleansing the palate between wine tastings, and an
expectorate container (participants were not required to swallow the wine). A maximum of 24
computer terminals were available per session, and the sessions ranged from 19 to 23 subjects.
At the end of the experiment, subjects completed a survey about themselves and their wine
consumption habits.
For the sensory portion of the experiment, participants completed tasting sheets where they were
invited to write down comments about each of the wines and rate them on their perceived level
of acidity, sweetness, fruitiness, and overall likability. The perceived level for each attribute was
measured on a four-inch line scale with anchors at zero for “not at all” and four for “extremely
high.” Subjects were asked to mark a line along the scale to indicate their response, which was
later measured and converted to a numerical rating.

5
A computerized sealed-bid first-price English auction was used to elicit maximum WTP for the
alternative wines presented. Elyakime et al. (1994) showed that the sealed-bid first-price auction
is an incentive compatible method of eliciting WTP, and that the equilibrium strategy for a
participant is to choose a reservation price equal to their private value. An additional advantage
of the English auction is that it is relatively easy for subjects to understand (Kagel, 1995; Lusk,
2003).
After signing a consent form, participants were asked to read the instructions for the first part of
the experiment that described general information and how to submit bids on the computer
terminals.2 The experiment administrator then gave a brief introduction of the rules of the
experiment, which included the amount of money they would earn. Participants received $30 for
completing the experiment that could be kept or used to spend on a bottle of wine introduced to
them in one of several computerized auctions.3 Participants were informed that they should
submit their maximum WTP for a 750 ml bottle for each of several wines presented to them in a
series of auctions and that only one of the wine auctions would be binding at the end of the
experiment. For the binding auction, selected randomly, the highest bidder would buy the
selected bottle of wine from their $30 participation payment. Since each wine auction was
equally likely to be chosen, subjects were informed that it was in their best interest to bid their
maximum WTP for each of the wines.4 After answering questions from participants about the
general nature of the experiment, a non-binding practice round was conducted with a pen to
familiarize subjects with the computerized auction mechanism.
2.3 Order Treatments
Subjects were presented with four wine samples (one wine from each CM treatment)
simultaneously at the beginning of the experiment via 1-oz samples in number coded ISO tasting
glasses covered with watch glasses. Serving orders of the wines by CM treatment were
randomized across panelists. After the practice round, subjects were given general information
(written and verbal) about the wines and the grapes from which they were made (e.g., varietal,
location of vineyard, how and where processed).
A total of 8 sessions were conducted. Figure 1 shows how the order of the information presented
differed across two types of groups. In one-half of the sessions, participants submitted their first
set of bids for the wines based on their sensory characteristics alone (hereafter referred to as
Sensory First (SF) groups). The wine samples were placed on a simple paper template with
numbered codes matching those on the glasses to maintain the original order of the wines as
presented. After giving written and verbal sensory instructions, subjects were allowed to smell
and taste each wine. They could taste wines more than once, but were instructed to cleanse their
palate between tastings. Subjects were given 15 minutes to conduct their sensory evaluation and
complete the tasting sheet provided. Subjects then submitted their maximum WTP for each wine
through four sequential computerized sealed-bid auctions. In each auction, a bid clock was used
2 A copy of the instructions and information provided are available upon request from the corresponding author.
3 An endowment of $30 was selected based on a review a Riesling prices from numerous wineries in the Finger
Lakes. Most Riesling wines sold for between $10 and $20 per bottle; however, some reserve or special vintages
were priced around $30. 4 In addition to cost considerations, limited quantities of wine from the field trials also precluded the sale of more
than one bottle of wine per session.

6
starting at $0.00 per bottle and increased by $0.25 every second with a maximum bid of $30 per
bottle. Participants were allowed to refer to their tasting sheets. The auctions proceeded from the
subject’s left to right for each of the wines presented. Since the wines were in random order
across subjects, the computer program sorted the bids to determine the highest bid for each wine
and round.
In the third part of the experiment for the SF groups, detailed grape production information and
disease protection efforts in the Finger Lakes Region were presented (Figure 1). Pictures of
winegrape canopies with excessive vigor and common fungal diseases (i.e., botrytis, powdery
mildew) were highlighted to illustrate problems associated with dense and shaded canopies.
Subjects were informed that university research indicates that disease management can be
enhanced by using CM practices that include shoot thinning and leaf removal. It was noted that
CM practices are considered more environmentally friendly since they decrease the duration of
wetness events and improve the penetration and efficacy of chemical applications, which should
reduce total fungicide use and improve fruit composition and quality. Pictures were also shown
illustrating the CM practices. Subjects were subsequently informed that the wines tasted in the
previous part of the experiment were made from Riesling grapes produced under the four
alternative CM practices and that winegrape growers and vintners can promote the use of these
practices through a variety of marketing mechanisms. An example illustrating this information
was distributed to participants that resembled the original wine order (numbered) template, but
now with detailed information on the CM practices employed. An example template is provided
in Figure 2. After reviewing the additional information, a second round of (four) wine auctions
were completed, but now considering both types of information received (sensory and
production).5
In the other four sessions, participants submitted their first set of bids based on the detailed CM
information alone (hereafter referred to as Information First (IF) groups) before doing the
sensory evaluation. Subjects were first provided with the detailed production and disease
management information as described above, along with wine templates that contained the
detailed CM information for each wine sample (Figure 2). After presentation of the information
(written and verbal), subjects submitted their bids for each wine through four sequential
computerized auctions. The sensory portion of the experiment followed for the IF groups, where
participants completed tasting sheets and submitted their WTP bids in the computerized auctions
considering both sets of information (production and sensory).
After completing both sets of wine auctions, one participant in each session was randomly
chosen to draw one of eight labeled balls from a bag; there was one ball for each wine type (4)
and round of bidding (2). The person with the maximum bid for the selected wine and round
combination purchased a bottle of that wine from their $30 payment. Participants received their
compensation after completing a survey about themselves and their wine consumption habits.6
5 Participants were not allowed to taste or smell the wines again in this part of the experiment.
6 A copy of the participant survey is available upon request from the corresponding author.

7
3. Data
A total of 169 subjects participated in the experimental sessions and were included in the final
dataset; the data includes 86 subjects from SF groups and 83 from IF groups.7 With eight
observations per subject (4 wines, 2 rounds), the full dataset includes 1,352 observations. Table 1
provides a summary of selected demographic characteristics. There was considerable variation in
participant age (AGE) and income (INCOME) levels. About 40% of the participants were male
(MALE), 50% were students (STUDENT, primarily graduate students), and 46% were married
(MARRIED). The average participant has spent about 44% of his/her life living in New York
State (NYYEARSP). About 45% of the participants were strongly concerned about environmental
protection efforts and activities related to the production of agricultural products (ENVIRONC),
and 85% drank white wine, on average, more than once per month (FREQWWINE).
Table 2 describes participants’ wine drinking and spending patterns, differentiated by white wine
type. For all of the white wine categories, the most common drinking frequency was one to three
times per month. As expected, there is a clear shift in the distribution towards lower consumption
frequencies as the wine category is narrowed to the Riesling category, and then to the New York
State Riesling category. In fact, 4.1% and 8.9% of participants had never drunk Riesling or New
York State Riesling wines, respectively.
The range of $10 to $15 was the most typical range for a 750 ml bottle of white wine among
subjects (lower portion of Table 2). While there is some indication that a higher percentage of
participants would pay more for Riesling wines, there were also higher percentages of
participants that had never actually purchased those types of wines previously, including almost
15% for any Riesling and nearly 21% for Rieslings from New York State. Taking the midpoints
of the spending categories and valuing the lowest (highest) categories at $5 ($35), would imply
an average spending per bottle of $11.20, $11.50, and $10.00 for White, Riesling, and New York
State Riesling, respectively.
Table 3 provides a summary of the sensory attribute evaluations across all participants; i.e.,
tasting sheet information from round 1 in the SF groups and round 2 in the IF groups. On
average, subjects liked the CM wines more, and found them less acidic and more fruity than the
control. Perceived levels of sweetness intensity showed lower levels of differences in means, but
the result is not surprising given that sugar levels of the juices and wines across treatments were
equalized before and after the fermentation process. Mean likability and WTP levels are similar
in a relative sense for the ST and STLR wines compared to the control, but the LR wine was
discounted more prominently on WTP. The comparison is not straightforward, however, as the
likability assessments were to be based on only the wines’ sensory characteristics, while the
WTP data for the IF groups may also reflect the CM information.
Average WTP bids for the experimental wines were much lower (i.e., around six dollars per
bottle, Table 3) than what participants said they typically spent on a bottle of Riesling (Table 2).
The lower values of bids, on average, are likely the result of using new wines not available
commercially or familiar to the subjects. While the wines were made using standard industry
practices, “university-made” wines may exhibit a downward bias in value amongst participants
7 Three subjects were removed since their response to a survey question on frequency of white wine consumption
was ‘Never’.

8
relative to existing commercial wines. As we are interested in the relative prices across
treatments and, in particular, in the CM wines relative to the control, we do not think this will
influence the relative results across wines.
Differences in information order effects were examined initially by comparing differences in
mean WTP by wine treatment and round number and distinguished by order group (Table 4).
WTP values for the CM treatment wines are higher, on average, for the IF groups in both rounds.
All CM wines averaged $6.54 per bottle in round one for the IF groups, relative to only $6.14 for
the SF groups. Furthermore, CM wine bids were higher, on average, than the control (non CM)
wine in the IF groups, but lower in the SF groups. Next, consider the changes in WTP in round
two. Changes are higher (in absolute value), on average, for the IF groups. Specifically, round
two bids drop $0.30 per bottle on average for the CM wines in the IF groups (added sensory),
compared to a $0.02 drop, on average, for the SF groups (added CM information).
4. Empirical Models
4.1 Sensory Model
Ordinary least squares (OLS) regression was used in the sensory models to examine consumer
preferences for the wines based on their perceived levels of acidity, sweetness, and fruitiness.
The regression models do not distinguish on the production type of wine, but rather on their
explicit sensory characteristics as perceived by the subjects. Accordingly, individual subject
rankings of ‘likability’ were regressed on the three sensory attributes, including quadratic and
interaction terms to allow for nonlinear responses.8 The sensory models can be expressed as:
∑ ∑
∑ ∑ , (1)
where LIKEij is the likability ranking of wine j by subject i, are the intensity rankings for
sensory attribute k (i.e., acidity, sweetness, or fruitiness) by subject i for wine j, are the
squared rankings, are interaction variables between the sensory attributes k and l
, and eij is a random disturbance term distributed N(0,σ).
4.2 WTP Models
Two-limit Tobit models (i.e., at $0 and $30) were estimated for the WTP models. Tobit models
are commonly adopted for estimating WTP when the dependent variable is not binary and has a
large number of bids at the limit (Lusk et al., 2004). Furthermore, Tobit models have been
widely used to study consumer response to new food products or labels (e.g., Drichoutis et al.,
2009; Kanter et al., 2009). A random effects model framework was used to account for the panel
nature of the data; i.e., each subject submitted multiple bids for different wines in multiple
rounds. The Tobit model, incorporating random effects is:
[ ] , (2)
8 The dependent variable is, by definition, bounded on [0,4]; however, only 3% of the responses were given at either
of the bounds. As such, OLS was deemed sufficient. Estimated Tobit models demonstrated very similar results.

9
where is the latent value of WTP for wine type j in round t for subject i in group m,
expressed as a function of wine type Wj, group type Gm, round Rt, and demographic
characteristics Xi. The vector of parameters describing the effects for specific CM treatments
(relative to the control wine) is β, γ is a vector of parameters describing the interaction effects
between wines and groups (relative to the control wine and the SF group), δ is a parameter
describing the effect of round 2 (relative to round 1), θ is a parameter describing the interaction
effect between round and group (relative to round 1 and the SF group), and φ is a vector of
parameters describing the effect of demographic characteristics. The individual specific
disturbance term for subject i is ui and ejtim is the overall error term distributed N(0, σe ).
Likelihood-ratio tests are completed to compare the random effects model with the standard
(pooled) tobit model.
5. Empirical Results
5.1 Sensory Models
Understanding consumer preferences for sensory attributes in wines is important to growers and
vintners in managing varieties and developing wines that match consumer preferences for
particular characteristics. Communicating the levels or predominance of important sensory
attributes is common practice by marketers when promoting their wine products. The sensory
portion of the experiment provided data to estimate these effects in the Riesling wines produced
from field trials. Given that the timing of the sensory exercise varied across the SF and IF
groups, sensory data were used from round one in the SF groups and round two in the IF groups.
While the CM information presented to the IF groups in round 1 could influence the subject’s
likability of the wines in round two, subjects were instructed to complete the tasting sheet based
only on their sensory evaluation of the alternative wines.
Table 5 shows the results of the OLS sensory model regressing subject likability of wines on
their perceived sensory attributes.9 The attributes used (i.e., acidity, sweetness, and fruitiness)
would appear to be distinct in their interpretation given that none of the interaction effects were
statistically different from zero. For example, preference for the level of a wine’s fruitiness is not
affected by the level of sweetness or acidity.
Estimates for ACIDITY were positive on the level term and negative on the quadratic term,
implying higher levels of acidity were associated with higher likability, but at a decreasing rate.
The relative magnitude of the parameters is used to determine the level of acidity where
likability is maximized, holding all else constant. The estimated parameters indicate a maximum
likability rating at a perceived acidity level of 1.6.10
Given that the ranking scale was from zero
to four, this would indicate that consumers in our sample prefer a relatively limited amount of
acidity in semi-dry Riesling wines.
As expected, SWEETNESS was not significant. Recalling that the juices and wines were
equalized on sugar content before and after fermentation, less variation in sweetness across
9 For ease of exposition, including demographic variables identical to those in the WTP regressions was also
considered in the sensory model; however, F-tests on the null hypothesis that all demographic variable effects were
zero could not be rejected at any reasonable significance level. 10
The maximum is found by taking the first derivative of the sensory equation with respect to ACIDITY, setting it
equal to zero, and solving; i.e., ACIDITYmax = 0.449/(2*.144). Insignificant interaction effects were ignored.

10
wines likely drove this result. The level term for FRUITINESS was positive and significant, but
the quadratic term was not. This indicates a strong preference for fruity flavors and aromas in the
Riesling wines.
5.2 WTP Models
While the sensory characteristic results provide useful information on consumer preferences for
wine attributes, they do not provide a monetary valuation of the wine’s overall sensory
characteristics or allow for changes in valuation based on other attributes. The WTP models are
used to assess this additional information (Table 6). Four alternative specifications were
considered, each with the same set of demographic variables identified a priori as potentially
important determinants of a subject’s WTP for the Riesling wines. In all cases, likelihood ratio
tests reject the standard tobit model (σu = 0) at the 1% significance level.11
Models 1 and 2
include both order groups, while Models 3a and 3b are the non-nested versions of Model 2 when
considering the different order groups in isolation.
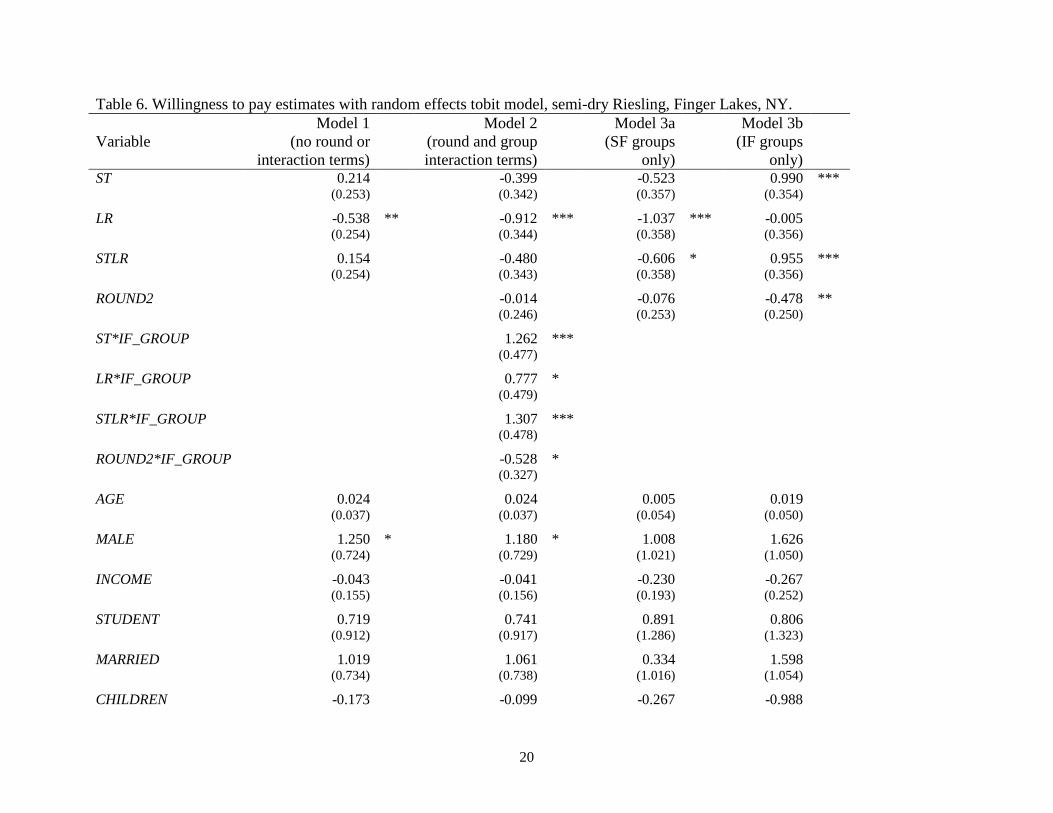
Focusing on Models 1 and 2, most demographic effects were not significant; however males
(MALE), subjects with a strong concern for environmental protection efforts in agriculture
(ENVIRONC), and subjects that frequently drank white wine (FREQWWINE) tended to pay more
for the Riesling wines offered, all else held constant. Price premiums ranged from $1.18 per
bottle for MALE to $2.23 per bottle for FREQWWINE.
Model 1 nests both order groups and includes marginal WTP estimates of the CM treatment
wines relative to the control wine with no group or round interaction terms. Information and
round effects are implicitly controlled for in the experimental design and, thus, Model 1 provides
average (or pooled) CM treatment effects. In this case, subjects valued only the LR wine
differently from the control wine. The pooled estimate for the LR wine showed a negative WTP
premium relative to the control of nearly 54 cents per bottle, or a reduction of 8.5% (i.e.,
0.54/6.32). In the pooled model, the determinants of that average effect – whether sensory
evaluation or CM information or both - are indistinguishable, but a strong monetary disincentive
is evident overall in the LR wine.
In Model 2 we exploit the panel nature of the data by estimating a nested tobit model that
includes group interaction effects to explicitly identify the initial monetary values of subjective
sensory and the objective environmental attributes. Round effects are incorporated to assess how
the addition of different types of information change the product valuations. Models 3a and 3b
are included for completeness and represent the non-nested variants of Model 2, where only the
SF and IF group data are considered, respectively.
The first three coefficient estimates in Model 2 (i.e., for ST, LR, and STLR) represent marginal
WTP estimates for the CM treatment wines based only on their combined sensory characteristics
relative to the control for round one (Table 6). The CM treatment wines all show negative
marginal effects, although only for the LR wine is the estimate significantly different from zero.
The negative $0.91 per bottle premium translates into a 14% reduction in price relative to the
average control wine bid of $6.69 (Table 4). Results from the experiment do not show improved
sensory characteristics from the CM wines for these wine consumers. Furthermore, the round
11
Chi-square test statistics were 847.29, 856.69, 386.83, and 416.76, respectively, for Models 1, 2, 3a and 3b.

11
two effect (ROUND2) was not significantly different from zero, indicating that the addition of
the environmentally friendly CM information about the wines did not affect their original
valuations.
It is not the case, however, that subjects were unwilling to pay for environmentally friendly
practices in winegrape production in general. Indeed, the CM treatment-group interaction effects
indicate just the opposite. Positive and significant marginal WTP values were estimated for all
three CM wines and ranged from $0.78 per bottle for the LR wine to $1.31 per bottle for the
STLR wine (CM wine and IF_GROUP interaction effects, Table 6), relative to the SF group in
round one. The total premium effects of the CM wines based on environmental attributes are
computed by summing the CM treatment and respective CM treatment-group interaction terms in
Model 2 (e.g., ST + ST*IF_GROUP). In this case, the total WTP premiums for the
environmentally friendly attributes are $0.86 (p-value = 0.014), -$0.13 (p-value = 0.703), and
$0.83 (p-value=0.019) per bottle for the ST, LR, and STLR wines, respectively. Based on the
average control wine bid of $6.22 (Table 4), these initial premiums are substantial for the ST and
STLR wines, approximately 13% to 14%. However, surprisingly, the LR wine value did not differ
significantly from the control wines based on the environmental information alone. This may be
due to subjects devaluing the environmental benefits from leaf removal given that it was done
later in the growing season and presupposing less of an overall influence on fungal disease
control. Recall that shoot thinning was done early in the growing season. The difference may
also be due to reductions in yields and the commensurate impacts on wine quality, where shoot
thinning was likely considered more substantial to reducing vine yields.
Negative sensory responses to CM wines were also apparent when sensory valuation follows
information on their environmental attributes. In particular, the round two effect for the IF
groups was -0.528, indicating the WTP bids dropped, on average, $0.53 per bottle after sensory
valuation. The combined influence of the environmentally friendly information and sensory
evaluation is similar to those in the sensory first grouping. Specifically, total premium effects for
the IF ordering (relative to the control wine) are $0.32 (p-value = 0.321), -$0.68 (p-value =
0.112), and $0.29 (p-value=0.502) per bottle for the ST, LR, and STLR wines, respectively.12
The
significant positive premiums for the ST and STLR wines based on the environmental attributes
are distinguished with the addition of (negative) sensory feedback.
6. Conclusions and Implications
Growing consumer demands for environmentally friendly products are increasingly influencing
agricultural production and food marketing strategies; however, both privately and publicly
appropriated values influence consumers’ WTP. Wine can be considered an ideal product to
examine these issues given consumers’ highly subjective sensory preferences towards wine, and
given that winegrape production processes are relatively intensive in the use of chemical inputs
for the control of disease and infection. Semi-dry Riesling wines made from actual field research
trials following prescribed CM practices were utilized in an experimental laboratory setting to
better understand preferences for environmentally friendly attributes incorporating sensory cues.
The order of information received by subjects (i.e., sensory evaluation and environmental
12
Total effects for the IF groups were estimated by summing the coefficients on treatment, round, and group
interaction effects. For example, the estimated final premium for ST was ST + ST*IF_GROUP + R2 +
R2*IF_GROUP.

12
product information) varied across experimental groups to explicitly consider asymmetric order
effects. Understanding potential WTP premiums for new wine products is essential information
to winegrape growers considering the adoption of environmentally friendly production practices
that face higher costs of production, as well as to the development of appropriate marketing
strategies considering intrinsic sensory and extrinsic environmental cues.
In a standard sensory assessment, we found that our sample of regular white wine consumers
clearly delineated their preferences for semi-dry Riesling wines based on the wines perceived
levels of acidity and fruitiness. Moderate levels of acidity and strong fruity flavors and aromas
were associated with increased likability of the wines. These types of characteristics are
commonly used when describing and marketing wines – the empirical results here support those
practices.
Furthermore, results from our laboratory experiment show that environmental friendly attributes
were important to consumers, but improvements in wine quality based on sensory attributes
alone were not apparent in the wines produced from the differing field treatments. Consistent
with much of the recent literature, sensory factor effects dominated environmental attribute
effects. WTP premiums of 13% to 14% were estimated for CM wines made following shoot
thinning (ST) and shoot thinning/leaf removal (STLR) based on their environmental attributes
alone. However, the addition of the wine’s (negative) sensory characteristics eliminated the
environmental premium effects. Furthermore, the wines’ sensory attributes were not favorable to
consumers initially and the introduction of environmentally friendly product information did not
affect WTP bids. In other words, once conditioned on (negative) sensory valuations, the addition
of environmental friendly attributes does not affect consumer valuations.
The sensory results would be strengthened with additional data that considers alternative site
locations and vintages to eliminate any potential spatial and weather influences. In addition, the
positive WTP premiums associated with the CM wines’ environmentally friendly attributes
should be compared with expected changes in production costs to better understand the
economic implications for growers considering the adoption of CM practices, conditional on
maintaining or improving wine quality. A careful examination of these issues is a top priority for
our continuing research.
Overall, the realization of a wine’s positive premiums for environmental attributes is realized
only if consumers’ sensory expectations are satisfied. The marketing implications are
straightforward. It is expected that including environmentally friendly product information on
wine labels and other marketing practices would increase demand and lead to higher premiums
for the products. However, these premiums are sustainable only in the face of repeat purchases,
implying that, after the initial purchase, a consumer’s sensory expectations are met. For wine at
least, quality matters and sensory evaluation trumps other extrinsic environmental factors. There
appears to exist an opportunity for new products to be promoted as environmentally friendly;
however we find evidence that for wine, products produced and marketed as environmentally
friendly also need to meet consumer demand in sensory qualities. As a result, marketing food
and beverages as environmentally-friendly remains one way to differentiate products, but such
strategies need to be especially mindful of product quality issues.

13
References
Barber, N., Taylor, C. and Strick, S. ‘Wine consumers’ environmental knowledge and attitudes:
Influence on willingness to purchase’, International Journal of Wine Research, Vol. 1,
(2009) pp. 59-52.
Bazoche P., Deola C. and Soler, L.G. ‘An experimental study of wine consumers’ willingness to
pay for environmental characteristics’, Selected Paper, 12th
Congress of the European
Association of Agricultural Economists (Ghent, Belgium, 2008).
Blend, J.R. and van Ravenswaay, E.O. ‘Measuring consumer demand for ecolabeled apples’,
American Journal of Agricultural Economics, Vol. 81, (1999) pp. 1072-1077.
Brennan, C.S. and Kuri, V. ‘Relationship between sensory attributes, hidden attributes and price
in influencing consumer perception of organic foods’, in J. Powell et al. (eds.), UK Organic
Research 2002: Proceedings of the Colloquium of Organic Researchers (COR) Conference
(Aberystwyth, 2002, pp. 625-668).
Brugarolas Mollá-Bauzá, M., Martinez-Carrasco Martinez, L. Martinez Pveda, A. and Rico
Pérez, M. ‘Determination of the surplus that consumers are willing to pay for an organic
wine’, Spanish Journal of Agricultural Research, Vol. 3, (2005) pp. 43-51.
Caderbat, J.-M. and Fiquet, J.-M. ‘What explains Bordeaux wine prices?’, Applied Economic
Letters, Vol. 11, (2004) pp. 293-296.
Combris, P., Bazoche, P. Giraud-Héraud, E. and Issanchou, S. ‘Food choices: What do we learn
from combining sensory and economic experiments?’, Food Quality and Preference, Vol.
20, (2009) pp. 550-557.
Combris, P., Lecocq, S. and Visser, M. ‘Estimation of a hedonic price equation for Bordeaux
wine: Does quality matter?’, The Economic Journal, Vol. 107, (1997) pp. 390-402.
Costanigro, M., Thilmany McFadden, D., Kroll, S. and Nurse, G. ‘An In-Store valuation of local
and organic apples: the role of social desirability’, Agribusiness: An International Journal,
Vol. 27, (2011) pp. 465-477.
Costanigro, M., Kroll, S., Thilmany, D., and Bunning, M. ‘Local, organic, conventional –
Asymmetric effects of information and taste on label preferences in an experimental auction’,
Selected Paper, AAEA/EAAE Food Environment Symposium (Boston, MA, 2012).
Delmas, M.A. and Grant, L.E. ‘Eco-labeling strategies and price-premium: The wine industry
puzzle’, Business & Society, (published online 11 March 2010)
http://bas.sagepub.com/content/early/2010/03/04/0007650310362254.
Drichoutis, A.C., Lazaridis, P. and Nayga, R.M. ‘Would consumers value food-away-from-home
products with nutritional labels?’, Agribusiness: An International Journal, Vol. 25, (2009)
pp. 550-575.
Durham, C.A. ‘The quick and tastey survey: opportunities from sensory tests’, Journal of Food
Distribution Research, Vol. 17, (2010) pp. 32-34.
Elyakime, B., Laffont, J.J., Loisel P., and Vuong, Q. ‘First-Price Sealed-Bid auctions with secret
reservation prices’, Annales d'Economie et de Statistique, Vol. 34, (1994) pp. 115–141.
Feldkamp, T.J., Schroeder, T.C. and Lusk, J.L. ‘Determining consumer valuation of
differentiated beef steak quality attributes’, Journal of Muscle Foods, Vol. 16, (2005) pp. 1-
15.
Foster, V. and Mourato, S. ‘Valuing the multiple impacts of pesticide sue in the UK: A
contingent ranking approach’, Journal of Agricultural Economics, Vol. 51, (2000) pp. 1-21.

14
Gustafson, C.R., Lybbert, T.J. and Sumner, D.A. ‘Combining consumer valuation research with
sensory science techniques: a laboratory experiment’, Selected Paper, Agricultural and
Applied Economics Association Annual Meeting (Pittsburgh, PA, 2011).
Huffman, W.E., Shogren, J.F., Rousu, M. and Tegene, A. ‘Consumer willingness to pay for
genetically modified food labels in a market with diverse information: Evidence from
experimental auctions’, Journal of Agricultural and Resource Economics, Vol. 28, (2003) pp.
481-502.
Johnson, H. and Robinson J. World Atlas of Wine, 5th ed. (London: Mitchell Beazley, 2001).
Kagel, J. H. ‘Auctions: A survey of experimental research’, in J. H. Kagel and A. E. Roth (eds.),
Handbook of Experimental Economics. (New Jersey: Princeton University Press, 1995, pp.
501–585).
Kanter, C. Messer, K.D., and Kaiser, H.M. ‘Does production labeling stigmatize conventional
milk’, American Journal of Agricultural Economics, Vol. 91, (2009) pp. 1097-1109.
Lecocq, S. Magnac, T., Pichery, M.-C.and Visser, M. ‘The impact of information on wine
auction prices: results of an experiment’, Annals of Economics and Statistics, Vol. 77, (2005)
pp. 37-57.
Lecocq, S. and Visser, M. ‘What determines wine prices: Objective vs. sensory characteristics’,
Journal of Wine Economics, Vol. 1, (2006) pp. 42-56.
Loureiro, M.L., McCluskey, J.J. and Mittelhammer, R.C. ‘Assessing consumer preferences for
organic, eco-labeled, and regular apples’, Journal of Agricultural and Resource Economics,
Vol. 26, (2001) pp. 404-416.
Loureiro, M.L., McCluskey, J.J. and Mittelhammer R.C. ‘Will consumers pay a premium for
eco-labeled apples’, Journal of Consumer Affairs, Vol. 36, (2002) pp. 203-219.
Loureiro, M.L. ‘Rethinking new wines: implications of local and environmentally friendly
labels’, Food Policy, Vol. 28, (2003) pp. 547-560.
Lusk, J.L. ‘Using experimental auctions for marketing applications: A discussion’, Journal of
Agricultural and Applied Economics, Vol. 35 (2003) pp. 349-360. Lusk, J.L., Feldkamp, T. and Schroeder, T.C. ‘Experimental auction procedure: Impact on
valuation of quality differentiated goods’, American Journal of Agricultural Economics, Vol.
86, (2004) pp. 389-405.
Lusk, J.L. and Briggerman, B.C. ‘Food values’, American Journal of Agricultural Economics,
Vol. 91, (2009) pp. 184-196.
McCluskey, J.J., Durham, C.A. and Horn, B.P. ‘Consumer preferences for socially responsible
production attributes across food products’, Agricultural and Resource Economics Review,
Vol. 38, (2009) pp. 345-356.
Melton, B.E., Huffman, W.E., Shogren, J.F. and Fox, J.A. ‘Consumer preferences for fresh food
items with multiple quality attributes: evidence from an experimental auction of pork chops’,
American Journal of Agricultural Economics, Vol. 78, (1996) pp. 916-923.
Preszler, T.L. ‘Crop load adjustment in Vitis Vinifera L. CV. Riesling’, Unpublished dissertation,
Cornell University (Ithaca, NY, 2012).
Teisl, M.F., Roe, B. and Levy, A.S. ‘Ecocertification: Why it may not be a “Field of Dreams”’,
American Journal of Agricultural Economics, Vol. 81, (1999) pp. 1066-1071.
Wessells, C.R., Johnston, R.J. and Donath, H. ‘Assessing consumer preferences for ecolabeled
seafood: The influence of species, certifier, and household attributes’, American Journal of
Agricultural Economics, Vol. 81, (1999) pp. 1084-1089.

15
Yang, N., McCluskey, J.J. and Ross, C. ‘Willingness to pay for sensory properties in Washington
State red wines’, Journal of Wine Economics, Vol. 4, (2009) pp. 81-93.

16
Table 1. Descriptive statistics for selected demographic variables (N=169).
Variable Description Mean Std Dev Min Max
AGE Age in years 31.79 12.54 21.00 71.00
INCOME Monthly income ($000) 4.04 2.42 1.25 8.33
NYYEARSP Proportion of life lived in New York 0.44 0.40 0.00 1.00
MALE Gender Male = 1, else 0 0.39 0.49 0.00 1.00
STUDENT Student Yes = 1, else 0 0.49 0.50 0.00 1.00
MARRIED Married Yes = 1, else 0 0.46 0.50 0.00 1.00
CHILDREN Children Yes = 1, else 0 0.21 0.41 0.00 1.00
ENVIRONC Strong concern for environmental protection
efforts in agriculture Yes = 1, else 0 0.45 0.50 0.00 1.00
ASIAN Race Asian = 1, else 0 0.27 0.44 0.00 1.00
ORGANIC Prefer to consume organic Yes, else 0 0.46 0.50 0.00 1.00
FREQWWINE Consume white wine more than once per
month, on average 0.85 0.36 0.00 1.00
Table 2. Distributions of wine consumption and spending patterns by participants
(N=169).
Category White (any) Riesling New York Riesling
Frequency of wine consumption (% of respondents by category):
Daily 1.2 0.0 0.0
More than 1x/week 13.0 6.5 4.7
1x/week 24.9 7.1 5.3
1-3x/month 46.1 39.6 30.8
Less than 1x/month 10.1 24.9 27.8
A couple times per year 4.7 17.7 22.5
Never 0.0 4.1 8.9
Typically spend on a 750 ml bottle of wine (% of respondents by category):
Less than $10 22.5 14.8 12.4
$10 - $15 62.1 55.0 51.5
$16 - $20 11.8 4.1 13.6
$21 - $25 3.0 0.6 1.2
$26 - $30 0.0 10.1 0.0
More than $30 0.6 0.6 0.6
Don’t buy 0.0 14.8 20.7

17
Table 3. Summary statistics for sensory attributes and WTP.a
CM Treatment N Mean Std Dev Min Max
Sensory attributes: Scale 0 (low) to 4 (high)
Like:
CON 166 2.00 0.99 0.00 4.00
ST 166 2.15 0.90 0.00 4.00
LR 166 2.04 0.89 0.00 4.00
STLR 166 2.17 0.92 0.00 4.00
Acidity Intensity:
CON 169 2.07 0.90 0.00 4.00
ST 169 1.89 0.88 0.00 3.75
LR 169 1.91 0.89 0.00 4.00
STLR 169 1.88 0.92 0.00 4.00
Sweetness Intensity:
CON 169 1.61 0.85 0.00 4.00
ST 169 1.69 0.81 0.00 4.00
LR 169 1.65 0.82 0.00 3.69
STLR 169 1.63 0.81 0.00 3.31
Fruitiness Intensity:
CON 166 1.78 0.88 0.00 4.00
ST 166 1.87 0.80 0.00 4.00
LR 166 1.81 0.81 0.00 3.94
STLR 166 1.90 0.86 0.00 4.00
WTP ($/bottle)c
CON 338 6.32 5.06 0.00 26.00
ST 338 6.47 4.81 0.00 22.50
LR 338 5.84 4.60 0.00 22.00
STLR 338 6.46 4.98 0.00 30.00 a Canopy management (CM) treatments are CON = control, no CM, ST = shoot thinning CM,
LR = leaf removal CM, and STLR = shoot thinning and leaf removal CM.

18
Table 4. Average WTP bids by information/sensory grouping and bidding round.a
CM Treatment N Round 1 Round 2 Difference
Sensory First Groups: (Sensory) (Sensory + Information)
CON 172 6.69 6.73 + 0.04
ST 172 6.24 6.37 + 0.14
LR 172 5.89 5.82 - 0.07
STLR 172 6.29 6.18 - 0.11
All CM Wines 516 6.14 6.12 - 0.02
Information First Groups: (Information) (Information + Sensory)
CON 166 6.22 5.60 - 0.63
ST 166 6.76 6.54 - 0.22
LR 166 6.01 5.62 - 0.40
STLR 166 6.85 6.55 - 0.30
All CM Wines 498 6.54 6.24 - 0.30 a Canopy Management (CM) treatments are CON = control, no CM, ST = shoot thinning CM, LR = leaf
removal CM, and STLR = shoot thinning and leaf removal CM.

19
Table 5. Ordinary least squares regression of
consumer likability on sensory attributes for semi-
dry Riesling, Finger Lakes, NY.a
Variable Estimate
ACIDITY 0.449 *** (0.155)
ACIDITY2 -0.144 ***
(0.034)
SWEETNESS 0.193 (0.188)
SWEETNESS2 -0.013
(0.048)
FRUITINESS 0.656 *** (0.176)
FRUITINESS2 -0.042
(0.046)
ACIDITY*SWEETNESS 0.009 (0.050)
ACIDITY*FRUITINESS -0.049 (0.047)
SWEETNESS*FRUITINESS -0.018 (0.062)
INTERCEPT 0.774 *** (0.228)
Adjusted R2 0.272
N 663 a The dependent variable is the level of how much the subject
liked the wine from ‘not at all’ (0) to ‘extremely’ (4). The
sensory attributes of perceived level of acidity, sweetness,
and fruitiness are similarly rated. The data are from the
sensory portion of the experiment only; i.e., round 1 for the
Sensory First groups and round two for the Information First
groups.
Note: we use *, **, and *** to represent 0.10, 0.05, and 0.01
levels of statistical significance, respectively. Standard errors
in parentheses.
20
Table 6. Willingness to pay estimates with random effects tobit model, semi-dry Riesling, Finger Lakes, NY.
Variable
Model 1
(no round or
interaction terms)
Model 2
(round and group
interaction terms)
Model 3a
(SF groups
only)
Model 3b
(IF groups
only)
ST 0.214 -0.399 -0.523 0.990 *** (0.253) (0.342) (0.357) (0.354)
LR -0.538 ** -0.912 *** -1.037 *** -0.005 (0.254) (0.344) (0.358) (0.356)
STLR 0.154 -0.480 -0.606 * 0.955 *** (0.254) (0.343) (0.358) (0.356)
ROUND2 -0.014 -0.076 -0.478 ** (0.246) (0.253) (0.250)
ST*IF_GROUP 1.262 *** (0.477)
LR*IF_GROUP 0.777 * (0.479)
STLR*IF_GROUP 1.307 *** (0.478)
ROUND2*IF_GROUP -0.528 * (0.327)
AGE 0.024 0.024 0.005 0.019 (0.037) (0.037) (0.054) (0.050)
MALE 1.250 * 1.180 * 1.008 1.626 (0.724) (0.729) (1.021) (1.050)
INCOME -0.043 -0.041 -0.230 -0.267 (0.155) (0.156) (0.193) (0.252)
STUDENT 0.719 0.741 0.891 0.806 (0.912) (0.917) (1.286) (1.323)
MARRIED 1.019 1.061 0.334 1.598 (0.734) (0.738) (1.016) (1.054)
CHILDREN -0.173 -0.099 -0.267 -0.988

21
(0.905) (0.909) (1.193) (1.465)
NYYEARSP 0.780 0.712 0.619 0.572 (1.008) (1.013) (1.442) (1.409)
ENVIRONC 1.428 * 1.463 * 1.313 1.344 (0.755) (0.759) (0.992) (1.163)
FREQWWINE 2.234 ** 2.181 ** 3.564 *** -0.264 (0.976) (0.981) (1.233) (1.5665)
ASIAN -0.749 -0.658 -0.416 -2.351 * (0.879) (0.885) (1.137) (1.430)
ORGANIC -0.497 -0.583 0.226 -1.419 (0.739) (0.744) (1.011) (1.087)
INTERCEPT 1.586 1.789 2.644 3.609 (2.003) (2.041) (2.834) (2.967)
σu 4.208 *** 4.233 *** 3.955 *** 4.122 *** (0.252) (0.254) (0.333) (0.355)
σe 3.209 *** 3.189 *** 3.242 *** 3.132 *** (0.073) (0.072) (0.104) (0.101)
Log Likelihood -3366.510 -3359.610 -1717.415 -1634.050
N 1352 1352 688 664 Note: We use *, **, and *** to represent 0.10, 0.05, and 0.01 levels of statistical significance, respectively. Standard errors in parentheses.

22
Figure 1. Experimental auctions and sensory evaluation order by information treatment and round
Group Type Part 1 Part 2 Part 3
Sensory
First Group
(SF)
Information
First Group
(IF)
Practice
round
(pen auction)
Practice
round
(pen auction)
Production
information
(1st set of auctions
for four wines)
Sensory
evaluation
(1st set of auctions
for four wines)
Production
information
(2nd
set of auctions
for four wines)
Sensory
evaluation
(2nd
set of auctions
for four wines)

23
Figure 2. Example template describing canopy management practices used for alternative wine samples.
GRAPE PRODUCTION PRACTICES
680 130 654 834
MADE WITH TRADITIONAL MANAGEMENT PRACTICES
This wine has been producedfollowing recommended industrypractices for premium quality grapeand wine production.
MADE WITH LEVEL I CANOPYMANAGEMENT PRACTICES
This wine has been producedfollowing recommended industrypractices for premium quality grapeand wine production.
Level I Canopy Management (CM)practices were also employed,involving shoot thinning (5 shoots percanopy foot) early in the growingseason.
CM practices promote a more opencanopy that improves air circulationand sunlight exposure to growingwine grapes.
CM practices represent moreenvironmentally-friendly productionpractices by increasing the potentialfor reduced fungicide use andimproved fruit composition throughenhanced aromas and flavors.
MADE WITH LEVEL II CANOPY MANAGEMENT PRACTICES
This wine has been producedfollowing recommended industrypractices for premium quality grapeand wine production.
Level II Canopy Management (CM)practices were also employed,involving heavy leaf removal late inthe growing season.
CM practices promote a more opencanopy that improves air circulationand sunlight exposure to growingwine grapes.
CM practices represent moreenvironmentally-friendly productionpractices by increasing the potentialfor reduced fungicide use andimproved fruit composition throughenhanced aromas and flavors.
MADE WITH LEVEL III CANOPY MANAGEMENT PRACTICES
This wine has been producedfollowing recommended industrypractices for premium quality grapeand wine production.
Level III Canopy Management (CM)practices were also employed,involving shoot thinning to 5 shootsper canopy foot and heavy leafremoval late in the growing season.
CM practices promote a more opencanopy that improves air circulationand sunlight exposure to growingwine grapes.
CM practices represent moreenvironmentally-friendly productionpractices, by increasing the potentialfor reduced fungicide use andimproved fruit composition throughenhanced aromas and flavors.

WP No Title Author(s)
OTHER A.E.M. WORKING PAPERS
Fee(if applicable)
Super-Additionality: A Neglected Force inMarkets for Carbon Offsets
Bento, A., Kanbur, R. and B. Leard2012-09
Creating Place for the Displaced: Migration andUrbanization in Asia
Beall, J., Guha-Khasnobis, G. and R.Kanbur
2012-08
The Angolan Economy – Diversification andGrowth
Kyle, S.2012-07
Informality: Concepts, Facts and Models Sinha, A. and R. Kanbur2012-06
Do Public Work Schemes Deter or EncourageOutmigration? Empirical Evidence from China
Chau, N., Kanbur, R. and Y. Qin2012-05
Peer Effects, Risk Pooling, and Status Seeking:What Explains Gift Spending Escalation in RuralChina?
Chen, X., Kanbur, R. and X. Zhang2012-04
Results Based Development Assistance:Perspectives from the South Asia Region of theWorld Bank
O'Brien, T., Fiszbein, A., Gelb, A.,Kanbur, R and J. Newman
2012-03
Aid to the Poor in Middle Income Countries andthe Future of IDA
Kanbur, R.2012-02
Does Kuznets Still Matter? Kanbur, R.2012-01
Meeting multiple policy objectives under GHGemissions reduction targets
Boisvert, R., and D. Blandford2011-21
The Theory of Biofuel Policy and Food GrainPrices
Drabik, D.2011-20
Factors Influencing Adoption of Integrated PestManagement in Northeast Greenhouse andNursery Production
Gómez, M.2011-19
Urban Agglomeration Economies in the U.S.Greenhouse and Nursery Production
Gómez, M.2011-18
Evaluating the Impact of the Fruit andVegetable Dispute Resolution Corporation onRegional Fresh Produce Trade among NAFTACountries
Gómez, M., Rizwan, M. and N. Chau2011-17
Paper copies are being replaced by electronic Portable Document Files (PDFs). To request PDFs of AEM publications, write to (be sure toinclude your e-mail address): Publications, Department of Applied Economics and Management, Warren Hall, Cornell University, Ithaca, NY14853-7801. If a fee is indicated, please include a check or money order made payable to Cornell University for the amount of yourpurchase. Visit our Web site (http://aem.cornell.edu/research/wp.htm) for a more complete list of recent bulletins.