Embed Size (px)
Citation preview

Empowered lives. Resilient nations.
100% ELECTRICITY GENERATION THROUGH RENEWABLE ENERGY BY 2050
Assessment of Sri Lanka’s Power Sector Empowered lives. Resilient nations.

Contact InformationMr. Harsha Wickramasinghe, Sustainable Energy Authority, [email protected]
Dr. Priyantha Wijayatunga, [email protected]
Dr. Alexandra Soezer, [email protected]
For questions or comments with respect to content, or for permission to use the ADB logo, please contact [email protected].
Technical Oversight and GuidanceDr. Alexandra Soezer, UNDP LECB
Darshak Mehta, Sector Advisory Services (Consultant), Asian Development Bank
Lead AuthorManpreet Singh (KPMG India)
AuthorsSandip Keswani (KPMG India), Puneet Chitkara (KPMG India), Ranjani Joseph (KPMG India), Himadri Singha (KPMG India), Shouvik Sen (KPMG India), Gaurav Mahindru (KPMG India), Vedamitra Rao (KPMG India), Pyumi Sumanasekaran (KPMG India), and Ninzer Shazaad (KPMG India)
Lead ReviewerDr. Priyantha Wijayatunga (Asian Development Bank)
ReviewersH.M.Buddika Hemashantha (Sri Lanka Carbon Fund), Milou Beerepoot (United Nations Development Program), and Dan Millison (Asian Development Bank).
Acknowledgements This study benefitted from valuable assistance with data collection, insightful stakeholder views and expert opinions, including from: J.D.K. Wickramaratne and Harsha Wickramasinghe (Sri Lanka Sustainable Energy Authority), Dr. H.M. Wijekoon and Buddhika Samarasekara (Ceylon Electricity Board), Damitha Kumarasinghe and Gamini Sarathchandra (Public Utilities Commission of Sri Lanka), Ranishka Wimalasena (Asian Development Bank), Sameera Gunawardena (Panasian Power Plc). David Elzinga (Asian Development Bank), Silver Navarro (Asian Development Bank), and Mr. Sulakshana Jayawardena (Ministry of Power and Renewable Energy, Sri Lanka).
EditorGeorgina Wilde
DesignKimberly Koserowski

100% ELECTRICITY GENERATION THROUGH RENEWABLE ENERGY BY 2050
Assessment of Sri Lanka’s Power Sector
Co-publication of the Asian Development Bank and the United Nations Development Programme
Empowered lives. Resilient nations.

This is a co-publication of Asian Development Bank and United Nations Development Programme.
The designation of the materials in this publication do not imply the expression of any opinion whatsoever on the part of the Secretariat of the United Nations, UNDP, ADB or its Board of Governors or the governments they represent concerning the legal status of any country, territory, city or area, or of its authorities, or concerning the delimitation of its frontiers or boundaries.
The content and views expressed in this publication are those of the authors and do not necessarily reflect the views or policies or carry the endorsement of the copublishing organizations.
The copublishing organizations do not guarantee the accuracy of the data included in this publication and accept no responsibility for any consequence of their use.
© 2017 Asian Development Bank, and United Nations Development Programme
All rights reserved. Published in 2017.
ADB and UNDP encourage printing or copying information exclusively for personal and non-commercial use with proper acknowledgment of ADB and UNDP. Users are restricted from reselling, redistributing, or creating derivative works for commercial purposes without the express, written consent of UNDP.
Also available online at:http://www.adb.orghttp://www.undp.org

100% ELECTRICITY GENERATION THROUGH RENEWABLE ENERGY BY 2050 — ASSESSMENT OF SRI LANKA’S POWER SECTOR
FOREWORDI am pleased to introduce a new study on Assessment of Sri Lanka's Power Sector - 100% percent Electricity Generation through Renewable Energy by 2050, jointly published by the United Nations Development Programme (UNDP) and the Asia Development Bank (ADB). The study will contribute towards the realisation of Sri Lanka's 100% renewable electricity targets by 2050 of which Sri Lanka's — not yet released — Long Term Generation Expansion Plan (2018 - 2037) is an important step. The Expansion Plan has been developed by the Ceylon Electricity Board (CEB).
Sri Lanka has already made significant progress in the electricity sector, four major achievements are:
Reaching this ambitious goal will, however, require achieving progressively deeper cuts in greenhouse gas emissions.
■ Electricity generation is increased 4 times between period of 1992 to 20161
■ Electricity access has reached from just about 50% in 1990 to 100% of the population by end of 2016.
■ Technical loss in Transmission and distribution is less than 10%2 implying an efficient operation
■ Establishment of an independent regulatory body for Electricity Sector utilities
The real challenge going forward lies in creating a de-risked policy environment and innovative financial models and practices to attract investment at scale in the sector. The joint study by UNDP and ADB will serve as a robust foundation for Sri Lanka's Long Term Generation Expansion Plan and builds on successes in the sector.
I welcome a continued close collaboration between energy experts from Sri Lanka, UNDP and ADB with the goal to identify a robust sustainable, holistic development pathway. For this, it will be important to assess different sectoral development scenarios, understand the needs for additional technical infrastructure, while aiming for a true paradigm shift that builds on global experiences.
I think that the world is at a turning point in terms of utilization of new sources of energy, new ways of energy delivery and new energy uses. Considering the demography, economy and current energy uses, Sri Lanka is uniquely positioned to spearhead cutting edge research and development for a zero carbon future. In this context, I am happy to welcome ADB and UNDP to further the interest of Sri Lanka.
Sincerely,
Dr. B.M.S. Batagoda Secretary to the Ministry of Power & Renewable Energy, Sri Lanka
1 http://www.pucsl.gov.lk/english/wp-content/uploads/2017 /05/LTGEP 2018-2037 .pdf Section 1.4.52 http://www.pucsl.gov.lk/english/wp-content/uploads/2017 /05/LTGEP 2018-2037 .pdf figure 3.1

FOREWORD
FOREWORDThe adoption of the Paris climate agreement in 2015 marks not only an historic milestone for the global effort to combat climate change but also sets an important signal for accelerated climate action and a dramatic transformation of economies as we know them.
As laid out in their visions and commitments on climate change, UNDP and the Asia Development Bank strongly support the goal of enabling climate-resilient, low-emission development with the objective of transitioning to resilient zero-carbon growth by the end of the century.
In the strongest ever collective spirit, 195 countries came forward with national plans, or intended Nationally Determined Contributions (INDCs), to outline targets for cutting greenhouse gas (GHG) emissions, many of which included climate adaptation targets and strong references to social inclusion, especially gender equality. These national contribution targets culminated into the Paris Agreement which set the highly ambitious - but vital - global goal to limit temperature increases to well below 2°C and transition to a zero-carbon economy by the end of the century.
Reaching this ambitious goal will, however, require achieving progressively deeper cuts in greenhouse gas emissions.
In this context, Sri Lanka as one of the countries disproportionately affected by climate change has agreed to ambitious renewable electricity generation targets by 2050. Sri Lanka is among the 43 countries of the Climate Vulnerable Forum that agreed to make their electricity generation 100 per cent renewable as rapidly as possible and by 2050 at the latest. Sri Lanka signed this declaration at the COP in Marrakech, Morocco. This is highly ambitious for a country that expects a steep increase in per capita electricity consumption for years to come.
The joint UNDP and Asia Development Bank ‘100% Electricity Generation Through Renewable Energy by 2050 Assessment of Sri Lanka’s Power Sector’ describes the technical challenges to meet this ambitious 100 per cent renewables target and how this target could be financed.
The report includes a step-wise approach for the assessment of the 100 per cent renewable electricity generation target, the composition of renewable energy generation and the direct and indirect costs associated with the target, including also the costs for the enabling infrastructure such as transmission systems and storage capacity. A favourable policy environment for additional regulations has also been analysed. Possible sources of financing for the transition of Sri Lanka’s electricity system have been assessed and finally, the sustainable development benefits of a 100% renewables scenario have been identified and quantified.
While this study gives deep insights into the issues associated with 100 per cent renewable energy targets, it is understood that over the next decades a number of changes are likely to occur in technology, economics and regulatory environment. The transparently conveyed assumptions and calculations will build a robust basis for future adjustments to changing circumstances.
Marcel Alers Dr. Yongping Zhai Head of Energy Technical Advisor (Energy) United Nations Development Programme Asian Development Bank
1100% ELECTRICITY GENERATION THROUGH RENEWABLE ENERGY BY 2050 — ASSESSMENT OF SRI LANKA’S POWER SECTOR
TABLE OF CONTENTSList of Tables 4
List of Figures 6
Abbreviations and Acronyms 7
1. Executive Summary 11
2. Introduction 14
Energy Mix and Emissions Profile 15
Pledge to Generate 100 percent Electricity through Renewable Energy 16
Key Challenges faced by the Sri Lankan Power Sector 18
3. Electricity Generation Assessment Framework 20
4. The 2050, 100 percent Renewable Energy Electricity Generation Scenario 22
Power Sector Demand Assessment (2050) 23
100 percent RE Power Sector Electricity Generation Mix (2050) 23
5. Economic and Generation Mix Rationale 29
Economic Rationale 29
Solar Rationale 33
6. Demand Management and Balancing Requirements 37
Peak Management Scenarios 38
Summary of Peak Demand Management and Balancing Requirements 42
7. Investment Requirements 44
Project Development Costs 44
Transmission Infrastructure Costs 45
Ancillary Systems Costs 46
Total Investment for Sri Lanka’s 2050 100 percent RE Electricity Generation Scenario 48
8. Investment Climate 49
Potential Investors 49
Potential Investor Risks 50
Risk Mitigation Frameworks 53

2 TABLE OF CONTENTS
9. Financial and Non-Financial Interventions Required 55
Targeted Interventions 55
Stakeholder Intervention Map Rationale 60
10. Sustainable Development 70
Sustainable Development Benefits 71
11. Path Forward 73
Formalization of 2050, 100 percent RE Electricity Generation Scenario 73
Annex A: Sri Lanka Power Sector - An Overview 76
Historical electricity demand trends in Sri Lanka 76
Historical electricity supply trends in Sri Lanka 77
Annex B: Sri Lanka’s Electricity Generation Portfolio 79
Grid connected 79
CEB Power Plants 79
Independent Power Producers (IPPs) 81
Technical performance of existing grid connected power plants 82
Off-grid electricity generation 83
Existing transmission system of Sri Lanka 83
Annex C: Sri Lanka Power Sector Stakeholders 85
Power Sector Stakeholders 86
Annex D: Sri Lanka Power Sector Regulatory Regime 91
Sri Lankan Power Sector’s Tariff Setting Methodology 91
Economics of Power Generation from Various Sources/Technologies 92
Annex E: Sri Lanka Renewables Policy Landscape 95
National Energy Policy and Strategies (NEPS 2008) 95
Sri Lanka Energy Sector Development Plan for a Knowledge-based Economy (2015-2025) 98
Battle for Solar Energy - The Rooftop Initiative 100
Carbon Partnership Facility (CPF) 102

3100% ELECTRICITY GENERATION THROUGH RENEWABLE ENERGY BY 2050 — ASSESSMENT OF SRI LANKA’S POWER SECTOR
Annex F: Sri Lanka Electricity Tariff Structures 103
CEB Tariff for NCRE 103
Feed-in-Tariff (FIT) Policy 104
Electricity Tariff for End Consumers 106
Annex G: CEB Demand Assessment and Generation Planning 108
Base Case Demand and Supply Forecast 109
Projects Planned or Committed as p er Base Case Scenario 111
Challenges in Implementation of LTGEP 112

4 LIST OF TABLES
LIST OF TABLES Table 1: Sri Lanka 2050 Electricity Generation Mix: 100 percent RE 24
Table 2: Assumed generation source PLF 26
Table 3: Potential future RE technologies 27
Table 4: Fuel costs avoided 30
Table 5: Recent trend of global solar prices 36
Table 6: Daily average supply profile of different technologies 41
Table 7: Auxiliary Power Consumption (APC) Assumptions 42
Table 8: Impact of high RE on balancing infrastructure 42
Table 9: Investment required for 100 percent RE electricity generation 44
Table 10: Investment required for transmission infrastructure 46
Table 11: Investment required for ancillary services 47
Table 12: Potential investor categories for the RE sector 49
Table 13: Potential risk areas for investors 50
Table 14: Potential risk mitigation measures to be taken by the Government 53
Table 15: Plausible financial interventions for the Sri Lankan RE sector 56
Table 16: Power sector stakeholder Intervention map 59
Table 17: Subsidies currently given to Sri Lanka household customers 62
Table 18: German FIT structure 66
Table 19: Sustainable Development Benefits 71
Table 20: Historical supply of electricity from different sources 78
Table 21: CEB portfolio (2015) 79
Table 22: IPP Portfolio (2015) 80
Table 23: Performance of existing power stations 82
Table 24: Electricity Sector Government Ministries 86
Table 25: Associated Government Ministries and Organizations 87
Table 26: Independent Power Producers (IPPs) 88
Table 27: Civil Society Agencies 89
Table 28: Financial Institutions 93
Table 29: Comparison of cost of generation from different sources 94
Table 30: Capital cost comparison 96
Table 31: NEPS Targets and Milestones 99
Table 32: Energy Sector Development Plan Targets and Strategies 103
5100% ELECTRICITY GENERATION THROUGH RENEWABLE ENERGY BY 2050 — ASSESSMENT OF SRI LANKA’S POWER SECTOR
Table 33: NCRE tariff for CEB 105
Table 34: Fixed Tariff Structure 105
Table 35: Three Tier Tariff Structure 107
Table 36: Average selling price of electricity 107
Table 37: Tariff for Domestic Users 109
Table 38: Base case demand-supply forecast 109
Table 39: Forecast of supply by source 110
Table 40: Projects Planned as per LTGEP Base Case Scenario 111
Table 41: Schedule of plant retirement 113

6 LIST OF FIGURES
LIST OF FIGURESFigure 1: 2050, 100 percent RE Electricity Generation Mix Progression 12
Figure 2: 2050, 100 percent RE Electricity Generation Scenario Investment Requirements 12
Figure 3: 2050, 100 percent RE Electricity Generation Scenario Economic Savings 13
Figure 4: Sri Lanka’s Real GDP Growth Rate 14
Figure 5: Sri Lanka Total Energy Demand 15
Figure 6: Sri Lanka Primary Energy Mix (2015) 15
Figure 7: Sri Lanka Emissions Profile 16
Figure 8: Sri Lanka Electricity Generation Mix Trend (2011-15) 17
Figure 9: Electricity generation assessment framework 20
Figure 10: Future electricity demand forecast in Sri Lanka 23
Figure 11: Sri Lanka 2050 electricity generation mix: 100 percent RE 25
Figure 12: Economic savings from fuel cost avoidance 30
Figure 13: Avoidance of electricity generation through coal 32
Figure 14: Solar growth in India 36
Figure 15: Peak demand trajectory in Sri Lanka 37
Figure 16: Sri Lanka 2050 daily load curve 38
Figure 17: 2020 - Typical daily demand-supply scenario 39
Figure 18: 2030 - Typical daily demand-supply scenario 39
Figure 19: 2040 - Typical daily demand-supply scenario 40
Figure 20: 2050 - Typical daily demand-supply scenario 40
Figure 21: Capital cost assumptions 45
Figure 22: Total investment required in Sri Lankan power sector for 100 percent RE 48
Figure 23: Growth in wind capacity addition 68
Figure 24: Sustainable Development Goals (SDG) Impacts (determined using UNDP’s Climate Action Impact Tool) 70
Figure 25: Electricity Generation Mix (2015) 76
Figure 26: Trends in Electricity Demand 77
Figure 27: Trends in Electricity Supply and Peak Demand 78
Figure 28: Plant Load Factor (PLF) of various power plant segments 82
Figure 29: Key electricity sector generation, transmission and distribution players 85
Figure 30: Sri Lanka Power Sector Reforms Timeline 91

7100% ELECTRICITY GENERATION THROUGH RENEWABLE ENERGY BY 2050 — ASSESSMENT OF SRI LANKA’S POWER SECTOR
ABBREVIATIONS AND ACRONYMSAD Accelerated Depreciation
ADB Asian Development Bank
AFD Agence Française de Développement
APC Auxiliary Power Consumption
BEASL Bio Energy Association of Sri Lanka
BMS Building Management System
BSAS Black Start Ancillary Services
BST Bulk Supply Tariffs
CAGR Compounded Annual Growth Rate
CBSL Central Bank of Sri Lanka
CC Combined Cycle
CCER Chinese Certified Emission Reduction
CDM Clean Development Mechanism
CEA Central Environmental Agency
CEB Ceylon Electricity Board
CERC Central Electricity Regulatory Commission
CPC Ceylon Petroleum Corporation
CPF Carbon Partnership Facility
CPSTL Ceylon Petroleum Storage Terminals Limited
CST Concentrated Solar Thermal
DFCC Development Finance Corporation of Ceylon
DFI Development Finance Institution
DII Domestic Institutional Investor
DSM Demand Side Management
EAR Environmental Assessment Report
ECF Energy Conservation Fund
EEG The Renewable Energy Sources Act
EES Electrical Energy Storage
EFL Environmental Foundation Limited
EIB European Investment Bank
ESCO Energy Service Company
ETS Emissions Trading System

8 ABBREVIATIONS
EU European Union
EUR Euro
FECS Federation of Electricity Consumer Societies
FII Foreign Institutional Investor
FIT Feed-In-Tariff
FSAS Frequency Support Ancillary Services
GBI Generation based Incentives
GDP Gross Domestic Product
GHG Green House Gas
GIS Geographic Information Systems
GT Gas Turbine
GTC Generation Tax Credit
GW Gigawatt
HPP Hydro Power Plant
ICT Information, Communication and Technology
IDC Interest During Construction
IDF Infrastructure debt funds
IEA International Energy Agency
IISD International Institute for Sustainable Development
INR Indian Rupee
IPP Independent Power Producer
IRS Interest Rate Subvention
ITC Investment Tax Credit
JICA Japan International Cooperation Agency
LAD Lanka Auto Diesel
LCoC Lanka Coal Company Pvt. Ltd.
LECO Lanka Electricity Company Private Limited
LH Large Hydro
LKR Lankan Rupee
LNG Liquefied Natural Gas
LTGEP Long Term Generation Expansion Plan
LTNREP Long Term Non-Conventional Renewable Energy Plan
M/P&RE Ministry of Power and Renewable Energy
M/PRD Ministry of Petroleum Resources Development

9100% ELECTRICITY GENERATION THROUGH RENEWABLE ENERGY BY 2050 — ASSESSMENT OF SRI LANKA’S POWER SECTOR
M/UD&SAD Ministry of Urban Development and Sacred Area Development
MMD&E Ministry of Mahaweli Development and Environment
MMT Million Metric Tons
MRP Market Readiness Proposal
MRV Monitoring Reporting and Verification
MW Megawatt
NBFC Non-Banking Financial Company
NCRE Non-Conventional Renewable Energy
NDC Nationally Determined Contributions
NEPS National Energy Policy and Strategies of Sri Lanka
O&M Operation and Maintenance
PAT Perform and Trade
PLF Plant Load Factor
PMR Partnership for Market Readiness
PPP Public Private Partnership
PRDS Petroleum Resources Development Secretariat
PSPP Pumped Storage Power Plant
PUCSL Public Utilities Commission of Sri Lanka
PV Photovoltaic
RE Renewable Energy
REC Renewable Energy Certificate
RES Renewable Energy Sector
RS Remote Sensing
SHR Station Heat Rate
SIA-SL Solar Industries Association – Sri Lanka
SLCCS Sri Lanka Carbon Crediting Scheme
SLCF Sri Lanka Carbon Fund
SLCOS Sri Lanka Carbon Offset Scheme
SLSEA Sri Lanka Sustainable Energy Authority
SPD Solar Power Project Developer
SPP Small Power Producers
SPV Solar Photo Voltaic
ST Steam Turbine
T&D Transmission and Distribution

10 ABBREVIATIONS
UDA Urban Development Authority
UNFCCC United Nations Framework Convention on Climate Change
USA United States of America
USABC United States Advanced Battery Consortium
USD United State Dollar
VAR Volt-Amperes Reactive
VCAS Voltage Control Ancillary Services
WB World Bank
WEC World Energy Council
WPP Senok Wind Power Private Limited

11100% ELECTRICITY GENERATION THROUGH RENEWABLE ENERGY BY 2050 — ASSESSMENT OF SRI LANKA’S POWER SECTOR
1 EXECUTIVE SUMMARY
In 2015, 52 percent of Sri Lanka’s electricity was generated through fossil fuels. Indigenous fossil fuel resources are scare, so the fossil fuel used for electricity is imported, a significant part of Sri Lanka’s import expenditure. As a developing country, Sri Lanka’s demand for electricity is going to increase in the future. It is imperative therefore, for Sri Lanka to secure its energy future by focusing on the development and adoption of indigenous, renewable sources of energy to meet this growing demand and reduce the economic burden of imports.
Acknowledging this need, Sri Lanka saw an increase in the share of renewable energy (RE) in the electricity mix, when in 2014, the country met its target of generating at least 10 percent of its electricity using renewable energy. Subsequently, in 2015, the contribution of fossil fuels to the electricity mix decreased, at the same time as a rise in the contribution of both renewable energy and large hydro.
In an endeavour to embrace renewables more fully, Sri Lanka, while attending the 22nd UNFCCC Conference of Parties in Marrakech, Morocco, as part of the Climate Vulnerable Forum, pledged to use only RE for electricity generation by 2050.
This report has been developed with the purpose of designing and proposing scenarios and mechanisms through which the goal of 100 percent RE in electricity generation by 2050 can be achieved. It details among other things the plausible electricity generation mix as well as financial interventions required for Sri Lanka to achieve its goal while highlighting the numerous technical and economic challenges the country is likely to face on its road to a 100 percent RE power sector.
While the result of the study is to propose a scenario where all of Sri Lanka’s electricity is completely generated through renewables, given the high costs and technical challenges associated with integrating renewables into the electricity generation mix, especially in terms of ancillary and balancing needs, the report proposes a gradual phase out of fossil fuels from the country’s electricity mix.

12 EXECUTIVE SUMMARY
Figure 1: 2050, 100 percent RE Electricity Generation Mix Progression
The report estimates that total investments to the tune of US$54-US$56 billion will be necessary in the power sector to achieve the 100 percent RE scenario.
Figure 2: 2050, 100 percent RE Electricity Generation Scenario Investment Requirements
Furthermore, by 2050, the report estimates that the 100 percent RE scenario can potentially save Sri Lanka US$18-US$19 billion by avoiding the use of imported fossil fuels.
7500 9500
18500 3500 3500
6500
1530 630
3150
0
5000
10000
15000
20000
25000
30000
2016-30 2030-40 2040-50
Mill
ion
US$
Generation Transmission & Distribution Balancing support
0
5000
10000
15000
20000
25000
30000
35000
40000
2016
20
17
2018
20
19
2020
20
21
2022
20
23
2024
20
25
2026
20
27
2028
20
29
2030
20
31
2032
20
33
2034
20
35
2036
20
37
2038
20
39
2040
20
41
2042
20
43
2044
20
45
2046
20
47
2048
20
49
2050
MW
Gas Turbine Combined Cycle Oil Coal Large Hydro Wind Small Hydro Biomass Solar

13100% ELECTRICITY GENERATION THROUGH RENEWABLE ENERGY BY 2050 — ASSESSMENT OF SRI LANKA’S POWER SECTOR
Figure 3: 2050, 100 percent RE Electricity Generation Scenario Economic Savings
Finally, this report aims to act as the foundation on which further studies and analysis can be carried out to develop a concrete implementation roadmap through which the Sri Lankan power sector can achieve its goal of generating all its electricity through indigenous, renewable energy sources.
0
2000
4000
6000
8000
10000
12000
14000
16000
18000
20000 20
16
2017
20
18
2019
20
20
2021
20
22
2023
20
24
2025
20
26
2027
20
28
2029
20
30
2031
20
32
2033
20
34
2035
20
36
2037
20
38
2039
20
40
2041
20
42
2043
20
44
2045
20
46
2047
20
48
2049
20
50
Mill
ion
US$
Fuel cost avoided Cumulative fuel cost avoided

14 INTRODUCTION
2 INTRODUCTION
Sri Lanka, situated in the southeastern part of Asia, is among the fastest growing economies in South Asia in recent years. Following a 30-year civil war, Sri Lanka’s economy has grown at an average rate of 6.4 percent between 2010 and 20153, with GDP per capita rising from US$2,014 in 20084 to US$3,837 in 2015.5 The figure below illustrates Sri Lanka’s real GDP growth rate since 2008.6
Figure 4: Sri Lanka’s Real GDP Growth Rate
3 The World Bank, “Sri Lanka Overview”. Available from: https://www.worldbank.org/en/country/srilanka/over-view#1.
4 Central Bank of Sri Lanka, Economic and Social Statistics of Sri Lanka 2012, (Colombo, 2012). Available from: http://www.cbsl.gov.lk/pics_n_docs/10_pub/_docs/statistics/other/econ_&_ss_2012.pdf.
5 Department of Census and Statistics, Sri Lanka, Data Sheet, 2016. Available from http://www.statistics.gov.lk/DataSheet/2016DataSheetEnglish.pdf.
6 Department of Census and Statistics, Sri Lanka, Data Sheet, 2016. Available from http://www.statistics.gov.lk/nas-tional_accounts/dcsna_r2/reports/revision_triangle_gdp.pdf and http://www.statistics.gov.lk/national_accounts/Press%20Release/2015ANNUAL.pdf.
6
3.5
8 8.3 9.1
3.4
4.9 4.8
2008 2009 2010 2011 2012 2013 2014 2015

15100% ELECTRICITY GENERATION THROUGH RENEWABLE ENERGY BY 2050 — ASSESSMENT OF SRI LANKA’S POWER SECTOR
Sri Lanka’s economy has transitioned from a predominantly rural agrarian economy to an urbanized economy driven by services. In 2015, the Sri Lankan service sector accounted for 62.4 percent of GDP, followed by the manufacturing sector (28.9 percent) and agriculture sector (8.7 percent).7
A corollary of economic growth has been the increasing demand for energy in the country.8 This demand is expected to continue to grow as Sri Lanka pursues economic growth and development.
Figure 5: Sri Lanka Total Energy Demand
Energy Mix and Emissions Profile
Sri Lanka’s energy demand is currently being catered to by several energy sources consisting of both indigenous non-fossil fuels and imported fossil fuels. Most of the country’s energy needs are met through biomass, an indigenous fuel source, and imported fossil fuels, such as petroleum and coal. The remainder is made up of other indigenous sources which, include large hydro and renewables such as solar, small hydro and wind.9
Figure 6: Sri Lanka Primary Energy Mix (2015)
7 The World Bank, “Sri Lanka Overview”. Available from: https://www.worldbank.org/en/country/srilanka/over-view#1.
8 SLSEA, “Sri Lanka Energy Balance”, 2014. Available from: http://www.info.energy.gov.lk/.9 SLSEA, “Sri Lanka Energy Balance”, 2014. Available from: http://www.info.energy.gov.lk/.
337.40
373.76 382.01
372.86 382.52
416.58
300
320
340
360
380
400
420
440
2005 2011 2012 2013 2014 2015
Peta
joul
es
Biomass 39%
Petroleum 39%
Hydro 9%
Coal 10%
New Renewable Energy3%
16 INTRODUCTION
However, with increasing demand, Sri Lanka has had to increase its dependence on costly imported fossil fuels (49 percent of the total energy mix).10 The transport and electricity generation sectors in particular are primarily driven by fossil fuels.
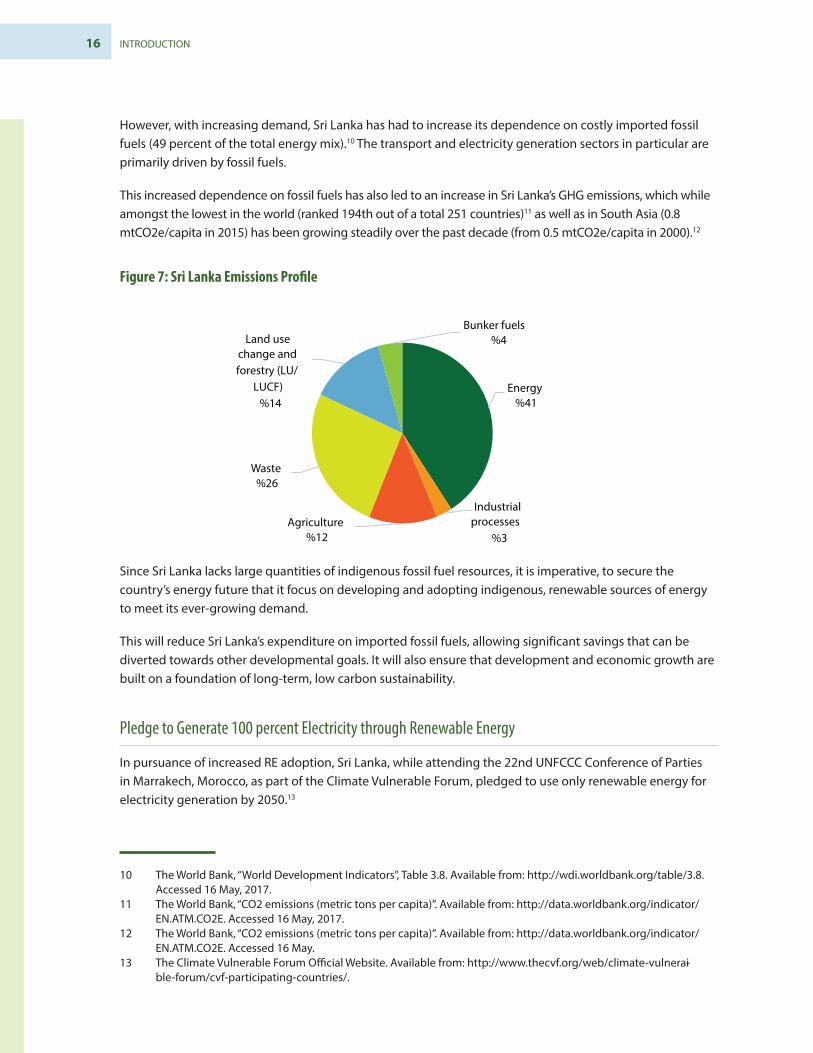
This increased dependence on fossil fuels has also led to an increase in Sri Lanka’s GHG emissions, which while amongst the lowest in the world (ranked 194th out of a total 251 countries)11 as well as in South Asia (0.8 mtCO2e/capita in 2015) has been growing steadily over the past decade (from 0.5 mtCO2e/capita in 2000).12
Figure 7: Sri Lanka Emissions Profile
Since Sri Lanka lacks large quantities of indigenous fossil fuel resources, it is imperative, to secure the country’s energy future that it focus on developing and adopting indigenous, renewable sources of energy to meet its ever-growing demand.
This will reduce Sri Lanka’s expenditure on imported fossil fuels, allowing significant savings that can be diverted towards other developmental goals. It will also ensure that development and economic growth are built on a foundation of long-term, low carbon sustainability.
Pledge to Generate 100 percent Electricity through Renewable Energy
In pursuance of increased RE adoption, Sri Lanka, while attending the 22nd UNFCCC Conference of Parties in Marrakech, Morocco, as part of the Climate Vulnerable Forum, pledged to use only renewable energy for electricity generation by 2050.13
10 The World Bank, “World Development Indicators”, Table 3.8. Available from: http://wdi.worldbank.org/table/3.8. Accessed 16 May, 2017.
11 The World Bank, “CO2 emissions (metric tons per capita)”. Available from: http://data.worldbank.org/indicator/EN.ATM.CO2E. Accessed 16 May, 2017.
12 The World Bank, “CO2 emissions (metric tons per capita)”. Available from: http://data.worldbank.org/indicator/EN.ATM.CO2E. Accessed 16 May.
13 The Climate Vulnerable Forum Official Website. Available from: http://www.thecvf.org/web/climate-vulnerai-ble-forum/cvf-participating-countries/.
Energy %41
Industrial processes
%3 Agriculture
%12
Waste %26
Land use change and forestry (LU/
LUCF) %14
Bunker fuels %4

17100% ELECTRICITY GENERATION THROUGH RENEWABLE ENERGY BY 2050 — ASSESSMENT OF SRI LANKA’S POWER SECTOR
Figure 8: Sri Lanka Electricity Generation Mix Trend (2011-15)
As seen in Figure 8, Sri Lanka in the recent past has been and still is primarily dependent on fossil fuels for generation of electricity. In 2014, Sri Lanka met its target of generating at least 10 percent of its electricity using renewable energy, as set by the National Energy Policy and Strategies of Sri Lanka (NEPS).14 Subsequently, in 2015, Sri Lanka saw a decrease in the contribution of fossil fuels to the electricity mix, along with a rise in the contribution of both RE and large hydro.
Even with these increases in adoption of renewable energy, 52 percent of Sri Lanka’s total electricity generation mix in 2015 (Figure 8) was made up of fossil fuels. As part of its Energy Sector Development Plan for a Knowledge-based Economy (2015-2025)15 Sri Lanka aims to become energy self-sufficient by 2030. It intends to do so using indigenous natural gas and large hydro along with renewable sources of energy. Thus, this target of 100 percent electricity generation purely through renewables by 2050 is highly ambitious and will constitute a big leap towards achieving climate sustainability for the country.
In addition to the 100 percent RE pledge, Sri Lanka’s Nationally Determined Contributions (NDC) re-submitted to the UNFCCC on 25 April 2016, enumerated various targets aimed at increasing the adoption of renewable and sustainable forms of energy. Highlights of Sri Lanka’s energy sector NDC targets include:
■ Establishing large scale wind power farms (514 MW), replacing planned thermal power plants generating equivalent amounts of electricity;
■ Broadening the solar power electricity generation capacity of the country with increased participation by the private sector and adoption of advanced technology available around the world. Sri Lanka aims to establish solar power plants with a capacity of up to 115 MW;
14 Ministry of Power and Energy, “National Energy Policy and Strategies”. Available from: http://powermin.gov.lk/english/wp-content/uploads/documents/national_energy_policy.pdf.
15 Ministry of Power and Energy,” Sri Lanka Energy Sector Development Plan for a Knowledge-Based Economy 2015-2025”, Colombo, n.d. Available from: http ://powermin.gov.lk/sinhala/wp-content/uploads/2015/03/ENERGY_EM-POWERED_NATION_2015_2025.pdf.
3972.67 2726.72
6010.10 3649.72
4904.41
6884.01 8416.47
4819.72 7944.30
6796.42
743.18 754.43 1194.50 1254.86 1524.71
0
2000
4000
6000
8000
10000
12000
14000
2011 2012 2013 2014 2015
GW
h
Major Hydro Thermal (CEB, IPP and Hired) Renewable Energy

18 INTRODUCTION
■ Promoting use of biomass (fuel wood) and waste (municipal, industrial and agricultural) by elevating its use in power generation, adding 104.62 MW by 2025;
■ Promoting mini and micro hydro power generation projects as an environment-friendly power generation option with a targeted additional capacity of 176 MW;
■ Introducing Demand Side Management (DSM) activities to improve the load factor of the system and upgrade efficiencies at the consumer end through measures such as high efficiency fans, pumps, motors, compressors, refrigerators and Building Management Systems (BMS) for the commercial, government and domestic sector;
■ Encouraging fuel switching to biomass in industries and adoption of energy efficient and environmentally sustainable transport systems; and
■ The Government of Sri Lanka has prioritized the implementation and enforcement of sustainable energy policies to absorb more Non-Conventional Renewable Energy (NCRE) in the system, increasing its contribution to at least 50 percent by 2030.
There is thus significant political willingness in Sri Lanka to adopt indigenous, renewable energy as its primary source of energy and this report aims to be a part of the foundation being laid to help achieve this goal.
Key Challenges faced by the Sri Lankan Power Sector
While the time is right for Sri Lanka to pursue the establishment of a 100 percent RE electricity generation sector, the Sri Lankan power sector still faces multiple key challenges, highlighted below, which will need to be proactively tackled if the country wishes to be successful in achieving this target.
1. A large amount of investment is required for infrastructure development in the power sector (generation, transmission and distribution). Sri Lanka does not have the domestic capability to fund ambitious projects from commercial banks. Without support from multilaterals and foreign banks with low cost finance, it will be difficult to bolster growth.
2. Technical challenges in terms of inadequacy of ancillary systems to support the grid in a high RE scenario. High penetration of RE is likely to induce intra-day variability in power supply and this variability needs to be addressed with a strong ancillary system. As of now, grid balancing is only done through hydro plants. For the replacement of thermal capacity by renewables to be successful, Pump Storage Power Generation (PSPP) is going to be very important. PSPP will be essential for managing prominent peak and off-peak characteristics of the daily demand pattern. Without setting up the necessary ancillary infrastructure, achieving Sri Lanka’s ambitious RE targets will be difficult.
3. Non-availability of proper incentives to develop RE based capacity. At times, developing coal based capacity becomes more lucrative because of its large unit size, high plant load factor and base load operation. An integrated national energy policy formulation to support RE growth is the need of the hour.
4. Currently, the high cost of electricity from RE sources is a deterrent to development of new RE capacity. From this perspective, coal is a preferred fuel. However, with technological innovation, there is expected to be a drop in the price of RE-generated power such as solar power, which could make RE
19100% ELECTRICITY GENERATION THROUGH RENEWABLE ENERGY BY 2050 — ASSESSMENT OF SRI LANKA’S POWER SECTOR
a commercially viable option. Also, with the evolution of storage facilities, the situation may further change and skew towards the incorporation of RE.
5. Lack of local research and development to promote local capacity development: Sri Lanka has limited or negligible research facilities dedicated to the development of RE resources locally, thus creating an industry which is dependent on importing RE expertise and resources.
6. Slow development of roof-top solar due to lack of proper education among consumers and limited options for low cost finance from commercial banks. Despite having regulations promulgating the adoption of rooftop solar, Sri Lanka has been unable to produce any gainful traction in the deployment of rooftop solar in the country. One of the primary reasons for this is the high cost of rooftop solar systems, coupled with the lack of cheap financing or business models available for the public to install and use these systems.
7. As Sri Lanka’s electricity sector is largely dependent on hydro plants, any variability in the monsoon pattern hits the sector hard. Only after the requirements of domestic water consumption and irrigation are met, is permission for power generation from hydro projects granted. Though hydro plants’ plant load factor (PLF) in Sri Lanka is in the range of 50 percent, there are concerns about non-availability of capacity in the future.
For any scenario incorporating RE in the electricity generation mix to succeed in Sri Lanka, it is imperative that it address the challenges and deploy measures to mitigate them to the furthest extent possible.

20 ELECTRICITY GENERATION ASSESSMENT FRAMEWORK
3 ELECTRICITY GENERATION ASSESSMENT FRAMEWORK
A framework based approach has been adopted to assess the RE potential of Sri Lanka and develop a concrete scenario for the adoption of 100 percent RE in electricity generation. This framework is illustrated below.
Figure 9: Electricity generation assessment framework
Assessment of electricity demand
Assess resources potential (Solar, Wihnd, Hydro, etc.)
Evaluate investment for project development and transmission
Assess financing requirement to support growth
Assess policy requirement, de-risking mechanism. Evaluate requirement of financial instruments.
Determine the capacity mix by energy balancing
Develop ancillary services for balancing
Assess supply profile for each type of technology
Identify appropriate balancing option
Evaluate daily supply and daily demand
Evaluate investment required for ancillary services
Peak demand is met (No deficity)
No
Yes

21100% ELECTRICITY GENERATION THROUGH RENEWABLE ENERGY BY 2050 — ASSESSMENT OF SRI LANKA’S POWER SECTOR
Rationale and benefits of the framework
To achieve a feasible, sustainable energy ecosystem, a robust assessment of the energy demand, peak demand and an appropriate capacity mix are important. This assessment will help determine the most viable investment options and the means to meet investment requirements. The framework is replicable to any entity (country/state/province) and follows a few key steps for assessment, as elaborated below:
Demand assessment: Future demand can be assessed by adopting an econometric model based on key assumptions like historical demand, the GDP growth rate, consumer mix, other macroeconomic variables, etc. This assessment will be central to attempts to estimate future capacity addition and investment required.
Resource assessment: The potential of different energy resources in a specific country/region needs to be evaluated to decide on the optimal energy mix. It is also important to assess the timeline and extent of exploitation possible for any kind of resource. This assessment should account for t future technology evolution and emerging trends (e.g. the evolution of storage technology may significantly affect the adoption trend of solar energy).
Generation mix assessment: Based on the demand profile, resource availability and the country’s strategic priorities, an optimal energy mix needs to be evaluated. Strategic priorities would include the country’s strategy on cost of generation, the NDC commitment and commitment towards environment and sustainable development. This assessment will also consider the existing energy mix and retirement of existing plants over the coming years.
Peak demand and balancing requirement assessment: Once the demand profile and generation mix are broadly decided, assessment is required to evaluate the potential for peak demand management with the existing portfolio. With an increasing RE proportion, generation influx will be intermittent and the country may face challenges meeting the peak requirement during early morning and evening. This may require additional balancing arrangements (storage, flywheel, spinning reserve etc.) to support the grid requirement.
Investment assessment: Based on the energy mix and balancing requirement, the investment required for project development, transmission infrastructure and ancillary systems for grid balancing needs to be evaluated.
While this framework depicts a simplified structure, the actual demand-supply scenario may be greatly affected by changes in the technology landscape and consumption patterns. For example, the penetration of electric vehicles, the evolution of storage technology and focus on energy efficiency are key areas which may influence generation and consumption.

22 THE 2050, 100 PERCENT RENEWABLE ENERGY ELECTRICITY GENERATION SCENARIO
THE 2050, 100 PERCENT RENEWABLE ENERGY ELECTRICITY GENERATION SCENARIO
Sri Lanka has historically looked towards the least expensive option to generate power to hold down costs for consumers. High power costs and cross subsidies are the two key factors driving the costs of coal-based generation significantly lower than the cost of power generation by a corresponding NCRE source. One of the primary reasons for the apparently low cost of fossil-fuel based power plants is that their environmental costs are not considered. Inclusion of cost of carbon, soil degradation, air-quality-related issues and other externalities will present a different scenario. The Sri Lankan government)) meanwhile continues to pursue the development and expansion of a coal-based power generation sector. Additionally, the potential loss of subsidies for poor households is a major barrier to the increased, faster uptake of NCRE power generation, especially through solar energy.
At current rates, the levelized cost of power generated from solar plants costs16 is LKR 22-25/kWh,17 while power generated from coal based stations costs LKR 9-15/kWh. At the consumer end of the equation, for small scale users, consuming anywhere between 1 to 60 kWh per month, electricity costs LKR 7.85/kWh. Large household consumers on the other hand, that is those consuming above 180 kWh, pay LKR 45/kWh.18 Therefore, at current prices, increased penetration of RE would further increase the burden on high end consumers as producers are likely to pass on the costs to them instead of to small scale users. Thus, in today’s scenario, coal-based stations are the more viable and profitable option for both producers and consumers in Sri Lanka.
The 100 percent RE electricity generation scenario thus needs to recognize the high costs of RE- generated power in Sri Lanka today and accordingly propose a scenario that not only fulfills Sri Lanka’s electricity demand through clean energy but does so in a cost-effective manner that does not increase the burden on the end consumer.
16 The levelized cost of electricity (LCOE) is the net present value of the unit-cost of electricity over the lifetime of a generating asset.
17 Ceylon Electricity Board (CEB), Long Term Generation Expansion Plan 2015-2034, 2015. Available from http://pucsl.gov.lk/english/wp-content/uploads/2015/09/Long-Term-Generation-Plan-2015-2034-PUCSL.pdf.
18 CEB, Ceylon Electricity Board, “Statistical Report”, 2016. Available from: http://www.ceb.lk/publications/.
4

23100% ELECTRICITY GENERATION THROUGH RENEWABLE ENERGY BY 2050 — ASSESSMENT OF SRI LANKA’S POWER SECTOR
Power Sector Demand Assessment (2050)
By 2050, Sri Lanka’s electricity generation demand is likely to increase fivefold to ~70,000 GWh from ~14,000 GWh in 2016.19
Figure 10: Future electricity demand forecast in Sri Lanka
Even though Sri Lanka has abundant potential for harnessing wind and solar energy, a proper mix is required to meet the evening peak demand, when solar energy will not be available. Also, to achieve 100 percent RE, a significant amount of supporting infrastructure development will be required. Currently, the capacity utilization levels of RE sources are much lower than conventional sources and significant investment will be required for capacity development and the establishment of supporting balancing infrastructure. The following sections explore the key facets of a potential RE capacity mix and its corresponding investment requirements.
100 percent RE Power Sector Electricity Generation Mix (2050)
As detailed in Annex G: The CEB Demand Assessment and Generation Planning, the electricity generation roadmap laid down by Sri Lanka’s Long Term Generation Expansion Plan 2015-34 (LTGEP) is unlikely to come to fruition. With proper policy initiatives and incentives in place, the gap created between electricity demand and generation can be bridged with NCRE sources. Following the replacement of coal-based power plants with NCRE sources, Sri Lanka can continue towards 100 percent electricity generation using RE by 2050 by gradually phasing out all its fossil fueled power plants in favour of RE electricity generation sources.
Though it may not be feasible to decommission all coal based plants immediately, new capacity addition can be limited to help meet morning and evening deficits in the early years of the 100 percent RE scenario.
19 The CEB has estimated demand for Sri Lanka to 2034 based on an econometric model. Demand for 2035-50 has been estimated by extrapolating the demand at a rate equal to the CAGR for the period 2020-34,~4.8 percent.
0
20000
40000
60000
80000
2016 2020 2025 2030 2035 2040 2045 2050
GW
h

24 THE 2050, 100 PERCENT RENEWABLE ENERGY ELECTRICITY GENERATION SCENARIO
Presented below is the electricity generation scenario that has been developed to showcase the plausible pathway Sri Lanka can take to increase the adoption of NCRE to 100 percent in its electricity generation mix, with a concurrent decrease and eventual phase out of fossil fuels from the generation mix, especially coal.
Table 1: Sri Lanka 2050 Electricity Generation Mix: 100 percent RE
Year Electricity Generating Capacity (MW)
GT CC Oil Coal LH Wind SH Biomass Solar NCRE Total
2016 178 594 307 825 1335 124 313 34 16 487 3726
2017 113 594 307 825 1490 144 338 49 31 562 3891
2018 183 594 256 825 1490 244 363 74 46 727 4075
2019 218 594 186 825 1490 442 388 99 219 1148 4461
2020 218 594 96 825 1536 690 413 124 392 1619 4888
2021 218 594 96 825 1536 887 438 129 563 2017 5286
2022 218 594 96 825 1576 1073 458 129 721 2380 5689
2023 105 594 61 825 1576 1356 473 134 998 2962 6123
2024 105 594 61 1125 1576 1200 483 144 850 2677 6138
2025 105 594 26 1125 1576 1449 493 149 900 2991 6417
2026 105 594 26 1125 1576 1698 508 154 1279 3639 7065
2027 105 594 26 1425 1576 1500 543 164 1060 3267 6993
2028 105 594 26 1425 1576 1784 578 174 1356 3892 7618
2029 105 594 26 1425 1576 2046 618 184 1639 4487 8213
2030 105 594 26 1425 1576 2313 653 194 1950 5110 8836
2031 105 594 26 1425 1576 2620 658 204 2284 5766 9492
2032 105 594 26 1425 1576 2935 663 214 2628 6440 10166
2033 105 270 26 1425 1576 3586 668 224 3362 7840 11242
2034 105 270 26 1425 1576 3928 673 234 3736 8571 11973
2035 105 270 26 1425 1576 4308 678 244 4156 9386 12788
2036 105 270 26 1425 1576 4707 683 254 4598 10242 13644
2037 105 270 26 1425 1576 5127 688 264 5063 11141 14543
2038 105 270 26 1425 1576 5567 693 274 5552 12085 15487
2039 105 270 26 1425 1576 6029 698 284 6066 13077 16479
2040 105 270 26 1425 1576 6513 703 294 6608 14118 17520
2041 105 270 26 1150 1576 7396 708 304 7612 16019 19146
2042 105 270 26 1150 1576 7930 713 314 8210 17167 20294
2043 105 270 26 875 1576 8863 718 324 9274 19180 22032

25100% ELECTRICITY GENERATION THROUGH RENEWABLE ENERGY BY 2050 — ASSESSMENT OF SRI LANKA’S POWER SECTOR
Year Electricity Generating Capacity (MW)
GT CC Oil Coal LH Wind SH Biomass Solar NCRE Total
2044 105 270 26 875 1576 9452 723 334 9936 20445 23297
2045 105 270 26 600 1576 10442 728 344 11066 22581 25158
2046 0 0 0 0 1576 12227 733 354 13122 26436 28012
2047 0 0 0 0 1576 12907 738 364 13890 27899 29475
2048 0 0 0 0 1576 13621 743 374 14698 29436 31012
2049 0 0 0 0 1576 14370 748 384 15546 31048 32624
2050 0 0 0 0 1576 15155 753 394 16438 32740 34316
GT: Gas TurbineCC: Combine CycleLH: Large HydroSH: Small HydroNCRE: Non-Conventional Renewable Energy
Figure 11 below charts the growth of NCRE in Sri Lanka’s electricity generation mix through the 100 percent RE scenario from 2016 to 2050.
Figure 11: Sri Lanka 2050 electricity generation mix: 100 percent RE
Gas Turbine Combined Cycle Oil Coal Large Hydro Wind Small Hydro Biomass Solar
0
5000
10000
15000
20000
25000
30000
35000
40000
2016
20
17
2018
20
19
2020
20
21
2022
20
23
2024
20
25
2026
20
27
2028
20
29
2030
20
31
2032
20
33
2034
20
35
2036
20
37
2038
20
39
2040
20
41
2042
20
43
2044
20
45
2046
20
47
2048
20
49
2050
MW

26 THE 2050, 100 PERCENT RENEWABLE ENERGY ELECTRICITY GENERATION SCENARIO
This generation mix has been developed based on a few key assumptions, presented below.
Demand
2016-34: Demand is as estimated by the CEB and reported in the LTGEP. An econometric model has been considered for demand estimation.
2035-50: Electricity demand for 2035-50 is estimated at a CAGR of 4.8 percent, extrapolated from the 2020-34 CAGR.
Plant Load Factor (on average)
Table 2: Assumed generation source PLF
Generation Source PLF (%) Assumption
Gas Turbine 20 Assumed to be peaking power only. SL’s performance in 2015.
Oil Based
Combine Cycle 50 Assumed.
Coal 60 SL’s performance in 2014 and 2015.
Large Hydro 40 Historical values of SL.
Small Hydro 39
Wind 30 Standard off-shore wind PLF.
Biomass 70 CEB assumption.
Solar 17 Standard solar PLF.
Fossil fuel capacity addition
According to the current LTGEP, two sub-critical20 coal units of 300 MW capacity are probably going to be commissioned, in 2024 and 2027 respectively. As part of the 100 percent RE scenario, for the early years of the plan, this coal capacity will be used as the base load instead of RE, while storage will be used as a peaking source. Since pump storage cannot be a reliable source because of seasonal variances, and by 2025, battery storage may not have emerged as an economical grid scale solution, widespread use of RE, especially as a viable base load, will not be possible in the early years of the proposed scenario, thus necessitating the use of fossil fuel based power for that period. Any additional RE or coal power generated throughout the day will be stored in the small amounts of battery capacity that will be economically viable at that time. This storage, coupled with the base coal capacity, will serve to meet the morning and evening daily peak deficits. Following depreciations in cost, this scenario will be reversed where, with increasing, cost effective storage solutions, coal power plants will gradually stop supplying any power to the grid while RE sources take over as the eventual base load source.
20 Sub-critical coal power plants: Power plants where steam pressure is maintained below the critical point of water i.e. below 3200 pounds per square inch or 22.064 MegaPascals (MPa). It is a system with a constant evaporation endpoint.

27100% ELECTRICITY GENERATION THROUGH RENEWABLE ENERGY BY 2050 — ASSESSMENT OF SRI LANKA’S POWER SECTOR
While the model currently uses coal capacity proposed under the current LTGEP as the solution for peak deficits, Sri Lanka can consider using gas based combined cycle power plants instead as a cleaner alternative to meet the same objective.
Other energy sources
Other energy sources consist of the liquefied natural gas (LNG) based CC project as planned by CEB. The generation gap arising out of the low coal scenario will be bridged through solar and wind energy while large hydro, small hydro and biomass capacity addition are present as per the long-term generation plan.
Mix of solar and wind
The generation mix between wind and solar energy has been determined to be such that by 2050, solar energy is expected to contribute ~30 percent while wind energy will contribute ~50 percent of the total demand. The assumption is that a significant portion of domestic and commercial use will be powered by solar energy through an accelerated adoption of roof-top solar infrastructure. However, at the same time, a very high concentration of solar energy is likely to pose balancing issues for the grid and until storage facilities have evolved to become commercially viable, demand that cannot be met by solar will be primarily catered to through wind.
Apart from technologies considered in our current assessment, Sri Lanka can consider the adoption of additional, advanced RE technologies such as geothermal, wave, tidal and off-shore wind as part of 100 percent RE electricity generation scenario in the future. However, before any decisions on these technologies and their involvement in the 100 percent RE scenario are made there is a need to conduct detailed assessments to explore their feasibility and viability in Sri Lanka.
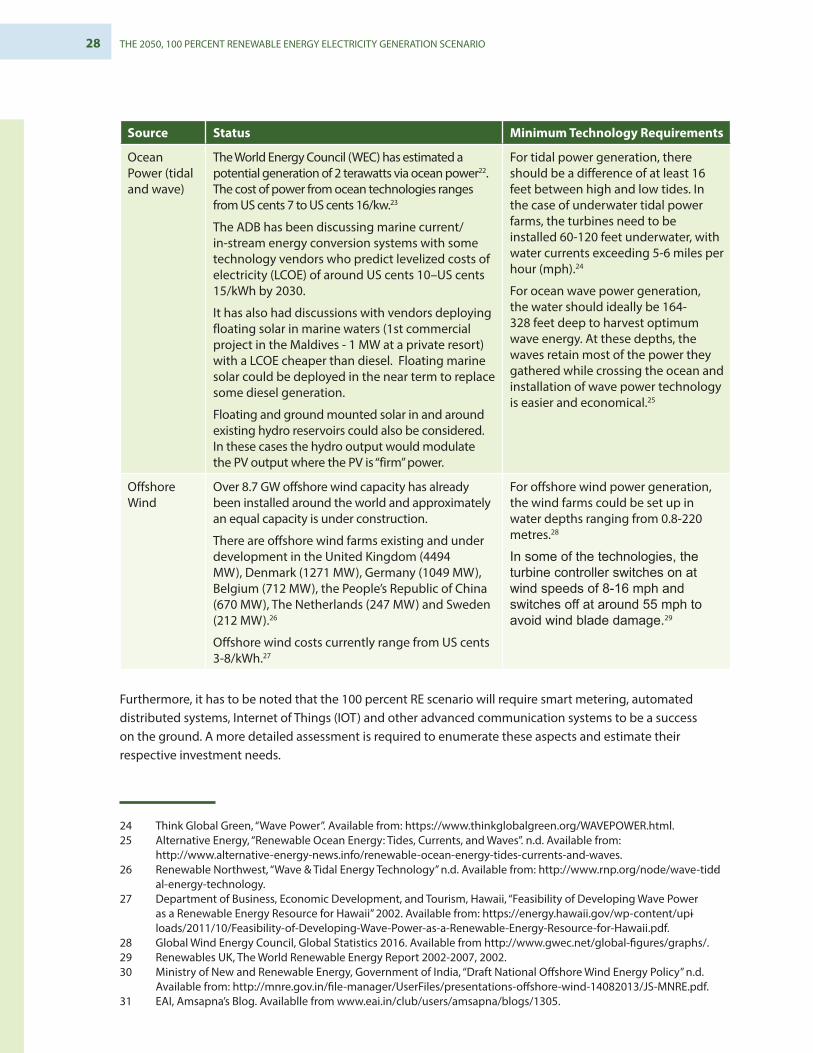
Table 3: Potential future RE technologies212223
Source Status Minimum Technology Requirements
Geothermal Power
In 2016, the global operating capacity was at 13.3 GW, led by 3.5 GW from the USA, 1.9 GW from The Philippines, 1.3 GW from Indonesia, 1.06 GW from Mexico and 0.9 GW from New Zealand.19
In the USA, a geothermal power plant costs US$3400/kW installed and can generate electricity at a cost of US$ 92/MWh (50 MW geothermal binary plant) and US$88/MWh (50 MW dual flash geothermal plant).20
Low grade geothermal resources are being used for district heating in Europe, the People’s Republic of China, and elsewhere with temperature ranges of 50 – 60oC.
The general criteria to identify potential high temperature resource areas are:
Temperature: >125°C
Depth to resource: <3 kilometres.
Ground elevation: <2,133 metres
For low temperature resource areas, the temperature criteria should be in the range of 50-125°C, with the other criteria remaining the same.21
21 Geothermal Energy Association, Annual U. S. and Global Geothermal Power Production Report, 2016. March 2016. Available from: http://geo-energy.or g/reports/2016/2016 percent 20Annual percent 20US percent 20Glob-al percent 20Geothermal percent 20Power percent 20Production.pdf.
22 Geothermal Energy Association, “Geothermal Basics-Power Plant Costs”, n.d. Available from: http://geo-energy.org/geo_basics_plant_cost.aspx.
23 GeothermEx, Inc. “Assessment of Energy Reserves and Costs of Geothermal Resources in Hawaii”, 2005. Available from http://www.geothermalcommunities.eu/assets/elearning/9.14.AssessmentOfEnergyReservesAndCostsOf-GeothermalResourcesInHawaii.pdf.
28 THE 2050, 100 PERCENT RENEWABLE ENERGY ELECTRICITY GENERATION SCENARIO
Source Status Minimum Technology Requirements
Ocean Power (tidal and wave)
The World Energy Council (WEC) has estimated a potential generation of 2 terawatts via ocean power22. The cost of power from ocean technologies ranges from US cents 7 to US cents 16/kw.23
The ADB has been discussing marine current/in-stream energy conversion systems with some technology vendors who predict levelized costs of electricity (LCOE) of around US cents 10–US cents 15/kWh by 2030.
It has also had discussions with vendors deploying floating solar in marine waters (1st commercial project in the Maldives - 1 MW at a private resort) with a LCOE cheaper than diesel. Floating marine solar could be deployed in the near term to replace some diesel generation.
Floating and ground mounted solar in and around existing hydro reservoirs could also be considered. In these cases the hydro output would modulate the PV output where the PV is “firm” power.
For tidal power generation, there should be a difference of at least 16 feet between high and low tides. In the case of underwater tidal power farms, the turbines need to be installed 60-120 feet underwater, with water currents exceeding 5-6 miles per hour (mph).24
For ocean wave power generation, the water should ideally be 164-328 feet deep to harvest optimum wave energy. At these depths, the waves retain most of the power they gathered while crossing the ocean and installation of wave power technology is easier and economical.25
Offshore Wind
Over 8.7 GW offshore wind capacity has already been installed around the world and approximately an equal capacity is under construction.
There are offshore wind farms existing and under development in the United Kingdom (4494 MW), Denmark (1271 MW), Germany (1049 MW), Belgium (712 MW), the People’s Republic of China (670 MW), The Netherlands (247 MW) and Sweden (212 MW).26
Offshore wind costs currently range from US cents 3-8/kWh.27
For offshore wind power generation, the wind farms could be set up in water depths ranging from 0.8-220 metres.28
In some of the technologies, the turbine controller switches on at wind speeds of 8-16 mph and switches off at around 55 mph to avoid wind blade damage.29
Furthermore, it has to be noted that the 100 percent RE scenario will require smart metering, automated distributed systems, Internet of Things (IOT) and other advanced communication systems to be a success on the ground. A more detailed assessment is required to enumerate these aspects and estimate their respective investment needs.2425262728293031
24 Think Global Green, “Wave Power”. Available from: https://www.thinkglobalgreen.org/WAVEPOWER.html.25 Alternative Energy, “Renewable Ocean Energy: Tides, Currents, and Waves”. n.d. Available from:
http://www.alternative-energy-news.info/renewable-ocean-energy-tides-currents-and-waves.26 Renewable Northwest, “Wave & Tidal Energy Technology” n.d. Available from: http://www.rnp.org/node/wave-tidd-
al-energy-technology.27 Department of Business, Economic Development, and Tourism, Hawaii, “Feasibility of Developing Wave Power
as a Renewable Energy Resource for Hawaii” 2002. Available from: https://energy.hawaii.gov/wp-content/upi-loads/2011/10/Feasibility-of-Developing-Wave-Power-as-a-Renewable-Energy-Resource-for-Hawaii.pdf.
28 Global Wind Energy Council, Global Statistics 2016. Available from http://www.gwec.net/global-figures/graphs/.29 Renewables UK, The World Renewable Energy Report 2002-2007, 2002.30 Ministry of New and Renewable Energy, Government of India, “Draft National Offshore Wind Energy Policy” n.d.
Available from: http://mnre.gov.in/file-manager/UserFiles/presentations-offshore-wind-14082013/JS-MNRE.pdf.31 EAI, Amsapna’s Blog. Availablle from www.eai.in/club/users/amsapna/blogs/1305.

29100% ELECTRICITY GENERATION THROUGH RENEWABLE ENERGY BY 2050 — ASSESSMENT OF SRI LANKA’S POWER SECTOR
5 ECONOMIC AND GENERATION MIX RATIONALE
The rationale behind the 100 percent RE scenario primarily arose from Sri Lanka’s intention to increase the share of renewable energy in its electricity generation mix by the end of the next decade, thereby gaining a measure of energy security. This drive has taken place against a background of growing social resistance to installation of new coal based power plants in the country.
While the CEB’s long-term generation planning is based on the “least cost principle” and has focused on significant coal based capacity, the government and the Public Utilities Commission (PUCSL) is committed to the adoption of more RE-based capacity for the future. The PUCSL had recently criticized the LTGEP proposed by the CEB, claiming that it did not focus much on the promotion of renewable energy technologies.32
Given the shifting focus towards the development of a greener economy we have developed a scenario to present a plausible 100 percent RE electricity generation mix in Sri Lanka’s power sector, substituting generation through fossil-fueled, especially coal-based power plants.
Economic Rationale
Sri Lanka does not have an abundant supply of fossil fuel deposits, relying heavily on the import of fossil fuels, which results in high import costs. Historically, Sri Lanka has imported 46-50 percent of its total energy used.33 This is a major burden on the economy, which can be offset by shifting focus to renewable energy sources.
If commissioning of coal based capacity is avoided, it would result in significant potential savings in terms of fuel cost avoidance. By 2050, the 100 percent RE scenario can potentially save US$18-US$19 billion on imported coal as compared with the base case scenario, which relies heavily on coal.
32 https://cleantechnica.com/2016/02/25/sri-lanka-targets-100-renewable-energy-share-2030/.33 http://databank.worldbank.org/data/reports.aspx.

30 ECONOMIC AND GENERATION MIX RATIONALE
Figure 12: Economic savings from fuel cost avoidance
The savings would increase substantially as we move towards 2050. According to the base case scenario, RE will contribute 20 percent of the total generation while coal will contribute ~50 percent. The 100 percent RE scenario envisages 100 percent generation through non-fossil fuels (including large hydro) by 2050, while all coal and gas plants will gradually be decommissioned by 2045. The table below presents a comparison between the base case scenario and the 100 percent RE scenario showcasing the potential economic gains from avoidance of coal based generation.
Table 4: Fuel costs avoided
Year Coal generation (GWh) Coal generation
avoided (GWh)
Fuel cost avoided (US$
million)
Cumulative fuel cost
avoided (US$ million)
Base case Scenario
100 % RE Scenario (by 2050)
2016 4183 4755 0 0.00 0.00
2017 4402 4755 0 0.00 0.00
2018 4644 4755 0 0.00 0.00
2019 5317 4755 562 20.91 20.91
2020 5651 4755 896 33.32 54.23
2021 6213 4755 1458 54.24 108.46
2022 6731 4755 1976 73.49 181.95
2023 7642 4755 2887 107.40 289.35
2024 8381 6485 1896 70.55 359.90
Fuel cost avoided Cumulative fuel cost avoided
0
5000
10000
15000
20000
2016
20
17
2018
20
19
2020
20
21
2022
20
23
2024
20
25
2026
20
27
2028
20
29
2030
20
31
2032
20
33
2034
20
35
2036
20
37
2038
20
39
2040
20
41
2042
20
43
2044
20
45
2046
20
47
2048
20
49
2050
Mill
ion
US$

31100% ELECTRICITY GENERATION THROUGH RENEWABLE ENERGY BY 2050 — ASSESSMENT OF SRI LANKA’S POWER SECTOR
Year Coal generation (GWh) Coal generation
avoided (GWh)
Fuel cost avoided (US$
million)
Cumulative fuel cost
avoided (US$ million)
Base case Scenario
100 % RE Scenario (by 2050)
2025 9219 6485 2734 101.70 461.60
2026 10206 6485 3722 138.44 600.05
2027 11127 8214 2914 108.39 708.43
2028 12149 8214 3936 146.41 854.84
2029 13144 8214 4930 183.41 1038.25
2030 14250 8214 6036 224.53 1262.79
2031 15436 8214 7222 268.66 1531.45
2032 16587 8214 8373 311.49 1842.94
2033 19172 8214 10958 407.63 2250.56
2034 20366 8214 12152 452.05 2702.62
2035 21365 8214 13152 489.24 3191.86
2036 22414 8214 14200 528.24 3720.10
2037 23513 8214 15299 569.14 4289.24
2038 24666 8214 16452 612.03 4901.27
2039 25875 8214 17661 657.00 5558.27
2040 27143 8214 18929 704.16 6262.43
2041 28472 6629 21844 812.59 7075.01
2042 29867 6629 23238 864.45 7939.46
2043 31329 5044 26285 977.80 8917.26
2044 32862 5044 27818 1034.83 9952.09
2045 34469 3458 31011 1153.60 11105.70
2046 36155 0 36155 1344.97 12450.67
2047 37923 0 37923 1410.74 13861.41
2048 39777 0 39777 1479.71 15341.12
2049 41721 0 41721 1552.03 16893.15
2050 43760 0 43760 1627.87 18521.01
Total Potential Savings (US$million) 18,521.01
As far as savings from oil-based plants are concerned, the LTGEP base case scenario stops any significant addition of oil based plants by 2020. In the base case, from 307 MW in 2016, oil-based capacity was supposed fall to 96 MW in 2020 and 26 MW in 2025. Subsequently, the 100 percent RE scenario has also kept a minimum 26 MW of oil based capacity. Therefore, the 100 percent RE scenario will not yield any extra savings when it comes to removal of oil based capacity from the mix.
32 ECONOMIC AND GENERATION MIX RATIONALE
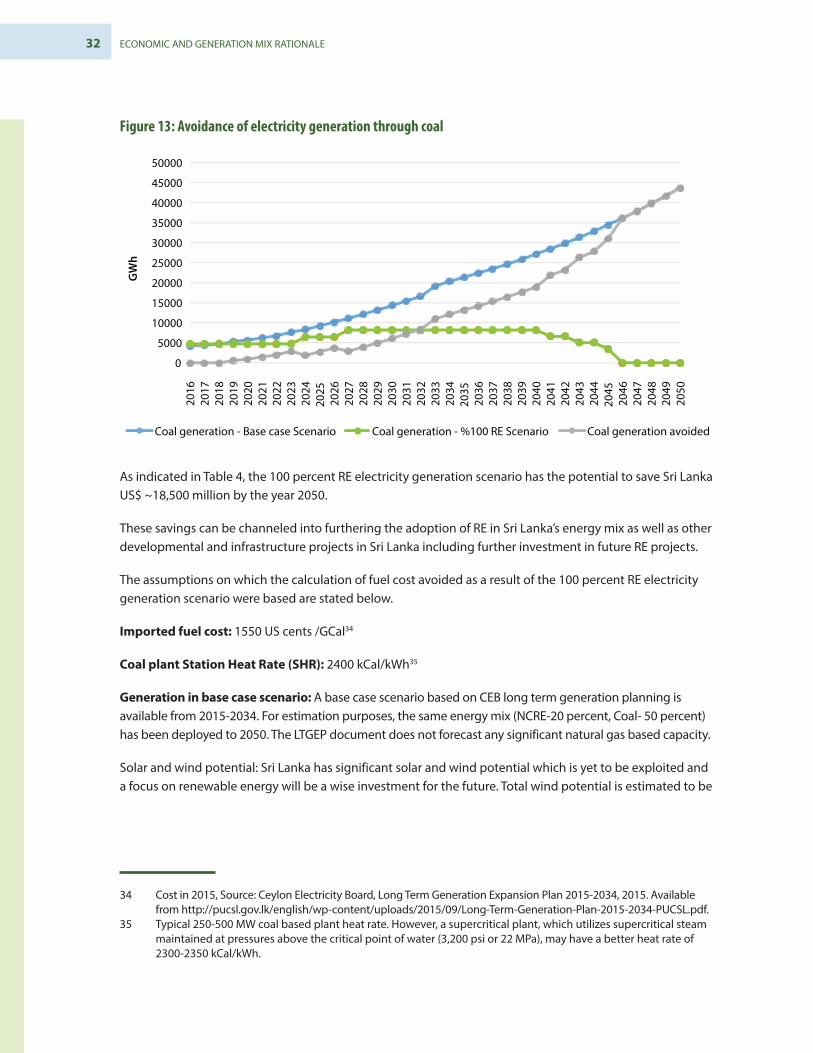
Figure 13: Avoidance of electricity generation through coal
As indicated in Table 4, the 100 percent RE electricity generation scenario has the potential to save Sri Lanka US$ ~18,500 million by the year 2050.
These savings can be channeled into furthering the adoption of RE in Sri Lanka’s energy mix as well as other developmental and infrastructure projects in Sri Lanka including further investment in future RE projects.
The assumptions on which the calculation of fuel cost avoided as a result of the 100 percent RE electricity generation scenario were based are stated below.
Imported fuel cost: 1550 US cents /GCal34
Coal plant Station Heat Rate (SHR): 2400 kCal/kWh35
Generation in base case scenario: A base case scenario based on CEB long term generation planning is available from 2015-2034. For estimation purposes, the same energy mix (NCRE-20 percent, Coal- 50 percent) has been deployed to 2050. The LTGEP document does not forecast any significant natural gas based capacity.
Solar and wind potential: Sri Lanka has significant solar and wind potential which is yet to be exploited and a focus on renewable energy will be a wise investment for the future. Total wind potential is estimated to be
34 Cost in 2015, Source: Ceylon Electricity Board, Long Term Generation Expansion Plan 2015-2034, 2015. Available from http://pucsl.gov.lk/english/wp-content/uploads/2015/09/Long-Term-Generation-Plan-2015-2034-PUCSL.pdf.
35 Typical 250-500 MW coal based plant heat rate. However, a supercritical plant, which utilizes supercritical steam maintained at pressures above the critical point of water (3,200 psi or 22 MPa), may have a better heat rate of 2300-2350 kCal/kWh.
0
5000
10000
15000
20000
25000
30000
35000
40000
45000
50000
2016
20
17
2018
20
19
2020
20
21
2022
20
23
2024
20
25
2026
20
27
2028
20
29
2030
20
31
2032
20
33
2034
20
35
2036
20
37
2038
20
39
2040
20
41
2042
20
43
2044
20
45
2046
20
47
2048
20
49
2050
GW
h
Coal generation - Base case Scenario Coal generation - %100 RE Scenario Coal generation avoided

33100% ELECTRICITY GENERATION THROUGH RENEWABLE ENERGY BY 2050 — ASSESSMENT OF SRI LANKA’S POWER SECTOR
20000 MW, while the average annual solar radiation is estimated at 4.5-6.0 kWh/sq.mtr/day.36 Additionally, this shift will also mitigate the risk of commodity price and currency fluctuations, which further strengthens the business case for a high RE scenario.
Solar Rationale
The 100 percent RE scenario has also been designed with a significant degree of reliance on solar energy to bridge the generation gap, based on the following line of reasoning.
Costs of solar panels and equipment are expected to fall in the future
While the cost of power from solar energy may not yet be cost effective, solar PV costs have declined more than 75 percent over the last 10 years37. This reduction has been due to multiple factors such as falling raw material costs (especially silicon costs), technology improvements, increasing efficiency and rising scale of solar PV installations across the world. The “learning curve” effect is expected to continue to influence the cost trajectory of solar PV. The photovoltaic learning curve, based on empirical evidence collected over the last 35 years, suggests that the learning rate38 is going to be around 23 percent 39. While future learning rates might be lower than historical rates, some of the cost reduction drivers will be as follows.
Efficient use of materials: Reductions in costs can be achieved using thinner wafers and better recycling of consumables using diamond wire technologies. Some companies are also working on direct conversion of polysilicon into wafers without ingot slicing, which could substantially reduce overall wafer costs. An expected reduction in silver consumption from 100 µg to 40 µg per cell by 2025, because of new developments in pastes and screens (10 percent of non-silicon cell price), is also likely to contribute towards cost reduction. Moreover, in cells, substitution of silver with copper and replacement of aluminum frames in modules with plastic or other cheaper materials will also help reduce costs.
Cell Efficiency: A major factor that will influence the reduction of solar panel costs is the efficiency of solar cells. The last few years have seen an annual improvement in average efficiency by around 0.5 percent. 40 This is
36 Wickramasinghe, T.A., and M. Narayana, “Solar and Wind Resource Assessment in Sri Lanka”, National Engineering Research & Development Centre of Sri Lanka, n.d. Available from: http://nerdc.nsf.ac.lk/bitstream/handle/1/25/Soalr%20and%20wind%20resources.pdf?sequence=1.
37 International Renewable Energy Agency (IRENA), Renewable Power Generation Costs in 2014, 2015.Available from: https://www.irena.org/DocumentDownloads/Publications/IRENA_RE_Power_Costs_2014_report.pdf.
38 Learning Rate: A learning rate is derived from a “Learning Curve”, or experience curve, which is a log-linear equa-tion relating the unit cost of a technology to its cumulative installed capacity or electricity generated. Learning rate can be defined as the rate at which the unit cost of electricity generated by a particular technology (for ex-ample, solar PV) decreases (positive value) or increases (negative value) with increased experience in deployment of said technology.
39 Fraunhofer ISE, Current and Future Cost of Photovoltaics. Long-term Scenarios for Market Development, System Prices and LCOE of Utility-Scale PV Systems. Study on behalf of Agora Energiewende, 2015. Available from: http://www.fvee.de/fileadmin/publikationen/weitere_publikationen/15_AgoraEnergiewende-ISE_Current_and_Fu-ture_Cost_of_PV.pdf.
40 Kelly-Detwiler, Peter, “As Solar Panel Efficiencies Keep Improving, It’s Time To Adopt Some New Metrics,” Forbes, 16 July, 2013. http://www.forbes.com/sites/peterdetwiler/2013/07/16/as-solar-panel-efficiencies-keep-improving-its-time-to-adopt-some-new-metrics/#8f4693d49d76.

34 ECONOMIC AND GENERATION MIX RATIONALE
expected to continue as the theoretical efficiency of a single junction silicon solar panels is around 29-31 percent compared with current average multi-crystalline silicon solar panel efficiencies of 16-17 percent. Some solar panel producers are already commercially shipping panels with 20-22 percent efficiency.41 Improvement in efficiencies may also occur through better cell printing technologies and improvement in cell to module power ratio.
The use of new technologies such as micro-inverters accompanied by an increase in system voltages will also help increase the power output efficiencies of solar panels. Use of multi-junction solar cells can further increase the efficiency to ~30-50 percent. However, the costs of such panels will have to be reduced to make them commercially competitive with silicon panels. It is also possible that a technology breakthrough in the use of organic materials or thin film technology could lead to an earlier than expected reduction in costs.42
Solar Inverters: The price of solar inverters has also decreased substantially from around US$100 cents/watt in 1990 to less than 9 US cents /watt today. The learning curve effect for solar inverters based on empirical data evidence from the last 25 years has been 19 percent. Like solar modules, solar inverter prices are expected to keep falling because of the use of more efficient materials, improved circuit design and better power semiconductors.43 Our base case scenario for solar inverter prices is around US¢5-7 cents/watt by 2025.
Balance of System (BOS) components: The primary improvement in Balance of System (BOS) costs will come indirectly through an increase in solar panel efficiency. Labour, mounting structure, land and fencing costs, tend to fall with module efficiency improvements. A doubling of module efficiency could effectively lead to a 50 percent decrease in the above costs. Use of other components such as electrical and cabling will also reduce because of increased module efficiency. Other factors that can contribute to a decline in BOS costs are the use of cheaper raw material substitutes, better design, increased scale of solar power plants and automation. Our base case scenario for the BOS prices is US cents 25-30 /watt by 2050.44
Battery storage cost is likely to be commercially viable by 2025
With ongoing R&D activities, battery storage technology is expected to reach commercial scale by 2025, possibly even earlier than that. Battery storage costs have reduced substantially over the last few years from over US$1,000 to about US$350 per kWh.45 With increasing scale, battery costs are expected to fall even further. Storage costs are estimated to come fall by 50-60 percent (to US$125/kWh) from current costs by 2025. At such prices, battery storage will emerge as a key component of a solar power system with its wide
41 Panasonic, “HIT Photovoltaic Module” n.d. Available from: http://business.panasonic.com/VBHN315KA01.html.42 Fraunhofer ISE, “New world record for solar cell efficiency at 46% – French-German cooperation confirms com-
petitive advantage of European photovoltaic industry”, Press Release, 1 December, 2014. Available from: https://www.ise.fraunhofer.de/en/press-and-media/press-releases/press-releases-2014/new-world-record-for-solar-cell-efficiency-at-46-percent.
43 Fraunhofer ISE, Current and Future Cost of Photovoltaics. Long-term Scenarios for Market Development, System Prices and LCOE of Utility-Scale PV Systems. Study on behalf of Agora Energiewende, 2015. Available from: http://www.fvee.de/fileadmin/publikationen/weitere_publikationen/15_AgoraEnergiewende-ISE_Current_and_Future_Cost_of_PV.pdf.
44 Fraunhofer ISE, Current and Future Cost of Photovoltaics. Long-term Scenarios for Market Development, System Prices and LCOE of Utility-Scale PV Systems. Study on behalf of Agora Energiewende, 2015. Available from: http://www.fvee.de/fileadmin/publikationen/weitere_publikationen/15_AgoraEnergiewende-ISE_Current_and_Future_Cost_of_PV.pdf.
45 Department of Energy, USA, “The EV Everywhere Challenge, FY 13 Highlights, Planned Activities,” n.d. Available from: https://energy.gov/sites/prod/files/2014/05/f15/APR13_Energy_Storage_c_II_EV_Everywhere_1.pdf.

35100% ELECTRICITY GENERATION THROUGH RENEWABLE ENERGY BY 2050 — ASSESSMENT OF SRI LANKA’S POWER SECTOR
range of applications. Globally, grid scale battery storage installations are already functional and are gradually increasing in size (rated power) and capacity (discharge time), making them feasible for varied use cases.
Solar Energy to reach grid parity by 2020
High demand from Asian countries, especially India and the People’s Republic of China, coupled with a strong focus on cost reduction of PV modules, is likely to lead to a significant drop in the cost of generation from solar by 2020. As suggested in the roadmap developed by the International Energy Agency (IEA), the cost of electricity from PV in different parts of the world will converge as markets develop, with an average cost reduction of 25 percent by 2020, 45 percent by 2030, and 65 percent by 2050, resulting in a range of US$40-US$160/MWh, assuming a cost of capital of 8 percent. 46
As capital expenditures fall and performance ratios increase, the average cost of generation through PV will continue to diminish and the range of levelized cost across countries will continue to narrow. The levelized cost of new-built, large-scale, ground-based PV plants is expected to fall on average to below US$100/MWh by 2025, and is expected to decrease to US$60/MWh thereafter. The levelized cost of new-built rooftop PV systems will fall on average to below US$100/MWh soon after 2030, and gradually decrease to US$80/MWh.47
Taking into consideration the above assumptions, solar energy costs in Sri Lanka are likely to drop to LKR 7-9/kWh by 2025, which is at par with the present cost of generation from a coal based plant in the country.
Case Study: The People’s Republic of China - A World Solar Power Superpower
The People’s Republic of China has the second highest amount of solar power capacity in the world after Germany. In 2005, the country was heavily dependent on coal which was contributing towards 68.75 percent of the total electricity generated. Because of its high cost, solar power was mostly being used for electricity in remote villages and telecommunication towers. The Chinese government enacted the “Renewable Energy Law” in 2005 to facilitate renewable energy generation and several new supporting regulations and guidelines were introduced where research and development, training for manpower skills and public participation were given due emphasis. As a result, today, the SPV industry in the People’s Republic of China is growing faster than in any other country. The market share of Chinese PV increased from 1 percent to 35 percent in 8 years. The government has established a robust PV industry chain to assure the supply of material and products for the industry. In 2014, a renewed thrust was given through the launch of the Rooftop Subsidy programme (US$2.4/W) and Golden Sun Demonstration (GSD) programme. Under the GSD, 50 percent support for large grid connected rooftop of >300 kW, and 70 percent for off-grid systems is provided by the government. Consequently, as of March 2016, the People’s Republic of China has achieved a total of 28.33 GW in SPV capacity.48
46 International Energy Agency (IEA), Technology Roadmap, Solar Photovoltaic Energy 2014 edition, OECD/IEA,2014. Available from: https://www.iea.org/publications/freepublications/publication/TechnologyRoadmapSolarPhoto-voltaicEnergy_2014edition.pdf.
47 International Energy Agency (IEA), Technology Roadmap, Solar Photovoltaic Energy 2014 edition, OECD/IEA,2014. Available from: https://www.iea.org/publications/freepublications/publication/TechnologyRoadmapSolarPhoto-voltaicEnergy_2014edition.pdf.
48 Solar rooftop in India: Policies, challenges and outlook. Goel, Malti, 2016. Available from: http://www.sciencedid-rect.com/science/article/pii/S2468025716300231.

36 ECONOMIC AND GENERATION MIX RATIONALE
Case Study: India Growth Story
The story of India is a prominent example of a country embracing RE to combat the threat of climate change and emission. India has set an ambitious target of installing 175 GW of RE-based capacity by 2022, out of which 100 GW will be from solar energy. In India, the first grid scale solar project was set up in 2009 and since then, total solar based installed capacity has reached 10 GW49 (9 GW grid scale). In the next 6-7 years, India is likely to see an addition of 80-90 GW of solar capacity.
Figure 14: Solar growth in India
In India, solar tariffs have dropped 70 percent over last the five years, from Rs.14.90/kWh in 2010 to Rs.4.34/kWh by the beginning of 2016. With this steep reduction in tariffs, grid based solar energy has achieved near parity with conventional sources. The competitiveness of solar-based generation is likely to improve further with increased competition and the evolution of cost effective storage facilities.
The fall in solar prices is not an India- specific phenomenon. Prices of solar power have been coming down internationally as well and are expected to decline further.
Table 5: Recent trend of global solar prices
Country Year Price (US cents/kWh)48
Jordan 2015 6.13
Dubai2015 5.98
2016 2.99
Germany 2015 10.09
Brazil 2015 8.42
49 KPMG Analysis50 Media reports.
161 461 1205
2319 2632 3744
6763
10000
0
2500
5000
7500
10000
12500
Mar-10 Mar-11 Mar-12 Mar-13 Mar-14 Mar-15 Mar-16 Dec-16
MW

37100% ELECTRICITY GENERATION THROUGH RENEWABLE ENERGY BY 2050 — ASSESSMENT OF SRI LANKA’S POWER SECTOR
6 DEMAND MANAGEMENT AND BALANCING REQUIREMENTS
For the 100 percent RE scenario to succeed, there is a need for the development of an accompanying robust peak demand management and balancing system. Currently, hydro plants in Sri Lanka are used for balancing the grid during any load fluctuation. However, with the increased penetration of RE-based capacity, especially solar and wind which induce significant amount of intraday variability in generation, a robust peak demand management and balancing mechanism is crucial to support the growth story.
Peak demand is likely to reach ~12,000 MW in 2050 from 2,500 MW in 2016. The CEB forecast peak demand between 2016 and 2034, in its LTGEP; the same CAGR of 4.8 percent has been used to extrapolate demand growth to 2050.
Figure 15: Peak demand trajectory in Sri Lanka
0
2000
4000
6000
8000
10000
12000
14000
2016
20
17
2018
20
19
2020
20
21
2022
20
23
2024
20
25
2026
20
27
2028
20
29
2030
20
31
2032
20
33
2034
20
35
2036
20
37
2038
20
39
2040
20
41
2042
20
43
2044
20
45
2046
20
47
2048
20
49
2050
MW
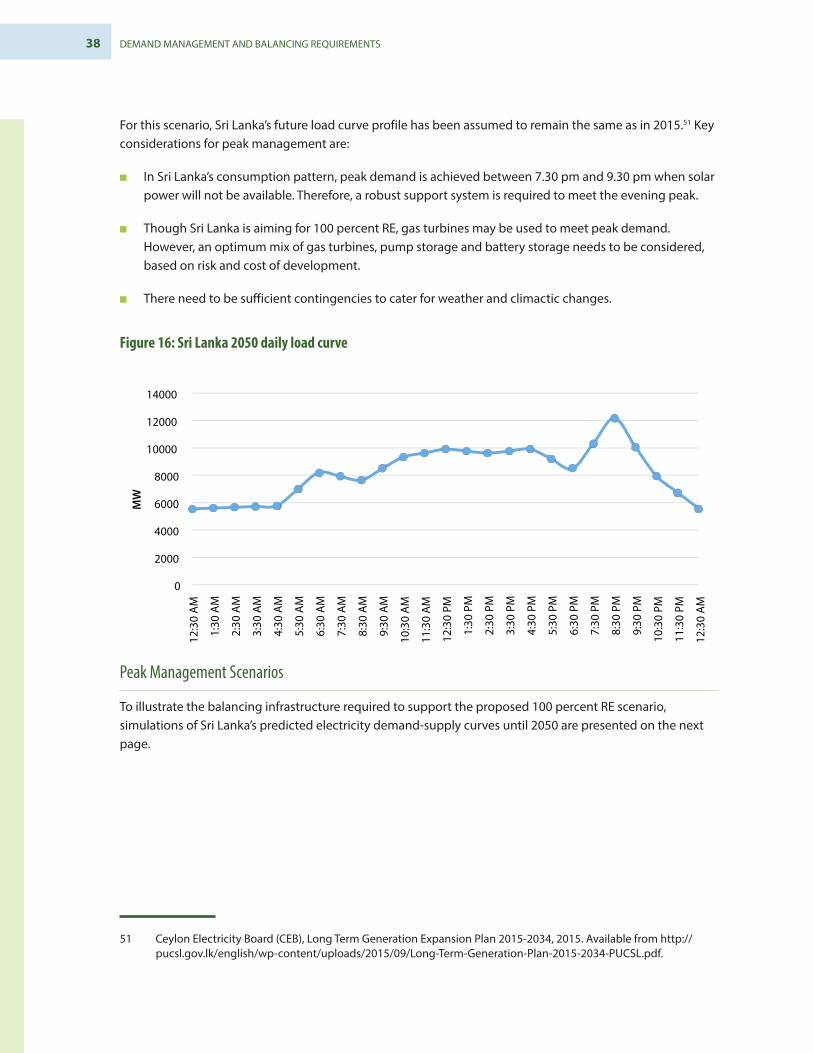
38 DEMAND MANAGEMENT AND BALANCING REQUIREMENTS
For this scenario, Sri Lanka’s future load curve profile has been assumed to remain the same as in 2015.51 Key considerations for peak management are:
■ In Sri Lanka’s consumption pattern, peak demand is achieved between 7.30 pm and 9.30 pm when solar power will not be available. Therefore, a robust support system is required to meet the evening peak.
■ Though Sri Lanka is aiming for 100 percent RE, gas turbines may be used to meet peak demand. However, an optimum mix of gas turbines, pump storage and battery storage needs to be considered, based on risk and cost of development.
■ There need to be sufficient contingencies to cater for weather and climactic changes.
Figure 16: Sri Lanka 2050 daily load curve
Peak Management Scenarios
To illustrate the balancing infrastructure required to support the proposed 100 percent RE scenario, simulations of Sri Lanka’s predicted electricity demand-supply curves until 2050 are presented on the next page.
51 Ceylon Electricity Board (CEB), Long Term Generation Expansion Plan 2015-2034, 2015. Available from http://pucsl.gov.lk/english/wp-content/uploads/2015/09/Long-Term-Generation-Plan-2015-2034-PUCSL.pdf.
0
2000
4000
6000
8000
10000
12000
14000
12:3
0 A
M
1:30
AM
2:30
AM
3:30
AM
4:30
AM
5:30
AM
6:30
AM
7:30
AM
8:30
AM
9:30
AM
10:3
0 A
M
11:3
0 A
M
12:3
0 PM
1:30
PM
2:30
PM
3:30
PM
4:30
PM
5:30
PM
6:30
PM
7:30
PM
8:30
PM
9:30
PM
10:3
0 PM
11:3
0 PM
12:3
0 A
M
MW
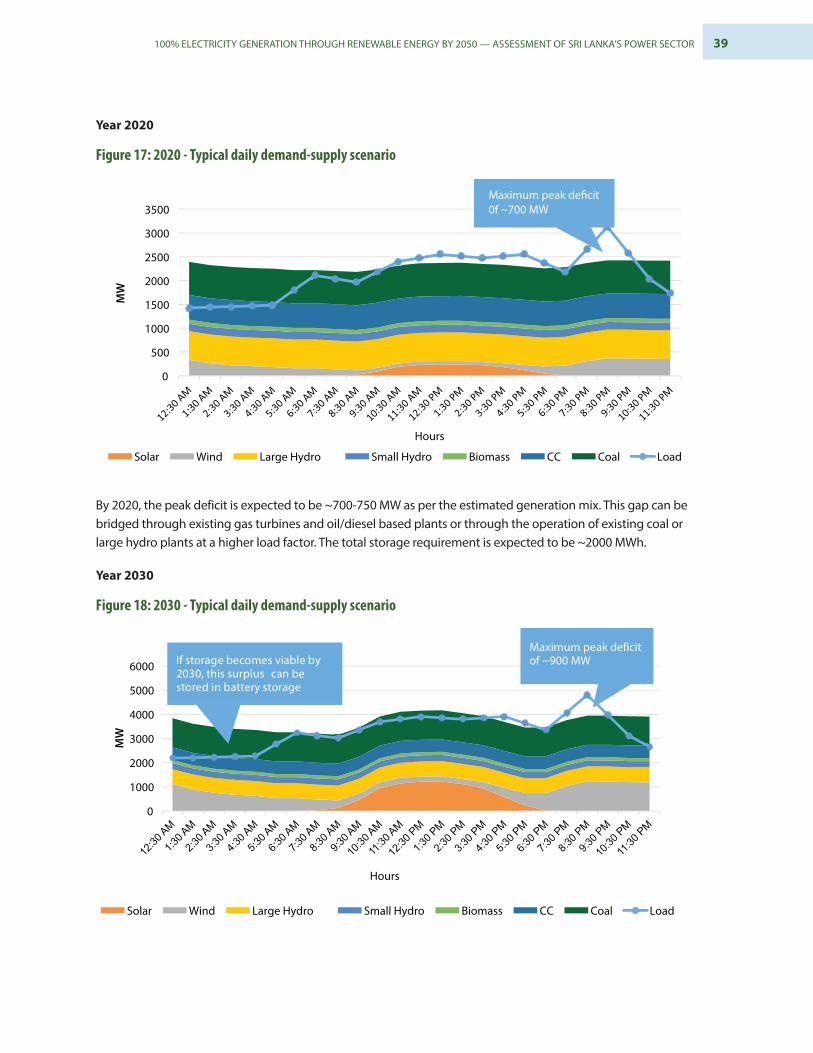
39100% ELECTRICITY GENERATION THROUGH RENEWABLE ENERGY BY 2050 — ASSESSMENT OF SRI LANKA’S POWER SECTOR
Year 2020
Figure 17: 2020 - Typical daily demand-supply scenario
By 2020, the peak deficit is expected to be ~700-750 MW as per the estimated generation mix. This gap can be bridged through existing gas turbines and oil/diesel based plants or through the operation of existing coal or large hydro plants at a higher load factor. The total storage requirement is expected to be ~2000 MWh.
Year 2030
Figure 18: 2030 - Typical daily demand-supply scenario
0
500
1000
1500
2000
2500
3000
3500
MW
Hours
Wind Large Hydro Small Hydro Biomass CC Coal Load
Solar
Maximum peak de�cit0f ~700 MW
0
1000
2000
3000
4000
5000
6000
MW
Hours
If storage becomes viable by 2030, this surplus can be stored in battery storage
Maximum peak deficit of ~900 MW
Wind Large Hydro Small Hydro Biomass CC Coal Load Solar

40 DEMAND MANAGEMENT AND BALANCING REQUIREMENTS
By 2030, Sri Lanka will need to increase its capacity of pump storage to meet a peak demand deficit of 900 MW. Also, by 2030, the cost of battery storage is expected to drop significantly, which may trigger a shift in focus to battery storage. The total storage requirement is expected to be ~1500 MWh.
Year 2040
Figure 19: 2040 - Typical daily demand-supply scenario
By 2040, an existing 600 MW coal-based capacity and 300 MW combine cycle capacity is expected to have been retired and the supply curve is likely to become middle heavy i.e. more capacity is expected to be available during the day time due to increased penetration of solar power. Maximum peak deficit may reach 1600 MW in the evening and the need for storage is going to be irrefutable. The total storage requirement is expected to be ~5000 MWh.
Year 2050
Figure 20: 2050 - Typical daily demand-supply scenario
Wind Large Hydro Small Hydro Biomass CC Coal Load Solar
0
1000
2000
3000
4000
5000
6000
7000
8000
MW
Hours
!Maximum peak deficit of ~1600 MW
This surplus can be stored in battery storage
Wind Large Hydro Small Hydro Biomass CC Coal Load Solar
0
2000
4000
6000
8000
10000
12000
14000
MW
Hours
Morning deficit also needs to be
met
This surplus can be stored in battery storage Maximum peak
deficit of ~3600 MW

41100% ELECTRICITY GENERATION THROUGH RENEWABLE ENERGY BY 2050 — ASSESSMENT OF SRI LANKA’S POWER SECTOR
By 2050, Sri Lanka will adopt 100 percent RE based generation capacity, which will further skew the supply curve towards the middle. Maximum peak deficit during evening and morning times may touch 3600 MW, making storage an imperative necessity. During the day, solar energy alone will be sufficient to meet the country’s demand. At the same time, during the day, there is likely to be significant curtailment of wind power if the energy generated is not stored. The total storage requirement is expected to be ~15000 MWh.
The key assumptions that were made to develop the demand-supply scenarios were as follows
Sri Lanka’s daily hourly supply profile (generation source availability factor)52
Table 6: Daily average supply profile of different technologies
Source 12:30 AM
1:30 AM
2:30 AM
3:30 AM
4:30 AM
5:30 AM
6:30 AM
7:30 AM
8:30 AM
9:30 AM
10:30 AM
11:30 AM
Availability Factor (%)
Solar 0 0 0 0 0 0 0 2 7 24 50 60
Wind 50 40 34 30 28 24 24 20 14 11 10 11
Large Hydro 40 40 40 40 40 40 40 40 40 40 40 40
Small Hydro 40 40 40 40 40 40 40 40 40 40 40 40
Biomass 70 70 70 70 70 70 70 70 70 70 70 70
CCP 90 90 90 90 90 90 90 90 90 90 90 90
Coal 90 90 90 90 90 90 90 90 90 90 90 90
Source 12:30 PM
1:30 PM
2:30 PM
3:30 PM
4:30 PM
5:30 PM
6:30 PM
7:30 PM
8:30 PM
9:30 PM
10:30 PM
11:30 PM
Solar 64 64 58 49 30 12 1 0 0 0 0 0
Wind 10 10 10 12 17 23 32 46 55 55 54 53
Large Hydro 40 40 40 40 40 40 40 40 40 40 40 40
Small Hydro 40 40 40 40 40 40 40 40 40 40 40 40
Biomass 70 70 70 70 70 70 70 70 70 70 70 70
CCP 90 90 90 90 90 90 90 90 90 90 90 90
Coal 90 90 90 90 90 90 90 90 90 90 90 90
■ Solar and Wind: The most conservative supply profile in the southern states of India has been assumed. ■ Hydro: Minimum availability of 40 percent throughout the day has been assumed.■ Coal and Combine Cycle Plants: Availability factor of 90 percent has been assumed.
Note: Profiles for Wind, Solar and Hydro are assumed based on closest available information due to data paucity in Sri Lanka and actual generation may be different from what has been assumed depending on seasonal variability.
52 The availability factor of a power plant is the time that it is able to produce electricity over a certain period, divided by of time in the period.
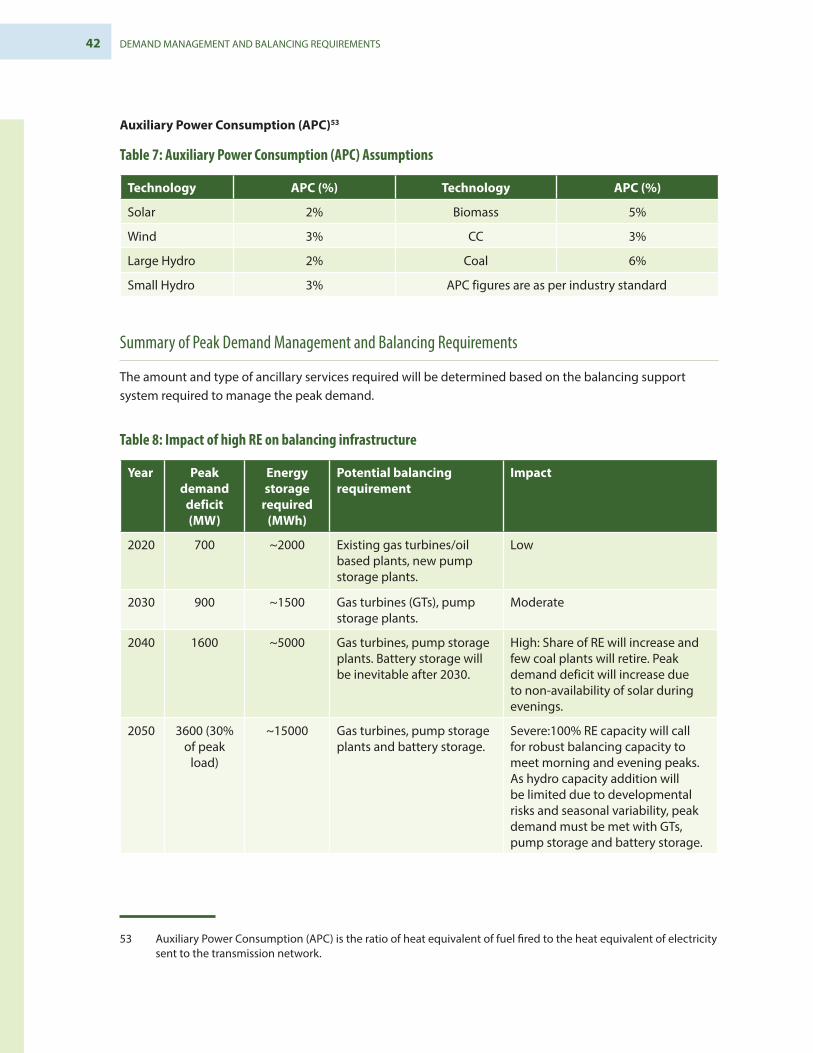
42 DEMAND MANAGEMENT AND BALANCING REQUIREMENTS
Auxiliary Power Consumption (APC)53
Table 7: Auxiliary Power Consumption (APC) Assumptions
Technology APC (%) Technology APC (%)
Solar 2% Biomass 5%
Wind 3% CC 3%
Large Hydro 2% Coal 6%
Small Hydro 3% APC figures are as per industry standard
Summary of Peak Demand Management and Balancing Requirements
The amount and type of ancillary services required will be determined based on the balancing support system required to manage the peak demand.
Table 8: Impact of high RE on balancing infrastructure
Year Peak demand
deficit (MW)
Energy storage
required (MWh)
Potential balancing requirement
Impact
2020 700 ~2000 Existing gas turbines/oil based plants, new pump storage plants.
Low
2030 900 ~1500 Gas turbines (GTs), pump storage plants.
Moderate
2040 1600 ~5000 Gas turbines, pump storage plants. Battery storage will be inevitable after 2030.
High: Share of RE will increase and few coal plants will retire. Peak demand deficit will increase due to non-availability of solar during evenings.
2050 3600 (30% of peak
load)
~15000 Gas turbines, pump storage plants and battery storage.
Severe:100% RE capacity will call for robust balancing capacity to meet morning and evening peaks. As hydro capacity addition will be limited due to developmental risks and seasonal variability, peak demand must be met with GTs, pump storage and battery storage.
53 Auxiliary Power Consumption (APC) is the ratio of heat equivalent of fuel fired to the heat equivalent of electricity sent to the transmission network.

43100% ELECTRICITY GENERATION THROUGH RENEWABLE ENERGY BY 2050 — ASSESSMENT OF SRI LANKA’S POWER SECTOR
A balancing support system would also address challenges related to:
■ Frequency control;
■ Voltage regulation; and
■ Black start support.
A preliminary assessment of the ancillary systems required has been set out in the following chapters.
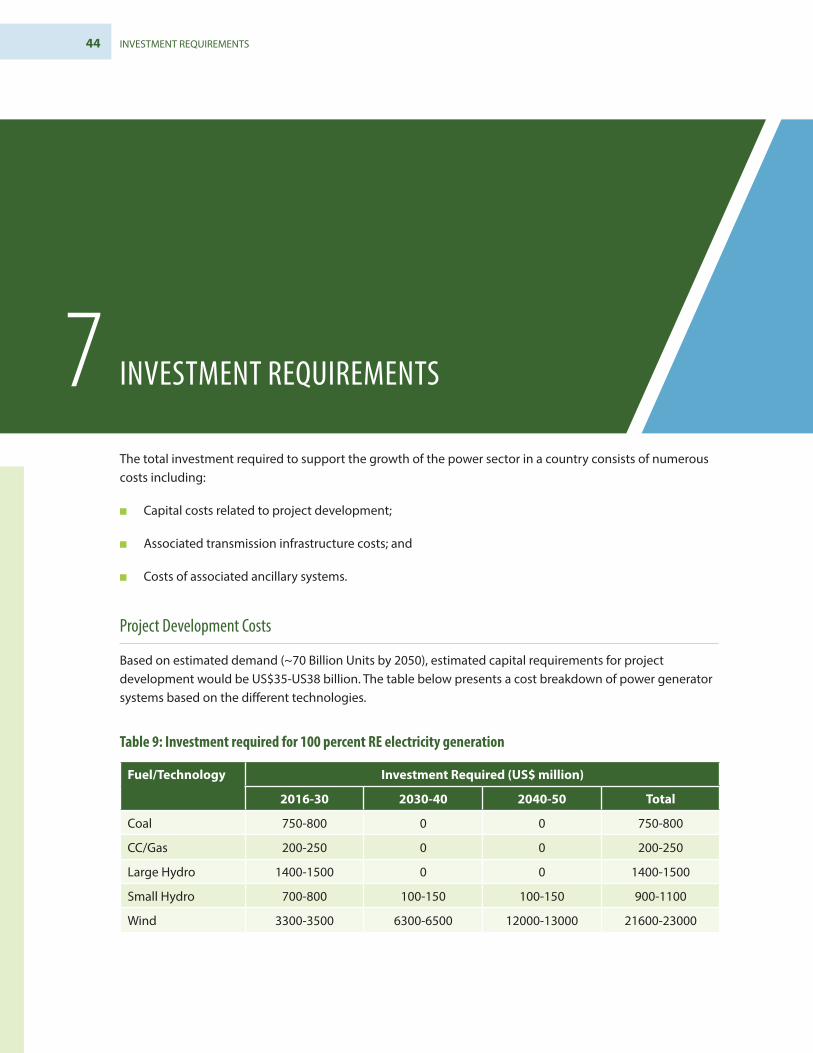
44 INVESTMENT REQUIREMENTS
7 INVESTMENT REQUIREMENTS
The total investment required to support the growth of the power sector in a country consists of numerous costs including:
■ Capital costs related to project development;
■ Associated transmission infrastructure costs; and
■ Costs of associated ancillary systems.
Project Development Costs
Based on estimated demand (~70 Billion Units by 2050), estimated capital requirements for project development would be US$35-US38 billion. The table below presents a cost breakdown of power generator systems based on the different technologies.
Table 9: Investment required for 100 percent RE electricity generation
Fuel/Technology Investment Required (US$ million)
2016-30 2030-40 2040-50 Total
Coal 750-800 0 0 750-800
CC/Gas 200-250 0 0 200-250
Large Hydro 1400-1500 0 0 1400-1500
Small Hydro 700-800 100-150 100-150 900-1100
Wind 3300-3500 6300-6500 12000-13000 21600-23000

45100% ELECTRICITY GENERATION THROUGH RENEWABLE ENERGY BY 2050 — ASSESSMENT OF SRI LANKA’S POWER SECTOR
Fuel/Technology Investment Required (US$ million)
2016-30 2030-40 2040-50 Total
Solar 1600-1800 3000-3200 5200-5400 9800-10400
Biomass 250-300 150-200 150-200 550-700
Total 8200-8950 9550-10050 17450-18750 35200-37750
The estimated capital cost per kW may vary somewhat based on the actual energy mix in 2050.54 The assumptions for capital costs are presented below:
Figure 21: Capital cost assumptions
The capital cost of solar energy is expected to drop by 50 percent by 2050,55 while costs for other technologies are likely to stay at current existing levels. Technologies like coal and wind are already mature and learning rates are expected to be a minimum.
Transmission Infrastructure Costs
In Sri Lanka, the average incremental cost estimated for transmission infrastructure development is LKR190,000/kW. Therefore, by 2050, the investment required for developing transmission infrastructure would be ~US$13-US$14billion.
54 Indian benchmarks have been used in the calculation of capital costs.55 Fraunhofer ISE, Current and Future Cost of Photovoltaics. Long-term Scenarios for Market Development, System
Prices and LCOE of Utility-Scale PV Systems. Study on behalf of Agora Energiewende, 2015. Available from: http://www.fvee.de/fileadmin/publikationen/weitere_publikationen/15_AgoraEnergiewende-ISE_Current_and_Fu-ture_Cost_of_PV.pdf.
0
500
1000
1500
2000
2500
2016 2020 2025 2030 2035 2040 2045 2050
Capi
tal c
ost U
S$/k
W
Solar Wind Coal CC/Gas Large Hydro Small Hydro Biomass

46 INVESTMENT REQUIREMENTS
Table 10: Investment required for transmission infrastructure
Duration Incremental system demand (MW) Investment required (US$ million)
2016-30 2322 3300-3500
2030-40 2764 4000-4200
2040-50 4603 6500-6700
Total 9689 13000-14000
Multilateral agencies like the ADB, AFD and JICA amongst others have already committed funds to multiple transmission projects worth more than US$500 million.56 These projects are related to new transmission infrastructure, capacity augmentation projects, system strengthening and modernization etc. However, a lot more will be required for Sri Lanka to acquire sufficient transmission infrastructure for the 100 percent RE scenario.
Ancillary Systems Costs
Ancillary Services are the support services which are required for improving and enhancing the reliability and security of the electrical power system. Ancillary Services are an indispensable part of the electricity industry and these services have evolved based on the prevailing structure of electric supply system and operational practices in individual countries.
There are basically three main types of Ancillary Services: Real power support services or load following Frequency Support Ancillary Services (FSAS); voltage or reactive power support services; and Black Start support services. Ancillary services could be introduced initially to improve the reliability and security of the grid. However, given the immaturity of the power sector in Sri Lanka, it would be desirable to start with ancillary services that will be simple to implement.
Frequency Support Ancillary Services (FSAS): The purpose of introducing Frequency Support Ancillary Services (FSAS) would be to maintain the frequency within the band specified in the country’s “Grid Code”. It is seen that there is some surplus generation capacity lying unutilized at some point of time, but at the same time load shedding is being carried out by the utilities. There is, therefore, a need for a mechanism such as FSAS to use these un-dispatched surplus capacities to enhance the power supply to the grid, when required, to maintain grid security.
Integration of renewable energy into the grid is one of the priority areas in Sri Lanka. The installed generation capacity of renewable generators is expected to grow rapidly in the coming years. Considering the high variability and unpredictability of generation from renewables, the FSAS would serve to stabilize the frequency for increased integration of renewable sources into the grid. FSAS can be used to complement the diurnal changes in renewable generation. FSAS can thus also be used as a mechanism to facilitate renewable integration by reducing the impact of their variation.
56 Ceylon Electricity Board (CEB), Long Term Generation Expansion Plan 2015-2034, 2015. Available from http://pucsl.gov.lk/english/wp-content/uploads/2015/09/Long-Term-Generation-Plan-2015-2034-PUCSL.pdf.

47100% ELECTRICITY GENERATION THROUGH RENEWABLE ENERGY BY 2050 — ASSESSMENT OF SRI LANKA’S POWER SECTOR
Voltage Control Ancillary Services (VCAS): Voltage support involves the injection or absorption of reactive power Volt-Amperes Reactive (VARs) into the grid to maintain system voltage within the optimal range. Since voltage is a local phenomenon and not a global phenomenon like frequency, the requirements of capacitors and/or reactors. at various nodes (sub-station or switchyard of generating station) may need to be changed. Therefore, the provision of reactive power, which may require a change in location, could be made under reactive power support ancillary services. Given that mobile substations, installed in trailers, which allow flexibility for quick installation to restore supply, are gaining popularity, mobile reactors or capacitors would be suitable elements for VCAS.
Black Start Ancillary Services (BSAS): Black start services provide the ability to start up from a shutdown condition without support from the grid, and then energize the grid to allow other units to start up. A properly sized energy storage system can provide black start capabilities, provided it is close enough to a generator
Presently, in Sri Lanka, there are no formal ancillary services available. As the grid is small, any kind of frequency imbalance is dealt with by available hydro plants and oil based plants. But, as the grid grows bigger, coupled with rapid penetration of RE, a robust ancillary system will be necessary.
By 2050, with 100 percent RE generation, Sri Lanka will need to have a significant amount of storage facility in place. To avoid emissions, by 2050, gas turbines will no longer be a plausible option to meet peaking power demands and pump and battery storage will be the two most suitable means for meeting peak demand.
Table 11: Investment required for ancillary services57
Year Peak demand deficit (MW)
Potential ancillary support required Investment required (US$ million)
2030 900 115 MW Gas Turbine (Existing) + 900 MW Pump Storage based hydro
1530
2040 1600 Incremental Battery Storage of 1000 MW (~3000 MWh)
630
2050 3600 Incremental Battery storage of 2000 MW (~15000 MWh)
3150
Key assumptions:
■ Battery storage needs to be replaced every five years.
■ The cost of battery storage will fall by 60-70 percent by 2050 from current levels of US$350/kWh. Battery developers working with the United States Advanced Battery Consortium (USABC) have made significant advances in cost reduction using advanced cathodes, processing improvements, lower-cost cell designs, and pack optimization.58
57 KPMG analysis.58 U.S. Department of Energy, EV Everywhere Grand Challenge Blueprint. Available from: https://energy.gov/eere/
electricvehicles/about-electric-vehicles.

48 INVESTMENT REQUIREMENTS
Total Investment for Sri Lanka’s 2050 100 percent RE Electricity Generation Scenario
Summarizing the financial requirements, the total investment required by the Sri Lankan power sector to adopt 100 percent RE by 2050 will be to the tune of US$54-US$56 billion.
Figure 22: Total investment required in Sri Lankan power sector for 100 percent RE
7500 9500
18500 3500 3500
6500
1530 630
3150
0
5000
10000
15000
20000
25000
30000
2016-30 2030-40 2040-50
US$
mill
ion
Generation Transmission & Distribution Balancing support

49100% ELECTRICITY GENERATION THROUGH RENEWABLE ENERGY BY 2050 — ASSESSMENT OF SRI LANKA’S POWER SECTOR
8 INVESTMENT CLIMATE
While the investments required for the 100 percent RE scenario have been elaborated, they need to be accompanied by a strong and robust investment climate. Foreign and domestic institutional investors in Sri Lanka have been facing significant barriers to investment in the renewable energy sector, with numerous risks in the form of off-taker risk, currency risk, lack of intermediaries and liquid instruments as well as low credit rating of operational assets, amongst others. Even when these are resolved, land acquisition and regulatory risks are likely to be significant barriers to the establishment of the RE project.
There is therefore a need to study Sri Lanka’s current investment climate and devise ways to address these barriers to institutional investment.
Potential Investors
Potential investors in Sri Lanka’s renewable energy and power sectors have been classified into four broad categories: government; the private sector; financiers; and retail investors. The table below details the composition of these four investor categories, as well as their preferred investment form, debt or equity.
Table 12: Potential investor categories for the RE sector
Investor Base Investment Pathway
Government ■ Central government
■ Public sector unit (CEB)
Equity
Private Sector ■ Group companies
■ Independent power producers
Equity

50 INVESTMENT CLIMATE
Investor Base Investment Pathway
Financiers
■ Private equity/Venture capital Equity
■ Domestic institutional investors (DIIs) (Pension Funds, Insurance companies etc.)
■ Domestic banks
■ Non-Banking Financial Companies (NBFCs)
Debt
■ Foreign institutional investors (FIIs)
■ Multilateral/bilateral agencies
Debt/Equity
Retail ■ Domestic consumers
■ Commercial entities
Equity
These investor categories will play a pivotal role in bridging the gap between debt and equity enabling the country to meet investment targets required to increase the adoption of RE in the power sector. While DIIs and multilateral agencies, who provide the lowest cost capital, could play a major role in debt financing, FIIs could also finance a significant portion of the equity required.
Potential Investor Risks
To mobilize more institutional investors, there is a need to address the various risks involved. It is hence important to understand the various types of risks involved in investing in the Sri Lankan RE power sector.
The table below highlights the various kinds of risks that institutional investors are likely to face when investing in the Sri Lankan power and renewables sector:
Table 13: Potential risk areas for investors
Risk Foreign Institutional Investors/IPPs/Multilaterals
Domestic Institutional Investors
Off-taker risk ✓
Evacuation risk (Lack of transmission infrastructure)
✓
Currency risk ✓
Regulatory/Policy risk ✓ ✓
Return risk ✓
Limited understanding of RE sector ✓
Lack of intermediaries ✓
Lack of liquid instrument to invest in RE ✓
Low credit rating of operational assets ✓

51100% ELECTRICITY GENERATION THROUGH RENEWABLE ENERGY BY 2050 — ASSESSMENT OF SRI LANKA’S POWER SECTOR
These risks and their relevance to Sri Lanka’s investment climate are detailed below.
Off-taker Risk: An off-take agreement is a power purchase agreement between a producer and a buyer of power, typically negotiated before construction of a project with a guarantee that the buyer will purchase a certain amount of electricity. Off-taker risk is the risk that the buyer will not fulfill his contractual obligations and will make delayed or incomplete payments.
In Sri Lanka, CEB’s poor and deteriorating financial standing poses significant off-take risk for generators. Furthermore, the absence of any policy or regulatory frameworks prioritizing the generation of RE electricity over fossil fuel electricity makes investors unsure of the presence of a guaranteed market for RE-generated electricity in Sri Lanka, making them reluctant to invest in the sector.
Evacuation Risk: The lack of proper transmission and evacuation infrastructure is another serious barrier to investment for foreign institutional investors. This directly increases the risks for foreign institutional investors and compromises the steady returns that they require.
While there is significant investment being carried out in this space, a lot through DFIs,59 much more needs to be done if Sri Lanka is to pursue its 100 percent RE goal.
Currency Risk: Currency risk is the risk of loss from unexpected and volatile fluctuations in foreign exchange rates, when a foreign investor has exposure to foreign currency or is involved in foreign-currency-traded investments.
When a project is financed through a foreign loan, it requires a currency hedge to protect against currency risk. Market-based currency hedging adds to the cost of debt. This makes fully-hedged foreign debt nearly as expensive as domestic debt.
In 2015, Sri Lanka’s currency risk rating deteriorated from BB to B. The fall in grade reflected a drop in foreign exchange reserves as well as an appreciation in the real trade-weighted exchange rate.60 This downgrade is likely to make foreign institutional investors in particular, reluctant to invest in a nascent sector like RE in Sri Lanka. Improvements therefore must be made, especially if Sri Lanka wishes to attract foreign investment to the RE sector.
Regulatory and Policy Risk: Investors face this risk when policies and regulations are not well drafted and lack incentive mechanisms for RE growth.
While Sri Lanka has policies and regulations advocating the adoption of RE, such as tariff rates focused on RE electricity generation, they have not been successful due to a lack of robust design and implementation.
Return Risk: Primary interactions with stakeholders revealed that the risk-return perception for RE projects is not investor conducive in Sri Lanka.
59 Ceylon Electricity Board (CEB), Long Term Generation Expansion Plan 2015-2034, 2015. Available from http://pucsl.gov.lk/english/wp-content/uploads/2015/09/Long-Term-Generation-Plan-2015-2034-PUCSL.pdf.
60 The Economist Intelligence Unit, Country Credit Risk, “Sri Lanka”, 11 June, 2015 Available from: http://country.eiu.com/article.aspx?articleid=53280189&Country=Sri percent. 20Lanka&topic=Risk&subtopic=Credit+risk&subsub-topic=Overview.
52 INVESTMENT CLIMATE
Limited understanding of the RE sector: Domestic Institutional Investors (DIIs) are essentially risk-averse and their investment strategy is traditionally liquid and involves less risky assets. The RE sector falls outside their typical investment regime and a lack of knowledge about the sector makes them reluctant to invest.
Lack of financial intermediaries: Financial intermediaries provide first-hand information about risk mitigation measures and investment details about the renewable energy market.
Primary interactions have revealed that domestic institutional investors in Sri Lanka have found it difficult to invest in the RE sector because they do not have adequate information, due to a lack of financial intermediaries to inform their investments.
Lack of liquid instruments to invest in RE: Domestic institutional investors prefer to invest in liquid assets with stable returns as their investments are liability-driven.
Primary stakeholder interactions have revealed that there is a lack of liquid instruments for investing in renewable energy projects in the country, making domestic investors reluctant to invest in RE projects.
Low credit rating of the sector/assets: Primary interactions have revealed that in some cases a low rating of power assets has kept DIIs away from any potential investment in Sri Lanka’s RE sector.
Additional challenges faced by investors are related to land acquisition, construction delays and curtailment61 risk. Sri Lanka faces high risks of RE curtailment which always threatens any return prospects the project may have. From primary interactions, it has been understood that wind developers especially, have been facing increased curtailment risks due to backing down instructions passed by load dispatch centres during seasons of high winds.62
61 Curtailment: Defined as “A reduction in the scheduled capacity or energy delivery by a power producer against the previously agreed upon amount of energy”. For example, a power producer has an agreement to transfer 100 kWh of electricity but is then asked by the load dispatch to instead transfer only 50 kWh.
62 A situation where wind power producers are being asked to reduce the amount of power they are supposed to transfer to the grid in order to maintain the grid’s balance. This in turn reduces the profits generated by the wind power producers since they are now selling less power than was initially agreed upon.

53100% ELECTRICITY GENERATION THROUGH RENEWABLE ENERGY BY 2050 — ASSESSMENT OF SRI LANKA’S POWER SECTOR
Risk Mitigation Frameworks
Having understood the risks faced by investors in Sri Lanka, the government can design mitigation frameworks that can help mitigate these risks and increase investor confidence in the sector. The table below maps various risk mitigation frameworks that could be used to address the risks faced by RE investors in Sri Lanka:
Table 14: Potential risk mitigation measures to be taken by the Government
Risk Solution 1
Solution 2 - Financial Instruments Solution 3 - Policy Solutions
Build a business
case
Payment security
mechanism
Currency hedging facility
Infra-structure
Debt fund
Partial credit
guarantee
Build trans-
mission capacity
Easier land
acquisi-tion
Provide intermedi-
aries
Stable policy
regime
Limited understanding of RE sector
✓
Off-taker risk ✓
Currency risk ✓
Lack of intermediaries
✓
Lack of liquid instruments for investment
✓
Low rating of assets
✓
Evacuation risk ✓
Regulatory/ policy risk
✓
Land acquisition issue
✓
Curtailment risk
✓
Developing a business case could be a potential solution, which would demonstrate the benefits of institutional investment in RE and would provide institutional investors the information required to help them make informed investment decisions. The business case may include a detailed cost-benefit analysis, risk-return profiles for different asset categories and potential measures for risk mitigation.
Several financial instruments will have to be designed to address the risk perceptions of investors. For example:
■ A payment security mechanism could mitigate the off-take risk of investors. Well drafted PPAs with appropriate clauses would instill confidence. However, long term solutions lie in better financial management of the CEB, which is the sole electricity buyer in the country.

54 INVESTMENT CLIMATE
■ A government-sponsored currency hedging facility could mitigate currency risk and lower hedging costs. The Sri Lankan government could bear the currency risk and provide currency hedging to lower the financing cost.
■ Infrastructure debt funds (IDF)63 can enable institutional investment in the renewable energy sector by providing a more liquid investment option. A dedicated IDF for RE projects floated by Non-Banking Financial Companies (NBFCs) could be a good financial instrument for RE investment.
■ Partial credit guarantees can improve the credit rating of the debt of operational RE projects, and make them attractive to institutional investors. A partial credit guarantee is a form of credit enhancement in which the borrower’s debt obligations are guaranteed by a guarantor with a strong credit rating. The guarantor can be the government or any group company with robust financials. A proper institutional framework should be in place to enable partial credit guarantee.
All the above will eventually help to reduce the cost of finance for RE-based projects and improve the risk-return profiles of these projects.
In addition to incorporation of financial instruments, there is also a need for several policy measures which can potentially mitigate risks for an investor. Some key areas where government intervention will be required are:
■ There is a need for the government to plan and build adequate transmission and balancing capacity to ensure that there is no shortage of transmission capacity to accommodate. This would enable better integration of RE into the grid on a large scale, and would enable all renewable energy generated to be utilized. Through this, the “must run” status of RE projects is not compromised, thereby eliminating the effects of curtailment on project profitability.
■ A stable and RE-focused policy regime is crucial to help RE projects take off soon. Policies should be consistent in nature and should work towards disincentivizing fossil-based generation.
■ A simple and comprehensive framework for land acquisition could potentially reduce delays in project development, therefore making projects less risky and reducing the cost of capital.
63 Infra debt funds (IDF): Funds that provide financing through debt mechanisms such as loans for infrastructure projects like RE projects

55100% ELECTRICITY GENERATION THROUGH RENEWABLE ENERGY BY 2050 — ASSESSMENT OF SRI LANKA’S POWER SECTOR
9 FINANCIAL AND NON-FINANCIAL INTERVENTIONS REQUIRED
The success of Sri Lanka’s 100 percent RE electricity generation scenario will be heavily dependent on the support provided by policymakers. The power sector policy landscape must enable various players, both public and private, to access financing that will allow them to make the requisite capital and technological investments.
While Sri Lanka currently does have multiple financial policy interventions for the increased adoption of RE in the power sector, such as feed-in tariffs and net metering among others (detailed in Annex E – Sri Lanka Renewables Policy Landscape), they have been unable to garner the level of interest required to transition to a 100 percent RE sector. This lack of interest has primarily been due to the way several of these interventions are currently designed and deployed, making them unattractive for potential investors. There is thus a need for retrospective assessment of existing interventions while exploring new avenues that will lead to a more robust and attractive investor landscape for the power sector.
Targeted Interventions
A multitude of interventions can be used in Sri Lanka to encourage the development and deployment of renewables. The rationale for these interventions rests on the benefits their use brings in several areas including energy security, the economy, the environment and energy access, among others, benefits that are not adequately reflected in market prices.
By early 2014, at least 138 countries had renewable energy support policies in place, up from 127 a year before.64 Most measures concern the use of renewables for generation of power, where the most common
64 IEA, World Energy Outlook 2014, OECD/IEA 2014. Available from: http://www.worldenergyoutlook.org/weo2014/.

56 FINANCIAL AND NON-FINANCIAL INTERVENTIONS REQUIRED
and essential interventions include tax credits, feed-in tariffs, price premiums and portfolio obligations65. The cost of these interventions may be borne by taxpayers or passed through to the end-user.
Although significant technology cost reductions have been achieved in recent years, particularly for solar PV, the average cost of generation is still higher for several renewable energy technologies than it is for conventional technologies. Thus, further reductions are required to boost the role of renewables in the future energy mix. Additionally, to combat challenges arising from climate change, additional taxes might have to be raised to discourage generation of fossil based electricity.
Table 15: Plausible financial interventions for the Sri Lankan RE sector6667
Intervention Description Quantification
Feed-In-Tariffs (FIT) FITs are granted to operators, including households, for the renewables based electricity fed into the grid. They are usually technology-specific, have a long duration and take the form of a fixed price per kWh.
Globally, there are three primary elements under the FIT scheme:66
Generation tariff: A fixed rate payable to entities for the total amount of electricity generated, calculated per unit. The rate the entity receives is determined by its date of registration with the FIT scheme and the type and size of installation.
Export tariff: A tariff that is payable on the units of electricity the entity exports back to the national grid because it has not been consumed by the entity.
Savings on electricity bills: The entity will generate savings since a portion of electricity consumed is self-generated, resulting in reduced electricity bills.
(FIT – wholesale electricity price) x RE generated.
Net Metering Net metering is a billing mechanism that credits RE system owners for the electricity they add to the grid, allowing them to use that electricity any time, instead of when it is generated. Thus, if a consumer generates more than he uses, the excess is credited and carried over and can then be used in subsequent billing cycles.67
Total RE generated – Total electricity consumed = amount credited
65 Portfolio Obligations: Situation where organizations or entities are obliged to compulsorily ensure that a percent-age of their total energy consumption is through renewable energy. These obligations are generally enforced through legislation or regulation. For example, renewable purchase obligations i.e. RPOs in India.
66 Which? “What is the feed-in tariff?” n.d. Available from: http://www.which.co.uk/reviews/feed-in-tariffs/article/feed-in-tariffs/what-is-the-feed-in-tariff.
67 Richi Verma and Jayashree Nand (2016). Solar policy sparks incentive row. The Times of India, 12 June.

57100% ELECTRICITY GENERATION THROUGH RENEWABLE ENERGY BY 2050 — ASSESSMENT OF SRI LANKA’S POWER SECTOR
Intervention Description Quantification
Generation based Incentives (GBIs)
GBIs can broadly be defined as incentives provided based on the amount of RE generated by a producer. GBIs broaden the investor base, incentivize actual efficient electricity generation and mark a transition from an investment-based incentive scheme to outcome-based incentive scheme.
GBI x RE generated
GBI Accelerated Depreciation (AD)
Direct reduction in tax liability.
AD is a financial mechanism used to depreciate a RE project’s assets so that greater tax deductions are allowed in the initial few years of the project, thereby reducing the project’s overall tax debt and reducing its costs.
AD x RE generated
Price Premiums
Price premiums are an additional payment made to producers on top of the electricity price received by the producer (market-driven or regulated).
Premium x RE generated
Generation Tax Credit (GTC)
Direct reduction in tax liability. GTC x RE generated
Investment Tax Credit (ITC)
Direct reduction in tax liability. ITC x RE capacity added in the year
Interest Rate Subvention (IRS)
IRS is a subsidy offered on interest rates, whereby the government or promoter offers to pay a portion of the total interest due from the producer, thereby reducing their overall repayment burden.
IRS x RE capacity added in the year
Duty Exemptions Duty exemptions are provided by the government to organizations (producers or ancillary service providers) relieving them of their obligation to pay duty on the import of various components essential for a RE project.
Exemption based on materials imported
Capital Subsidy Capital subsidy is a suite of subsidies that cover a share of the upfront capital cost of a RE project’s assets. The subsidies generally take the form of reimbursements once the project application has been approved and commissioned.
Capital subsidies are usually provided to end users (project developers) instead of large investors. The government usually earmarks the subsidy funds to reassure the beneficiaries of availability of funds.
Subsidy x RE capacity added in the year
Grant Programmes Direct cash payments to reduce upfront capital costs. Grant x RE capacity added in the year

58 FINANCIAL AND NON-FINANCIAL INTERVENTIONS REQUIRED
Intervention Description Quantification
Soft Loans A soft loan is provided on comparatively lenient terms and conditions as compared to market loans, such as lower interest rates and prolonged repayment periods among others. The repayment of these soft loans might also include interest holidays.
Normally such loans are provided by Domestic Financial Institutions (DFI), multinational development banks and other government agencies;68 they are usually a part of soft financing or concessional funding schemes.
Loan amount based on RE project size
Carbon Credit Marketplace
Carbon credit systems place a cost on carbon emissions by creating credits valued against one ton of hydrocarbon fuel. A carbon credit is essentially a permit that allows the receiver to burn a specified amount of hydrocarbon fuel over a specified period. Credits are granted to entities that act to measurably reduce carbon emissions.69
A carbon credit marketplace provides a space for exchange of credits between entities, including nations, designed to reduce emissions of carbon dioxide. The carbon trade allows entities that have higher carbon emissions to purchase the right to release more carbon dioxide into the atmosphere from entities that have lower carbon emissions and hence accrued a significant amount of credits.
CC price x CC generated (amount of carbon emissions reduced)
Competitive Bids and Auctions
A process to generate offers from multiple bidders to fulfil specific energy needs, such as a target for renewables capacity, at the most competitive price
-
Green Bonds A green bond70 is a debt instrument with which an entity raises money from investors to fund “green” projects. The bond issuer gets capital while the investor receives fixed income in the form of interest. Once the bond matures, the initial capital is repaid. Green projects typically involve renewable energy generation and emission reductions among others.
Annual average price of GB x amount of GB released (based on the size of the RE project)
Renewable Energy Certificates (RECs)
A REC is a certificate of proof issued to an entity certifying that one unit of electricity was generated from a renewable energy source. These certificates provide a mechanism for purchase of renewable energy that is imported from and exported to the electricity grid.
Annual average price of REC x REC released (amount of RE generated)
While the Sri Lankan government can use the financial interventions detailed above to increase investor interest in RE systems, there is a need to tailor financial packages based on the needs of the various stakeholder groups representing the power sector, both consumers and producers.
The table below explores associations between the wide range of stakeholders in the Sri Lankan power sector and the corresponding mix of financial interventions deemed appropriate for each.
68 The Economic Times, “Definition of ‘Soft Loans’”, n.d., Available from: http://economictimes.indiatimes.com/defini-tion/soft-loans.
69 Investopedia, “Carbon Credit”, n.d. Availalble from: http://www.investopedia.com/terms/c/carbon_credit.asp#ixz-z4UnBUSHTf.
70 ET in Classroom (2016). There are varieties of bonds on offer, get to know about them (Bonds). The Economic Times, February 10.

59100% ELECTRICITY GENERATION THROUGH RENEWABLE ENERGY BY 2050 — ASSESSMENT OF SRI LANKA’S POWER SECTOR
Tabl
e 16:
Powe
r sec
tor s
take
hold
er In
terv
entio
n m
ap
Fin
anci
al
Inte
rven
tion
Pow
er S
ecto
r Sta
keho
lder
s (In
terv
entio
n Ta
rget
s)
Urb
anRu
ral
Indu
stry
Prod
ucer
sO
ff-G
rid
Prod
ucer
sA
ncill
ary
Serv
ices
Gov
ernm
ent
Inst
itutio
nsRe
sear
ch
Org
aniz
atio
ns
Hou
seho
ldCo
mm
erci
alH
ouse
hold
Com
mer
cial
CEB
IPP
Feed
-in-T
ariff
s✓
✓✓
✓
Net
Met
erin
g✓
✓✓
✓✓
✓✓
GBI
AD✓
✓✓
Pric
e Pr
emiu
ms
✓✓
GTC
✓✓
✓
Inve
stm
ent T
ax
Cred
its (I
TC)
✓✓
✓✓
✓✓
✓✓
✓✓
✓
Inte
rest
Rat
e Su
bven
tion
(IRC)
✓
✓✓
✓
Dut
y Ex
empt
ions
✓✓
✓✓
Capi
tal S
ubsid
y✓
✓
Gra
nts
✓✓
Soft
Loan
s✓
✓✓
✓
Carb
on C
redi
t M
arke
tpla
ce✓
✓✓
✓✓
✓
Com
petit
ive
Bids
&
Auct
ions
✓✓
Gre
en B
onds
✓✓
✓✓
Rene
wab
le E
nerg
y Ce
rtifi
cate
s✓
✓✓

60 FINANCIAL AND NON-FINANCIAL INTERVENTIONS REQUIRED
Stakeholder Intervention Map Rationale
The stakeholder invervention map attempts to balance the needs of the various stakeholders participating in the Sri Lankan power sector, their possible contributions towards the achievement of the 100 percent RE scenario and the Sri Lankan government’s ability to provide financial assistance to the sector. The line of reasoning for each of the individual stakeholders and their associated mix of financial interventions has been elaborated below:
Households (Urban and Rural)
Urban and rural households in Sri Lanka are one of the main targets for the Sri Lankan government in their aim to achieve a 100 percent RE economy. With this in mind the Sri Lankan government has robust FIT and Net Metering policy interventions catering to households as part of the “Battle for Solar Energy” rooftop solar initiative. However, these interventions have been unsuccessful in generating sufficient interest in the adoption of rooftop solar, primarily due to the high initial capital required to setup rooftop solar systems.
Due to this, it is recommended that the Sri Lankan government, while continuing current interventions, introduce financial interventions that help households access capital for infrastructure at an affordable rate. This can be achieved through multiple avenues including:
a. Interest Rate Subvention (IRS): Primary stakeholder interactions have ascertained that current interest rates of 12-13 percent are a barrier to the adoption of rooftop solar in the country and a decrease to 8 percent would make it more attractive for household consumers. The provision of interest rate subventions is thus a critical component in making household consumers comfortable about investing in rooftop solar infrastructure.
b. Investment Tax Credits (ITC): Households investing in rooftop solar can be provided tax benefits based on the size of the project, thereby reducing the up-front capital required to set up the system.
c. Capital Subsidy: For rural households where repayment of loans might not be possible especially in areas where the grid is unavailable, the government can offer capital subsidies reducing the up-front capital required to set up RE systems while ensuring that households still have a financial stake in the deployment and upkeep of the system.
Furthermore, for successful and smooth operation of rooftop and micro solar power plants, various models based on certain operating parameters may be worked out to make the deployment of solar a viable business model. While multiple business models can be devised, all models must be in accordance with the prevailing legal framework. Some of the business models that can be considered have been elaborated below.
a. Solar installations owned by consumer
i. Solar Rooftop facility owned, operated and maintained by the consumer(s).
ii. Solar Rooftop facility owned by consumer but operated and maintained by a third party.
b. Solar installations owned, operated and maintained by a third party71
If a third party implements the solar facility and provides services to consumers, the surplus electricity may be fed into the electricity grid. The combinations could be:
71 See: http://www.info.energy.gov.lk/.
61100% ELECTRICITY GENERATION THROUGH RENEWABLE ENERGY BY 2050 — ASSESSMENT OF SRI LANKA’S POWER SECTOR
i. Arrangement as a captive generating plant for the roof owners: The third party implements the facility on the roof or within the premises of the consumers; the consumer may or may not invest as equity in the facility as mutually agreed between them. The third party may also make arrangements for operation and maintenance of the facility. The power is then sold to the roof owner.
ii. Solar lease model, sale to grid: The third party implementing the solar facility enters into a lease agreement with the consumer to rent it on a medium- to long-term basis. The facility is entirely owned by the third party and the consumer is not required to make any investment in the facility. The power generated is fed into the grid and the rooftop owner gets a rent.
c. Solar installations owned by the utility
i. Solar installations owned operated and maintained by the utility: The utility may own, operate and maintain the solar facility and may opt to subcontract the operation and maintenance activity. The utility can recover the cost in the form of a suitable tariff. Furthermore, the electricity generated can also be used by the utility to fulfill its energy needs.
ii. The distribution licensee provides appropriate viability gap funds72: The utility may appoint a third party to implement the solar facilities on its behalf and provide appropriate funds or viability gap funds for implementing such a facility. It may also enter into an agreement with the third party undertaking the operation and maintenance of the solar facilities.
Case Study: Third Party Financing - An Established Financing Solution in the United States73
Third party financing of solar energy in the USA primarily occurs through two models:
a. Power purchase agreements (PPAs): In the PPA model, an installer/developer builds a solar energy system on a customer’s property at no cost. The solar energy system offsets the customer’s electric utility bill, and the developer sells the power generated to the customer at a fixed rate, typically lower than the local utility. At the end of the PPA contract term, property owners can extend the contract and even buy the solar energy system from the developer.
b. Solar leases: In the lease model, a customer will sign a contract with an installer/developer and pay for the solar energy system over a period of years or decades, rather than paying for the power produced. Solar leases can be structured so customers pay no up-front costs, some of the system cost, or purchase the system before the end of the lease term. Similar leasing structures are commonly used in many other industries, including automobiles and office equipment.
72 Viability Gap Funds: Grants, given one-time or deferred, provided to support infrastructure projects that are eco-nomically justified but fall short of financial viability.
73 Solar Energy Industries Association (SEIA), “Third-Party Solar Financing”, n.d. Available from: http://www.seia.org/policy/finance-tax/third-party-financing.

62 FINANCIAL AND NON-FINANCIAL INTERVENTIONS REQUIRED
To ensure that the recommended interventions do not impose too great a fiscal burden, the Sri Lankan Government can redirect existing subsidies aimed at maintaining current tariffs for household consumers (listed in the table below)74 to setting up rooftop solar infrastructure for these specific household groups.
Table 17: Subsidies currently given to Sri Lanka household customers
Household Consumers (Units)
Total (Subsidy) or Surcharge (LKR million)
Cost of Supply (LKR/kWh)
0-30 (4,405) 23.66
31-60 (12,223) 21.07
61-90 (14,119) 19.73
91-180 (7.252) 17.72
181-600 1,611 16.98
>600 2,082 -
This could be carried out under a “Rooftop Solar Incentive Programme” for target household groups who currently receive large amounts of electricity cost subsidies.
Case Study: Capital Subsidy for Solar Rooftops in India
Under the National Solar Mission, in 2015 the Indian government scaled up the budget for grid connected solar rooftop systems from INR600 crores (~US93 million) to INR5000 crores (~US$ 775 million) to be implemented by 2020. The funds are earmarked from the National Clean Energy Fund (NCEF) and this scheme aims to develop solar rooftop installed capacity of 4200 MW by 2020. The subsidy disbursement will be undertaken through the Solar Energy Corporation of India, state government schemes and financial institutions disbursement schemes.
As part of the scheme, a capital subsidy of 30 percent will be provided to general category states, and 70 percent to special category states. In addition, the subsidy will only be provided to residential, government and social sectors, while commercial and industrial sectors will be encouraged to adopt these systems without the subsidy.75
74 PUCSL, “Consultation Paper on Setting Tariffs for the Period 2011-2015”n.d. Available from: http://www.pucsl.gov.lk/english/wp-content/uploads/2012/11/Consultation-Paper-Proposed-Electricity-Tariffs-2011.pdf.
75 Press Information Bureau, Government of India, “A Big Boost for Solar Rooftops in India”, 30 December 2015. Available from: http://pib.nic.in/newsite/mbErel.aspx?relid=134026.

63100% ELECTRICITY GENERATION THROUGH RENEWABLE ENERGY BY 2050 — ASSESSMENT OF SRI LANKA’S POWER SECTOR
Commercial Establishments and Industries
It was noted during primary stakeholder interactions that commercial establishments and industries will play a major part in the increase in demand in Sri Lanka over the coming years. In view of this it will be essential to engage these stakeholders and increase their contribution towards the adoption of RE.
However, while doing so it is essential that the interventions offered help commercial establishments and industries meet their needs through RE but do not offer an incentive for them to turn into RE producers at the same time, as this could then create problems for Sri Lanka’s power transmission and balancing infrastructure, including oversupply. Based on this line of reasoning, the Sri Lankan government should look at offering Net Metering and Investment Tax Credits (ITC) to commercial establishments and industries (avenues for costs savings and reducing up-front infrastructure capital costs respectively) while refraining from offering FIT services to this group.
While interventions should prevent commercial establishments and industries from becoming RE producers for financial gains, Sri Lanka can still provide avenues for financial revenue in the form of Renewable Energy Certificates (RECs) and the development of a Carbon Credit Marketplace.
Sri Lanka could adopt a carbon credit scheme based on emissions reductions through adoption of RE generation capacity. Furthermore, once a significant amount of credits is produced, Sri Lanka can open the market to international players such as the EU or the People’s Republic of China, ensuring participants have access to a larger market where they are guaranteed sales of accrued credits.
While Sri Lanka already possesses a carbon market in the form of the Sri Lanka Carbon Crediting Scheme (SLCCS) based on Clean Development Mechanism (CDM) practices, it has had very limited success with current carbon credit prices standing at a low US$1-US$2 per tCO2e. Thus, a fresh approach needs to be taken in the development of a carbon marketplace in the country
Case Study: The People’s Republic of China’s Emission Trading System (ETS)
In November 2010, the Chinese government announced the development of a national ETS, which would be launched initially as pilot programmes in Beijing, Chongqing, Guangdong, Hubei, Shanghai, Shenzhen and Tianjin. These regions were selected as they represent 25 percent of the annual national GDP. These pilot programmes were fully launched by 2014, with each programme being customized to suit the region to be implemented in, while maintaining certain common features which include:
■ Common sectoral coverage
■ Use of free allowances, trading platforms, allowance allocation methodology
■ Chinese Certified Emission Reduction (CCER) trades
■ Flexible provisions such as banking of allowances
By July 2015, more than 57 million tons of carbon (valued at US$308 million) had been traded under these seven pilot programmes. Based on the success and large scale acceptance of these programmes, the government announced a national ETS development timeline:

64 FINANCIAL AND NON-FINANCIAL INTERVENTIONS REQUIRED
■ Preparation Phase (2014-15): Develop technical standards, finalization of the national registry, greenhouse gas accounting methods for all sectors and defining the national ETS features.
■ Operational Improvement Phase (2016-20):
— First Stage (2016-17): A national level test run of all the ETS regulations, allowances will be conducted, for the regions to embed the ETS policy into their existing systems.
— Second Stage (2017-20): Full national implementation of ETS to be streamlined and achieve market stability
■ Stabilization and Maturation Phase (>2020): Under this phase the government would include additional trading products, enhance market stability, as well as establish linkages between the national ETS and international trading systems
The People’s Republic of China being one of the largest GHG emitters, through this ETS showcased their mitigation commitments and understanding of carbon markets. This cap and trade system which will be launched in 2017 nationally, currently covers eight sectors and 18 sub sectors which consume 10,000 tons of coal equivalent annually. This national scheme is expected to have a cap size of at least 4 billion tons, which is twice the size of the European Union ETS.
For Sri Lanka to implement an ETS in any form, the government would need to consider the following recommendations, among others:
■ If the market is a cap and trade system, selection of the right cap size is important. Experts suggest that increasing sectoral coverage would improve price discovery and enable formation of a forward carbon price curve.
■ The government should avoid the overlapping of existing policies with the ETS regulations to prevent ambiguity in ETS implementation; the ETS should be governed by a specifically designed set of rules.
■ A robust compliance, monitoring and enforcement system will need to be established, with binding emission reduction targets to reduce overall GHG emissions.
Producers (On and Off-Grid)
Producers form the backbone of a power sector and will require the most financial and regulatory support if Sri Lanka is to successfully implement the 100 percent RE electricity generation scenario.
Sri Lanka’s current FIT plan for RE producers (detailed in Annex F: Sri Lanka Electricity Tariff Structures), while extensive, needs to address multiple issues that will make RE more attractive over conventional sources of energy. Recommendations for changes in Sri Lanka’s current FIT policy are listed below:
Prioritize the use and consumption of electricity generated through RE in the grid over electricity generated through conventional sources. By prioritizing RE over fossil fuels Sri Lanka signals potential RE investors that there will be an assured market place for the energy they produce while discouraging additional fossil fuel producers.
65100% ELECTRICITY GENERATION THROUGH RENEWABLE ENERGY BY 2050 — ASSESSMENT OF SRI LANKA’S POWER SECTOR
The FIT policy needs to be cognizant of economies of scale where RE projects are benchmarked and evaluated based on their size and tariffs are accordingly determined. Thus, smaller RE projects should be allowed to charge higher tariffs as compared with larger RE projects, ensuring that RE projects of all sizes are fundamentally profitable.
The concept of an annual decrease in tariff rates based on the RE technology used should be introduced. This will ensure that producers do not become dependent on high tariffs for operation and upkeep of a particular RE project. Instead producers will be forced to adopt latest RE technologies to ensure the longevity of the project while providing the highest quality level of service (LoS).
Case Study: Evolution of Germany’s Renewable Energy Sources Act (EEG)
The Renewable Energy Sources Act (EEG), was announced in early 2000, as a replacement to Germany’s Feed-in Law 1991. The EEG’s objective is to accelerate the market launch of RE technologies for electricity production. The Act’s core element is that it is the duty of grid operators to prioritize RE-based electricity generation and pay for it according to fixed tariffs over a period of 20 years. The tariff paid is dependent on the technology used, the year of installation and the size of the plant (see the tables below). Each grid operator is obliged to pay the statutory tariff to the plant operator. These tariffs are adjusted at regular intervals to market developments. The EEG Amendement 2004, set degression rates76 for all technologies to account for innovation in technology to improve efficieny, electricity output and reduced installation costs.
For example, for a photovoltaics power plant installation in 2007 (<30KW), the plant operator will receive €49.21 cents/ KWh of electricity, valid for 2007 and a further 20 years. If this same installation was made in 2008, the fees paid would have decreased to €46.75 cents/ KWh of electricity. Thus the operators are incentivised for technological innovation through reduced costs.77
The EEG Act has been amended multiple times, with the latest amendement in 2014. The latest amendment envisions that the RE sources gross electricity consumption share will increase as follows:
■ To 40-45 percent by 2025
■ To 55-60 percent by 2035
■ To 80 percent by 2050
76 Degression Rate: Rate at which the tariff commanded by a technology decreases with time.77 Federal Ministry for the Environment, Nature Conservation and Nuclear Safety, EEG- The Renewable Energy
Sources Act, Berlin, 2007. Available from: http://www.folkecenter.dk/mediafiles/folkecenter/pdf/eeg_success_brochure_engl.pdf.

66 FINANCIAL AND NON-FINANCIAL INTERVENTIONS REQUIRED
The following table captures the feed-in-tariff structure in Germany:78
Table 18: German FIT structure
Renewable Energy Source
FIT Structure
Onshore Wind The tariff of €8.93 cents/KWh will be decreased by 1.5 percent annually for new installations.
Offshore Wind The tariff will be unchanged at €5 cents/ KWh. This tariff will remain the same until 2018, following which it will annually decrease by 7 percent. The scheme has launched an optional FIT model with tariff of €19 cents/ KWh for 8 years to accelerate repayment of investments.
Hydropower The FIT is paid for 20 years, with an annual decrease of 1 percent. The tariff structures are:
Up to 500KW – €12.7 cents/ KWh
500KW- 2MW – € 8.3 cents/ KWh
<5MW – € 6.3 cents/ KWh
<10MW – € 5.5 cents/ KWh
<20MW – € 5.3 cents/ KWh
<50MW – € 4.2 cents/ KWH
>50MW – €3.4 cents/ KWh
Biomass Basic tariff €6-14.3 cents/ KWh with tariff reduction of 10-15 percent on average.
Geothermal The tariffs will be €23-25 cents/ KWh, which is set to decrease by 5 percent annually post 2018.
Photovoltaics The tariff could be decreased half yearly based on the capacity of the innovative technologies used. On 1 January, 2012 the tariffs could decrease between 1.5 percent and 24 percent (a basic decrease rate of 9 percent for an additional capacity installed between 2,500 and 3,500 MW).
Furthermore, once RE starts gaining traction in the power sector with the advent of numerous financial players willing to invest in it, Competitive Bidding and Auctioning should be introduced to wean producers from a preferential tariff system and keep the electricity market competitive forcing RE producers to maintain a high LoS.
78 IEA, “2012 Amendment of the Renewable Energy Sources Act (EEG 2912)” n.d. Available from https://www.iea.org/policiesandmeasures/pams/germany/name-25107-en.php.

67100% ELECTRICITY GENERATION THROUGH RENEWABLE ENERGY BY 2050 — ASSESSMENT OF SRI LANKA’S POWER SECTOR
Case Study: Auctioning of Solar Power in India
Initially with the announcement of the Jawaharlal Nehru National Solar Mission (JNNSM), solar projects were offered a FIT or preferential tariff of INR17.91/unit (US cents 28/unit) to Solar Photo Voltaic (SPV) projects and INR15.31/unit (US cents 24/unit) to Concentrated Solar Thermal (CST) projects shortlisted in Batch I. However, considering the overwhelming response received for the SPV capacity offered, the Government of India chose to replace the FIT with a reverse bidding or auctioning mechanism where the fixed capacity of SPV offered would be allotted based on least price offered by Solar Power Project Developers (SPD) and not first-come-first-serve basis.
The auctioning process resulted in allocation of the first 150 MW SPV projects and 470 MW CST projects, with 37 SPDs emerging as winners comprising 30 SPV projects and 7 CST projects. The auctioning led to huge discounts over the initial FIT, where the weighted average of the quoted tariffs for SPV was INR12.16/unit (US cents 19/unit) and CST was INR11.41/unit (US cents 18/unit) implying an average of 32 percent and 25 percent respectively of the Central Electricity Regulatory Commission (CERC) declared FITs. However, it may be noted that some of the gains due to auctioning would be offset by the higher tariffs paid to the 84 MW projects qualified under the migration scheme as compared to the rates offered to these projects by the state utilities.
Considering the huge savings over the economic life of the projects, the move towards auctioning does appear to be a great success. However, such huge discount in tariffs over CERC determined FIT and the ultimate selection of the SPDs have raised several questions regarding the financial feasibility of the projects, hindrances in financial closure and hence timely completion of the projects.79
Apart from the changes in the FIT policy suggested above, RE producers need to be given access to multiple source of infrastructure financing in the form of Generation based Incentives (GBI) (since off-grid systems do not feed into the grid, Price Premiums are not provided to them), Investment Tax Credits (ITC), Duty Exemptions, Soft Loans, and Green Bonds.
Case Study: Impact of Accelerated Depreciation (AD) in Wind Power Generation in India
In India, it has been observed that wind power has experienced huge growth since 1990s. In 1997, the total installed wind capacity was 1GW, which has now grown to nearly 22GW in 2014. According to an International Institute for Sustainable Development (IISD) report, this growth has been partially attributed to an AD scheme, launched in 1994, with a depreciation rate of 100 percent. The scheme was launched to encourage private sector participation in power generation.
79 Basu, Sambit, “India Solar Policy: Elements Casting Shadow on Harnessing the Potential”, IDFC Policy Group, Sector Note No. 1 November 2011. Available from: http://www.idfc.com/pdf/publications/India-Solar-Policy-Ele-ment-Casting-Shadow-on-Harnessing-the-Potential.pdf.

68 FINANCIAL AND NON-FINANCIAL INTERVENTIONS REQUIRED
Figure 23: Growth in wind capacity addition
As the market stabilized and technology matured, this rate was reduced to 80 percent in 2002. As is visible from the above figure, the average annual capacity addition is of 1500 MW, with a peak in 2012 when Generation Based Incentives (GBIs) were also running concurrently. After 2012, the AD and GBI scheme was withdrawn, resulting in a fall in capacity additions.80 The AD scheme was completely withdrawn due to the following concerns raised by the authorities.
■ The scheme incentivized capacity instead of actual generation, resulting in inefficient project installations. These projects would get full AD benefits and best wind potential land sites, without investing in efficient and effective technology improvements.
■ AD was restricted only to certain group of investors, who had book profits based in India. Foreign investors and independent power producers which did not have profits generated in India, could not avail this scheme. (An alternate GBI scheme was launched for such investors).
■ AD was being misused as a tax instrument instead of a tool for developing a sustainable wind power industry.
As with the case of AD in India, Sri Lanka needs to ensure that any financial incentive provided to producers needs to be regularly monitored and modified, if required, to ensure they are not taken undue advantage of and producers do not become dependent on them for future expansions.
In addition to many financial interventions provided for the generation of RE by producers, Sri Lanka needs to rescind the subsidies that it currently provides to fossil fuelled power producers in a phased manner, discouraging further expansion of fossil fuelled electricity generation in the country. This could include the use of mechanisms such as carbon tax to dissuade generators from using carbon intensive fossil fuels in electricity generation.
80 Sud, Tashar, and others, India’s Accelerated Depreciation Policy for Wind Energy, IISD April 2015.Availalbe from: https://www.iisd.org/sites/default/files/publications/india-accelerated-depreciation-policy-wind-energy-case-study.pdf.
1859 2474 3691 5310 7094 8757 10242 11929 1415617353 19052
6151217 1619
17841663
14851687
22273197
16692079
0
5000
10000
15000
20000
25000
FY 04 FY 05 FY 06 FY 07 FY 08 FY 09 FY 10 FY 11 FY 12 FY 13 FY 14
Existing capacity New capacity

69100% ELECTRICITY GENERATION THROUGH RENEWABLE ENERGY BY 2050 — ASSESSMENT OF SRI LANKA’S POWER SECTOR
Ancillary Services
As detailed in Chapter 7, the success of Sri Lanka’s 100 percent RE electricity generation scenario is heavily dependent on the development and deployment of peak demand management and balancing infrastructure. This infrastructure will consist of numerous ancillary service providers, including battery and transmission equipment manufacturers, who will need ample financial support to set a robust, local secondary market supporting the primary electricity generation market.
Given the absence of raw materials required for the local manufacturing of RE infrastructure and equipment in Sri Lanka, most ancillary service providers look at importing RE equipment from the global market including India and the People’s Republic of China. Financial interventions for ancillary services hence will revolve around decreasing their import costs while allowing them to develop a local Sri Lankan market for the sale of imported RE equipment. Thus, apart from the Duty Exemptions, Investment Tax Credits (ITC) and Soft Loans provided to ancillary services for easy imports of RE equipment, Sri Lanka needs to enable the creation of a secondary marketplace where stakeholder groups like commercial establishments, industries and small scale power producers find it cheaper to source RE equipment locally than import it themselves.
Government and Research Organizations
Government and research organizations will need to be given financial support to assist them in building capacity of the various stakeholders involved in the Sri Lankan power sector in matters related to the adoption of RE as well as generating awareness of RE among the general population. In this regard, they can be supported through Grants and Capital Subsidies. They can also be provided incentives in the form of Net Metering and Investment Tax Credits (ITC) to increase their adoption of RE on their premises.

70 SUSTAINABLE DEVELOPMENT
10 SUSTAINABLE DEVELOPMENT
The success of Sri Lanka’s 100 percent RE electricity generation scenario will not just contribute towards helping Sri Lanka achieve its NDC goals in terms of RE contributions and GHG emissions reductions but will also play a major role in providing multiple sustainable development benefits.
Figure 24: Sustainable Development Goals (SDG) Impacts (determined using UNDP’s Climate Action Impact Tool)

71100% ELECTRICITY GENERATION THROUGH RENEWABLE ENERGY BY 2050 — ASSESSMENT OF SRI LANKA’S POWER SECTOR
Sustainable Development Benefits
The table below provides a snapshot of the sustainable development benefits that the 100 percent RE electricity generation scenario is expected to lead to:
Table 19: Sustainable Development Benefits
SDG Impacts
The 100% RE power generation scenario will lead to the retirement of fossil based power plants especially coal. This will lead to a reduction in fly ash, particulate matter, NOx, SOx concentration in the air, improving the air quality, thereby leading to better health conditions for citizens of the country.
Given that Sri Lanka currently does not possess the resource base for the development of an indigenous RE technology manufacturing industry, the 100% RE scenario will propagate the mass adoption and acceptance of RE technology through increased education and capacity building providing not just theoretical education but also vocational training for students to participate in the resulting RE job market.
The 100% RE power generation scenario will lead to the retirement of fossil based power plants especially coal. The increased participation of solar and wind in power generation ensures increased utilization of Sri Lanka’s available natural resources while reducing their dependence on imported fossil fuels, giving a rise to the adoption and use of clean energy technology in the country.
The increased participation of solar and wind in power generation ensures increased utilization of Sri Lanka’s available natural resources while reducing their dependence on imported fossil fuels, thereby reducing Sri Lanka’s financial burden on imports. Additionally, the scenario is going to lead to the development of a robust ancillary industry supporting the primary industry of energy generation resulting in greater economic productivity and job creation in the country.
The success of Sri Lanka’s 100% RE electricity generation scenario will be heavily dependent on the development and deployment of peak demand management and balancing infrastructure in the country which will be developed through the setup of a secondary, robust, local ancillary industry directly supporting the primary industry of electricity generation. This industrialization will foster increased innovation and research in the clean technology sector in Sri Lanka.
As part of the 100% RE scenario, the increased adoption of renewable energy will not only lead to a drastic reduction in GHG emissions from the power sector but will also result in the development of climate resilient infrastructure and subsequent industrialization through the use of sustainable technologies. Further climate resilience is achieved through producers and consumers being encouraged to increase their energy efficiency as part of the 100% RE scenario.

72 SUSTAINABLE DEVELOPMENT
SDG Impacts
The 100% RE scenario will give Sri Lanka numerous opportunities to collaborate with global and local RE players as well as international markets to develop a network of partnerships that it can leverage for technical and financial enhancement in the RE space in the country.

73100% ELECTRICITY GENERATION THROUGH RENEWABLE ENERGY BY 2050 — ASSESSMENT OF SRI LANKA’S POWER SECTOR
11 PATH FORWARD
The current report acts as a platform on which Sri Lanka can design, develop and implement measures which will help the country meet its target of electricity generation using renewable energy.
While the report provides detailed information on the plausible generation mix, required financial investments and recommended financial and non-financial interventions, further studies will be required in each of the elements detailed here to develop a concrete, long term electricity generation plan for Sri Lanka.
Formalization of 2050, 100 percent RE Electricity Generation Scenario
To move forward and implement the recommendations provided in this report there is a need for greater involvement of the various stakeholders of the Sri Lankan power sector, especially the Sri Lankan Government, the CEB, the renewable energy generation community and financial institutions, especially domestic banks. Therefore, one of the first steps would involve bringing all the various stakeholders to a common forum to chart out the future of renewable energy in Sri Lanka’s power sector.
Securing International and National Funding
Early stage consultations with international technical and financing agencies will be essential to garner interest in the plan and subsequently to securing international funding. A robust communication and outreach programme must be developed to increase awareness among the stakeholders, including DFIs such as ADB, UNDP, WB, amongst others, informing them of Sri Lanka’s RE ambitions for its power sector. Informal distribution of information on the 100 percent RE scenario should start immediately, in a bid to generate interest in the country especially in stakeholders participating in the power sector. Formal approaches to potential funding agencies should start as soon as possible.

74 PATH FORWARD
Furthermore, in addition to the current report, there are multiple areas that will require further, detailed assessment and study to bolster this report’s findings and formalize the 100 percent RE Scenario. These include the following:
Feasibility of Proposed 100 percent RE Electricity Generation Scenario
1. Technical Assessment of Power Sector: A detailed power sector redesign must be initiated and a roadmap needs to be developed to explore most the appropriate transmission and balancing mechanisms including storage, spinning reserve, and deviation settlement mechanisms amongst others.
2. Risk Assessment of Power Sector: Studies of Sri Lanka’s economy must be carried out to develop and implement concrete risk-mitigating solutions for investors in the country’s RE sector. This would include studying Sri Lanka’s macroeconomic conditions and proposing solutions to tackle challenges such as inflation, credit risk, etc.
3. Development of Feasible Business Models: A detailed assessment of the various financial interventions recommended in the document with respect to their target stakeholders’ needs to be carried out that can feed into the development of robust business models for each stakeholder – intervention combination.
4. Financial Implications of 100 percent RE Scenario: The financial implications of the 100 percent RE scenario, like the Fuel Cost Avoidance outlined in Chapter 5 - Rationale behind 100 percent RE Electricity Generation Mix ,as well as the sustainable development benefits of the 100 percent RE electricity generation scenario have to be studied in detail and frameworks need to be devised to divert/utilize any savings in the most efficient manner possible.
Technological Resources and Systems
1. Identification of Appropriate Technological Requirements: The technical and cost parameters identified should be refined and subsequently investments identified and recast into an abatement curve type format displaying a logical progression of investments, starting with those that have negative costs (i.e., pay for themselves) which will offset future costs. This will facilitate a more informed discussion of financing instruments to be applied to specific investments (e.g., more efficient lighting might be financed through an Energy Service Company (ESCO) contract while a new solar power plant could be delivered through competitive bidding with a different financing structure). This would further inform policy and regulatory changes that might be required.
2. Setup of RE Ancillary Support System: To implement a robust ancillary support system, suitable provisions will have to be made to develop a suitable enabling environment for the procurement and deployment of ancillary support systems for the RE sector. This would include formulation of regulations, pricing, selection of technology, provision of avenues to acquire required technologies locally or through imports, etc.
3. Investments for Distribution and Communication Systems: The 100 percent RE scenario will require smart metering, automated distributed systems, Internet of Things (IOT) and other advanced communication systems to be a success on the ground. A more detailed assessment will be required for these aspects and their investment needs.

75100% ELECTRICITY GENERATION THROUGH RENEWABLE ENERGY BY 2050 — ASSESSMENT OF SRI LANKA’S POWER SECTOR
Regulatory and Market Reforms
1. Regulatory Reforms: Detailed study of current regulatory structures and policies governing the Sri Lankan power sector is needed, leading to the design of reform measures to govern not just the incorporation of RE in electricity generation (as recommended in the report) but also to overhaul the current power sector regulatory regime. The ADB’s Assessment of Power Sector Reforms in Sri Lanka81 provides an extensive study detailing the reforms required for the Sri Lankan power sector that can be used as the foundation for such an endeavour. As well as regulations directly affecting the power sector, Sri Lanka will also need to study regulations that will assist market players in the procurement of technology and resources for the development and deployment of RE in the country, locally or internationally (for example, import duty structures for RE technology might need to be revamped, allowing producers easier access to the latest RE technology from around the world).
2. Market Reforms: Given the intermittent nature of RE as well as its tendency to drive down power prices, one of the biggest tasks for the Sri Lankan government is going to be the redesign of the Sri Lankan power market to reflect the flexibility in supply and demand due to the incorporation of large amounts of RE. The market needs to be designed to allow prices to adjust more frequently, reflecting weather fluctuations (for example, at times of extreme scarcity, a higher fixed price would need to apply to prevent load-shedding and blackouts).
81 ADB, Assessment of Power Sector Reforms in Sri Lanka, Country Report, 2015. Available from: https://www.adb.org/documents/assessment-power-sector-reforms-sri-lanka

76 ANNEX A: SRI LANKA POWER SECTOR - AN OVERVIEW
ANNEX A: SRI LANKA POWER SECTOR - AN OVERVIEW The contribution of fossil fuels to Sri Lanka’s electricity generation mix has seen a continuous rise over the years. Fossil fuels now serve as the primary source of fuel for electricity generation in the country, replacing large hydro.82
Figure 25: Electricity Generation Mix (2015)
Today electricity in Sri Lanka is mainly generated using coal and oil. As a country with limited proven indigenous fossil fuel resources, Sri Lanka is dependent on imported coal and petroleum for the generation of its electricity. While Sri Lanka is currently exploring the Mannar basin for natural gas, its commercial viability is still in question83 and the country’s dependence on imported fossil fuels for electricity generation is likely to continue unless renewables are integrated and adopted in a large-scale manner, positioning them as viable substitutes.
Historical electricity demand trends in Sri Lanka
Sri Lanka’s electricity demand has been growing at an average annual rate of around 6 percent over the past 20 years, and this trend is expected to continue in the foreseeable future. By the end of 2015, approximately 99 percent of the total population had access to electricity from the national electricity grid. Once current planned electrification schemes are implemented it is expected that this will increase further.
82 Sri Lanka Energy Balance –Electricity, 2016. Available from: http://www.info.energy.gov.lk/.83 Reuters, “Sri Lanka launches tender to develop natural gas site in Mannar Basin”, 13 February 2017. Available from:
http://www.reuters.com/article/sri-lanka-oil-exploration-idUSL4N1FY2XT.
Major Hydro 37%
Thermal (Oil) 18%
Thermal (Coal) 34%
Renewable Energy
11%
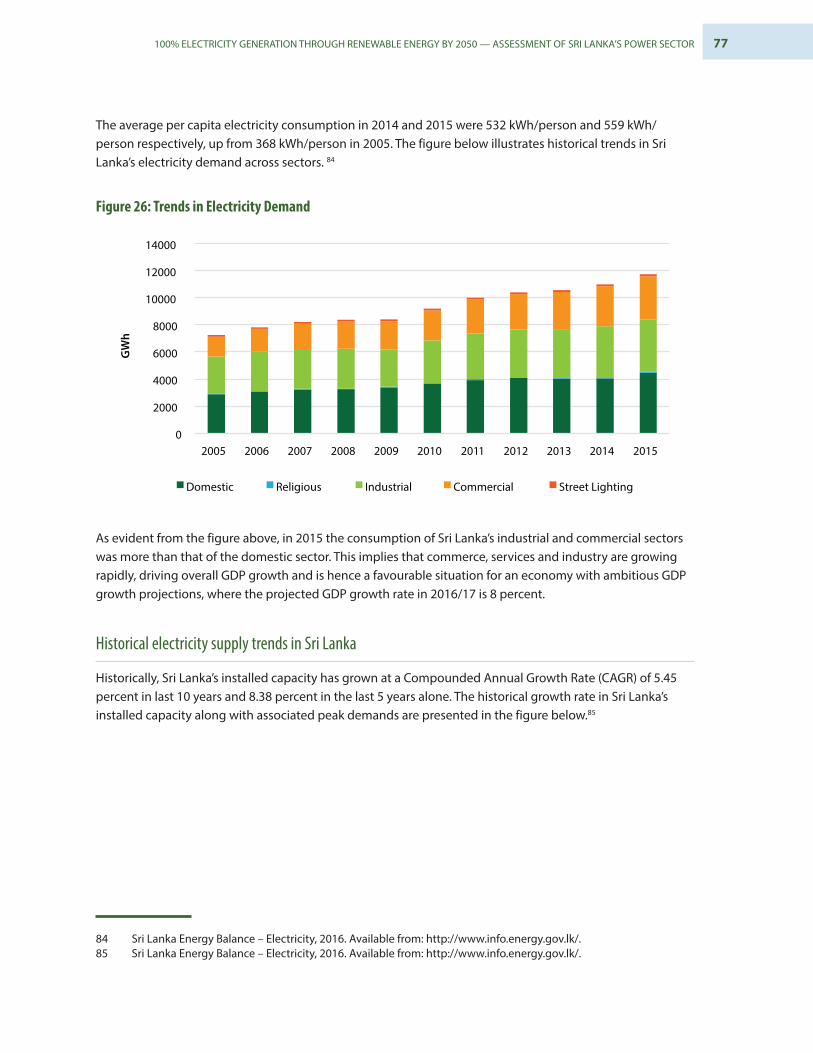
77100% ELECTRICITY GENERATION THROUGH RENEWABLE ENERGY BY 2050 — ASSESSMENT OF SRI LANKA’S POWER SECTOR
The average per capita electricity consumption in 2014 and 2015 were 532 kWh/person and 559 kWh/person respectively, up from 368 kWh/person in 2005. The figure below illustrates historical trends in Sri Lanka’s electricity demand across sectors. 84
Figure 26: Trends in Electricity Demand
As evident from the figure above, in 2015 the consumption of Sri Lanka’s industrial and commercial sectors was more than that of the domestic sector. This implies that commerce, services and industry are growing rapidly, driving overall GDP growth and is hence a favourable situation for an economy with ambitious GDP growth projections, where the projected GDP growth rate in 2016/17 is 8 percent.
Historical electricity supply trends in Sri Lanka
Historically, Sri Lanka’s installed capacity has grown at a Compounded Annual Growth Rate (CAGR) of 5.45 percent in last 10 years and 8.38 percent in the last 5 years alone. The historical growth rate in Sri Lanka’s installed capacity along with associated peak demands are presented in the figure below.85
84 Sri Lanka Energy Balance – Electricity, 2016. Available from: http://www.info.energy.gov.lk/.85 Sri Lanka Energy Balance – Electricity, 2016. Available from: http://www.info.energy.gov.lk/.
0
2000
4000
6000
8000
10000
12000
14000
2005 2006 2007 2008 2009 2010 2011 2012 2013 2014 2015
GW
h
Domestic Religious Industrial Commercial Street Lighting

78 ANNEX A: SRI LANKA POWER SECTOR - AN OVERVIEW
Figure 27: Trends in Electricity Supply and Peak Demand
Although there is significant reserve margin between installed capacities and peak demand, the seasonal variance of hydro plants and high cost of oil based power plants sometimes make it difficult to manage peak demand.
In the early stages, electricity demand was mainly met by hydro generation while the contribution from thermal generation was minimal. With time, thermal generation has become prominent, replacing hydro as the primary source of electricity generation. Electricity generation during the last ten years has been summarized in the table below.86
Table 20: Historical supply of electricity from different sources
Year Electricity Generation (GWh)
Thermal Hydro NCRE Total
2005 5339 3173 336 8848
2006 4805 4289 403 9497
2007 5895 3603 403 9901
2008 5849 3700 454 10003
2009 6062 3356 569 9987
2010 5063 4988 749 10800
2011 6884 3973 743 11600
2012 8416 2727 754 11897
2013 4820 6010 1194 12024
2014 7944 3650 1255 12849
2015 6796 4904 1525 13225
86 Sri Lanka Energy Balance – Electricity, 2016. Available from: http://www.info.energy.gov.lk/.
0 500
1000 1500 2000 2500 3000 3500 4000 4500
2005 2006 2007 2008 2009 2010 2011 2012 2013 2014 2015
MW
Total Installed Capacity in the Grid (MW) System Peak Demand (MW)
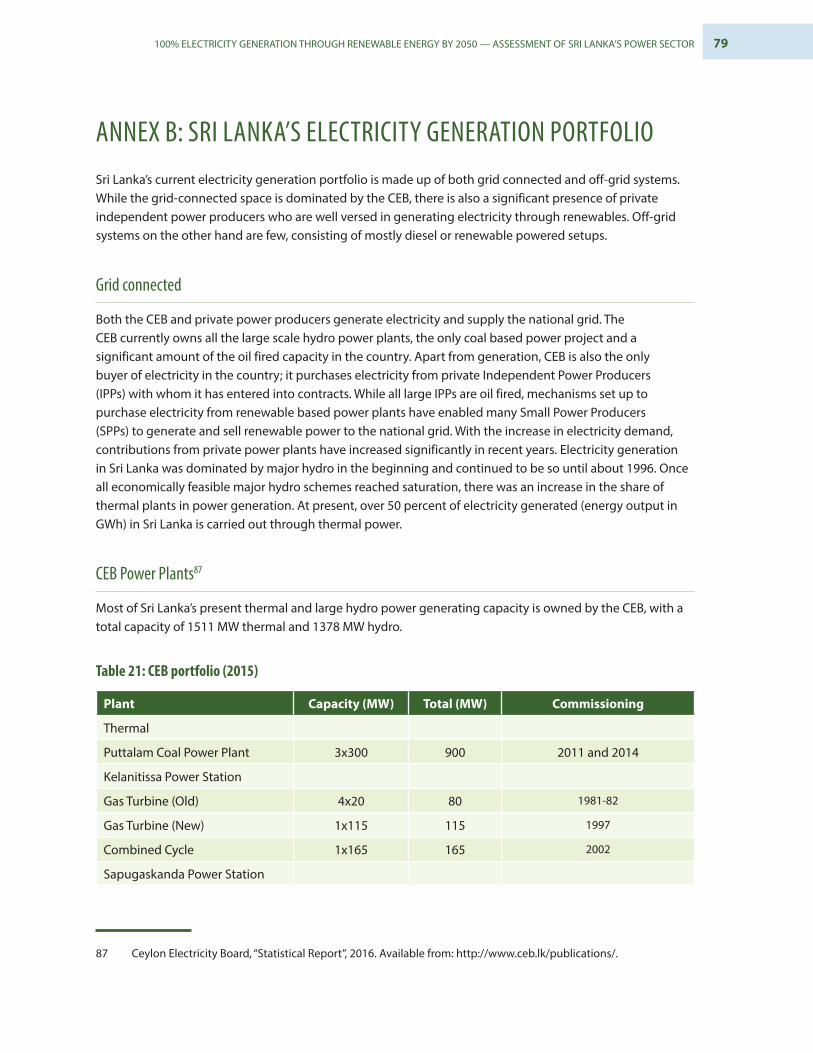
79100% ELECTRICITY GENERATION THROUGH RENEWABLE ENERGY BY 2050 — ASSESSMENT OF SRI LANKA’S POWER SECTOR
ANNEX B: SRI LANKA’S ELECTRICITY GENERATION PORTFOLIO Sri Lanka’s current electricity generation portfolio is made up of both grid connected and off-grid systems. While the grid-connected space is dominated by the CEB, there is also a significant presence of private independent power producers who are well versed in generating electricity through renewables. Off-grid systems on the other hand are few, consisting of mostly diesel or renewable powered setups.
Grid connected
Both the CEB and private power producers generate electricity and supply the national grid. The CEB currently owns all the large scale hydro power plants, the only coal based power project and a significant amount of the oil fired capacity in the country. Apart from generation, CEB is also the only buyer of electricity in the country; it purchases electricity from private Independent Power Producers (IPPs) with whom it has entered into contracts. While all large IPPs are oil fired, mechanisms set up to purchase electricity from renewable based power plants have enabled many Small Power Producers (SPPs) to generate and sell renewable power to the national grid. With the increase in electricity demand, contributions from private power plants have increased significantly in recent years. Electricity generation in Sri Lanka was dominated by major hydro in the beginning and continued to be so until about 1996. Once all economically feasible major hydro schemes reached saturation, there was an increase in the share of thermal plants in power generation. At present, over 50 percent of electricity generated (energy output in GWh) in Sri Lanka is carried out through thermal power.
CEB Power Plants87
Most of Sri Lanka’s present thermal and large hydro power generating capacity is owned by the CEB, with a total capacity of 1511 MW thermal and 1378 MW hydro.
Table 21: CEB portfolio (2015)
Plant Capacity (MW) Total (MW) Commissioning
Thermal
Puttalam Coal Power Plant 3x300 900 2011 and 2014
Kelanitissa Power Station
Gas Turbine (Old) 4x20 80 1981-82
Gas Turbine (New) 1x115 115 1997
Combined Cycle 1x165 165 2002
Sapugaskanda Power Station
87 Ceylon Electricity Board, “Statistical Report”, 2016. Available from: http://www.ceb.lk/publications/.

80 ANNEX B: SRI LANKA’S ELECTRICITY GENERATION PORTFOLIO
Plant Capacity (MW) Total (MW) Commissioning
Diesel (old) 4x20 80 1984
Diesel (Extn) 8x10 80 1997-99
Uthurujanani Power Station 3x9 27 2013
Colombo Power Ltd (heavy oil) 4x16 64 2000
Total Thermal 1511
Hydro
Laxapana area
Canyon 2x30 60 1983, 1989
Wimalasurendra 2x25 50 1965
Old Laxapana 3x9.5+2x12.5 53.5 1950, 1958
New laxapana 2x58 116 1974
Polpitiya 2x37.5 75 1969
Mahaweli area
Upper Kotmale 2x75 150 2012
Victoria 3x70 210 1984-86
Kotmale 3x67 201 1985, 1988
Randenigala 2x61 122 1986
Ukuwela 2x20 40 1976
Bowatenna 1x40 40 1981
Rantambe 2x24.5 49 1990
Samanala Area
Samanalawewa 2x60 120 1992
Kukule 2x35 70 2003
Other Small hydro 21
Wind 3
Total Hydro and Renewable 1380.5
Total CEB Portfolio 2890
The 900 MW Puttalam coal plant, funded by EXIM Bank of the People’s Republic of China and commissioned in 2011, was the latest thermal power plant added to the CEB system.
In the large hydro category, Sri Lanka has two main hydro power complexes, namely Laxapana and Mahaweli, each consisting of multiple units. The Laxapana complex is based on the Kelani River while the Mahaweli complex is based on the Mahaweli River. Other than these major schemes, there are two large-scale hydro power stations, namely Samanalawewa and Kukule Ganga, while small scale power plants such as Inginiyagala and Uda Walawa also generate hydropower.

81100% ELECTRICITY GENERATION THROUGH RENEWABLE ENERGY BY 2050 — ASSESSMENT OF SRI LANKA’S POWER SECTOR
Independent Power Producers (IPPs)88
IPPs mostly consist of diesel and combined cycle power plants along with a significant capacity of Non-Conventional Renewable Energy (NCRE).
Entering the Sri Lankan electricity market in 1997, IPPs supply electricity to the national grid, operating by entering into long term agreements with CEB. These contracts are individually executed under different terms and conditions. In 2014, seven IPPs were in operation in the Sri Lankan power sector.
Over this period, assisted by the enabling environment created by the Government and implemented by the Sri Lanka Sustainable Energy Authority (SLSEA), through measures such as the provision of attractive cost-based, technology-specific tariff schemes, the number of small power producers in Sri Lanka increased rapidly. These power plants are operated by private sector investors with the installed capacity of individual units limited to 10 MW and are usually funded by commercial banks.
Table 22: IPP Portfolio (2015)
Plant Capacity (MW) Total (MW) Commissioning
Asia Power Ltd (Fuel oil) 8x6.4 51 1998
AES Kelanitissa (Combine cycle) 1x110+1x55 165 2003
ACE Power Embilipitiya (Fuel oil) 14x7.11 100 2005
West Coast Power (Combine cycle, fuel oil) 3x100 300 2010
Northern Power (Fuel oil) 38 2009
Total Thermal 654
NCRE Mini Hydro 307
NCRE Wind 124
NCRE -Other 21
Total 1760
88 Ministry of Power and Renewable Energy – Sector at a Glance, 2016. Available from: http://powermin.gov.lk/english/?page_id=1507 and http://www.pucsl.gov.lk/english/wp-content/uploads/2016/03/Gen-Perforn-mance_2015-First-Half.pdf.

82 ANNEX B: SRI LANKA’S ELECTRICITY GENERATION PORTFOLIO
Technical performance of existing grid connected power plants89
Table 23 below presents the average technical performance of Sri Lankan power plants for the year 2015:
Table 23: Performance of existing power stations
Power Plant Station Heat Rate
(SHR) (kCal/kwh)
Min operating level (%)
Forced Outage
(%)
Sch Maintenance (Days/year)
O&M cost (US$/MW/Year)
Fuel oil based plant, Engine
2,000-2,100 NA 2-3 38-40 60,000-65,000
Gas Turbine, Diesel oil 2,850-2,900 70 29-34 35-50 35,000-40000
Combined Cycle PP- Oil, Naptha
1,900-2,000 65 8-9 30 20,000-22,000
Coal based PP 2,400 60 5 52 25,000-26,000
The highest efficiencies reported were in the combined cycle power plants operated by the CEB. These plants use diesel, fuel oil and naphtha as their fuel sources, possessing higher overall efficiencies along with other operational advantages compared with diesel engine power plants.
In most fast-growing countries in South Asia, the installed unit is of a larger size and therefore, operating efficiencies are much better (SHR of 2,200-2,300 kCal/kWh). However, considering the small unit size and age of existing units, the efficiency (or SHR) of Sri Lanka’s thermal plants is not below average. The average planned outage is much higher in Sri Lanka when compared with other South Asian countries.
Figure 28: Plant Load Factor (PLF) of various power plant segments
89 Ceylon Electricity Board (CEB), Long Term Generation Expansion Plan 2015-2034, 2015. Available from http://pucsl.gov.lk/english/wp-content/uploads/2015/09/Long-Term-Generation-Plan-2015-2034-PUCSL.pdf.
19.1
49.4
66.459.1
23.4
39.4
16.1
68.2
15.1
31
0
10
20
30
40
50
60
70
80
CEB- Hydro CEB- Thermal oil CEB- Thermal coal
IPP thermal Renewable
PLF
(per
cent
)
2014 2015

83100% ELECTRICITY GENERATION THROUGH RENEWABLE ENERGY BY 2050 — ASSESSMENT OF SRI LANKA’S POWER SECTOR
Although the minimum operating capacity of coal and gas based stations is in the range of 60-70 percent, interactions with relevant stakeholders revealed that the actual technical minimum is much lower (40-50 percent). This leads to situations where operating these plants cost-effectively during low demand conditions is tough due to the technological barriers involved.
With respect to CEB hydro and renewable power plants it must be noted that the overall plant load factors90 of have been improved (Figure 27) due to rich rainfall, which in turn has influenced the reduction of thermal oil plant dispatch91.
On the other hand, the PLF of IPP thermal plants had fallen to 15 percent in 2015 due to the commissioning of 2x300 MW units of Puttalam coal power projects by CEB in 2014-15. IPPs mainly operates fuel oil based plants which are mostly used as peak load stations at present. With the commissioning of additional base load units, IPP thermal plants saw a fall in their PLFs.
Off-grid electricity generation
Off-grid generation is available in some locations, usually due to the unavailability of the national grid or as a matter of policy. Additionally, standby power supplies are also available in most industrial and commercial facilities, although their generation is minimal due to the short-term nature of operation.
The two main areas of off-grid generation are:
■ Diesel generators utilized as a standby option to run only for short durations during grid failures;
■ RE systems, such as small hydro, wind and solar photovoltaic systems for households which are operated off-grid due to unavailability of the grid and other technical reasons.
Many industries use their own generation either as a matter of policy, utilizing grid supply only as a backup or owing to the non-availability of the grid.
Existing transmission system of Sri Lanka
The country’s transmission system is owned and maintained by the CEB, the sole electricity buyer, which purchases power from generation licensees through Power Purchase Agreements. Long-term transmission development studies are carried out by the CEB as a 10-year rolling plan to accommodate any new requirements and demand in the transmission system. Transmission planning is carried out based on generation planning.
90 Ministry of Power and Renewable Energy – Sector at a Glance, 2016. Available from: http://powermin.gov.lk/english/?page_id=1507 and http://www.pucsl.gov.lk/english/wp-content/uploads/2016/03/Gen-Perforn-mance_2015-First-Half.pdf.
91 Dispatch: Generation of power by a power plant which is subsequently transmitted to the grid. In this case due to increased use of RE and hydro power plants, the use (or dispatch/transmission of power) of thermal oil plants have reduced.

84 ANNEX B: SRI LANKA’S ELECTRICITY GENERATION PORTFOLIO
Electricity distribution and sales in Sri Lanka come under the purview of two state owned organizations:
■ Ceylon Electricity Board (CEB);
■ Lanka Electricity Company (Pvt.) Ltd. (LECO)
The CEB transmission system comprises 220kV and 132kV transmission networks interconnected to switching stations, grid substations and power stations. At grid substations, a 132-kV transmission line is converted to 33 kV for distribution within the locality. In some instances, the electricity at 33 kV is again converted to 11 kV at primary substations and then distributed to consumers. Distribution networks operated by LECO use 11 kV as the distribution voltage. However, both CEB and LECO supply at 400 V to small scale consumers such as households and commercial buildings.
The country’s total transmission and distribution (T&D) loss in 2015 was ~10 percent which is far superior to many South Asian countries. The country plans to contain the loss below 10 percent92 in the future.
92 Ministry of Power and Renewable Energy – Sector at a Glance, 2016. Available from: http://powermin.gov.lk/english/?page_id=1507 and http://www.pucsl.gov.lk/english/wp-content/uploads/2016/03/Gen-Perforn-mance_2015-First-Half.pdf .

85100% ELECTRICITY GENERATION THROUGH RENEWABLE ENERGY BY 2050 — ASSESSMENT OF SRI LANKA’S POWER SECTOR
ANNEX C: SRI LANKA POWER SECTOR STAKEHOLDERSThe Sri Lankan electricity sector is largely managed by state-owned corporations, along with private sector participation in power generation. There are two regulatory agencies involved in the electricity sector, the Public Utilities Commission of Sri Lanka (PUCSL) and Sri Lanka Sustainable Energy Authority (SLSEA).
Figure 28 below presents the key generation, transmission and distribution players in the electricity sector and their interactions.
Figure 29: Key electricity sector generation, transmission and distribution players
Ministry of Power & Energy
CEB owned (Hydro, Thermal, RE)
CEB (Region 1)
CEB (Region 1)
CEB (Region 1)
CEB (Region 1)
CEB (Region 1)
CEB (Single Buyer)
Regulator: Public Utility Commission of Sri Lanka (PUCSL)
IPPs (Hydro, Thermal, RE)
SLSEA
Generation Licensees
Distribution Licensees
Transmission Licensees
CEB

86 ANNEX C: SRI LANKA POWER SECTOR STAKEHOLDERS
Power Sector Stakeholders
Below is a detailed list of all the stakeholders that play a significant part in the operation of the Sri Lankan power sector.
Electricity Sector Government Ministries
Table 24: Electricity Sector Government Ministries
Main Organization Sub Organization Role in Sri Lanka
Ministry of Power and Renewable Energy
- The M/P&RE is the central ministry responsible for formulation and implementation of policies, programmes, and projects pertaining to power and energy. M/P&RE is also mandated to reform all systems and procedures to ensure the efficient conduct of business; monitor, plan, and develop electricity facilities throughout Sri Lanka, including hydropower, thermal power and NCRE; develop a sound electricity policy for the control, regulation, and utilization of energy resources; promote energy efficiency; and develop indigenous renewable energy resources.
Ceylon Electricity Board
The CEB is a state-owned utility which is engaged in power generation (the CEB has one licence and 25 power plants), transmission (one licence), distribution (four licences, serving 90 percent of consumers) and collection of revenue. CEB generation accounts for 66 percent of the installed capacity on the Sri Lanka grid. The remaining generation capacity is held by the private sector.
Sri Lanka Sustainable Energy Authority (SLSEA)
The SLSEA was established in October 2007, through the Sri Lanka Sustainable Energy Authority Act No. 35 of 2007, with a mandate to assist in developing the national policy on energy, and implement policy for renewable energy, energy efficiency and conservation. Promotion of renewable energy projects through private investment is another key aspect of SLSEA activity. The Authority currently functions under the purview of the Ministry of Environment and Natural Resources.
Ceylon Electricity Board
(Major shareholding)
Lanka Coal Company Pvt. Ltd.
(LCoC)
LCoC was incorporated to procure and supply coal for coal fired thermal plants of Sri Lanka.
With the commissioning of the first coal plant in Puttalam in 2011, a new company, LCoC was established under the M/P&RE to streamline the supply of coal required for the plant. LCoC now supplies coal to the three 300 MW power plant, with a supply of ~1.7 million tons of coal in 2014. Current shareholders are the CEB, the Ceylon Shipping Corporation, the Sri Lanka Ports Authority and the Government Treasury.
Lanka Electricity Company Pvt. Ltd.
(LECO)
LECO is a state-owned distribution company that purchases bulk power from the CEB Transmission Licensee, and distributes it to consumers. The LECO serves ~9 percent of consumers in a few urban areas. The LECO operates under the Sri Lanka Companies Act, and has the CEB and the Ministry of Finance (on behalf of the state) as major shareholders; other shareholders are also state entities.
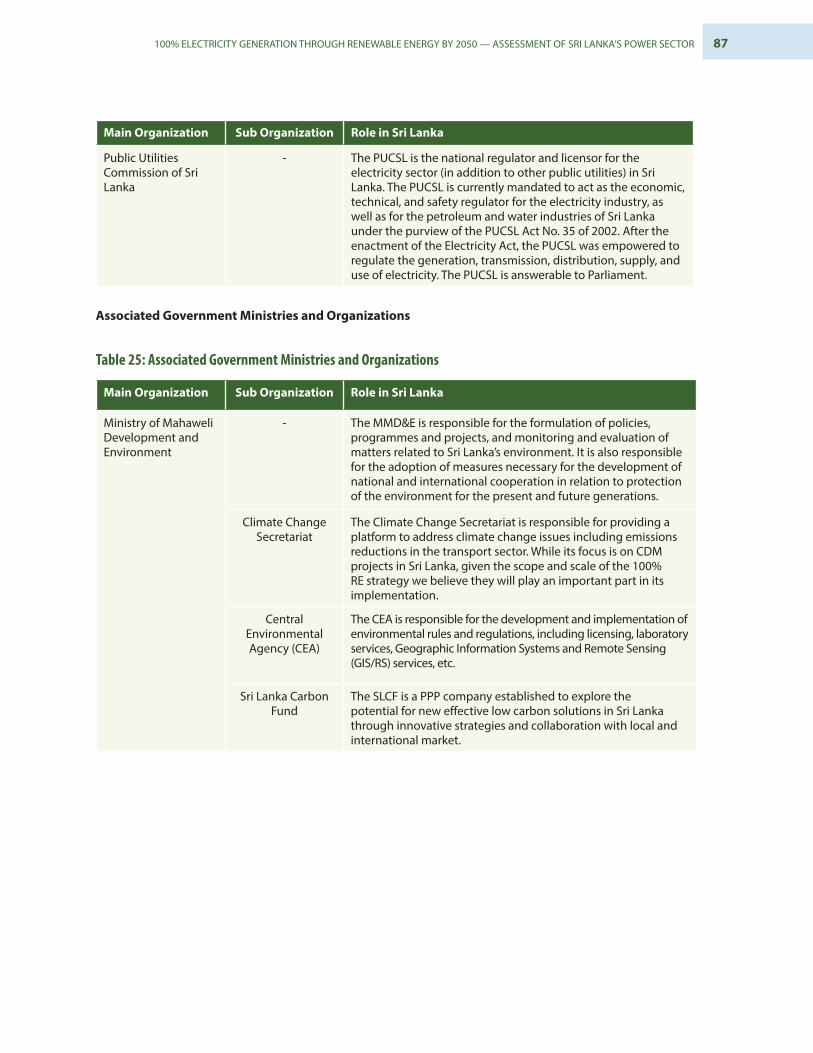
87100% ELECTRICITY GENERATION THROUGH RENEWABLE ENERGY BY 2050 — ASSESSMENT OF SRI LANKA’S POWER SECTOR
Main Organization Sub Organization Role in Sri Lanka
Public Utilities Commission of Sri Lanka
- The PUCSL is the national regulator and licensor for the electricity sector (in addition to other public utilities) in Sri Lanka. The PUCSL is currently mandated to act as the economic, technical, and safety regulator for the electricity industry, as well as for the petroleum and water industries of Sri Lanka under the purview of the PUCSL Act No. 35 of 2002. After the enactment of the Electricity Act, the PUCSL was empowered to regulate the generation, transmission, distribution, supply, and use of electricity. The PUCSL is answerable to Parliament.
Associated Government Ministries and Organizations
Table 25: Associated Government Ministries and Organizations
Main Organization Sub Organization Role in Sri Lanka
Ministry of Mahaweli Development and Environment
- The MMD&E is responsible for the formulation of policies, programmes and projects, and monitoring and evaluation of matters related to Sri Lanka’s environment. It is also responsible for the adoption of measures necessary for the development of national and international cooperation in relation to protection of the environment for the present and future generations.
Climate Change Secretariat
The Climate Change Secretariat is responsible for providing a platform to address climate change issues including emissions reductions in the transport sector. While its focus is on CDM projects in Sri Lanka, given the scope and scale of the 100% RE strategy we believe they will play an important part in its implementation.
Central Environmental Agency (CEA)
The CEA is responsible for the development and implementation of environmental rules and regulations, including licensing, laboratory services, Geographic Information Systems and Remote Sensing (GIS/RS) services, etc.
Sri Lanka Carbon Fund
The SLCF is a PPP company established to explore the potential for new effective low carbon solutions in Sri Lanka through innovative strategies and collaboration with local and international market.

88 ANNEX C: SRI LANKA POWER SECTOR STAKEHOLDERS
Main Organization Sub Organization Role in Sri Lanka
Ministry of Petroleum Resources Development
- The M/PRD is currently responsible for the upstream and downstream activities of the petroleum sector and is the policy making and chief accounting body of the following entities: the Ceylon Petroleum Corporation, the Ceylon Petroleum Storage Terminals Ltd and the Petroleum Resources Development Secretariat.
Ceylon Petroleum Corporation (CPC)
The CPC is responsible for the export, import, sales, supply and distribution of petroleum products in Sri Lanka. It is also responsible for carrying out exploration activities for production and refining of petroleum products.
Ceylon Petroleum Storage Terminals
Limited (CPSTL)
CPSTL was set up as a common user facility company established to facilitate petroleum storage & distribution activities in Sri Lanka.
Petroleum Resources
Development Secretariat (PRDS)
The PRDS was set up to design and monitor fiscal regimes for the petroleum sector that meet the country’s evolving economic needs, matching them with a stable, efficient regulatory framework that attracts investment and encourages knowledge transfer.
Ministry of Finance - The MoF is responsible for developing and executing Sri Lanka’s public finance policy, economic policy and long-term planning.
Ministry of Local Government and Provincial Councils
- The ministry is responsible for the development of efficient and effective provincial and local administrative system to promote sustainable and economic development. It is also responsible for the promotion of decentralized governance models at the local and provincial level.
Ministry of Urban Development and Sacred Area Development
- The M/UD&SAD is responsible for the development and maintenance of the infrastructure of Sri Lanka’s urban centers including major cities like Colombo.
Urban Development
Authority
The UDA is the principle planner and developer of sustainable urban centers in Sri Lanka.
Independent Power Producers (IPPs)
Apart from the ministries and organizations mentioned above, the Sri Lankan electricity market also consists of several Independent Power Producers responsible for setting up power generation projects across the country.
The power crises of the mid-1990s prompted the entry of independent power producers and these organizations are engaged in power generation through thermal generation (diesel engine and combined cycle as well as generation though a few small hydro plants. The next phase of capacity addition, especially in Renewable Energy segment, will be driven by IPPs. Listed below are some of the major players.

89100% ELECTRICITY GENERATION THROUGH RENEWABLE ENERGY BY 2050 — ASSESSMENT OF SRI LANKA’S POWER SECTOR
Table 26: Independent Power Producers (IPPs)
Main Organization Sub Organization Role in Sri Lanka
Senok Group Senok Wind Power Senok Group is a privately owned diversified group in Sri Lanka. The Group entered the wind power generation business and in June 2010, Senok Wind Power Pvt. Ltd. (WPP) commissioned the first 10 MW wind IPP located in Kalpitiya on the west coast of Sri Lanka. They also install and operate mini-hydro power plants across Sri Lanka.
Windforce Pvt. Ltd. - Windforce Pvt. Ltd. is one of the largest IPPs of wind power in Sri Lanka. They have an installed capacity of 50 MW of wind power plants across Sri Lanka connected to the national grid.
JLanka Technologies - JLanka is a known solar provider for domestic solar systems and has the highest number of solar installations across Sri Lanka. The solar systems installed supply 15,000 kWh per day to the national grid, saving 11,000 kg of greenhouse gas emissions per day.
LTL Holdings Lakdanavi Pvt. Ltd. Lakdanavi (Pvt) Ltd is a subsidiary of LTL and the largest independent power producer in Sri Lanka. Lakdanavi has completed a 300 MW Cycle Power Plant in Kerawalapitiya.
Lakdanavi Pvt. Ltd. Heladhanavi Limited
Heladhanavi Limited operates a 100 MW thermal power plant. The company is based in Puttalam, and operates as a subsidiary of Lakdhanavi Limited.
Asia Power Pvt. Ltd. - Asia Power (Private) Limited develops, owns, and operates an electric power plant in Sapugaskanda. It operates a diesel-fired power plant with a generation capacity of 51 MW. The company sells electricity to the Ceylon Electricity Board. Asia Power (Private) Limited is based in Colombo, Sri Lanka.
Colombo Power Pvt. Ltd.
- This IPP has installed the 60 MW Colombo Power Barge supplying base load power to the National grid in collaboration with Japan’s Kawasho Corporation.
AES Corporation AES Kelanitissa Pvt. Ltd.
The AES Kelanitissa Power Station, is a 168 MW diesel-fuel fired combined cycle power station, owned by AES Kelanitissa Private Limited, a subsidiary of AES Corporation.
Yughadhanavi Pvt. Ltd.
- Yughadhanavi (Kerawalapitiya) 300 MW Combined Cycle Gas Turbine Power Plant Sri Lanka is located at Kerawalapitiya, Colombo, Sri Lanka. It has 3 unit(s). The first unit was commissioned in 2008 and the last in 2010. It is operated by West Coast Power (Pvt) Ltd.
Northern Power Company Pvt. Ltd.
- Northern Power Company (Private) Limited is a power producer for a 30-Megawatt Heavy Fuel Oil Diesel Power Generating Facility. The company is based in Jaffna, Sri Lanka. As of November 9, 2007, Northern Power Company (Private) Limited is a subsidiary of MTD Capital Bhd.
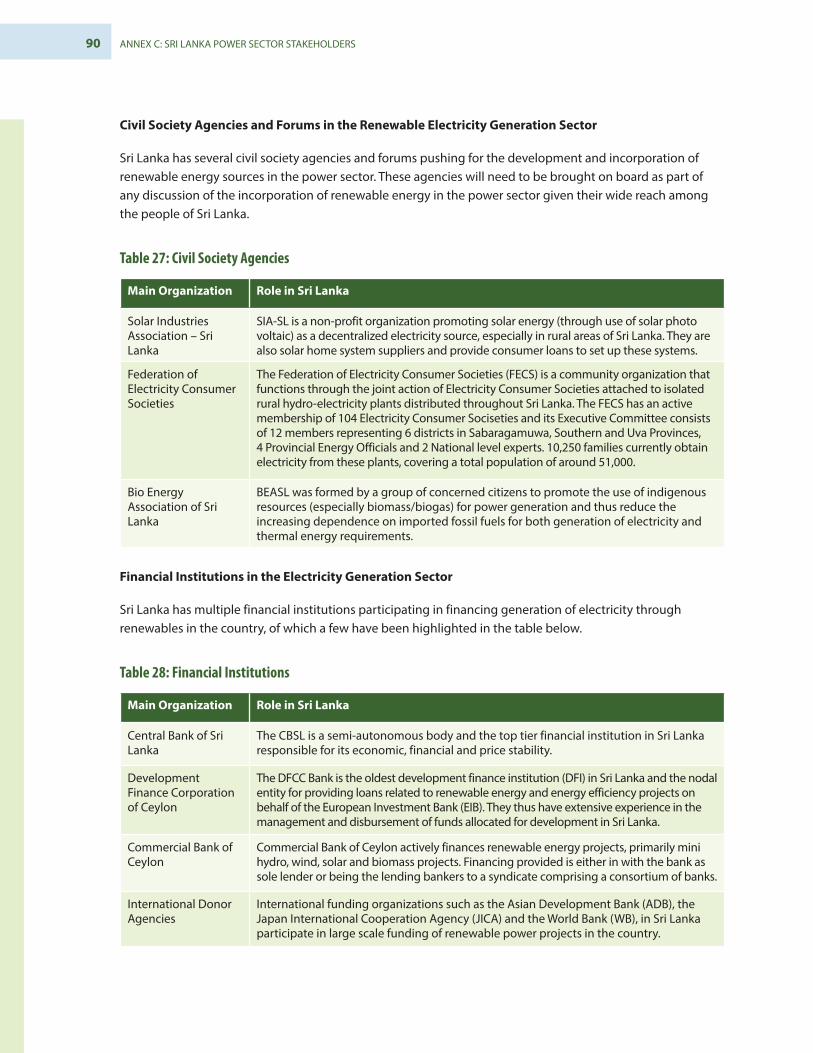
90 ANNEX C: SRI LANKA POWER SECTOR STAKEHOLDERS
Civil Society Agencies and Forums in the Renewable Electricity Generation Sector
Sri Lanka has several civil society agencies and forums pushing for the development and incorporation of renewable energy sources in the power sector. These agencies will need to be brought on board as part of any discussion of the incorporation of renewable energy in the power sector given their wide reach among the people of Sri Lanka.
Table 27: Civil Society Agencies
Main Organization Role in Sri Lanka
Solar Industries Association – Sri Lanka
SIA-SL is a non-profit organization promoting solar energy (through use of solar photo voltaic) as a decentralized electricity source, especially in rural areas of Sri Lanka. They are also solar home system suppliers and provide consumer loans to set up these systems.
Federation of Electricity Consumer Societies
The Federation of Electricity Consumer Societies (FECS) is a community organization that functions through the joint action of Electricity Consumer Societies attached to isolated rural hydro-electricity plants distributed throughout Sri Lanka. The FECS has an active membership of 104 Electricity Consumer Sociseties and its Executive Committee consists of 12 members representing 6 districts in Sabaragamuwa, Southern and Uva Provinces, 4 Provincial Energy Officials and 2 National level experts. 10,250 families currently obtain electricity from these plants, covering a total population of around 51,000.
Bio Energy Association of Sri Lanka
BEASL was formed by a group of concerned citizens to promote the use of indigenous resources (especially biomass/biogas) for power generation and thus reduce the increasing dependence on imported fossil fuels for both generation of electricity and thermal energy requirements.
Financial Institutions in the Electricity Generation Sector
Sri Lanka has multiple financial institutions participating in financing generation of electricity through renewables in the country, of which a few have been highlighted in the table below.
Table 28: Financial Institutions
Main Organization Role in Sri Lanka
Central Bank of Sri Lanka
The CBSL is a semi-autonomous body and the top tier financial institution in Sri Lanka responsible for its economic, financial and price stability.
Development Finance Corporation of Ceylon
The DFCC Bank is the oldest development finance institution (DFI) in Sri Lanka and the nodal entity for providing loans related to renewable energy and energy efficiency projects on behalf of the European Investment Bank (EIB). They thus have extensive experience in the management and disbursement of funds allocated for development in Sri Lanka.
Commercial Bank of Ceylon
Commercial Bank of Ceylon actively finances renewable energy projects, primarily mini hydro, wind, solar and biomass projects. Financing provided is either in with the bank as sole lender or being the lending bankers to a syndicate comprising a consortium of banks.
International Donor Agencies
International funding organizations such as the Asian Development Bank (ADB), the Japan International Cooperation Agency (JICA) and the World Bank (WB), in Sri Lanka participate in large scale funding of renewable power projects in the country.

91100% ELECTRICITY GENERATION THROUGH RENEWABLE ENERGY BY 2050 — ASSESSMENT OF SRI LANKA’S POWER SECTOR
ANNEX D: SRI LANKA POWER SECTOR REGULATORY REGIMEIn the early years of Sri Lanka’s independence, its power sector was run as a government department. In 1969, however, the government created the Ceylon Electricity Board (CEB), a public-sector vertically- integrated utility regulated by the Ministry of Power and Energy. The CEB was responsible for all functions of the power sector i.e. electricity generation, transmission, distribution and retail supply, with no competition from any other public or private player.
Figure 30: Sri Lanka Power Sector Reforms Timeline
It is important to note that with the participation of private players, Sri Lanka has witnessed capacity addition through NCRE sources.
The Electricity Act also mandated that the CEB transmission entity be the lone, single buyer of electricity in the country. The CEB’s separate divisions (generation, transmission and distribution) were not spun-off as separate entities.
As a result, CEB now holds six licences:
■ One generation licence for about 66 percent of all generating capacity in the grid;
■ One transmission licence for 100 percent of transmission and for 100 percent of bulk supply in accordance with the single-buyer model; and
■ Four distribution licences that in total cover approximately 91 percent of power customers.
Sri Lankan Power Sector’s Tariff Setting Methodology
Sri Lanka’s power tariff is highly cost reflective and is approved by the Public Utilities Commission of Sri Lanka (Commission) in accordance with Section 30 of the Sri Lanka Electricity Act, No. 20 of 2009. The tariff schedule reflects separately the costs of each generating, transmission, and distribution licensee providing electricity at specified times of the year. Also, the tariff permits each licensee to recover all reasonable costs incurred in carrying out its authorized activities on an efficient basis.

92 ANNEX D: SRI LANKA POWER SECTOR REGULATORY REGIME
The tariff components are grouped in the following manner:
■ Bulk Supply Tariffs or BST, covering the use of the transmission system and the tariff related to electricity generation;
■ Distribution Tariff, covering the use of the licensee’s distribution system; and
■ Retail Supply Tariff, covering the cost of supply of electricity from the distribution system to the customer.
Transmission customers only pay the bulk supply tariff, while other customers pay a tariff consisting of all other components.
Prices for capacity and energy sold by generators and purchased by the single buyers are defined in Power Purchase Agreements (PPAs), establishing commercial conditions for such sales and purchases. Generally, there are four types of PPAs:
■ PPAs between Independent Power Producers (IPPs) and the Transmission Licensee
■ PPAs between thermal power plants belonging to the Ceylon Electricity Board (CEB) Generation Licensee and the Transmission Licensee
■ PPAs between hydroelectric power plants belonging to CEB Generation Licensee and the Transmission Licensee
■ PPAs with Small Power Producers (SPP), also known as Small Power Purchase Agreements (SPPAs) and the Transmission Licensee
PPAs with IPPs and SPPs are derived through competitive bidding or based on negotiation. Generation tariffs for CEB plants are cost reflective and paid in two parts—fixed cost and variable cost (energy charge).
Economics of Power Generation from Various Sources/Technologies
In terms of the present cost of generation, hydro and coal based plants are clear winners over other fuel sources as well as renewable energy. However, it is expected that with technological innovation and market development, the cost of generation from RE sources will come down significantly and achieve tariff parity with coal. Table 29 below presents the cost of generation from various sources93 in Sri Lanka.
93 Ceylon Electricity Board (CEB), Long Term Generation Expansion Plan 2015-2034, 2015. Available from http://pucsl.gov.lk/english/wp-content/uploads/2015/09/Long-Term-Generation-Plan-2015-2034-PUCSL.pdf. CEB Long Term Generation Planning 2015-34 and Ministry of Power and Renewable Energy – Sector at a Glance, 2016. Available from: http://powermin.gov.lk/english/?page_id=1507 and http://www.pucsl.gov.lk/english/wp-con/-tent/uploads/2016/03/Gen-Performance_2015-First-Half.pdf.
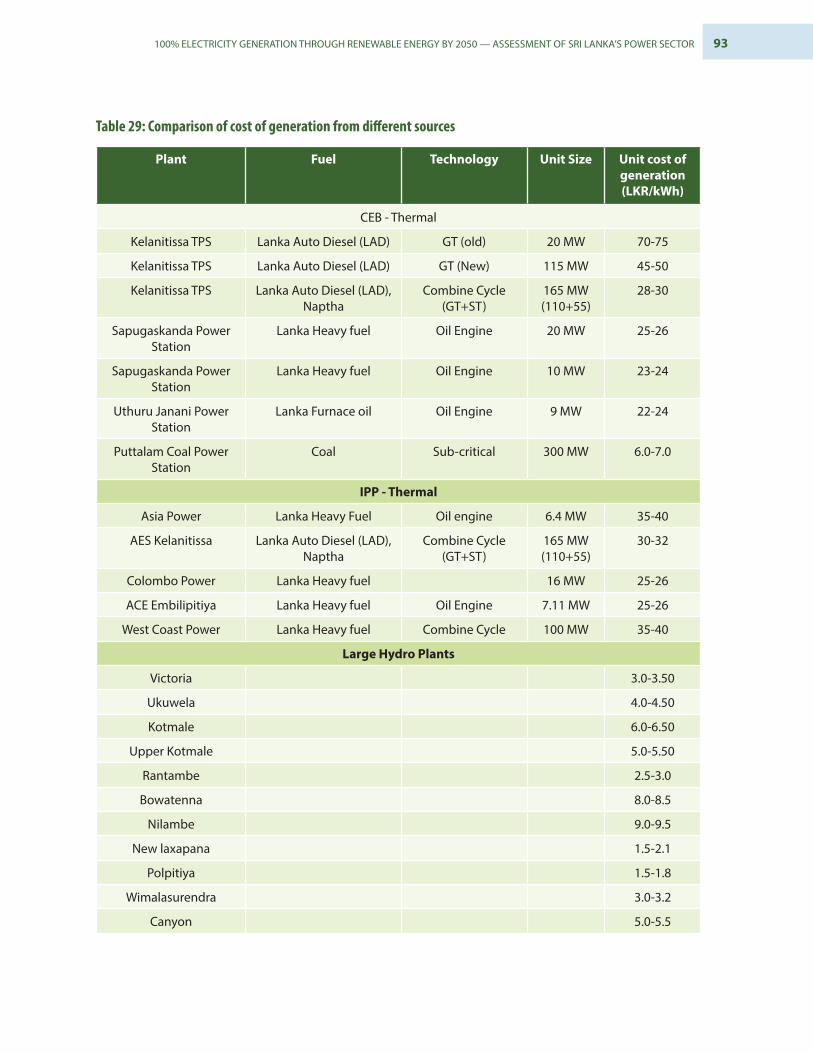
93100% ELECTRICITY GENERATION THROUGH RENEWABLE ENERGY BY 2050 — ASSESSMENT OF SRI LANKA’S POWER SECTOR
Table 29: Comparison of cost of generation from different sources
Plant Fuel Technology Unit Size Unit cost of generation (LKR/kWh)
CEB - Thermal
Kelanitissa TPS Lanka Auto Diesel (LAD) GT (old) 20 MW 70-75
Kelanitissa TPS Lanka Auto Diesel (LAD) GT (New) 115 MW 45-50
Kelanitissa TPS Lanka Auto Diesel (LAD), Naptha
Combine Cycle (GT+ST)
165 MW (110+55)
28-30
Sapugaskanda Power Station
Lanka Heavy fuel Oil Engine 20 MW 25-26
Sapugaskanda Power Station
Lanka Heavy fuel Oil Engine 10 MW 23-24
Uthuru Janani Power Station
Lanka Furnace oil Oil Engine 9 MW 22-24
Puttalam Coal Power Station
Coal Sub-critical 300 MW 6.0-7.0
IPP - Thermal
Asia Power Lanka Heavy Fuel Oil engine 6.4 MW 35-40
AES Kelanitissa Lanka Auto Diesel (LAD), Naptha
Combine Cycle (GT+ST)
165 MW (110+55)
30-32
Colombo Power Lanka Heavy fuel 16 MW 25-26
ACE Embilipitiya Lanka Heavy fuel Oil Engine 7.11 MW 25-26
West Coast Power Lanka Heavy fuel Combine Cycle 100 MW 35-40
Large Hydro Plants
Victoria 3.0-3.50
Ukuwela 4.0-4.50
Kotmale 6.0-6.50
Upper Kotmale 5.0-5.50
Rantambe 2.5-3.0
Bowatenna 8.0-8.5
Nilambe 9.0-9.5
New laxapana 1.5-2.1
Polpitiya 1.5-1.8
Wimalasurendra 3.0-3.2
Canyon 5.0-5.5

94 ANNEX D: SRI LANKA POWER SECTOR REGULATORY REGIME
Plant Fuel Technology Unit Size Unit cost of generation (LKR/kWh)
Samanalawewa 4.0-4.5
Kukule 3.0-3.5
Inginiyagala 2.5-3.0
Udawalawe 4.5-5
Renewables
Renewables 16-18
The capital costs associated with various technologies and fuel based capacities are shown in Table 30.94
Table 30: Capital cost comparison
Technology/Fuel Unit size (MW)
Total Unit cost (US$/
kW)
Const. period (year)
IDC* (%of pure
capital cost)
Total Unit cost (incl. IDC), US$/
kW
Economic life (Yrs.)
Gas Turbine- Auto Diesel
35 736 1.5 6.50 784 20
Gas Turbine- Auto Diesel
105 501 1.5 6.50 534 20
Combine Cycle- Auto diesel
140 1055 3 13.54 1198 30
Combine Cycle- Auto diesel
280 853 3 13.54 968 30
Combine cycle- LNG 300 1109 3 13.54 1259 30
New coal 300 1200 4 18.53 1422 30
Hydro 20-40 2111 4 18.50 2502 40
Solar 1000 1 6 1060 20
Wind 1100 1 6 1166 20
*IDC: Interest During Construction
Solar and Wind capital costs are as per prevailing global trends whereas other figures are as estimated by the CEB.
It is important to note that the cost of generation from coal and hydro based plants is much lower than other sources viz. fuel oil, gas and renewables. Though the initial capital cost of coal and hydro based plants are higher than RE and other sources, a higher load factor helps to reduce the cost of power.
94 Sources: CEB; KPMG research.

95100% ELECTRICITY GENERATION THROUGH RENEWABLE ENERGY BY 2050 — ASSESSMENT OF SRI LANKA’S POWER SECTOR
ANNEX E: SRI LANKA RENEWABLES POLICY LANDSCAPE Sri Lanka’s power sector policy landscape is dominated by The National Energy Policy and Strategies policy document formulated by the Ministry of Power and Renewable Energy in 2006. Apart from the National Energy Policy and Strategies document, the country has put forth multiple policies including its NDC to promote and incentivize the growth and incorporation of renewable energy in the power sector.
National Energy Policy and Strategies (NEPS 2008)95
The National Energy Policy and Strategies policy document was formulated by the Ministry of Power and Renewable Energy in 2006 and further updated in 2008 and 2010. The broad strategies defined under this policy are presented below:
Providing basic energy needs: The government wants to ensure 100 percent connection of all electricity consumers to the national electricity grid along with providing subsidies to marginalized communities to ensure access to the grid.
Ensuring energy security: This strategy intends to promote the following objectives in the realm of energy security:
■ Exploring alternative fuel opportunities;
■ Exploring cross border energy transfer;
■ Encouraging market players to maintain fuel reserves;
■ Bio-fuel as an alternate fuel option.
Promoting energy efficiency and conservation: This strategy has been formulated to develop demand and supply side energy management to ensure both demand and supply stakeholders use energy efficient technologies which are sustainable and viable. The strategy also calls for appropriate participation of private sector players to increase energy efficiency and optimize the existing petroleum distribution infrastructure in the country. Part of the strategy is an Energy Conservation Fund (ECF) to promote energy conservation activities.
Promoting indigenous resources: To promote the utilization of indigenous resources, this strategy has been formulated with the following objectives:
■ The government will seek concessionary financing for Electrical Energy Storage (EES) medium scale hydroelectric projects, which are not viable under commercial terms. (with commercial tariffs);
■ Promotion of access to CDM funding to popularize NCRE resources;
■ Promotion of biomass based projects in land surplus regions, to create rural income generation avenues;
■ Promotion of Waste to Energy projects.
95 Ministry of Power and Renewable Energy – About Us, 2016. Available from: http://powermin.gov.lk/en-glish/?page_id=1394.
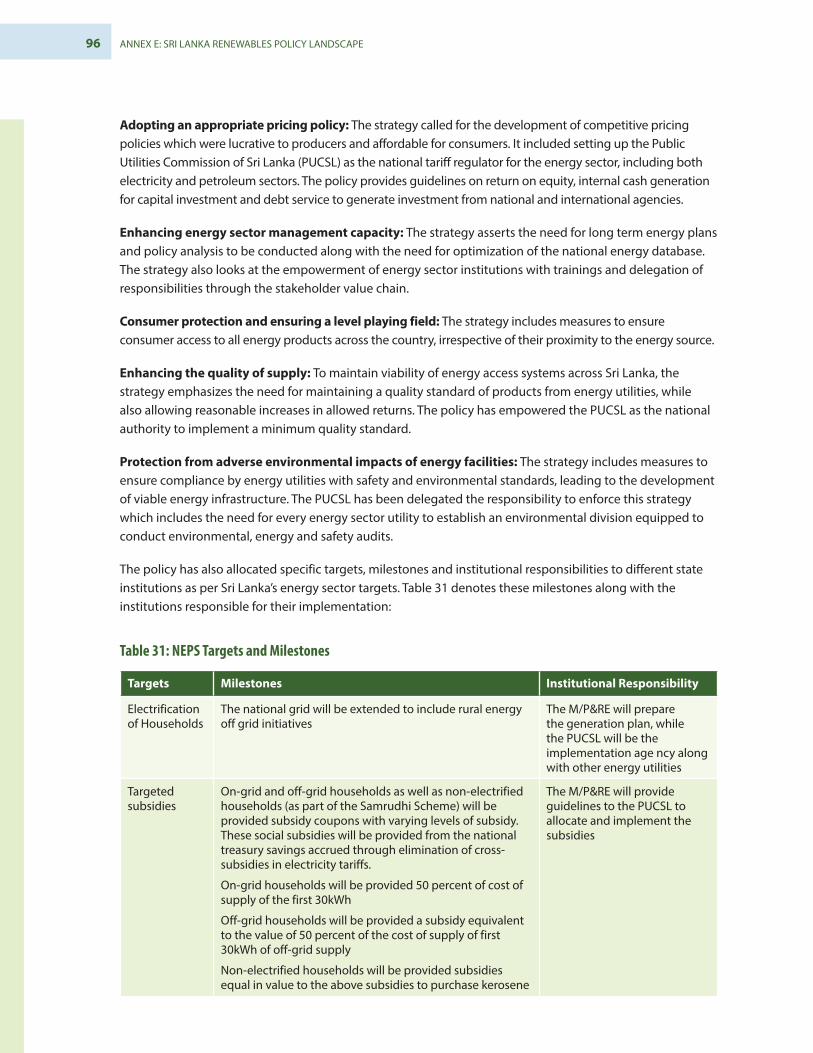
96 ANNEX E: SRI LANKA RENEWABLES POLICY LANDSCAPE
Adopting an appropriate pricing policy: The strategy called for the development of competitive pricing policies which were lucrative to producers and affordable for consumers. It included setting up the Public Utilities Commission of Sri Lanka (PUCSL) as the national tariff regulator for the energy sector, including both electricity and petroleum sectors. The policy provides guidelines on return on equity, internal cash generation for capital investment and debt service to generate investment from national and international agencies.
Enhancing energy sector management capacity: The strategy asserts the need for long term energy plans and policy analysis to be conducted along with the need for optimization of the national energy database. The strategy also looks at the empowerment of energy sector institutions with trainings and delegation of responsibilities through the stakeholder value chain.
Consumer protection and ensuring a level playing field: The strategy includes measures to ensure consumer access to all energy products across the country, irrespective of their proximity to the energy source.
Enhancing the quality of supply: To maintain viability of energy access systems across Sri Lanka, the strategy emphasizes the need for maintaining a quality standard of products from energy utilities, while also allowing reasonable increases in allowed returns. The policy has empowered the PUCSL as the national authority to implement a minimum quality standard.
Protection from adverse environmental impacts of energy facilities: The strategy includes measures to ensure compliance by energy utilities with safety and environmental standards, leading to the development of viable energy infrastructure. The PUCSL has been delegated the responsibility to enforce this strategy which includes the need for every energy sector utility to establish an environmental division equipped to conduct environmental, energy and safety audits.
The policy has also allocated specific targets, milestones and institutional responsibilities to different state institutions as per Sri Lanka’s energy sector targets. Table 31 denotes these milestones along with the institutions responsible for their implementation:
Table 31: NEPS Targets and Milestones
Targets Milestones Institutional Responsibility
Electrification of Households
The national grid will be extended to include rural energy off grid initiatives
The M/P&RE will prepare the generation plan, while the PUCSL will be the implementation age ncy along with other energy utilities
Targeted subsidies
On-grid and off-grid households as well as non-electrified households (as part of the Samrudhi Scheme) will be provided subsidy coupons with varying levels of subsidy. These social subsidies will be provided from the national treasury savings accrued through elimination of cross-subsidies in electricity tariffs.
On-grid households will be provided 50 percent of cost of supply of the first 30kWh
Off-grid households will be provided a subsidy equivalent to the value of 50 percent of the cost of supply of first 30kWh of off-grid supply
Non-electrified households will be provided subsidies equal in value to the above subsidies to purchase kerosene
The M/P&RE will provide guidelines to the PUCSL to allocate and implement the subsidies

97100% ELECTRICITY GENERATION THROUGH RENEWABLE ENERGY BY 2050 — ASSESSMENT OF SRI LANKA’S POWER SECTOR
Targets Milestones Institutional Responsibility
Fuel diversity and security
The country wants to reduce its dependence on hydropower and oil and explore other energy resources. These alternate resources currently include coal and non-conventional renewable energy (the NCRE: wind, solar, small hydro and biomass). Sri Lanka wants to achieve 10 a percent contribution from the NCRE by 2015, which has been successfully achieved. The government is aiming to replace petrol-based fuels by indigenous biomass fuels through incentives, and access to green funding such as CDM.
The PUCSL will be the major implementing agency along with electric utilities and petroleum sub-sector downstream players.
NCRE based electricity in the grid
The government will form an energy fund (to be managed by the ECF) which will be supported by funding from energy cess, donor grants and CDM funds. Biomass will be promoted as a new rural industry to feed in the electricity generated to the national grid. The government will provide technology specific incentives, which are based on actual energy supplied to the grid.
The PUCSL and ECF will be the primary agencies handling this target, with the ECF involved in promotion of NCRE technologies through a Long Term Non-Conventional Renewable Energy Plan (LTNREP). This plan will provide guidelines on pricing and resource pricing.
Petroleum sub-sector regulation and product pricing
The pricing structure will be developed using a price formula between the government, utilities and the PUCSL. The import and distribution of these products will be through common user facilities and will not receive any subsidies. The government will only provide kerosene subsidies to rural households.
This target will be implemented and regulated by the PUCSL along with close cooperation from petroleum sub-sector utilities and national treasury
Supply side energy efficiency
The government wants to reduce the transmission and distribution losses of energy utilities, optimize the country’s hydro-thermal power system output and increase production and transmission efficiency.
The PUCSL and energy utilities are responsible for achieving this target.
Demand side energy efficiency
The government intends to promote energy labelling, energy efficient appliances, promotion of energy efficiency as a parameter for loan viable projects.
The PUCSL, electric and petroleum utilities along with the ECF will be responsible for achieving this target.
Rural electrification
The government will create a special fund for rural electrification with funding from donor agencies, government incentives and electric distribution utilities to promote use of alternate on/ off grid electric connections to rural regions
The PUCSL, Ministry of Power and Energy and Ministry of Finance will jointly be responsible for achieving this target.
The highlights of the NEPS concerning the adoption of renewable energy are listed below:
■ Biomass-based energy projects to be developed in areas where land resources are available, enabling new industrial activities in such areas, emphasizing creating rural income generation avenues.
■ Efforts to be made to replace petroleum-based fuel with indigenous biomass fuel in industrial thermal applications by encouraging fuel switching initiatives through appropriate incentives, including facilitation of access to green funding such as CDM.
■ Commercial development of biomass to be encouraged and facilitated as a new rural industry, allowing the rural poor to engage in fuel-wool farming and participate in mainstream economy by supplying electricity to urban load centers.

98 ANNEX E: SRI LANKA RENEWABLES POLICY LANDSCAPE
■ The Government recognizes that certain NRE technologies would require incentives to ensure their capacity build-up to contribute to the national NRE target. These incentives will be provided on a competitive basis, in which the NRE developers will bid for a share of the NRE target subject to a price ceiling. NRE incentives will be technology-specific and based on actual energy supplied to the grid.
■ To make available the incentives for NRE technologies, the Government will create an “Energy Fund”, which will be managed by the ECF. This fund will be strengthened through an energy cess, grants received from donors and well-wishers, as well as any funds received under CDM.
■ NRE developments will not be charged any resource cost (royalty) for a period of 15 years from the commercial operation date. Resource cost charges from selected NRE technologies after the 15th year of commercial operation will be used to finance incentives for further NRE development, through the Energy Fund.
■ Supply side and end-use energy efficiency will be encouraged through financial and other incentives/ disincentives in respect of energy end-use mandatory measures such as appliance energy labelling, building codes and energy audits.
Sri Lanka Energy Sector Development Plan for a Knowledge-based Economy (2015-2025)96
The Sri Lanka Energy Sector Development Plan for a Knowledge-based Economy, was developed by the Ministry of Power and Renewable Energy to promote Energy Security and Self Sufficiency across Sri Lanka. To meet its energy needs, Sri Lanka needs to import 02 MM of crude oil, 04 MMT of refined petroleum products and 2.25 MMT of coal annually. This costs the government approximately US$5 billion in foreign exchange, which is nearly 25 percent of their import expenditure, and nearly 50 percent of total export income, resulting in a huge burden on its balance of trade and exchange rates.
The plan has envisioned the following targets to be achieved through certain thrust areas highlighted in the latter table:
■ To make Sri Lanka an energy self-sufficient nation by 2030
■ Increase the share of electricity generation from renewable energy sources from 50 percent in 2014 to 60 percent by 2020 and finally to meet the total demand from renewable and other indigenous energy resources by 2030.
■ Increase the electricity generation capacity of the system from 4,050 MW to 6,400 MW by 2025
■ Generate a minimum 1,000 MW of electricity using indigenous gas resources discovered in Mannar basin by 2020
■ Increase generation capacity of low cost thermal power plants fired by natural gas and biomass to 2,000 MW to reduce the generation costs and to diversify generation mix by 2020
96 Ministry of Power and Energy. 2014. Sri Lanka Energy Sector Development Plan for a knowledge based econ-omy. Available at [http://powermin.gov.lk/sinhala/wp-content/uploads/2015/03/ENERGY_EMPOWERED_NA-TION_2015_2025.pdf].

99100% ELECTRICITY GENERATION THROUGH RENEWABLE ENERGY BY 2050 — ASSESSMENT OF SRI LANKA’S POWER SECTOR
■ Provide affordable electricity coverage to 100 percent of the people of the country on a continuous basis before the end of 2015
■ Reduce the technical and commercial losses of the electricity transmission and distribution network from 11 percent to 8 percent by 2020
■ Reduce annual energy demand growth by 2 percent through conservation and efficient use
■ Reduce petroleum fuel use in the transport sub-sector by 5 percent by introducing alternative strategies such as efficient modes of transport and electrification of transport by 2020
■ Produce the total petroleum product demand of the country through our own refinery by 2025
■ Upgrade the quality of Gasoline and Diesel to EURO IV and EURO III respectively by 2018
■ Further enhance the quality and reliability of electricity and fuel supply
■ Broadening energy sector investment windows to include bonds, debentures, public private partnerships and other such novel financial instruments
■ Reduce the carbon footprint of the energy sector by 5 percent by 2025
The plan has broadly identified the following “Thrust Areas” to achieve their energy sector targets.
Table 32: Energy Sector Development Plan Targets and Strategies
Thrust Area Strategy
Integrated national energy policy formulation
■ There is a need for development of a national policy for the economic consolidation of Sri Lanka’s energy supply
■ Ensure fuel diversity and development of indigenous energy resources
■ Promotion of energy transfer agreements with neighbouring countries
■ Ensure access to grid-connected rural electrification schemes to the rural, poor non-electrified households
■ Development of special off-peak tariffs in agriculture and transport sectors
■ Ensure implementation of pricing mechanism with periodic reviews
A cleaner future through green energy
■ Promote the renewable energy share in the electricity generation mix
■ Establish a competitive bidding process for large solar and wind power projects, as well as promotion of net metering for small scale renewable energy projects
■ Establishment of a fuel wood exchange
■ Rehabilitation/ refurbishment of outdated hydro power plants
Conservation and efficient use of energy - a national priority
■ Need to enhance efficiency of power generation and petroleum refinery facilities
■ Reduce transmission and distribution losses to an optimum level
■ Energy efficiency in transport sector, user appliances, petroleum sector, while reducing the energy sector carbon footprint
■ Ensure promotion of sustainable urban development such as green buildings

100 ANNEX E: SRI LANKA RENEWABLES POLICY LANDSCAPE
Thrust Area Strategy
Customer satisfaction in service and quality
■ Ensure adherence to service and supply quality standard
■ Capacity building of energy sector professionals to meet challenges in the emerging competitive environment
■ Installation of smart meters and advance payment mechanism
Timely development of infrastructure
■ The power transmission network should be strengthened to cater to increased generation capacity
■ Ensure proximity of generation and transmission network through use of national corridors
■ Develop a natural gas transmission and distribution network
Efficient energy sector institutions and good governance
■ Simultaneous regulation of both upstream and downstream energy networks
■ Promotion of a transparent and equitable investment scenario
■ Implementation of competitive market mechanisms, with periodic Monitoring, Reporting and Verification (MRV) systems
■ Implementation of a transparent pricing approach
■ Decreased legal hindrances to sectorial development activities to ensure speedy implementation of projects.
■ Empowerment of energy based institutions
Innovative financing for a diverse energy sector
■ Identify and adopt innovative means of energy infrastructure financing
■ Reduce energy project related financial burdens through Bonds/Debentures/shares/ credit policy revamp
■ Restructure the CEB/CPC loan portfolio (CPC bonds – US$2 billion and CEB debentures – US$500 million) and implement of Asset Management policy effectively
Investment in R&D for cutting-edge product development
■ Promotion of domestic R&D institutions to develop indigenous technologies in energy conversion, storage, delivery, metering and billing to enhance the stake of renewable energy, carbon emissions avoidance and efficiency in the energy systems
■ Increased focus on Nuclear energy for Agriculture, Human health, Environment and Industry
■ Promotion of electric transport, smart meters and ICT solutions
Battle for Solar Energy - The Rooftop Initiative
Through a recent flagship initiative, The Ministry of Power and Renewable Energy has launched a new community based power generation project titled “Battle for Solar Energy” in collaboration with the Sri Lanka Sustainable Energy Authority (SLSEA), the Ceylon Electricity Board (CEB) and the Lanka Electricity Company (Private) Limited (LECO).
The initiative aims to promote the setting up of small solar power plants on the rooftops of households, religious places, hotels, commercial establishments and industries. The target is to add 200 MW of solar electricity to the national grid by 2020 and 1000 MW by 2025 through this intervention.
Under this programme, consumers will have multiple options to generate and use electricity in their premises. In the case of electricity, they can sell any excess to the national grid or bank it for later use.

101100% ELECTRICITY GENERATION THROUGH RENEWABLE ENERGY BY 2050 — ASSESSMENT OF SRI LANKA’S POWER SECTOR
According to the electricity usage the customer can select a preferred option from the following three schemes:
■ Net Metering
■ Net Accounting and
■ Micro Solar Power Producer
Net Metering: In this intervention, the customer is connected to the grid through a net metering system and must pay only for the total amount of electricity consumed. If the solar electricity production exceeds the electricity consumption of the premises, the balance amount can be carried forward for future use up to 10 years. No fee will be paid for the excess electricity produced. While existing net metering customers can switch to other schemes if they wish to, electricity units accumulated before the signing of the new agreement will not be carried forward.
Net Accounting: If the electricity generated by the solar rooftop system is greater than the total consumption, the consumer will be paid for the excess amount. If the consumption is greater than the generation, the consumer must pay for the excess consumed as per the existing electricity tariff structure.
Micro Solar Power Producer: The total electricity generated by the solar rooftop system would be purchased by the utility. The bill for electricity consumed is to be paid to the utility as usual.
The utility in turn will pay the solar electricity producers for the excess electricity exported to the grid on the following basis,97 with effect from the date of the agreement signed with the utility:
■ First seven years - LKR 22.00/kWh
■ 8th to 20th years - LKR 15.50/kWh
The installed capacity of the generating facility will not exceed the contract demand of the producer. The contract period is 20 years.
The existing net metering system, which was implemented in 2010 for small scale power generation, did not grow up as expected and it had become more popular among customers who had high energy consumption. Normal households were not attracted to the scheme. A lack of education and inability to arrange capital were key reasons behind the low response from consumers.
Currently numerous commercial banks in Sri Lanka provide loan facilities for the purchase of net metering systems. These loans are being given based on a payback period of five-seven years with 75 percent of the total amount of installation being provided under these schemes. It is believed that if a long-term loan facility can be arranged under a concessionary interest rate, all the above three options could be implemented affordably and the M/P&RE is taking steps to formulate such a scheme.
97 Ministry of Power and Renewable Energy.

102 ANNEX E: SRI LANKA RENEWABLES POLICY LANDSCAPE
The Government intends to cover a target of 100,000 households through the Battle for Solar Energy scheme.
■ Other policy initiatives and incentives for the incorporation of renewables in the power sector include:
■ Clear policy targets to develop NCRE resources wherein it envisions to increase the RE share of 10 percent in 2015 to 20 percent of total generation by 2020.
■ Promotion of competitive bidding for large scale RE projects (Solar and Wind Parks)
■ All IPPs have been provided with the following concessions:
— Exemption from import taxes for capital equipment
— Exemption from corporate taxes for 5–8 years
Apart from the policy interventions detailed above, the Government has also taken an interest in the development of domestic mechanisms for trading carbon credits, including Certified Emission Reductions (CERs) generated from domestic CDM projects. In this regard, the country is exploring numerous options.
Carbon Partnership Facility (CPF)
The Government of Sri Lanka is exploring opportunities for developing market instruments in carbon credits with the World Bank (WB) as part of the WB’s Carbon Partnership Facility (CPF). The CPF is one of the WB’s carbon finance instruments targeting the post-2012 period. The CPF’s objective is to develop emission reductions and support their purchase on a large scale through the provision of carbon finance to long-term investments. To scale up carbon finance, the CPF collaborates with governments and market participants on investment programmes and sector-based interventions that are consistent with low-carbon economic growth and the sustainable development priorities of developing countries.98
Additionally, in the international arena, Sri Lanka joined the Partnership for Market Readiness (PMR) group as the 18th implementing country in April 2016,99 receiving funding of US$350,000 to develop its Market Readiness Proposal (MRP).100 Sri Lanka has also sought help and support to:
■ Develop its domestic carbon markets (Clean Development Mechanism (CDM) and Sri Lanka Carbon Offset/ Crediting Scheme (SLCOS/ SLCCS))
■ Strengthen its national Monitoring Reporting and Verification (MRV) systems and registry tracking
■ Increase private investments in climate friendly development (green growth) activities in Sri Lanka.
■ Increase national capacity to develop regulations and institutional frameworks to develop, implement and enforce domestic and international market instruments.
98 Carbon Partnership Facility, 2016. Available from: http://cpf.wbcarbonfinance.org/. 99 PMR: Partnership for Market Readiness – Sri Lanka, 2016. Available from: https://www.thepmr.org/country/sri-lanka. 100 PMR: Partnership for Market Readiness, 2016. Available from: https://www.thepmr.org/system/files/documents/
Resolution%20PA14-2016-4%20Confirmation%20and%20Allocation%20Preparation%20Funding%20to%20Sri%20Lanka.pdf.

103100% ELECTRICITY GENERATION THROUGH RENEWABLE ENERGY BY 2050 — ASSESSMENT OF SRI LANKA’S POWER SECTOR
ANNEX F: SRI LANKA ELECTRICITY TARIFF STRUCTURESTo incentivize the adoption of renewable energy in electricity generation, the Sri Lankan Government has implemented multiple tariff structures based on the use of renewable energy aimed at different segments of the power sector. On the producer side, each tariff structure has been designed to consider the various technologies used in the generation of electricity through renewables.
At the same time, at the consumer end however, tariffs are determined based on the amount of electricity consumed irrespective of the source of generation.
CEB Tariff for NCRE101
For the CEB, the tariff is determined through a Standardized Power Purchase Agreement for NCRE, three tiered in nature. This consists of a fixed rate, an Operations and Maintenance (O&M) rate and a fuel rate.
Table 33: NCRE tariff for CEB
Technology/Source
O&M rate (Year 1-20) (LKR/kWh)
Escalable base fuel rate (Year 1-20)
(LKR/kWh)
Non-Escalable(fixed rate) (LKR/kWh)
Years 1-8 Years 9-15 Years 15-20
Mini Hydro 1.83 None 15.56 5.98 3.4
Wind 1.3 None 22.05 8.48 4.82
Biomass 1.52 12.25 9.67 3.72 2.11
Agro & Industrial waste
1.52 6.13 9.65 3.71 2.11
Waste Heat 0.48 None 9.14 3.52 2
The escalation rate (tariff increase rate) is decided every year. Any other renewable energy technology other than those specified above are offered a flat tariff of LKR3.10 / kWh (non-escalable for 20 years).
For IPPs, the NCRE tariff is determined either through competitive bidding or standardized power purchase agreements with CEB, which are cost reflective.
101 CEB Long Term Generation Planning 2015-34.
104 ANNEX F: SRI LANKA ELECTRICITY TARIFF STRUCTURES
Feed-in-Tariff (FIT) Policy
Sri Lanka introduced a Feed-in-Tariff (FIT) policy to promote renewable energy technologies, for power plants with a capacity less than 10 MW. The NCRE technologies applicable under this policy are:
■ Mini hydro
■ Mini hydro—local (local signifies that at least the hydro turbine used is locally manufactured
■ Wind
■ Wind—local (local signifies that at least the turbine blades are locally manufactured)
■ Biomass—dendro (biomass through dendro plant specially grown as fuel)
■ Biomass— agricultural / industrial waste (waste includes byproducts such as paddy husk, saw dust, sugar cane bagasse)
■ Municipal solid waste
■ Waste heat recovery
The FIT was initially launched with the “avoided cost” principle. Avoided cost represents the cost a utility would have incurred to provide the same amount of electricity from conventional fuel sources. However, this principle did not take into account fossil fuel subsidies and the three-year average used for calculating the cost of the FIT, when in reality the RE generation prices were continuously increasing, resulting in the estimated avoided costs being lesser than actual avoided costs. This avoided cost principle was used to set up mini hydro plants across the country, despite the discrepancies in tariffs set.
In 2007, with the launch of SLSEA, the avoided cost principle was replaced with technology-specific cost-based tariff calculation, which was either a fixed tariff or a three-tier tariff structure. Following detailed stakeholder consultations and public hearings in 2011, PUCSL announced the following rates of NCRE purchased from the transmission licensee, CEB, under the two tariff structures:
Fixed Tariff Structure
The fixed tariff structure or flat rate is a constant tariff rate over a period of 20 years wherein the same cash outflows are considered. This includes the first year’s estimated escalation applied over the duration of the project, and an all-inclusive tariff is determined for the technology utilized.

105100% ELECTRICITY GENERATION THROUGH RENEWABLE ENERGY BY 2050 — ASSESSMENT OF SRI LANKA’S POWER SECTOR
Table 34: Fixed Tariff Structure
Technology All inclusive rate (LKR/ kWh) for 20 years
Mini-hydro 13.04
Mini-hydro local 13.32
Wind 19.43
Wind local 19.97
Biomass-dendro 20.70
Biomass-agricultural/ industrial waste 14.53
Municipal waste 22.02
Waste heat recovery 6.64
Three-Tier Tariff Structure
The three-tier tariff is distributed across three tiers over a period of 20 years. The tiers are as follows:
■ The first eight years of the project is considered tier 1; the cash outflow includes loan repayments for six years, annual Operations and Maintenance (O&M) costs, return on equity and fuel costs.
■ The next seven years is categorized as tier 2; the cash outflow includes annual O&M costs, return on equity and fuel costs.
■ Finally, the next five years constitute tier 3; the cash outflow includes the annual O&M costs, fuel costs and an incentive payment.
The structure and the associated tariffs for the various technology sources are shown in Table 35 below.
Table 35: Three Tier Tariff Structure
Technology Escalable (LKR/kWh)
Non-Escalable fixed rate (LKR/kWh)
Escalable base rate
(year 16+) (LKR/kWh)
Royalty to govt. paid direct by
the power purchaser (year 16+)
Base O&M rate
Base fuel rate
Year 1-8 Year 9-15
Mini-hydro 1.61 None 12.64 5.16 1.68 10% of total tariff
Mini-hydro local
1.65 None 12.92 5.28 1.68 10% of total tariff
Wind 3.03 None 17.78 7.26 1.68 10% of total tariff
Wind local 3.11 None 18.28 7.47 1.68 10% of total tariff

106 ANNEX F: SRI LANKA ELECTRICITY TARIFF STRUCTURES
Technology Escalable (LKR/kWh)
Non-Escalable fixed rate (LKR/kWh)
Escalable base rate
(year 16+) (LKR/kWh)
Royalty to govt. paid direct by
the power purchaser (year 16+)
Base O&M rate
Base fuel rate
Year 1-8 Year 9-15
Biomass-dendro
1.29 (year 1-15)
1.61 (year 16+)
9.10 7.58 3.10 1.68 No royalty
Biomass-agricultural/ industrial waste
1.29 (year 1-15)
1.61 (year 16+)
4.55 7.58 3.10 1.68 No royalty
Municipal waste
4.51 1.75 15.16 6.19 1.68 No royalty
Waste heat recovery
0.43 None 7.13 2.65 1.68 No royalty
Escalation rate for year 2010
7.64% 5.09% None None 5.09% -
In 2011, the government announced a tariff cap of LKR20.70 per kWh for a 20-year period for NCRE projects, using technologies applicable under the policy, which currently do not have a declared tariff.
While the FIT policy was popular amongst wind and biomass projects, it faced criticism from various stakeholders. These criticisms have been highlighted below:
■ The policy does not consider economies of scale. By categorizing all projects using the same technology as a normal sized project, instead of benchmarking projects and evaluating them based on their scale, large projects (close to 10MW) make more profits as compared to small scale projects.
■ The plant factors are similar for different fuel sources in similar renewable energy projects.
■ Lack of trust/ faith of financial institutions in the financial viability of NCRE projects (except solar and wind) even with the tariffs set as part of the FIT policy.
■ While the FIT policy promotes the growth of renewable energy, there is no provision for upgrading the national grid infrastructure to absorb the additional renewable power generated. This makes the grid susceptible to failures resulting in grid instability.
Electricity Tariff for End Consumers
Unlike generation, the CEB has a monopoly over electricity transmission while the distribution business is shared by the CEB and LECO. Table 37 below presents the average selling price of electricity (in LKR/kWh) to consumers.102
102 SLSEA, 2014. Available from: http://www.info.energy.gov.lk/content/pdf3/2014%20Energy%20Balance.pdf

107100% ELECTRICITY GENERATION THROUGH RENEWABLE ENERGY BY 2050 — ASSESSMENT OF SRI LANKA’S POWER SECTOR
Table 36: Average selling price of electricity
LKR/kWh 2010 2011 2012 2013 2014
CEB 13.10 13.42 15.73 18.05 18.52
LECO 13.03 13.63 15.56 17.73 18.69
National Average 13.05 13.60 15.71 18.01 18.54
While the average selling price of a unit of electricity has increased over time in Sri Lanka, tariffs for domestic consumers are determined based on the amount of electricity consumed.
Table 37: Tariff for Domestic Users
Low Users (Monthly consumption <= 60 Units)
Consumption per month (kWh) Energy (per unit) charge (LKR/kWh)
Fixed charge
(LKR/month)
0 – 30 2.50 30.00
31 – 60 4.85 60.00
Remaining Users (Monthly consumption > 60 Units)
Consumption per month (kWh) Energy (per unit) charge (LKR/kWh)
Fixed charge
(LKR/month)
0 – 60 7.85 -
61 – 90 10.00 90.00
91 – 120 27.75 480.00
121 – 180 32.00 480.00
More than 180 45.00 540.00
Similarly, non-domestic consumers are segregated into multiple categories and each category is then charged based on the amount of electricity consumed. The individual categories and their respective tariffs can be found at http://www.pucsl.gov.lk/english/information-centre/tariff-revision-2013/.
Thus, unlike tariffs for producers, consumer tariffs in Sri Lanka are independent of the source of electricity. This lack of prioritization of electricity generated through renewables coupled with lower operating costs of fossil- fueled power plants has resulted in a reluctance to invest in renewable electricity generation systems in Sri Lanka.

108 ANNEX G: CEB DEMAND ASSESSMENT AND GENERATION PLANNING
ANNEX G: CEB DEMAND ASSESSMENT AND GENERATION PLANNINGThe CEB is responsible for the development and maintenance of an efficient, co-ordinated and economical system of electricity supply throughout Sri Lanka. As a result, the CEB revises the Long-Term Generation Expansion Plan (LTGEP) every two years, an exercise carried out in intense consultation with Transmission and Generation Planning Branch of the CEB.
As part of the LTGEP, the CEB develops a detailed “base case demand and supply” based on which future power generation expansion is planned.
To estimate future electricity demand, the CEB adopted an econometric model. In this model, demand has been estimated and analysed against multiple independent variables. Key variables considered for modeling were:
■ Sectoral GDP growth (domestic, commercial, industrial, agriculture)
■ Services sector GDP
■ Past demand
■ Past GDP growth
■ Average electricity price
■ Domestic consumer accounts
A regression model was built and regression coefficients were used to forecast electricity demand. An estimated total Transmission and Distribution loss was added to the total energy demand forecast to derive the net energy generation forecast. Furthermore, future load factors were derived by fitting a linear curve to the adjusted past load factors. Since the contribution of NCRE affects the peak demand, load factors were adjusted by adding their future capacity contribution while peak demand forecast was derived using the load factor forecast and energy generation forecast.

109100% ELECTRICITY GENERATION THROUGH RENEWABLE ENERGY BY 2050 — ASSESSMENT OF SRI LANKA’S POWER SECTOR
Base Case Demand and Supply Forecast
Table 38 below presents the “Base Case Demand and Supply forecast” to 2034.103
Table 38: Base case demand-supply forecast
Year Demand (GWh) T&D Loss (%) Generation (GWh) Peak Demand (MW)
2016 12015 10.68 13452 2483
2017 12842 10.62 14368 2631
2018 13726 10.57 15348 2788
2019 14671 10.51 16394 2954
2020 15681 10.46 17513 3131
2021 16465 10.40 18376 3259
2022 17288 10.35 19284 3394
2023 18155 10.29 20237 3534
2024 19069 10.23 21242 3681
2025 20033 10.18 22303 3836
2026 21050 10.12 23420 4014
2027 22125 10.07 24602 4203
2028 23243 10.01 25828 4398
2029 24402 9.96 27101 4599
2030 25598 9.90 28411 4805
2031 26827 9.84 29755 5018
2032 28087 9.79 31135 5235
2033 29395 9.73 32563 5459
2034 30759 9.68 34056 5692
103 CEB Long Term Generation Planning 2015-34.

110 ANNEX G: CEB DEMAND ASSESSMENT AND GENERATION PLANNING
To meet the above energy requirement and peak demand, base case installed capacity is presented in Table 39 below.104
Table 39: Forecast of supply by source
Year Gas Turbine (MW)
Combined cycle (MW)
Fuel oil + Diesel (MW)
Coal (MW)
Large Hydro (MW)
NCRE (MW)
Total (MW)
2015 178 594 307 825 1335 442 3681
2016 178 594 307 825 1335 487 3726
2017 113 594 307 825 1490 562 3891
2018 183 594 256 825 1490 727 4075
2019 218 594 186 825 1490 802 4115
2020 218 594 96 1279 1536 972 4695
2021 218 594 96 1279 1536 1062 4785
2022 218 594 96 1819 1576 1142 5445
2023 105 594 61 1819 1576 1217 5372
2024 105 594 61 2089 1576 1297 5722
2025 105 594 26 2089 1776 1367 5957
2026 105 594 26 2089 2176 1407 6397
2027 105 594 26 2359 2176 1482 6742
2028 105 594 26 2359 2176 1524 6784
2029 105 594 26 2629 2176 1604 7134
2030 105 594 26 2899 2176 1659 7459
2031 105 594 26 2899 2176 1704 7504
2032 105 594 26 3439 2176 1759 8099
2033 105 270 26 3439 2176 1819 7835
2034 105 270 26 3709 2176 1884 8170
According to the current long term planning document prepared by the CEB, capacity addition is envisaged from both coal and NCRE sources. The base case envisages that in the next 20 years, ~3000 MW coal based, ~1500 MW NCRE, ~800 MW large hydro and ~105 MW GT based capacity will be added.
Large Hydro: The hydro potential in the country has already been developed to a great extent. Several prospective hydro projects have been identified in the Master Plan Study, 1989. Some major hydro projects identified in the Master Plan Study are in the developing stage, especially Broadlands (35MW) and Moragolla
104 Ceylon Electricity Board (CEB), Long Term Generation Expansion Plan 2015-2034, 2015. Available from http://pucsl.gov.lk/english/wp-content/uploads/2015/09/Long-Term-Generation-Plan-2015-2034-PUCSL.pdf.

111100% ELECTRICITY GENERATION THROUGH RENEWABLE ENERGY BY 2050 — ASSESSMENT OF SRI LANKA’S POWER SECTOR
(31MW). Some major irrigation projects such as Uma Oya (120MW), Gin Gaga (20MW), Moragahakanda (25MW) and Thalpitigala (15MW) are also to be completed soon.
Pumped Storage: Currently, in Sri Lanka, peak demand is met by existing hydro and thermal generation. In the future, with limited development of large hydro and higher penetration of NCRE with induced variability, the option of pumped storage is likely to be explored; 600 MW of pump storage is planned by 2025. The unit sizes have not yet been finalized.
Thermal Power: Thermal power will remain a prominent source of electricity to meet the growing requirement. The long term plan envisages that coal capacity will be added after 2020. In the near term, 3x35 MW GT-based capacity will be added to compensate for the retirement of oil based plants.
Non-Conventional Renewable Energy (NCRE): Sri Lanka has exploited large conventional renewable resources (hydro) almost to their maximum potential. Non-Conventional Renewable Energy (NCRE) has now become a prime potential source of energy for the future, especially considering the low impact on the environment as compared to conventional sources of energy. NCRE sources in Sri Lanka include mini hydro, wind, biomass and solar. Growth in the NCRE segment is expected to be driven mainly by private sector participation. Though the total contribution from NCRE to the national grid is presently 10 percent, by 2020, the contribution is likely to surpass 20 percent.
Projects Planned or Committed as per Base Case Scenario105
Table 40 below lists all the projects that the CEB has currently planned or committed based on the base case scenario developed as part of the LTGEP.
Table 40: Projects Planned as per LTGEP Base Case Scenario
Year Large Hydro and NCRE Addition Thermal Addition
2016 None None
2017 35 MW Broadlands HPP120 MW Uma Oya HPP
None
2018 100 MW Mannar Wind Park Phase I 2x35 MW Gas Turbine
2019 None 1x35 MW Gas Turbine
2020 31 MW Moragolla HPP15 MW Thalpitigala HPP
100 MW Mannar Wind Park Phase II
2x250 MW Coal Power Plants Trincomalee Power Company Limited
2021 50 MW Mannar Wind Park Phase II None
2022 20 MW Seethawaka HPP20 MW Gin Ganga HPP
50 MW Mannar Wind Park Phase III
2x300 MW New Coal Plant – Trincomalee -2, Phase – I
105 Ceylon Electricity Board (CEB), Long Term Generation Expansion Plan 2015-2034, 2015. Available from http://pucsl.gov.lk/english/wp-content/uploads/2015/09/Long-Term-Generation-Plan-2015-2034-PUCSL.pdf.
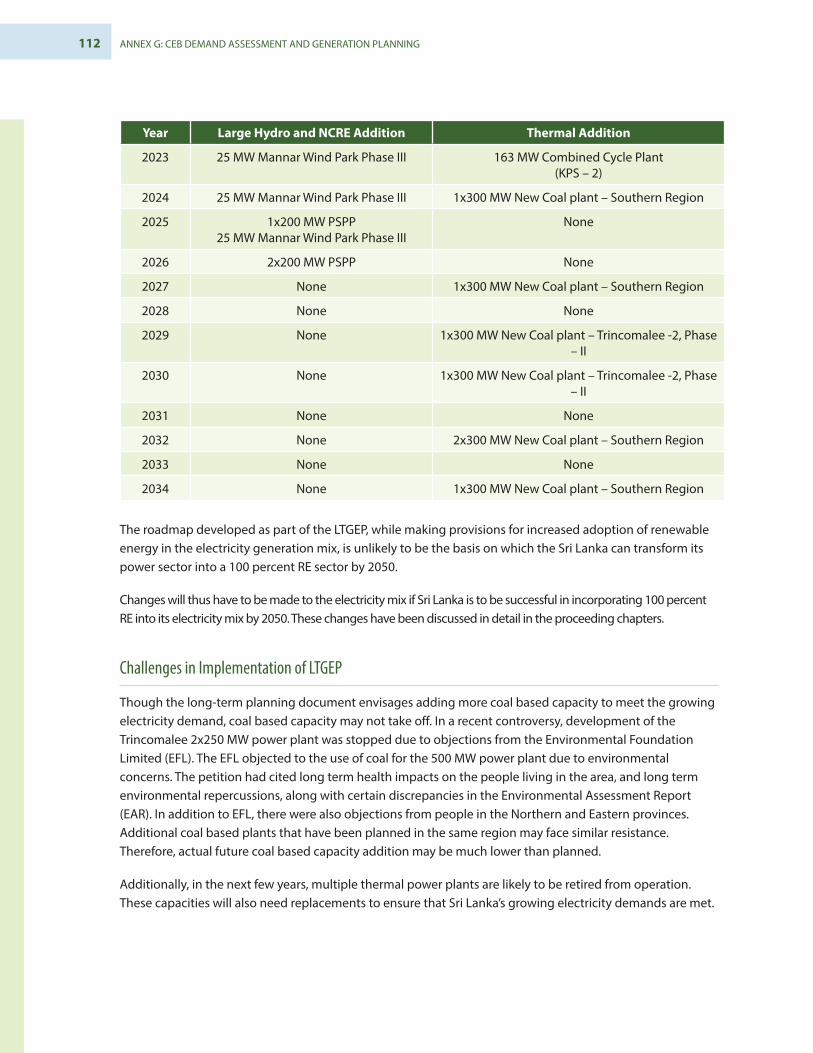
112 ANNEX G: CEB DEMAND ASSESSMENT AND GENERATION PLANNING
Year Large Hydro and NCRE Addition Thermal Addition
2023 25 MW Mannar Wind Park Phase III 163 MW Combined Cycle Plant(KPS – 2)
2024 25 MW Mannar Wind Park Phase III 1x300 MW New Coal plant – Southern Region
2025 1x200 MW PSPP25 MW Mannar Wind Park Phase III
None
2026 2x200 MW PSPP None
2027 None 1x300 MW New Coal plant – Southern Region
2028 None None
2029 None 1x300 MW New Coal plant – Trincomalee -2, Phase – II
2030 None 1x300 MW New Coal plant – Trincomalee -2, Phase – II
2031 None None
2032 None 2x300 MW New Coal plant – Southern Region
2033 None None
2034 None 1x300 MW New Coal plant – Southern Region
The roadmap developed as part of the LTGEP, while making provisions for increased adoption of renewable energy in the electricity generation mix, is unlikely to be the basis on which the Sri Lanka can transform its power sector into a 100 percent RE sector by 2050.
Changes will thus have to be made to the electricity mix if Sri Lanka is to be successful in incorporating 100 percent RE into its electricity mix by 2050. These changes have been discussed in detail in the proceeding chapters.
Challenges in Implementation of LTGEP
Though the long-term planning document envisages adding more coal based capacity to meet the growing electricity demand, coal based capacity may not take off. In a recent controversy, development of the Trincomalee 2x250 MW power plant was stopped due to objections from the Environmental Foundation Limited (EFL). The EFL objected to the use of coal for the 500 MW power plant due to environmental concerns. The petition had cited long term health impacts on the people living in the area, and long term environmental repercussions, along with certain discrepancies in the Environmental Assessment Report (EAR). In addition to EFL, there were also objections from people in the Northern and Eastern provinces. Additional coal based plants that have been planned in the same region may face similar resistance. Therefore, actual future coal based capacity addition may be much lower than planned.
Additionally, in the next few years, multiple thermal power plants are likely to be retired from operation. These capacities will also need replacements to ensure that Sri Lanka’s growing electricity demands are met.

113100% ELECTRICITY GENERATION THROUGH RENEWABLE ENERGY BY 2050 — ASSESSMENT OF SRI LANKA’S POWER SECTOR
Table 41 below lists the power projects that are due for retirement.106
Table 41: Schedule of plant retirement
Year Thermal retirement
2016 4x15 MW Colombo Power Plant14x7.11 MW ACE Power Embilipitiya
2017 4x17 MW Kelanitissa Gas Turbines
2018 8x6.13 MW Asia Power
2019 4x18 MW Sapugaskanda diesel
2020 4x15 MW CEB Barge Power Plant6x5 MW Northern Power
2021 -
2022 -
2023 163 MW AES Kelanitissa Combined Cycle Plant++115 MW Gas Turbine
4x9 MW Sapugaskanda Diesel Ext.
2024 -
2025 4x9 MW Sapugaskanda Diesel Ext.
2026 -
2027 -
2028 -
2029 -
2030 -
2031 -
2032 -
2033 165 MW Combined Cycle Plant (KPS)163 MW Combined Cycle Plant (KPS – 2)
2034 -
Approximately 210 MW of thermal capacity is due for retirement by 2018 itself. With the achievement of plant life and increasing focus on the adoption of more efficient technology, a significant amount of existing capacity will retire in the next 10-15 years.
Coupled with growing concerns over climate change and sustainability, these coal based capacities will need to be replaced by other suitable alternatives, which in Sri Lanka’s case is most likely going to be renewables.
106 Ceylon Electricity Board (CEB), Long Term Generation Expansion Plan 2015-2034, 2015. Available from http://pucsl.gov.lk/english/wp-content/uploads/2015/09/Long-Term-Generation-Plan-2015-2034-PUCSL.pdf.

Min
i hyd
ro, S
ri La
nka.
Pho
to c
redi
t: D
omin
ic S
anso
ni, W
B


SECTION TITLE
United Nations Development Programme304 E 45th StreetNew York, NY 10017, USA
Asian Development Bank6 ADB Avenue, Mandaluyong City1550 Metro Manila, Philippineswww.adb.org
Empowered lives. Resilient nations.