Embed Size (px)
Citation preview

Carbon footprint of electricity generation
Stephanie Baldwin
POST
www.parliament.uk/post
Provides information on S&T based issues to Parliamentarians
NOT party political
Independent, impartial, balanced – no recommendations
Seek input from industry, academia, government, NGO’s
Peer reviewed by these external experts
What is POST’s role?
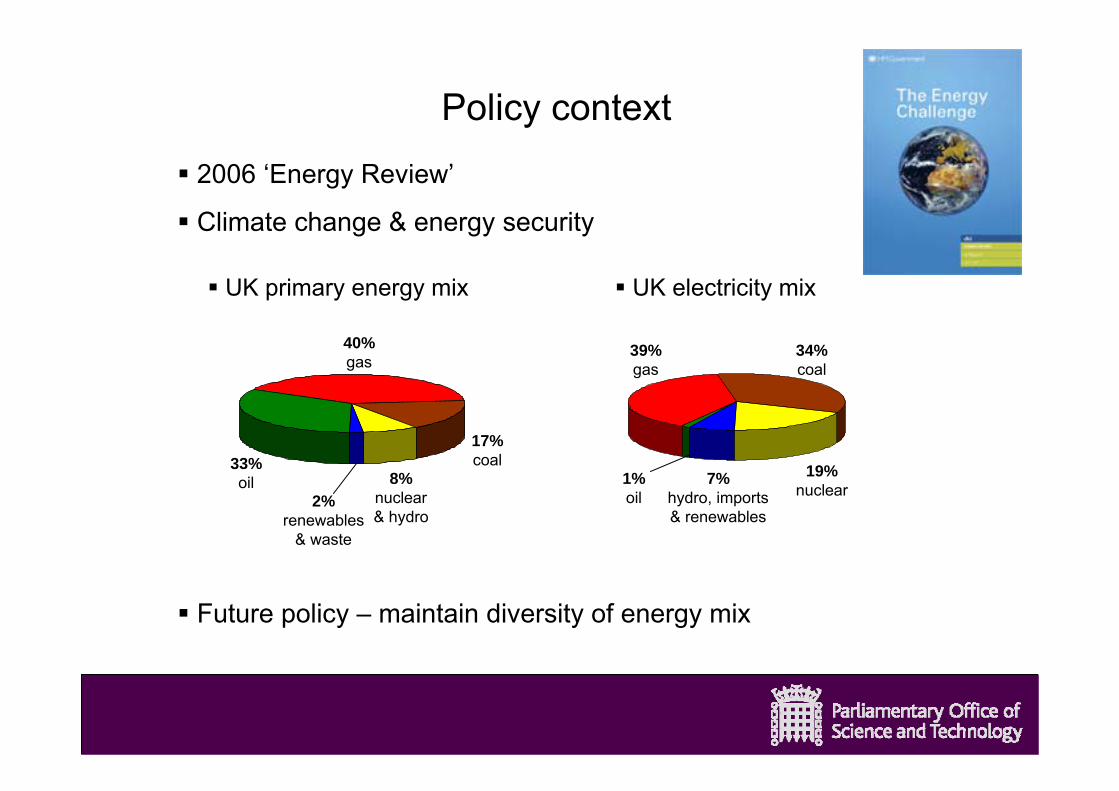
2%renewables
& waste
8%nuclear& hydro
17%coal33%
oil
40%gas
Policy context
34%coal
39%gas
19%nuclear
7%hydro, imports& renewables
1%oil
2006 ‘Energy Review’
Climate change & energy security
UK primary energy mix UK electricity mix
Future policy – maintain diversity of energy mix

No electricity generation technology is ‘carbon free’
All electricity generation technologies have a carbon footprint
8 different electricity generation technologies analysed
In the context of fossil fuelled electricity generation…
where they are now? – current carbon footprint
where are they going? – future carbon footprint
how do they compare with other technologies?
Background

What is a carbon footprint?The total amount of CO2 and other greenhouse gasesemitted over the full life cycle of a product or process,from extraction of raw materials through to decommissioning
Expressed as gCO2eq/kwh – account for different GWP of other GHG’s
Carbon footprints are calculated using Life Cycle Assessment (LCA) 1. Boundary definition2. LCI – Life Cycle Inventory – the most objective result of LCA3. LCIA – Life Cycle Impact Assessment4. Interpretation & improvement
LCA cannot replace the decision making process itself
DefinitionsCO2
CO2CO2
CO2
CO2
CO2

decommissioning
maintenance
transport
CO2
recycling
extraction
construction
operation(direct CO2 emissions)
CO2
CO2
CO2
CO2
CO2
CO2processing
Full life cycle carbon dioxide (CO2) and other greenhouse gases (e.g. CH4) emitted by electricity generation technologies
0
200
400
600
800
1000
1200
Coal Gas Biomass PV Marine Hydro Wind Nuclear
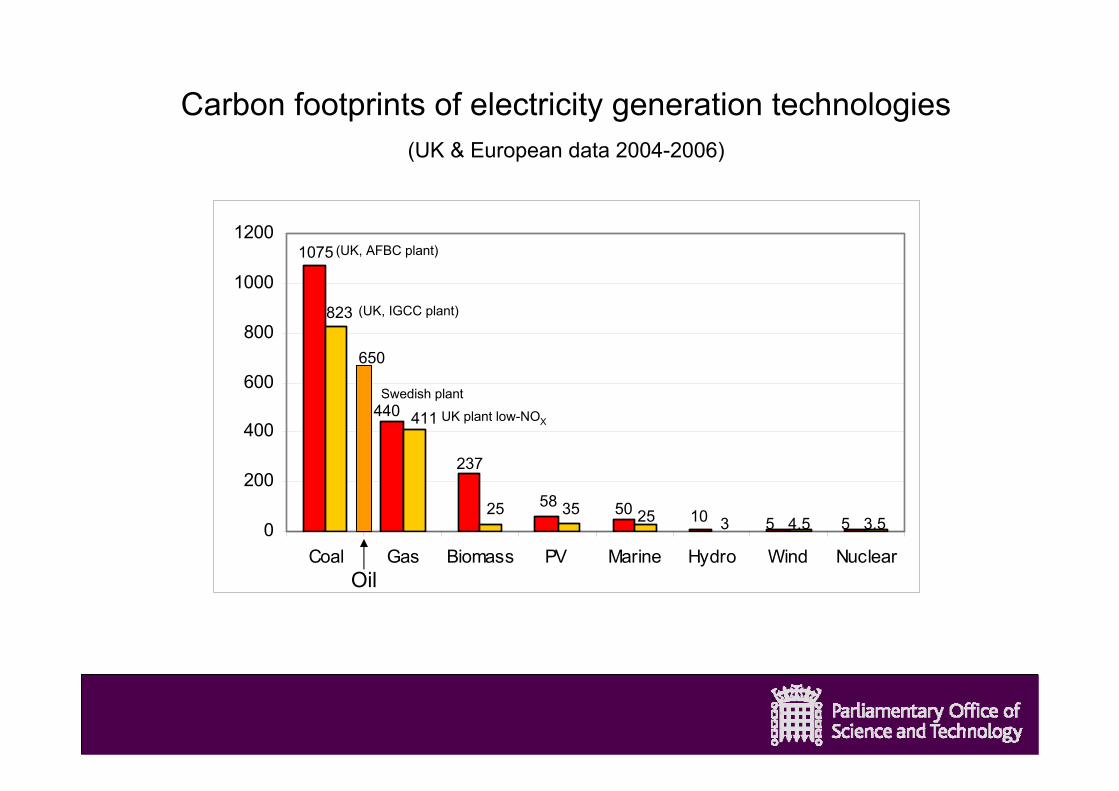
1075
Oil
650
823
440 411
25 3558
237
(UK, AFBC plant)
50 25 10 3 5 4.5 3.55
Carbon footprints of electricity generation technologies(UK & European data 2004-2006)
(UK, IGCC plant)
UK plant low-NOX
Swedish plant

Differences between individual plants – some older and/or less efficient
Different technologies – e.g. run-of-river vs. reservoir storage
Different LCA input (boundary definition) parameters
Different studies – some studies older, so had older data (2000 was cutoff date)
Ranges in each electricity generation technology are due to:
0
200
400
600
800
1000
1200
Coal Gas Biomass PV Marine Hydro Wind Nuclear
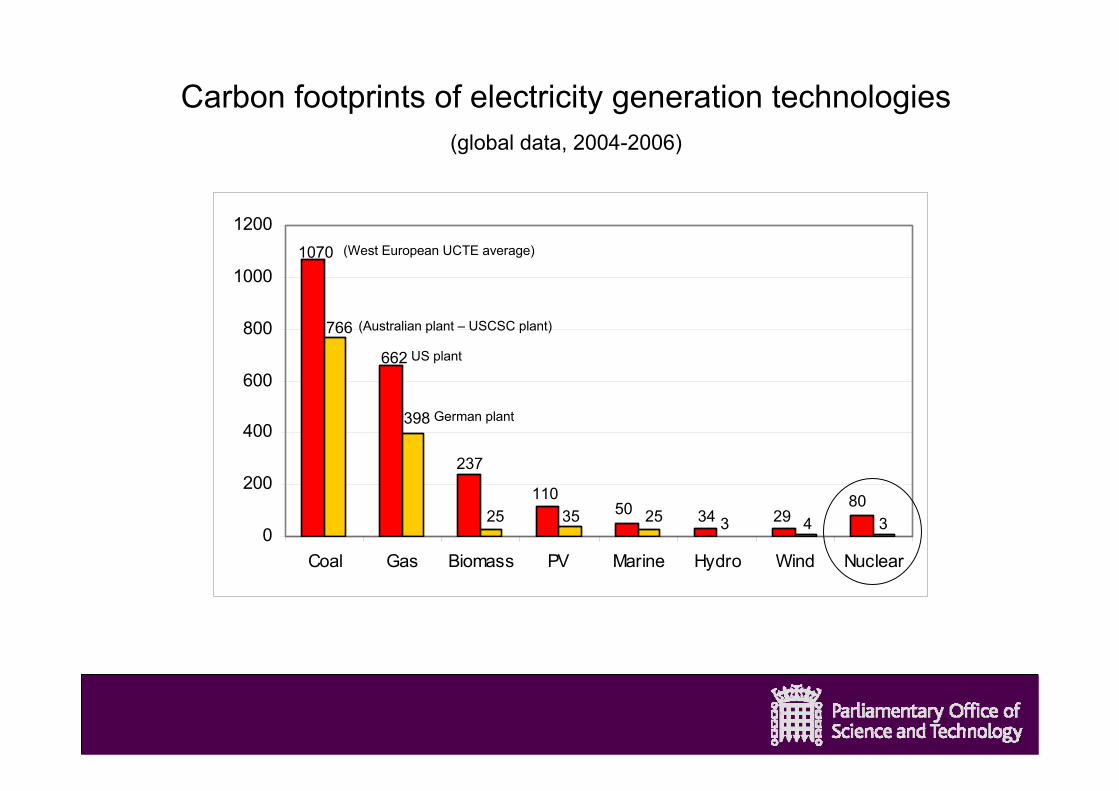
Carbon footprints of electricity generation technologies(global data, 2004-2006)
1070
766
662
398
25 35110
237
(West European UCTE average)
50 25 34 3 29 4 380
(Australian plant – USCSC plant)
US plant
German plant
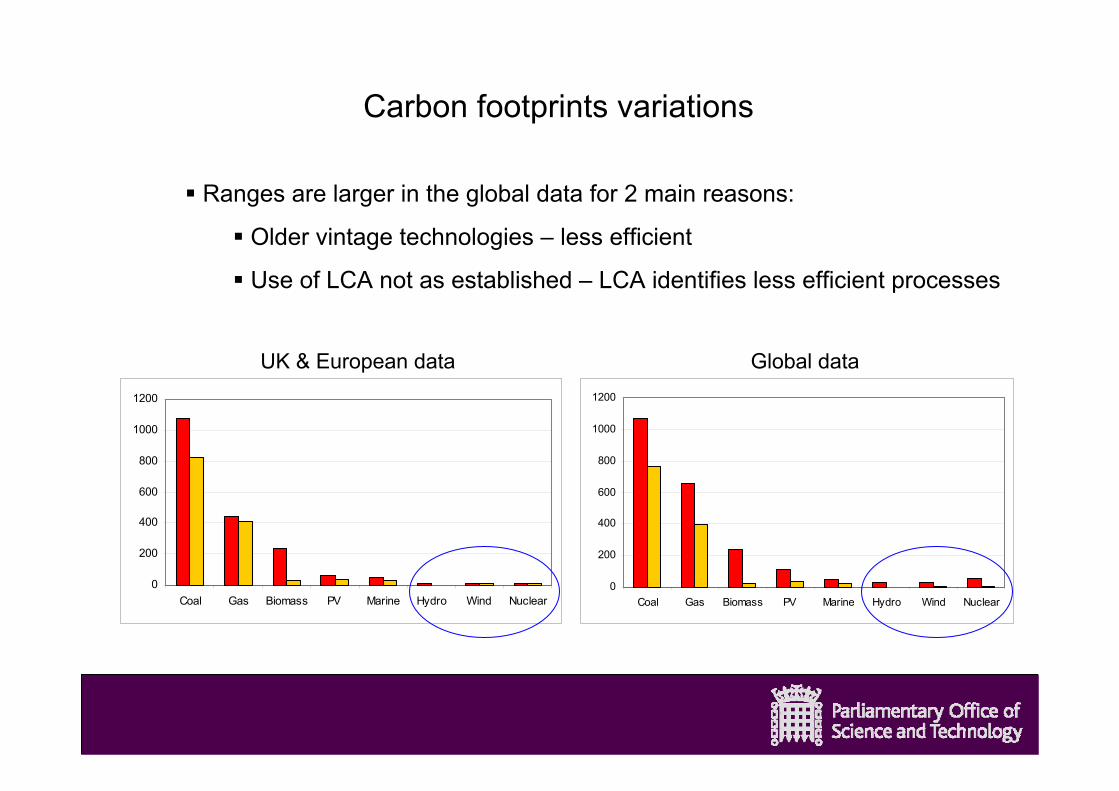
Carbon footprints variations
0
200
400
600
800
1000
1200
Coal Gas Biomass PV Marine Hydro Wind Nuclear
Ranges are larger in the global data for 2 main reasons:
Older vintage technologies – less efficient
Use of LCA not as established – LCA identifies less efficient processes
UK & European data Global data
0
200
400
600
800
1000
1200
Coal Gas Biomass PV Marine Hydro Wind Nuclear

Carbon footprint of electricity generation technologies(UK & Europe)
0
200
400
600
800
1000
1200
Coal Gas Biomass PV Marine Hydro Wind Nuclear

Carbon footprint of low carbon electricity generation technologies(UK & Europe)
020406080
100120140160180200
Biomass PV Marine Hydro Wind Nuclear
237
25
58
3550
2510
3 5.25 4.64 5.05 3.48
strawdirect combustion
UK UK
, Torness
offshore
onshore
southern Europe
run-of-river
reservoir storage
range for UKwave converters
woodchip gasification
Sweden, R
inghals
020406080
100120140160180200
Biomass PV Marine Hydro Wind Nuclear
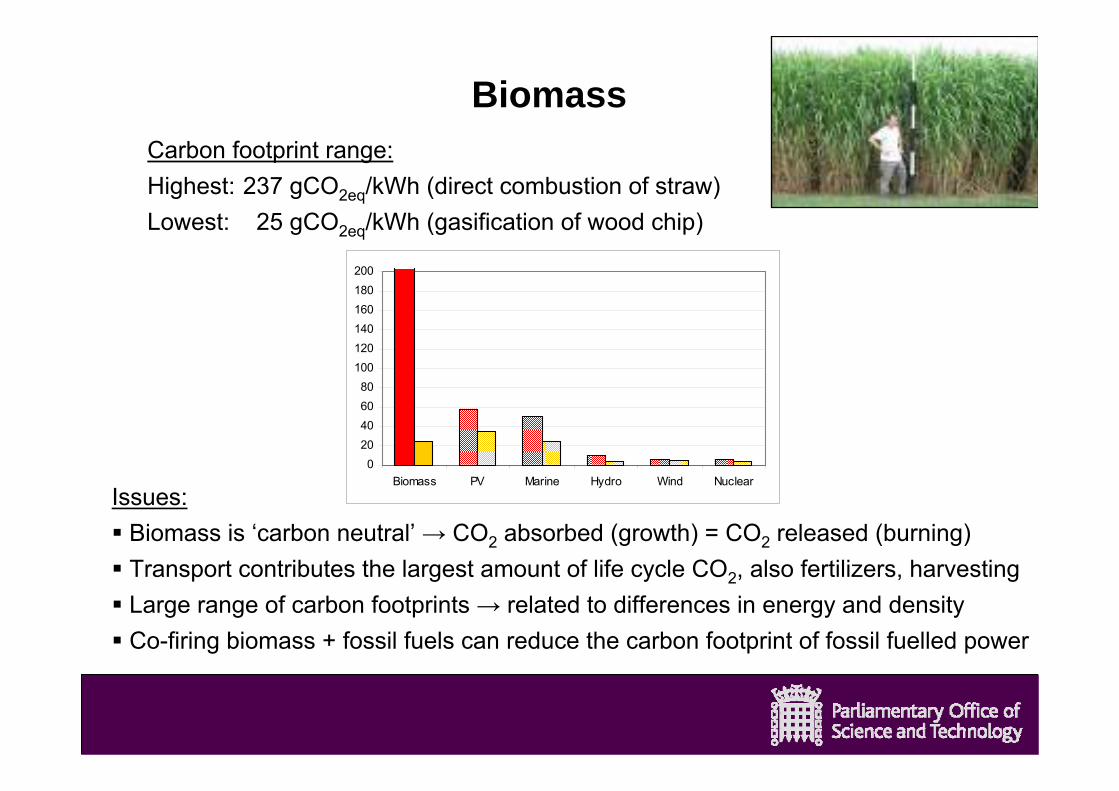
Carbon footprint range:Highest: 237 gCO2eq/kWh (direct combustion of straw)Lowest: 25 gCO2eq/kWh (gasification of wood chip)
Issues:Biomass is ‘carbon neutral’ → CO2 absorbed (growth) = CO2 released (burning)Transport contributes the largest amount of life cycle CO2, also fertilizers, harvestingLarge range of carbon footprints → related to differences in energy and densityCo-firing biomass + fossil fuels can reduce the carbon footprint of fossil fuelled power
Biomass

PhotovoltaicsCarbon footprint range:Highest: 58 gCO2eq/kWh (UK)Lowest: 35 gCO2eq/kWh (southern Europe)
Issues:PV cells predominantly made of high grade siliconSilicon extraction and purification is most energy intensive phase (60% of CO2)Future reductions in silicon use (e.g. thin film) will lower carbon footprintCarbon footprint lower in southern Europe because greater operating hours
020406080
100120140160180200
Biomass PV Marine Hydro Wind Nuclear
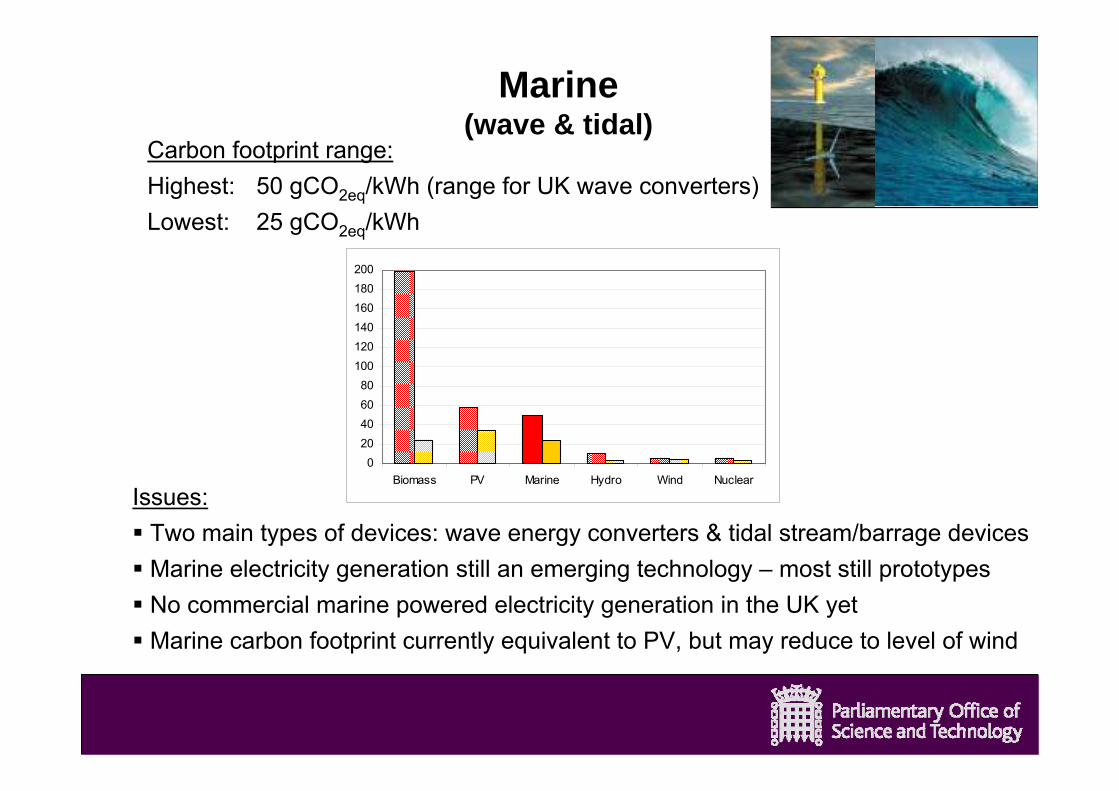
Marine(wave & tidal)
Carbon footprint range:Highest: 50 gCO2eq/kWh (range for UK wave converters)Lowest: 25 gCO2eq/kWh
Issues:Two main types of devices: wave energy converters & tidal stream/barrage devicesMarine electricity generation still an emerging technology – most still prototypesNo commercial marine powered electricity generation in the UK yetMarine carbon footprint currently equivalent to PV, but may reduce to level of wind
020406080
100120140160180200
Biomass PV Marine Hydro Wind Nuclear
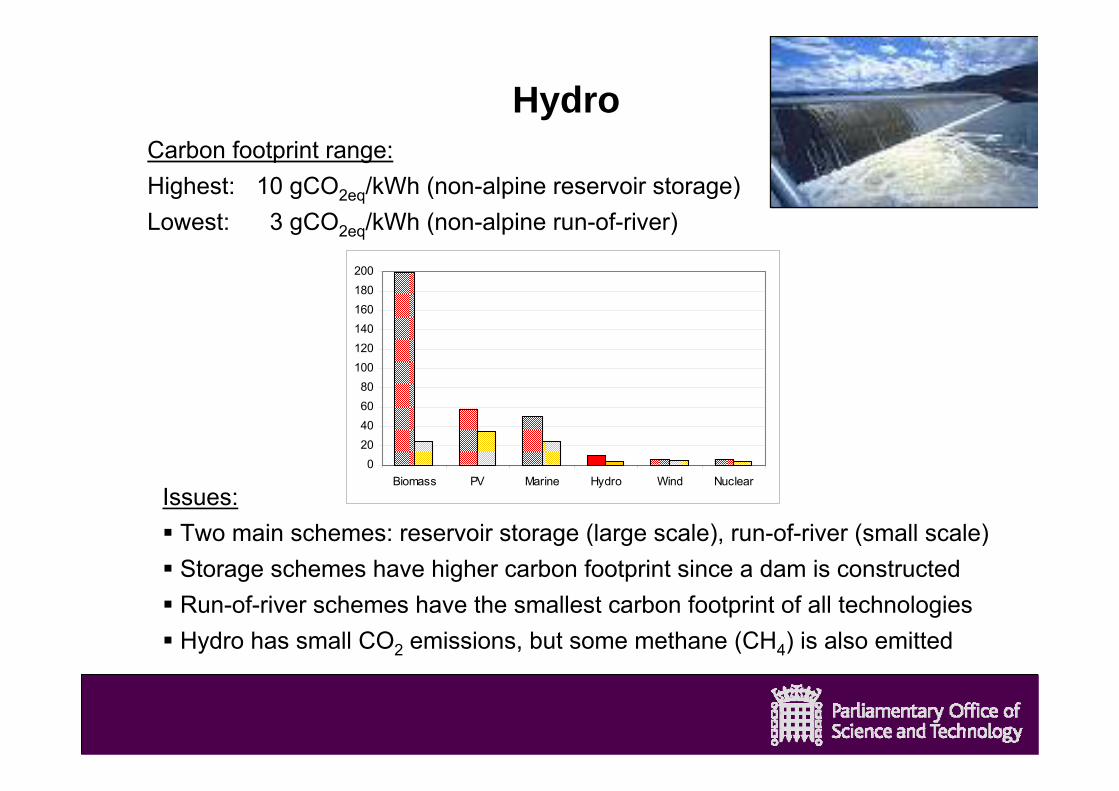
Carbon footprint range:Highest: 10 gCO2eq/kWh (non-alpine reservoir storage)Lowest: 3 gCO2eq/kWh (non-alpine run-of-river)
Hydro
Issues:Two main schemes: reservoir storage (large scale), run-of-river (small scale) Storage schemes have higher carbon footprint since a dam is constructedRun-of-river schemes have the smallest carbon footprint of all technologiesHydro has small CO2 emissions, but some methane (CH4) is also emitted
020406080
100120140160180200
Biomass PV Marine Hydro Wind Nuclear
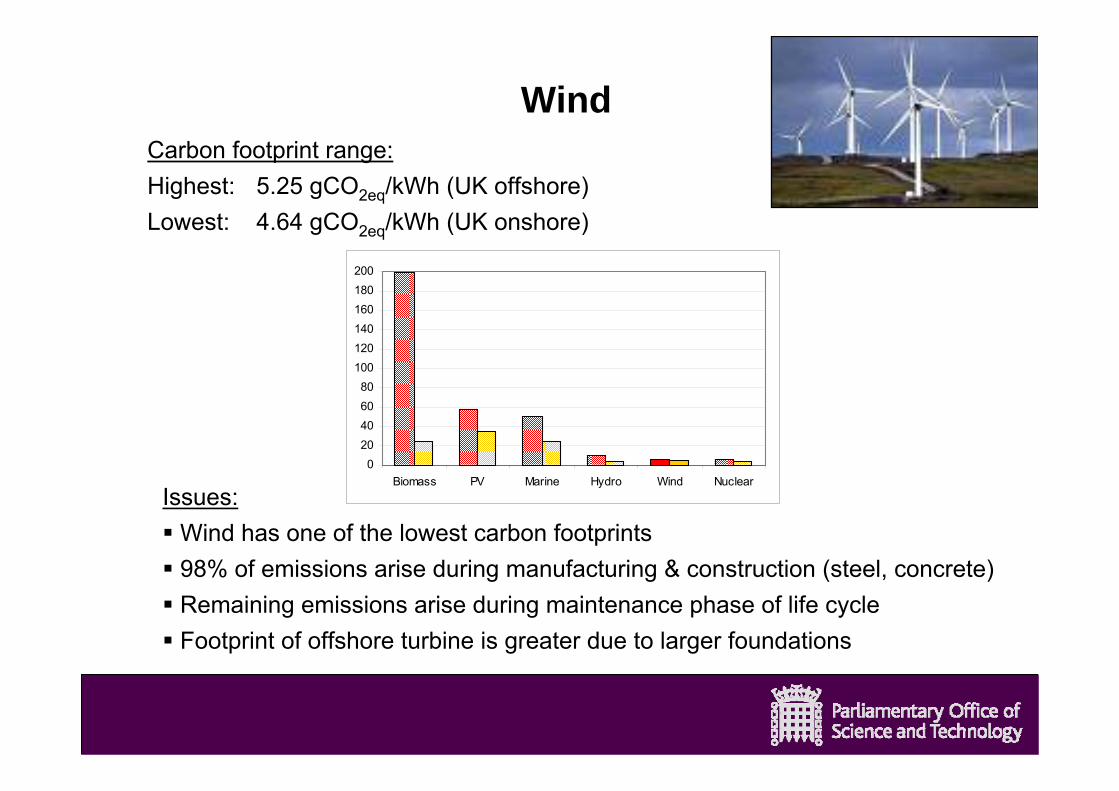
Issues:Wind has one of the lowest carbon footprints98% of emissions arise during manufacturing & construction (steel, concrete)Remaining emissions arise during maintenance phase of life cycleFootprint of offshore turbine is greater due to larger foundations
WindCarbon footprint range:Highest: 5.25 gCO2eq/kWh (UK offshore)Lowest: 4.64 gCO2eq/kWh (UK onshore)
020406080
100120140160180200
Biomass PV Marine Hydro Wind Nuclear
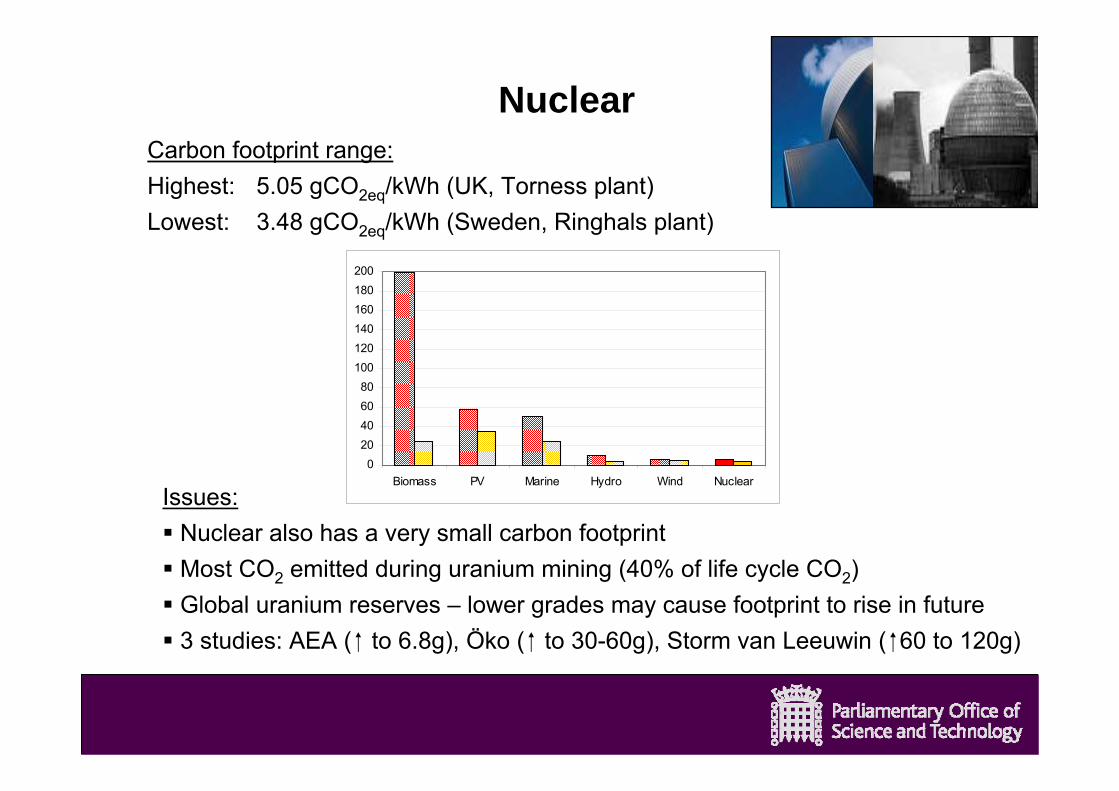
Issues:Nuclear also has a very small carbon footprintMost CO2 emitted during uranium mining (40% of life cycle CO2)Global uranium reserves – lower grades may cause footprint to rise in future3 studies: AEA ( to 6.8g), Öko ( to 30-60g), Storm van Leeuwin ( 60 to 120g)
NuclearCarbon footprint range:Highest: 5.05 gCO2eq/kWh (UK, Torness plant)Lowest: 3.48 gCO2eq/kWh (Sweden, Ringhals plant)
020406080
100120140160180200
Biomass PV Marine Hydro Wind Nuclear

Future carbon footprint reductions
-200
-100
0
100
200
300
400
500
600
700
800
Coal Gas Biomass PV Marine Hydro Wind Nuclear
current footprint
future footprint
coalwithCCS
gaswithCCS
biomasswithCCS
Future carbon reductions are possiblefor all these technologies if the construction
phase (e.g. steel, concrete production)is fuelled by ‘low carbon’ electricity
future reductions in raw materialse.g. less silicon in thin film PV
Increasing futurenuclear footprint due to
lower grade uranium
(or increases!)
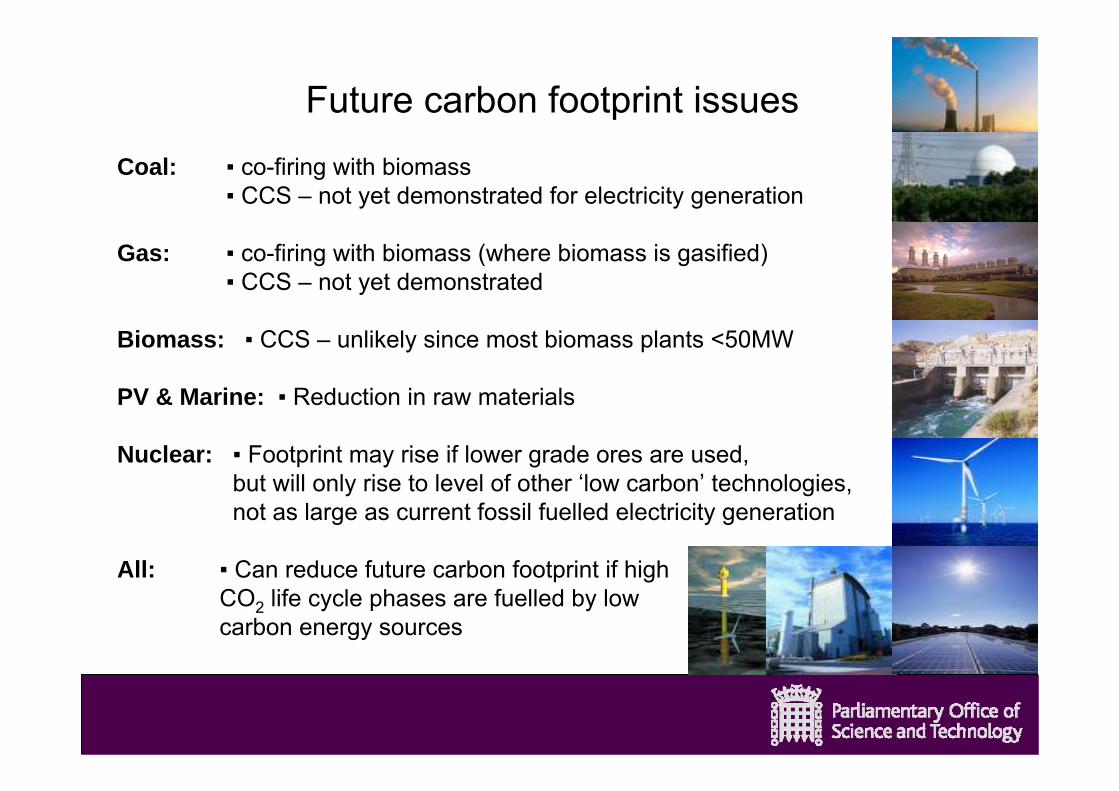
Future carbon footprint issues
Coal: ▪ co-firing with biomass▪ CCS – not yet demonstrated for electricity generation
Gas: ▪ co-firing with biomass (where biomass is gasified)▪ CCS – not yet demonstrated
Biomass: ▪ CCS – unlikely since most biomass plants <50MW
PV & Marine: ▪ Reduction in raw materials
Nuclear: ▪ Footprint may rise if lower grade ores are used,but will only rise to level of other ‘low carbon’ technologies,not as large as current fossil fuelled electricity generation
All: ▪ Can reduce future carbon footprint if highCO2 life cycle phases are fuelled by lowcarbon energy sources

Thank You!Stephanie Baldwin
www.parliament.uk/post
Conclusions
All electricity generation technologies emit CO2 at some point during their life cycle
None of these technologies are entirely ‘carbon free’
Fossil fuelled electricity generation has the largest carbon footprint (>1,000gCO2eq/kWh)
‘Low carbon’ technologies have low carbon footprints (<100gCO2eq/kWh)
Future carbon footprints can be reduced for all electricitiy generation technologies if
the high CO2 emission phases are fuelled by low carbon energy sources